User login
Dual vs Triple Therapy Following ACS or PCI in Patients with Atrial Fibrillation
Study Overview
Objective. To compare the benefit of apixaban with a vitamin K antagonist and compare aspirin with placebo in patients with atrial fibrillation who had acute coronary syndrome or underwent percutaneous coronary intervention (PCI) and were planning to take a P2Y12 inhibitor.
Design. Multicenter, international, open-label, prospective randomized controlled trial with a 2-by-2 factorial design.
Setting and participants. 4614 patients who had an acute coronary syndrome or had undergone PCI and were planning to take a P2Y12 inhibitor.
Intervention. Patients were assigned by means of an interactive voice-response system to receive apixaban or a vitamin K antagonist and to receive aspirin or matching placebo for 6 months.
Main outcome measures. The primary outcome was major or clinically relevant nonmajor bleeding. Secondary outcomes included death or hospitalization and a composite of ischemic events.
Main results. At 6 months, major or clinically relevant nonmajor bleeding had occurred in 10.5% of the patients receiving apixaban, as compared to 14.7% of those receiving a vitamin K antagonist (hazard ratio [HR], 0.69; 95% confidence interval [CI], 0.58-0.81, P < 0.001 for both noninferiority and superiority), and in 16.1% of the patients receiving aspirin, as compared with 9.0% of those receiving placebo (HR 1.89; 95% CI, 1.59-2.24; P < 0.001). Patients in the apixaban group had a lower incidence of death or hospitalization than those in the vitamin K antagonist group (23.5% versus 27.4%; HR 0.83; 95% CI, 0.74-0.93; P = 0.002) and similar incidence of ischemic events.
Conclusion. Among patients with atrial fibrillation and recent acute coronary syndrome or PCI treated with a P2Y12 inhibitor, an antithrombotic regimen that included apixaban without aspirin resulted in less bleeding and fewer hospitalizations without significant differences in the incidence of ischemic events than the regimens that included a vitamin K antagonist, aspirin, or both.
Commentary
PCI is performed in about 20% of patients with atrial fibrillation. These patients require dual antiplatelet therapy to prevent ischemic events, combined with long-term anticoagulation to prevent stroke due to atrial fibrillation. Because the combination of anticoagulation and antiplatelet therapy is associated with a higher risk of bleeding, balancing the risk and benefit of dual antiplatelet therapy and anticoagulation in this population is crucial.
Previous studies have assessed the risk and benefit associated with anticoagulation and antiplatelet therapy. When warfarin plus clopidogrel (double therapy) was compared with warfarin, aspirin, and clopidogrel (triple therapy) in patients with acute coronary syndromes and stable ischemic coronary disease undergoing PCI, use of clopidogrel without aspirin (double therapy) was associated with a significant reduction in bleeding complications (19.4% versus 44.4%, HR, 0.36; 95% CI, 0.26-0.20; P < 0.0001) without increasing thrombotic events.1 Recent studies have compared triple therapy with warfarin to double therapy using direct oral anticoagulants (DOAC). The PIONEER AF-PCI study, which compared low-dose rivaroxaban (15 mg once daily) plus a P2Y12 inhibitor to vitamin K antagonist plus dual antiplatelet therapy, found that the rates of clinically significant bleeding were lower in the low-dose rivaroxaban group compared to the triple-therapy group with a vitamin K antagonist (16.8% versus 26.7%; HR, 0.59; 95% CI, 0.47-0.76; P < 0.001).2 Similarly, the RE-DUAL PCI studied dabigatran and showed that the dual therapy group with dabigatran had a lower incidence of major or clinically relevant nonmajor bleeding events during follow-up compared to triple therapy including a vitamin K antagonist (15.4% versus 26.9%; HR, 0.52; 95% CI, 0.42-0.63; P < 0.001).3
In this context, Lopes at al investigated the clinical question of dual therapy versus triple therapy by performing a well-designed randomized clinical trial. In this trial with a 2-by-2 factorial design, the authors studied the effect of apixaban compared to vitamin K antagonist and the effect of aspirin compared to placebo. Major or clinically relevant nonmajor bleeding occurred in 10.5% of patients receiving apixaban, as compared to 14.7% of those receiving a vitamin K antagonist (HR 0.69; 95% CI, 0.58-0.81; P < 0.001). The incidence of major or clinically relevant nonmajor bleeding was higher in patients receiving aspirin than in those receiving placebo (16.1% versus 9.0%; HR, 1.89; 95% CI, 1.59-2.24; P < 0.001). Patients in the apixaban group had a lower incidence of death or hospitalization than those in the vitamin K antagonist group (23.5% versus 27.4%; HR, 0.83; 95% CI, 0.74-0.93; P = 0.002). The incidence of ischemic events was similar between the apixaban group and vitamin K antagonist group and between the aspirin group and placebo group.
The strengths of this current study include the large number of patients it enrolled. Taking the results from the PIONEER-AF, RE-DUAL PCI, and AUGUSTUS trials, it is clear that DOAC reduces the risk of bleeding compared to vitamin K antagonist. In addition, the AUGUSTUS trial was the first that evaluated the effect of aspirin in patients treated with DOAC and antiplatelet therapy. Aspirin was associated with increased risk of bleeding, with a similar rate of ischemic events compared to placebo.
The AUGUSTUS trial has several limitations. Although the incidence of ischemic events was similar between the apixaban group and the vitamin K antagonist group, the study was not powered to evaluate for individual ischemic outcomes. However, there was no clear evidence of an increase in harm. Since more than 90% of P2Y12 inhibitors used were clopidogrel, the safety and efficacy of combining apixaban with ticagrelor or prasugrel will require further study.
Applications for Clinical Practice
In patients with atrial fibrillation and a recent acute coronary syndrome or PCI treated with a P2Y12 inhibitor, dual therapy with a P2Y12 inhibitor and DOAC should be favored over a regimen that includes a vitamin K antagonist and/or aspirin.
—Taishi Hirai, MD, University of Missouri Medical Center, and John Blair, MD, University of Chicago Medical Center
1. Dewilde WJM, Oirbans T, Verheugt FWA, et al. Use of clopidogrel with or without aspirin in patients taking oral anticoagulant therapy and undergoing percutaneous coronary intervention: an open-label, randomised, controlled trial. Lancet. 2013;381(9872):1107-1115.
2. Gibson CM, Mehran R, Bode C, et al. Prevention of bleeding in patients with atrial fibrillation undergoing PCI. N Engl J Med. 2016;375:2423-2434.
3. Cannon CP, Bhatt DL, Oldgren J, et al. Dual antithrombotic therapy with dabigatran after PCI in atrial fibrillation. N Engl J Med. 2017;377:1513-1524.
Study Overview
Objective. To compare the benefit of apixaban with a vitamin K antagonist and compare aspirin with placebo in patients with atrial fibrillation who had acute coronary syndrome or underwent percutaneous coronary intervention (PCI) and were planning to take a P2Y12 inhibitor.
Design. Multicenter, international, open-label, prospective randomized controlled trial with a 2-by-2 factorial design.
Setting and participants. 4614 patients who had an acute coronary syndrome or had undergone PCI and were planning to take a P2Y12 inhibitor.
Intervention. Patients were assigned by means of an interactive voice-response system to receive apixaban or a vitamin K antagonist and to receive aspirin or matching placebo for 6 months.
Main outcome measures. The primary outcome was major or clinically relevant nonmajor bleeding. Secondary outcomes included death or hospitalization and a composite of ischemic events.
Main results. At 6 months, major or clinically relevant nonmajor bleeding had occurred in 10.5% of the patients receiving apixaban, as compared to 14.7% of those receiving a vitamin K antagonist (hazard ratio [HR], 0.69; 95% confidence interval [CI], 0.58-0.81, P < 0.001 for both noninferiority and superiority), and in 16.1% of the patients receiving aspirin, as compared with 9.0% of those receiving placebo (HR 1.89; 95% CI, 1.59-2.24; P < 0.001). Patients in the apixaban group had a lower incidence of death or hospitalization than those in the vitamin K antagonist group (23.5% versus 27.4%; HR 0.83; 95% CI, 0.74-0.93; P = 0.002) and similar incidence of ischemic events.
Conclusion. Among patients with atrial fibrillation and recent acute coronary syndrome or PCI treated with a P2Y12 inhibitor, an antithrombotic regimen that included apixaban without aspirin resulted in less bleeding and fewer hospitalizations without significant differences in the incidence of ischemic events than the regimens that included a vitamin K antagonist, aspirin, or both.
Commentary
PCI is performed in about 20% of patients with atrial fibrillation. These patients require dual antiplatelet therapy to prevent ischemic events, combined with long-term anticoagulation to prevent stroke due to atrial fibrillation. Because the combination of anticoagulation and antiplatelet therapy is associated with a higher risk of bleeding, balancing the risk and benefit of dual antiplatelet therapy and anticoagulation in this population is crucial.
Previous studies have assessed the risk and benefit associated with anticoagulation and antiplatelet therapy. When warfarin plus clopidogrel (double therapy) was compared with warfarin, aspirin, and clopidogrel (triple therapy) in patients with acute coronary syndromes and stable ischemic coronary disease undergoing PCI, use of clopidogrel without aspirin (double therapy) was associated with a significant reduction in bleeding complications (19.4% versus 44.4%, HR, 0.36; 95% CI, 0.26-0.20; P < 0.0001) without increasing thrombotic events.1 Recent studies have compared triple therapy with warfarin to double therapy using direct oral anticoagulants (DOAC). The PIONEER AF-PCI study, which compared low-dose rivaroxaban (15 mg once daily) plus a P2Y12 inhibitor to vitamin K antagonist plus dual antiplatelet therapy, found that the rates of clinically significant bleeding were lower in the low-dose rivaroxaban group compared to the triple-therapy group with a vitamin K antagonist (16.8% versus 26.7%; HR, 0.59; 95% CI, 0.47-0.76; P < 0.001).2 Similarly, the RE-DUAL PCI studied dabigatran and showed that the dual therapy group with dabigatran had a lower incidence of major or clinically relevant nonmajor bleeding events during follow-up compared to triple therapy including a vitamin K antagonist (15.4% versus 26.9%; HR, 0.52; 95% CI, 0.42-0.63; P < 0.001).3
In this context, Lopes at al investigated the clinical question of dual therapy versus triple therapy by performing a well-designed randomized clinical trial. In this trial with a 2-by-2 factorial design, the authors studied the effect of apixaban compared to vitamin K antagonist and the effect of aspirin compared to placebo. Major or clinically relevant nonmajor bleeding occurred in 10.5% of patients receiving apixaban, as compared to 14.7% of those receiving a vitamin K antagonist (HR 0.69; 95% CI, 0.58-0.81; P < 0.001). The incidence of major or clinically relevant nonmajor bleeding was higher in patients receiving aspirin than in those receiving placebo (16.1% versus 9.0%; HR, 1.89; 95% CI, 1.59-2.24; P < 0.001). Patients in the apixaban group had a lower incidence of death or hospitalization than those in the vitamin K antagonist group (23.5% versus 27.4%; HR, 0.83; 95% CI, 0.74-0.93; P = 0.002). The incidence of ischemic events was similar between the apixaban group and vitamin K antagonist group and between the aspirin group and placebo group.
The strengths of this current study include the large number of patients it enrolled. Taking the results from the PIONEER-AF, RE-DUAL PCI, and AUGUSTUS trials, it is clear that DOAC reduces the risk of bleeding compared to vitamin K antagonist. In addition, the AUGUSTUS trial was the first that evaluated the effect of aspirin in patients treated with DOAC and antiplatelet therapy. Aspirin was associated with increased risk of bleeding, with a similar rate of ischemic events compared to placebo.
The AUGUSTUS trial has several limitations. Although the incidence of ischemic events was similar between the apixaban group and the vitamin K antagonist group, the study was not powered to evaluate for individual ischemic outcomes. However, there was no clear evidence of an increase in harm. Since more than 90% of P2Y12 inhibitors used were clopidogrel, the safety and efficacy of combining apixaban with ticagrelor or prasugrel will require further study.
Applications for Clinical Practice
In patients with atrial fibrillation and a recent acute coronary syndrome or PCI treated with a P2Y12 inhibitor, dual therapy with a P2Y12 inhibitor and DOAC should be favored over a regimen that includes a vitamin K antagonist and/or aspirin.
—Taishi Hirai, MD, University of Missouri Medical Center, and John Blair, MD, University of Chicago Medical Center
1. Dewilde WJM, Oirbans T, Verheugt FWA, et al. Use of clopidogrel with or without aspirin in patients taking oral anticoagulant therapy and undergoing percutaneous coronary intervention: an open-label, randomised, controlled trial. Lancet. 2013;381(9872):1107-1115.
2. Gibson CM, Mehran R, Bode C, et al. Prevention of bleeding in patients with atrial fibrillation undergoing PCI. N Engl J Med. 2016;375:2423-2434.
3. Cannon CP, Bhatt DL, Oldgren J, et al. Dual antithrombotic therapy with dabigatran after PCI in atrial fibrillation. N Engl J Med. 2017;377:1513-1524.
Patient-Reported Outcomes in Multiple Sclerosis: An Overview
From the Dartmouth Institute for Health Policy & Clinical Practice, Geisel School of Medicine, Hanover, NH (Ms. Manohar and Dr. Oliver), the Department of Community & Family Medicine, Dartmouth-Hitchcock Medical Center, Lebanon, NH (Ms. Perkins, Ms. Laurion, and Dr. Oliver), and the Multiple Sclerosis Specialty Care Program, Concord Hospital, Concord, NH (Dr. Oliver).
Abstract
- Background: Patient-reported outcomes (PROs), including patient-reported outcome measures (PROMs) and patient-reported experience measures (PREMs), can be used to assess perceived health status, functioning, quality of life, and experience of care. Complex chronic illnesses such as multiple sclerosis (MS) affect multiple aspects of health, and PROs can be applied in assessment and decision-making in MS care as well as in research pertaining to MS.
- Objective: To provide a general review of PROs, with a specific focus on implications for MS care.
- Methods: Evidence synthesis of available literature on PROs in MS care.
- Results: PROs (including PROMs and PREMs) have historically been utilized in research and are now being applied in clinical, improvement, and population health settings using learning health system approaches in many disease populations, including MS. Many challenges complicate the use of PROs in MS care, including reliability, validity, and interpretability of PROMs, as well as feasibility barriers due to time and financial constraints in clinical settings.
- Conclusion: PROs have the potential to better inform clinical care, empower patient-centered care, inform health care improvement efforts, and create the conditions for coproduction of health care services.
Keywords: PRO; PROM; patient-reported outcome measure; patient-reported experience measure; quality of life; patient-centered care.
Multiple sclerosis (MS) is a disabling, complex, chronic, immune-mediated disorder of the central nervous system (CNS). MS causes inflammatory and degenerative damage in the CNS, which disrupts signaling pathways.1 It is most commonly diagnosed in young adults and affects 2.3 million people worldwide.2 People with MS experience very different disease courses and a wide range of neurological symptoms, including visual, somatic, mental health, sensory, motor, and cognitive problems.1-3 Relapsing-remitting MS, the most common form, affects 85% of those with MS and is characterized by periods of relapse (exacerbation) and remission.1 Other forms of MS (primary progressive and secondary progressive MS) are characterized by progressive deterioration and worsening symptom severity without exacerbations. Disease-modifying therapies (DMTs) can reduce the frequency of exacerbations and disability progression, but unfortunately there is no cure for MS. Treatment is focused on increasing quality of life, minimizing disability, and maximizing wellness.
Patient-reported outcomes (PROs) describe the perceived health status, function, and/or experience of a person as obtained by direct self-report. Patient-reported outcome measures (PROMs) are validated PROs that can be used to inform clinical care,4 and have demonstrated effectiveness in improving patient-provider communication and decision-making.5-7 PROMs are currently used in some MS clinical trials to determine the impact of experimental interventions,8-10 and are also being used to inform and improve clinical care in some settings. Especially for persons with MS, they can provide individualized perspectives about health experience and outcomes.11 In more advanced applications, PROMs can be used to improve face-to-face collaborations between clinicians and patients and to inform patient-centered systems of care.12-14 PROMs can also be used to inform systems-level improvement for entire patient populations.15,16
In this article, we review current applications of PROs and PROMs in the care of persons with MS, as well as current limitations and barriers to their use.
At a recent visit to her neurologist, Marion reviews her health diary, in which she has been tracking her fatigue levels throughout the day and when she has to visit the bathroom. The PRO diary also helps her remember details that she might not otherwise be able to recall at the time of her clinic visit. They review the diary entrees together to develop a shared understanding of what Marion has been experiencing and identify trends in the PRO data. They discuss symptom management and use the PRO information from the diary to help guide adjustments to her physical therapy routine and medication regimen.
Part of Marion’s “PRO package” includes the Center for Epidemiologic Studies Depression Scale (CES-D), a validated depression screening and symptom severity questionnaire that she completes every 3 months. Although she denies being depressed, she has noticed that her CES-D scores in recent months have been consistently increasing. This prompts a discussion about mental health in MS and a referral to work on depression with the MS mental health specialist. Marion and the mental health specialist use CES-D measures at baseline and during treatment to set a remission target and to track progress during treatment. Marion finds this helpful because she says it is hard for her to “wrap my hands around depression… it’s not something that there is a blood test or a MRI for.” Marion is encouraged by being able to see her CES-D scores change as her depression severity decreases, and this helps motivate her to keep engaged in treatment.
PROs and PROMs: General Applications
PROs are measures obtained directly from an individual without a priori interpretation by a clinician.9,17 PROs capture individual perspectives on symptoms, capability, disability, and health-related quality of life.9 With increasing emphasis on patient-centered care,18 individual perspectives and preferences elicited using PROMs may be able to inform better quality of care and patient-centered disease treatment and management.19-21
PROMs are standardized, validated questionnaires used to assess PROs and can be generic or condition-specific. Generic PROMs can be used in any patient population. The SF-3622 is a set of quality of life measures that assess perceived ability to complete physical tasks and routine activities, general health status, fatigue, social functioning, pain, and emotional and mental health.23 Condition-specific PROMs can be used for particular patient populations and are helpful in identifying changes in health status for a specific disease, disability, or surgery. For example, the PDQ-39 assesses 8 dimensions of daily living, functioning, and well-being for people with Parkinson’s disease.24
PROMs have been used in some MS clinical trials and research studies to determine the effectiveness of experimental treatments from the viewpoint of study participants.9,25,26 PROs can also be utilized in clinical care to facilitate communication of needs and track health outcomes,27 and can inform improvement in outcomes for health systems and populations. They can also be used to assess experience of care,28 encouraging a focus on high-quality outcomes through PRO-connected reimbursement mechanisms,29 and provide aggregate data to evaluate clinical practice, population health outcomes, and the effectiveness of public policies.27
Patient-reported experience measures (PREMs) assess patient satisfaction and experience of health care.30,31 CollaboRATE32 is a PREM that assesses the degree of shared decision-making occurring between patients and clinicians during clinical care. PREMs are currently used for assessing self-efficacy and in shared decision-making and health care improvement applications. PREMs have yet to be developed specifically for persons with MS.
PROMs in MS Care
Generic PROMs have shown that persons with MS are disproportionately burdened by poor quality of life.33-35 Other generic PROMs, like the SF-36,36 the Sickness Impact Profile,37 and versions of the Health Utilities Index,38 can be used to gather information on dysfunction and to determine quality and duration of life modified by MS-related dysfunction and disability. MS-specific PROMs are used to assess MS impairments, including pain, fatigue, cognition, sexual dysfunction, and depression.12,39-42 PROMs have also been used in MS clinical trials, including the Multiple Sclerosis Impact Scale-29 (MSIS-29),43,44 the Leeds MS QoL (LMSQoL),45,46 the Functional Assessment of MS (FAMS),47 the Hamburg Quality of Life Questionnaire in MS (HAQUAMS),48 the MS Quality of Life-54 (MSQoL-54),49 the MS International QoL (MUSIQoL),50 and the Patient-Reported Indices for MS Activity Limitations Scale (PRIMUS).51
Condition-specific PROMs are more sensitive to changes in health status and functioning for persons with MS compared to generic PROMs. They are also more reliable during MS remission and relapse periods.44,52 For example, the SF-36 has floor and ceiling effects in MS populations—a high proportion of persons with MS are scored at the maximum or minimum levels of the scale, limiting discriminant capability.22 As a result, a “combined approach” using both generic and MS-specific measures is often recommended.53 Some MS PROMs (eg, MSQoL-54) include generic questions found in the SF-36 as well as additional MS-specific questions or scales.
The variety of PROMs available (see Table for a selected listing) introduces a significant challenge to using them—limited generalizability and difficulty comparing PROs across MS studies. Efforts to establish common PROMs have been undertaken to address this problem.54 The National Institute of Neurologicical Disorders and Stroke (NINDS) sponsored the development of a neurological quality of life battery, the Neuro-QOL.55 Neuro-QOL measures the physical, mental, and social effects of neurological conditions in adults and children with neurological disorders and has the capability to facilitate comparisons across different neurological conditions. Additionally, the Patient-Reported Outcomes Measure Information System (PROMIS) has been developed to assess physical, mental, and social effects of chronic disease. PROMIS has a hybrid design that includes generic and MS-specific measures (such as PROMIS FatigueMS).56 PROMIS can be used to assess persons with MS as well as to compare the MS population with other populations with chronic illness.

PROMs have varying levels of reliability and validity. The Evaluating the Measure of Patient-Reported Outcomes57 study evaluated the development process of MS PROMs,43 and found that the MSIS-29 and LMSQoL had the highest overall reliability among the most common MS PROMs. However, both scored poorly on validity due to lack of patient involvement during development. This questions the overall capability of existing MS PROMs to accurately and consistently assess PROs in persons with MS.
“Feed-Forward” PROMs
Oliver and colleagues16 have described “feed-forward” PROM applications in MS care in a community hospital setting using a learning health system approach. This MS clinic uses feed-forward PROs to inform clinical care—PRO data are gathered before the clinic visit and analyzed ahead of or during the clinic visit by the clinician. Patients are asked to arrive early and complete a questionnaire comprised of PROMs measuring disability, functioning, quality of life, cognitive ability, pain, fatigue, sleep quality, anxiety, and depression. Clinicians score the PROMs and input scores into the electronic health record before the clinical encounter. During the clinic visit, PROM data is visually displayed so that the clinician and patient can discuss results and use the data to better inform decision-making. The visual data display contains longitudinal information, displaying trends in health status across multiple domains, and includes specified thresholds for clinically active symptom levels (Figure).16 Longitudinal monitoring of PROM data allows for real-time assessment of goal-related progress throughout treatment. As illustrated previously by Marion’s case study, the use of real-time feed-forward PROM data can strengthen the partnership between patient and clinician as well as improve empowerment, engagement, self-monitoring, and adherence.

PRO Dashboards
Performance dashboards are increasingly used in health care to visually display clinical and PRO data for individual patients, systems, and populations over time. Dashboards display a parsimonious group of critically important measures to give clinicians and patients a longitudinal view of PRO status. They can inform decision-making in clinical care, operations, health care improvement efforts, and population health initiatives.58 Effective dashboards allow for user customization with meaningful measures, knowledge discovery for analysis of health problems, accessibility of health information, clear visualization, alerts for unexpected data values, and system connectivity.59,60 Appropriate development of PRO dashboards requires meaningful patient and clinician involvement via focus groups and key informant interviews, Delphi process approaches to prioritize and finalize selection of priority measures, iterative building of the interface with design input from key informants and stakeholders (co-design), and pilot testing to assess feasibility and acceptability of use.61-63
Other Applications of PROs/PROMs in MS
Learning Health Systems
The National Quality Forum (NQF) and the Centers for Medicaid and Medicare Services have adopted PROs for use in quality measurement.64-66 This includes a movement towards the use of LHS, defined as a health system in which information from patients and clinicians is systematically collected and synthesized with external evidence to inform clinical care, improvement, and research.67-70 Often a LHS is undertaken as a collaborative effort between multiple health care centers to improve quality and outcomes of care.70 The MS Continuous Quality Improvement Collaborative (MS-CQI), the first multi-center systems-level health care improvement research collaborative for MS,71 as well as IBD Qorus and the Cystic Fibrosis Care Center Network utilize LHS approaches.72-77
IBD Qorus is a LHS developed by the Crohn’s and Colitis Foundation that uses performance dashboards to better inform clinical care for people with inflammatory bowel disease. It also employs system-level dashboards for performance benchmarking in quality improvement initiatives and aggregate-level dashboards to assess population health status.78,79 MS-CQI uses a LHS approach to inform the improvement of MS care across multiple centers using a comprehensive dashboard, including PROMs, for benchmarking and to monitor system and population health status. MS-CQI collects PROMs using a secure online platform that can be accessed by persons with MS and their clinicians and also includes a journaling feature for collecting qualitative information and for reference and self-monitoring.71
MS Research
PROMs are used in clinical and epidemiological research to evaluate many aspects of MS, including the FAMS, the PDSS, the Fatigue Impact Scale (FIS), and others.80-82 For example, the PROMIS FatigueMS and the Fatigue Performance Scale have been used to assess the impact of MS-related fatigue on social participation.83 Generic and MS-specific PROMs have been used to assess pain levels for people with MS,84-87 and multiple MS-specific PROMs, like PRIMUS and MSQoL-54,43 as well as the SF-3639 include pain assessment scales. PROMs have also been used to assess MS-related bladder, bowel, and sexual dysfunction. Urgency, frequency, and incontinence affect up to 75% of patients with MS,88 and many PROMs, such as the LMSQoL, MUSIQoL, and the MSQoL-54, are able to evaluate bladder control and sexual functioning.43,89
PROMs are employed in MS clinical trials to help assess the tolerability and effectiveness of DMTs.90,91 PROs have been used as secondary endpoints to understand the global experience of a DMT from the patient perspective.92-94 There are 15 FDA-approved DMTs for MS, and clinical trials for 6 of these have used PROMs as an effectiveness end point.54,91,95,96 However, most DMT clinical trials are powered for MRI, relapse rate, or disease progression primary outcomes rather than PROMs, often resulting in underpowered PROM analyses.97 In addition, many PROMs are not appropriate for use in DMT clinical trials.98,99
In order to bridge the gap between clinical research and practice, some industry entities are championing “patient-focused drug development” approaches. The Accelerated Cure Project for MS has launched iConquerMS, which collects PROMs from persons with MS to further PRO research in MS and follows 4700 individuals with MS worldwide.100 In 2018, the American College of Physicians announced a collaboration with an industry partner to share data to inform DMT clinical trials and develop and validate PROMs specifically designed for DMT clinical trials.101
Population Health
Registries following large cohorts of people with MS have the potential to develop knowledge about disease progression, treatment patterns, and outcomes.102 The Swedish EIMS study has identified associations between pre-disease body mass index and MS prognosis,102 alcohol and tobacco consumption affecting MS risk,103,104 and exposure to shift work at a young age and increased MS risk.105 The North American Research Committee on MS83,106,107 and iConquerMS registries are “PROM-driven” and have been useful in identifying reductions in disease progression in people using DMTs.107,108 The New York State MS Consortium has identified important demographic characteristics that influence MS progression.109,110 PROs can also be used to determine risk of MS-related mortality111 and decline in quality of life.112,113 Limitations of these approaches include use of different PROMs, inconsistencies in data collection processes, and different follow-up intervals used across registries.102
Patient-Centered Care
The Institute of Medicine defines patient-centeredness as “care that is respectful and responsive to individual patient preferences, needs, and values and ensures that patient values guide all clinical decisions.”114 PROs are useful for identifying a patient’s individual health concerns and preferences, something that is needed when treating a highly variable chronic health condition like MS. The use of PROs can help clinicicans visualize the lived experience of persons with MS and identify personal preferences,115 as well as improve self-monitoring, self-management, self-efficacy, adherence, wellness, and coping ability.116 At the system level, PROs can inform improvement initiatives and patient-centered care design efforts.117-120
Selecting PROMs
Initiatives from groups like the COnsensus-based Standards for the Selection of health Measurement INstruments (COSMIN)121 and the International Society for Quality of Life Research (ISOQOL)108 offer guidance on selecting PROs. The NINDS has promoted common data collection between clinical studies of the brain and nervous system.122 General guidance from these sources recommends first considering the outcome and target population, selecting PROMs to measure the outcome through a synthesis of the available evidence, assessing validity and reliability of selected PROMs, and using standard measures that can be compared across studies or populations.108,121 Other factors include feasibility, acceptability, and burden of use for patients, clinicians, and systems, as well as literacy, cultural, and linguistic factors.123
The NQF recommends that consideration be given to individual patient needs, insurance factors, clinical setting constraints, and available resources when selecting PROMs.124 To maximize response rate, PROMs that are sensitive, reliable, valid, and developed in a comparative demographic of patients are advised.125 ISOQOL has released a User’s Guide and several companion guides on implementing and utilizing PROMs.108,126,127 Finally, PRO-Performance Measures (PRO-PMs) are sometimes used to assess whether PROMs are appropriately contributing to performance improvement and accountability.124
The Cons of PROs
PROs can disrupt busy clinical care environments and overextend clinical staff.125 Online collection of PROs outside of clinical encounters can relieve PRO-related burden, but this requires finding and funding appropriate secure online networks to effectively collect PROs.128 In 2015, only 60% of people seen for primary care visits could access or view their records online, and of those, only 57% used messaging for medical questions or concerns.129 Ideally, online patient portal or mobile health apps could synchronize directly to electronic health records or virtual scribes to transfer patient communications into clinical documentation.130 There has been limited success with this approach in European countries131 and with some chronic illness conditions in the United States.74
Electronic health technologies, including mobile health (mHealth) solutions, have improved the self-monitoring and self-management capability of patients with MS via information sharing in patient networks, assistive technologies, smartphone applications, and wearable devices.132,133 A recent study found that communication modes included secure online patient portal use (29%) and email use (21%), and among those who owned tablets or smartphones, 46% used mHealth apps.134 Social media use has been associated with increased peer/social/emotional support and increased access to health information, as well as clinical monitoring and behavior change.134,135 Individuals using mHealth apps are younger, have comorbidities, and have higher socioeconomic and education levels,135,136 suggesting that inequities in mHealth access exist.
Questionnaires can be time-consuming and cause mental distress if not appropriately facilitated.137 Decreasing questionnaire length and providing the option for PROMs to be delivered and completed online or outside of the clinic context can reduce burden.138 Additionally, while some people are consistent in sharing their PROs, others struggle with using computers, especially while experiencing severe symptoms, forget to complete PROMs, or simply do not have internet access due to financial or geographic constraints.139 A group of disabled and elderly persons with MS reported barriers to internet use due to visual deficits, small website font sizes, and distracting color schemes.140
Interpretability
Interpreting PROMs and displays of longitudinal PROM data can be a challenge for persons with MS and their clinicians. There is little standardization in how PROMs are scored and presented, and there is often confusion about thresholds for clinical significance and how PROM scores can be compared to other PROMs.141,142 While guidelines exist for implementing PRO scores in clinical settings,126,143 there are few that aid PROM interpretation. As a result, clinicians often seek research evidence for PROMs used in other similar patient populations as a benchmark,142-144 or compare them to other patients seen in their clinical practice.
Longitudinal PRO data are usually displayed in simple line graphs.145,146 Overall, line graphs have been found to have the highest ease of understanding by both patients and clinicians, but sometimes can be confusing.147 For example, upward trending lines are usually viewed as improvement and downward trending lines as decline; however, upward trending scores on a PROM can indicate decline, such as increasing fatigue severity. Annotation of visual displays can help. Patients and clinicians find that employing thresholds and color coding is useful, and better than “stoplight” red-yellow-green shading schemes or red-circle formats to indicate data that warrant attention.142
PROs are not free of risk for error, especially if they are used independently of other information sources, such as clinical interview, examination, and diagnostic testing, or if they are utilized too frequently, too infrequently, or are duplicated in practice. If a PRO instrument is employed too frequently, score changes may reflect learning effects rather than actual clinical status. Conversely, if used too infrequently, PRO information will not be timely enough to inform real-time clinical practice. Duplication of PRO assessments (eg, multiple measures of the same PRO for the same patient on the same day) or use of multiple PRO measures to assess the same aspect (eg, 2 measures used to assess fatigue) could introduce unnecessary complexity and confusion to interpretation of PRO results.
PRO measures also can be biased or modified by clinical status and/or perceptions of people with MS at the time of assessment. For example, cognitive impairment, whether at baseline state or due to a cognitive MS relapse event, could impact patients’ ability to understand and respond to PRO assessments, producing erroneous results. However, when used appropriately, PROs targeting cognitive dysfunction may be able to detect onset of cognitive events or help to measure recovery from them. Finally, PROs measure perceived (self-reported) status, which may not be an accurate depiction of actual status.
All of these potential pitfalls support the argument that PROs should be utilized to augment the clinical interview, examination, and diagnostic (objective) testing aspects of comprehensive MS care. In this way, PROs can be correlated with other information sources to deepen the shared understanding of health status between a person with MS and her clinician, increasing the potential to make better treatment decisions and care plans together in partnership.
Value and Cost
National groups such as the Patient-Centered Outcomes Research Institute (PCORI) are working with regulatory bodies, funding agencies, insurance providers, patient advocacy groups, researchers, providers, and specialty groups to investigate how PROMs can be implemented into value-based health care reforms, including value-based reimbursement.148 However, practical PRO implementation requires considerable time and resources, and many methodological and operational questions must be addressed before widespread adoption and reimbursement for PROMs will be feasible.148,149
Summary
PROs can generate valuable information about perceived health status, function, quality of life, and experience of care using self-reported sources. Validated PRO assessment tools include PROMs and PREMs. PROs are currently utilized in research settings (especially PROMs) but are also being used in clinical practice, quality improvement initiatives, and population health applications using LHS approaches. PROs have the advantages of empowering and informing persons with MS and clinicians to optimize patient-centered care, improve systems of care, and study population health outcomes. Barriers include PROM validity, reliability, comparability, specificity, interpretability, equity, time, and cost. Generic PROMs and PREMs, and some MS-specific PROMs, can be used for persons with MS. Unfortunately, no PREMs have been developed specifically for persons with MS, and this is an area for future research. With appropriate development and utilization in LHS applications, PROs can inform patient-centered clinical care, system-level improvement initiatives, and population health research, and have the potential to help facilitate coproduction of health care services.
Acknowledgments: The authors thank Ann Cabot, DO, of the MS Specialty Care Program at Concord Hospital and (especially) peer mentors from a peer outreach wellness program for people with MS (who have asked to remain anonymous) for interviews conducted with their permission to inform the case study described in this article. The case study used in this manuscript has been de-identified, with some aspects modified from actual, and the person in the case study is fictitiously named.
Corresponding author: Brant Oliver, PhD, MS, MPH, APRN-BC, Department of Community & Family Medicine, Dartmouth-Hitchcock Medical Center, Lebanon, NH 03756; brant.j.oliver@dartmouth.edu.
Financial disclosures: None.
1. Goldenberg MM. Multiple sclerosis review. PT. 2012;37:175-184.
2. Doshi A, Chataway J. Multiple sclerosis, a treatable disease. Clin Med. 2016;16(Suppl 6):s53-s9.
3. Perrin Ross A. Management of multiple sclerosis. Am J Managed Care. 2013;19(16 Suppl):s301-s306.
4. Batalden M, Batalden P, Margolis P, et al. Coproduction of healthcare service. BMJ Qual Saf. 2016;25:509-517.
5. Chen J, Ou L, Hollis SJ. A systematic review of the impact of routine collection of patient reported outcome measures on patients, providers and health organisations in an oncologic setting. BMC Health Serv Res. 2013;13:211.
6. Knaup C, Koesters M, Schoefer D, et al. Effect of feedback of treatment outcome in specialist mental healthcare: meta-analysis. Br J Psychiatr. 2009;195:15-22.
7. Dudgeon D. The impact of measuring patient-reported outcome measures on quality of and access to palliative care. J Palliat Med. 2018;21(S1):S76-s80.
8. Snyder CF, Herman JM, White SM, et al. When using patient-reported outcomes in clinical practice, the measure matters: a randomized controlled trial. J Oncol Pract. 2014;10:e299-e306.
9. Guidance for industry: patient-reported outcome measures: use in medical product development to support labeling claims: draft guidance. Health Qual Life Outcomes. 2006;4:79.
10. de Jong MJ, Huibregtse R, Masclee AAM, et al. Patient-reported outcome measures for use in clinical trials and clinical practice in inflammatory bowel diseases: a systematic review. Clin Gastroenterol Hepatol. 2018;16:648-663.
11. Roman D, Osborne-Stafsnes J, Amy CH, et al. Early lessons from four ‘aligning forces for quality’ communities bolster the case for patient-centered care. Health Affairs. 2013;32:232-241.
12. Ehde DM, Alschuler KN, Sullivan MD, et al. Improving the quality of depression and pain care in multiple sclerosis using collaborative care: The MS-care trial protocol. Contemporary Clinical Trials. 2018;64:219-229.
13. Lavallee DC, Chenok KE, Love RM, et al. Incorporating patient-reported outcomes into health care to engage patients and enhance care. Health Affairs. 2016;35:575-582.
14. Schick-Makaroff K, Thummapol O, Thompson S, et al. Strategies for incorporating patient-reported outcomes in the care of people with chronic kidney disease (PRO kidney): a protocol for a realist synthesis. Clin Gastroenterol Hepatol. 2018;16:648-663.
15. Nelson EC, Dixon-Woods M, Batalden PB, et al. Patient focused registries can improve health, care, and science. BMJ. 2016;354:i3319.
16. Oliver BJ, Nelson EC, Kerrigan CL. Turning feed-forward and feedback processes on patient-reported data into intelligent action and informed decision-making: case studies and principles. Med Care. 2019;57 Suppl 1:S31-s37.
17. Deshpande PR, Rajan S, Sudeepthi BL, Abdul Nazir CP. Patient-reported outcomes: A new era in clinical research. Perspect Clin Res. 2011;2:137-144.
18. Epstein RM, Street RL, Jr. The values and value of patient-centered care. Ann Fam Med. 2011;9:100-103.
19. Payne SA. A study of quality of life in cancer patients receiving palliative chemotherapy. Soc Sci Med. 1992;35:1505-1509.
20. Borgaonkar MR, Irvine EJ. Quality of life measurement in gastrointestinal and liver disorders. Gut. 2000;47:444-454.
21. Macdonell R, Nagels G, Laplaud DA, et al. Improved patient-reported health impact of multiple sclerosis: The ENABLE study of PR-fampridine. Multiple Sclerosis. 2016;22:944-954.
22. Hobart J, Freeman J, Lamping D, et al. The SF-36 in multiple sclerosis: why basic assumptions must be tested. J Neurol Neurosurg Psychiatry. 2001;71:363-370.
23. Lins L, Carvalho FM. SF-36 total score as a single measure of health-related quality of life: Scoping review. SAGE Open Med. 2016;4:2050312116671725.
24. Parkinson’s Disease Society of the United Kingdom. The Parkinson’s Disease Questionnaire (PDQ-39). https://www.parkinsons.org.uk/professionals/resources/parkinsons-disease-questionnaire-pdq-39. Accessed October 20, 2019.
25. Basch E. The missing voice of patients in drug-safety reporting. N Engl J Med. 2010;362:865-869.
26. Calvert M, Brundage M, Jacobsen PB, et al. The CONSORT Patient-Reported Outcome (PRO) extension: implications for clinical trials and practice. Health Qual Life Outcomes. 2013;11:184.
27. Black N. Patient reported outcome measures could help transform healthcare. BMJ. 2013;346:f167.
28. Franks P, Fiscella K, Shields CG, et al. Are patients’ ratings of their physicians related to health outcomes? Ann Fam Med. 2005;3:229-234.
29. Hostetter M, Klein S. Using patient-reported outcomes to improve health care quality. The Commonwealth Fund 2019. www.commonwealthfund.org/publications/newsletter-article/using-patient-reported-outcomes-improve-health-care-quality. Accessed October 24, 2019.
30. Charlotte Kingsley SP. Patient-reported outcome measures and patient-reported experience measures. BJA Education. 2017;17:137-144.
31. Weldring T, Smith SM. Patient-Reported outcomes (PROs) and patient-reported outcome measures (PROMs). Health Services Insights. 2013;6:61-68.
32. Elwyn G, Barr PJ, Grande SW, et al. Developing CollaboRATE: A fast and frugal patient-reported measure of shared decision making in clinical encounters. Patient Educ Couns. 2013;93:102-107.
33. Kurtzke JF. Rating neurologic impairment in multiple sclerosis: an expanded disability status scale (EDSS). Neurology. 1983;33:1444-1452.
34. Rudick RA, Miller D, Clough JD, et al. Quality of life in multiple sclerosis. Comparison with inflammatory bowel disease and rheumatoid arthritis. Arch Neurol. 1992;49:1237-1242.
35. Benito-Leon J, Morales JM, Rivera-Navarro J, Mitchell A. A review about the impact of multiple sclerosis on health-related quality of life. Disabil Rehabil. 2003;25:1291-1303.
36. RAND Corporation. 36-Item Short Form Survey (SF-36). [https://www.rand.org/health-care/surveys_tools/mos/36-item-short-form.html. Accessed October 20, 2019.
37. Bergner M, Bobbitt RA, Carter WB, Gilson BS. The sickness impact profile: development and final revision of a health status measure. Medical Care. 1981;19:787-805.
38. Horsman J, Furlong W, Feeny D, Torrance G. The Health Utilities Index (HUI): concepts, measurement properties and applications. Health Qual Life Outcomes. 2003;1:54.
39. Kinkel RP, Laforet G, You X. Disease-related determinants of quality of life 10 years after clinically isolated syndrome. Int J MS Care. 2015;17:26-34.
40. Baumstarck-Barrau K, Simeoni MC, Reuter F, et al. Cognitive function and quality of life in multiple sclerosis patients: a cross-sectional study. BMC Neurology. 2011;11:17.
41. Samartzis L, Gavala E, Zoukos Y, et al. Perceived cognitive decline in multiple sclerosis impacts quality of life independently of depression. Rehabil Res Pract. 2014;2014:128751.
42. Vitkova M, Rosenberger J, Krokavcova M, et al. Health-related quality of life in multiple sclerosis patients with bladder, bowel and sexual dysfunction. Disabil Rehabil. 2014;36:987-992.
43. Khurana V, Sharma H, Afroz N, et al. Patient-reported outcomes in multiple sclerosis: a systematic comparison of available measures. Eur J Neurol. 2017;24:1099-1107.
44. Hobart J, Lamping D, Fitzpatrick R, et al. The Multiple Sclerosis Impact Scale (MSIS-29): a new patient-based outcome measure. Brain. 2001;124(Pt 5):962-973.
45. Lily O, McFadden E, Hensor E, et al. Disease-specific quality of life in multiple sclerosis: the effect of disease modifying treatment. Multiple Sclerosis. 2006;12:808-813.
46. Ford HL, Gerry E, Tennant A, et al. Developing a disease-specific quality of life measure for people with multiple sclerosis. Clin Rehabil. 2001;15:247-258.
47. Cella DF, Dineen K, Arnason B, et al. Validation of the functional assessment of multiple sclerosis quality of life instrument. Neurology. 1996;47:129-139.
48. Gold SM, Heesen C, Schulz H, et al. Disease specific quality of life instruments in multiple sclerosis: validation of the Hamburg Quality of Life Questionnaire in Multiple Sclerosis (HAQUAMS). Multiple Sclerosis. 2001;7:119-130.
49. Vickrey BG, Hays RD, Harooni R, et al. A health-related quality of life measure for multiple sclerosis. Qual Life Res. 1995;4:187-206.
50. Simeoni M, Auquier P, Fernandez O, et al. Validation of the Multiple Sclerosis International Quality of Life questionnaire. Multiple Sclerosis. 2008;14:219-230.
51. Doward LC, McKenna SP, Meads DM, et al. The development of patient-reported outcome indices for multiple sclerosis (PRIMUS). Multiple Sclerosis. 2009;15:1092-1102.
52. Ozakbas S, Akdede BB, Kosehasanogullari G, et al. Difference between generic and multiple sclerosis-specific quality of life instruments regarding the assessment of treatment efficacy. J Neurol Sci. 2007;256:30-34.
53. Cella DF, Wiklund I, Shumaker SA, Aaronson NK. Integrating health-related quality of life into cross-national clinical trials. Qual Life Res. 1993;2:433-440.
54. Nowinski CJ, Miller DM, Cella D. Evolution of patient-reported outcomes and their role in multiple sclerosis clinical trials. Neurotherapeutics. 2017;14:934-944.
55. Cella D, Nowinski C, Peterman A, et al. The neurology quality-of-life measurement initiative. Arch Phys Med Rehabil. 2011;92(10 Suppl):S28-S36.
56. HealthMeasures: PROMIS. http://www.healthmeasures.net/explore-measurement-systems/promis. Accessed October 20, 2019.
57. Valderas JM, Ferrer M, Mendivil J, et al. Development of EMPRO: a tool for the standardized assessment of patient-reported outcome measures. Value Health. 2008;11:700-708.
58. Bach K, Martling C, Mork PJ, et al. Design of a clinician dashboard to facilitate co-decision making in the management of non-specific low back pain. J Intelligent Helath Syst. 2019;52:269-284.
59. Karami M, Safdari R, Rahimi A. Effective radiology dashboards: key research findings. Radiology Management. 2013;35:42-45.
60. Dowding D, Randell R, Gardner P, et al. Dashboards for improving patient care: review of the literature. Int J Med Informatic. 2015;84:87-100.
61. Mlaver E, Schnipper JL, Boxer RB, et al. User-centered collaborative design and development of an inpatient safety dashboard. Jt Comm J Qual Patient Saf. 2017;43:676-685.
62. Dowding D, Merrill J, Russell D. Using feedback intervention theory to guide clinical dashboard design. AMIA Annu Symp Proc. 2018;2018:395-403.
63. Hartzler AL, Izard JP, Dalkin BL, et al. Design and feasibility of integrating personalized PRO dashboards into prostate cancer care. J Am Med Inform Assoc. 2016;23:38-47.
64. Lavallee DC, Chenok KE, Love RM, et al. Incorporating patient-reported outcomes into health care to engage patients and enhance care. Health Affairs. 2016;35:575-582.
65. U.S. Centers for Medicare & Medicaid Services. Comprehensive Care for Joint Replacement Model. https://innovation.cms.gov/initiatives/CJR. Accessed August 3, 2019.
66. National Quality Forum. Patient-reported outcomes: Accessed August 3, 2019. http://www.qualityforum.org/Patient-Reported_Outcomes.aspx. Accessed October 20, 2019.
67. Institute of Medicine Roundtable on Evidence-Based Medicine. The National Academies Collection: Reports funded by National Institutes of Health. In: Olsen LA, Aisner D, McGinnis JM, eds. The Learning Healthcare System: Workshop Summary. Washington (DC): National Academies Press (US).National Academy of Sciences; 2007.
68. About Learning Health Systems: Agency for Healthcare Research and Quality. https://www.ahrq.gov/learning-health-systems/about.html. Accessed August 3, 2019.
69. Best Care at Lower Cost: The Path to Continuously Learning Health Care in America. Washington (DC): National Academies Press; 2013.
70. Committee on Quality of Health Care in America. Crossing the Quality Chasm: A New Health System for the 21st Century. Washington, DC: National Academies Press; 2001.
71. Oliver BJ, for the MS-CQI Investigators. The Multiple Sclerosis Continuous improvement collaborative: the first coproduction learning health system improvement science research collaborative for multiple sclerosis. The International Society for Quality in Health Care (ISQua) Annual International Conference; October 2019; Cape Town, South Africa.
72. Britto MT, Fuller SC, Kaplan HC, et al. Using a network organisational architecture to support the development of Learning Healthcare Systems. BMJ Qual Saf. 2018;27:937-946.
73. Care Centers: Cystic Fibrosis Foundation. https://www.cff.org/Care/Care-Centers/. Accessed August 3, 2019.
74. Schechter MS, Fink AK, Homa K, Goss CH. The Cystic Fibrosis Foundation patient registry as a tool for use in quality improvement. BMJ Qual Saf. 2014;23(Suppl 1):i9-i14.
75. Mogayzel PJ, Dunitz J, Marrow LC, Hazle LA. Improving chronic care delivery and outcomes: the impact of the cystic fibrosis Care Center Network. BMJ Qual Saf. 2014;23(Suppl 1):i3-i8.
76. Godfrey MM, Oliver BJ. Accelerating the rate of improvement in cystic fibrosis care: contributions and insights of the learning and leadership collaborative. BMJ Qual Saf. 2014;23(Suppl 1):i23-i32.
77. Nelson EC, Godfrey MM. Quality by Design: A Clinical Microsystems Approach. San Francisco, California: Jossey-Bass; 2007.
78. Crohn’s & Colitis Foundation.Quality of Care: IBD Qorus: https://www.crohnscolitisfoundation.org/research/ibd-qorus. Accessed October 23, 2019.
79. Johnson LC, Melmed GY, Nelson EC, et al. Fostering collaboration through creation of an ibd learning health system. Am J Gastroenterol. 2017;112:406-468.
80. Fernandez-Munoz JJ, Moron-Verdasco A, Cigaran-Mendez M, et al. Disability, quality of life, personality, cognitive and psychological variables associated with fatigue in patients with multiple sclerosis. Acta Neurologica Scandinavica. 2015;132:118-124.
81. Flachenecker P, Kumpfel T, Kallmann B, et al. Fatigue in multiple sclerosis: a comparison of different rating scales and correlation to clinical parameters. Multiple Sclerosis. 2002;8:523-526.
82. Tellez N, Rio J, Tintore M, et al. Does the Modified Fatigue Impact Scale offer a more comprehensive assessment of fatigue in MS? Multiple Sclerosis. 2005;11:198-202.
83. Salter A, Fox RJ, Tyry T, et al. The association of fatigue and social participation in multiple sclerosis as assessed using two different instruments. Mult Scler Relat Disord. 2019;31:165-72.
84. Solaro C, Trabucco E, Messmer Uccelli M. Pain and multiple sclerosis: pathophysiology and treatment. Curr Neurol Neurosci Rep. 2013;13:320.
85. Jawahar R, Oh U, Yang S, Lapane KL. A systematic review of pharmacological pain management in multiple sclerosis. Drugs. 2013;73:1711-1722.
86. Rintala A, Hakkinen A, Paltamaa J. Ten-year follow-up of health-related quality of life among ambulatory persons with multiple sclerosis at baseline. Qual Life Res. 2016;25:3119-3127.
87. Tepavcevic DK, Pekmezovic T, Stojsavljevic N, et al. Change in quality of life and predictors of change among patients with multiple sclerosis: a prospective cohort study. Qual Life Res. 2014;23:1027-1037.
88. DasGupta R, Fowler CJ. Bladder, bowel and sexual dysfunction in multiple sclerosis: management strategies. Drugs. 2003;63:153-166.
89. Marck CH, Jelinek PL, Weiland TJ, et al. Sexual function in multiple sclerosis and associations with demographic, disease and lifestyle characteristics: an international cross-sectional study. BMC Neurology. 2016;16:210.
90. Gajofatto A, Benedetti MD. Treatment strategies for multiple sclerosis: When to start, when to change, when to stop? World J Clinical Cases. 2015;3:545-555.
91. National Multiple Sclerosis Society. Disease-modifying therapies for MS. 2018.
92. Rudick RA, Panzara MA. Natalizumab for the treatment of relapsing multiple sclerosis. Biologics. 2008;2:189-199.
93. Cohen JA, Cutter GR, Fischer JS, et al. Benefit of interferon beta-1a on MSFC progression in secondary progressive MS. Neurology. 2002;59:679-687.
94. Patti F, Pappalardo A, Montanari E, et al. Interferon-beta-1a treatment has a positive effect on quality of life of relapsing-remitting multiple sclerosis: results from a longitudinal study. J Neurol Sci. 2014;337:180-185.
95. Novartis. Exploring the efficacy and safety of Siponimod in patients with secondary progressive multiple sclerosis (EXPAND). Available from clinicaltrials.gov/ct2/show/NCT01665144. NLM identifier: NCT01665144.
96. Singal AG, Higgins PD, Waljee AK. A primer on effectiveness and efficacy trials. Clin Transl Gastroenterol. 2014;5:e45.
97. Jongen PJ. Health-related quality of life in patients with multiple sclerosis: impact of disease-modifying drugs. CNS Drugs. 2017;31:585-602.
98. Coretti S, Ruggeri M, McNamee P. The minimum clinically important difference for EQ-5D index: a critical review. Expert Rev Pharmacoecon Outcomes Res. 2014;14:221-233.
99. Clinical Review Report: Ocrelizumab (Ocrevus). CADTH Common Drug Review. 2018:Appendix 4, Validity of Outcome Measures.
100. iCounquer MS; Empowering patients: how individuals with ms are contributing to the fight to find a cure: 2018. https://www.iconquerms.org/empowering-patients-how-individuals-ms-are-contributing-fight-find-cure. Accessed October 23, 2019.
101. K M. Accelerated Cure Project Announces Collaboration with EMD Serono to Advance Patient-Focused Drug Development in Multiple Sclerosis2018. https://www.iconquerms.org/accelerated-cure-project-announces-collaboration-emd-serono-advance-patient-focused-drug-development. Accessed October 24, 2019.
102. Bebo BF Jr, Fox RJ, Lee K, et al. Landscape of MS patient cohorts and registries: Recommendations for maximizing impact. Multiple Sclerosis. 2018;24:579-586.
103. Hedstrom AK, Hillert J, Olsson T, Alfredsson L. Alcohol as a modifiable lifestyle factor affecting multiple sclerosis risk. JAMA Neurology. 2014;71:300-305.
104. Hedstrom AK, Baarnhielm M, Olsson T, Alfredsson L. Tobacco smoking, but not Swedish snuff use, increases the risk of multiple sclerosis. Neurology. 2009;73:696-701.
105. Hedstrom AK, Akerstedt T, Hillert J, et al. Shift work at young age is associated with increased risk for multiple sclerosis. Ann Neurol. 2011;70:733-741.
106. Hadjimichael O, Vollmer T, Oleen-Burkey M. Fatigue characteristics in multiple sclerosis: the North American Research Committee on Multiple Sclerosis (NARCOMS) survey. Health Qual Life Outcomes. 2008;6:100.
107. Fox RJ, Salter AR, Tyry T, et al. Treatment discontinuation and disease progression with injectable disease-modifying therapies: findings from the North American research committee on multiple sclerosis database. Int J MS Care. 2013;15:194-201.
108. Reeve BB, Wyrwich KW, Wu AW, et al. ISOQOL recommends minimum standards for patient-reported outcome measures used in patient-centered outcomes and comparative effectiveness research. Qual Life Res. 2013;22:1889-1905.
109. Jacobs LD, Wende KE, Brownscheidle CM, et al. A profile of multiple sclerosis: the New York State Multiple Sclerosis Consortium. Multiple Sclerosis. 1999;5:369-376.
110. Weinstock-Guttman B, Jacobs LD, Brownscheidle CM, et al. Multiple sclerosis characteristics in African American patients in the New York State Multiple Sclerosis Consortium. Multiple Sclerosis. 2003;9:293-298.
111. Raffel J, Wallace A, Gveric D, et al. Patient-reported outcomes and survival in multiple sclerosis: A 10-year retrospective cohort study using the Multiple Sclerosis Impact Scale-29. PLoS Med. 2017;14:e1002346.
112. Vaughn CB, Kavak KS, Dwyer MG, et al. Fatigue at enrollment predicts EDSS worsening in the New York State Multiple Sclerosis Consortium. Multiple Sclerosis. 2018:1352458518816619.
113. Alroughani RA, Akhtar S, Ahmed SF, Al-Hashel JY. Clinical predictors of disease progression in multiple sclerosis patients with relapsing onset in a nation-wide cohort. Int J Neuroscience. 2015;125:831-837.
114. Dolan JG, Veazie PJ, Russ AJ. Development and initial evaluation of a treatment decision dashboard. BMC Med Inform Decision Mak. 2013;13:51.
115. Stuifbergen AK, Becker H, Blozis S, et al. A randomized clinical trial of a wellness intervention for women with multiple sclerosis. Arch Phys Med Rehabil. 2003;84:467-476.
116. Finkelstein J, Martin C, Bhushan A, et al. Feasibility of computer-assisted education in patients with multiple sclerosis. In: Proceedings of the IEEE Symposium on Computer-Based Medical Systems. Bethesda, MD; 2004.
117. Batalden P. Getting more health from healthcare: quality improvement must acknowledge patient coproduction—an essay by Paul Batalden. BMJ. 2018;362:k3617.
118. Batalden PB, Davidoff F. What is “quality improvement” and how can it transform healthcare? Qual Saf Health Care. 2007;16:2-3.
119. Ovretveit J, Zubkoff L, Nelson EC, et al. Using patient-reported outcome measurement to improve patient care. Int J Qual Health Care. 2017;29:874-879.
120. Prodinger B, Taylor P. Improving quality of care through patient-reported outcome measures (PROMs): expert interviews using the NHS PROMs Programme and the Swedish quality registers for knee and hip arthroplasty as examples. BMC Health Services Res. 2018;18:87.
121. Prinsen CA, Vohra S, Rose MR, et al. How to select outcome measurement instruments for outcomes included in a “Core Outcome Set” – a practical guideline. Trials. 2016;17:449.
122. NINDS. NINDS Common Data Elements: Streamline Your Neuroscience Clinical Research National Institute of Health. https://www.commondataelements.ninds.nih.gov/#page=Default. Accessed October 23, 2019.
123. Francis DO, McPheeters ML, Noud M, et al. Checklist to operationalize measurement characteristics of patient-reported outcome measures. Systematic Rev. 2016;5:129.
124. National Quality Forum. Patient-reported outcomes (PROs) in performance measurement. 2013. https://www.qualityforum.org/Publications/2012/12/Patient-Reported_Outcomes_in_Performance_Measurement.aspx. Accessed October 15, 2019.
125. Dawson J, Doll H, Fitzpatrick R, et al. The routine use of patient reported outcome measures in healthcare settings. BMJ. 2010;340:c186.
126. Aaronson N ET, Greenlhalgh J, Halyard M, et al. User’s guide to implementation of patient reported outcomes assessment in clinical practice. International Society for Quality of Life. 2015.
127. Chan EKH, Edwards TC, Haywood K, et al. Implementing patient-reported outcomes mesaures in clinical practice: a companion guide to the ISOQOL user’s guide. Qual Life Res. 2018;28:621-627.
128. Snyder CF, Wu AW, Miller RS, et al. The role of informatics in promoting patient-centered care. Cancer J. 2011;17:211-218
129. Osborn R, Moulds D, Schneider EC, et al. Primary care physicians in ten countries report challenges caring for patients with complex health needs. Health Affairs. 2015;34:2104-2112.
130. Wu AW, Kharrazi H, Boulware LE, Snyder CF. Measure once, cut 0wice--adding patient-reported outcome measures to the electronic health record for comparative effectiveness research. J Clin Epidemiol. 2013;66(8 Suppl):S12-S20.
131. Trojano M, Bergamaschi R, Amato MP, et al. The Italian multiple sclerosis register. Neurol Sci. 2019;40:155-165.
132. Moorhead SA, Hazlett DE, Harrison L, et al. A new dimension of health care: systematic review of the uses, benefits, and limitations of social media for health communication. J Med Internet Res. 2013;15:e85.
133. Luigi L, Francesco B, Marcello M, et al. e-Health and multiple sclerosis: An update. Multiple Sclerosis J. 2018;24:1657-1664.
134. Marrie RA, Leung S, Tyry T, et al. Use of eHealth and mHealth technology by persons with multiple sclerosis. Mult Scler Relat Dis. 2019;27:13-19.
135. Giunti G, Kool J, Rivera Romero O, Dorronzoro Zubiete E. Exploring the specific needs of persons with multiple sclerosis for mhealth solutions for physical activity: mixed-methods study. JMIR Mhealth Uhealth. 2018;6:e37.
136. Spooner KK, Salemi JL, Salihu HM, Zoorob RJ. eHealth patient-provider communication in the United States: interest, inequalities, and predictors. J Am Med Inform Assoc. 2017;24(e1):e18-e27.
137. Safdar N, Abbo LM, Knobloch MJ, Seo SK. Research methods in healthcare epidemiology: survey and qualitative research. Infect Control Hosp Epidemiol. 2016;37:1272-1277.
138. Rolstad S, Adler J, Rydén A. Response burden and questionnaire length: is shorter better? A review and meta-analysis. Value Health. 2011;14:1101-1108.
139. Chiu C, Bishop M, Pionke JJ, et al. Barriers to the accessibility and continuity of health-care services in people with multiple sclerosis: a literature review. Int J MS Care. 2017;19:313-321.
140. Atreja A, Mehta N, Miller D, et al. One size does not fit all: using qualitative methods to inform the development of an Internet portal for multiple sclerosis patients. AMIA Annu Symp Proc Symp. 2005:16-20.
141. Snyder CF, Blackford AL, Brahmer JR, et al. Needs assessments can identify scores on HRQOL questionnaires that represent problems for patients: an illustration with the Supportive Care Needs Survey and the QLQ-C30. Qual Life Res. 2010;19:837-845.
142. de Vet HC, Terwee CB. The minimal detectable change should not replace the minimal important difference. J Clin Epidemiol. 2010;63:804-805.
143. Snyder CF, Aaronson NK, Choucair AK, et al. Implementing patient-reported outcomes assessment in clinical practice: a review of the options and considerations. Qual Life. 2012;21:1305-1314.
144. Myla DG, Melanie DW, Robert WM, et al. Identification and validation of clinically meaningful benchmarks in the 12-item Multiple Sclerosis Walking Scale. Multiple Sclerosis J. 2017;23:1405-1414.
145. van Munster CEP, Uitdehaag BMJ. Outcome measures in clinical trials for multiple sclerosis. CNS Drugs. 2017;31:217-236.
146. Snyder CF, Jensen R, Courtin SO, Wu AW. PatientViewpoint: a website for patient-reported outcomes assessment. Quality Life Res. 2009;18:793-800.
147. Snyder CF, Smith KC, Bantug ET, et al. What do these scores mean? Presenting patient-reported outcomes data to patients and clinicians to improve interpretability. Cancer. 2017;123:1848-1859.
148. Squitieri L, Bozic KJ, Pusic AL. The role of patient-reported outcome measures in value-based payment reform. Value Health. 2017;20:834-836.
149. Boyce MB, Browne JP. The effectiveness of providing peer benchmarked feedback to hip replacement surgeons based on patient-reported outcome measures—results from the PROFILE trial: a cluster randomised controlled study. BMJ Open. 2015;5:e008325.
From the Dartmouth Institute for Health Policy & Clinical Practice, Geisel School of Medicine, Hanover, NH (Ms. Manohar and Dr. Oliver), the Department of Community & Family Medicine, Dartmouth-Hitchcock Medical Center, Lebanon, NH (Ms. Perkins, Ms. Laurion, and Dr. Oliver), and the Multiple Sclerosis Specialty Care Program, Concord Hospital, Concord, NH (Dr. Oliver).
Abstract
- Background: Patient-reported outcomes (PROs), including patient-reported outcome measures (PROMs) and patient-reported experience measures (PREMs), can be used to assess perceived health status, functioning, quality of life, and experience of care. Complex chronic illnesses such as multiple sclerosis (MS) affect multiple aspects of health, and PROs can be applied in assessment and decision-making in MS care as well as in research pertaining to MS.
- Objective: To provide a general review of PROs, with a specific focus on implications for MS care.
- Methods: Evidence synthesis of available literature on PROs in MS care.
- Results: PROs (including PROMs and PREMs) have historically been utilized in research and are now being applied in clinical, improvement, and population health settings using learning health system approaches in many disease populations, including MS. Many challenges complicate the use of PROs in MS care, including reliability, validity, and interpretability of PROMs, as well as feasibility barriers due to time and financial constraints in clinical settings.
- Conclusion: PROs have the potential to better inform clinical care, empower patient-centered care, inform health care improvement efforts, and create the conditions for coproduction of health care services.
Keywords: PRO; PROM; patient-reported outcome measure; patient-reported experience measure; quality of life; patient-centered care.
Multiple sclerosis (MS) is a disabling, complex, chronic, immune-mediated disorder of the central nervous system (CNS). MS causes inflammatory and degenerative damage in the CNS, which disrupts signaling pathways.1 It is most commonly diagnosed in young adults and affects 2.3 million people worldwide.2 People with MS experience very different disease courses and a wide range of neurological symptoms, including visual, somatic, mental health, sensory, motor, and cognitive problems.1-3 Relapsing-remitting MS, the most common form, affects 85% of those with MS and is characterized by periods of relapse (exacerbation) and remission.1 Other forms of MS (primary progressive and secondary progressive MS) are characterized by progressive deterioration and worsening symptom severity without exacerbations. Disease-modifying therapies (DMTs) can reduce the frequency of exacerbations and disability progression, but unfortunately there is no cure for MS. Treatment is focused on increasing quality of life, minimizing disability, and maximizing wellness.
Patient-reported outcomes (PROs) describe the perceived health status, function, and/or experience of a person as obtained by direct self-report. Patient-reported outcome measures (PROMs) are validated PROs that can be used to inform clinical care,4 and have demonstrated effectiveness in improving patient-provider communication and decision-making.5-7 PROMs are currently used in some MS clinical trials to determine the impact of experimental interventions,8-10 and are also being used to inform and improve clinical care in some settings. Especially for persons with MS, they can provide individualized perspectives about health experience and outcomes.11 In more advanced applications, PROMs can be used to improve face-to-face collaborations between clinicians and patients and to inform patient-centered systems of care.12-14 PROMs can also be used to inform systems-level improvement for entire patient populations.15,16
In this article, we review current applications of PROs and PROMs in the care of persons with MS, as well as current limitations and barriers to their use.
At a recent visit to her neurologist, Marion reviews her health diary, in which she has been tracking her fatigue levels throughout the day and when she has to visit the bathroom. The PRO diary also helps her remember details that she might not otherwise be able to recall at the time of her clinic visit. They review the diary entrees together to develop a shared understanding of what Marion has been experiencing and identify trends in the PRO data. They discuss symptom management and use the PRO information from the diary to help guide adjustments to her physical therapy routine and medication regimen.
Part of Marion’s “PRO package” includes the Center for Epidemiologic Studies Depression Scale (CES-D), a validated depression screening and symptom severity questionnaire that she completes every 3 months. Although she denies being depressed, she has noticed that her CES-D scores in recent months have been consistently increasing. This prompts a discussion about mental health in MS and a referral to work on depression with the MS mental health specialist. Marion and the mental health specialist use CES-D measures at baseline and during treatment to set a remission target and to track progress during treatment. Marion finds this helpful because she says it is hard for her to “wrap my hands around depression… it’s not something that there is a blood test or a MRI for.” Marion is encouraged by being able to see her CES-D scores change as her depression severity decreases, and this helps motivate her to keep engaged in treatment.
PROs and PROMs: General Applications
PROs are measures obtained directly from an individual without a priori interpretation by a clinician.9,17 PROs capture individual perspectives on symptoms, capability, disability, and health-related quality of life.9 With increasing emphasis on patient-centered care,18 individual perspectives and preferences elicited using PROMs may be able to inform better quality of care and patient-centered disease treatment and management.19-21
PROMs are standardized, validated questionnaires used to assess PROs and can be generic or condition-specific. Generic PROMs can be used in any patient population. The SF-3622 is a set of quality of life measures that assess perceived ability to complete physical tasks and routine activities, general health status, fatigue, social functioning, pain, and emotional and mental health.23 Condition-specific PROMs can be used for particular patient populations and are helpful in identifying changes in health status for a specific disease, disability, or surgery. For example, the PDQ-39 assesses 8 dimensions of daily living, functioning, and well-being for people with Parkinson’s disease.24
PROMs have been used in some MS clinical trials and research studies to determine the effectiveness of experimental treatments from the viewpoint of study participants.9,25,26 PROs can also be utilized in clinical care to facilitate communication of needs and track health outcomes,27 and can inform improvement in outcomes for health systems and populations. They can also be used to assess experience of care,28 encouraging a focus on high-quality outcomes through PRO-connected reimbursement mechanisms,29 and provide aggregate data to evaluate clinical practice, population health outcomes, and the effectiveness of public policies.27
Patient-reported experience measures (PREMs) assess patient satisfaction and experience of health care.30,31 CollaboRATE32 is a PREM that assesses the degree of shared decision-making occurring between patients and clinicians during clinical care. PREMs are currently used for assessing self-efficacy and in shared decision-making and health care improvement applications. PREMs have yet to be developed specifically for persons with MS.
PROMs in MS Care
Generic PROMs have shown that persons with MS are disproportionately burdened by poor quality of life.33-35 Other generic PROMs, like the SF-36,36 the Sickness Impact Profile,37 and versions of the Health Utilities Index,38 can be used to gather information on dysfunction and to determine quality and duration of life modified by MS-related dysfunction and disability. MS-specific PROMs are used to assess MS impairments, including pain, fatigue, cognition, sexual dysfunction, and depression.12,39-42 PROMs have also been used in MS clinical trials, including the Multiple Sclerosis Impact Scale-29 (MSIS-29),43,44 the Leeds MS QoL (LMSQoL),45,46 the Functional Assessment of MS (FAMS),47 the Hamburg Quality of Life Questionnaire in MS (HAQUAMS),48 the MS Quality of Life-54 (MSQoL-54),49 the MS International QoL (MUSIQoL),50 and the Patient-Reported Indices for MS Activity Limitations Scale (PRIMUS).51
Condition-specific PROMs are more sensitive to changes in health status and functioning for persons with MS compared to generic PROMs. They are also more reliable during MS remission and relapse periods.44,52 For example, the SF-36 has floor and ceiling effects in MS populations—a high proportion of persons with MS are scored at the maximum or minimum levels of the scale, limiting discriminant capability.22 As a result, a “combined approach” using both generic and MS-specific measures is often recommended.53 Some MS PROMs (eg, MSQoL-54) include generic questions found in the SF-36 as well as additional MS-specific questions or scales.
The variety of PROMs available (see Table for a selected listing) introduces a significant challenge to using them—limited generalizability and difficulty comparing PROs across MS studies. Efforts to establish common PROMs have been undertaken to address this problem.54 The National Institute of Neurologicical Disorders and Stroke (NINDS) sponsored the development of a neurological quality of life battery, the Neuro-QOL.55 Neuro-QOL measures the physical, mental, and social effects of neurological conditions in adults and children with neurological disorders and has the capability to facilitate comparisons across different neurological conditions. Additionally, the Patient-Reported Outcomes Measure Information System (PROMIS) has been developed to assess physical, mental, and social effects of chronic disease. PROMIS has a hybrid design that includes generic and MS-specific measures (such as PROMIS FatigueMS).56 PROMIS can be used to assess persons with MS as well as to compare the MS population with other populations with chronic illness.
PROMs have varying levels of reliability and validity. The Evaluating the Measure of Patient-Reported Outcomes57 study evaluated the development process of MS PROMs,43 and found that the MSIS-29 and LMSQoL had the highest overall reliability among the most common MS PROMs. However, both scored poorly on validity due to lack of patient involvement during development. This questions the overall capability of existing MS PROMs to accurately and consistently assess PROs in persons with MS.
“Feed-Forward” PROMs
Oliver and colleagues16 have described “feed-forward” PROM applications in MS care in a community hospital setting using a learning health system approach. This MS clinic uses feed-forward PROs to inform clinical care—PRO data are gathered before the clinic visit and analyzed ahead of or during the clinic visit by the clinician. Patients are asked to arrive early and complete a questionnaire comprised of PROMs measuring disability, functioning, quality of life, cognitive ability, pain, fatigue, sleep quality, anxiety, and depression. Clinicians score the PROMs and input scores into the electronic health record before the clinical encounter. During the clinic visit, PROM data is visually displayed so that the clinician and patient can discuss results and use the data to better inform decision-making. The visual data display contains longitudinal information, displaying trends in health status across multiple domains, and includes specified thresholds for clinically active symptom levels (Figure).16 Longitudinal monitoring of PROM data allows for real-time assessment of goal-related progress throughout treatment. As illustrated previously by Marion’s case study, the use of real-time feed-forward PROM data can strengthen the partnership between patient and clinician as well as improve empowerment, engagement, self-monitoring, and adherence.
PRO Dashboards
Performance dashboards are increasingly used in health care to visually display clinical and PRO data for individual patients, systems, and populations over time. Dashboards display a parsimonious group of critically important measures to give clinicians and patients a longitudinal view of PRO status. They can inform decision-making in clinical care, operations, health care improvement efforts, and population health initiatives.58 Effective dashboards allow for user customization with meaningful measures, knowledge discovery for analysis of health problems, accessibility of health information, clear visualization, alerts for unexpected data values, and system connectivity.59,60 Appropriate development of PRO dashboards requires meaningful patient and clinician involvement via focus groups and key informant interviews, Delphi process approaches to prioritize and finalize selection of priority measures, iterative building of the interface with design input from key informants and stakeholders (co-design), and pilot testing to assess feasibility and acceptability of use.61-63
Other Applications of PROs/PROMs in MS
Learning Health Systems
The National Quality Forum (NQF) and the Centers for Medicaid and Medicare Services have adopted PROs for use in quality measurement.64-66 This includes a movement towards the use of LHS, defined as a health system in which information from patients and clinicians is systematically collected and synthesized with external evidence to inform clinical care, improvement, and research.67-70 Often a LHS is undertaken as a collaborative effort between multiple health care centers to improve quality and outcomes of care.70 The MS Continuous Quality Improvement Collaborative (MS-CQI), the first multi-center systems-level health care improvement research collaborative for MS,71 as well as IBD Qorus and the Cystic Fibrosis Care Center Network utilize LHS approaches.72-77
IBD Qorus is a LHS developed by the Crohn’s and Colitis Foundation that uses performance dashboards to better inform clinical care for people with inflammatory bowel disease. It also employs system-level dashboards for performance benchmarking in quality improvement initiatives and aggregate-level dashboards to assess population health status.78,79 MS-CQI uses a LHS approach to inform the improvement of MS care across multiple centers using a comprehensive dashboard, including PROMs, for benchmarking and to monitor system and population health status. MS-CQI collects PROMs using a secure online platform that can be accessed by persons with MS and their clinicians and also includes a journaling feature for collecting qualitative information and for reference and self-monitoring.71
MS Research
PROMs are used in clinical and epidemiological research to evaluate many aspects of MS, including the FAMS, the PDSS, the Fatigue Impact Scale (FIS), and others.80-82 For example, the PROMIS FatigueMS and the Fatigue Performance Scale have been used to assess the impact of MS-related fatigue on social participation.83 Generic and MS-specific PROMs have been used to assess pain levels for people with MS,84-87 and multiple MS-specific PROMs, like PRIMUS and MSQoL-54,43 as well as the SF-3639 include pain assessment scales. PROMs have also been used to assess MS-related bladder, bowel, and sexual dysfunction. Urgency, frequency, and incontinence affect up to 75% of patients with MS,88 and many PROMs, such as the LMSQoL, MUSIQoL, and the MSQoL-54, are able to evaluate bladder control and sexual functioning.43,89
PROMs are employed in MS clinical trials to help assess the tolerability and effectiveness of DMTs.90,91 PROs have been used as secondary endpoints to understand the global experience of a DMT from the patient perspective.92-94 There are 15 FDA-approved DMTs for MS, and clinical trials for 6 of these have used PROMs as an effectiveness end point.54,91,95,96 However, most DMT clinical trials are powered for MRI, relapse rate, or disease progression primary outcomes rather than PROMs, often resulting in underpowered PROM analyses.97 In addition, many PROMs are not appropriate for use in DMT clinical trials.98,99
In order to bridge the gap between clinical research and practice, some industry entities are championing “patient-focused drug development” approaches. The Accelerated Cure Project for MS has launched iConquerMS, which collects PROMs from persons with MS to further PRO research in MS and follows 4700 individuals with MS worldwide.100 In 2018, the American College of Physicians announced a collaboration with an industry partner to share data to inform DMT clinical trials and develop and validate PROMs specifically designed for DMT clinical trials.101
Population Health
Registries following large cohorts of people with MS have the potential to develop knowledge about disease progression, treatment patterns, and outcomes.102 The Swedish EIMS study has identified associations between pre-disease body mass index and MS prognosis,102 alcohol and tobacco consumption affecting MS risk,103,104 and exposure to shift work at a young age and increased MS risk.105 The North American Research Committee on MS83,106,107 and iConquerMS registries are “PROM-driven” and have been useful in identifying reductions in disease progression in people using DMTs.107,108 The New York State MS Consortium has identified important demographic characteristics that influence MS progression.109,110 PROs can also be used to determine risk of MS-related mortality111 and decline in quality of life.112,113 Limitations of these approaches include use of different PROMs, inconsistencies in data collection processes, and different follow-up intervals used across registries.102
Patient-Centered Care
The Institute of Medicine defines patient-centeredness as “care that is respectful and responsive to individual patient preferences, needs, and values and ensures that patient values guide all clinical decisions.”114 PROs are useful for identifying a patient’s individual health concerns and preferences, something that is needed when treating a highly variable chronic health condition like MS. The use of PROs can help clinicicans visualize the lived experience of persons with MS and identify personal preferences,115 as well as improve self-monitoring, self-management, self-efficacy, adherence, wellness, and coping ability.116 At the system level, PROs can inform improvement initiatives and patient-centered care design efforts.117-120
Selecting PROMs
Initiatives from groups like the COnsensus-based Standards for the Selection of health Measurement INstruments (COSMIN)121 and the International Society for Quality of Life Research (ISOQOL)108 offer guidance on selecting PROs. The NINDS has promoted common data collection between clinical studies of the brain and nervous system.122 General guidance from these sources recommends first considering the outcome and target population, selecting PROMs to measure the outcome through a synthesis of the available evidence, assessing validity and reliability of selected PROMs, and using standard measures that can be compared across studies or populations.108,121 Other factors include feasibility, acceptability, and burden of use for patients, clinicians, and systems, as well as literacy, cultural, and linguistic factors.123
The NQF recommends that consideration be given to individual patient needs, insurance factors, clinical setting constraints, and available resources when selecting PROMs.124 To maximize response rate, PROMs that are sensitive, reliable, valid, and developed in a comparative demographic of patients are advised.125 ISOQOL has released a User’s Guide and several companion guides on implementing and utilizing PROMs.108,126,127 Finally, PRO-Performance Measures (PRO-PMs) are sometimes used to assess whether PROMs are appropriately contributing to performance improvement and accountability.124
The Cons of PROs
PROs can disrupt busy clinical care environments and overextend clinical staff.125 Online collection of PROs outside of clinical encounters can relieve PRO-related burden, but this requires finding and funding appropriate secure online networks to effectively collect PROs.128 In 2015, only 60% of people seen for primary care visits could access or view their records online, and of those, only 57% used messaging for medical questions or concerns.129 Ideally, online patient portal or mobile health apps could synchronize directly to electronic health records or virtual scribes to transfer patient communications into clinical documentation.130 There has been limited success with this approach in European countries131 and with some chronic illness conditions in the United States.74
Electronic health technologies, including mobile health (mHealth) solutions, have improved the self-monitoring and self-management capability of patients with MS via information sharing in patient networks, assistive technologies, smartphone applications, and wearable devices.132,133 A recent study found that communication modes included secure online patient portal use (29%) and email use (21%), and among those who owned tablets or smartphones, 46% used mHealth apps.134 Social media use has been associated with increased peer/social/emotional support and increased access to health information, as well as clinical monitoring and behavior change.134,135 Individuals using mHealth apps are younger, have comorbidities, and have higher socioeconomic and education levels,135,136 suggesting that inequities in mHealth access exist.
Questionnaires can be time-consuming and cause mental distress if not appropriately facilitated.137 Decreasing questionnaire length and providing the option for PROMs to be delivered and completed online or outside of the clinic context can reduce burden.138 Additionally, while some people are consistent in sharing their PROs, others struggle with using computers, especially while experiencing severe symptoms, forget to complete PROMs, or simply do not have internet access due to financial or geographic constraints.139 A group of disabled and elderly persons with MS reported barriers to internet use due to visual deficits, small website font sizes, and distracting color schemes.140
Interpretability
Interpreting PROMs and displays of longitudinal PROM data can be a challenge for persons with MS and their clinicians. There is little standardization in how PROMs are scored and presented, and there is often confusion about thresholds for clinical significance and how PROM scores can be compared to other PROMs.141,142 While guidelines exist for implementing PRO scores in clinical settings,126,143 there are few that aid PROM interpretation. As a result, clinicians often seek research evidence for PROMs used in other similar patient populations as a benchmark,142-144 or compare them to other patients seen in their clinical practice.
Longitudinal PRO data are usually displayed in simple line graphs.145,146 Overall, line graphs have been found to have the highest ease of understanding by both patients and clinicians, but sometimes can be confusing.147 For example, upward trending lines are usually viewed as improvement and downward trending lines as decline; however, upward trending scores on a PROM can indicate decline, such as increasing fatigue severity. Annotation of visual displays can help. Patients and clinicians find that employing thresholds and color coding is useful, and better than “stoplight” red-yellow-green shading schemes or red-circle formats to indicate data that warrant attention.142
PROs are not free of risk for error, especially if they are used independently of other information sources, such as clinical interview, examination, and diagnostic testing, or if they are utilized too frequently, too infrequently, or are duplicated in practice. If a PRO instrument is employed too frequently, score changes may reflect learning effects rather than actual clinical status. Conversely, if used too infrequently, PRO information will not be timely enough to inform real-time clinical practice. Duplication of PRO assessments (eg, multiple measures of the same PRO for the same patient on the same day) or use of multiple PRO measures to assess the same aspect (eg, 2 measures used to assess fatigue) could introduce unnecessary complexity and confusion to interpretation of PRO results.
PRO measures also can be biased or modified by clinical status and/or perceptions of people with MS at the time of assessment. For example, cognitive impairment, whether at baseline state or due to a cognitive MS relapse event, could impact patients’ ability to understand and respond to PRO assessments, producing erroneous results. However, when used appropriately, PROs targeting cognitive dysfunction may be able to detect onset of cognitive events or help to measure recovery from them. Finally, PROs measure perceived (self-reported) status, which may not be an accurate depiction of actual status.
All of these potential pitfalls support the argument that PROs should be utilized to augment the clinical interview, examination, and diagnostic (objective) testing aspects of comprehensive MS care. In this way, PROs can be correlated with other information sources to deepen the shared understanding of health status between a person with MS and her clinician, increasing the potential to make better treatment decisions and care plans together in partnership.
Value and Cost
National groups such as the Patient-Centered Outcomes Research Institute (PCORI) are working with regulatory bodies, funding agencies, insurance providers, patient advocacy groups, researchers, providers, and specialty groups to investigate how PROMs can be implemented into value-based health care reforms, including value-based reimbursement.148 However, practical PRO implementation requires considerable time and resources, and many methodological and operational questions must be addressed before widespread adoption and reimbursement for PROMs will be feasible.148,149
Summary
PROs can generate valuable information about perceived health status, function, quality of life, and experience of care using self-reported sources. Validated PRO assessment tools include PROMs and PREMs. PROs are currently utilized in research settings (especially PROMs) but are also being used in clinical practice, quality improvement initiatives, and population health applications using LHS approaches. PROs have the advantages of empowering and informing persons with MS and clinicians to optimize patient-centered care, improve systems of care, and study population health outcomes. Barriers include PROM validity, reliability, comparability, specificity, interpretability, equity, time, and cost. Generic PROMs and PREMs, and some MS-specific PROMs, can be used for persons with MS. Unfortunately, no PREMs have been developed specifically for persons with MS, and this is an area for future research. With appropriate development and utilization in LHS applications, PROs can inform patient-centered clinical care, system-level improvement initiatives, and population health research, and have the potential to help facilitate coproduction of health care services.
Acknowledgments: The authors thank Ann Cabot, DO, of the MS Specialty Care Program at Concord Hospital and (especially) peer mentors from a peer outreach wellness program for people with MS (who have asked to remain anonymous) for interviews conducted with their permission to inform the case study described in this article. The case study used in this manuscript has been de-identified, with some aspects modified from actual, and the person in the case study is fictitiously named.
Corresponding author: Brant Oliver, PhD, MS, MPH, APRN-BC, Department of Community & Family Medicine, Dartmouth-Hitchcock Medical Center, Lebanon, NH 03756; brant.j.oliver@dartmouth.edu.
Financial disclosures: None.
1. Goldenberg MM. Multiple sclerosis review. PT. 2012;37:175-184.
2. Doshi A, Chataway J. Multiple sclerosis, a treatable disease. Clin Med. 2016;16(Suppl 6):s53-s9.
3. Perrin Ross A. Management of multiple sclerosis. Am J Managed Care. 2013;19(16 Suppl):s301-s306.
4. Batalden M, Batalden P, Margolis P, et al. Coproduction of healthcare service. BMJ Qual Saf. 2016;25:509-517.
5. Chen J, Ou L, Hollis SJ. A systematic review of the impact of routine collection of patient reported outcome measures on patients, providers and health organisations in an oncologic setting. BMC Health Serv Res. 2013;13:211.
6. Knaup C, Koesters M, Schoefer D, et al. Effect of feedback of treatment outcome in specialist mental healthcare: meta-analysis. Br J Psychiatr. 2009;195:15-22.
7. Dudgeon D. The impact of measuring patient-reported outcome measures on quality of and access to palliative care. J Palliat Med. 2018;21(S1):S76-s80.
8. Snyder CF, Herman JM, White SM, et al. When using patient-reported outcomes in clinical practice, the measure matters: a randomized controlled trial. J Oncol Pract. 2014;10:e299-e306.
9. Guidance for industry: patient-reported outcome measures: use in medical product development to support labeling claims: draft guidance. Health Qual Life Outcomes. 2006;4:79.
10. de Jong MJ, Huibregtse R, Masclee AAM, et al. Patient-reported outcome measures for use in clinical trials and clinical practice in inflammatory bowel diseases: a systematic review. Clin Gastroenterol Hepatol. 2018;16:648-663.
11. Roman D, Osborne-Stafsnes J, Amy CH, et al. Early lessons from four ‘aligning forces for quality’ communities bolster the case for patient-centered care. Health Affairs. 2013;32:232-241.
12. Ehde DM, Alschuler KN, Sullivan MD, et al. Improving the quality of depression and pain care in multiple sclerosis using collaborative care: The MS-care trial protocol. Contemporary Clinical Trials. 2018;64:219-229.
13. Lavallee DC, Chenok KE, Love RM, et al. Incorporating patient-reported outcomes into health care to engage patients and enhance care. Health Affairs. 2016;35:575-582.
14. Schick-Makaroff K, Thummapol O, Thompson S, et al. Strategies for incorporating patient-reported outcomes in the care of people with chronic kidney disease (PRO kidney): a protocol for a realist synthesis. Clin Gastroenterol Hepatol. 2018;16:648-663.
15. Nelson EC, Dixon-Woods M, Batalden PB, et al. Patient focused registries can improve health, care, and science. BMJ. 2016;354:i3319.
16. Oliver BJ, Nelson EC, Kerrigan CL. Turning feed-forward and feedback processes on patient-reported data into intelligent action and informed decision-making: case studies and principles. Med Care. 2019;57 Suppl 1:S31-s37.
17. Deshpande PR, Rajan S, Sudeepthi BL, Abdul Nazir CP. Patient-reported outcomes: A new era in clinical research. Perspect Clin Res. 2011;2:137-144.
18. Epstein RM, Street RL, Jr. The values and value of patient-centered care. Ann Fam Med. 2011;9:100-103.
19. Payne SA. A study of quality of life in cancer patients receiving palliative chemotherapy. Soc Sci Med. 1992;35:1505-1509.
20. Borgaonkar MR, Irvine EJ. Quality of life measurement in gastrointestinal and liver disorders. Gut. 2000;47:444-454.
21. Macdonell R, Nagels G, Laplaud DA, et al. Improved patient-reported health impact of multiple sclerosis: The ENABLE study of PR-fampridine. Multiple Sclerosis. 2016;22:944-954.
22. Hobart J, Freeman J, Lamping D, et al. The SF-36 in multiple sclerosis: why basic assumptions must be tested. J Neurol Neurosurg Psychiatry. 2001;71:363-370.
23. Lins L, Carvalho FM. SF-36 total score as a single measure of health-related quality of life: Scoping review. SAGE Open Med. 2016;4:2050312116671725.
24. Parkinson’s Disease Society of the United Kingdom. The Parkinson’s Disease Questionnaire (PDQ-39). https://www.parkinsons.org.uk/professionals/resources/parkinsons-disease-questionnaire-pdq-39. Accessed October 20, 2019.
25. Basch E. The missing voice of patients in drug-safety reporting. N Engl J Med. 2010;362:865-869.
26. Calvert M, Brundage M, Jacobsen PB, et al. The CONSORT Patient-Reported Outcome (PRO) extension: implications for clinical trials and practice. Health Qual Life Outcomes. 2013;11:184.
27. Black N. Patient reported outcome measures could help transform healthcare. BMJ. 2013;346:f167.
28. Franks P, Fiscella K, Shields CG, et al. Are patients’ ratings of their physicians related to health outcomes? Ann Fam Med. 2005;3:229-234.
29. Hostetter M, Klein S. Using patient-reported outcomes to improve health care quality. The Commonwealth Fund 2019. www.commonwealthfund.org/publications/newsletter-article/using-patient-reported-outcomes-improve-health-care-quality. Accessed October 24, 2019.
30. Charlotte Kingsley SP. Patient-reported outcome measures and patient-reported experience measures. BJA Education. 2017;17:137-144.
31. Weldring T, Smith SM. Patient-Reported outcomes (PROs) and patient-reported outcome measures (PROMs). Health Services Insights. 2013;6:61-68.
32. Elwyn G, Barr PJ, Grande SW, et al. Developing CollaboRATE: A fast and frugal patient-reported measure of shared decision making in clinical encounters. Patient Educ Couns. 2013;93:102-107.
33. Kurtzke JF. Rating neurologic impairment in multiple sclerosis: an expanded disability status scale (EDSS). Neurology. 1983;33:1444-1452.
34. Rudick RA, Miller D, Clough JD, et al. Quality of life in multiple sclerosis. Comparison with inflammatory bowel disease and rheumatoid arthritis. Arch Neurol. 1992;49:1237-1242.
35. Benito-Leon J, Morales JM, Rivera-Navarro J, Mitchell A. A review about the impact of multiple sclerosis on health-related quality of life. Disabil Rehabil. 2003;25:1291-1303.
36. RAND Corporation. 36-Item Short Form Survey (SF-36). [https://www.rand.org/health-care/surveys_tools/mos/36-item-short-form.html. Accessed October 20, 2019.
37. Bergner M, Bobbitt RA, Carter WB, Gilson BS. The sickness impact profile: development and final revision of a health status measure. Medical Care. 1981;19:787-805.
38. Horsman J, Furlong W, Feeny D, Torrance G. The Health Utilities Index (HUI): concepts, measurement properties and applications. Health Qual Life Outcomes. 2003;1:54.
39. Kinkel RP, Laforet G, You X. Disease-related determinants of quality of life 10 years after clinically isolated syndrome. Int J MS Care. 2015;17:26-34.
40. Baumstarck-Barrau K, Simeoni MC, Reuter F, et al. Cognitive function and quality of life in multiple sclerosis patients: a cross-sectional study. BMC Neurology. 2011;11:17.
41. Samartzis L, Gavala E, Zoukos Y, et al. Perceived cognitive decline in multiple sclerosis impacts quality of life independently of depression. Rehabil Res Pract. 2014;2014:128751.
42. Vitkova M, Rosenberger J, Krokavcova M, et al. Health-related quality of life in multiple sclerosis patients with bladder, bowel and sexual dysfunction. Disabil Rehabil. 2014;36:987-992.
43. Khurana V, Sharma H, Afroz N, et al. Patient-reported outcomes in multiple sclerosis: a systematic comparison of available measures. Eur J Neurol. 2017;24:1099-1107.
44. Hobart J, Lamping D, Fitzpatrick R, et al. The Multiple Sclerosis Impact Scale (MSIS-29): a new patient-based outcome measure. Brain. 2001;124(Pt 5):962-973.
45. Lily O, McFadden E, Hensor E, et al. Disease-specific quality of life in multiple sclerosis: the effect of disease modifying treatment. Multiple Sclerosis. 2006;12:808-813.
46. Ford HL, Gerry E, Tennant A, et al. Developing a disease-specific quality of life measure for people with multiple sclerosis. Clin Rehabil. 2001;15:247-258.
47. Cella DF, Dineen K, Arnason B, et al. Validation of the functional assessment of multiple sclerosis quality of life instrument. Neurology. 1996;47:129-139.
48. Gold SM, Heesen C, Schulz H, et al. Disease specific quality of life instruments in multiple sclerosis: validation of the Hamburg Quality of Life Questionnaire in Multiple Sclerosis (HAQUAMS). Multiple Sclerosis. 2001;7:119-130.
49. Vickrey BG, Hays RD, Harooni R, et al. A health-related quality of life measure for multiple sclerosis. Qual Life Res. 1995;4:187-206.
50. Simeoni M, Auquier P, Fernandez O, et al. Validation of the Multiple Sclerosis International Quality of Life questionnaire. Multiple Sclerosis. 2008;14:219-230.
51. Doward LC, McKenna SP, Meads DM, et al. The development of patient-reported outcome indices for multiple sclerosis (PRIMUS). Multiple Sclerosis. 2009;15:1092-1102.
52. Ozakbas S, Akdede BB, Kosehasanogullari G, et al. Difference between generic and multiple sclerosis-specific quality of life instruments regarding the assessment of treatment efficacy. J Neurol Sci. 2007;256:30-34.
53. Cella DF, Wiklund I, Shumaker SA, Aaronson NK. Integrating health-related quality of life into cross-national clinical trials. Qual Life Res. 1993;2:433-440.
54. Nowinski CJ, Miller DM, Cella D. Evolution of patient-reported outcomes and their role in multiple sclerosis clinical trials. Neurotherapeutics. 2017;14:934-944.
55. Cella D, Nowinski C, Peterman A, et al. The neurology quality-of-life measurement initiative. Arch Phys Med Rehabil. 2011;92(10 Suppl):S28-S36.
56. HealthMeasures: PROMIS. http://www.healthmeasures.net/explore-measurement-systems/promis. Accessed October 20, 2019.
57. Valderas JM, Ferrer M, Mendivil J, et al. Development of EMPRO: a tool for the standardized assessment of patient-reported outcome measures. Value Health. 2008;11:700-708.
58. Bach K, Martling C, Mork PJ, et al. Design of a clinician dashboard to facilitate co-decision making in the management of non-specific low back pain. J Intelligent Helath Syst. 2019;52:269-284.
59. Karami M, Safdari R, Rahimi A. Effective radiology dashboards: key research findings. Radiology Management. 2013;35:42-45.
60. Dowding D, Randell R, Gardner P, et al. Dashboards for improving patient care: review of the literature. Int J Med Informatic. 2015;84:87-100.
61. Mlaver E, Schnipper JL, Boxer RB, et al. User-centered collaborative design and development of an inpatient safety dashboard. Jt Comm J Qual Patient Saf. 2017;43:676-685.
62. Dowding D, Merrill J, Russell D. Using feedback intervention theory to guide clinical dashboard design. AMIA Annu Symp Proc. 2018;2018:395-403.
63. Hartzler AL, Izard JP, Dalkin BL, et al. Design and feasibility of integrating personalized PRO dashboards into prostate cancer care. J Am Med Inform Assoc. 2016;23:38-47.
64. Lavallee DC, Chenok KE, Love RM, et al. Incorporating patient-reported outcomes into health care to engage patients and enhance care. Health Affairs. 2016;35:575-582.
65. U.S. Centers for Medicare & Medicaid Services. Comprehensive Care for Joint Replacement Model. https://innovation.cms.gov/initiatives/CJR. Accessed August 3, 2019.
66. National Quality Forum. Patient-reported outcomes: Accessed August 3, 2019. http://www.qualityforum.org/Patient-Reported_Outcomes.aspx. Accessed October 20, 2019.
67. Institute of Medicine Roundtable on Evidence-Based Medicine. The National Academies Collection: Reports funded by National Institutes of Health. In: Olsen LA, Aisner D, McGinnis JM, eds. The Learning Healthcare System: Workshop Summary. Washington (DC): National Academies Press (US).National Academy of Sciences; 2007.
68. About Learning Health Systems: Agency for Healthcare Research and Quality. https://www.ahrq.gov/learning-health-systems/about.html. Accessed August 3, 2019.
69. Best Care at Lower Cost: The Path to Continuously Learning Health Care in America. Washington (DC): National Academies Press; 2013.
70. Committee on Quality of Health Care in America. Crossing the Quality Chasm: A New Health System for the 21st Century. Washington, DC: National Academies Press; 2001.
71. Oliver BJ, for the MS-CQI Investigators. The Multiple Sclerosis Continuous improvement collaborative: the first coproduction learning health system improvement science research collaborative for multiple sclerosis. The International Society for Quality in Health Care (ISQua) Annual International Conference; October 2019; Cape Town, South Africa.
72. Britto MT, Fuller SC, Kaplan HC, et al. Using a network organisational architecture to support the development of Learning Healthcare Systems. BMJ Qual Saf. 2018;27:937-946.
73. Care Centers: Cystic Fibrosis Foundation. https://www.cff.org/Care/Care-Centers/. Accessed August 3, 2019.
74. Schechter MS, Fink AK, Homa K, Goss CH. The Cystic Fibrosis Foundation patient registry as a tool for use in quality improvement. BMJ Qual Saf. 2014;23(Suppl 1):i9-i14.
75. Mogayzel PJ, Dunitz J, Marrow LC, Hazle LA. Improving chronic care delivery and outcomes: the impact of the cystic fibrosis Care Center Network. BMJ Qual Saf. 2014;23(Suppl 1):i3-i8.
76. Godfrey MM, Oliver BJ. Accelerating the rate of improvement in cystic fibrosis care: contributions and insights of the learning and leadership collaborative. BMJ Qual Saf. 2014;23(Suppl 1):i23-i32.
77. Nelson EC, Godfrey MM. Quality by Design: A Clinical Microsystems Approach. San Francisco, California: Jossey-Bass; 2007.
78. Crohn’s & Colitis Foundation.Quality of Care: IBD Qorus: https://www.crohnscolitisfoundation.org/research/ibd-qorus. Accessed October 23, 2019.
79. Johnson LC, Melmed GY, Nelson EC, et al. Fostering collaboration through creation of an ibd learning health system. Am J Gastroenterol. 2017;112:406-468.
80. Fernandez-Munoz JJ, Moron-Verdasco A, Cigaran-Mendez M, et al. Disability, quality of life, personality, cognitive and psychological variables associated with fatigue in patients with multiple sclerosis. Acta Neurologica Scandinavica. 2015;132:118-124.
81. Flachenecker P, Kumpfel T, Kallmann B, et al. Fatigue in multiple sclerosis: a comparison of different rating scales and correlation to clinical parameters. Multiple Sclerosis. 2002;8:523-526.
82. Tellez N, Rio J, Tintore M, et al. Does the Modified Fatigue Impact Scale offer a more comprehensive assessment of fatigue in MS? Multiple Sclerosis. 2005;11:198-202.
83. Salter A, Fox RJ, Tyry T, et al. The association of fatigue and social participation in multiple sclerosis as assessed using two different instruments. Mult Scler Relat Disord. 2019;31:165-72.
84. Solaro C, Trabucco E, Messmer Uccelli M. Pain and multiple sclerosis: pathophysiology and treatment. Curr Neurol Neurosci Rep. 2013;13:320.
85. Jawahar R, Oh U, Yang S, Lapane KL. A systematic review of pharmacological pain management in multiple sclerosis. Drugs. 2013;73:1711-1722.
86. Rintala A, Hakkinen A, Paltamaa J. Ten-year follow-up of health-related quality of life among ambulatory persons with multiple sclerosis at baseline. Qual Life Res. 2016;25:3119-3127.
87. Tepavcevic DK, Pekmezovic T, Stojsavljevic N, et al. Change in quality of life and predictors of change among patients with multiple sclerosis: a prospective cohort study. Qual Life Res. 2014;23:1027-1037.
88. DasGupta R, Fowler CJ. Bladder, bowel and sexual dysfunction in multiple sclerosis: management strategies. Drugs. 2003;63:153-166.
89. Marck CH, Jelinek PL, Weiland TJ, et al. Sexual function in multiple sclerosis and associations with demographic, disease and lifestyle characteristics: an international cross-sectional study. BMC Neurology. 2016;16:210.
90. Gajofatto A, Benedetti MD. Treatment strategies for multiple sclerosis: When to start, when to change, when to stop? World J Clinical Cases. 2015;3:545-555.
91. National Multiple Sclerosis Society. Disease-modifying therapies for MS. 2018.
92. Rudick RA, Panzara MA. Natalizumab for the treatment of relapsing multiple sclerosis. Biologics. 2008;2:189-199.
93. Cohen JA, Cutter GR, Fischer JS, et al. Benefit of interferon beta-1a on MSFC progression in secondary progressive MS. Neurology. 2002;59:679-687.
94. Patti F, Pappalardo A, Montanari E, et al. Interferon-beta-1a treatment has a positive effect on quality of life of relapsing-remitting multiple sclerosis: results from a longitudinal study. J Neurol Sci. 2014;337:180-185.
95. Novartis. Exploring the efficacy and safety of Siponimod in patients with secondary progressive multiple sclerosis (EXPAND). Available from clinicaltrials.gov/ct2/show/NCT01665144. NLM identifier: NCT01665144.
96. Singal AG, Higgins PD, Waljee AK. A primer on effectiveness and efficacy trials. Clin Transl Gastroenterol. 2014;5:e45.
97. Jongen PJ. Health-related quality of life in patients with multiple sclerosis: impact of disease-modifying drugs. CNS Drugs. 2017;31:585-602.
98. Coretti S, Ruggeri M, McNamee P. The minimum clinically important difference for EQ-5D index: a critical review. Expert Rev Pharmacoecon Outcomes Res. 2014;14:221-233.
99. Clinical Review Report: Ocrelizumab (Ocrevus). CADTH Common Drug Review. 2018:Appendix 4, Validity of Outcome Measures.
100. iCounquer MS; Empowering patients: how individuals with ms are contributing to the fight to find a cure: 2018. https://www.iconquerms.org/empowering-patients-how-individuals-ms-are-contributing-fight-find-cure. Accessed October 23, 2019.
101. K M. Accelerated Cure Project Announces Collaboration with EMD Serono to Advance Patient-Focused Drug Development in Multiple Sclerosis2018. https://www.iconquerms.org/accelerated-cure-project-announces-collaboration-emd-serono-advance-patient-focused-drug-development. Accessed October 24, 2019.
102. Bebo BF Jr, Fox RJ, Lee K, et al. Landscape of MS patient cohorts and registries: Recommendations for maximizing impact. Multiple Sclerosis. 2018;24:579-586.
103. Hedstrom AK, Hillert J, Olsson T, Alfredsson L. Alcohol as a modifiable lifestyle factor affecting multiple sclerosis risk. JAMA Neurology. 2014;71:300-305.
104. Hedstrom AK, Baarnhielm M, Olsson T, Alfredsson L. Tobacco smoking, but not Swedish snuff use, increases the risk of multiple sclerosis. Neurology. 2009;73:696-701.
105. Hedstrom AK, Akerstedt T, Hillert J, et al. Shift work at young age is associated with increased risk for multiple sclerosis. Ann Neurol. 2011;70:733-741.
106. Hadjimichael O, Vollmer T, Oleen-Burkey M. Fatigue characteristics in multiple sclerosis: the North American Research Committee on Multiple Sclerosis (NARCOMS) survey. Health Qual Life Outcomes. 2008;6:100.
107. Fox RJ, Salter AR, Tyry T, et al. Treatment discontinuation and disease progression with injectable disease-modifying therapies: findings from the North American research committee on multiple sclerosis database. Int J MS Care. 2013;15:194-201.
108. Reeve BB, Wyrwich KW, Wu AW, et al. ISOQOL recommends minimum standards for patient-reported outcome measures used in patient-centered outcomes and comparative effectiveness research. Qual Life Res. 2013;22:1889-1905.
109. Jacobs LD, Wende KE, Brownscheidle CM, et al. A profile of multiple sclerosis: the New York State Multiple Sclerosis Consortium. Multiple Sclerosis. 1999;5:369-376.
110. Weinstock-Guttman B, Jacobs LD, Brownscheidle CM, et al. Multiple sclerosis characteristics in African American patients in the New York State Multiple Sclerosis Consortium. Multiple Sclerosis. 2003;9:293-298.
111. Raffel J, Wallace A, Gveric D, et al. Patient-reported outcomes and survival in multiple sclerosis: A 10-year retrospective cohort study using the Multiple Sclerosis Impact Scale-29. PLoS Med. 2017;14:e1002346.
112. Vaughn CB, Kavak KS, Dwyer MG, et al. Fatigue at enrollment predicts EDSS worsening in the New York State Multiple Sclerosis Consortium. Multiple Sclerosis. 2018:1352458518816619.
113. Alroughani RA, Akhtar S, Ahmed SF, Al-Hashel JY. Clinical predictors of disease progression in multiple sclerosis patients with relapsing onset in a nation-wide cohort. Int J Neuroscience. 2015;125:831-837.
114. Dolan JG, Veazie PJ, Russ AJ. Development and initial evaluation of a treatment decision dashboard. BMC Med Inform Decision Mak. 2013;13:51.
115. Stuifbergen AK, Becker H, Blozis S, et al. A randomized clinical trial of a wellness intervention for women with multiple sclerosis. Arch Phys Med Rehabil. 2003;84:467-476.
116. Finkelstein J, Martin C, Bhushan A, et al. Feasibility of computer-assisted education in patients with multiple sclerosis. In: Proceedings of the IEEE Symposium on Computer-Based Medical Systems. Bethesda, MD; 2004.
117. Batalden P. Getting more health from healthcare: quality improvement must acknowledge patient coproduction—an essay by Paul Batalden. BMJ. 2018;362:k3617.
118. Batalden PB, Davidoff F. What is “quality improvement” and how can it transform healthcare? Qual Saf Health Care. 2007;16:2-3.
119. Ovretveit J, Zubkoff L, Nelson EC, et al. Using patient-reported outcome measurement to improve patient care. Int J Qual Health Care. 2017;29:874-879.
120. Prodinger B, Taylor P. Improving quality of care through patient-reported outcome measures (PROMs): expert interviews using the NHS PROMs Programme and the Swedish quality registers for knee and hip arthroplasty as examples. BMC Health Services Res. 2018;18:87.
121. Prinsen CA, Vohra S, Rose MR, et al. How to select outcome measurement instruments for outcomes included in a “Core Outcome Set” – a practical guideline. Trials. 2016;17:449.
122. NINDS. NINDS Common Data Elements: Streamline Your Neuroscience Clinical Research National Institute of Health. https://www.commondataelements.ninds.nih.gov/#page=Default. Accessed October 23, 2019.
123. Francis DO, McPheeters ML, Noud M, et al. Checklist to operationalize measurement characteristics of patient-reported outcome measures. Systematic Rev. 2016;5:129.
124. National Quality Forum. Patient-reported outcomes (PROs) in performance measurement. 2013. https://www.qualityforum.org/Publications/2012/12/Patient-Reported_Outcomes_in_Performance_Measurement.aspx. Accessed October 15, 2019.
125. Dawson J, Doll H, Fitzpatrick R, et al. The routine use of patient reported outcome measures in healthcare settings. BMJ. 2010;340:c186.
126. Aaronson N ET, Greenlhalgh J, Halyard M, et al. User’s guide to implementation of patient reported outcomes assessment in clinical practice. International Society for Quality of Life. 2015.
127. Chan EKH, Edwards TC, Haywood K, et al. Implementing patient-reported outcomes mesaures in clinical practice: a companion guide to the ISOQOL user’s guide. Qual Life Res. 2018;28:621-627.
128. Snyder CF, Wu AW, Miller RS, et al. The role of informatics in promoting patient-centered care. Cancer J. 2011;17:211-218
129. Osborn R, Moulds D, Schneider EC, et al. Primary care physicians in ten countries report challenges caring for patients with complex health needs. Health Affairs. 2015;34:2104-2112.
130. Wu AW, Kharrazi H, Boulware LE, Snyder CF. Measure once, cut 0wice--adding patient-reported outcome measures to the electronic health record for comparative effectiveness research. J Clin Epidemiol. 2013;66(8 Suppl):S12-S20.
131. Trojano M, Bergamaschi R, Amato MP, et al. The Italian multiple sclerosis register. Neurol Sci. 2019;40:155-165.
132. Moorhead SA, Hazlett DE, Harrison L, et al. A new dimension of health care: systematic review of the uses, benefits, and limitations of social media for health communication. J Med Internet Res. 2013;15:e85.
133. Luigi L, Francesco B, Marcello M, et al. e-Health and multiple sclerosis: An update. Multiple Sclerosis J. 2018;24:1657-1664.
134. Marrie RA, Leung S, Tyry T, et al. Use of eHealth and mHealth technology by persons with multiple sclerosis. Mult Scler Relat Dis. 2019;27:13-19.
135. Giunti G, Kool J, Rivera Romero O, Dorronzoro Zubiete E. Exploring the specific needs of persons with multiple sclerosis for mhealth solutions for physical activity: mixed-methods study. JMIR Mhealth Uhealth. 2018;6:e37.
136. Spooner KK, Salemi JL, Salihu HM, Zoorob RJ. eHealth patient-provider communication in the United States: interest, inequalities, and predictors. J Am Med Inform Assoc. 2017;24(e1):e18-e27.
137. Safdar N, Abbo LM, Knobloch MJ, Seo SK. Research methods in healthcare epidemiology: survey and qualitative research. Infect Control Hosp Epidemiol. 2016;37:1272-1277.
138. Rolstad S, Adler J, Rydén A. Response burden and questionnaire length: is shorter better? A review and meta-analysis. Value Health. 2011;14:1101-1108.
139. Chiu C, Bishop M, Pionke JJ, et al. Barriers to the accessibility and continuity of health-care services in people with multiple sclerosis: a literature review. Int J MS Care. 2017;19:313-321.
140. Atreja A, Mehta N, Miller D, et al. One size does not fit all: using qualitative methods to inform the development of an Internet portal for multiple sclerosis patients. AMIA Annu Symp Proc Symp. 2005:16-20.
141. Snyder CF, Blackford AL, Brahmer JR, et al. Needs assessments can identify scores on HRQOL questionnaires that represent problems for patients: an illustration with the Supportive Care Needs Survey and the QLQ-C30. Qual Life Res. 2010;19:837-845.
142. de Vet HC, Terwee CB. The minimal detectable change should not replace the minimal important difference. J Clin Epidemiol. 2010;63:804-805.
143. Snyder CF, Aaronson NK, Choucair AK, et al. Implementing patient-reported outcomes assessment in clinical practice: a review of the options and considerations. Qual Life. 2012;21:1305-1314.
144. Myla DG, Melanie DW, Robert WM, et al. Identification and validation of clinically meaningful benchmarks in the 12-item Multiple Sclerosis Walking Scale. Multiple Sclerosis J. 2017;23:1405-1414.
145. van Munster CEP, Uitdehaag BMJ. Outcome measures in clinical trials for multiple sclerosis. CNS Drugs. 2017;31:217-236.
146. Snyder CF, Jensen R, Courtin SO, Wu AW. PatientViewpoint: a website for patient-reported outcomes assessment. Quality Life Res. 2009;18:793-800.
147. Snyder CF, Smith KC, Bantug ET, et al. What do these scores mean? Presenting patient-reported outcomes data to patients and clinicians to improve interpretability. Cancer. 2017;123:1848-1859.
148. Squitieri L, Bozic KJ, Pusic AL. The role of patient-reported outcome measures in value-based payment reform. Value Health. 2017;20:834-836.
149. Boyce MB, Browne JP. The effectiveness of providing peer benchmarked feedback to hip replacement surgeons based on patient-reported outcome measures—results from the PROFILE trial: a cluster randomised controlled study. BMJ Open. 2015;5:e008325.
Decreasing Overutilization of Echocardiograms and Abdominal Imaging in the Evaluation of Children with Fungemia
From the University of Miami, Department of Pediatrics and Department of Medicine, Miami, FL.
Abstract
- Objective: Pediatric fungemia is associated with a low risk of fungal endocarditis and renal infections. The majority of current guidelines do not recommend routine abdominal imaging/echocardiograms in the evaluation of fungemia, but such imaging has been routinely ordered for patients on the pediatric gastroenterology service at our institution. Our goals were to assess the financial impact of this deviation from current clinical guidelines and redefine the standard work to reduce overutilization of abdominal ultrasounds and echocardiograms. Specifically, our goal was to reduce imaging by 50% by 18 months.
- Methods: Root cause analysis showed a lack of familiarity with current evidence. Using this data, countermeasures were implemented, including practitioner education of guidelines and creation of a readily accessible clinical pathway and an electronic order set for pediatric fungemia management. Balancing measures were missed episodes of fungal endocarditis and renal infection.
- Results: During the period January 1, 2016 to November 19, 2017, 18 of 21 episodes of fungemia in our pediatric institution occurred in patients admitted to the pediatric gastroenterology service. Abdominal imaging and echocardiograms were done 100% of the time, with no positive findings and an estimated cost of approximately $58,000. Post-intervention from November 20, 2017 to April 3, 2019, 7 of 13 episodes of fungemia occurred on this service. Frequency of abdominal imaging and echocardiograms decreased to 43% and 57%, respectively. No episodes of fungal endocarditis or renal infection were identified.
- Conclusion: Overutilization of abdominal imaging and echocardiograms in pediatric fungemia evaluation can be safely decreased.
Keywords: guidelines; cost; candidemia; endocarditis.
Practitioners may remain under the impression that routine abdominal ultrasounds (US) and echocardiograms (echo) are indicated in fungemia to evaluate for fungal endocarditis and renal infection, although these conditions are rare and limited to a subset of the population.1-10 Risk factors include prematurity, immunosuppression, prior bacterial endocarditis, abnormal cardiac valves, and previous urogenital surgeries.11
The 2016 Infectious Diseases Society of America (IDSA) guidelines do not recommend routine US or echo but rather provide scenarios in which Candida endocarditis should be suspected, and these include: persistently positive blood cultures, persistent fevers despite appropriate therapy, and clinical signs that may suggest endocarditis, such as a new heart murmur, heart failure, or embolic phenomena.11 IDSA recommends abdominal imaging in neonates with persistently positive blood cultures to evaluate the urogenital system, in addition to the liver and spleen. They also recommend abdominal imaging in symptomatic ascending Candida pyelonephritis beyond the neonatal period and in chronic disseminated candidiasis; the latter is uncommon and seen almost exclusively in patients recovering from neutropenia with a hematologic malignancy.11
We also reviewed guidelines on fungemia originating outside the United States. The 2010 Canadian clinical guidelines on invasive candidiasis do not explicitly recommend routine imaging, but rather state that various imaging studies, including US and echo among others, may be helpful.12 The German Speaking Mycological Society and the Paul-Ehrlich-Society for Chemotherapy published a joint recommendation against routine US and echo in uncomplicated candidemia in 2011.13
The European Society for Clinical Microbiology and Infectious Diseases is the only society that recommends routine echo. Their 2012 guidelines on candidiasis recommend transesophageal echo in adults14 and echocardiography in children,15 as well as abdominal imaging in the diagnosis of chronic disseminated candidiasis in adults with hematological malignancies/hematopoietic stem cell transplantation.16
The 2013 Brazilian guidelines explicitly recommend against routine abdominal imaging and echo because of the low frequency of visceral lesions in adults with candidemia and recommend reserving imaging for those with persistently positive blood cultures or with clinical signs/symptoms suggestive of endocarditis/abdominal infection or clinical deterioration.17 The 2014 Japanese guidelines recommend ruling out chronic disseminated candidiasis in these patients with symptoms during the neutrophil recovery phase, but do not mention routinely imaging other patients. They do not address the role of echocardiography.18
Although physicians in the United Sates typically follow IDSA guidelines, abdominal US and echo were ordered routinely for patients with fungemia on the pediatric gastroenterology service at our institution, leading to higher medical costs and waste of medical resources. Our goals were to assess the current standard work for fungemia evaluation on this service, assess the impact of its deviation from current clinical guidelines, and redefine the standard work by (1) presenting current evidence to practitioners taking care of patients on this service, (2) providing a clinical pathway that allowed for variations where appropriate, and (3) providing a plan for pediatric fungemia management. Our SMART (Specific, Measurable, Attainable, Relevant and Timely) goal was to reduce overutilization of abdominal US and echo in pediatric patients with fungemia on the pediatric gastroenterology service by 50%.
Methods
Study, Setting, and Participants
We executed this quality improvement project at a quaternary care pediatric hospital affiliated with a school of medicine. The project scope consisted of inpatient pediatric patients with fungemia on the pediatric gastroenterology service admitted to the wards or pediatric critical care unit at this institution, along with the practitioners caring for these patients. The project was part of an institutional quality improvement initiative program. The quality improvement team included quality improvement experts from the departments of medicine and pediatrics, a pediatric resident and student, and physicians from the divisions of pediatric infectious disease, pediatric critical care, and pediatric gastroenterology. This study qualified for Institutional Review Board (IRB) exemption based on the University’s IRB stipulations.
Current Condition
Root cause analysis was performed by creating a process map of the current standard work and a fishbone diagram (Figure 1). We incorporated feedback from voice of the customer in the root cause analysis. In this analysis, the voice of the customer came from the bedside floor nurses, ultrasound clerk and sonographer, echo technician, cardiology fellow, and microbiology medical technician. We got their feedback on our process map, its accuracy and ways to expand, their thoughts on the problem and why we have this problem, and any solutions they could offer to help improve the problem. Some of the key points obtained were: echos were not routinely done on the floors and were not considered urgent as they often did not change management; the sonographer and those from the cardiology department felt imaging was often overutilized because of misconceptions and lack of available hospital guidelines. Suggested solutions included provider education with reference to Duke’s criteria and establishing a clinical pathway approved by all concerned departments.

Prior to education, we surveyed current practices of practitioners on teams caring for these patients, which included physicians of all levels (attendings, fellows, residents) as well as nurse practitioners and medical students from the department of pediatrics and divisions of pediatric gastroenterology, pediatric infectious disease, and pediatric critical care medicine.
Countermeasures
Practitioner Education. In October 2017 practitioners were given a 20-minute presentation on the latest international guidelines on fungemia. Fifty-nine practitioners completed pre- and post-test surveys. Eight respondents were excluded due to incomplete surveys. We compared self-reported frequencies of ordering abdominal imaging and echo before the presentation with intention to order post education. Intention to change clinical practice after the presentation was also surveyed.
Clinical Pathway. Education alone may not result in sustainability, and thus we provided a readily accessible clinical pathway and an electronic order set for pediatric fungemia management. Inter-department buy-in was also necessary for success. It was important to get the input from the various teams (infectious disease, cardiology, gastroenterology, and critical care), which was done by incorporating members from those divisions in the project or getting their feedback through voice of the customer analysis.
We redefined standard work based on current evidence and created a clinical pathway during March 2018 that included variations when appropriate (Figure 2). We presented the clinical pathway to practitioners and distributed it via email. We also made it available to pediatric residents and fellows on their mobile institutional work resource application.

Electronic Order Set. We created an electronic order set for pediatric fungemia management and made it available in the electronic health record May 2018.
Measurement
Cases of fungemia were identified through the electronic health record pre-intervention (January 1, 2016 through November 19, 2017) and post-intervention (November 20, 2019 through April 3, 2019). An episode of fungemia was defined as an encounter with 1 or more positive blood culture(s) for Candida species or Cryptococcus species. We manually identified patients belonging to the pediatric gastroenterology service and reviewed these charts to determine the presenting complaint, organism isolated, transplant status, central lines status, risk factors, if abdominal imaging or echocardiography were done for the episode of fungemia, and their corresponding results. We calculated overall and per patient medical charges by using the average charges at our institution of US and echocardiography with a cardiology consult. These average charges were provided by patient financial services and the pediatric cardiology department, respectively. To address non-technical expenditures, we calculated the average time taken for transport to and from radiology and the echo suite for each identified patient. We identified missed fungal endocarditis and fungal balls as balancing measures.
Results
Survey
Among the 51 practitioners surveyed, 36% were performing routine echo and 22% self-reported performing routine abdominal imaging. After education, no respondents planned to routinely do echo or abdominal imaging. All but 1 respondent planned to change their practice for evaluation of fungemia patients based on the presentation (eFigure 1).

Baseline Data
Over the 23-month period from January 1, 2016 to November 19, 2017, there were 21 episodes of fungemia, 18 of which occurred in patients on the pediatric gastroenterology service (2 of the 18 were transplant recipients). For the 18 episodes on this service, abdominal imaging and echo were done 100% of the time, with 0 positive findings (eFigure 2).

Of those 18 episodes, the average age was 4.6 years, with two-thirds of the population being male. There were 3 patients with multiple episodes that accounted for 8 of the episodes (3, 3, and 2 episodes each). Fever was the most common presenting complaint. The most common organism was Candida parapsilosis (6 of the 18 episodes). All episodes but one involved a central line, and all central lines were removed when present except for one case. Of the risk factors, 3 episodes occurred in neutropenic patients, and for 1 episode the patient had a questionable history of fungal endocarditis (and was on fungal prophylaxis). There were no patients with recent cardiac/urogenital surgery or prior fungal balls. No episodes had clinical symptoms suggestive of fungal endocarditis or fungal balls.
Post-Intervention Data
Over the subsequent 17-month period (November 11, 2017 to April 3, 2019), there were 13 episodes of candidemia. There were no episodes of Cryptococcus fungemia. Seven episodes occurred in patients on the pediatric gastroenterology service (2 of the 7 occurred in transplant recipients). Abdominal imaging was done in 3 of these episodes (43%), and in 2 of these 3 episodes, imaging was done at an outside institution prior to arrival, with no positive results (eFigure 2).
Echocardiography was done 57% of the time (n = 4), with echo being done at an outside institution prior to arrival half of the time (n = 2), with no endocarditis identified. The cases of abdominal imaging and echo done at outside institutions prior to arrival were not impacted by the countermeasures. Excluding those 2 patients who had both abdominal imaging and echocardiography done prior to arrival, the overall rate of imaging (both abdominal imaging and echo) done after countermeasures were instituted was 30% (Figure 3).
 was done.")
Of those 7 episodes, the average age was 6.8 years (57% female). There were no patients with multiple episodes. The most common presenting complaint was fever. The most common organism was Candida albicans (3 of the 7 episodes). All episodes involved a central line, which was removed in all cases except for one. Of the risk factors, 2 episodes were in neutropenic patients, and 1 episode had a history of bacterial endocarditis (not related to fungemia). No episodes occurred in patients with prior fungal renal infection, urogenital malformations, or recent cardiac/urogenital surgery. No episodes had clinical symptoms suggestive of fungal endocarditis or renal infection. No episodes of fungal endocarditis or renal infection were identified.
On average, a patient at our institution undergoing abdominal US and echo with a cardiology consult results in medical waste of approximately $3200 per patient. This cost does not take into account other miscellaneous charges possibly incurred, such as the radiologist interpreting the findings and transportation. Baseline data calculations show that patients waste on average 55 minutes in physical transport, and this does not take into account wait times.
Discussion
Candidemia contributes to 10% of central-line associated blood stream infections (CLABSI).19 Increased usage of indwelling central catheters for administration of parenteral nutrition will inevitably result in practitioners encountering cases of candidemia when caring for this population. As seen from our results, the majority of episodes of candidemia at our institution occurred on the pediatric gastroenterology service, and thus redefining standard work on this service will be impactful.
Candida parapsilosis and Candida albicans were the most common causative agents before and after intervention, respectively, but overall the most common organism was Candida albicans, which is in keeping with that of CLABSI in the literature.19 Growth of Candida parapsilosis has been particularly linked to CLABSI.19 The third most common organism in our study was Candida glabrata, which is the second most common cause of candidemia in CLABSI.19
The cases of positive abdominal imaging in fungemia in the literature are limited to the neonatal population1-4 and chronic disseminated candidiasis in patients with hematologic malignancies/neutropenia/immunosuppression.5,6 In fungal endocarditis, the reported cases were generally in neonates,1,3,7 critically ill patients,8 patients with hematologic malignancies/neutropenia/immunosuppression,6,9 or those with a cardiac history.9,10 This population differs from the patient population on the pediatric gastroenterology service. Patients on this service may not need US or echo. Performing abdominal US and echo in fungemia patients in whom such imaging is not indicated may result in medical waste of approximately $3200 per patient. There is also a waste of medical resources and time.
We found almost all practitioners are willing to change clinical practice once provided with current guidelines. Face-to-face oral presentations allowed for questions and interaction, making this form of information dissemination better than e-mails or handouts.
Though the numbers were small over the short study period, we were able to decrease overutilization of abdominal imaging and echo after implementing countermeasures. Frequency decreased from 100% to 43% and 57% for abdominal imaging and echo, respectively. Imaging that was done after the countermeasures were implemented was mainly attributed to imaging patients underwent prior to presenting to our institution. This reinforces the need for education at other institutions as well. Of the balancing measures assessed, there were no missed cases of fungal balls or fungal endocarditis. Additionally,
The findings from this quality improvement project underscore current recommendations that, despite common misconceptions, routine abdominal US and echo are not indicated in all cases of fungemia. Case-by-case assessment based on the clinical scenario remains key to management of fungemia to avoid unnecessary medical interventions.
Corresponding author: Donna Cheung, MBBS, 200 Hawkins Drive, BT 1120-G, Iowa City, IA 52242; donna.ann.cheung@gmail.com.
Financial support: None.
1. Benjamin DK Jr, Poole C, Steinbach WJ, et al. Neonatal candidemia and end-organ damage: a critical appraisal of the literature using meta-analytic techniques. Pediatrics. 2003;112:634-640.
2. Wynn JL, Tan S, Gantz MG, et al. Outcomes following candiduria in extremely low birth weight infants. Clin Infect Dis. 2012;54:331-339.
3. Noyola DE, Fernandez M, Moylett EH, et al. Ophthalmologic, visceral, and cardiac involvement in neonates with candidemia. Clin Infect Dis. 2001;32:1018-1023.
4. Phillips JR, Karlowicz MG Prevalence of Candida species in hospital-acquired urinary tract infections in a neonatal intensive care unit. Pediatr Infect Dis J. 1997;16:190-194.
5. Pagano L, Mele L, Fianchi L, et al. Chronic disseminated candidiasis in patients with hematologic malignancies. Clinical features and outcome of 29 episodes. Haematologica. 2002;87:535-541.
6. Zaoutis TE, Greves HM, Lautenbach E, et al. Risk factors for disseminated candidiasis in children with candidemia. Pediatr Infect Dis J. 2004;23:635-641.
7. Levy I, Shalit I, Birk E, et al. Candida endocarditis in neonates: report of five cases and review of the literature. Mycoses. 2006;49:43-48.
8. Aspesberro F, Beghetti M, Oberhansli I, et al. Fungal endocarditis in critically ill children. Eur J Pediatr. 1999;158:275-280.
9. Fernandez-Cruz A, Cruz Menarguez M, Munoz P, et al. The search for endocarditis in patients with candidemia: a systematic recommendation for echocardiography? A prospective cohort. Eur J Clin Microbiol Infect Dis. 2015;34:1543-1549.
10. Hernandez-Torres A, Garcia-Vazquez E, Laso-Ortiz A, et al. [Candida sp endocarditis. Experience in a third-level hospital and review of the literature]. Rev Esp Quimioter. 2013;26:51-55.
11. Pappas PG, Kauffman CA, Andes DR, et al. Clinical practice guideline for the management of candidiasis: 2016 Update by the Infectious Diseases Society of America. Clin Infect Dis. 2016;62:e1-50.
12. Bow EJ, Evans G, Fuller J, et al. Canadian clinical practice guidelines for invasive candidiasis in adults. Can J Infect Dis Med Microbiol. 2010;21:e122-50.
13. Ruhnke M, Rickerts V, Cornely OA, et al. Diagnosis and therapy of Candida infections: joint recommendations of the German Speaking Mycological Society and the Paul-Ehrlich-Society for Chemotherapy. Mycoses. 2011;54:279-310.
14. Cornely OA, Bassetti M, Calandra T, et al. ESCMID* guideline for the diagnosis and management of Candida diseases 2012: non-neutropenic adult patients. Clin Microbiol Infect. 2012;18 Suppl 7:19-37.
15. Hope WW, Castagnola E, Groll AH, et al. ESCMID* guideline for the diagnosis and management of Candida diseases 2012: prevention and management of invasive infections in neonates and children caused by Candida spp. Clin Microbiol Infect. 2012;18 Suppl 7:38-52.
16. Ullmann AJ, Akova M, Herbrecht R, et al. ESCMID* guideline for the diagnosis and management of Candida diseases 2012: adults with haematological malignancies and after haematopoietic stem cell transplantation (HCT). Clin Microbiol Infect. 2012;18 Suppl 7:53-67.
17. Colombo AL, Guimaraes T, Camargo LF, et al. Brazilian guidelines for the management of candidiasis - a joint meeting report of three medical societies: Sociedade Brasileira de Infectologia, Sociedade Paulista de Infectologia and Sociedade Brasileira de Medicina Tropical. Braz J Infect Dis. 2013;17:283-312.
18. Kohno S, Tamura K, Niki Y, et al. Executive Summary of Japanese Domestic guidelines for management of deep-seated mycosis 2014. Med Mycol J. 2016;57:E117-E163.
19. Kojic EM, Darouiche RO. Candida infections of medical devices. Clin Microbiology Rev. 2004;17:255-267.
From the University of Miami, Department of Pediatrics and Department of Medicine, Miami, FL.
Abstract
- Objective: Pediatric fungemia is associated with a low risk of fungal endocarditis and renal infections. The majority of current guidelines do not recommend routine abdominal imaging/echocardiograms in the evaluation of fungemia, but such imaging has been routinely ordered for patients on the pediatric gastroenterology service at our institution. Our goals were to assess the financial impact of this deviation from current clinical guidelines and redefine the standard work to reduce overutilization of abdominal ultrasounds and echocardiograms. Specifically, our goal was to reduce imaging by 50% by 18 months.
- Methods: Root cause analysis showed a lack of familiarity with current evidence. Using this data, countermeasures were implemented, including practitioner education of guidelines and creation of a readily accessible clinical pathway and an electronic order set for pediatric fungemia management. Balancing measures were missed episodes of fungal endocarditis and renal infection.
- Results: During the period January 1, 2016 to November 19, 2017, 18 of 21 episodes of fungemia in our pediatric institution occurred in patients admitted to the pediatric gastroenterology service. Abdominal imaging and echocardiograms were done 100% of the time, with no positive findings and an estimated cost of approximately $58,000. Post-intervention from November 20, 2017 to April 3, 2019, 7 of 13 episodes of fungemia occurred on this service. Frequency of abdominal imaging and echocardiograms decreased to 43% and 57%, respectively. No episodes of fungal endocarditis or renal infection were identified.
- Conclusion: Overutilization of abdominal imaging and echocardiograms in pediatric fungemia evaluation can be safely decreased.
Keywords: guidelines; cost; candidemia; endocarditis.
Practitioners may remain under the impression that routine abdominal ultrasounds (US) and echocardiograms (echo) are indicated in fungemia to evaluate for fungal endocarditis and renal infection, although these conditions are rare and limited to a subset of the population.1-10 Risk factors include prematurity, immunosuppression, prior bacterial endocarditis, abnormal cardiac valves, and previous urogenital surgeries.11
The 2016 Infectious Diseases Society of America (IDSA) guidelines do not recommend routine US or echo but rather provide scenarios in which Candida endocarditis should be suspected, and these include: persistently positive blood cultures, persistent fevers despite appropriate therapy, and clinical signs that may suggest endocarditis, such as a new heart murmur, heart failure, or embolic phenomena.11 IDSA recommends abdominal imaging in neonates with persistently positive blood cultures to evaluate the urogenital system, in addition to the liver and spleen. They also recommend abdominal imaging in symptomatic ascending Candida pyelonephritis beyond the neonatal period and in chronic disseminated candidiasis; the latter is uncommon and seen almost exclusively in patients recovering from neutropenia with a hematologic malignancy.11
We also reviewed guidelines on fungemia originating outside the United States. The 2010 Canadian clinical guidelines on invasive candidiasis do not explicitly recommend routine imaging, but rather state that various imaging studies, including US and echo among others, may be helpful.12 The German Speaking Mycological Society and the Paul-Ehrlich-Society for Chemotherapy published a joint recommendation against routine US and echo in uncomplicated candidemia in 2011.13
The European Society for Clinical Microbiology and Infectious Diseases is the only society that recommends routine echo. Their 2012 guidelines on candidiasis recommend transesophageal echo in adults14 and echocardiography in children,15 as well as abdominal imaging in the diagnosis of chronic disseminated candidiasis in adults with hematological malignancies/hematopoietic stem cell transplantation.16
The 2013 Brazilian guidelines explicitly recommend against routine abdominal imaging and echo because of the low frequency of visceral lesions in adults with candidemia and recommend reserving imaging for those with persistently positive blood cultures or with clinical signs/symptoms suggestive of endocarditis/abdominal infection or clinical deterioration.17 The 2014 Japanese guidelines recommend ruling out chronic disseminated candidiasis in these patients with symptoms during the neutrophil recovery phase, but do not mention routinely imaging other patients. They do not address the role of echocardiography.18
Although physicians in the United Sates typically follow IDSA guidelines, abdominal US and echo were ordered routinely for patients with fungemia on the pediatric gastroenterology service at our institution, leading to higher medical costs and waste of medical resources. Our goals were to assess the current standard work for fungemia evaluation on this service, assess the impact of its deviation from current clinical guidelines, and redefine the standard work by (1) presenting current evidence to practitioners taking care of patients on this service, (2) providing a clinical pathway that allowed for variations where appropriate, and (3) providing a plan for pediatric fungemia management. Our SMART (Specific, Measurable, Attainable, Relevant and Timely) goal was to reduce overutilization of abdominal US and echo in pediatric patients with fungemia on the pediatric gastroenterology service by 50%.
Methods
Study, Setting, and Participants
We executed this quality improvement project at a quaternary care pediatric hospital affiliated with a school of medicine. The project scope consisted of inpatient pediatric patients with fungemia on the pediatric gastroenterology service admitted to the wards or pediatric critical care unit at this institution, along with the practitioners caring for these patients. The project was part of an institutional quality improvement initiative program. The quality improvement team included quality improvement experts from the departments of medicine and pediatrics, a pediatric resident and student, and physicians from the divisions of pediatric infectious disease, pediatric critical care, and pediatric gastroenterology. This study qualified for Institutional Review Board (IRB) exemption based on the University’s IRB stipulations.
Current Condition
Root cause analysis was performed by creating a process map of the current standard work and a fishbone diagram (Figure 1). We incorporated feedback from voice of the customer in the root cause analysis. In this analysis, the voice of the customer came from the bedside floor nurses, ultrasound clerk and sonographer, echo technician, cardiology fellow, and microbiology medical technician. We got their feedback on our process map, its accuracy and ways to expand, their thoughts on the problem and why we have this problem, and any solutions they could offer to help improve the problem. Some of the key points obtained were: echos were not routinely done on the floors and were not considered urgent as they often did not change management; the sonographer and those from the cardiology department felt imaging was often overutilized because of misconceptions and lack of available hospital guidelines. Suggested solutions included provider education with reference to Duke’s criteria and establishing a clinical pathway approved by all concerned departments.
Prior to education, we surveyed current practices of practitioners on teams caring for these patients, which included physicians of all levels (attendings, fellows, residents) as well as nurse practitioners and medical students from the department of pediatrics and divisions of pediatric gastroenterology, pediatric infectious disease, and pediatric critical care medicine.
Countermeasures
Practitioner Education. In October 2017 practitioners were given a 20-minute presentation on the latest international guidelines on fungemia. Fifty-nine practitioners completed pre- and post-test surveys. Eight respondents were excluded due to incomplete surveys. We compared self-reported frequencies of ordering abdominal imaging and echo before the presentation with intention to order post education. Intention to change clinical practice after the presentation was also surveyed.
Clinical Pathway. Education alone may not result in sustainability, and thus we provided a readily accessible clinical pathway and an electronic order set for pediatric fungemia management. Inter-department buy-in was also necessary for success. It was important to get the input from the various teams (infectious disease, cardiology, gastroenterology, and critical care), which was done by incorporating members from those divisions in the project or getting their feedback through voice of the customer analysis.
We redefined standard work based on current evidence and created a clinical pathway during March 2018 that included variations when appropriate (Figure 2). We presented the clinical pathway to practitioners and distributed it via email. We also made it available to pediatric residents and fellows on their mobile institutional work resource application.
Electronic Order Set. We created an electronic order set for pediatric fungemia management and made it available in the electronic health record May 2018.
Measurement
Cases of fungemia were identified through the electronic health record pre-intervention (January 1, 2016 through November 19, 2017) and post-intervention (November 20, 2019 through April 3, 2019). An episode of fungemia was defined as an encounter with 1 or more positive blood culture(s) for Candida species or Cryptococcus species. We manually identified patients belonging to the pediatric gastroenterology service and reviewed these charts to determine the presenting complaint, organism isolated, transplant status, central lines status, risk factors, if abdominal imaging or echocardiography were done for the episode of fungemia, and their corresponding results. We calculated overall and per patient medical charges by using the average charges at our institution of US and echocardiography with a cardiology consult. These average charges were provided by patient financial services and the pediatric cardiology department, respectively. To address non-technical expenditures, we calculated the average time taken for transport to and from radiology and the echo suite for each identified patient. We identified missed fungal endocarditis and fungal balls as balancing measures.
Results
Survey
Among the 51 practitioners surveyed, 36% were performing routine echo and 22% self-reported performing routine abdominal imaging. After education, no respondents planned to routinely do echo or abdominal imaging. All but 1 respondent planned to change their practice for evaluation of fungemia patients based on the presentation (eFigure 1).
Baseline Data
Over the 23-month period from January 1, 2016 to November 19, 2017, there were 21 episodes of fungemia, 18 of which occurred in patients on the pediatric gastroenterology service (2 of the 18 were transplant recipients). For the 18 episodes on this service, abdominal imaging and echo were done 100% of the time, with 0 positive findings (eFigure 2).
Of those 18 episodes, the average age was 4.6 years, with two-thirds of the population being male. There were 3 patients with multiple episodes that accounted for 8 of the episodes (3, 3, and 2 episodes each). Fever was the most common presenting complaint. The most common organism was Candida parapsilosis (6 of the 18 episodes). All episodes but one involved a central line, and all central lines were removed when present except for one case. Of the risk factors, 3 episodes occurred in neutropenic patients, and for 1 episode the patient had a questionable history of fungal endocarditis (and was on fungal prophylaxis). There were no patients with recent cardiac/urogenital surgery or prior fungal balls. No episodes had clinical symptoms suggestive of fungal endocarditis or fungal balls.
Post-Intervention Data
Over the subsequent 17-month period (November 11, 2017 to April 3, 2019), there were 13 episodes of candidemia. There were no episodes of Cryptococcus fungemia. Seven episodes occurred in patients on the pediatric gastroenterology service (2 of the 7 occurred in transplant recipients). Abdominal imaging was done in 3 of these episodes (43%), and in 2 of these 3 episodes, imaging was done at an outside institution prior to arrival, with no positive results (eFigure 2).
Echocardiography was done 57% of the time (n = 4), with echo being done at an outside institution prior to arrival half of the time (n = 2), with no endocarditis identified. The cases of abdominal imaging and echo done at outside institutions prior to arrival were not impacted by the countermeasures. Excluding those 2 patients who had both abdominal imaging and echocardiography done prior to arrival, the overall rate of imaging (both abdominal imaging and echo) done after countermeasures were instituted was 30% (Figure 3).
Of those 7 episodes, the average age was 6.8 years (57% female). There were no patients with multiple episodes. The most common presenting complaint was fever. The most common organism was Candida albicans (3 of the 7 episodes). All episodes involved a central line, which was removed in all cases except for one. Of the risk factors, 2 episodes were in neutropenic patients, and 1 episode had a history of bacterial endocarditis (not related to fungemia). No episodes occurred in patients with prior fungal renal infection, urogenital malformations, or recent cardiac/urogenital surgery. No episodes had clinical symptoms suggestive of fungal endocarditis or renal infection. No episodes of fungal endocarditis or renal infection were identified.
On average, a patient at our institution undergoing abdominal US and echo with a cardiology consult results in medical waste of approximately $3200 per patient. This cost does not take into account other miscellaneous charges possibly incurred, such as the radiologist interpreting the findings and transportation. Baseline data calculations show that patients waste on average 55 minutes in physical transport, and this does not take into account wait times.
Discussion
Candidemia contributes to 10% of central-line associated blood stream infections (CLABSI).19 Increased usage of indwelling central catheters for administration of parenteral nutrition will inevitably result in practitioners encountering cases of candidemia when caring for this population. As seen from our results, the majority of episodes of candidemia at our institution occurred on the pediatric gastroenterology service, and thus redefining standard work on this service will be impactful.
Candida parapsilosis and Candida albicans were the most common causative agents before and after intervention, respectively, but overall the most common organism was Candida albicans, which is in keeping with that of CLABSI in the literature.19 Growth of Candida parapsilosis has been particularly linked to CLABSI.19 The third most common organism in our study was Candida glabrata, which is the second most common cause of candidemia in CLABSI.19
The cases of positive abdominal imaging in fungemia in the literature are limited to the neonatal population1-4 and chronic disseminated candidiasis in patients with hematologic malignancies/neutropenia/immunosuppression.5,6 In fungal endocarditis, the reported cases were generally in neonates,1,3,7 critically ill patients,8 patients with hematologic malignancies/neutropenia/immunosuppression,6,9 or those with a cardiac history.9,10 This population differs from the patient population on the pediatric gastroenterology service. Patients on this service may not need US or echo. Performing abdominal US and echo in fungemia patients in whom such imaging is not indicated may result in medical waste of approximately $3200 per patient. There is also a waste of medical resources and time.
We found almost all practitioners are willing to change clinical practice once provided with current guidelines. Face-to-face oral presentations allowed for questions and interaction, making this form of information dissemination better than e-mails or handouts.
Though the numbers were small over the short study period, we were able to decrease overutilization of abdominal imaging and echo after implementing countermeasures. Frequency decreased from 100% to 43% and 57% for abdominal imaging and echo, respectively. Imaging that was done after the countermeasures were implemented was mainly attributed to imaging patients underwent prior to presenting to our institution. This reinforces the need for education at other institutions as well. Of the balancing measures assessed, there were no missed cases of fungal balls or fungal endocarditis. Additionally,
The findings from this quality improvement project underscore current recommendations that, despite common misconceptions, routine abdominal US and echo are not indicated in all cases of fungemia. Case-by-case assessment based on the clinical scenario remains key to management of fungemia to avoid unnecessary medical interventions.
Corresponding author: Donna Cheung, MBBS, 200 Hawkins Drive, BT 1120-G, Iowa City, IA 52242; donna.ann.cheung@gmail.com.
Financial support: None.
1. Benjamin DK Jr, Poole C, Steinbach WJ, et al. Neonatal candidemia and end-organ damage: a critical appraisal of the literature using meta-analytic techniques. Pediatrics. 2003;112:634-640.
2. Wynn JL, Tan S, Gantz MG, et al. Outcomes following candiduria in extremely low birth weight infants. Clin Infect Dis. 2012;54:331-339.
3. Noyola DE, Fernandez M, Moylett EH, et al. Ophthalmologic, visceral, and cardiac involvement in neonates with candidemia. Clin Infect Dis. 2001;32:1018-1023.
4. Phillips JR, Karlowicz MG Prevalence of Candida species in hospital-acquired urinary tract infections in a neonatal intensive care unit. Pediatr Infect Dis J. 1997;16:190-194.
5. Pagano L, Mele L, Fianchi L, et al. Chronic disseminated candidiasis in patients with hematologic malignancies. Clinical features and outcome of 29 episodes. Haematologica. 2002;87:535-541.
6. Zaoutis TE, Greves HM, Lautenbach E, et al. Risk factors for disseminated candidiasis in children with candidemia. Pediatr Infect Dis J. 2004;23:635-641.
7. Levy I, Shalit I, Birk E, et al. Candida endocarditis in neonates: report of five cases and review of the literature. Mycoses. 2006;49:43-48.
8. Aspesberro F, Beghetti M, Oberhansli I, et al. Fungal endocarditis in critically ill children. Eur J Pediatr. 1999;158:275-280.
9. Fernandez-Cruz A, Cruz Menarguez M, Munoz P, et al. The search for endocarditis in patients with candidemia: a systematic recommendation for echocardiography? A prospective cohort. Eur J Clin Microbiol Infect Dis. 2015;34:1543-1549.
10. Hernandez-Torres A, Garcia-Vazquez E, Laso-Ortiz A, et al. [Candida sp endocarditis. Experience in a third-level hospital and review of the literature]. Rev Esp Quimioter. 2013;26:51-55.
11. Pappas PG, Kauffman CA, Andes DR, et al. Clinical practice guideline for the management of candidiasis: 2016 Update by the Infectious Diseases Society of America. Clin Infect Dis. 2016;62:e1-50.
12. Bow EJ, Evans G, Fuller J, et al. Canadian clinical practice guidelines for invasive candidiasis in adults. Can J Infect Dis Med Microbiol. 2010;21:e122-50.
13. Ruhnke M, Rickerts V, Cornely OA, et al. Diagnosis and therapy of Candida infections: joint recommendations of the German Speaking Mycological Society and the Paul-Ehrlich-Society for Chemotherapy. Mycoses. 2011;54:279-310.
14. Cornely OA, Bassetti M, Calandra T, et al. ESCMID* guideline for the diagnosis and management of Candida diseases 2012: non-neutropenic adult patients. Clin Microbiol Infect. 2012;18 Suppl 7:19-37.
15. Hope WW, Castagnola E, Groll AH, et al. ESCMID* guideline for the diagnosis and management of Candida diseases 2012: prevention and management of invasive infections in neonates and children caused by Candida spp. Clin Microbiol Infect. 2012;18 Suppl 7:38-52.
16. Ullmann AJ, Akova M, Herbrecht R, et al. ESCMID* guideline for the diagnosis and management of Candida diseases 2012: adults with haematological malignancies and after haematopoietic stem cell transplantation (HCT). Clin Microbiol Infect. 2012;18 Suppl 7:53-67.
17. Colombo AL, Guimaraes T, Camargo LF, et al. Brazilian guidelines for the management of candidiasis - a joint meeting report of three medical societies: Sociedade Brasileira de Infectologia, Sociedade Paulista de Infectologia and Sociedade Brasileira de Medicina Tropical. Braz J Infect Dis. 2013;17:283-312.
18. Kohno S, Tamura K, Niki Y, et al. Executive Summary of Japanese Domestic guidelines for management of deep-seated mycosis 2014. Med Mycol J. 2016;57:E117-E163.
19. Kojic EM, Darouiche RO. Candida infections of medical devices. Clin Microbiology Rev. 2004;17:255-267.
Applying Robust Process Improvement Techniques to the Voluntary Inpatient Psychiatry Admission Process
From the Wake Forest School of Medicine (Ms. Newman), and Wake Forest Baptist Health, Department of Psychiatry and Behavioral Medicine (Dr. Kramer), Winston-Salem, NC.
Abstract
- Background: Adults voluntarily admitted to inpatient behavioral health units can ask to sign a Request to Discharge (RTD) form if they would like to be discharged before the treatment team agrees that discharge is appropriate. This gives the team 72 hours to determine whether the patient is safe to discharge or to involuntarily commit the patient to the unit. At 1 medical center, patients who were offered voluntary admission often lacked complete understanding of the “72-hour rule” and the early discharge procedure.
- Methods: Robust Process Improvement® techniques were implemented to improve the admission process. Flow charts, standardized scripts, and pocket cards were distributed to relevant staff. The Request for Voluntary Admission form was revised to emphasize the “72-hour rule” and the process for requesting a RTD form.
- Results: The unit’s average overall Press Ganey score improved from 77.1 to 81.6 (P = 0.003), while the average discharge score improved from 83.0 to 87.5 (P = 0.023) following implementation of the new process.
- Conclusion: Incorporating strategies such as an opportunity to “teach back” important information about the voluntary admission process (ie, what the 72-hour rule is, what the request to discharge form is, and the possibility of involuntary commitment) allows clinicians to assess capacity while simultaneously giving patients realistic expectations of the admission. These changes can lead to improvement in patient satisfaction.
Keywords: behavioral health; communication; patient satisfaction.
Communication is paramount within medical teams to improve outcomes and strengthen rapport with patients, particularly with psychiatric patients in acute crisis. Studies
While some forms of communication are required to protect the safety of patients and others around them, other forms are required to build strong relationships with patients. However, these 2 goals do not have to be mutually exclusive in the psychiatric hospital environment. Hospitals aim to improve patient satisfaction while simultaneously providing effective communication about treatment. Studies have indicated that communication during graduate medical training may decline due to “emotional and physical brutality” associated with residency training programs.4 To ameliorate this and emphasize communication education, accredited psychiatry residency programs require residents to use structured communication tools to achieve a level 2 in the Accreditation Council for Graduate Medical Education milestone project for the category of patient safety and health care team.5 These standardized processes allow all patients to receive the same important information related to their care while minimizing human error. Such communication skills aim to improve health care outcomes and satisfaction for patients while also training better physicians.
For legal and ethical reasons, the adult inpatient behavioral health units at major hospitals are highly regulated. In most states, a patient who is admitted to an adult inpatient behavioral health unit on a voluntary basis can ask to sign a request to discharge (RTD) form if he or she would like to be discharged from the hospital before the treatment team sees fit.6 In most jurisdictions, this action gives the treatment team 72 hours to determine whether the patient is safe to discharge. Within that time frame, the physician must either discharge the patient, or, if it is not safe to do so, involuntarily commit him or her to the unit. In most jurisdictions, this process is commonly referred to as the “72-hour rule.”
In North Carolina, state legislation Chapter 122C, Article 5, Part 2(b) specifies: “In 24-hour facilities the application shall acknowledge that the applicant may be held by the facility for a period of 72 hours after any written request for release that the applicant may make, and shall acknowledge that the 24-hour facility may have the legal right to petition for involuntary commitment of the applicant during that period. At the time of application, the facility shall tell the applicant about procedures for discharge.”7 This requirement can be somewhat confusing for both medical team members and patients alike.
As formerly practiced on the behavioral health unit described in this report, patients offered voluntary admission status to the inpatient behavioral unit often lacked complete understanding of the 72-hour rule and the process for requesting early discharge from the facility. We hypothesized that this led to the observed patient frustration and hostility, lack of trust in the treatment team, poor attendance and participation in group therapy activities, medication refusal, and overall decreased patient satisfaction. To address this issue, this pilot project was conducted to improve the voluntary admission process on the adult inpatient unit of a major academic medical center in North Carolina.
In April 2008, The Joint Commission’s Center for Transforming Healthcare embarked on an enterprise-wide initiative called Robust Process Improvement (RPI). RPI was developed as a blended approach in applying Six Sigma, Lean, and Change Management techniques to improve medical processes and procedures. RPI techniques were applied in this study to better define the problems related to inpatient behavioral health unit admission and discharge by collecting data, obtaining staff involvement, creating a solution, and monitoring for lasting benefit.
Methods
This quality improvement project took place at an 885-bed tertiary care academic medical center with Level 1 Trauma Center designation. Institutional Review Board approval was not required because this was performed as a quality improvement project rather than an experimental clinical trial and was not designed to create new generalizable knowledge.
The techniques used to improve outcomes on the inpatient behavioral health unit included Active Listening, Elevator Speech, Statistics, Cause and Effect Diagrams, development of a Communication Plan, Brainstorming, and Standard Work. Through interviews with physician assistants, nurses, and resident physicians conducted over a 1-month period, it became clear that there was confusion among patients surrounding the voluntary admission process, the process for requesting discharge, and the possibility of a voluntary admission being converted to an involuntary one. Active listening was used to better understand the opportunities for improvement from multiple perspectives through varying stages of the admission—from the consent process in the emergency department, admission to the unit, throughout the hospital stay, to the time of discharge. The following elevator speech was used to highlight the areas of confusion and the importance of implementing change with the team involved in implementing the new admission procedures:
Our project is about improving patient understanding of the voluntary admission process to the Adult Psychiatry Unit and the 72-hour rule. This is important because the present process leads to patient misunderstanding, discontent on the unit, resistance to provided therapies, and low Press Ganey satisfaction scores. Success will look like reduced patient confusion about the 72-hour rule, increased group participation, decreased patient-staff conflict, and improved Press Ganey scores. What we are asking from you is to use a standardized, scripted informed consent process, flow chart, and pocket card during the voluntary admission process.
Additionally, brainstorming sessions were conducted with physician assistants, nurses, and residents to discuss options to improve the process and elicit a list of barriers.
Data Gathering
Several metrics were tracked to further understand the issue. Overall Press Ganey scores, in addition to admission and discharge subsection scores, were tracked for the 8 months prior to implementing the quality improvement procedures (March 2017-October 2017). Additionally, the treatment team members answered survey questions related to perceived patient understanding at the beginning of training sessions in the 5-week period immediately prior to implementing the quality improvement procedures. This survey was administered using a 6-point Likert scale, ranging from 1 (never) to 6 (frequently), and included the following questions:
- How often do you have to explain: (a) Request for Voluntary Admission form, (b) 72-Hour Rule, (c) Request to Discharge form?
- How often is there confusion about the 72-hour rule and RTD form once admitted to the adult inpatient psychiatric unit?
- How often do you need to re-explain the 72-hour rule and RTD form once admitted to the adult inpatient psychiatric unit?
In-depth interviews were conducted with 4 resident physicians, 4 physician assistants, and 3 nurses to identify specific shortcomings of the admission procedure. A key finding from these interviews was that some patients tended not to understand that the treatment team had 72 hours to respond to the RTD application. Instead, several patients had indicated that they thought that they could immediately discharge themselves since they were on the unit “voluntarily” or that they could categorically discharge themselves after 72 hours of being admitted. This feedback was crucial in determining the next steps that could be taken to minimize confusion.
Process Changes
In preparation for this quality improvement project, the language and layout of the Request for Voluntary Admission form was revised and approved internally by the hospital’s Forms Committee to emphasize the 72-hour rule and the process for completing a RTD form. Additionally, these interviews indicated that it was difficult to track patients who were admitted voluntarily versus involuntarily. To rectify this problem, a field was added to the electronic medical record system to include current psychiatric admission status, allowing the selection to be either “Voluntary” or “Involuntary.” This new field in the electronic medical record system gives nurses the ability to easily update legal status daily as appropriate, which minimizes the risk of information not being effectively communicated at shift changes, while also allowing various members of the treatment team to be updated on the admission status of each patient.
After reviewing data and obtaining staff involvement related to the problem, a new psychiatric admission and consent process was created. The new consent and admission process was characterized by a standardized procedure and scripted language to present to candidates for voluntary admission. The standardized procedure begins with the admitting staff member reading scripted consent language from a pocket card that includes 3 key points describing the voluntary admission procedure (see script in Figure 1). The first key point is to describe the 72-hour rule. Next, the staff member describes the purpose of the RTD form and shows an example to the patient. Finally, the staff member responsible for consenting describes the possibility of the patient being required to remain on the unit involuntarily in the event that he or she wants to leave before the treatment team sees fit and is deemed to be a danger to himself or herself or others.

On the reverse side of the pocket card, an example of the RTD form is available to show to the patient. The subsequent teach-back procedure is summarized using the flow chart in Figure 2, and this was made available to staff who participate in the admission and discharge processes. After reading the consent script, the consenting staff member must ask the patient to recall the 3 key points. For each key point that the patient cannot recall, the relevant section of the scripted language is re-read to the patient, who is asked to explain it again. If the patient recalls the 3 key points, then he or she is deemed to have cognitive capacity and thus can become a candidate for voluntary admission.
 process. IVC, involuntary commitment.")
Flow charts, scripts, and pocket cards were created and distributed to relevant physicians, physician assistants, and nurses who participate in the admission or discharge process. Additional copies of pocket cards were made available within the department. In October 2017, an attending psychiatrist and medical student trained psychiatry physician assistants, nurses, and resident physicians who participated in the admission process in the ED or patient care on the unit on how to use the new materials. The new process was first implemented on November 1, 2017.
Measurements
Press Ganey scores were compared for 8 months before and 8 months after implementing the new process to monitor changes from the patients’ perspective. Additionally, the treatment team members answered survey questions related to perceived patient understanding at the beginning of training sessions in mid-September through mid-October and again 5 weeks after the new process was implemented.
Results
The behavioral health unit’s Press Ganey (overall and discharge) scores increased during the 8-month period following implementation of the quality improvement project (Figure 3). There was a notable upward trend of overall and discharge Press Ganey scores on a month-by-month basis from November through April. In total, 181 Press Ganey score reports were available for the 6-month period prior to the new process versus 157 score reports after (Figure 4). The average overall Press Ganey score for respondents improved from 77.1 to 81.6 (P = 0.003), while the average discharge score improved from 83.0 to 87.5 (P = 0.023).

In recent months, the behavioral health discharge satisfaction score has become one of the highest performing aspects of the department according to Press Ganey reports. From April through June 2018, the department has performed in the 98th percentile or higher in “information about patient’s rights” during admission and “discharge instructions if help is needed.”

The survey related to perceived patient satisfaction and confusion also indicated significant improvement. Survey respondents indicated that there was less confusion about the 72-hour rule and RTD form after the quality improvement procedure was implemented (P = 0.039) and that fewer attempts to re-explain these concepts were required as well (P = 0.035).
Discussion
The Press Ganey scores for this unit indicated an improvement in patient satisfaction, in particular with the discharge process. While the overall Press Ganey scores on the inpatient behavioral health unit showed a significant improvement, it remained stagnant, around 80, during the 8-month period after implementing the new standardized admission process. However, the discharge score consistently improved over the same 8 months, from 82 to 95 in the most recent month. Also, the overall and discharge scores indicated a brief spike/improvement in October, immediately preceding the implementation of the new scripted language. Given the timeline, this spike is likely related to the ongoing meetings, trainings, and awareness of the upcoming process improvement.
With hospital and health system reimbursements becoming increasingly tied with patient outcomes, quality improvement efforts to improve patient care and satisfaction are of the utmost importance. In order to develop the rapport with patients needed for a high level of cooperation and excellent outcomes on an inpatient psychiatric unit, it is essential that all patients receive specific information about what the admission entails and what the options are for being discharged from the unit. Since a voluntary admission can be converted to an involuntary admission if a patient is deemed a threat to himself or herself or others despite already signing a RTD form, it is essential that this is not only discussed prior to admission, but that these details are explicitly checked for understanding. This allows the treatment team to assess for capacity and the patient to demonstrate informed consent. Differing expectations or understanding in what the voluntary admission or discharge process entails can lead to patient frustration and hostility, lack of trust in the treatment team, poor attendance and participation in group therapy activities, and medication refusal. Altogether, this can lead to longer inpatient stays, increased costs, decreased outcomes, and decreased patient satisfaction.
These initiatives were relatively easy to implement and are backed by evidence that they ultimately increased patient satisfaction. These findings could be extended to other institutions to improve the voluntary admission process and, ultimately, the patient experience. Additionally, the methods could be applied to other patient care processes within psychiatric facilities, and to improve other aspects of the patient care experience that have room for improvement, as illustrated by the department’s Press Ganey subsection scores, or areas that the treatment team would like to focus on.
Limitations
There are several limitations in the design and evaluation of this project. The assessment of patient understanding, especially in psychiatric patients, is very difficult to quantify. The principal measure of assessing patient understanding was limited to health care professional survey results. This may have led to a slight social desirability bias. An objective assessment of understanding directly from the patients was not readily attainable in our study, but future studies could look at this metric in addition to health care professional survey results.
Additionally, the overall Press Ganey scores may be influenced by factors beyond the admission process and the applied improvement procedures. It is difficult to discern whether there were any other factors that also contributed to the overall increase. However, the discharge score was a more direct measure specifically related to the modified procedures, and the temporal association of the intervention with the increased scores suggests that the intervention was responsible.
Conclusion
Standardization of the consent process ensures that all patients receive the necessary information every time in busy clinical settings. Incorporating an opportunity to “teach back” specific important information about the voluntary admission process, specifically what the 72-hour rule is, what the RTD form is, and the possibility of involuntary commitment, allows clinicians to assess capacity, while simultaneously allowing patients to have realistic expectations of the admission. Concise, standardized answers regarding these points minimizes variation in information being dispersed and decreases the possibility of omitting important information. At a major academic medical center, easy-to-implement quality improvement techniques significantly decreased patient confusion surrounding the 72-hour rule and the RTD form, along with the frequency in which these policies needed to be re-explained on the adult inpatient psychiatric unit. These changes ultimately led to improvement in patient satisfaction, as indicated by significant improvement in both overall and discharge patient satisfaction scores.
Corresponding author: Jennifer F. Newman, 475 Vine St., Winston-Salem, NC, 27101; jnewman9@u.rochester.edu.
Financial disclosures: None.
1. Redfern E, Brown R, Vincent C. Improving communication in the emergency department. Emerg Med J. 2009;26:658-661.
2. Payne CE, Stein JM, Leong T, Dressler DD. Avoiding handover fumbles: a controlled trial of a structured handover tool versus traditional handover methods. BMJ Qual Saf. 2012;21:925-932.
3. Weller J, Boyd M, Cumin D. Teams, tribes and patient safety: overcoming barriers to effective teamwork in healthcare. Postgrad Med J. 2014;90:149-154.
4. DiMatteo MR. The role of the physician in the emerging health care environment. Western J Med. 1998;168:328.
5. The Psychiatry Milestone Project. J Grad Med Educ. 2014;6(1 Suppl 1):284-304.
6. Garakani A, Shalenberg E, Burstin SC, et al. Voluntary psychiatric hospitalization and patient-driven requests for discharge: a statutory review and analysis of implications for the capacity to consent to voluntary hospitalization. Harv Rev Psychiatry. 2014;22:241-249.
7. Procedure for Admission and Discharge of Clients Act, 211 § 122C-211(2014).
From the Wake Forest School of Medicine (Ms. Newman), and Wake Forest Baptist Health, Department of Psychiatry and Behavioral Medicine (Dr. Kramer), Winston-Salem, NC.
Abstract
- Background: Adults voluntarily admitted to inpatient behavioral health units can ask to sign a Request to Discharge (RTD) form if they would like to be discharged before the treatment team agrees that discharge is appropriate. This gives the team 72 hours to determine whether the patient is safe to discharge or to involuntarily commit the patient to the unit. At 1 medical center, patients who were offered voluntary admission often lacked complete understanding of the “72-hour rule” and the early discharge procedure.
- Methods: Robust Process Improvement® techniques were implemented to improve the admission process. Flow charts, standardized scripts, and pocket cards were distributed to relevant staff. The Request for Voluntary Admission form was revised to emphasize the “72-hour rule” and the process for requesting a RTD form.
- Results: The unit’s average overall Press Ganey score improved from 77.1 to 81.6 (P = 0.003), while the average discharge score improved from 83.0 to 87.5 (P = 0.023) following implementation of the new process.
- Conclusion: Incorporating strategies such as an opportunity to “teach back” important information about the voluntary admission process (ie, what the 72-hour rule is, what the request to discharge form is, and the possibility of involuntary commitment) allows clinicians to assess capacity while simultaneously giving patients realistic expectations of the admission. These changes can lead to improvement in patient satisfaction.
Keywords: behavioral health; communication; patient satisfaction.
Communication is paramount within medical teams to improve outcomes and strengthen rapport with patients, particularly with psychiatric patients in acute crisis. Studies
While some forms of communication are required to protect the safety of patients and others around them, other forms are required to build strong relationships with patients. However, these 2 goals do not have to be mutually exclusive in the psychiatric hospital environment. Hospitals aim to improve patient satisfaction while simultaneously providing effective communication about treatment. Studies have indicated that communication during graduate medical training may decline due to “emotional and physical brutality” associated with residency training programs.4 To ameliorate this and emphasize communication education, accredited psychiatry residency programs require residents to use structured communication tools to achieve a level 2 in the Accreditation Council for Graduate Medical Education milestone project for the category of patient safety and health care team.5 These standardized processes allow all patients to receive the same important information related to their care while minimizing human error. Such communication skills aim to improve health care outcomes and satisfaction for patients while also training better physicians.
For legal and ethical reasons, the adult inpatient behavioral health units at major hospitals are highly regulated. In most states, a patient who is admitted to an adult inpatient behavioral health unit on a voluntary basis can ask to sign a request to discharge (RTD) form if he or she would like to be discharged from the hospital before the treatment team sees fit.6 In most jurisdictions, this action gives the treatment team 72 hours to determine whether the patient is safe to discharge. Within that time frame, the physician must either discharge the patient, or, if it is not safe to do so, involuntarily commit him or her to the unit. In most jurisdictions, this process is commonly referred to as the “72-hour rule.”
In North Carolina, state legislation Chapter 122C, Article 5, Part 2(b) specifies: “In 24-hour facilities the application shall acknowledge that the applicant may be held by the facility for a period of 72 hours after any written request for release that the applicant may make, and shall acknowledge that the 24-hour facility may have the legal right to petition for involuntary commitment of the applicant during that period. At the time of application, the facility shall tell the applicant about procedures for discharge.”7 This requirement can be somewhat confusing for both medical team members and patients alike.
As formerly practiced on the behavioral health unit described in this report, patients offered voluntary admission status to the inpatient behavioral unit often lacked complete understanding of the 72-hour rule and the process for requesting early discharge from the facility. We hypothesized that this led to the observed patient frustration and hostility, lack of trust in the treatment team, poor attendance and participation in group therapy activities, medication refusal, and overall decreased patient satisfaction. To address this issue, this pilot project was conducted to improve the voluntary admission process on the adult inpatient unit of a major academic medical center in North Carolina.
In April 2008, The Joint Commission’s Center for Transforming Healthcare embarked on an enterprise-wide initiative called Robust Process Improvement (RPI). RPI was developed as a blended approach in applying Six Sigma, Lean, and Change Management techniques to improve medical processes and procedures. RPI techniques were applied in this study to better define the problems related to inpatient behavioral health unit admission and discharge by collecting data, obtaining staff involvement, creating a solution, and monitoring for lasting benefit.
Methods
This quality improvement project took place at an 885-bed tertiary care academic medical center with Level 1 Trauma Center designation. Institutional Review Board approval was not required because this was performed as a quality improvement project rather than an experimental clinical trial and was not designed to create new generalizable knowledge.
The techniques used to improve outcomes on the inpatient behavioral health unit included Active Listening, Elevator Speech, Statistics, Cause and Effect Diagrams, development of a Communication Plan, Brainstorming, and Standard Work. Through interviews with physician assistants, nurses, and resident physicians conducted over a 1-month period, it became clear that there was confusion among patients surrounding the voluntary admission process, the process for requesting discharge, and the possibility of a voluntary admission being converted to an involuntary one. Active listening was used to better understand the opportunities for improvement from multiple perspectives through varying stages of the admission—from the consent process in the emergency department, admission to the unit, throughout the hospital stay, to the time of discharge. The following elevator speech was used to highlight the areas of confusion and the importance of implementing change with the team involved in implementing the new admission procedures:
Our project is about improving patient understanding of the voluntary admission process to the Adult Psychiatry Unit and the 72-hour rule. This is important because the present process leads to patient misunderstanding, discontent on the unit, resistance to provided therapies, and low Press Ganey satisfaction scores. Success will look like reduced patient confusion about the 72-hour rule, increased group participation, decreased patient-staff conflict, and improved Press Ganey scores. What we are asking from you is to use a standardized, scripted informed consent process, flow chart, and pocket card during the voluntary admission process.
Additionally, brainstorming sessions were conducted with physician assistants, nurses, and residents to discuss options to improve the process and elicit a list of barriers.
Data Gathering
Several metrics were tracked to further understand the issue. Overall Press Ganey scores, in addition to admission and discharge subsection scores, were tracked for the 8 months prior to implementing the quality improvement procedures (March 2017-October 2017). Additionally, the treatment team members answered survey questions related to perceived patient understanding at the beginning of training sessions in the 5-week period immediately prior to implementing the quality improvement procedures. This survey was administered using a 6-point Likert scale, ranging from 1 (never) to 6 (frequently), and included the following questions:
- How often do you have to explain: (a) Request for Voluntary Admission form, (b) 72-Hour Rule, (c) Request to Discharge form?
- How often is there confusion about the 72-hour rule and RTD form once admitted to the adult inpatient psychiatric unit?
- How often do you need to re-explain the 72-hour rule and RTD form once admitted to the adult inpatient psychiatric unit?
In-depth interviews were conducted with 4 resident physicians, 4 physician assistants, and 3 nurses to identify specific shortcomings of the admission procedure. A key finding from these interviews was that some patients tended not to understand that the treatment team had 72 hours to respond to the RTD application. Instead, several patients had indicated that they thought that they could immediately discharge themselves since they were on the unit “voluntarily” or that they could categorically discharge themselves after 72 hours of being admitted. This feedback was crucial in determining the next steps that could be taken to minimize confusion.
Process Changes
In preparation for this quality improvement project, the language and layout of the Request for Voluntary Admission form was revised and approved internally by the hospital’s Forms Committee to emphasize the 72-hour rule and the process for completing a RTD form. Additionally, these interviews indicated that it was difficult to track patients who were admitted voluntarily versus involuntarily. To rectify this problem, a field was added to the electronic medical record system to include current psychiatric admission status, allowing the selection to be either “Voluntary” or “Involuntary.” This new field in the electronic medical record system gives nurses the ability to easily update legal status daily as appropriate, which minimizes the risk of information not being effectively communicated at shift changes, while also allowing various members of the treatment team to be updated on the admission status of each patient.
After reviewing data and obtaining staff involvement related to the problem, a new psychiatric admission and consent process was created. The new consent and admission process was characterized by a standardized procedure and scripted language to present to candidates for voluntary admission. The standardized procedure begins with the admitting staff member reading scripted consent language from a pocket card that includes 3 key points describing the voluntary admission procedure (see script in Figure 1). The first key point is to describe the 72-hour rule. Next, the staff member describes the purpose of the RTD form and shows an example to the patient. Finally, the staff member responsible for consenting describes the possibility of the patient being required to remain on the unit involuntarily in the event that he or she wants to leave before the treatment team sees fit and is deemed to be a danger to himself or herself or others.
On the reverse side of the pocket card, an example of the RTD form is available to show to the patient. The subsequent teach-back procedure is summarized using the flow chart in Figure 2, and this was made available to staff who participate in the admission and discharge processes. After reading the consent script, the consenting staff member must ask the patient to recall the 3 key points. For each key point that the patient cannot recall, the relevant section of the scripted language is re-read to the patient, who is asked to explain it again. If the patient recalls the 3 key points, then he or she is deemed to have cognitive capacity and thus can become a candidate for voluntary admission.
Flow charts, scripts, and pocket cards were created and distributed to relevant physicians, physician assistants, and nurses who participate in the admission or discharge process. Additional copies of pocket cards were made available within the department. In October 2017, an attending psychiatrist and medical student trained psychiatry physician assistants, nurses, and resident physicians who participated in the admission process in the ED or patient care on the unit on how to use the new materials. The new process was first implemented on November 1, 2017.
Measurements
Press Ganey scores were compared for 8 months before and 8 months after implementing the new process to monitor changes from the patients’ perspective. Additionally, the treatment team members answered survey questions related to perceived patient understanding at the beginning of training sessions in mid-September through mid-October and again 5 weeks after the new process was implemented.
Results
The behavioral health unit’s Press Ganey (overall and discharge) scores increased during the 8-month period following implementation of the quality improvement project (Figure 3). There was a notable upward trend of overall and discharge Press Ganey scores on a month-by-month basis from November through April. In total, 181 Press Ganey score reports were available for the 6-month period prior to the new process versus 157 score reports after (Figure 4). The average overall Press Ganey score for respondents improved from 77.1 to 81.6 (P = 0.003), while the average discharge score improved from 83.0 to 87.5 (P = 0.023).
In recent months, the behavioral health discharge satisfaction score has become one of the highest performing aspects of the department according to Press Ganey reports. From April through June 2018, the department has performed in the 98th percentile or higher in “information about patient’s rights” during admission and “discharge instructions if help is needed.”
The survey related to perceived patient satisfaction and confusion also indicated significant improvement. Survey respondents indicated that there was less confusion about the 72-hour rule and RTD form after the quality improvement procedure was implemented (P = 0.039) and that fewer attempts to re-explain these concepts were required as well (P = 0.035).
Discussion
The Press Ganey scores for this unit indicated an improvement in patient satisfaction, in particular with the discharge process. While the overall Press Ganey scores on the inpatient behavioral health unit showed a significant improvement, it remained stagnant, around 80, during the 8-month period after implementing the new standardized admission process. However, the discharge score consistently improved over the same 8 months, from 82 to 95 in the most recent month. Also, the overall and discharge scores indicated a brief spike/improvement in October, immediately preceding the implementation of the new scripted language. Given the timeline, this spike is likely related to the ongoing meetings, trainings, and awareness of the upcoming process improvement.
With hospital and health system reimbursements becoming increasingly tied with patient outcomes, quality improvement efforts to improve patient care and satisfaction are of the utmost importance. In order to develop the rapport with patients needed for a high level of cooperation and excellent outcomes on an inpatient psychiatric unit, it is essential that all patients receive specific information about what the admission entails and what the options are for being discharged from the unit. Since a voluntary admission can be converted to an involuntary admission if a patient is deemed a threat to himself or herself or others despite already signing a RTD form, it is essential that this is not only discussed prior to admission, but that these details are explicitly checked for understanding. This allows the treatment team to assess for capacity and the patient to demonstrate informed consent. Differing expectations or understanding in what the voluntary admission or discharge process entails can lead to patient frustration and hostility, lack of trust in the treatment team, poor attendance and participation in group therapy activities, and medication refusal. Altogether, this can lead to longer inpatient stays, increased costs, decreased outcomes, and decreased patient satisfaction.
These initiatives were relatively easy to implement and are backed by evidence that they ultimately increased patient satisfaction. These findings could be extended to other institutions to improve the voluntary admission process and, ultimately, the patient experience. Additionally, the methods could be applied to other patient care processes within psychiatric facilities, and to improve other aspects of the patient care experience that have room for improvement, as illustrated by the department’s Press Ganey subsection scores, or areas that the treatment team would like to focus on.
Limitations
There are several limitations in the design and evaluation of this project. The assessment of patient understanding, especially in psychiatric patients, is very difficult to quantify. The principal measure of assessing patient understanding was limited to health care professional survey results. This may have led to a slight social desirability bias. An objective assessment of understanding directly from the patients was not readily attainable in our study, but future studies could look at this metric in addition to health care professional survey results.
Additionally, the overall Press Ganey scores may be influenced by factors beyond the admission process and the applied improvement procedures. It is difficult to discern whether there were any other factors that also contributed to the overall increase. However, the discharge score was a more direct measure specifically related to the modified procedures, and the temporal association of the intervention with the increased scores suggests that the intervention was responsible.
Conclusion
Standardization of the consent process ensures that all patients receive the necessary information every time in busy clinical settings. Incorporating an opportunity to “teach back” specific important information about the voluntary admission process, specifically what the 72-hour rule is, what the RTD form is, and the possibility of involuntary commitment, allows clinicians to assess capacity, while simultaneously allowing patients to have realistic expectations of the admission. Concise, standardized answers regarding these points minimizes variation in information being dispersed and decreases the possibility of omitting important information. At a major academic medical center, easy-to-implement quality improvement techniques significantly decreased patient confusion surrounding the 72-hour rule and the RTD form, along with the frequency in which these policies needed to be re-explained on the adult inpatient psychiatric unit. These changes ultimately led to improvement in patient satisfaction, as indicated by significant improvement in both overall and discharge patient satisfaction scores.
Corresponding author: Jennifer F. Newman, 475 Vine St., Winston-Salem, NC, 27101; jnewman9@u.rochester.edu.
Financial disclosures: None.
1. Redfern E, Brown R, Vincent C. Improving communication in the emergency department. Emerg Med J. 2009;26:658-661.
2. Payne CE, Stein JM, Leong T, Dressler DD. Avoiding handover fumbles: a controlled trial of a structured handover tool versus traditional handover methods. BMJ Qual Saf. 2012;21:925-932.
3. Weller J, Boyd M, Cumin D. Teams, tribes and patient safety: overcoming barriers to effective teamwork in healthcare. Postgrad Med J. 2014;90:149-154.
4. DiMatteo MR. The role of the physician in the emerging health care environment. Western J Med. 1998;168:328.
5. The Psychiatry Milestone Project. J Grad Med Educ. 2014;6(1 Suppl 1):284-304.
6. Garakani A, Shalenberg E, Burstin SC, et al. Voluntary psychiatric hospitalization and patient-driven requests for discharge: a statutory review and analysis of implications for the capacity to consent to voluntary hospitalization. Harv Rev Psychiatry. 2014;22:241-249.
7. Procedure for Admission and Discharge of Clients Act, 211 § 122C-211(2014).
Cardioprotective Effect of Metformin in Patients with Decreased Renal Function
Study Overview
Objective. To assess whether metformin use is associated with lower risk of fatal or nonfatal major adverse cardiovascular events (MACE) as compared to sulfonylurea use among diabetic patients with reduced kidney function.
Design. Retrospective cohort study of US Veterans receiving care within the Veterans Health Administration, with data supplemented by linkage to Medicare, Medicaid, and National Death Index data from 2001 through 2016.
Setting and participants. A retrospective cohort of Veterans Health Administration (VHA) patients, aged 18 years and older. Pharmacy data included medication, date filled, days supplied, and number of pills dispensed. For Medicare and Medicaid patients, enrollees’ claims files and prescription (Part D) data were obtained. In addition, dates and cause of death were obtained from vital status and the National Death Index files.
Patients with new-onset type 2 diabetes were identified by selecting new users of metformin, glipizide, glyburide, or glimepiride. These patients were followed longitudinally and the date of cohort entry and start of follow-up was the day of reaching a reduced kidney function threshold, defined as either an estimated glomerular filtration rate (eGFR) of less than 60 mL/m
Main outcome measures. Primary outcome was the composite of MACE including hospitalization for acute myocardial infarction (AMI), ischemic or hemorrhagic stroke, transient ischemic attack (TIA), or date of cardiovascular death. The secondary outcome excluded TIA as part of the composite MACE event because not all patients who sustain a TIA are admitted to the hospital.
Main results. From January 1, 2002 through December 30, 2015, 67,749 new metformin users and 28,976 new sulfonylurea users who persisted with treatment were identified. After using propensity score-weighted matching, 24,679 metformin users and 24,799 sulfonylurea users entered the final analysis. Cohort patients were 98% male and 81.8% white. Metformin users were younger than sulfonylurea users, with a median age of 61 years versus 71 years, respectively.
For the main outcome, there were 1048 composite MACE events among metformin patients with reduced kidney function and 1394 MACE events among sulfonylurea patients, yielding 23.0 (95% confidence interval [CI], 21.7-24.4) versus 29.2 (95% CI, 27.7-30.7) events per 1000 person-years of use, respectively, after propensity score-weighting. After covariate adjustment, the cause-specific adjusted hazard ratio (aHR) for MACE was 0.80 (95% CI, 0.75-0.86) among metformin users compared with sulfonylurea users. The adjusted incidence rate difference was 5.8 (95% CI, 4.1-7.3) fewer events per 1000-person years for metformin compared with sulfonylurea users. Results were also consistent for each component of the primary outcome, including cardiovascular hospitalizations (aHR, 0.87; 95% CI, 0.80-0.95) and cardiovascular deaths (aHR, 0.70; 95% CI, 0.63-0.78).
Analysis of secondary outcomes, which included AMI, stroke, and cardiovascular death and excluded TIA, demonstrated similar results, with a cause-specific aHR of 0.78 (95% CI, 0.72-0.84) among metformin users compared with sulfonylurea users. The adjusted incidence rate difference was 5.9 (95% CI, 4.3-7.6) fewer events per 1000-person years for metformin compared with sulfonylurea users.
Conclusion. For patients with diabetes and reduced kidney function, treatment with metformin monotherapy, as compared with a sulfonylurea, was associated with a lower risk of MACE.
Commentary
There are approximately 30 million US adults with a diagnosis of type 2 diabetes (T2DM), of whom 20% also have impaired kidney function or chronic kidney disease (CKD).1 Metformin hydrochloride has remained the preferred first-line treatment for T2DM based on safety and effectiveness, as well as low cost.2 Metformin is eliminated by the kidneys and can accumulate as eGFR declines. Based on the negative clinical experience, the US Food and Drug Administration (FDA) issued a safety warning restricting metformin for patients with serum creatinine levels of 1.5 mg/dL or greater for men or 1.4 mg/dL or greater for women. The FDA recommended against starting metformin therapy in patients with CKD with eGFR between 30 and 45 mL/min/1.73 m2, although patients already taking metformin can continue with caution in that setting.1,3
There are several limitations in conducting observational studies comparing metformin to other glucose-lowering medications. First, metformin trials typically excluded patients with CKD due to the FDA warnings. Second, there is usually a time-lag bias in which patients who initiate glucose-lowering medications other than metformin are at a later stage of disease. Third, there is often an allocation bias, as there are substantial differences in baseline characteristics between metformin and sulfonylurea monotherapy users, with metformin users usually being younger and healthier.4
In this retrospective cohort study by Roumie et al, the authors used propensity score–weighted matching to reduce the impacts on time-lag and allocation bias. However, several major limitations remained in this study. First, the study design excluded those who began diabetes treatment after the onset of reduced kidney function; therefore, this study cannot be generalized to patients who already have reduced eGFR at the time of metformin initiation. Second, cohort entry and the start of follow-up was either an elevated serum creatinine or reduced eGFR less than 60 mL/min/1.73 m2. The cohort may have included some patients with an acute kidney injury event, rather than progression to CKD, who recovered from their acute kidney injury. Third, the study population was mostly elderly white men; together with the lack of dose analysis, this study may not be generalizable to other populations.
Applications for Clinical Practice
The current study demonstrated that metformin use, as compared to sulfonylureas, has a lower risk of fatal or nonfatal major adverse cardiovascular events among patients with reduced kidney function. When clinicians are managing hyperglycemia in patients with type 2 diabetes, it is important to keep in mind that all medications have adverse effects. There are now 11 drug classes for treating diabetes, in addition to multiple insulin options, and the challenge for clinicians is to present clear information to guide patients using shared decision making, based on each patient’s clinical circumstances and preferences, to achieve individualized glycemic target ranges.
–Ka Ming Gordon Ngai, MD, MPH
1. Geiss LS, Kirtland K, Lin J, et al. Changes in diagnosed diabetes, obesity, and physical inactivity prevalence in US counties, 2004-2012. PLoS One. 2017;12:e0173428.
2. Good CB, Pogach LM. Should metformin be first-line therapy for patients with type 2 diabetes and chronic kidney disease? JAMA Intern Med. 2018;178:911-912.
3. US Food and Drug Administration. FDA revises warnings regarding use of the diabetes medicine metformin in certain patients with reduced kidney function. https://www.fda.gov/downloads/Drugs/DrugSafety/UCM494140.pdf. Accessed September 30, 2019.
4. Wexler DJ. Sulfonylureas and cardiovascular safety the final verdict? JAMA. 2019;322:1147-1149.
Study Overview
Objective. To assess whether metformin use is associated with lower risk of fatal or nonfatal major adverse cardiovascular events (MACE) as compared to sulfonylurea use among diabetic patients with reduced kidney function.
Design. Retrospective cohort study of US Veterans receiving care within the Veterans Health Administration, with data supplemented by linkage to Medicare, Medicaid, and National Death Index data from 2001 through 2016.
Setting and participants. A retrospective cohort of Veterans Health Administration (VHA) patients, aged 18 years and older. Pharmacy data included medication, date filled, days supplied, and number of pills dispensed. For Medicare and Medicaid patients, enrollees’ claims files and prescription (Part D) data were obtained. In addition, dates and cause of death were obtained from vital status and the National Death Index files.
Patients with new-onset type 2 diabetes were identified by selecting new users of metformin, glipizide, glyburide, or glimepiride. These patients were followed longitudinally and the date of cohort entry and start of follow-up was the day of reaching a reduced kidney function threshold, defined as either an estimated glomerular filtration rate (eGFR) of less than 60 mL/m
Main outcome measures. Primary outcome was the composite of MACE including hospitalization for acute myocardial infarction (AMI), ischemic or hemorrhagic stroke, transient ischemic attack (TIA), or date of cardiovascular death. The secondary outcome excluded TIA as part of the composite MACE event because not all patients who sustain a TIA are admitted to the hospital.
Main results. From January 1, 2002 through December 30, 2015, 67,749 new metformin users and 28,976 new sulfonylurea users who persisted with treatment were identified. After using propensity score-weighted matching, 24,679 metformin users and 24,799 sulfonylurea users entered the final analysis. Cohort patients were 98% male and 81.8% white. Metformin users were younger than sulfonylurea users, with a median age of 61 years versus 71 years, respectively.
For the main outcome, there were 1048 composite MACE events among metformin patients with reduced kidney function and 1394 MACE events among sulfonylurea patients, yielding 23.0 (95% confidence interval [CI], 21.7-24.4) versus 29.2 (95% CI, 27.7-30.7) events per 1000 person-years of use, respectively, after propensity score-weighting. After covariate adjustment, the cause-specific adjusted hazard ratio (aHR) for MACE was 0.80 (95% CI, 0.75-0.86) among metformin users compared with sulfonylurea users. The adjusted incidence rate difference was 5.8 (95% CI, 4.1-7.3) fewer events per 1000-person years for metformin compared with sulfonylurea users. Results were also consistent for each component of the primary outcome, including cardiovascular hospitalizations (aHR, 0.87; 95% CI, 0.80-0.95) and cardiovascular deaths (aHR, 0.70; 95% CI, 0.63-0.78).
Analysis of secondary outcomes, which included AMI, stroke, and cardiovascular death and excluded TIA, demonstrated similar results, with a cause-specific aHR of 0.78 (95% CI, 0.72-0.84) among metformin users compared with sulfonylurea users. The adjusted incidence rate difference was 5.9 (95% CI, 4.3-7.6) fewer events per 1000-person years for metformin compared with sulfonylurea users.
Conclusion. For patients with diabetes and reduced kidney function, treatment with metformin monotherapy, as compared with a sulfonylurea, was associated with a lower risk of MACE.
Commentary
There are approximately 30 million US adults with a diagnosis of type 2 diabetes (T2DM), of whom 20% also have impaired kidney function or chronic kidney disease (CKD).1 Metformin hydrochloride has remained the preferred first-line treatment for T2DM based on safety and effectiveness, as well as low cost.2 Metformin is eliminated by the kidneys and can accumulate as eGFR declines. Based on the negative clinical experience, the US Food and Drug Administration (FDA) issued a safety warning restricting metformin for patients with serum creatinine levels of 1.5 mg/dL or greater for men or 1.4 mg/dL or greater for women. The FDA recommended against starting metformin therapy in patients with CKD with eGFR between 30 and 45 mL/min/1.73 m2, although patients already taking metformin can continue with caution in that setting.1,3
There are several limitations in conducting observational studies comparing metformin to other glucose-lowering medications. First, metformin trials typically excluded patients with CKD due to the FDA warnings. Second, there is usually a time-lag bias in which patients who initiate glucose-lowering medications other than metformin are at a later stage of disease. Third, there is often an allocation bias, as there are substantial differences in baseline characteristics between metformin and sulfonylurea monotherapy users, with metformin users usually being younger and healthier.4
In this retrospective cohort study by Roumie et al, the authors used propensity score–weighted matching to reduce the impacts on time-lag and allocation bias. However, several major limitations remained in this study. First, the study design excluded those who began diabetes treatment after the onset of reduced kidney function; therefore, this study cannot be generalized to patients who already have reduced eGFR at the time of metformin initiation. Second, cohort entry and the start of follow-up was either an elevated serum creatinine or reduced eGFR less than 60 mL/min/1.73 m2. The cohort may have included some patients with an acute kidney injury event, rather than progression to CKD, who recovered from their acute kidney injury. Third, the study population was mostly elderly white men; together with the lack of dose analysis, this study may not be generalizable to other populations.
Applications for Clinical Practice
The current study demonstrated that metformin use, as compared to sulfonylureas, has a lower risk of fatal or nonfatal major adverse cardiovascular events among patients with reduced kidney function. When clinicians are managing hyperglycemia in patients with type 2 diabetes, it is important to keep in mind that all medications have adverse effects. There are now 11 drug classes for treating diabetes, in addition to multiple insulin options, and the challenge for clinicians is to present clear information to guide patients using shared decision making, based on each patient’s clinical circumstances and preferences, to achieve individualized glycemic target ranges.
–Ka Ming Gordon Ngai, MD, MPH
1. Geiss LS, Kirtland K, Lin J, et al. Changes in diagnosed diabetes, obesity, and physical inactivity prevalence in US counties, 2004-2012. PLoS One. 2017;12:e0173428.
2. Good CB, Pogach LM. Should metformin be first-line therapy for patients with type 2 diabetes and chronic kidney disease? JAMA Intern Med. 2018;178:911-912.
3. US Food and Drug Administration. FDA revises warnings regarding use of the diabetes medicine metformin in certain patients with reduced kidney function. https://www.fda.gov/downloads/Drugs/DrugSafety/UCM494140.pdf. Accessed September 30, 2019.
4. Wexler DJ. Sulfonylureas and cardiovascular safety the final verdict? JAMA. 2019;322:1147-1149.
Prasugrel Superior to Ticagrelor in Acute Coronary Syndromes
Study Overview
Objective. To assess the relative merits of ticagrelor compared to prasugrel in patients with acute coronary syndromes who will undergo invasive evaluation.
Design. Multicenter, open-label, prospective randomized controlled trial.
Setting and participants. A total of 4018 patients who presented with ACS with or without ST-segment elevation.
Intervention. Patients were randomly assigned to receive either ticagrelor or prasugrel.
Main outcome measures. The primary end point was the composite of death, myocardial infarction, or stroke at 1 year. The secondary end point was bleeding.
Main results. At 1 year, a primary end point event occurred in 184 of 2012 patients (9.3%) in the ticagrelor group and 137 of 2006 patients (6.9%) in the prasugrel group (hazard ratio [HR], 1.36; 95% confidence interval [CI], 1.09-1.70; P = 0.006). In the comparison between
Conclusion. In patients who presented with ACS with or without ST-segment elevation, the incidence of death, myocardial infarction, or stroke was significantly lower among those who received prasugrel as compared to those who received ticagrelor, and incidence of major bleeding was not significantly different.
Commentary
Dual antiplatelet therapy combining an adenosine disphosphate (ADP) receptor antagonist and aspirin is standard treatment for patients presenting with ACS. The limitation of clopidogrel has been its modest antiplatelet effect, with substantial interpatient variability. The newer generation thienopyridine prasugrel and the reversible direct-acting oral antagonist of the ADP receptor ticagrelor provide consistent and greater antiplatelet effect compared to clopidogrel. It has been previously reported that these agents are superior in reducing ischemic events when compared to clopidogrel.1,2 Therefore, current guidelines recommend ticagrelor and prasugrel in preference to clopidogrel.3,4 However, there has been no large randomized controlled study comparing the effect of ticagrelor and prasugrel. In this context, Shupke et al investigated this clinical question by performing a well-designed multicenter randomized controlled trial in patients presenting with ACS. At 12-month follow-up, the composite of death, myocardial infarction, and stroke occurred more frequently in the ticagrelor group compared to the prasugrel group (9.3% versus 6.9%; HR, 1.36; 95% CI, 1.09-1.70; P < 0.01). The incidence of major bleeding was not significantly different between the 2 groups (5.4% versus 4.8%; P = 0.46).
The strengths of this current study include the randomized design and the large number of patients enrolled, with adequate power to evaluate for superiority. This was a multicenter trial in Europe with 23 participating centers (21 from Germany). Furthermore, the interventional technique used by the operators reflects more contemporary technique compared to the previous studies comparing each agent to clopidogrel,1,2 with more frequent use of radial access (37%) and drug-eluting stents (90%) and reduced use of GPIIb/IIIa inhibitors (12%).
There are a few important points to consider due to the differences between the 2 agents compared in this study. First, the loading dose of ticagrelor and prasugrel was administered differently in patients presenting with ACS without ST elevation. Ticagrelor was administered as soon as possible prior to the coronary angiogram, but prasugrel was administered after the coronary anatomy was defined prior to the intervention, which is how this agent is administered in current clinical practice. Therefore, this trial was an open-label study that compared not only different medications, but different administration strategies. Second, ticagrelor and prasugrel have different side-effect profiles. The side effects unique to ticagrelor are dyspnea and bradycardia. On the other hand, a contraindication unique to prasugrel is patients with a history of transient ischemic attack or stroke due to increased risk of thrombotic and hemorrhagic stroke.1 In addition, prasugrel has increased bleeding risk in patients older than 75 years of age and those with low body weight (< 60 kg). In this study, the overall medication discontinuation rate was higher in the ticagrelor group specifically due to dyspnea, and the reduced dose of 5 mg of prasugrel was used in patients older than 75 years or with low body weight.
Since the timing of administration of ticagrelor (preloading prior to coronary angiography is recommended) is similar to that of clopidogrel, and given the theoretical benefit of reversible inhibition of the ADP receptor, ticagrelor has been used more commonly in clinical practice than prasugrel, and it has been implemented in the ACS protocol in many hospitals. In light of the results from this first head-to-head comparison utilizing more contemporary interventional techniques, these protocols may need to be adjusted in favor of prasugrel for patients presenting with ACS. However, given the difference in timing of administration and the difference in side-effect profile, operators must also tailor these agents depending on the patient profile.
Applications for Clinical Practice
In patients presenting with ACS, prasugrel was superior to ticagrelor, with a lower composite of death, myocardial infarction, and stroke at 12 months. Prasugrel should be considered as a first-line treatment for ACS.
– Taishi Hirai, MD, and Arun Kumar, MD, University of Missouri, Columbia, MO
1. Wiviott SD, Braunwald E, McCabe CH, et al. Prasugrel versus clopidogrel in patients with acute coronary syndromes. N Engl J Med. 2007;357:2001-2015.
2. Wallentin L, Becker RC, Budaj A, et al. Ticagrelor versus clopidogrel in patients with acute coronary syndromes. N Engl J Med. 2009;361:1045-1057.
3. Ibanez B, James S, Agewall S, et al. 2017 ESC Guidelines for the management of acute myocardial infarction in patients presenting with ST-segment elevation: The Task Force for the management of acute myocardial infarction in patients presenting with ST-segment elevation of the European Society of Cardiology (ESC). Eur Heart J. 2018;39:119-177.
4. Levine GN, Bates ER, Bittl JA, et al. 2016 ACC/AHA guideline focused update on duration of dual antiplatelet therapy in patients with coronary artery disease: a report of the American College of Cardiology/American Heart Association Task Force on Clinical Practice Guidelines. J Am Coll Cardiol. 2016;68:1082-1115.
Study Overview
Objective. To assess the relative merits of ticagrelor compared to prasugrel in patients with acute coronary syndromes who will undergo invasive evaluation.
Design. Multicenter, open-label, prospective randomized controlled trial.
Setting and participants. A total of 4018 patients who presented with ACS with or without ST-segment elevation.
Intervention. Patients were randomly assigned to receive either ticagrelor or prasugrel.
Main outcome measures. The primary end point was the composite of death, myocardial infarction, or stroke at 1 year. The secondary end point was bleeding.
Main results. At 1 year, a primary end point event occurred in 184 of 2012 patients (9.3%) in the ticagrelor group and 137 of 2006 patients (6.9%) in the prasugrel group (hazard ratio [HR], 1.36; 95% confidence interval [CI], 1.09-1.70; P = 0.006). In the comparison between
Conclusion. In patients who presented with ACS with or without ST-segment elevation, the incidence of death, myocardial infarction, or stroke was significantly lower among those who received prasugrel as compared to those who received ticagrelor, and incidence of major bleeding was not significantly different.
Commentary
Dual antiplatelet therapy combining an adenosine disphosphate (ADP) receptor antagonist and aspirin is standard treatment for patients presenting with ACS. The limitation of clopidogrel has been its modest antiplatelet effect, with substantial interpatient variability. The newer generation thienopyridine prasugrel and the reversible direct-acting oral antagonist of the ADP receptor ticagrelor provide consistent and greater antiplatelet effect compared to clopidogrel. It has been previously reported that these agents are superior in reducing ischemic events when compared to clopidogrel.1,2 Therefore, current guidelines recommend ticagrelor and prasugrel in preference to clopidogrel.3,4 However, there has been no large randomized controlled study comparing the effect of ticagrelor and prasugrel. In this context, Shupke et al investigated this clinical question by performing a well-designed multicenter randomized controlled trial in patients presenting with ACS. At 12-month follow-up, the composite of death, myocardial infarction, and stroke occurred more frequently in the ticagrelor group compared to the prasugrel group (9.3% versus 6.9%; HR, 1.36; 95% CI, 1.09-1.70; P < 0.01). The incidence of major bleeding was not significantly different between the 2 groups (5.4% versus 4.8%; P = 0.46).
The strengths of this current study include the randomized design and the large number of patients enrolled, with adequate power to evaluate for superiority. This was a multicenter trial in Europe with 23 participating centers (21 from Germany). Furthermore, the interventional technique used by the operators reflects more contemporary technique compared to the previous studies comparing each agent to clopidogrel,1,2 with more frequent use of radial access (37%) and drug-eluting stents (90%) and reduced use of GPIIb/IIIa inhibitors (12%).
There are a few important points to consider due to the differences between the 2 agents compared in this study. First, the loading dose of ticagrelor and prasugrel was administered differently in patients presenting with ACS without ST elevation. Ticagrelor was administered as soon as possible prior to the coronary angiogram, but prasugrel was administered after the coronary anatomy was defined prior to the intervention, which is how this agent is administered in current clinical practice. Therefore, this trial was an open-label study that compared not only different medications, but different administration strategies. Second, ticagrelor and prasugrel have different side-effect profiles. The side effects unique to ticagrelor are dyspnea and bradycardia. On the other hand, a contraindication unique to prasugrel is patients with a history of transient ischemic attack or stroke due to increased risk of thrombotic and hemorrhagic stroke.1 In addition, prasugrel has increased bleeding risk in patients older than 75 years of age and those with low body weight (< 60 kg). In this study, the overall medication discontinuation rate was higher in the ticagrelor group specifically due to dyspnea, and the reduced dose of 5 mg of prasugrel was used in patients older than 75 years or with low body weight.
Since the timing of administration of ticagrelor (preloading prior to coronary angiography is recommended) is similar to that of clopidogrel, and given the theoretical benefit of reversible inhibition of the ADP receptor, ticagrelor has been used more commonly in clinical practice than prasugrel, and it has been implemented in the ACS protocol in many hospitals. In light of the results from this first head-to-head comparison utilizing more contemporary interventional techniques, these protocols may need to be adjusted in favor of prasugrel for patients presenting with ACS. However, given the difference in timing of administration and the difference in side-effect profile, operators must also tailor these agents depending on the patient profile.
Applications for Clinical Practice
In patients presenting with ACS, prasugrel was superior to ticagrelor, with a lower composite of death, myocardial infarction, and stroke at 12 months. Prasugrel should be considered as a first-line treatment for ACS.
– Taishi Hirai, MD, and Arun Kumar, MD, University of Missouri, Columbia, MO
1. Wiviott SD, Braunwald E, McCabe CH, et al. Prasugrel versus clopidogrel in patients with acute coronary syndromes. N Engl J Med. 2007;357:2001-2015.
2. Wallentin L, Becker RC, Budaj A, et al. Ticagrelor versus clopidogrel in patients with acute coronary syndromes. N Engl J Med. 2009;361:1045-1057.
3. Ibanez B, James S, Agewall S, et al. 2017 ESC Guidelines for the management of acute myocardial infarction in patients presenting with ST-segment elevation: The Task Force for the management of acute myocardial infarction in patients presenting with ST-segment elevation of the European Society of Cardiology (ESC). Eur Heart J. 2018;39:119-177.
4. Levine GN, Bates ER, Bittl JA, et al. 2016 ACC/AHA guideline focused update on duration of dual antiplatelet therapy in patients with coronary artery disease: a report of the American College of Cardiology/American Heart Association Task Force on Clinical Practice Guidelines. J Am Coll Cardiol. 2016;68:1082-1115.
Combination Encorafenib, Cetuximab, and Binimetinib Improves Survival in BRAF V600E–Mutated Metastatic Colon Cancer
Study Overview
Objective. To evaluate whether the combination of encorafenib plus cetuximab with or without the MEK inhibitor binimetin
Design. Global, multicenter, randomized, open-label, phase 3 trial.
Intervention. Patients were randomized in a 1:1:1 fashion to 1 of 3 groups: triplet-therapy group (encorafenib 300 mg daily, binimetinib 45 mg twice daily, and cetuximab 400 mg/m2 of body surface area initially, then 250 mg/m2 weekly), doublet-therapy group (encorafenib and cetuximab in same doses and schedule as the triplet-therapy group), and control group (investigators choice of cetuximab and irinotecan or cetuximab and FOLFIRI). The randomization was stratified by performance status and prior irinotecan use. Treatment was given until progression or unacceptable toxicities on a 28-day cycle. No crossover was permitted.
Setting and participants. 665 patients underwent randomization: 224 patients to triplet-therapy, 220 to doublet-therapy, and 221 to the control group. Eligible patients had histologically confirmed metastatic colorectal cancer with a BRAF V600E mutation. Patients all had disease progression after 1 or 2 previous lines of therapy.
Main outcome measures. The primary end point of the study was OS and objective response rate (ORR) in the triplet-therapy group compared with the control group. Secondary endpoints included OS in the doublet-therapy group compared with the control group, as well as progression-free survival (PFS), duration of response (DOR), and safety. Assessments were performed every 6 weeks for the first 24 weeks and then every 12 weeks thereafter.
Results. The baseline characteristics were well balanced between the treatment arms. At the time of data cutoff, the median duration of follow-up was 7.8 months for each group. The median OS was 9 months in the triplet-therapy group and 5.4 months in the control group (hazard ratio [HR] for death, 0.52; 95% confidence interval [CI], 0.39-0.70; P < 0.001). The median OS was 8.4 months for the doublet-therapy group, resulting in a significant reduction in the risk of death compared with the control group (HR, 0.6; 95% CI, 0.45-0.79; P < 0.001). The estimated 6-month survival was 71% for the triplet-therapy group, 65% for the doublet-therapy group, and 47% for the control group. The triplet-therapy group had a higher ORR compared with the control group (26% versus 2%, P < 0.001). The ORR in the doublet-therapy group was also significantly higher than that in the control group (20% versus 2%, P < 0.001). Complete responses were seen in 4% of patients in the triplet-therapy group, 5% of the doublet-therapy group, and no patients in the control group. PFS was significantly longer in both the triplet-therapy and doublet-therapy groups compared with the control group (median PFS: 4.3 months, 4.2 months, 1.5 months, respectively). This translated into a 62% and 60% reduction in the risk for disease progression or death in the triplet-therapy and doublet-therapy groups, respectively, compared to the control group.
The most common adverse event reported in the triplet-therapy group was gastrointestinal (GI) related (diarrhea, nausea, and vomiting), with grade 3 or higher GI toxicity seen in 10% of patients. Skin toxicity in the form of acneiform dermatitis was seen in almost 50% of those in the triplet-therapy arm; however, grade 3 or higher skin toxicity was uncommon (2%). Overall, adverse events grade 3 or higher were observed in 58% of those in the triplet-therapy group, 50% in the doublet-therapy group, and 61% in the control group. Adverse events leading to drug discontinuation occurred in 7% in the triplet-therapy group, 8% in the doublet-therapy group, and 11% in the control group. Three deaths were considered treatment related: 1 in the triplet-therapy group (bowel perforation) and 2 in the control group (anaphylaxis and respiratory failure).
Conclusion. The triplet-combination of encorafenib, binimetinib, and cetuximab as well as the doublet-regimen of encorafenib and cetuximab improved both PFS and OS in patients with metastatic, BRAF V600E–mutated colorectal cancer that has progressed after 1 or 2 lines of therapy.
Commentary
The current interim analysis of the BEACON CRC trial demonstrates improved response rates, PFS, and, importantly, OS with the triplet regimen of encorafenib, binimetinib, and cetuximab in patients with metastatic BRAF V600E–mutated colorectal cancer compared to standard irinotecan-based therapy. Similarly, a doublet-regimen of encorafenib and cetuximab also improved outcomes compared with irinotecan-based chemotherapy, resulting in significantly higher response rates, PFS, and OS.
BRAF mutations are seen in approximately 5% to 15% of colorectal cancers and are more commonly seen in right-sided disease. BRAF-mutated colorectal cancer has a poor prognosis, and the presence of a BRAF mutation is an independent prognostic factor for decreased survival.1 Previous work to improve outcomes in this subset of patients has been largely disappointing. For example, Kopetz and colleagues have previously shown that single-agent BRAF inhibition with vemurafenib in metastatic BRAF-mutated colorectal cancer did not show meaningful clinical activity.2 Preclinical studies have suggested that single-agent BRAF or MEK inhibition alone do not lead to sustained MAPK pathway inhibition. Mechanistically, inhibition of BRAF has been shown to lead to feedback activation of EGFR; thus, inhibition of BRAF alone does not lead to cessation of proliferation.3 In light of this, the combination of EGFR and BRAF inhibition has been an attractive therapeutic strategy. Yaeger and colleagues enrolled 15 patients in a pilot study looking at the efficacy and safety of the BRAF inhibitor vemurafenib and the EGFR antibody panitumumab in patients with BRAF-mutated metastatic colorectal cancer. In this cohort, combined BRAF and EGFR inhibition showed tumor regression in 10 of 12 patients.4 This finding was validated in other subsequent studies.5
The current study is the first phase 3 trial to validate the efficacy of BRAF, MEK, and EGFR inhibition in patients with BRAF-mutant metastatic colorectal cancer. The results of this study represent a very important step forward in treating this patient cohort that has historically had very poor clinical outcomes. The combination of encorafenib, binimetinib, and cetuximab improved OS by 48% compared with standard irinotecan-based chemotherapy. In light of this, we now have a chemotherapy-free targeted combination that improves survival and likely represents the new standard of care in patients with BRAF-mutated colorectal cancer after progression on 1 or 2 prior lines of therapy. Ongoing trials are being pursued to investigate the efficacy of these combinations in the upfront setting, and the results of these trials are eagerly awaited.
Applications for Clinical Practice
The combination of encorafenib, binimetinib, and cetuximab improved OS in patients with BRAF-mutated metastatic colorectal cancer after progression on 1 or 2 prior lines of therapy. This combination represents a potential new standard of care in this patient population.
–Daniel Isaac, DO, MS
1. Souglakos J, Philips J, Wang, R, et al. Prognostic and predictive value of common mutations for treatment response and survival in patients with metastatic colorectal cancer. Br J Cancer. 2009;101:465-472.
2. Kopetz S, Desai J, Chan E, et al. Phase II pilot study of vemurafenib in patients with metastatic BRAF-mutated colorectal cancer. J Clin Oncol. 2015;33:4032-4038.
3. Prahallad A, Sun C, Huang S, et al. Unresponsiveness of colon cancer to BRAF (V600e) inhibition through feedback activation of EGFR. Nature. 2012;483:100-103.
4. Yaeger R, Cercek A, O’Reilly EM, et al. Pilot trial of combined BRAF and EGFR inhibition in BRAF-mutant metastatic colorectal cancer patients. Clin Cancer Res. 2015;21:1313-1320.
5. Van Geel EMJM, Tabernero J, Elez E, et al. A phase Ib dose-escalation study of encorafenib and cetuximab with or without alpelisib in metastatic BRAF-mutant colorectal cancer. Cancer Discov. 2017;7:610-619.
Study Overview
Objective. To evaluate whether the combination of encorafenib plus cetuximab with or without the MEK inhibitor binimetin
Design. Global, multicenter, randomized, open-label, phase 3 trial.
Intervention. Patients were randomized in a 1:1:1 fashion to 1 of 3 groups: triplet-therapy group (encorafenib 300 mg daily, binimetinib 45 mg twice daily, and cetuximab 400 mg/m2 of body surface area initially, then 250 mg/m2 weekly), doublet-therapy group (encorafenib and cetuximab in same doses and schedule as the triplet-therapy group), and control group (investigators choice of cetuximab and irinotecan or cetuximab and FOLFIRI). The randomization was stratified by performance status and prior irinotecan use. Treatment was given until progression or unacceptable toxicities on a 28-day cycle. No crossover was permitted.
Setting and participants. 665 patients underwent randomization: 224 patients to triplet-therapy, 220 to doublet-therapy, and 221 to the control group. Eligible patients had histologically confirmed metastatic colorectal cancer with a BRAF V600E mutation. Patients all had disease progression after 1 or 2 previous lines of therapy.
Main outcome measures. The primary end point of the study was OS and objective response rate (ORR) in the triplet-therapy group compared with the control group. Secondary endpoints included OS in the doublet-therapy group compared with the control group, as well as progression-free survival (PFS), duration of response (DOR), and safety. Assessments were performed every 6 weeks for the first 24 weeks and then every 12 weeks thereafter.
Results. The baseline characteristics were well balanced between the treatment arms. At the time of data cutoff, the median duration of follow-up was 7.8 months for each group. The median OS was 9 months in the triplet-therapy group and 5.4 months in the control group (hazard ratio [HR] for death, 0.52; 95% confidence interval [CI], 0.39-0.70; P < 0.001). The median OS was 8.4 months for the doublet-therapy group, resulting in a significant reduction in the risk of death compared with the control group (HR, 0.6; 95% CI, 0.45-0.79; P < 0.001). The estimated 6-month survival was 71% for the triplet-therapy group, 65% for the doublet-therapy group, and 47% for the control group. The triplet-therapy group had a higher ORR compared with the control group (26% versus 2%, P < 0.001). The ORR in the doublet-therapy group was also significantly higher than that in the control group (20% versus 2%, P < 0.001). Complete responses were seen in 4% of patients in the triplet-therapy group, 5% of the doublet-therapy group, and no patients in the control group. PFS was significantly longer in both the triplet-therapy and doublet-therapy groups compared with the control group (median PFS: 4.3 months, 4.2 months, 1.5 months, respectively). This translated into a 62% and 60% reduction in the risk for disease progression or death in the triplet-therapy and doublet-therapy groups, respectively, compared to the control group.
The most common adverse event reported in the triplet-therapy group was gastrointestinal (GI) related (diarrhea, nausea, and vomiting), with grade 3 or higher GI toxicity seen in 10% of patients. Skin toxicity in the form of acneiform dermatitis was seen in almost 50% of those in the triplet-therapy arm; however, grade 3 or higher skin toxicity was uncommon (2%). Overall, adverse events grade 3 or higher were observed in 58% of those in the triplet-therapy group, 50% in the doublet-therapy group, and 61% in the control group. Adverse events leading to drug discontinuation occurred in 7% in the triplet-therapy group, 8% in the doublet-therapy group, and 11% in the control group. Three deaths were considered treatment related: 1 in the triplet-therapy group (bowel perforation) and 2 in the control group (anaphylaxis and respiratory failure).
Conclusion. The triplet-combination of encorafenib, binimetinib, and cetuximab as well as the doublet-regimen of encorafenib and cetuximab improved both PFS and OS in patients with metastatic, BRAF V600E–mutated colorectal cancer that has progressed after 1 or 2 lines of therapy.
Commentary
The current interim analysis of the BEACON CRC trial demonstrates improved response rates, PFS, and, importantly, OS with the triplet regimen of encorafenib, binimetinib, and cetuximab in patients with metastatic BRAF V600E–mutated colorectal cancer compared to standard irinotecan-based therapy. Similarly, a doublet-regimen of encorafenib and cetuximab also improved outcomes compared with irinotecan-based chemotherapy, resulting in significantly higher response rates, PFS, and OS.
BRAF mutations are seen in approximately 5% to 15% of colorectal cancers and are more commonly seen in right-sided disease. BRAF-mutated colorectal cancer has a poor prognosis, and the presence of a BRAF mutation is an independent prognostic factor for decreased survival.1 Previous work to improve outcomes in this subset of patients has been largely disappointing. For example, Kopetz and colleagues have previously shown that single-agent BRAF inhibition with vemurafenib in metastatic BRAF-mutated colorectal cancer did not show meaningful clinical activity.2 Preclinical studies have suggested that single-agent BRAF or MEK inhibition alone do not lead to sustained MAPK pathway inhibition. Mechanistically, inhibition of BRAF has been shown to lead to feedback activation of EGFR; thus, inhibition of BRAF alone does not lead to cessation of proliferation.3 In light of this, the combination of EGFR and BRAF inhibition has been an attractive therapeutic strategy. Yaeger and colleagues enrolled 15 patients in a pilot study looking at the efficacy and safety of the BRAF inhibitor vemurafenib and the EGFR antibody panitumumab in patients with BRAF-mutated metastatic colorectal cancer. In this cohort, combined BRAF and EGFR inhibition showed tumor regression in 10 of 12 patients.4 This finding was validated in other subsequent studies.5
The current study is the first phase 3 trial to validate the efficacy of BRAF, MEK, and EGFR inhibition in patients with BRAF-mutant metastatic colorectal cancer. The results of this study represent a very important step forward in treating this patient cohort that has historically had very poor clinical outcomes. The combination of encorafenib, binimetinib, and cetuximab improved OS by 48% compared with standard irinotecan-based chemotherapy. In light of this, we now have a chemotherapy-free targeted combination that improves survival and likely represents the new standard of care in patients with BRAF-mutated colorectal cancer after progression on 1 or 2 prior lines of therapy. Ongoing trials are being pursued to investigate the efficacy of these combinations in the upfront setting, and the results of these trials are eagerly awaited.
Applications for Clinical Practice
The combination of encorafenib, binimetinib, and cetuximab improved OS in patients with BRAF-mutated metastatic colorectal cancer after progression on 1 or 2 prior lines of therapy. This combination represents a potential new standard of care in this patient population.
–Daniel Isaac, DO, MS
1. Souglakos J, Philips J, Wang, R, et al. Prognostic and predictive value of common mutations for treatment response and survival in patients with metastatic colorectal cancer. Br J Cancer. 2009;101:465-472.
2. Kopetz S, Desai J, Chan E, et al. Phase II pilot study of vemurafenib in patients with metastatic BRAF-mutated colorectal cancer. J Clin Oncol. 2015;33:4032-4038.
3. Prahallad A, Sun C, Huang S, et al. Unresponsiveness of colon cancer to BRAF (V600e) inhibition through feedback activation of EGFR. Nature. 2012;483:100-103.
4. Yaeger R, Cercek A, O’Reilly EM, et al. Pilot trial of combined BRAF and EGFR inhibition in BRAF-mutant metastatic colorectal cancer patients. Clin Cancer Res. 2015;21:1313-1320.
5. Van Geel EMJM, Tabernero J, Elez E, et al. A phase Ib dose-escalation study of encorafenib and cetuximab with or without alpelisib in metastatic BRAF-mutant colorectal cancer. Cancer Discov. 2017;7:610-619.
Quantifying the EHR connection to burnout
While plenty of anecdotal and other evidence exists to connect the use of electronic health records to physician burnout, new research puts a more standard, quantifiable measure to it in an effort to help measure progress in improving the usability of EHRs.

Researchers used the System Usability Scale (SUS), “favored as an industry standard as a short, simple, and reliable measurement of technology usability with solid benchmarks to easily interpret its results, as the measure in this research, Edward Melnick, MD, of Yale University, New Haven, Conn., and colleagues wrote in Mayo Clinic Proceedings.
“The previous studies have definitely hinted at [the link between EHRs and burnout], but never really quantified it,” Dr. Melnick said in an interview.
Among the 870 physicians evaluating their EHRs’ usability, the mean score on a scale of 0-100 (higher being more usable) was 45.9. As a point of comparison, Microsoft Excel has an SUS score of 57, digital video recorders score 74, Amazon scores 82, microwave ovens score 87, and Google search scores 93.
“A score of 45.9 is in the bottom 9% of usability scores across studies in other industries and is categorized as in the ‘not acceptable’ range with a grade of F,” the authors wrote. “In aggregate, 733 of 870 (84.2%) of respondents rated their EHR less than 68 on the SUS, the average score across industries.”
In tying the SUS results to burnout, which was measured using the Maslach Burnout Inventory, the authors noted that the scores “were strongly and independently associated with physician burnout in a dose-response relationship. The odds of burnout were lower for each 1 point more favorable SUS score, a finding that persisted after adjusting for an extensive array of other personal and professional characteristics. The relationship between SUS score and burnout also persisted when emotional exhaustion and depersonalization were treated as continuous variables.”
The authors did note that, despite the strong relationship, they could not determine a causation given the cross-sectional nature of the data.
“I’m hoping that this paper will spark conversation and drive change and be a way of tracking improvements,” Dr. Melnick said. “So, if you bring in something new and say this is going to be better, how do you know it is going to be better? Well maybe you measure it using the System Usability Scale” to give it a quantifiable measure of improvement. He said it is an advantage “of having a metric that has been standardized and used in other industries,” allowing EHR stakeholders to measure improvement. “Once you can measure it, you can manage it and make improvements faster.”
The findings “will not come as a surprise to anyone who practices medicine,” Patrice Harris, MD, president of the American Medical Association, said in a statement. “It is a national imperative to overhaul the design and use of EHRs and reframe the technology to focus primarily on its most critical function: helping physicians care for patients. Significantly enhancing EHR usability is key and the AMA is working to ensure a new generation of EHRs are designed to prioritize time with patients, rather than overload physicians with type-and-click tasks.”
Funding for the study was provided by the Stanford Medicine WebMD Center, AMA, and the Mayo Clinic Department of Medicine Program on Physician Well-Being. No conflicts of interest were reported by the authors.
SOURCE: Melnick E et al. Mayo Clinic Proceedings 2019 Nov 14. doi: 10.1016/j.mayocp.2019.09.024.
While plenty of anecdotal and other evidence exists to connect the use of electronic health records to physician burnout, new research puts a more standard, quantifiable measure to it in an effort to help measure progress in improving the usability of EHRs.
Researchers used the System Usability Scale (SUS), “favored as an industry standard as a short, simple, and reliable measurement of technology usability with solid benchmarks to easily interpret its results, as the measure in this research, Edward Melnick, MD, of Yale University, New Haven, Conn., and colleagues wrote in Mayo Clinic Proceedings.
“The previous studies have definitely hinted at [the link between EHRs and burnout], but never really quantified it,” Dr. Melnick said in an interview.
Among the 870 physicians evaluating their EHRs’ usability, the mean score on a scale of 0-100 (higher being more usable) was 45.9. As a point of comparison, Microsoft Excel has an SUS score of 57, digital video recorders score 74, Amazon scores 82, microwave ovens score 87, and Google search scores 93.
“A score of 45.9 is in the bottom 9% of usability scores across studies in other industries and is categorized as in the ‘not acceptable’ range with a grade of F,” the authors wrote. “In aggregate, 733 of 870 (84.2%) of respondents rated their EHR less than 68 on the SUS, the average score across industries.”
In tying the SUS results to burnout, which was measured using the Maslach Burnout Inventory, the authors noted that the scores “were strongly and independently associated with physician burnout in a dose-response relationship. The odds of burnout were lower for each 1 point more favorable SUS score, a finding that persisted after adjusting for an extensive array of other personal and professional characteristics. The relationship between SUS score and burnout also persisted when emotional exhaustion and depersonalization were treated as continuous variables.”
The authors did note that, despite the strong relationship, they could not determine a causation given the cross-sectional nature of the data.
“I’m hoping that this paper will spark conversation and drive change and be a way of tracking improvements,” Dr. Melnick said. “So, if you bring in something new and say this is going to be better, how do you know it is going to be better? Well maybe you measure it using the System Usability Scale” to give it a quantifiable measure of improvement. He said it is an advantage “of having a metric that has been standardized and used in other industries,” allowing EHR stakeholders to measure improvement. “Once you can measure it, you can manage it and make improvements faster.”
The findings “will not come as a surprise to anyone who practices medicine,” Patrice Harris, MD, president of the American Medical Association, said in a statement. “It is a national imperative to overhaul the design and use of EHRs and reframe the technology to focus primarily on its most critical function: helping physicians care for patients. Significantly enhancing EHR usability is key and the AMA is working to ensure a new generation of EHRs are designed to prioritize time with patients, rather than overload physicians with type-and-click tasks.”
Funding for the study was provided by the Stanford Medicine WebMD Center, AMA, and the Mayo Clinic Department of Medicine Program on Physician Well-Being. No conflicts of interest were reported by the authors.
SOURCE: Melnick E et al. Mayo Clinic Proceedings 2019 Nov 14. doi: 10.1016/j.mayocp.2019.09.024.
FROM MAYO CLINIC PROCEEDINGS
CDC finds that efforts to reduce new HIV infections have stalled
, according to a Vital Signs report published by the Centers for Disease Control and Prevention based upon a simultaneous MMWR Early Release. The report indicates that many Americans with HIV are not aware of their status or are not receiving effective treatment. Furthermore, the data suggest that few Americans who could benefit from preexposure prophylaxis (PrEP), a daily pill that prevents HIV, are receiving it.
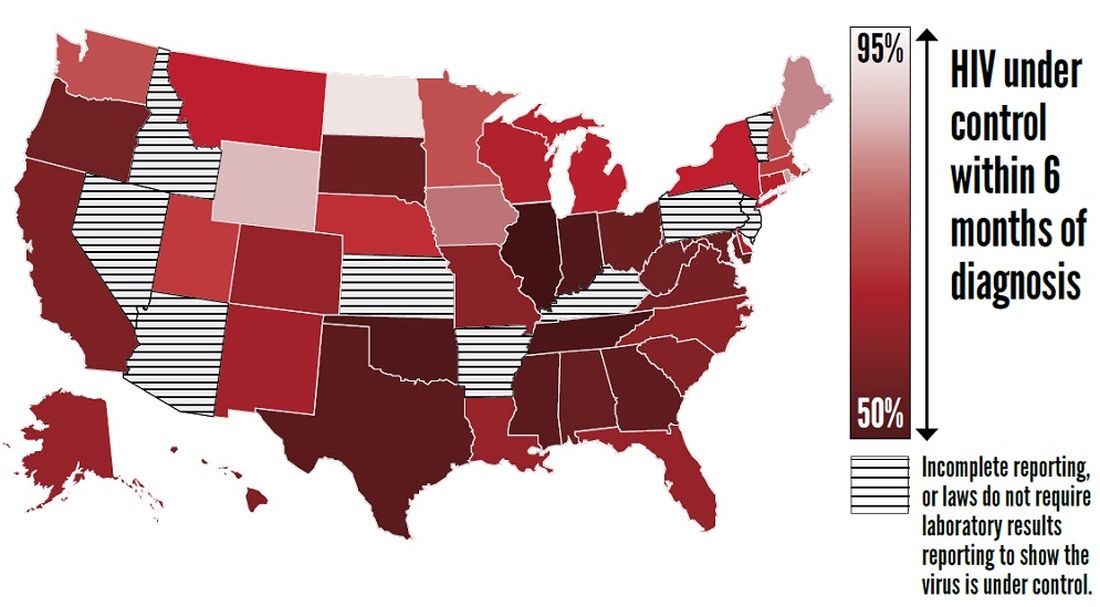
The report “shows that HIV testing, treatment, and prevention have not reached enough Americans, and it emphasizes the continued urgent need to increase these interventions,” said Jay C. Butler, MD, deputy director for infectious diseases at the CDC, at a press conference. “We made a lot of progress in the late ’90s and into the early part of the 21st century in reducing the number of new cases of HIV. But HIV prevention progress has stalled in America since 2013. This stalling underscores the need to increase resources, deploy new technologies, and build expertise, particularly in areas where they’re needed most.”
To achieve these objectives, the CDC has proposed a federal initiative called Ending the HIV Epidemic: A Plan for America. The goal of the initiative is to reduce new HIV infections by 90% by 2030, in part by expanding access to PrEP medications.
Data suggest shortcomings in diagnosis, treatment, and prevention
In its review of data on HIV testing and treatment in 2017, the Vital Signs report found that approximately 154,000 people with HIV (that is, 14% of the total population with HIV) were unaware that they had the virus. These patients consequently could not take advantage of HIV treatment to maintain health, control the virus, and prevent HIV transmission. Young people aged 13-24 years were less likely to know their HIV status than did those aged 25 years and older, according to the report.
Furthermore, approximately two-thirds (63%) of patients who knew that they had HIV had the virus under control through effective treatment. Young people and African Americans were least likely to have the virus under control, according to the report.
The report also examines data about treatment with PrEP in 2018. About 1.2 million Americans could benefit from PrEP, but only 219,700 (18%) of them had received a prescription for the drug. The eligible groups with the lowest rates of coverage were young people, African Americans, and Latinos.
The report presents a conservative estimate of PrEP coverage, however. Researchers examined data from 92% of prescriptions from retail pharmacies in the United States but did not include prescriptions from closed health care systems such as managed care organizations and military health plans. PrEP coverage in 2018 likely was higher than these estimates indicate, according to the CDC.
“There has been a rapid increase in the number of people taking PrEP over the past 3 years, but there is no doubt that PrEP uptake is too low,” said Eugene McCray, MD, director of CDC’s division of HIV/AIDS prevention. “We are working hard to increase access to PrEP, especially among gay and bisexual men, women, transgender people, young people, African Americans, and Latinos.”
The rate of new HIV infections has not decreased, but remained stable, according to the report. The CDC estimates that there were about 38,000 new infections per year from 2013 to 2017.
Proposed initiative focuses on areas of greatest need
The proposed Ending the HIV Epidemic initiative, if it is funded, will target the locations of greatest need throughout the country. Its initial focus will be on 50 areas that account for more than half of new HIV diagnoses, including 48 counties; San Juan, Puerto Rico; and Washington, D.C. It also will direct resources to seven states with high rates of infection in rural areas. In a second phase, the initiative will expand nationwide, provided that additional resources are made available.
The proposed initiative relies on four science-based strategies. First, it will aim to diagnose all Americans with HIV (at least 95% of HIV infections) as early as possible. Second, the initiative will enable people with HIV to receive treatment rapidly and effectively. The CDC’s target is to achieve viral suppression in at least 95% of people with diagnosed HIV. Third, the initiative will use proven interventions such as PrEP and syringe services programs to prevent new HIV transmissions. One related goal is for at least 50% of people who could benefit from PrEP to receive a prescription. Finally, the initiative is intended to respond quickly to potential HIV outbreaks and provide prevention and treatment to those who need them.
The U.S. Department of Health & Human Services already has taken steps to enable the initiative to be implemented quickly if it is funded in 2020. The department has provided funding to Baltimore City, Md.; DeKalb County, Ga.; and East Baton Rouge Parish, La. to begin pursuing parts of the initiative. These communities are encouraged to share the lessons of their experiences with other communities. HHS also has supported local efforts to develop plans under the initiative in all priority geographic areas. These plans draw upon recommendations from the community, HIV-planning bodies, and health care providers.
“Ending the HIV epidemic would be one of the greatest public health triumphs in our nation’s history,” said Dr. McCray.
SOURCES: Centers for Disease Control and Prevention. CDC Vital Signs. 2019 Dec 3. and Harris NS et al. MMWR Morb Mortal Wkly Rep. 2019 Dec 3.
, according to a Vital Signs report published by the Centers for Disease Control and Prevention based upon a simultaneous MMWR Early Release. The report indicates that many Americans with HIV are not aware of their status or are not receiving effective treatment. Furthermore, the data suggest that few Americans who could benefit from preexposure prophylaxis (PrEP), a daily pill that prevents HIV, are receiving it.
The report “shows that HIV testing, treatment, and prevention have not reached enough Americans, and it emphasizes the continued urgent need to increase these interventions,” said Jay C. Butler, MD, deputy director for infectious diseases at the CDC, at a press conference. “We made a lot of progress in the late ’90s and into the early part of the 21st century in reducing the number of new cases of HIV. But HIV prevention progress has stalled in America since 2013. This stalling underscores the need to increase resources, deploy new technologies, and build expertise, particularly in areas where they’re needed most.”
To achieve these objectives, the CDC has proposed a federal initiative called Ending the HIV Epidemic: A Plan for America. The goal of the initiative is to reduce new HIV infections by 90% by 2030, in part by expanding access to PrEP medications.
Data suggest shortcomings in diagnosis, treatment, and prevention
In its review of data on HIV testing and treatment in 2017, the Vital Signs report found that approximately 154,000 people with HIV (that is, 14% of the total population with HIV) were unaware that they had the virus. These patients consequently could not take advantage of HIV treatment to maintain health, control the virus, and prevent HIV transmission. Young people aged 13-24 years were less likely to know their HIV status than did those aged 25 years and older, according to the report.
Furthermore, approximately two-thirds (63%) of patients who knew that they had HIV had the virus under control through effective treatment. Young people and African Americans were least likely to have the virus under control, according to the report.
The report also examines data about treatment with PrEP in 2018. About 1.2 million Americans could benefit from PrEP, but only 219,700 (18%) of them had received a prescription for the drug. The eligible groups with the lowest rates of coverage were young people, African Americans, and Latinos.
The report presents a conservative estimate of PrEP coverage, however. Researchers examined data from 92% of prescriptions from retail pharmacies in the United States but did not include prescriptions from closed health care systems such as managed care organizations and military health plans. PrEP coverage in 2018 likely was higher than these estimates indicate, according to the CDC.
“There has been a rapid increase in the number of people taking PrEP over the past 3 years, but there is no doubt that PrEP uptake is too low,” said Eugene McCray, MD, director of CDC’s division of HIV/AIDS prevention. “We are working hard to increase access to PrEP, especially among gay and bisexual men, women, transgender people, young people, African Americans, and Latinos.”
The rate of new HIV infections has not decreased, but remained stable, according to the report. The CDC estimates that there were about 38,000 new infections per year from 2013 to 2017.
Proposed initiative focuses on areas of greatest need
The proposed Ending the HIV Epidemic initiative, if it is funded, will target the locations of greatest need throughout the country. Its initial focus will be on 50 areas that account for more than half of new HIV diagnoses, including 48 counties; San Juan, Puerto Rico; and Washington, D.C. It also will direct resources to seven states with high rates of infection in rural areas. In a second phase, the initiative will expand nationwide, provided that additional resources are made available.
The proposed initiative relies on four science-based strategies. First, it will aim to diagnose all Americans with HIV (at least 95% of HIV infections) as early as possible. Second, the initiative will enable people with HIV to receive treatment rapidly and effectively. The CDC’s target is to achieve viral suppression in at least 95% of people with diagnosed HIV. Third, the initiative will use proven interventions such as PrEP and syringe services programs to prevent new HIV transmissions. One related goal is for at least 50% of people who could benefit from PrEP to receive a prescription. Finally, the initiative is intended to respond quickly to potential HIV outbreaks and provide prevention and treatment to those who need them.
The U.S. Department of Health & Human Services already has taken steps to enable the initiative to be implemented quickly if it is funded in 2020. The department has provided funding to Baltimore City, Md.; DeKalb County, Ga.; and East Baton Rouge Parish, La. to begin pursuing parts of the initiative. These communities are encouraged to share the lessons of their experiences with other communities. HHS also has supported local efforts to develop plans under the initiative in all priority geographic areas. These plans draw upon recommendations from the community, HIV-planning bodies, and health care providers.
“Ending the HIV epidemic would be one of the greatest public health triumphs in our nation’s history,” said Dr. McCray.
SOURCES: Centers for Disease Control and Prevention. CDC Vital Signs. 2019 Dec 3. and Harris NS et al. MMWR Morb Mortal Wkly Rep. 2019 Dec 3.
FROM THE CDC
Early colonoscopy for acute lower GI bleeding fails to improve diagnostic yield or reduce rebleeding rate
While generally recommended for diagnosis and treatment of severe bleeding, early colonoscopy did not improve stigmata identification or reduce rebleeding rates in patients admitted for acute lower gastrointestinal bleeding in a relatively large, multicenter randomized trial, investigators report.
The proportion of patients with identified stigmata of recent hemorrhage (SRH) was not statistically significantly different between groups of patients who had early colonoscopy versus those who had a procedure 24 hours or more after admission, according to results of the 170-patient randomized study.
Although rebleeding rate was only a secondary endpoint, a larger study would be “unlikely to show a benefit” of the urgent approach, said investigators led by Ryota Niikura, MD, PhD, of the department of gastroenterology in the graduate school of medicine at the University of Tokyo.
“Our results for rebleeding suggested that early colonoscopy does not improve rebleeding outcomes, even if we chose rebleeding as the primary outcome,” Dr. Niikura and colleagues said in a discussion of the results, which appear in Gastroenterology.
Leading up to this trial, there was “controversy” over whether early colonoscopy could improve significant clinical outcomes such as rebleeding, transfusion need, and mortality, according to the authors, who said this is the largest of four randomized, controlled trials reported on the subject to date, and the first multicenter trial among that group.
One of those randomized studies, reported by Green and colleagues in the American Journal of Gastroenterology in 2005, found no differences in mortality, hospital stay, intensive care unit stay, transfusion requirements, rebleeding, or surgery for urgent colonoscopy versus care provided according to a standard algorithm.
Similarly, Laine and Shah said urgent colonoscopy had no edge over routine elective colonoscopy in terms of clinical outcomes or lowering costs, in a randomized study reported in 2010, also in the American Journal of Gastroenterology.
In September 2019, van Rongen and colleagues reported results of the BLEED study of early versus standard colonoscopy. Length of hospital stay was significantly shorter among patients randomized to the urgent approach; however, the rate of recurrent bleeding and hospital readmission was significantly higher in that group, according to results published in the Journal of Clinical Gastroenterology.
Two out of three of the previous randomized trials also showed no improvement in diagnostic yield with early colonoscopy, though “some meta-analyses” do suggest such a benefit, Dr. Niikura and coauthors said.
The latest reported randomized trial by Dr. Niikura and coinvestigators included patients 20 years of age or older who had moderate to severe hematochezia or melena within 24 hours of admission. A total of 162 adult patients at 15 hospitals in Japan were randomized to undergo early colonoscopy within 24 hours, or elective colonoscopy between 24 and 72 hours.
The primary outcome, identification of SRH, was not significantly different for the early versus later colonoscopy. Investigators said SRH was observed in 17 of 79 patients undergoing early colonoscopy or 21.5%, and in 17 of 80 patients in the elective colonoscopy group, or 21.3% (P = .967).
Similar rates of SRH between early and elective colonoscopy is a finding “in line” with the two of three previous randomized trials that found no increase in diagnostic yield, Dr. Niikura and coinvestigators noted in their report.
Rebleeding within 30 days, the “key secondary outcome” of the study according to investigators, was seen in 11 of 72 patients in the early colonoscopy group, or 15.3%, and in 5 of 75 patients in the elective colonoscopy group, or 6.7%, for a difference of 8.6 percentage points (95% confidence interval, –1.4 to 18.7).
Taken together, these findings suggest that early colonoscopy did not improve the SRH identification rate and that the 30-day rebleeding rate was not different, the authors said in a discussion of the results.
“Guidelines and prior studies often recommend that early colonoscopy be performed within 8-24 hours of admission to increase diagnostic yield and the likelihood of a therapeutic intervention,” they added in their discussion.
Dr. Niikura and coauthors acknowledged receiving grant funding from the Japanese Gastroenterological Association. Study coauthor Mitsuhiro Fujishiro, MD, PhD, reported disclosures related to Takeda, AstraZeneca, Zeria, Daiichi-Sankyo, and EA Pharma. The remaining authors did not declare competing interests.
SOURCE: Niikura R et al. Gastroenterology. 2019. doi: 10.1053/j.gastro.2019.09.010.
When to perform colonoscopy for the evaluation of acute lower gastrointestinal bleeding (LGIB) is controversial. Multiple observational studies, three small, single center randomized controlled trials, and several meta-analyses have produced mixed results. Therefore, a large, multicenter trial is of high priority.

Overall, the results suggest that in most patients presenting with acute LGIB, we do not need to perform colonoscopy within 24 hours of admission. However, the mean time to colonoscopy in the elective group was 41 hours from presentation. Therefore, colonoscopy should be performed on a next available basis. Further delays add unnecessary hospital days and increase cost of care. Future studies are needed to identify alternative ways to improve outcomes in LGIB, define the management of unstable patients with acute LGIB, and perfect the approach to endoscopic hemostasis in the colon.
Lisa L. Strate, MD, is professor of medicine, University of Washington, and section chief, gastroenterology, Harborview Medical Center, Seattle.
When to perform colonoscopy for the evaluation of acute lower gastrointestinal bleeding (LGIB) is controversial. Multiple observational studies, three small, single center randomized controlled trials, and several meta-analyses have produced mixed results. Therefore, a large, multicenter trial is of high priority.
Overall, the results suggest that in most patients presenting with acute LGIB, we do not need to perform colonoscopy within 24 hours of admission. However, the mean time to colonoscopy in the elective group was 41 hours from presentation. Therefore, colonoscopy should be performed on a next available basis. Further delays add unnecessary hospital days and increase cost of care. Future studies are needed to identify alternative ways to improve outcomes in LGIB, define the management of unstable patients with acute LGIB, and perfect the approach to endoscopic hemostasis in the colon.
Lisa L. Strate, MD, is professor of medicine, University of Washington, and section chief, gastroenterology, Harborview Medical Center, Seattle.
While generally recommended for diagnosis and treatment of severe bleeding, early colonoscopy did not improve stigmata identification or reduce rebleeding rates in patients admitted for acute lower gastrointestinal bleeding in a relatively large, multicenter randomized trial, investigators report.
The proportion of patients with identified stigmata of recent hemorrhage (SRH) was not statistically significantly different between groups of patients who had early colonoscopy versus those who had a procedure 24 hours or more after admission, according to results of the 170-patient randomized study.
Although rebleeding rate was only a secondary endpoint, a larger study would be “unlikely to show a benefit” of the urgent approach, said investigators led by Ryota Niikura, MD, PhD, of the department of gastroenterology in the graduate school of medicine at the University of Tokyo.
“Our results for rebleeding suggested that early colonoscopy does not improve rebleeding outcomes, even if we chose rebleeding as the primary outcome,” Dr. Niikura and colleagues said in a discussion of the results, which appear in Gastroenterology.
Leading up to this trial, there was “controversy” over whether early colonoscopy could improve significant clinical outcomes such as rebleeding, transfusion need, and mortality, according to the authors, who said this is the largest of four randomized, controlled trials reported on the subject to date, and the first multicenter trial among that group.
One of those randomized studies, reported by Green and colleagues in the American Journal of Gastroenterology in 2005, found no differences in mortality, hospital stay, intensive care unit stay, transfusion requirements, rebleeding, or surgery for urgent colonoscopy versus care provided according to a standard algorithm.
Similarly, Laine and Shah said urgent colonoscopy had no edge over routine elective colonoscopy in terms of clinical outcomes or lowering costs, in a randomized study reported in 2010, also in the American Journal of Gastroenterology.
In September 2019, van Rongen and colleagues reported results of the BLEED study of early versus standard colonoscopy. Length of hospital stay was significantly shorter among patients randomized to the urgent approach; however, the rate of recurrent bleeding and hospital readmission was significantly higher in that group, according to results published in the Journal of Clinical Gastroenterology.
Two out of three of the previous randomized trials also showed no improvement in diagnostic yield with early colonoscopy, though “some meta-analyses” do suggest such a benefit, Dr. Niikura and coauthors said.
The latest reported randomized trial by Dr. Niikura and coinvestigators included patients 20 years of age or older who had moderate to severe hematochezia or melena within 24 hours of admission. A total of 162 adult patients at 15 hospitals in Japan were randomized to undergo early colonoscopy within 24 hours, or elective colonoscopy between 24 and 72 hours.
The primary outcome, identification of SRH, was not significantly different for the early versus later colonoscopy. Investigators said SRH was observed in 17 of 79 patients undergoing early colonoscopy or 21.5%, and in 17 of 80 patients in the elective colonoscopy group, or 21.3% (P = .967).
Similar rates of SRH between early and elective colonoscopy is a finding “in line” with the two of three previous randomized trials that found no increase in diagnostic yield, Dr. Niikura and coinvestigators noted in their report.
Rebleeding within 30 days, the “key secondary outcome” of the study according to investigators, was seen in 11 of 72 patients in the early colonoscopy group, or 15.3%, and in 5 of 75 patients in the elective colonoscopy group, or 6.7%, for a difference of 8.6 percentage points (95% confidence interval, –1.4 to 18.7).
Taken together, these findings suggest that early colonoscopy did not improve the SRH identification rate and that the 30-day rebleeding rate was not different, the authors said in a discussion of the results.
“Guidelines and prior studies often recommend that early colonoscopy be performed within 8-24 hours of admission to increase diagnostic yield and the likelihood of a therapeutic intervention,” they added in their discussion.
Dr. Niikura and coauthors acknowledged receiving grant funding from the Japanese Gastroenterological Association. Study coauthor Mitsuhiro Fujishiro, MD, PhD, reported disclosures related to Takeda, AstraZeneca, Zeria, Daiichi-Sankyo, and EA Pharma. The remaining authors did not declare competing interests.
SOURCE: Niikura R et al. Gastroenterology. 2019. doi: 10.1053/j.gastro.2019.09.010.
FROM GASTROENTEROLOGY