User login
Nearly one in five U.S. adolescents have prediabetes
with a higher prevalence among males, a study has found.

Linda J. Andes, PhD, from the Centers for Disease Control and Prevention and coauthors reported in JAMA Pediatrics their analysis of data from 2,606 adolescent (12-18 years) and 3,180 young adult (19-34 years) participants in the 2005-2016 National Health and Nutrition Examination Surveys.
This found that the percentage with prediabetes – defined as either impaired fasting glucose (IFG), impaired glucose tolerance (IGT) or increased hemoglobin A1c (HbA1c) level – was 18% among adolescents and 24% among young adults.
The most common condition was IFG, which was seen in 11% of adolescents and 16% of young adults. The rate of IGT was 4% in adolescents and 6% of young adults, while elevated HbA1c levels were seen in 5% of adolescents and 8% of young adults.
This information is important because “In adults, these three phenotypes increase the risk of developing type 2 diabetes as well as cardiovascular diseases,” Dr. Andes and coauthors wrote. “In 2011-2012, the overall prevalence of prediabetes among U.S. adults, defined as the presence of any of the three glucose metabolism dysregulation phenotypes, was 38% and it increased to about 50% in persons 65 years and older.”
Dr. Andes and associates noted that isolated IFG was the most common glucose dysregulation seen in both adolescents and young adults. “While individuals with IFG are at increased risk for type 2 diabetes, few primary prevention trials have included individuals selected for the presence of IFG and none have been conducted in adolescents with IFG or IGT to our knowledge.”
The study saw some key gender differences in prevalence. For example, the prevalence of IFG was significantly lower in adolescent girls than in boys (7% vs. 15%; P less than .001), and in young women, compared with young men (10% vs. 22%; P less than .001).
“These findings are consistent with those of other studies in adults; however, the underlying mechanisms for explaining this discrepancy are still unclear,” Dr. Andes and coauthors wrote.
Ethnicity also appeared to influence risk, with the prevalence of IFG significantly lower in non-Hispanic black adolescents, compared with Hispanic adolescents. However, increased HbA1c levels were significantly more prevalent in non-Hispanic black adolescents, compared with Hispanic or non-Hispanic white adolescents.
“These findings highlight the need for additional studies on the long-term consequences and preventive strategies of abnormal glucose metabolism as measured by HbA1c levels in adolescents and young adults, especially of minority racial/ethnic groups,” the authors wrote.
Adolescents with prediabetes had significantly higher systolic blood pressure, non-HDL cholesterol, waist-to-height ratio, higher body mass index, and lower insulin sensitivity, compared with those with normal glucose tolerance. Among young adults with prediabetes, there was significantly higher systolic blood pressure and non-HDL cholesterol, compared with individuals with normal glucose tolerance.
No funding or conflicts of interest were declared.
SOURCE: Andes LJ et al. JAMA Pediatr. 2019 Dec 2. doi: 10.1001/jamapediatrics.2019.4498.
with a higher prevalence among males, a study has found.
Linda J. Andes, PhD, from the Centers for Disease Control and Prevention and coauthors reported in JAMA Pediatrics their analysis of data from 2,606 adolescent (12-18 years) and 3,180 young adult (19-34 years) participants in the 2005-2016 National Health and Nutrition Examination Surveys.
This found that the percentage with prediabetes – defined as either impaired fasting glucose (IFG), impaired glucose tolerance (IGT) or increased hemoglobin A1c (HbA1c) level – was 18% among adolescents and 24% among young adults.
The most common condition was IFG, which was seen in 11% of adolescents and 16% of young adults. The rate of IGT was 4% in adolescents and 6% of young adults, while elevated HbA1c levels were seen in 5% of adolescents and 8% of young adults.
This information is important because “In adults, these three phenotypes increase the risk of developing type 2 diabetes as well as cardiovascular diseases,” Dr. Andes and coauthors wrote. “In 2011-2012, the overall prevalence of prediabetes among U.S. adults, defined as the presence of any of the three glucose metabolism dysregulation phenotypes, was 38% and it increased to about 50% in persons 65 years and older.”
Dr. Andes and associates noted that isolated IFG was the most common glucose dysregulation seen in both adolescents and young adults. “While individuals with IFG are at increased risk for type 2 diabetes, few primary prevention trials have included individuals selected for the presence of IFG and none have been conducted in adolescents with IFG or IGT to our knowledge.”
The study saw some key gender differences in prevalence. For example, the prevalence of IFG was significantly lower in adolescent girls than in boys (7% vs. 15%; P less than .001), and in young women, compared with young men (10% vs. 22%; P less than .001).
“These findings are consistent with those of other studies in adults; however, the underlying mechanisms for explaining this discrepancy are still unclear,” Dr. Andes and coauthors wrote.
Ethnicity also appeared to influence risk, with the prevalence of IFG significantly lower in non-Hispanic black adolescents, compared with Hispanic adolescents. However, increased HbA1c levels were significantly more prevalent in non-Hispanic black adolescents, compared with Hispanic or non-Hispanic white adolescents.
“These findings highlight the need for additional studies on the long-term consequences and preventive strategies of abnormal glucose metabolism as measured by HbA1c levels in adolescents and young adults, especially of minority racial/ethnic groups,” the authors wrote.
Adolescents with prediabetes had significantly higher systolic blood pressure, non-HDL cholesterol, waist-to-height ratio, higher body mass index, and lower insulin sensitivity, compared with those with normal glucose tolerance. Among young adults with prediabetes, there was significantly higher systolic blood pressure and non-HDL cholesterol, compared with individuals with normal glucose tolerance.
No funding or conflicts of interest were declared.
SOURCE: Andes LJ et al. JAMA Pediatr. 2019 Dec 2. doi: 10.1001/jamapediatrics.2019.4498.
FROM JAMA PEDIATRICS
Endoscopy-related occupational injuries run rampant in gastroenterology
SAN ANTONIO – Swati Pawa, MD, reported at the annual meeting of the American College of Gastroenterology.

Moreover, most respondents said they received zero training in ergonomic strategies for endoscopy-related injury (ERI) prevention during their fellowship training. And there’s been none since. Eighty-one percent of respondents indicated they would welcome such training, added Dr. Pawa, a gastroenterologist at Wake Forest University, Winston-Salem, N.C.
The survey results expose a glaring unmet need in clinical practice, she said: “There have been no published guidelines from any of the major professional GI societies to date addressing how to prevent endoscopy-related injuries.”
The 38-item survey was created by the ACG Women in GI Committee and sponsored by the ACG governing board.
Among the key findings was the identification of sex differences in the types of ERIs reported, which suggests different contributory mechanisms. For example, female gastroenterologists were more likely than were their male colleagues to have experienced ERIs involving the upper back, by a margin of 49% to 36%. Upper extremity pain was more common among the women, too, with 63% reporting hand or finger pain, compared with 53% of men. Twenty-four percent of women reported carpal tunnel syndrome and an equal percentage developed tendonitis, compared with 18% and 17% of men, respectively.
Seventy-one percent of women attributed their ERI to torquing with their right hand, as did 63% of men. Women also more frequently cited having to deal with a nonadjustable bed or monitor as contributing to injury. In contrast, roughly twice as many men as women attributed their ERI to wearing a lead apron or use of the elevator on the duodenoscope.
Equally common causes of ERIs in men and women included standing in awkward positions while supporting an endoscope, standing for a long time, and adjusting tip angulation with the left hand.
Male and female gastroenterologists differed in their practice patterns. The men had been performing endoscopy for a mean of 23 years, compared with 13 years for the women. Fifty-six percent of the men were in private practice, compared with 35% of the women. In contrast, 43% of the women worked in academic settings versus 28% of the men. Thirty percent of the male gastroenterologists characterized themselves as interventional specialists, a rate more than twice that in women, who more commonly specialized in inflammatory bowel disease.
The survey was sent to nearly 16,000 ACG members. It generated a 14% response rate. Roughly two-thirds of responses were provided by male gastroenterologists.
Dr. Pawa and her coinvestigators are now drilling down through the survey data in an effort to identify an appropriate endoscopy workload limit that’s associated with reduced ERI risk.
One audience member commented, “The incidence of ERI in your survey is much higher than most of us would expect.” He speculated that response bias might be at work, with gastroenterologists who have personally experienced an ERI being perhaps more highly motivated to be among the 14% who completed the 38-question survey. Dr. Pawa replied that the survey figures are in line with other, smaller studies.
She reported having no financial conflicts regarding her study.
SAN ANTONIO – Swati Pawa, MD, reported at the annual meeting of the American College of Gastroenterology.
Moreover, most respondents said they received zero training in ergonomic strategies for endoscopy-related injury (ERI) prevention during their fellowship training. And there’s been none since. Eighty-one percent of respondents indicated they would welcome such training, added Dr. Pawa, a gastroenterologist at Wake Forest University, Winston-Salem, N.C.
The survey results expose a glaring unmet need in clinical practice, she said: “There have been no published guidelines from any of the major professional GI societies to date addressing how to prevent endoscopy-related injuries.”
The 38-item survey was created by the ACG Women in GI Committee and sponsored by the ACG governing board.
Among the key findings was the identification of sex differences in the types of ERIs reported, which suggests different contributory mechanisms. For example, female gastroenterologists were more likely than were their male colleagues to have experienced ERIs involving the upper back, by a margin of 49% to 36%. Upper extremity pain was more common among the women, too, with 63% reporting hand or finger pain, compared with 53% of men. Twenty-four percent of women reported carpal tunnel syndrome and an equal percentage developed tendonitis, compared with 18% and 17% of men, respectively.
Seventy-one percent of women attributed their ERI to torquing with their right hand, as did 63% of men. Women also more frequently cited having to deal with a nonadjustable bed or monitor as contributing to injury. In contrast, roughly twice as many men as women attributed their ERI to wearing a lead apron or use of the elevator on the duodenoscope.
Equally common causes of ERIs in men and women included standing in awkward positions while supporting an endoscope, standing for a long time, and adjusting tip angulation with the left hand.
Male and female gastroenterologists differed in their practice patterns. The men had been performing endoscopy for a mean of 23 years, compared with 13 years for the women. Fifty-six percent of the men were in private practice, compared with 35% of the women. In contrast, 43% of the women worked in academic settings versus 28% of the men. Thirty percent of the male gastroenterologists characterized themselves as interventional specialists, a rate more than twice that in women, who more commonly specialized in inflammatory bowel disease.
The survey was sent to nearly 16,000 ACG members. It generated a 14% response rate. Roughly two-thirds of responses were provided by male gastroenterologists.
Dr. Pawa and her coinvestigators are now drilling down through the survey data in an effort to identify an appropriate endoscopy workload limit that’s associated with reduced ERI risk.
One audience member commented, “The incidence of ERI in your survey is much higher than most of us would expect.” He speculated that response bias might be at work, with gastroenterologists who have personally experienced an ERI being perhaps more highly motivated to be among the 14% who completed the 38-question survey. Dr. Pawa replied that the survey figures are in line with other, smaller studies.
She reported having no financial conflicts regarding her study.
REPORTING FROM ACG 2019
Higher risk of bipolar disorder, depression, anxiety found with autism
Individuals with autism spectrum disorder might be at significantly higher risk of bipolar disorder, anxiety, and depression, a new study suggests.
and associates. The report was published in JAMA Pediatrics.
Dr. Kirsch and associates reported the outcomes of a population-based cohort study involving 1,014 individuals with autism spectrum disorder and 2,028 age-and sex-matched controls without autism spectrum disorder. They found that individuals with autism spectrum disorder were more than nine times more likely to be diagnosed with bipolar disorder, 2.81 times more likely to be diagnosed with depression, and 3.45 times more likely to be diagnosed with anxiety, compared with controls.
“Significant psychosocial sequelae associated with having ASD, including difficulties developing and maintaining relationships, challenges succeeding academically and vocationally, and behaviors that can be problematic to manage, particularly increase risk for mood and anxiety symptoms in individuals with ASD,” wrote Dr. Kirsch of the department of psychiatry and psychology at the Mayo Clinic, Rochester, Minn., and associates. “Individuals with ASD also experience greater rates of other mental health challenges, including attention-deficit/hyperactivity disorder and substance abuse.”
Individuals with autism spectrum disorder who received a diagnosis of depression, anxiety, or bipolar disorder also were more likely to be diagnosed at a younger age than were those without autism. In the case of depression, the median age of diagnosis was 15.7 years, compared with 18.1 years among controls. For anxiety, the median age of diagnosis among individuals with autism spectrum disorder was 15.2 years, compared with 20.3 years for controls. For bipolar disorder, it was 20.3 years, compared with 27 years although the small number of individuals meant this was not statistically significant.
The authors suggested that the earlier age at diagnosis might reflect that individuals with autism spectrum disorder generally are monitored more closely, and are more likely to be connected to screening and diagnostic resources because of their original diagnosis.
The researchers also found that the increased risk of depression and anxiety was even higher among men with autism spectrum disorder, even though the cumulative incidence of these conditions was greater in women both with and without autism. In addition, the researchers noted that individuals with autism spectrum disorder were more likely to be diagnosed with multiple psychiatric conditions than were those without autism.
Dr. Kirsch and associates cited several limitations. One is that the population studied came from Olmsted County, Minn., which is wealthier and less diverse than the general population. Nevertheless, the results could help guide treatments for patients with ASD.
“Given the high rates of comorbidity, researchers and practitioners should develop tools that are specific to the unique needs of this population and effective medications and treatments for mood and anxiety concerns, which remain limited in this population,” they wrote.
The study was funded by grants from the National Institutes of Health and the U.S. Public Health Service. No conflicts of interest were disclosed.
SOURCE: Kirsch A et al. JAMA Pediatr. 2019 Dec 2. doi: 10.1001/jamapediatrics.2019.4368.
FROM JAMA PEDIATRICS
Retained placenta after vaginal birth: How long should you wait to manually remove the placenta?
You have just safely delivered the baby who is quietly resting on her mother’s chest. You begin active management of the third stage of labor, administering oxytocin, performing uterine massage and applying controlled tension on the umbilical cord. There is no evidence of excess postpartum bleeding.
How long will you wait to deliver the placenta?
Active management of the third stage of labor
Most authorities recommend active management of the third stage of labor because active management reduces the risk of maternal hemorrhage >1,000 mL (relative risk [RR], 0.34), postpartum hemoglobin levels < 9 g/dL (RR, 0.50), and maternal blood transfusion (RR, 0.35) compared with expectant management.1
The most important component of active management of the third stage of labor is the administration of a uterotonic after delivery of the newborn. In the United States, oxytocin is the uterotonic most often utilized for the active management of the third stage of labor. Authors of a recent randomized clinical trial reported that intravenous oxytocin is superior to intramuscular oxytocin for reducing postpartum blood loss (385 vs 445 mL), the frequency of blood loss greater than 1,000 mL (4.6% vs 8.1%), and the rate of maternal blood transfusion (1.5% vs 4.4%).2
In addition to administering oxytocin, the active management of the third stage often involves maneuvers to accelerate placental delivery, including the Crede and Brandt-Andrews maneuvers and controlled tension on the umbilical cord. The Crede maneuver, described in 1853, involves placing a hand on the abdominal wall near the uterine fundus and squeezing the uterine fundus between the thumb and fingers.3,4
The Brandt-Andrews maneuver, described in 1933, involves placing a clamp on the umbilical cord close to the vulva.5 The clamp is used to apply judicious tension on the cord with one hand, while the other hand is placed on the mother’s abdomen with the palm and fingers overlying the junction between the uterine corpus and the lower segment. With judicious tension on the cord, the abdominal hand pushes the uterus upward toward the umbilicus. Placental separation is indicated when lengthening of the umbilical cord occurs. The Brandt-Andrews maneuver may be associated with fewer cases of uterine inversion than the Crede maneuver.5-7
Of note, umbilical cord traction has not been demonstrated to reduce the need for blood transfusion or the incidence of postpartum hemorrhage (PPH) >1,000 mL, and it is commonly utilized by obstetricians and midwives.8,9 Hence, in the third stage, the delivering clinician should routinely administer a uterotonic, but use of judicious tension on the cord can be deferred if the woman prefers a noninterventional approach to delivery.
Following a vaginal birth, when should the diagnosis of retained placenta be made?
The historic definition of retained placenta is nonexpulsion of the placenta 30 minutes after delivery of the newborn. However, many observational studies report that, when active management of the third stage is utilized, 90%, 95%, and 99% of placentas deliver by 9 minutes, 13 minutes, and 28 minutes, respectively.10 In addition, many observational studies report that the incidence of PPH increases significantly with longer intervals between birth of the newborn and delivery of the placenta. In one study the rate of blood loss >500 mL was 8.5% when the placenta delivered between 5 and 9 minutes and 35.1% when the placenta delivered ≥30 minutes following birth of the baby.10 In another observational study, compared with women delivering the placenta < 10 minutes after birth, women delivering the placenta ≥30 minutes after birth had a 3-fold increased risk of PPH.11 Similar findings have been reported in other studies.12-14
Continue to: Based on the association between a delay in delivery...
Based on the association between a delay in delivery of the placenta and an increased risk of PPH, some authorities recommend that, in term pregnancy, the diagnosis of retained placenta should be made at 20 minutes following birth and consideration should be given to removing the placenta at this time. For women with effective neuraxial anesthesia, manual removal of the placenta 20 minutes following birth may be the best decision for balancing the benefit of preventing PPH with the risk of unnecessary intervention. For women with no anesthesia, delaying manual removal of the placenta to 30 minutes or more following birth may permit more time for the placenta to deliver prior to performing an intervention that might cause pain, but the delay increases the risk of PPH.
The retained placenta may prevent the uterine muscle from effectively contracting around penetrating veins and arteries, thereby increasing the risk of postpartum hemorrhage. The placenta that has separated from the uterine wall but is trapped inside the uterine cavity can be removed easily with manual extraction. If the placenta is physiologically adherent to the uterine wall, a gentle sweeping motion with an intrauterine hand usually can separate the placenta from the uterus in preparation for manual extraction. However, if a placenta accreta spectrum disorder is contributing to a retained placenta, it may be difficult to separate the densely adherent portion of the uterus from the uterine wall. In the presence of placenta accreta spectrum disorder, vigorous attempts to remove the placenta may precipitate massive bleeding. In some cases, the acchoucheur/midwife may recognize the presence of a focal accreta and cease attempts to remove the placenta in order to organize the personnel and equipment needed to effectively treat a potential case of placenta accreta. In one study, when a placenta accreta was recognized or suspected, immediately ceasing attempts at manually removing the placenta resulted in better case outcomes than continued attempts to remove the placenta.1
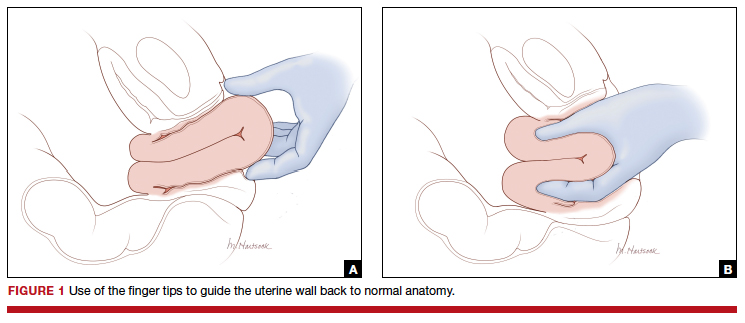
Uterine inversion may occur during an attempt to manually remove the placenta. There is universal agreement that once a uterine inversion is recognized it is critically important to immediately restore normal uterine anatomy to avoid massive hemorrhage and maternal shock. The initial management of uterine inversion includes:
- stopping oxytocin infusion
- initiating high volume fluid resuscitation
- considering a dose of a uterine relaxant, such as nitroglycerin or terbutaline
- preparing for blood product replacement.
In my experience, when uterine inversion is immediately recognized and successfully treated, blood product replacement is not usually necessary. However, if uterine inversion has not been immediately recognized or treated, massive hemorrhage and shock may occur.
Two approaches to the vaginal restoration of uterine anatomy involve using the tips of the fingers and palm of the hand to guide the wall of the uterus back to its normal position (FIGURE 1) or to forcefully use a fist to force the uterine wall back to its normal position (FIGURE 2). If these maneuvers are unsuccessful, a laparotomy may be necessary.

At laparotomy, the Huntington or Haultain procedures may help restore normal uterine anatomy. The Huntington procedure involves using clamps to apply symmetrical tension to the left and right round ligaments and/or uterine serosa to sequentially tease the uterus back to normal anatomy.2,3 The Haultain procedure involves a vertical incision on the posterior wall of the uterus to release the uterine constriction ring that is preventing the return of the uterine fundus to its normal position (FIGURE 3).4,5

References
- Kayem G, Anselem O, Schmitz T, et al. Conservative versus radical management in cases of placenta accreta: a historical study. J Gynecol Obstet Biol Reprod (Paris). 2007;36:680-687.
- Huntington JL. Acute inversion of the uterus. Boston Med Surg J. 1921;184:376-378.
- Huntington JL, Irving FC, Kellogg FS. Abdominal reposition in acute inversion of the puerperal uterus. Am J Obstet Gynecol. 1928;15:34-40.
- Haultain FW. Abdominal hysterotomy for chronic uterine inversion: a record of 3 cases. Proc Roy Soc Med. 1908;1:528-535.
- Easterday CL, Reid DE. Inversion of the puerperal uterus managed by the Haultain technique; A case report. Am J Obstet Gynecol. 1959;78:1224-1226.
Manual extraction of the placenta
Prior to performing manual extraction of the placenta, a decision should be made regarding the approach to anesthesia and perioperative antibiotics. Manual extraction of the placenta is performed by placing one hand on the uterine fundus to stabilize the uterus and using the other hand to follow the umbilical cord into the uterine cavity. The intrauterine hand is used to separate the uterine-placental interface with a gentle sweeping motion. The placental mass is grasped and gently teased through the cervix and vagina. Inspection of the placenta to ensure complete removal is necessary.
An alternative to manual extraction of the placenta is the use of Bierer forceps and ultrasound guidance to tease the placenta through the cervical os. This technique involves the following steps15:
1. use ultrasound to locate the placenta
2. place a ring forceps on the anterior lip of the cervix
3. introduce the Bierer forcep into the uterus
4. use the forceps to grasp the placenta and pull it toward the vagina
5. stop frequently to re-grasp placental tissue that is deeper in the uterine cavity
6. once the placenta is extracted, examine the placenta to ensure complete removal.
Of note when manual extraction is used to deliver a retained placenta, randomized clinical trials report no benefit for the following interventions:
- perioperative antibiotics16
- nitroglycerin to relax the uterus17
- ultrasound to detect retained placental tissue.18
Best timing for manual extraction of the placenta
The timing for the diagnosis of retained placenta, and the risks and benefits of manual extraction would be best evaluated in a large, randomized clinical trial. However, based on observational studies, in a term pregnancy, the diagnosis of retained placenta is best made using a 20-minute interval. In women with effective neuraxial anesthesia, consideration should be given to manual removal of the placenta at that time.
- Begley CM, Gyte GM, Devane D, et al. Active versus expectant management for women in the third stage of labor. Cochrane Database Syst Rev. 2019;2:CD007412.
- Adnan N, Conlan-Trant R, McCormick C, et al. Intramuscular versus intravenous oxytocin to prevent postpartum haemorrhage at vaginal delivery: randomized controlled trial. BMJ. 2018;362:k3546.
- Gülmezoglu AM, Souza JP. The evolving management of the third stage of labour. BJOG. 2009;116(suppl 1):26-28.
- Ebert AD, David M. Meilensteine der Praventionsmedizin. Carl Siegmund Franz Credé (1819-1882), der Credesche Handgriff und die Credesche Augenprophylaxe. Geburtshilfe Frauenheilkd. 2016;76:675-678.
- Brandt ML. The mechanism and management of the third stage of labor. Am J Obstet Gynecol. 1933;25:662-667.
- Kimbell N. Brandt-Andrews technique of delivery of the placenta. Br Med J. 1958;1:203-204.
- De Lee JB, Greenhill JP. Principles and Practice of Obstetrics. 9th ed. Philadelphia, PA: Saunders; 1947:275.
- Du Y, Ye M, Zheng F. Active management of the third stage of labor with and without controlled cord traction: a systematic review and meta-analysis of randomized controlled trials. Acta Obstet Gynecol Scand. 2014;93:626-633.
- Hofmeyr GJ, Mshweshwe NT, Gülmezoglu AM. Controlled cord traction for the third stage of labor. Cochrane Database Syst Rev. 2015;1:CD008020.
- Frolova AI, Stout MJ, Tuuli MG, et al. Duration of the third stage of labor and risk of postpartum hemorrhage. Obstet Gynecol. 2016;127:951-956.
- Shinar S, Schwartz A, Maslovitz S, et al. How long is safe? Setting the cutoff for uncomplicated third stage length: a retrospective case-control study. Birth. 2016;43:36-41.
- Magann EF, Evans S, Chauhan SP, et al. The length of the third stage of labor and the risk of postpartum hemorrhage. Obstet Gynecol. 2005;105:290-293.
- Cummings K, Doherty DA, Magann EF, et al. Timing of manual placenta removal to prevent postpartum hemorrhage: is it time to act? J Matern Fetal Neonatal Med. 2016;29:3930-3933.
- Rabie NZ, Ounpraseuth S, Hughes D, et al. Association of the length of the third stage of labor and blood loss following vaginal delivery. South Med J. 2018;111:178-182.
- Rosenstein MG, Vargas JE, Drey EA. Ultrasound-guided instrumental removal of the retained placenta after vaginal delivery. Am J Obstet Gynecol. 2014;211:180.e1-e3.
- Chibueze EC, Parsons AJ, Ota E, et al. Prophylactic antibiotics for manual removal of retained placenta during vaginal birth: a systematic review of observational studies and meta-analysis. BMC Pregnancy Childbirth. 2015;15:313.
- Abdel-Aleem H, Abdel-Aleem MA, Shaaban OM. Nitroglycerin for management of retained placenta. Cochrane Database Syst Rev. 2015;(11):CD007708.
- Weissback T, Haikin-Herzberger E, Bacci-Hugger K, et al. Immediate postpartum ultrasound evaluation for suspected retained placental tissue in patients undergoing manual removal of placenta. Eur J Obstet Gynecol Reprod Biol. 2015;192:37-40.

Robert L. Barbieri, MD
Editor in Chief, OBG MANAGEMENT
Chair, Obstetrics and Gynecology
Brigham and Women’s Hospital
Boston, Massachusetts
Kate Macy Ladd Professor of Obstetrics,
Gynecology and Reproductive Biology
Harvard Medical School
Dr. Barbieri reports no financial relationships relevant to this article.
You have just safely delivered the baby who is quietly resting on her mother’s chest. You begin active management of the third stage of labor, administering oxytocin, performing uterine massage and applying controlled tension on the umbilical cord. There is no evidence of excess postpartum bleeding.
How long will you wait to deliver the placenta?
Active management of the third stage of labor
Most authorities recommend active management of the third stage of labor because active management reduces the risk of maternal hemorrhage >1,000 mL (relative risk [RR], 0.34), postpartum hemoglobin levels < 9 g/dL (RR, 0.50), and maternal blood transfusion (RR, 0.35) compared with expectant management.1
The most important component of active management of the third stage of labor is the administration of a uterotonic after delivery of the newborn. In the United States, oxytocin is the uterotonic most often utilized for the active management of the third stage of labor. Authors of a recent randomized clinical trial reported that intravenous oxytocin is superior to intramuscular oxytocin for reducing postpartum blood loss (385 vs 445 mL), the frequency of blood loss greater than 1,000 mL (4.6% vs 8.1%), and the rate of maternal blood transfusion (1.5% vs 4.4%).2
In addition to administering oxytocin, the active management of the third stage often involves maneuvers to accelerate placental delivery, including the Crede and Brandt-Andrews maneuvers and controlled tension on the umbilical cord. The Crede maneuver, described in 1853, involves placing a hand on the abdominal wall near the uterine fundus and squeezing the uterine fundus between the thumb and fingers.3,4
The Brandt-Andrews maneuver, described in 1933, involves placing a clamp on the umbilical cord close to the vulva.5 The clamp is used to apply judicious tension on the cord with one hand, while the other hand is placed on the mother’s abdomen with the palm and fingers overlying the junction between the uterine corpus and the lower segment. With judicious tension on the cord, the abdominal hand pushes the uterus upward toward the umbilicus. Placental separation is indicated when lengthening of the umbilical cord occurs. The Brandt-Andrews maneuver may be associated with fewer cases of uterine inversion than the Crede maneuver.5-7
Of note, umbilical cord traction has not been demonstrated to reduce the need for blood transfusion or the incidence of postpartum hemorrhage (PPH) >1,000 mL, and it is commonly utilized by obstetricians and midwives.8,9 Hence, in the third stage, the delivering clinician should routinely administer a uterotonic, but use of judicious tension on the cord can be deferred if the woman prefers a noninterventional approach to delivery.
Following a vaginal birth, when should the diagnosis of retained placenta be made?
The historic definition of retained placenta is nonexpulsion of the placenta 30 minutes after delivery of the newborn. However, many observational studies report that, when active management of the third stage is utilized, 90%, 95%, and 99% of placentas deliver by 9 minutes, 13 minutes, and 28 minutes, respectively.10 In addition, many observational studies report that the incidence of PPH increases significantly with longer intervals between birth of the newborn and delivery of the placenta. In one study the rate of blood loss >500 mL was 8.5% when the placenta delivered between 5 and 9 minutes and 35.1% when the placenta delivered ≥30 minutes following birth of the baby.10 In another observational study, compared with women delivering the placenta < 10 minutes after birth, women delivering the placenta ≥30 minutes after birth had a 3-fold increased risk of PPH.11 Similar findings have been reported in other studies.12-14
Continue to: Based on the association between a delay in delivery...
Based on the association between a delay in delivery of the placenta and an increased risk of PPH, some authorities recommend that, in term pregnancy, the diagnosis of retained placenta should be made at 20 minutes following birth and consideration should be given to removing the placenta at this time. For women with effective neuraxial anesthesia, manual removal of the placenta 20 minutes following birth may be the best decision for balancing the benefit of preventing PPH with the risk of unnecessary intervention. For women with no anesthesia, delaying manual removal of the placenta to 30 minutes or more following birth may permit more time for the placenta to deliver prior to performing an intervention that might cause pain, but the delay increases the risk of PPH.
The retained placenta may prevent the uterine muscle from effectively contracting around penetrating veins and arteries, thereby increasing the risk of postpartum hemorrhage. The placenta that has separated from the uterine wall but is trapped inside the uterine cavity can be removed easily with manual extraction. If the placenta is physiologically adherent to the uterine wall, a gentle sweeping motion with an intrauterine hand usually can separate the placenta from the uterus in preparation for manual extraction. However, if a placenta accreta spectrum disorder is contributing to a retained placenta, it may be difficult to separate the densely adherent portion of the uterus from the uterine wall. In the presence of placenta accreta spectrum disorder, vigorous attempts to remove the placenta may precipitate massive bleeding. In some cases, the acchoucheur/midwife may recognize the presence of a focal accreta and cease attempts to remove the placenta in order to organize the personnel and equipment needed to effectively treat a potential case of placenta accreta. In one study, when a placenta accreta was recognized or suspected, immediately ceasing attempts at manually removing the placenta resulted in better case outcomes than continued attempts to remove the placenta.1
Uterine inversion may occur during an attempt to manually remove the placenta. There is universal agreement that once a uterine inversion is recognized it is critically important to immediately restore normal uterine anatomy to avoid massive hemorrhage and maternal shock. The initial management of uterine inversion includes:
- stopping oxytocin infusion
- initiating high volume fluid resuscitation
- considering a dose of a uterine relaxant, such as nitroglycerin or terbutaline
- preparing for blood product replacement.
In my experience, when uterine inversion is immediately recognized and successfully treated, blood product replacement is not usually necessary. However, if uterine inversion has not been immediately recognized or treated, massive hemorrhage and shock may occur.
Two approaches to the vaginal restoration of uterine anatomy involve using the tips of the fingers and palm of the hand to guide the wall of the uterus back to its normal position (FIGURE 1) or to forcefully use a fist to force the uterine wall back to its normal position (FIGURE 2). If these maneuvers are unsuccessful, a laparotomy may be necessary.
At laparotomy, the Huntington or Haultain procedures may help restore normal uterine anatomy. The Huntington procedure involves using clamps to apply symmetrical tension to the left and right round ligaments and/or uterine serosa to sequentially tease the uterus back to normal anatomy.2,3 The Haultain procedure involves a vertical incision on the posterior wall of the uterus to release the uterine constriction ring that is preventing the return of the uterine fundus to its normal position (FIGURE 3).4,5
References
- Kayem G, Anselem O, Schmitz T, et al. Conservative versus radical management in cases of placenta accreta: a historical study. J Gynecol Obstet Biol Reprod (Paris). 2007;36:680-687.
- Huntington JL. Acute inversion of the uterus. Boston Med Surg J. 1921;184:376-378.
- Huntington JL, Irving FC, Kellogg FS. Abdominal reposition in acute inversion of the puerperal uterus. Am J Obstet Gynecol. 1928;15:34-40.
- Haultain FW. Abdominal hysterotomy for chronic uterine inversion: a record of 3 cases. Proc Roy Soc Med. 1908;1:528-535.
- Easterday CL, Reid DE. Inversion of the puerperal uterus managed by the Haultain technique; A case report. Am J Obstet Gynecol. 1959;78:1224-1226.
Manual extraction of the placenta
Prior to performing manual extraction of the placenta, a decision should be made regarding the approach to anesthesia and perioperative antibiotics. Manual extraction of the placenta is performed by placing one hand on the uterine fundus to stabilize the uterus and using the other hand to follow the umbilical cord into the uterine cavity. The intrauterine hand is used to separate the uterine-placental interface with a gentle sweeping motion. The placental mass is grasped and gently teased through the cervix and vagina. Inspection of the placenta to ensure complete removal is necessary.
An alternative to manual extraction of the placenta is the use of Bierer forceps and ultrasound guidance to tease the placenta through the cervical os. This technique involves the following steps15:
1. use ultrasound to locate the placenta
2. place a ring forceps on the anterior lip of the cervix
3. introduce the Bierer forcep into the uterus
4. use the forceps to grasp the placenta and pull it toward the vagina
5. stop frequently to re-grasp placental tissue that is deeper in the uterine cavity
6. once the placenta is extracted, examine the placenta to ensure complete removal.
Of note when manual extraction is used to deliver a retained placenta, randomized clinical trials report no benefit for the following interventions:
- perioperative antibiotics16
- nitroglycerin to relax the uterus17
- ultrasound to detect retained placental tissue.18
Best timing for manual extraction of the placenta
The timing for the diagnosis of retained placenta, and the risks and benefits of manual extraction would be best evaluated in a large, randomized clinical trial. However, based on observational studies, in a term pregnancy, the diagnosis of retained placenta is best made using a 20-minute interval. In women with effective neuraxial anesthesia, consideration should be given to manual removal of the placenta at that time.
- Begley CM, Gyte GM, Devane D, et al. Active versus expectant management for women in the third stage of labor. Cochrane Database Syst Rev. 2019;2:CD007412.
- Adnan N, Conlan-Trant R, McCormick C, et al. Intramuscular versus intravenous oxytocin to prevent postpartum haemorrhage at vaginal delivery: randomized controlled trial. BMJ. 2018;362:k3546.
- Gülmezoglu AM, Souza JP. The evolving management of the third stage of labour. BJOG. 2009;116(suppl 1):26-28.
- Ebert AD, David M. Meilensteine der Praventionsmedizin. Carl Siegmund Franz Credé (1819-1882), der Credesche Handgriff und die Credesche Augenprophylaxe. Geburtshilfe Frauenheilkd. 2016;76:675-678.
- Brandt ML. The mechanism and management of the third stage of labor. Am J Obstet Gynecol. 1933;25:662-667.
- Kimbell N. Brandt-Andrews technique of delivery of the placenta. Br Med J. 1958;1:203-204.
- De Lee JB, Greenhill JP. Principles and Practice of Obstetrics. 9th ed. Philadelphia, PA: Saunders; 1947:275.
- Du Y, Ye M, Zheng F. Active management of the third stage of labor with and without controlled cord traction: a systematic review and meta-analysis of randomized controlled trials. Acta Obstet Gynecol Scand. 2014;93:626-633.
- Hofmeyr GJ, Mshweshwe NT, Gülmezoglu AM. Controlled cord traction for the third stage of labor. Cochrane Database Syst Rev. 2015;1:CD008020.
- Frolova AI, Stout MJ, Tuuli MG, et al. Duration of the third stage of labor and risk of postpartum hemorrhage. Obstet Gynecol. 2016;127:951-956.
- Shinar S, Schwartz A, Maslovitz S, et al. How long is safe? Setting the cutoff for uncomplicated third stage length: a retrospective case-control study. Birth. 2016;43:36-41.
- Magann EF, Evans S, Chauhan SP, et al. The length of the third stage of labor and the risk of postpartum hemorrhage. Obstet Gynecol. 2005;105:290-293.
- Cummings K, Doherty DA, Magann EF, et al. Timing of manual placenta removal to prevent postpartum hemorrhage: is it time to act? J Matern Fetal Neonatal Med. 2016;29:3930-3933.
- Rabie NZ, Ounpraseuth S, Hughes D, et al. Association of the length of the third stage of labor and blood loss following vaginal delivery. South Med J. 2018;111:178-182.
- Rosenstein MG, Vargas JE, Drey EA. Ultrasound-guided instrumental removal of the retained placenta after vaginal delivery. Am J Obstet Gynecol. 2014;211:180.e1-e3.
- Chibueze EC, Parsons AJ, Ota E, et al. Prophylactic antibiotics for manual removal of retained placenta during vaginal birth: a systematic review of observational studies and meta-analysis. BMC Pregnancy Childbirth. 2015;15:313.
- Abdel-Aleem H, Abdel-Aleem MA, Shaaban OM. Nitroglycerin for management of retained placenta. Cochrane Database Syst Rev. 2015;(11):CD007708.
- Weissback T, Haikin-Herzberger E, Bacci-Hugger K, et al. Immediate postpartum ultrasound evaluation for suspected retained placental tissue in patients undergoing manual removal of placenta. Eur J Obstet Gynecol Reprod Biol. 2015;192:37-40.

Preventing early-onset group B streptococcal disease in newborns
In 1992, the American College of Obstetricians and Gynecologists (ACOG) and the American Academy of Pediatrics (AAP) published their first joint guidelines on the prevention of early-onset neonatal group B streptococcal (GBS) infection.1 In this initial statement, the organizations recommended universal culturing of obstetric patients at 28 weeks’ gestation and treatment of colonized women during labor if they had a recognized risk factor for neonatal GBS infection.
In 1996, the Centers for Disease Control and Prevention (CDC) published its first set of official guidelines on the topic and suggested that both universal screening and a risk-factor–based approach were reasonable options.2 The 2002 update of the CDC guidelines strongly recommended universal screening of all pregnant women at 35 to 37 weeks’ gestation and intrapartum prophylaxis for all colonized women regardless of risk factors.3
The third set of CDC guidelines was published in 2010.4 The key features of this version were the elimination of erythromycin as an alternative to penicillin in patients who are allergic to beta-lactam antibiotics and the establishment of 4 hours as the critical interval for administration of prophylaxis prior to delivery. The 2010 publication was the last such report from the CDC. Since then ACOG and AAP have been tasked with providing updated practice guidelines. To that end, ACOG recently issued a new Committee Opinion on “Prevention of Group B Streptococcal Early-Onset Disease in Newborns.”5 Here we will highlight the key features of our current strategy for preventing neonatal GBS infection.
CASE Pregnant patient presents with many questions about GBS
A 26-year-old primigravid woman presents for her first prenatal appointment at 9 weeks’ gestation. Her older sister recently delivered a term infant that died in the first week of life from GBS sepsis. Understandably, she has many questions.
1. Your patient first wants to know, “What is this streptococcal organism and how likely am I to have this infection?”
Streptococcus agalactiae, also known as GBS, is a gram-positive encapsulated bacterium that produces beta hemolysis when grown on blood agar. Approximately 25% of pregnant women harbor this organism in the lower genital tract and/or rectum.6
GBS is one of the most important causes of neonatal infection, particularly in preterm infants. The frequency of infection is now 0.23 per 1,000 live births in the US.5
Neonatal infection can be divided into early-onset infection (occurring within the first 7 days of life) and late-onset infection (occurring from after the first week until the third month of life). Approximately 80% to 85% of cases of neonatal GBS infections are early in onset. Virtually all of the early-onset infections result from vertical transmission during delivery from a colonized mother to her infant.5-7
2. “How dangerous is this infection to my baby and me? Are there certain factors that increase the risk of my baby becoming infected?”
GBS is responsible for approximately 2% to 3% of cases of either asymptomatic bacteriuria or acute cystitis. Women with urinary tract infections caused by GBS are at increased risk for preterm premature rupture of membranes and preterm delivery. Genital tract colonization also increases a woman’s risk for chorioamnionitis and endometritis, particularly after cesarean delivery (CD). In addition, GBS can be part of the polymicrobial flora in women who have a wound (incisional site) infection following CD.6,7
Continue to: In colonized women, several risk factors...
In colonized women, several risk factors have been identified that increase the probability of early-onset neonatal GBS infection. These factors include: preterm labor, especially when complicated by premature rupture of membranes; intrapartum maternal fever (usually due to chorioamnionitis); rupture of membranes greater than 18 hours before delivery; previous delivery of an infected infant; young age; and black or Hispanic ethnicity. Approximately 25% of colonized women will have one of these risk factors.5-7
These risk factors have a profound impact on neonatal attack rates and mortality. Without the interventions outlined below, the neonatal infection rate is 40% to 50% in the presence of a risk factor and less than 5% in the absence of a risk factor. In infected infants, neonatal mortality approaches 30% to 35% when a maternal risk factor is present, but is less than 5% when risk factors are absent.5-7
3. “What will you do to determine if I am colonized with this organism?”
The current guidelines set forth in the ACOG Committee Opinion recommend that selected high-risk patients (patients with preterm labor or preterm premature rupture of membranes) be tested for GBS at the time of initial presentation. All other women should be tested for GBS during the interval 36 0/7 to 37 6/7 weeks’ gestation.5 Testing at this point in pregnancy is almost 90% sensitive for identifying patients who will be colonized at the time of admission for labor if no more than 5 weeks elapse between the time the culture is obtained and labor begins. The positive predictive value of this test is 87%, and the negative predictive value is 96%.8
ACOG’s previous guidelines provided for testing at 35 rather than 36 weeks. The change in the recommendations was based on 2 factors. First, all women with unknown GBS status who may deliver before 37 weeks already should be targeted for prophylaxis. Second, the new 5-week window now will include women who deliver up to 41 weeks’ gestation. Given current obstetric practice in the US, delivery beyond 41 weeks is unlikely.5
At the present time, the best test for identification of GBS colonization is bacteriologic culture. A cotton swab is placed into the lower third of the vagina, streaked along the perineum, and then placed into the rectum. The swab is withdrawn, placed in a culturette tube, and transported to the laboratory. In the laboratory, the swab is cultured for approximately 24 hours in a nutrient broth and then subcultured on a selective blood agar plate. Failure to sample both the vagina and rectum or failure to use selective broth and selective blood agar will reduce the yield of positive cultures by approximately 50%.5-7
In recent years, researchers have become interested in the use of rapid nucleic acid amplification tests for the identification of GBS. These tests perform well if the test protocol provides for an 18- to 24-hour incubation in nutrient broth prior to application of the nucleic acid probe. When the tests are performed without this enrichment phase, sensitivities are inferior to those associated with bacteriologic culture. In addition, because the rapid tests do not isolate the organisms, they do not allow for antibiotic sensitivity testing.5-7
Continue to: “If I test positive for GBS, how and when will you treat me?”...
4. “If I test positive for GBS, how and when will you treat me?”
The current ACOG guidelines recommend that all colonized women be treated intrapartum with prophylactic antibiotics regardless of whether risk factors are present. Treatment should be started at the time of admission and continued until the infant is delivered.5
The drugs of choice for intrapartum prophylaxis are intravenous penicillin or ampicillin. If the patient has a mild allergy to penicillin, cefazolin is the appropriate alternative. If the patient has a severe allergy to penicillin, the 2 options are vancomycin or clindamycin. If the latter drug is used, the laboratory must perform sensitivity testing because 13% to 20% of strains of GBS may be resistant to clindamycin. The frequency of resistance to erythromycin now ranges from 25% to 32%. Thus, erythromycin is no longer used for intrapartum prophylaxis.5-7,9
The appropriate intravenous dosages of these antibiotics are listed in the TABLE.5 The new ACOG guidelines have revised the previous recommendations for dosing of penicillin, eliminating the 2.5 million-unit dose. They also have revised the dosing recommendations for vancomyin, eliminating the previous recommendation of 1 g every 12 hours.5 The new recommendations regarding vancomycin are particularly important and are based, at least in part, on an interesting report from Onwuchuruba and colleagues.10 These authors studied maternal and cord blood concentrations of vancomycin in mother-infant dyads receiving either the original recommended dosage of vancomycin (1 g every 12 hours) or a dosage of 15 to 20 mg/kg every 8 hours. With standard dosing, only 9% of neonates had therapeutic vancomycin serum concentrations at delivery. With the 20 mg/kg dose of vancomycin, the percent of neonates with therapeutic serum concentrations of vancomycin increased to 80%.
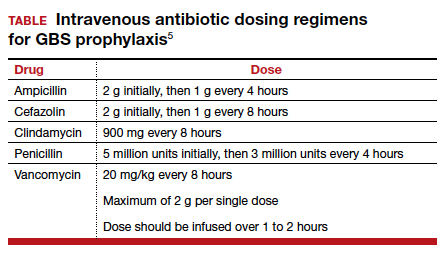
5. “For how long must I be treated in labor before my baby will be protected by the antibiotics?”
The current ACOG Committee Opinion stresses the importance of treating the colonized mother for at least 4 hours prior to delivery.5 This recommendation is based primarily on the landmark report by De Cueto and colleagues.11 These authors evaluated colonized women who received intrapartum prophylaxis at varying times prior to delivery. Their primary endpoint was the percentage of newborns who were colonized with GBS. If the mothers had received antibiotics for less than 1 hour prior to delivery, 46% of neonates were colonized. This figure was equal to the rate of colonization in neonates whose mothers received no antibiotics. When the interval was 1 to 2 hours, the percentage was 29%. When mothers had received antibiotics for 2 to 4 hours, the neonatal colonization rate fell to 2.9%. When antibiotics had been administered for greater than 4 hours, the rate of neonatal colonization was only 1.2%.
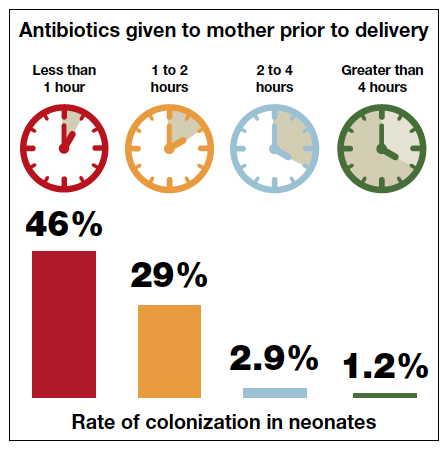
Fairlie and colleagues recently reported the results of another interesting investigation comparing the effectiveness of prophylaxis based on duration of treatment and choice of individual antibiotics.12 Prophylaxis with penicillin or ampicillin for 4 hours or more was 91% effective in preventing early-onset neonatal infection in term infants and 86% effective in preventing infection in preterm infants. These outcomes were superior to the outcomes in both term and preterm infants who received penicillin or ampicillin for less than 4 hours.
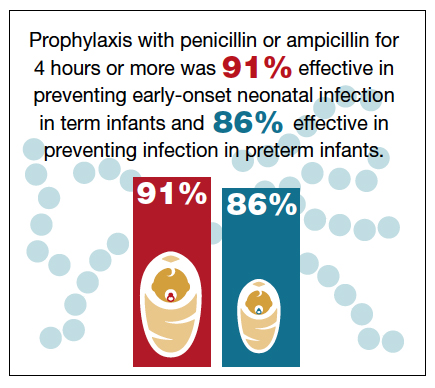
These observations agree with the findings of McNanley and colleagues who evaluated vaginal colony counts of GBS following different periods of antibiotic administration.13 These authors noted that mean colony counts decreased 5-fold within 2 hours of penicillin administration, 50-fold within 4 hours, and 1,000-fold within 6 hours.
Despite these compelling findings, the ACOG Committee Opinion stresses that obstetric interventions such as amniotomy and oxytocin augmentation should not be delayed simply to permit a certain time period of antibiotic administration.5
Continue to: “If I were to have a scheduled CD before the onset of labor and/or ruptured membranes, would I still need to receive antibiotics?”...
6. “If I were to have a scheduled CD before the onset of labor and/or ruptured membranes, would I still need to receive antibiotics?”
If a mother is scheduled to have a CD, for example because of a prior cesarean or because of a persistent fetal malpresentation, she should still have a GBS culture at 36 0/7 to 37 6/7 weeks’ gestation. The information obtained from this culture may be of value to both the obstetrician and pediatrician if the patient experiences labor or rupture of membranes prior to her scheduled surgery. If she does not experience spontaneous labor prior to her scheduled date of surgery, she does not require specific GBS prophylaxis at the time of her operation.5 Rather, she should receive prophylactic antibiotics to prevent post–cesarean infection, ideally, the combination of cefazolin (2 g IV) plus azithromycin (500 mg IV).14 Cefazolin, of course, provides excellent coverage of GBS.
7. “If I am colonized with GBS and I receive treatment during labor, will my baby be safe after delivery?”
The interventions outlined above will prevent almost 90% of early-onset GBS infections, but they are not foolproof.5-7,15,16 Successful management of the neonate is dependent upon several factors, including:5-7
- gestational age
- presence of maternal chorioamnionitis
- presence or absence of risk factors for early-onset infection
- duration (adequacy) of maternal treatment during labor
- presence of immediate clinical signs of infection in the neonate (such as fever, lethargy, hemodynamic instability, respiratory distress, or elevated or decreased white blood cell count).
If the mother is at term and receives intrapartum prophylaxis for at least 4 hours prior to delivery, the neonate usually will not require any special tests and simply will be observed for 24 to 48 hours for signs of infection.
If the mother delivers preterm and receives appropriate intrapartum prophylaxis, the pediatricians typically will obtain a complete blood count (CBC) and treat with prophylactic antibiotics (ampicillin plus gentamicin) for 48 hours if abnormalities are noted on the CBC or the baby exhibits signs of infection. If the CBC is normal and the baby shows no signs of infection, no treatment is indicated.
Regardless of gestational age, if the mother does not receive prophylaxis for at least 4 hours before delivery, the pediatricians usually will obtain a CBC and closely observe the baby in the hospital for signs of infection. If such signs develop or the CBC is abnormal, blood and cerebrospinal fluid cultures will be obtained. Antibiotic therapy (usually ampicillin plus gentamicin) is then initiated, and the drugs are continued until cultures return with no growth. If either culture is positive, antibiotics will then be continued for 7 to 10 days.
If the mother has documented chorioamnionitis and receives treatment intrapartum with appropriate antibiotics (usually ampicillin plus gentamicin), the pediatricians usually will obtain a CBC, C-reactive protein (CRP) level, and blood cultures and then start the infant on antibiotics, pending the result of the laboratory tests. If the CBC and CRP are reassuring, the cultures are negative after 48 hours, and the infant demonstrates no signs of clinical infection, many pediatricians will then discontinue antibiotics. Others may still continue the antibiotics for 7 to 10 days.
- Committee on Infectious Diseases and Committee on Fetus and Newborn. Guidelines for prevention of group B streptococcal (GBS) infection by chemoprophylaxis. Pediatrics. 1992;90:775-778.
- CDC. Prevention of perinatal group B streptococcal disease: a public health perspective. MMWR Recomm Rep. 1996;45(RR-7):1-24.
- Schrag S, Gorwitz R, Fultz-Butts K, et al. Prevention of perinatal group B streptococcal disease. Revised guidelines from CDC. MMWR Recomm Rep. 2002;51(RR-11):1-22.
- Verani JR, McGee L, Schrag SJ. Prevention of perinatal group B streptococcal disease--revised guidelines from CDC, 2010. Division of Bacterial Diseases, National Center for Immunization and Respiratory Diseases, Centers for Disease Control and Prevention (CDC). MMWR Recomm Rep. 2010;59:1-36.
- Prevention of group B streptococcal early-onset disease in newborns. ACOG Committee Opinion Summary, Number 782. Obstet Gynecol. 2019;134:206-210.
- Duff P, Birsner M. Maternal and perinatal infection in pregnancy: bacteria. In: Gabbe SG, Niebyl JR, Simpson JL, et al, eds. Obstetrics. Normal and Problem Pregnancies. 7th ed. Philadelphia, PA: Elsevier; 2017.
- Duff P. Maternal and fetal infections. In: Resnik R, Lockwood CJ, Moore TR, et al, eds. Creasy and Resnik's Maternal-Fetal Medicine: Principles and Practice. 8th ed. Philadelphia, PA: Elsevier; 2019.
- Yancey MK, Schuchat A, Brown LK, et al. The accuracy of late antenatal screening cultures in predicting genital group B streptococcal colonization at delivery. Obstet Gynecol. 1996;88:811-815.
- Edwards RK, Clark P, Duff P. Intrapartum antibiotic prophylaxis 2: positive predictive value of antenatal group B streptococci cultures and antibiotic susceptibility of clinical isolates. Obstet Gynecol. 2002;100:540-544.
- Onwuchuruba CN, Towers CV, Howard BC, et al. Transplacental passage of vancomycin from mother to neonate. Am J Obstet Gynecol. 2014;210:352.e1-352.e4.
- de Cueto M, Sanchez MJ, Sampedro A, et al. Timing of intrapartum ampicillin and prevention of vertical transmission of group B streptococcus. Obstet Gynecol. 1998;91:112-114.
- Fairlie T, Zell ER, Schrag S. Effectiveness of intrapartum antibiotic prophylaxis for prevention of early-onset group B streptococcal disease. Obstet Gynecol. 2013;121:570-577.
- McNanley AR, Glantz JC, Hardy DJ, et al. The effect of intrapartum penicillin on vaginal group B streptococcus colony counts. Am J Obstet Gynecol. 2007;197:583.e1-583.e4.
- Tita AT, Szychowski JM, Boggess K, et al. Adjunctive azithromycin prophylaxis for cesarean delivery. N Engl J Med. 2016;375:1231-1241.
- Brozanski BS, Jones JG, Krohn MA, et al. Effect of a screening-based prevention policy on prevalence of early-onset group B streptococcal sepsis. Obstet Gynecol. 2000;95:496-501.
- Rosenstein NE, Schuchat A. Opportunities for prevention of perinatal group B streptococcal disease: a multistate surveillance analysis. The National Group B Streptococcal Disease Study Group. Obstet Gynecol. 1997;90:901-906.

Dr. Duff is Professor of Maternal-Fetal Medicine, Department of Obstetrics and Gynecology, University of Florida College of Medicine, Gainesville.
The author reports no financial relationships relevant to this article.
Dr. Duff is Professor of Maternal-Fetal Medicine, Department of Obstetrics and Gynecology, University of Florida College of Medicine, Gainesville.
The author reports no financial relationships relevant to this article.
Dr. Duff is Professor of Maternal-Fetal Medicine, Department of Obstetrics and Gynecology, University of Florida College of Medicine, Gainesville.
The author reports no financial relationships relevant to this article.
In 1992, the American College of Obstetricians and Gynecologists (ACOG) and the American Academy of Pediatrics (AAP) published their first joint guidelines on the prevention of early-onset neonatal group B streptococcal (GBS) infection.1 In this initial statement, the organizations recommended universal culturing of obstetric patients at 28 weeks’ gestation and treatment of colonized women during labor if they had a recognized risk factor for neonatal GBS infection.
In 1996, the Centers for Disease Control and Prevention (CDC) published its first set of official guidelines on the topic and suggested that both universal screening and a risk-factor–based approach were reasonable options.2 The 2002 update of the CDC guidelines strongly recommended universal screening of all pregnant women at 35 to 37 weeks’ gestation and intrapartum prophylaxis for all colonized women regardless of risk factors.3
The third set of CDC guidelines was published in 2010.4 The key features of this version were the elimination of erythromycin as an alternative to penicillin in patients who are allergic to beta-lactam antibiotics and the establishment of 4 hours as the critical interval for administration of prophylaxis prior to delivery. The 2010 publication was the last such report from the CDC. Since then ACOG and AAP have been tasked with providing updated practice guidelines. To that end, ACOG recently issued a new Committee Opinion on “Prevention of Group B Streptococcal Early-Onset Disease in Newborns.”5 Here we will highlight the key features of our current strategy for preventing neonatal GBS infection.
CASE Pregnant patient presents with many questions about GBS
A 26-year-old primigravid woman presents for her first prenatal appointment at 9 weeks’ gestation. Her older sister recently delivered a term infant that died in the first week of life from GBS sepsis. Understandably, she has many questions.
1. Your patient first wants to know, “What is this streptococcal organism and how likely am I to have this infection?”
Streptococcus agalactiae, also known as GBS, is a gram-positive encapsulated bacterium that produces beta hemolysis when grown on blood agar. Approximately 25% of pregnant women harbor this organism in the lower genital tract and/or rectum.6
GBS is one of the most important causes of neonatal infection, particularly in preterm infants. The frequency of infection is now 0.23 per 1,000 live births in the US.5
Neonatal infection can be divided into early-onset infection (occurring within the first 7 days of life) and late-onset infection (occurring from after the first week until the third month of life). Approximately 80% to 85% of cases of neonatal GBS infections are early in onset. Virtually all of the early-onset infections result from vertical transmission during delivery from a colonized mother to her infant.5-7
2. “How dangerous is this infection to my baby and me? Are there certain factors that increase the risk of my baby becoming infected?”
GBS is responsible for approximately 2% to 3% of cases of either asymptomatic bacteriuria or acute cystitis. Women with urinary tract infections caused by GBS are at increased risk for preterm premature rupture of membranes and preterm delivery. Genital tract colonization also increases a woman’s risk for chorioamnionitis and endometritis, particularly after cesarean delivery (CD). In addition, GBS can be part of the polymicrobial flora in women who have a wound (incisional site) infection following CD.6,7
Continue to: In colonized women, several risk factors...
In colonized women, several risk factors have been identified that increase the probability of early-onset neonatal GBS infection. These factors include: preterm labor, especially when complicated by premature rupture of membranes; intrapartum maternal fever (usually due to chorioamnionitis); rupture of membranes greater than 18 hours before delivery; previous delivery of an infected infant; young age; and black or Hispanic ethnicity. Approximately 25% of colonized women will have one of these risk factors.5-7
These risk factors have a profound impact on neonatal attack rates and mortality. Without the interventions outlined below, the neonatal infection rate is 40% to 50% in the presence of a risk factor and less than 5% in the absence of a risk factor. In infected infants, neonatal mortality approaches 30% to 35% when a maternal risk factor is present, but is less than 5% when risk factors are absent.5-7
3. “What will you do to determine if I am colonized with this organism?”
The current guidelines set forth in the ACOG Committee Opinion recommend that selected high-risk patients (patients with preterm labor or preterm premature rupture of membranes) be tested for GBS at the time of initial presentation. All other women should be tested for GBS during the interval 36 0/7 to 37 6/7 weeks’ gestation.5 Testing at this point in pregnancy is almost 90% sensitive for identifying patients who will be colonized at the time of admission for labor if no more than 5 weeks elapse between the time the culture is obtained and labor begins. The positive predictive value of this test is 87%, and the negative predictive value is 96%.8
ACOG’s previous guidelines provided for testing at 35 rather than 36 weeks. The change in the recommendations was based on 2 factors. First, all women with unknown GBS status who may deliver before 37 weeks already should be targeted for prophylaxis. Second, the new 5-week window now will include women who deliver up to 41 weeks’ gestation. Given current obstetric practice in the US, delivery beyond 41 weeks is unlikely.5
At the present time, the best test for identification of GBS colonization is bacteriologic culture. A cotton swab is placed into the lower third of the vagina, streaked along the perineum, and then placed into the rectum. The swab is withdrawn, placed in a culturette tube, and transported to the laboratory. In the laboratory, the swab is cultured for approximately 24 hours in a nutrient broth and then subcultured on a selective blood agar plate. Failure to sample both the vagina and rectum or failure to use selective broth and selective blood agar will reduce the yield of positive cultures by approximately 50%.5-7
In recent years, researchers have become interested in the use of rapid nucleic acid amplification tests for the identification of GBS. These tests perform well if the test protocol provides for an 18- to 24-hour incubation in nutrient broth prior to application of the nucleic acid probe. When the tests are performed without this enrichment phase, sensitivities are inferior to those associated with bacteriologic culture. In addition, because the rapid tests do not isolate the organisms, they do not allow for antibiotic sensitivity testing.5-7
Continue to: “If I test positive for GBS, how and when will you treat me?”...
4. “If I test positive for GBS, how and when will you treat me?”
The current ACOG guidelines recommend that all colonized women be treated intrapartum with prophylactic antibiotics regardless of whether risk factors are present. Treatment should be started at the time of admission and continued until the infant is delivered.5
The drugs of choice for intrapartum prophylaxis are intravenous penicillin or ampicillin. If the patient has a mild allergy to penicillin, cefazolin is the appropriate alternative. If the patient has a severe allergy to penicillin, the 2 options are vancomycin or clindamycin. If the latter drug is used, the laboratory must perform sensitivity testing because 13% to 20% of strains of GBS may be resistant to clindamycin. The frequency of resistance to erythromycin now ranges from 25% to 32%. Thus, erythromycin is no longer used for intrapartum prophylaxis.5-7,9
The appropriate intravenous dosages of these antibiotics are listed in the TABLE.5 The new ACOG guidelines have revised the previous recommendations for dosing of penicillin, eliminating the 2.5 million-unit dose. They also have revised the dosing recommendations for vancomyin, eliminating the previous recommendation of 1 g every 12 hours.5 The new recommendations regarding vancomycin are particularly important and are based, at least in part, on an interesting report from Onwuchuruba and colleagues.10 These authors studied maternal and cord blood concentrations of vancomycin in mother-infant dyads receiving either the original recommended dosage of vancomycin (1 g every 12 hours) or a dosage of 15 to 20 mg/kg every 8 hours. With standard dosing, only 9% of neonates had therapeutic vancomycin serum concentrations at delivery. With the 20 mg/kg dose of vancomycin, the percent of neonates with therapeutic serum concentrations of vancomycin increased to 80%.
5. “For how long must I be treated in labor before my baby will be protected by the antibiotics?”
The current ACOG Committee Opinion stresses the importance of treating the colonized mother for at least 4 hours prior to delivery.5 This recommendation is based primarily on the landmark report by De Cueto and colleagues.11 These authors evaluated colonized women who received intrapartum prophylaxis at varying times prior to delivery. Their primary endpoint was the percentage of newborns who were colonized with GBS. If the mothers had received antibiotics for less than 1 hour prior to delivery, 46% of neonates were colonized. This figure was equal to the rate of colonization in neonates whose mothers received no antibiotics. When the interval was 1 to 2 hours, the percentage was 29%. When mothers had received antibiotics for 2 to 4 hours, the neonatal colonization rate fell to 2.9%. When antibiotics had been administered for greater than 4 hours, the rate of neonatal colonization was only 1.2%.
Fairlie and colleagues recently reported the results of another interesting investigation comparing the effectiveness of prophylaxis based on duration of treatment and choice of individual antibiotics.12 Prophylaxis with penicillin or ampicillin for 4 hours or more was 91% effective in preventing early-onset neonatal infection in term infants and 86% effective in preventing infection in preterm infants. These outcomes were superior to the outcomes in both term and preterm infants who received penicillin or ampicillin for less than 4 hours.
These observations agree with the findings of McNanley and colleagues who evaluated vaginal colony counts of GBS following different periods of antibiotic administration.13 These authors noted that mean colony counts decreased 5-fold within 2 hours of penicillin administration, 50-fold within 4 hours, and 1,000-fold within 6 hours.
Despite these compelling findings, the ACOG Committee Opinion stresses that obstetric interventions such as amniotomy and oxytocin augmentation should not be delayed simply to permit a certain time period of antibiotic administration.5
Continue to: “If I were to have a scheduled CD before the onset of labor and/or ruptured membranes, would I still need to receive antibiotics?”...
6. “If I were to have a scheduled CD before the onset of labor and/or ruptured membranes, would I still need to receive antibiotics?”
If a mother is scheduled to have a CD, for example because of a prior cesarean or because of a persistent fetal malpresentation, she should still have a GBS culture at 36 0/7 to 37 6/7 weeks’ gestation. The information obtained from this culture may be of value to both the obstetrician and pediatrician if the patient experiences labor or rupture of membranes prior to her scheduled surgery. If she does not experience spontaneous labor prior to her scheduled date of surgery, she does not require specific GBS prophylaxis at the time of her operation.5 Rather, she should receive prophylactic antibiotics to prevent post–cesarean infection, ideally, the combination of cefazolin (2 g IV) plus azithromycin (500 mg IV).14 Cefazolin, of course, provides excellent coverage of GBS.
7. “If I am colonized with GBS and I receive treatment during labor, will my baby be safe after delivery?”
The interventions outlined above will prevent almost 90% of early-onset GBS infections, but they are not foolproof.5-7,15,16 Successful management of the neonate is dependent upon several factors, including:5-7
- gestational age
- presence of maternal chorioamnionitis
- presence or absence of risk factors for early-onset infection
- duration (adequacy) of maternal treatment during labor
- presence of immediate clinical signs of infection in the neonate (such as fever, lethargy, hemodynamic instability, respiratory distress, or elevated or decreased white blood cell count).
If the mother is at term and receives intrapartum prophylaxis for at least 4 hours prior to delivery, the neonate usually will not require any special tests and simply will be observed for 24 to 48 hours for signs of infection.
If the mother delivers preterm and receives appropriate intrapartum prophylaxis, the pediatricians typically will obtain a complete blood count (CBC) and treat with prophylactic antibiotics (ampicillin plus gentamicin) for 48 hours if abnormalities are noted on the CBC or the baby exhibits signs of infection. If the CBC is normal and the baby shows no signs of infection, no treatment is indicated.
Regardless of gestational age, if the mother does not receive prophylaxis for at least 4 hours before delivery, the pediatricians usually will obtain a CBC and closely observe the baby in the hospital for signs of infection. If such signs develop or the CBC is abnormal, blood and cerebrospinal fluid cultures will be obtained. Antibiotic therapy (usually ampicillin plus gentamicin) is then initiated, and the drugs are continued until cultures return with no growth. If either culture is positive, antibiotics will then be continued for 7 to 10 days.
If the mother has documented chorioamnionitis and receives treatment intrapartum with appropriate antibiotics (usually ampicillin plus gentamicin), the pediatricians usually will obtain a CBC, C-reactive protein (CRP) level, and blood cultures and then start the infant on antibiotics, pending the result of the laboratory tests. If the CBC and CRP are reassuring, the cultures are negative after 48 hours, and the infant demonstrates no signs of clinical infection, many pediatricians will then discontinue antibiotics. Others may still continue the antibiotics for 7 to 10 days.
- Committee on Infectious Diseases and Committee on Fetus and Newborn. Guidelines for prevention of group B streptococcal (GBS) infection by chemoprophylaxis. Pediatrics. 1992;90:775-778.
- CDC. Prevention of perinatal group B streptococcal disease: a public health perspective. MMWR Recomm Rep. 1996;45(RR-7):1-24.
- Schrag S, Gorwitz R, Fultz-Butts K, et al. Prevention of perinatal group B streptococcal disease. Revised guidelines from CDC. MMWR Recomm Rep. 2002;51(RR-11):1-22.
- Verani JR, McGee L, Schrag SJ. Prevention of perinatal group B streptococcal disease--revised guidelines from CDC, 2010. Division of Bacterial Diseases, National Center for Immunization and Respiratory Diseases, Centers for Disease Control and Prevention (CDC). MMWR Recomm Rep. 2010;59:1-36.
- Prevention of group B streptococcal early-onset disease in newborns. ACOG Committee Opinion Summary, Number 782. Obstet Gynecol. 2019;134:206-210.
- Duff P, Birsner M. Maternal and perinatal infection in pregnancy: bacteria. In: Gabbe SG, Niebyl JR, Simpson JL, et al, eds. Obstetrics. Normal and Problem Pregnancies. 7th ed. Philadelphia, PA: Elsevier; 2017.
- Duff P. Maternal and fetal infections. In: Resnik R, Lockwood CJ, Moore TR, et al, eds. Creasy and Resnik's Maternal-Fetal Medicine: Principles and Practice. 8th ed. Philadelphia, PA: Elsevier; 2019.
- Yancey MK, Schuchat A, Brown LK, et al. The accuracy of late antenatal screening cultures in predicting genital group B streptococcal colonization at delivery. Obstet Gynecol. 1996;88:811-815.
- Edwards RK, Clark P, Duff P. Intrapartum antibiotic prophylaxis 2: positive predictive value of antenatal group B streptococci cultures and antibiotic susceptibility of clinical isolates. Obstet Gynecol. 2002;100:540-544.
- Onwuchuruba CN, Towers CV, Howard BC, et al. Transplacental passage of vancomycin from mother to neonate. Am J Obstet Gynecol. 2014;210:352.e1-352.e4.
- de Cueto M, Sanchez MJ, Sampedro A, et al. Timing of intrapartum ampicillin and prevention of vertical transmission of group B streptococcus. Obstet Gynecol. 1998;91:112-114.
- Fairlie T, Zell ER, Schrag S. Effectiveness of intrapartum antibiotic prophylaxis for prevention of early-onset group B streptococcal disease. Obstet Gynecol. 2013;121:570-577.
- McNanley AR, Glantz JC, Hardy DJ, et al. The effect of intrapartum penicillin on vaginal group B streptococcus colony counts. Am J Obstet Gynecol. 2007;197:583.e1-583.e4.
- Tita AT, Szychowski JM, Boggess K, et al. Adjunctive azithromycin prophylaxis for cesarean delivery. N Engl J Med. 2016;375:1231-1241.
- Brozanski BS, Jones JG, Krohn MA, et al. Effect of a screening-based prevention policy on prevalence of early-onset group B streptococcal sepsis. Obstet Gynecol. 2000;95:496-501.
- Rosenstein NE, Schuchat A. Opportunities for prevention of perinatal group B streptococcal disease: a multistate surveillance analysis. The National Group B Streptococcal Disease Study Group. Obstet Gynecol. 1997;90:901-906.

The One Step test: The better diagnostic approach for gestational diabetes mellitus
Gestational diabetes mellitus (GDM) generally is defined as any degree of glucose intolerance with onset or first recognition during pregnancy.1-14 The best approach and exact criteria to use for GDM screening and diagnosis are under worldwide debate. In TABLE 1 we present just some of the many differing suggestions by varying organizations.2,7-9,11,12,15-17 The American College of Obstetricians and Gynecologists, for instance, suggests a Two Step approach to diagnosis.15 We will make the argument in this article, however, that diagnosis should be defined universally as an abnormal result with the One Step 75-g glucose testing, as adopted by the World Health Organization, International Federation of Gynecology and Obstetrics, and others. Approximately 8% of all pregnancies are complicated by GDM by the One Step test in the United States.18-22 The prevalence may range from 1% to 14% of all pregnancies, depending on the population studied and the diagnostic tests employed.1,19
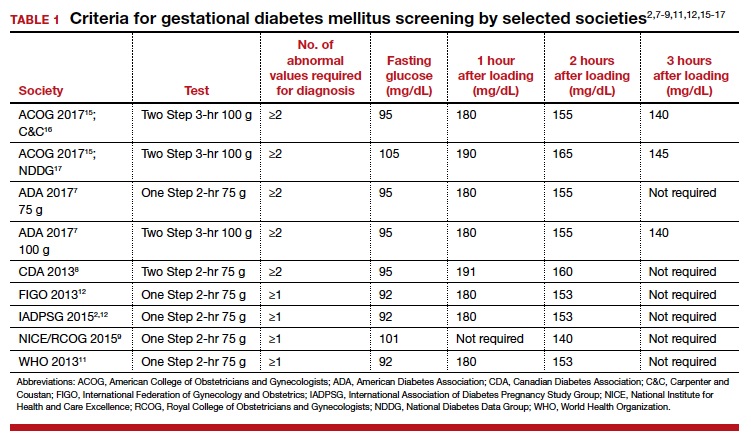
Diagnostic options
Different methods for screening and diagnosis of GDM have been proposed by international societies; there is controversy regarding the diagnosis of GDM by either the One Step or the Two Step approach.6
The One Step approach includes an oral glucose tolerance test with a 75-g glucose load with measurement of plasma glucose concentration at fasting state and 1 hour and 2 hours post–glucose administration. A positive result for the One Step approach is defined as at least 1 measurement higher than 92, 180, or 153 mg/dL at fasting, 1 hour, or 2 hours, respectively.
The Two Step approach includes a nonfasting oral 50-g glucose load, with a glucose blood measurement 1 hour later. A positive screening, defined often as a blood glucose value higher than 135 mg/dL (range, 130 to 140 mg/dL), is followed by a diagnostic test with a 100-g glucose load with measurements at fasting and 1, 2, and 3 hours post–glucose administration. A positive diagnostic test is defined as 2 measurements higher than the target value.
Why we support the One Step test
There are several reasons to prefer the One Step approach for the diagnosis of GDM, compared with the Two Step approach.
Women testing negative for GDM with Two Step still experience complications pregnancy. Women who test positive for GDM with the One Step test, but negative with the Two Step test, despite having therefore a milder degree of glucose intolerance, do have a higher risk of experiencing several complications.23 For the mother, these complications include gestational hypertension, preeclampsia, and cesarean delivery. The baby also can experience problems at birth (TABLE 2).23 Therefore, women who test positive for GDM with the One Step test deserve to be diagnosed with and treated for the condition, as not only are they at risk for these complications but also treatment of the GDM decreases the incidence of these complications.18,19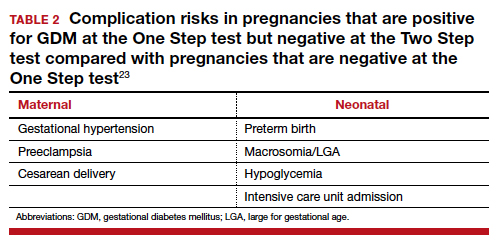
There is indeed an increased GDM diagnosis rate with the One Step (about 8%) compared with the Two Step test (about 4%). Nonetheless, this increase is mild and nonsignificant in the meta-analysis of randomized controlled trials (RCTs),18,19 is less than the 18% difference in diagnosis rate previously hypothesized, is consistent with the increased diabetes/prediabetes rates in the general population, and is linked to the increasing incidence of obesity and insulin resistance.
Overall test adherence is better. Five percent to 15% of patients, depending on the study, are not adherent with taking the second part of the Two Step test. Women indeed prefer the One Step approach; the second step in the Two Step approach may be a burden.
Less costly. The One Step process is cost-effective when postpregnancy diabetes mellitus prevention is considered.
Better maternal and perinatal outcomes. Probably the most important and convincing reason the One Step test should be used is that meta-analysis of the 4 RCTs comparing the approaches (including 2 US trials) shows that diagnosing and treating mild GDM as per the One Step approach, compared with screening and treating using the Two Step approach, is associated with increased incidence of GDM (8% vs 4%) and with better maternal and perinatal outcomes.13,18,19 In fact, the One Step approach is associated with significant reductions in: large for gestational age (56%), admission to neonatal intensive care unit (51%), and neonatal hypoglycemia (48%). Tests of heterogeneity in the meta-analysis and of quality all pointed to better outcomes in the One Step test group.13,19
The need for a second step in the Two Step approach delays diagnosis and treatment. The One Step approach is associated with an increase in GDM test adherence and earlier diagnosis,13 which is another reason for better outcomes with the One Step approach. In the presence of risk factors, such as prior GDM, prior macrosomia, advanced maternal age, multiple gestations, and others, the One Step test should be done at the first prenatal visit.
Continue to: US guidelines should be reconsidered...
US guidelines should be reconsidered
The One Step, 75-g, 2-hour oral glucose tolerance test is universally used to diagnose diabetes mellitus outside of pregnancy. Given our many noted reasons (TABLE 3), we recommend universal screening of GDM by using the One Step approach. It is time, indeed, for the United States to reconsider its guidelines for screening for GDM.
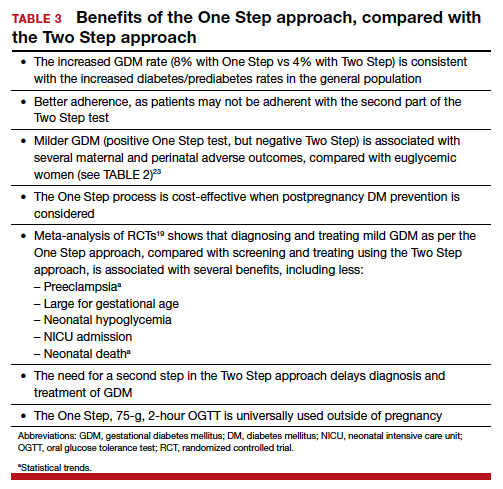
- Kampmann U, Madsen LR, Skajaa GO, et al. Gestational diabetes: a clinical update. World J Diabetes. 2015;6:1065-1072.
- HAPO Study Cooperative Research Group. Hyperglycemia and adverse pregnancy outcomes. N Engl J Med. 2008;358:1991-2002.
- Meltzer SJ, Snyder J, Penrod JR, et al. Gestational diabetes mellitus screening and diagnosis: a prospective randomised controlled trial comparing costs of one-step and two-step methods. BJOG. 2010;117:407-415.
- Sevket O, Ates S, Uysal O, et al. To evaluate the prevalence and clinical outcomes using a one-step method versus a two-step method to screen gestational diabetes mellitus. J Matern Fetal Neonatal Med. 2014;27:36-41.
- Scifres CM, Abebe KZ, Jones KA, et al. Gestational diabetes diagnostic methods (GD2M) pilot randomized trial. Matern Child Health J. 2015;19:1472-1480.
- Farrar D, Duley L, Medley N, et al. Different strategies for diagnosing gestational diabetes to improve maternal and infant health. Cochrane Database Syst Rev. 2015;1:CD007122.
- American Diabetes Association. Classification and diagnosis of diabetes. Diabetes Care. 2017;40(suppl 1):S11-S24.
- Canadian Diabetes Association Clinical Practice Guidelines Expert Committee. Diabetes and Pregnancy. Can J Diabetes. 2013;37(suppl 1):S168-S183.
- NICE guideline. Diabetes in pregnancy: management from preconception to the postnatal period. February 2015. https://www.nice.org.uk/guidance/ng3/. Last updated August 2015. Accessed November 18, 2019.
- WHO 1999. Definition, diagnosis and classification of diabetes mellitus and its complications. Part 1: diagnosis and classification of diabetes mellitus. From http://apps.who.int/iris/bitstream/10665/66040/1/WHO
_NCD_NCS_99.2.pdf. Accessed November 18, 2019. - World Health Organization. Diagnostic criteria and classification of hyperglycaemia first detected in pregnancy. 2013. http://apps.who.int/iris/bitstream/10665/85975/1/WHO_
NMH_MND_13.2_eng.pdf. Accessed November 18, 2019. - Hod M, Kapur A, Sacks DA, et al. The International Federation of Gynecology and Obstetrics (FIGO) Initiative on gestational diabetes mellitus: a pragmatic guide for diagnosis, management, and care. Int J Gynaecol Obstet. 2015;131(suppl 3):S173-S211.
- Berghella V, Caissutti C, Saccone G, et al. The One Step approach for diagnosing gestational diabetes is associated with better perinatal outcomes than using the Two Step approach: evidence of randomized clinical trials. Am J Obstet Gynecol. 2019;220:562-564.
- Berghella V, Caissutti C, Saccone G, et al. One-Step approach to identifying gestational diabetes mellitus: association with perinatal outcomes. Obstet Gynecol. 2019;133:383.
- American College of Obstetricians and Gynecologists. Committee on Practice Bulletins—Obstetrics. Practice Bulletin No. 180: gestational diabetes mellitus. Obstet Gynecol. 2017;130:e17-e31.
- Carpenter MW, Coustan DR. Criteria for screening tests for gestational diabetes. Am J Obstet Gynecol. 1982;144:768-773.
- National Diabetes Data Group. Classification and diagnosis of diabetes mellitus and other categories of glucose intolerance. Diabetes. 1979;28:1039-1057.
- Saccone G, Khalifeh A, Al-Kouatly HB, et al. Screening for gestational diabetes mellitus: one step versus two step approach. A meta-analysis of randomized trials. J Matern Fetal Neonatal Med. 2018:1-9.
- Saccone G, Caissutti C, Khalifeh A, et al. One step versus two step approach for gestational diabetes screening: systematic review and meta-analysis of the randomized trials. J Matern Fetal Neonatal Med. 2019;32:1547-1555.
- Khalifeh A, Eckler R, Felder L, et al. One-step versus two-step diagnostic testing for gestational diabetes: a randomized controlled trial. J Matern Fetal Neonatal Med. 2018:1-6.
- Caissutti C, Saccone G, Khalifeh A, et al. Which criteria should be used for starting pharmacologic therapy for management of gestational diabetes in pregnancy? Evidence from randomized controlled trials. J Matern Fetal Neonatal Med. 2019;32:2905-2914.
- Caissutti C, Saccone G, Ciardulli A, et al. Very tight vs. tight control: which should be the criteria for pharmacologic therapy dose adjustment in diabetes in pregnancy? Evidence from randomized controlled trials. Acta Obstet Gynecol Scand. 2018;97:235-247.
- Caissutti C, Khalifeh A, Saccone G, et al. Are women positive for the One Step but negative for the Two Step screening tests for gestational diabetes at higher risk for adverse outcomes? Acta Obstet Gynecol Scand. 2018;97:122-134.
Gestational diabetes mellitus (GDM) generally is defined as any degree of glucose intolerance with onset or first recognition during pregnancy.1-14 The best approach and exact criteria to use for GDM screening and diagnosis are under worldwide debate. In TABLE 1 we present just some of the many differing suggestions by varying organizations.2,7-9,11,12,15-17 The American College of Obstetricians and Gynecologists, for instance, suggests a Two Step approach to diagnosis.15 We will make the argument in this article, however, that diagnosis should be defined universally as an abnormal result with the One Step 75-g glucose testing, as adopted by the World Health Organization, International Federation of Gynecology and Obstetrics, and others. Approximately 8% of all pregnancies are complicated by GDM by the One Step test in the United States.18-22 The prevalence may range from 1% to 14% of all pregnancies, depending on the population studied and the diagnostic tests employed.1,19
Diagnostic options
Different methods for screening and diagnosis of GDM have been proposed by international societies; there is controversy regarding the diagnosis of GDM by either the One Step or the Two Step approach.6
The One Step approach includes an oral glucose tolerance test with a 75-g glucose load with measurement of plasma glucose concentration at fasting state and 1 hour and 2 hours post–glucose administration. A positive result for the One Step approach is defined as at least 1 measurement higher than 92, 180, or 153 mg/dL at fasting, 1 hour, or 2 hours, respectively.
The Two Step approach includes a nonfasting oral 50-g glucose load, with a glucose blood measurement 1 hour later. A positive screening, defined often as a blood glucose value higher than 135 mg/dL (range, 130 to 140 mg/dL), is followed by a diagnostic test with a 100-g glucose load with measurements at fasting and 1, 2, and 3 hours post–glucose administration. A positive diagnostic test is defined as 2 measurements higher than the target value.
Why we support the One Step test
There are several reasons to prefer the One Step approach for the diagnosis of GDM, compared with the Two Step approach.
Women testing negative for GDM with Two Step still experience complications pregnancy. Women who test positive for GDM with the One Step test, but negative with the Two Step test, despite having therefore a milder degree of glucose intolerance, do have a higher risk of experiencing several complications.23 For the mother, these complications include gestational hypertension, preeclampsia, and cesarean delivery. The baby also can experience problems at birth (TABLE 2).23 Therefore, women who test positive for GDM with the One Step test deserve to be diagnosed with and treated for the condition, as not only are they at risk for these complications but also treatment of the GDM decreases the incidence of these complications.18,19
There is indeed an increased GDM diagnosis rate with the One Step (about 8%) compared with the Two Step test (about 4%). Nonetheless, this increase is mild and nonsignificant in the meta-analysis of randomized controlled trials (RCTs),18,19 is less than the 18% difference in diagnosis rate previously hypothesized, is consistent with the increased diabetes/prediabetes rates in the general population, and is linked to the increasing incidence of obesity and insulin resistance.
Overall test adherence is better. Five percent to 15% of patients, depending on the study, are not adherent with taking the second part of the Two Step test. Women indeed prefer the One Step approach; the second step in the Two Step approach may be a burden.
Less costly. The One Step process is cost-effective when postpregnancy diabetes mellitus prevention is considered.
Better maternal and perinatal outcomes. Probably the most important and convincing reason the One Step test should be used is that meta-analysis of the 4 RCTs comparing the approaches (including 2 US trials) shows that diagnosing and treating mild GDM as per the One Step approach, compared with screening and treating using the Two Step approach, is associated with increased incidence of GDM (8% vs 4%) and with better maternal and perinatal outcomes.13,18,19 In fact, the One Step approach is associated with significant reductions in: large for gestational age (56%), admission to neonatal intensive care unit (51%), and neonatal hypoglycemia (48%). Tests of heterogeneity in the meta-analysis and of quality all pointed to better outcomes in the One Step test group.13,19
The need for a second step in the Two Step approach delays diagnosis and treatment. The One Step approach is associated with an increase in GDM test adherence and earlier diagnosis,13 which is another reason for better outcomes with the One Step approach. In the presence of risk factors, such as prior GDM, prior macrosomia, advanced maternal age, multiple gestations, and others, the One Step test should be done at the first prenatal visit.
Continue to: US guidelines should be reconsidered...
US guidelines should be reconsidered
The One Step, 75-g, 2-hour oral glucose tolerance test is universally used to diagnose diabetes mellitus outside of pregnancy. Given our many noted reasons (TABLE 3), we recommend universal screening of GDM by using the One Step approach. It is time, indeed, for the United States to reconsider its guidelines for screening for GDM.
- Kampmann U, Madsen LR, Skajaa GO, et al. Gestational diabetes: a clinical update. World J Diabetes. 2015;6:1065-1072.
- HAPO Study Cooperative Research Group. Hyperglycemia and adverse pregnancy outcomes. N Engl J Med. 2008;358:1991-2002.
- Meltzer SJ, Snyder J, Penrod JR, et al. Gestational diabetes mellitus screening and diagnosis: a prospective randomised controlled trial comparing costs of one-step and two-step methods. BJOG. 2010;117:407-415.
- Sevket O, Ates S, Uysal O, et al. To evaluate the prevalence and clinical outcomes using a one-step method versus a two-step method to screen gestational diabetes mellitus. J Matern Fetal Neonatal Med. 2014;27:36-41.
- Scifres CM, Abebe KZ, Jones KA, et al. Gestational diabetes diagnostic methods (GD2M) pilot randomized trial. Matern Child Health J. 2015;19:1472-1480.
- Farrar D, Duley L, Medley N, et al. Different strategies for diagnosing gestational diabetes to improve maternal and infant health. Cochrane Database Syst Rev. 2015;1:CD007122.
- American Diabetes Association. Classification and diagnosis of diabetes. Diabetes Care. 2017;40(suppl 1):S11-S24.
- Canadian Diabetes Association Clinical Practice Guidelines Expert Committee. Diabetes and Pregnancy. Can J Diabetes. 2013;37(suppl 1):S168-S183.
- NICE guideline. Diabetes in pregnancy: management from preconception to the postnatal period. February 2015. https://www.nice.org.uk/guidance/ng3/. Last updated August 2015. Accessed November 18, 2019.
- WHO 1999. Definition, diagnosis and classification of diabetes mellitus and its complications. Part 1: diagnosis and classification of diabetes mellitus. From http://apps.who.int/iris/bitstream/10665/66040/1/WHO
_NCD_NCS_99.2.pdf. Accessed November 18, 2019. - World Health Organization. Diagnostic criteria and classification of hyperglycaemia first detected in pregnancy. 2013. http://apps.who.int/iris/bitstream/10665/85975/1/WHO_
NMH_MND_13.2_eng.pdf. Accessed November 18, 2019. - Hod M, Kapur A, Sacks DA, et al. The International Federation of Gynecology and Obstetrics (FIGO) Initiative on gestational diabetes mellitus: a pragmatic guide for diagnosis, management, and care. Int J Gynaecol Obstet. 2015;131(suppl 3):S173-S211.
- Berghella V, Caissutti C, Saccone G, et al. The One Step approach for diagnosing gestational diabetes is associated with better perinatal outcomes than using the Two Step approach: evidence of randomized clinical trials. Am J Obstet Gynecol. 2019;220:562-564.
- Berghella V, Caissutti C, Saccone G, et al. One-Step approach to identifying gestational diabetes mellitus: association with perinatal outcomes. Obstet Gynecol. 2019;133:383.
- American College of Obstetricians and Gynecologists. Committee on Practice Bulletins—Obstetrics. Practice Bulletin No. 180: gestational diabetes mellitus. Obstet Gynecol. 2017;130:e17-e31.
- Carpenter MW, Coustan DR. Criteria for screening tests for gestational diabetes. Am J Obstet Gynecol. 1982;144:768-773.
- National Diabetes Data Group. Classification and diagnosis of diabetes mellitus and other categories of glucose intolerance. Diabetes. 1979;28:1039-1057.
- Saccone G, Khalifeh A, Al-Kouatly HB, et al. Screening for gestational diabetes mellitus: one step versus two step approach. A meta-analysis of randomized trials. J Matern Fetal Neonatal Med. 2018:1-9.
- Saccone G, Caissutti C, Khalifeh A, et al. One step versus two step approach for gestational diabetes screening: systematic review and meta-analysis of the randomized trials. J Matern Fetal Neonatal Med. 2019;32:1547-1555.
- Khalifeh A, Eckler R, Felder L, et al. One-step versus two-step diagnostic testing for gestational diabetes: a randomized controlled trial. J Matern Fetal Neonatal Med. 2018:1-6.
- Caissutti C, Saccone G, Khalifeh A, et al. Which criteria should be used for starting pharmacologic therapy for management of gestational diabetes in pregnancy? Evidence from randomized controlled trials. J Matern Fetal Neonatal Med. 2019;32:2905-2914.
- Caissutti C, Saccone G, Ciardulli A, et al. Very tight vs. tight control: which should be the criteria for pharmacologic therapy dose adjustment in diabetes in pregnancy? Evidence from randomized controlled trials. Acta Obstet Gynecol Scand. 2018;97:235-247.
- Caissutti C, Khalifeh A, Saccone G, et al. Are women positive for the One Step but negative for the Two Step screening tests for gestational diabetes at higher risk for adverse outcomes? Acta Obstet Gynecol Scand. 2018;97:122-134.

Does planned early delivery make sense in women with preterm preeclampsia?
Chappell LC, Brocklehurst P, Green ME, et al; PHOENIX Study Group. Planned early delivery or expectant management for late preterm pre-eclampsia (PHOENIX): a randomised controlled trial. Lancet. 2019;394:1181-1190.
EXPERT COMMENTARY
Preeclampsia is a common hypertensive disorder of pregnancy. Among women who develop the disease at late preterm gestation, the question remains, “What is the optimal timing for delivery?” The American College of Obstetricians and Gynecologists (ACOG) categorizes preeclampsia as “with and without severe features.”1 Delivery is recommended for women with preeclampsia with severe features at or beyond 34 weeks’ gestation, and for women with preeclampsia without severe features at or beyond 37 weeks’ gestation.1 For patients with fetal growth restriction and preeclampsia, ACOG also recommends delivery between 34 and 37 weeks’ gestation.
Details of the study
Chappell and colleagues conducted a randomized controlled trial among women with singleton or dichorionic diamniotic twin pregnancy between 34 and 36.6 weeks’ gestation. Women were assigned to either planned delivery within 48 hours of randomization or expectant management until 37 weeks or earlier with clinical deterioration.
Among the 901 women included in the study, 450 were allocated to planned delivery and 451 to expectant management.
Study outcomes. The co-primary short-term maternal outcome was a composite of maternal morbidity with the addition of recorded systolic blood pressure of at least 160 mm Hg postrandomization (on any occasion). The co-primary short-term perinatal outcome was a composite of neonatal deaths within 7 days of delivery and perinatal deaths or neonatal unit admissions.
Participant details. At baseline, the average gestational age at randomization was 35.6 weeks, with equal distribution through the 3 weeks (34 through 36 weeks). About 37% of the women had severe hypertension (≥ 160 mm Hg) in the previous 48 hours prior to randomization, and approximately 22% had fetal growth restriction. The authors did not categorize the women based on severe features of preeclampsia.
Results. The investigators found that the proportion of women with the maternal co-primary outcome was significantly lower in the planned delivery group compared with the expectant management group (65% vs 75%), and the proportion of infants with the perinatal co-primary outcome was significantly higher in the planned delivery group compared with the expectant management group (42% vs 34%). The fact that early delivery led to more neonatal unit admissions for the infant, principally for a listed indication of prematurity and without an excess of respiratory or other morbidity, intensity of care, or length of stay, is very reassuring.
Study strengths and limitations
This is the largest study of women in this group allocated, randomized, and multicenter investigation addressing a very important clinical question. The patient population was mostly white, with only 13% black women, and had an average body mass index of 29 kg/m2 (which is low compared with many practices in the United States). The average difference between the 2 study groups was the additional prolongation of pregnancy from enrollment to delivery of only 3 days, which may not be clinically relevant. More than half of the women in the expectant management group had medically indicated delivery before 37 weeks’ gestation.
Continue to: A limitation of this study...
A limitation of this study is that all women with preeclampsia were considered the same—that is, no distinction was made between severe and nonsevere preeclampsia, and a significant proportion of women had severe hypertension at enrollment, which would make them ineligible for expectant management anyway.
The maternal composite outcome was driven mostly by severe hypertension and progression to severe preeclampsia (likely driven by severe hypertension). All other maternal outcomes were very rare or did not happen; however, the incidence of delivery indications for various preeclampsia-related complications was higher in the expectant management group.
The takeaway
In the absence of biomarkers for risk stratification and treatment of preeclampsia, delivering women who have a diagnosis of preeclampsia at or beyond 34 weeks’ gestation may be a viable option for preventing maternal complications.
In the United States, preeclampsia is categorized as severe or nonsevere, and gestational age at delivery depends on the type of preeclampsia. Clinicians should discuss expectant management after 34 weeks with patients who have preeclampsia without severe features, noting that this may decrease the chances for adverse maternal outcomes (mostly severe hypertension) at the cost of neonatal intensive care unit admission, which may depend on local practices. Attention also should be paid to particular patient populations (such as obese and African American women) who are at higher risk for developing adverse maternal outcomes. This may be particularly relevant in a smaller hospital setting in which patient follow-up may not be universal or access to a maternal-fetal medicine specialist may not be available to discuss management plans.
My personal take: I work in a large tertiary medical center. I worry about added prematurity, especially among women with superimposed preeclampsia where the diagnosis may be unclear. In my practice, we monitor patients with preeclampsia very closely, and with any signs of severe features we deliver them after 34 weeks. We follow ACOG guidelines for managing preeclampsia based on severity of disease and gestational age. I am not planning to immediately change my practice based on this study by Chappell and colleagues, and I will wait for results of long-term effects on neonatal outcomes, studies using biomarkers for risk assessment of women at risk for adverse outcomes, and opinions from ACOG and the Society for Maternal-Fetal Medicine about this management plan.
SAROSH RANA, MD, MPH
- American College of Obstetricians and Gynecologists Committee on Practice Bulletins--Obstetrics. Gestational hypertension and preeclampsia. Obstet Gynecol. 2019;133:e1-e25.
Chappell LC, Brocklehurst P, Green ME, et al; PHOENIX Study Group. Planned early delivery or expectant management for late preterm pre-eclampsia (PHOENIX): a randomised controlled trial. Lancet. 2019;394:1181-1190.
EXPERT COMMENTARY
Preeclampsia is a common hypertensive disorder of pregnancy. Among women who develop the disease at late preterm gestation, the question remains, “What is the optimal timing for delivery?” The American College of Obstetricians and Gynecologists (ACOG) categorizes preeclampsia as “with and without severe features.”1 Delivery is recommended for women with preeclampsia with severe features at or beyond 34 weeks’ gestation, and for women with preeclampsia without severe features at or beyond 37 weeks’ gestation.1 For patients with fetal growth restriction and preeclampsia, ACOG also recommends delivery between 34 and 37 weeks’ gestation.
Details of the study
Chappell and colleagues conducted a randomized controlled trial among women with singleton or dichorionic diamniotic twin pregnancy between 34 and 36.6 weeks’ gestation. Women were assigned to either planned delivery within 48 hours of randomization or expectant management until 37 weeks or earlier with clinical deterioration.
Among the 901 women included in the study, 450 were allocated to planned delivery and 451 to expectant management.
Study outcomes. The co-primary short-term maternal outcome was a composite of maternal morbidity with the addition of recorded systolic blood pressure of at least 160 mm Hg postrandomization (on any occasion). The co-primary short-term perinatal outcome was a composite of neonatal deaths within 7 days of delivery and perinatal deaths or neonatal unit admissions.
Participant details. At baseline, the average gestational age at randomization was 35.6 weeks, with equal distribution through the 3 weeks (34 through 36 weeks). About 37% of the women had severe hypertension (≥ 160 mm Hg) in the previous 48 hours prior to randomization, and approximately 22% had fetal growth restriction. The authors did not categorize the women based on severe features of preeclampsia.
Results. The investigators found that the proportion of women with the maternal co-primary outcome was significantly lower in the planned delivery group compared with the expectant management group (65% vs 75%), and the proportion of infants with the perinatal co-primary outcome was significantly higher in the planned delivery group compared with the expectant management group (42% vs 34%). The fact that early delivery led to more neonatal unit admissions for the infant, principally for a listed indication of prematurity and without an excess of respiratory or other morbidity, intensity of care, or length of stay, is very reassuring.
Study strengths and limitations
This is the largest study of women in this group allocated, randomized, and multicenter investigation addressing a very important clinical question. The patient population was mostly white, with only 13% black women, and had an average body mass index of 29 kg/m2 (which is low compared with many practices in the United States). The average difference between the 2 study groups was the additional prolongation of pregnancy from enrollment to delivery of only 3 days, which may not be clinically relevant. More than half of the women in the expectant management group had medically indicated delivery before 37 weeks’ gestation.
Continue to: A limitation of this study...
A limitation of this study is that all women with preeclampsia were considered the same—that is, no distinction was made between severe and nonsevere preeclampsia, and a significant proportion of women had severe hypertension at enrollment, which would make them ineligible for expectant management anyway.
The maternal composite outcome was driven mostly by severe hypertension and progression to severe preeclampsia (likely driven by severe hypertension). All other maternal outcomes were very rare or did not happen; however, the incidence of delivery indications for various preeclampsia-related complications was higher in the expectant management group.
The takeaway
In the absence of biomarkers for risk stratification and treatment of preeclampsia, delivering women who have a diagnosis of preeclampsia at or beyond 34 weeks’ gestation may be a viable option for preventing maternal complications.
In the United States, preeclampsia is categorized as severe or nonsevere, and gestational age at delivery depends on the type of preeclampsia. Clinicians should discuss expectant management after 34 weeks with patients who have preeclampsia without severe features, noting that this may decrease the chances for adverse maternal outcomes (mostly severe hypertension) at the cost of neonatal intensive care unit admission, which may depend on local practices. Attention also should be paid to particular patient populations (such as obese and African American women) who are at higher risk for developing adverse maternal outcomes. This may be particularly relevant in a smaller hospital setting in which patient follow-up may not be universal or access to a maternal-fetal medicine specialist may not be available to discuss management plans.
My personal take: I work in a large tertiary medical center. I worry about added prematurity, especially among women with superimposed preeclampsia where the diagnosis may be unclear. In my practice, we monitor patients with preeclampsia very closely, and with any signs of severe features we deliver them after 34 weeks. We follow ACOG guidelines for managing preeclampsia based on severity of disease and gestational age. I am not planning to immediately change my practice based on this study by Chappell and colleagues, and I will wait for results of long-term effects on neonatal outcomes, studies using biomarkers for risk assessment of women at risk for adverse outcomes, and opinions from ACOG and the Society for Maternal-Fetal Medicine about this management plan.
SAROSH RANA, MD, MPH
- American College of Obstetricians and Gynecologists Committee on Practice Bulletins--Obstetrics. Gestational hypertension and preeclampsia. Obstet Gynecol. 2019;133:e1-e25.
- American College of Obstetricians and Gynecologists Committee on Practice Bulletins--Obstetrics. Gestational hypertension and preeclampsia. Obstet Gynecol. 2019;133:e1-e25.

Don’t Forget These 5 Things When Treating Hidradenitis Suppurativa
Hidradenitis suppurativa (HS) is a common and debilitating inflammatory disorder of the pilosebaceous unit that presents with recurrent scarring inflammatory nodules and sinus tracts in the intertriginous folds of the body. It is a complex condition that requires multimodal management to address the medical, surgical, and psychosocial needs of affected patients. However, it can be difficult to coordinate all that goes into HS management beyond the standard therapeutic ladder of topical and oral antimicrobials, intralesional corticosteroids, biologics, and surgery. In this article, I will outline 5 important aspects of HS treatment that often are overlooked.
Talk About Pathophysiology
Patients with HS often have limited understanding of their condition. One common misperception is that HS is an infectious disease and that disease activity is associated with poor hygiene.1 Dispelling this myth may help patients avoid unnecessary hygiene practices, decrease perceived stigma, and enhance your therapeutic alliance.
The current model of HS pathophysiology implicates an aberrant inflammatory response to the cutaneous bacterial microbiome, which leads to follicular occlusion and then rupture of debris and bacteria into the surrounding dermis. Immune cells and inflammatory mediators such as nuclear factor κB and tumor necrosis factor α respond to the disruption. Chronic lesions develop due to tissue repair with scarring and re-epithelialization.2,3 Although most patients probably are not interested in the esoteric details, I typically make a point of explaining to patients that HS is a chronic inflammatory disease and provide reassurance that it is not a sign of poor hygiene.
Counsel on Smoking Cessation
Most HS patients use tobacco. As many as 75% of HS patients are active smokers and another 10% to 15% are former smokers. Although there is mixed evidence that disease activity correlates with smoking status, the Hidradenitis Suppurativa Foundation in the United States and Canada concluded in the 2019 North American Clinical Management Guidelines for Hidradenitis Suppurativa that due to the overall health risks of smoking, we should recommend cessation to our patients.4
Laser Hair Removal Works
Don’t forget about laser hair removal! Evidence from randomized controlled trials supports the use of the Nd:YAG laser in the treatment of HS. Treat the entire affected anatomic area and use stacked double pulses on active nodules (typical settings: 10-mm spot size; 10-millisecond pulse duration and 35–50 J/cm2 in Fitzpatrick skin types I–III; 20-millisecond pulse duration and 25–40 J/cm2 in Fitzpatrick skin types IV–VI).4 Especially if it is covered by your patient’s insurance, Nd:YAG is a great adjunctive treatment to consider. The guidelines also recommend long-pulsed alexandrite and diode lasers as well as intense pulsed light, all of which result in follicular destruction, though these treatments have less supporting evidence.4
Have a Plan for Flares
Intralesional injection of triamcinolone is a mainstay of HS treatment and provides patients with rapid relief of symptoms during a flare.5 One case series found that there was a notable decrease in pain, size, and drainage after just 1 day of treatment with intralesional triamcinolone 10 mg/mL (0.2–2.0 mL).6
Intralesional steroid injection is a great tool for quieting an active disease flare while simultaneously instating ongoing treatment for preventive management. However, even when disease control is optimized, patients may still experience intermittent flares of disease. For some patients, it may be appropriate to have a plan in place for a return to clinic during the beginning of a flare to obtain intralesional steroids. The ability to come in on short notice may help avoid visits to the emergency department and urgent care where your patients may receive treatments such as short courses of antibiotics or incision and drainage that may deviate from your overall treatment plan.
Consider Childbearing Status
Don’t forget to consider childbearing plans and childbearing potential when treating female patients with HS. Pregnancy is a frequent consideration in HS patients, as HS affects 3 to 4 times more women than men and typically presents after puberty (second or third decades of life). Many of the medications in the HS armamentarium are contraindicated in pregnancy including tetracyclines, retinoids, and hormonal agents. Surgery should be avoided in pregnant patients whenever possible, particularly in the first trimester. Relatively safe options include topical antibiotics such as clindamycin and metronidazole, as well as tumor necrosis factor α inhibitors, which are classified as category B in pregnancy.5
Before making treatment decisions in pregnant and breastfeeding patients, consult the US Food and Drug Administration recommendations. Perng et al7 reviewed current management strategies for HS in pregnant and breastfeeding women, and their review article in the Journal of the American Academy of Dermatology is an excellent resource.
Final Thoughts
Comprehensive management of HS may include a combination of medication and procedures, lifestyle modification, management of comorbidities, and social support. Formulating a good treatment plan may be a challenge but can drastically improve your patient’s quality of life.
- What is hidradenitis suppurativa? Hidradenitis Suppurativa Foundation website. https://www.hs-foundation.org/what-is-hs. Accessed October 9, 2019.
- Frew JW, Hawkes JE, Krueger JG. Topical, systemic and biologic therapies in hidradenitis suppurativa: pathogenic insights by examining therapeutic mechanisms. Ther Adv Chronic Dis. 2019;10:2040622319830646. doi:10.1177/2040622319830646
- Lacarrubba F, Musumeci ML, Nasca MR, et al. Double-ended pseudocomedones in hidradenitis suppurativa: clinical, dermoscopic, and histopathological correlation. Acta Derm Venereol. 2017;97:763-764.
- Alikhan A, Sayed C, Alavi A, et al. North American Clinical Management Guidelines for Hidradenitis Suppurativa: a publication from the United States and Canadian Hidradenitis Suppurativa Foundations. part I: diagnosis, evaluation, and the use of complementary and procedural management. J Am Acad Dermatol. 2019;81:76-90.
- Alikhan A, Sayed C, Alavi A, et al. North American Clinical Management Guidelines for Hidradenitis Suppurativa: a publication from the United States and Canadian Hidradenitis Suppurativa Foundations. part II: topical, intralesional, and systemic medical management. J Am Acad Dermatol. 2019;81:91-101.
- Riis PT, Boer J, Prens EP, et al. Intralesional triamcinolone for flares of hidradenitis suppurativa (HS): a case series. J Am Acad Dermatol. 2016;75:1151-1155.
- Perng P, Zampella JG, Okoye GA. Management of hidradenitis suppurativa in pregnancy. J Am Acad Dermatol. 2017;76:979-989.
Hidradenitis suppurativa (HS) is a common and debilitating inflammatory disorder of the pilosebaceous unit that presents with recurrent scarring inflammatory nodules and sinus tracts in the intertriginous folds of the body. It is a complex condition that requires multimodal management to address the medical, surgical, and psychosocial needs of affected patients. However, it can be difficult to coordinate all that goes into HS management beyond the standard therapeutic ladder of topical and oral antimicrobials, intralesional corticosteroids, biologics, and surgery. In this article, I will outline 5 important aspects of HS treatment that often are overlooked.
Talk About Pathophysiology
Patients with HS often have limited understanding of their condition. One common misperception is that HS is an infectious disease and that disease activity is associated with poor hygiene.1 Dispelling this myth may help patients avoid unnecessary hygiene practices, decrease perceived stigma, and enhance your therapeutic alliance.
The current model of HS pathophysiology implicates an aberrant inflammatory response to the cutaneous bacterial microbiome, which leads to follicular occlusion and then rupture of debris and bacteria into the surrounding dermis. Immune cells and inflammatory mediators such as nuclear factor κB and tumor necrosis factor α respond to the disruption. Chronic lesions develop due to tissue repair with scarring and re-epithelialization.2,3 Although most patients probably are not interested in the esoteric details, I typically make a point of explaining to patients that HS is a chronic inflammatory disease and provide reassurance that it is not a sign of poor hygiene.
Counsel on Smoking Cessation
Most HS patients use tobacco. As many as 75% of HS patients are active smokers and another 10% to 15% are former smokers. Although there is mixed evidence that disease activity correlates with smoking status, the Hidradenitis Suppurativa Foundation in the United States and Canada concluded in the 2019 North American Clinical Management Guidelines for Hidradenitis Suppurativa that due to the overall health risks of smoking, we should recommend cessation to our patients.4
Laser Hair Removal Works
Don’t forget about laser hair removal! Evidence from randomized controlled trials supports the use of the Nd:YAG laser in the treatment of HS. Treat the entire affected anatomic area and use stacked double pulses on active nodules (typical settings: 10-mm spot size; 10-millisecond pulse duration and 35–50 J/cm2 in Fitzpatrick skin types I–III; 20-millisecond pulse duration and 25–40 J/cm2 in Fitzpatrick skin types IV–VI).4 Especially if it is covered by your patient’s insurance, Nd:YAG is a great adjunctive treatment to consider. The guidelines also recommend long-pulsed alexandrite and diode lasers as well as intense pulsed light, all of which result in follicular destruction, though these treatments have less supporting evidence.4
Have a Plan for Flares
Intralesional injection of triamcinolone is a mainstay of HS treatment and provides patients with rapid relief of symptoms during a flare.5 One case series found that there was a notable decrease in pain, size, and drainage after just 1 day of treatment with intralesional triamcinolone 10 mg/mL (0.2–2.0 mL).6
Intralesional steroid injection is a great tool for quieting an active disease flare while simultaneously instating ongoing treatment for preventive management. However, even when disease control is optimized, patients may still experience intermittent flares of disease. For some patients, it may be appropriate to have a plan in place for a return to clinic during the beginning of a flare to obtain intralesional steroids. The ability to come in on short notice may help avoid visits to the emergency department and urgent care where your patients may receive treatments such as short courses of antibiotics or incision and drainage that may deviate from your overall treatment plan.
Consider Childbearing Status
Don’t forget to consider childbearing plans and childbearing potential when treating female patients with HS. Pregnancy is a frequent consideration in HS patients, as HS affects 3 to 4 times more women than men and typically presents after puberty (second or third decades of life). Many of the medications in the HS armamentarium are contraindicated in pregnancy including tetracyclines, retinoids, and hormonal agents. Surgery should be avoided in pregnant patients whenever possible, particularly in the first trimester. Relatively safe options include topical antibiotics such as clindamycin and metronidazole, as well as tumor necrosis factor α inhibitors, which are classified as category B in pregnancy.5
Before making treatment decisions in pregnant and breastfeeding patients, consult the US Food and Drug Administration recommendations. Perng et al7 reviewed current management strategies for HS in pregnant and breastfeeding women, and their review article in the Journal of the American Academy of Dermatology is an excellent resource.
Final Thoughts
Comprehensive management of HS may include a combination of medication and procedures, lifestyle modification, management of comorbidities, and social support. Formulating a good treatment plan may be a challenge but can drastically improve your patient’s quality of life.
- What is hidradenitis suppurativa? Hidradenitis Suppurativa Foundation website. https://www.hs-foundation.org/what-is-hs. Accessed October 9, 2019.
- Frew JW, Hawkes JE, Krueger JG. Topical, systemic and biologic therapies in hidradenitis suppurativa: pathogenic insights by examining therapeutic mechanisms. Ther Adv Chronic Dis. 2019;10:2040622319830646. doi:10.1177/2040622319830646
- Lacarrubba F, Musumeci ML, Nasca MR, et al. Double-ended pseudocomedones in hidradenitis suppurativa: clinical, dermoscopic, and histopathological correlation. Acta Derm Venereol. 2017;97:763-764.
- Alikhan A, Sayed C, Alavi A, et al. North American Clinical Management Guidelines for Hidradenitis Suppurativa: a publication from the United States and Canadian Hidradenitis Suppurativa Foundations. part I: diagnosis, evaluation, and the use of complementary and procedural management. J Am Acad Dermatol. 2019;81:76-90.
- Alikhan A, Sayed C, Alavi A, et al. North American Clinical Management Guidelines for Hidradenitis Suppurativa: a publication from the United States and Canadian Hidradenitis Suppurativa Foundations. part II: topical, intralesional, and systemic medical management. J Am Acad Dermatol. 2019;81:91-101.
- Riis PT, Boer J, Prens EP, et al. Intralesional triamcinolone for flares of hidradenitis suppurativa (HS): a case series. J Am Acad Dermatol. 2016;75:1151-1155.
- Perng P, Zampella JG, Okoye GA. Management of hidradenitis suppurativa in pregnancy. J Am Acad Dermatol. 2017;76:979-989.
Resident Pearls
- Medical treatment of hidradenitis suppurativa (HS) can be relatively straightforward, but optimal comprehensive management is multifaceted.
- Educate patients about pathophysiology, counsel on smoking cessation, remember laser hair removal, consider an ongoing plan for addressing flares, and think about childbearing status when treating HS patients.

Use of PEP prophylaxis techniques may diverge from the evidence
(PEP), according to research published online in Gastrointestinal Endoscopy. In addition, methods for PEP prophylaxis in clinical practice are not implemented to the extent that the current evidence warrants.
“Future studies should not only further clarify the optimal PEP prophylaxis strategy, but should also focus on strategies to improve the implementation of evidence-based PEP prophylaxis techniques,” wrote Patrick Avila, MD, MPH, gastroenterologist at the University of California, San Francisco, and colleagues.
A survey of American endoscopists
Approximately 4% of patients who undergo biliopancreatic endoscopy develop PEP, which has a mortality rate of 3%. The American Society for Gastrointestinal Endoscopy (ASGE) recommends prophylactic and rectal NSAIDs to reduce the incidence and severity of PEP in patients at high risk. The ASGE further suggests that rectal indomethacin may decrease the risk and severity of PEP in patients at average risk.
The European Society for Gastrointestinal Endoscopy (ESGE) recommends rectal indomethacin for all patients undergoing ERCP (endoscopic retrograde cholangiopancreatography). Several surveys of European endoscopists, however, indicate that relatively few respondents have adopted the recommended prophylactic techniques. The literature does not contain information about practice patterns among American endoscopists, and Dr. Avila and colleagues decided to investigate this question.
The researchers developed a 16-question online survey to assess current practice patterns with regard to PEP prophylaxis. They defined ERCPs that entailed a high risk for PEP as any that involved pancreatic or precut sphincterotomy, traumatic biliary sphincterotomy, balloon dilation of the biliary sphincter, injection of the pancreatic duct, extensive pancreatic duct instrumentation, difficult cannulation, suspected sphincter of Oddi dysfunction, previous PEP, or a female patient. Dr. Avila and colleagues distributed the survey to 233 advanced endoscopists involved in advanced endoscopy fellowship training programs.
Respondents had years of experience
Sixty-two endoscopists (26.7%) completed the survey. Respondents’ mean age was 47 years, and most respondents (74.6%) had been performing ERCP for more than 5 years. Almost all respondents (95%) worked at a tertiary referral center, and all worked with fellows.
All respondents reported having used to prevent PEP. Most responders (72%) used only in patients at high risk of PEP, and 64% reported using in 25% or less of the ERCPs that they had performed. Four respondents (6.8%) used for PEP in more than half of ERCPs. Among endoscopists who rarely use for PEP, the major reasons cited included concern about increased risk of PEP with failed pancreatic duct insertion, the belief that stents do not provide additional benefit beyond pharmacologic prophylaxis, and difficulties in following up patients to ensure stent passage.
About 98% of respondents reported using rectal NSAIDs for PEP. Thirty-four respondents (59.7%) used this treatment only for patients at high risk, and 23 respondents (40.1%) used it for patients at average risk. Among respondents who used rectal NSAIDs to prevent PEP, 67.8% used the treatment in half or more of ERCPs. The NSAID of choice was indomethacin for all respondents. One respondent reported never using rectal NSAIDs for PEP because of doubts about its efficacy, in addition to cost and availability.
In addition, 49 respondents (83.0%) reported using rapid intravenous fluids to prevent PEP. None reported using octreotide or antibiotics to prevent PEP.
Results may reflect recall bias
The survey reveals “a significant divergence from the scientific evidence in how PEP techniques are used in routine clinical practice,” wrote Dr. Avila and colleagues. Several studies, including a randomized controlled trial, support the use of rectal NSAIDs as prophylaxis as patients at average risk of PEP, but less than half of respondents reported using it. The ASGE guidelines state that this treatment is “reasonable,” but do not advocate for it. “If appropriate, adopting a stronger stance in our practice guidelines may lead to further widespread use of rectal NSAIDs in this group of patients,” wrote Dr. Avila and colleagues.
Pancreatic duct stent placement is a difficult procedure to perform. The success rate in one British study was 51%, and a study of expert pancreaticobiliary endoscopists found a failure rate of 7%. It therefore may not be surprising that was used less often than rectal NSAIDs among respondents, according to the authors.
Dr. Avila and colleagues acknowledged that the survey’s low response rate could have introduced nonresponse bias into the findings. They also stated that the study may have been affected by selection and recall biases. The results thus may not be generalizable to other practice settings, they concluded.
The authors did not report any study funding or disclosures.
* This story was updated on 12/2/2019.
SOURCE: Avila P et al. Gastrointest Endosc. 2019 Nov 16. doi: 10.1016/j.gie.2019.11.013.
FROM GASTROINTESTINAL ENDOSCOPY
Vaping: The new wave of nicotine addiction
Electronic cigarettes and other “vaping” devices have been increasing in popularity among youth and adults since their introduction in the US market in 2007.1 This increase is partially driven by a public perception that vaping is harmless, or at least less harmful than cigarette smoking.2 Vaping fans also argue that current smokers can use vaping as nicotine replacement therapy to help them quit smoking.3
We disagree. Research on the health effects of vaping, though still limited, is accumulating rapidly and making it increasingly clear that this habit is far from harmless. For youth, it is a gateway to addiction to nicotine and other substances. Whether it can help people quit smoking remains to be seen. And recent months have seen reports of serious respiratory illnesses and even deaths linked to vaping.4
In December 2016, the US Surgeon General warned that e-cigarette use among youth and young adults in the United States represents a “major public health concern,”5 and that more adolescents and young adults are now vaping than smoking conventional tobacco products.
This article reviews the issue of vaping in the United States, as well as available evidence regarding its safety.
YOUTH AT RISK
Retail sales of e-cigarettes and vaping devices approach an annual $7 billion.6 A 2014–2015 survey found that 2.4% of the general US population were current users of e-cigarettes, and 8.5% had tried them at least once.3

In 2014, for the first time, e-cigarette use became more common among US youth than traditional cigarettes.5
The odds of taking up vaping are higher among minority youth in the United States, particularly Hispanics.9 This trend is particularly worrisome because several longitudinal studies have shown that adolescents who use e-cigarettes are 3 times as likely to eventually become smokers of traditional cigarettes compared with adolescents who do not use e-cigarettes.10–12
If US youth continue smoking at the current rate, 5.6 million of the current population under age 18, or 1 of every 13, will die early of a smoking-related illness.13
RECENT OUTBREAK OF VAPING-ASSOCIATED LUNG INJURY
As of November 5, 2019, there had been 2,051 cases of vaping-associated lung injury in 49 states (all except Alaska), the District of Columbia, and 1 US territory reported to the US Centers for Disease Control and Prevention (CDC), with 39 confirmed deaths.4 The reported cases include respiratory injury including acute eosinophilic pneumonia, organizing pneumonia, acute respiratory distress syndrome, and hypersensitivity pneumonitis.14
Most of these patients had been vaping tetrahydrocannabinol (THC), though many used both nicotine- and THC-containing products, and others used products containing nicotine exclusively.4 Thus, it is difficult to identify the exact substance or substances that may be contributing to this sudden outbreak among vape users, and many different product sources are currently under investigation.
One substance that may be linked to the epidemic is vitamin E acetate, which the New York State Department of Health has detected in high levels in cannabis vaping cartridges used by patients who developed lung injury.15 The US Food and Drug Administration (FDA) is continuing to analyze vape cartridge samples submitted by affected patients to look for other chemicals that can contribute to the development of serious pulmonary illness.
WHAT IS AN E-CIGARETTE? WHAT IS A VAPE PEN?

Vape pens consist of similar elements but are not necessarily similar in appearance to a conventional cigarette, and may look more like a pen or a USB flash drive. In fact, the Juul device is recharged by plugging it into a USB port.
Vaping devices have many street names, including e-cigs, e-hookahs, vape pens, mods, vapes, and tank systems.
The first US patent application for a device resembling a modern e-cigarette was filed in 1963, but the product never made it to the market.16 Instead, the first commercially successful e-cigarette was created in Beijing in 2003 and introduced to US markets in 2007.
Newer-generation devices have larger batteries and can heat the liquid to higher temperatures, releasing more nicotine and forming additional toxicants such as formaldehyde. Devices lack standardization in terms of design, capacity for safely holding e-liquid, packaging of the e-liquid, and features designed to minimize hazards of use.
Not just nicotine
Many devices are designed for use with other drugs, including THC.17 In a 2018 study, 10.9% of college students reported vaping marijuana in the past 30 days, up from 5.2% in 2017.18
Other substances are being vaped as well.19 In theory, any heat-stable psychoactive recreational drug could be aerosolized and vaped. There are increasing reports of e-liquids containing recreational drugs such as synthetic cannabinoid receptor agonists, crack cocaine, LSD, and methamphetamine.17
Freedom, rebellion, glamour
Sales have risen rapidly since 2007 with widespread advertising on television and in print publications for popular brands, often featuring celebrities.20 Spending on advertising for e-cigarettes and vape devices rose from $6.4 million in 2011 to $115 million in 2014—and that was before the advent of Juul (see below).21
Marketing campaigns for vaping devices mimic the themes previously used successfully by the tobacco industry, eg, freedom, rebellion, and glamour. They also make unsubstantiated claims about health benefits and smoking cessation, though initial websites contained endorsements from physicians, similar to the strategies of tobacco companies in old cigarette ads. Cigarette ads have been prohibited since 1971—but not e-cigarette ads. Moreover, vaping products appear as product placements in television shows and movies, with advocacy groups on social media.22
By law, buyers have to be 18 or 21

Vaping devices can be purchased at vape shops, convenience stores, gas stations, and over the Internet; up to 50% of sales are conducted online.24
Fruit flavors are popular
Zhu et al25 estimated that 7,700 unique vaping flavors exist, with fruit and candy flavors predominating. The most popular flavors are tobacco and mint, followed by fruit, dessert and candy flavors, alcoholic flavors (strawberry daiquiri, margarita), and food flavors.25 These flavors have been associated with higher usage in youth, leading to increased risk of nicotine addiction.26
WHAT IS JUUL?
The Juul device (Juul Labs, www.juul.com) was developed in 2015 by 2 Stanford University graduates. Their goal was to produce a more satisfying and cigarette-like vaping experience, specifically by increasing the amount of nicotine delivered while maintaining smooth and pleasant inhalation. They created an e-liquid that could be vaporized effectively at lower temperatures.27
While more than 400 brands of vaping devices are currently available in the United States,3 Juul has held the largest market share since 2017,28 an estimated 72.1% as of August 2018.29 The surge in popularity of this particular brand is attributed to its trendy design that is similar in size and appearance to a USB flash drive,29 and its offering of sweet flavors such as “crème brûlée” and “cool mint.”
On April 24, 2018, in view of growing concern about the popularity of Juul products among youth, the FDA requested that the company submit documents regarding its marketing tactics, as well as research on the effects of this marketing on product design and public health impact, and information about adverse experiences and complaints.30 The company was forced to change its marketing to appeal less to youth. Now it offers only 3 flavors: “Virginia tobacco,” “classic tobacco,” and “menthol,” although off-brand pods containing a variety of flavors are still available. And some pods are refillable, so users can essentially vape any substance they want.
Although the Juul device delivers a strong dose of nicotine, it is small and therefore easy to hide from parents and teachers, and widespread use has been reported among youth in middle and high schools. Hoodies, hemp jewelry, and backpacks have been designed to hide the devices and allow for easy, hands-free use. YouTube searches for terms such as “Juul,” “hiding Juul at school,” and “Juul in class,” yield thousands of results.31 A 2017 survey reported that 8% of Americans age 15 to 24 had used Juul in the month prior to the survey.32 “To juul” has become a verb.
Each Juul starter kit contains the rechargeable inhalation device plus 4 flavored pods. In the United States, each Juul pod contains nearly as much nicotine as 1 pack of 20 cigarettes in a concentration of 3% or 5%. (Israel and Europe have forced the company to replace the 5% nicotine pods with 1.7% nicotine pods.33) A starter kit costs $49.99, and additional packs of 4 flavored liquid cartridges or pods cost $15.99.34 Other brands of vape pens cost between $15 and $35, and 10-mL bottles of e-liquid cost approximately $7.
What is ‘dripping’?
Hard-core vapers seeking a more intense experience are taking their vaping devices apart and modifying them for “dripping,” ie, directly dripping vape liquids onto the heated coils for inhalation. In a survey, 1 in 4 high school students using vape devices also used them for dripping, citing desires for a thicker cloud of vapor, more intense flavor, “a stronger throat hit,” curiosity, and other reasons.35 Dripping involves higher temperatures, which leads to higher amounts of nicotine delivered, along with more formaldehyde, acetaldehyde, and acetone (see below).36
BAD THINGS IN E-LIQUID AEROSOL
Studies of vape liquids consistently confirm the presence of toxic substances in the resulting vape aerosol.37–40 Depending on the combination of flavorings and solvents in a given e-liquid, a variety of chemicals can be detected in the aerosol from various vaping devices. Chemicals that may be detected include known irritants of respiratory mucosa, as well as various carcinogens. The list includes:
- Organic volatile compounds such as propylene glycol, glycerin, and toluene
- Aldehydes such as formaldehyde (released when propylene glycol is heated to high temperatures), acetaldehyde, and benzaldehyde
- Acetone and acrolein
- Carcinogenic nitrosamines
- Polycyclic aromatic hydrocarbons
- Particulate matter
- Metals including chromium, cadmium, nickel, and lead; and particles of copper, nickel, and silver have been found in electronic nicotine delivery system aerosol in higher levels than in conventional cigarette smoke.41
The specific chemicals detected can vary greatly between brands, even when the flavoring and nicotine content are equivalent, which frequently results in inconsistent and conflicting study findings. The chemicals detected also vary with the voltage or power used to generate the aerosol. Different flavors may carry varying levels of risk; for example, mint- and menthol-flavored e-cigarettes were shown to expose users to dangerous levels of pulegone, a carcinogenic compound banned as a food additive in 2018.42 The concentrations of some of these chemicals are sufficiently high to be of toxicologic concern; for example, one study reported the presence of benzaldehyde in e-cigarette aerosol at twice the workplace exposure limit.43
Biologic effects
In an in vitro study,44 57% of e-liquids studied were found to be cytotoxic to human pulmonary fibroblasts, lung epithelial cells, and human embryonic stem cells. Fruit-flavored e-liquids in particular caused a significant increase in DNA fragmentation. Cell cultures treated with e-cigarette liquids showed increased oxidative stress, reduced cell proliferation, and increased DNA damage,44 which may have implications for carcinogenic risk.
In another study,45 exposure to e-cigarette aerosol as well as conventional cigarette smoke resulted in suppression of genes related to immune and inflammatory response in respiratory epithelial cells. All genes with decreased expression after exposure to conventional cigarette smoke also showed decreased expression with exposure to e-cigarette smoke, which the study authors suggested could lead to immune suppression at the level of the nasal mucosa. Diacetyl and acetoin, chemicals found in certain flavorings, have been linked to bronchiolitis obliterans, or “popcorn lung.”46
Nicotine is not benign
The nicotine itself in many vaping liquids should also not be underestimated. Nicotine has harmful neurocognitive effects and addictive properties, particularly in the developing brains of adolescents and young adults.47 Nicotine exposure during adolescence negatively affects memory, attention, and emotional regulation,48 as well as executive functioning, reward processing, and learning.49
The brain undergoes major structural remodeling in adolescence, and nicotine acetylcholine receptors regulate neural maturation. Early exposure to nicotine disrupts this process, leading to poor executive functioning, difficulty learning, decreased memory, and issues with reward processing.
Fetal exposure, if nicotine products are used during pregnancy, has also been linked to adverse consequences such as deficits in attention and cognition, behavioral effects, and sudden infant death syndrome.5
Much to learn about toxicity
Partly because vaping devices have been available to US consumers only since 2007, limited evidence is available regarding the long-term effects of exposure to the aerosol from these devices in humans.1 Many of the studies mentioned above were in vitro studies or conducted in mouse models. Differences in device design and the composition of the e-liquid among device brands pose a challenge for developing well-designed studies of the long-term health effects of e-cigarette and vape use. Additionally, devices may have different health impacts when used to vape cannabis or other drugs besides nicotine, which requires further investigation.
E-CIGARETTES AND SMOKING CESSATION
Conventional cigarette smoking is a major public health threat, as tobacco use is responsible for 480,000 deaths annually in the United States.50
And smoking is extremely difficult to quit: as many as 80% of smokers who attempt to quit resume smoking within the first month.51 The chance of successfully quitting improves by over 50% if the individual undergoes nicotine replacement therapy, and it improves even more with counseling.50
There are currently 5 types of FDA-approved nicotine replacement therapy products (gum, patch, lozenge, inhaler, nasal spray) to help with smoking cessation. In addition, 2 non-nicotine prescription drugs (varenicline and bupropion) have been approved for treating tobacco dependence.
Can vaping devices be added to the list of nicotine replacement therapy products? Although some manufacturers try to brand their devices as smoking cessation aids, in one study,52 one-third of e-cigarette users said they had either never used conventional cigarettes or had formerly smoked them.
Bullen et al53 randomized smokers interested in quitting to receive either e-cigarettes, nicotine patches, or placebo (nicotine-free) e-cigarettes and followed them for 6 months. Rates of tobacco cessation were less than predicted for the entire study population, resulting in insufficient power to determine the superiority of any single method, but the study authors concluded that nicotine e-cigarettes were “modestly effective” at helping smokers quit, and that abstinence rates may be similar to those with nicotine patches.53
Hajek et al54 randomized 886 smokers to e-cigarette or nicotine replacement products of their choice. After 1 year, 18% of e-cigarette users had stopped smoking, compared with 9.9% of nicotine replacement product users. However, 80% of the e-cigarette users were still using e-cigarettes after 1 year, while only 9% of nicotine replacement product users were still using nicotine replacement therapy products after 1 year.
While quitting conventional cigarette smoking altogether has widely established health benefits, little is known about the health benefits of transitioning from conventional cigarette smoking to reduced conventional cigarette smoking with concomitant use of e-cigarettes.
Campagna et al55 found no beneficial health effects in smokers who partially substituted conventional cigarettes for e-cigarettes.
Many studies found that smokers use e-cigarettes to maintain their habit instead of quitting entirely.56 It has been suggested that any slight increase in effectiveness in smoking cessation by using e-cigarettes compared with other nicotine replacement products could be linked to satisfying of the habitual smoking actions, such as inhaling and bringing the hand to the mouth,24 which are absent when using other nicotine replacement methods such as a nicotine patch.
As with safety information, long-term outcomes regarding the use of vape devices for smoking cessation have not been yet established, as this option is still relatively new.
VAPING AS A GATEWAY DRUG
Another worrisome trend involving electronic nicotine delivery systems is their marketing and branding, which appear to be aimed directly at adolescents and young adults. Juul and other similar products cannot be sold to anyone under the age of 18 (or 21 in 18 states, including California, Massachusetts, New York, and now Ohio). Despite this, Juul and similar products continue to increase in popularity among middle school and high school students.57
While smoking cessation and health improvement are cited as reasons for vaping among middle-aged and older adults, adolescents and young adults more often cite flavor, enjoyment, peer use, and curiosity as reasons for use.
Adolescents are more likely to report interest in trying a vape product flavored with menthol or fruit than tobacco, and commonly hold the belief that fruit-flavored e-cigarettes are less harmful than tobacco-flavored e-cigarettes.58 Harrell et al59 polled youth and young adults who used flavored e-cigarettes, and 78% said they would no longer use the product if their preferred flavor were not available. In September 2019, Michigan became the first state to ban the sale of flavored e-cigarettes in stores and online. Similar bills have been introduced in California, Massachusetts, and New York.60
Myths and misperceptions abound among youth regarding smoking vs vaping. Young people view regular cigarette smoking negatively, as causing cancer, bad breath, and asthma exacerbations. Meanwhile, they believe marijuana is safer and less addictive than traditional cigarette smoking.61 Youth exposed to e-cigarette advertisements viewed e-cigarettes as healthier, more enjoyable, “cool,” safe, and fun.61 The overall public health impact of increasing initiation of smoking, particularly among youth and young adults, should not be underestimated.
SECONDHAND VAPE AND OTHER EXPOSURE RISKS
Cigarette smoking has been banned in many public places, in view of a large body of scientific evidence about the harmful effects of secondhand smoke. Advocates for allowing vaping in public places say that vaping emissions do not harm bystanders, but evidence is insufficient to support this claim.62 One study showed that passive exposure to e-cigarette aerosol generated increases in serum levels of cotinine (a nicotine metabolite) similar to those with passive exposure to conventional cigarette smoke.5
Accidental nicotine poisoning in children as a result of ingesting e-cigarette liquid is also a major concern,63 particularly with sweet flavors such as bubblegum or cheesecake that may be attractive to children.
Calls to US poison control centers with respect to e-cigarettes and vaping increased from 1 per month in September 2010 to 215 in February 2014, with 51% involving children under age 5.64 This trend resulted in the Child Nicotine Poisoning Prevention Act, which passed in 2015 and went into effect in 2016, requiring packaging that is difficult to open for children under age 5.5
Device malfunctions or battery failures have led to explosions that have resulted in substantial injuries to users, as well as house and car fires.49
HOW DO WE DISCOURAGE ADOLESCENT USE?
There are currently no established treatment approaches for adolescents who have become addicted to vaping. A review of the literature regarding treatment modalities used to address adolescent use of tobacco and marijuana provides insight that options such as nicotine replacement therapy and counseling modalities such as cognitive behavioral therapy may be helpful in treating teen vaping addiction. However, more research is needed to determine the effectiveness of these treatments in youth addicted to vaping.
Given that youth who vape even once are more likely to try other types of tobacco, we recommend that parents and healthcare providers start conversations by asking what the young person has seen or heard about vaping. Young people can also be asked what they think the school’s response should be: Do they think vaping should be banned in public places, as cigarettes have been banned? What about the carbon footprint? What are their thoughts on the plastic waste, batteries, and other toxins generated by the e-cigarette industry?
New US laws ban the sale of e-cigarettes and vaping devices to minors in stores and online. These policies are modeled in many cases on environmental control policies that have been previously employed to reduce tobacco use, particularly by youth. For example, changing laws to mandate sales only to individuals age 21 and older in all states can help to decrease access to these products among middle school and high school students.
As with tobacco cessation, education will not be enough. Support of legislation that bans vaping in public places, increases pricing to discourage adolescent use, and other measures used successfully to decrease conventional cigarette smoking can be deployed to decrease the public health impact of e-cigarettes. We recommend further regulation of specific harmful chemicals and clear, detailed ingredient labeling to increase consumer understanding of the risks associated with these products. Additionally, we recommend eliminating flavored e-cigarettes, which are the most appealing type for young users, and raising prices of e-cigarettes and similar products to discourage use by youth.
If current cigarette smokers want to use e-cigarettes to quit, we recommend that clinicians counsel them to eventually completely stop use of traditional cigarettes and switch to using e-cigarettes, instead of becoming a dual user of both types of products or using e-cigarettes indefinitely. After making that switch, they should then work to gradually taper usage and nicotine addiction by reducing the amount of nicotine in the e-liquid. Clinicians should ask patients about use of e-cigarettes and vaping devices specifically, and should counsel nonsmokers to avoid initiation of use.
EVIDENCE OF HARM CONTINUES TO EMERGE
Data about respiratory effects, secondhand exposure, and long-term smoking cessation efficacy are still limited, and it remains as yet unknown what combinations of solvents, flavorings, and nicotine in a given e-liquid will result in the most harmful or least harmful effects. In addition, while much of the information about the safety of these components has been obtained using in vitro or mouse models, increasing reports of serious respiratory illness and rising numbers of deaths linked to vaping make it clear that these findings likely translate to harmful effects in humans.
E-cigarettes may ultimately prove to be less harmful than traditional cigarettes, but it seems likely that with further time and research, serious health risks of e-cigarette use will continue to emerge.
- Sood A, Kesic M, Hernandez M. Electronic cigarettes: one size does not fit all. J Allergy Clin Immunol 2018; 141(6):1973-1982. doi:10.1016/j.jaci.2018.02.029
- Romijnders K, van Osch L, de Vries H, Talhout R. Perceptions and reasons regarding e-cigarette use among users and non-users: a narrative literature review. Int J Environ Res Public Health 2018; 15(6):1190. doi:10.3390/ijerph15061190
- Zhu S, Zhuang Y-L, Wong S, Cummins SE, Tedeschi GJ. E-cigarette use and associated changes in population smoking cessation: evidence from US current population surveys. BMJ 2017; 358:j3262. doi:10.1136/bmj.j3262
- Centers for Disease Control and Prevention. Outbreak of lung injury associated with e-cigarette use, or vaping. Updated November 5, 2019. www.cdc.gov/tobacco/basic_information/e-Cigarettes/severe-Lung-Disease.html. Accessed November 14, 2019.
- US Public Health Services, US Department of Health and Human Services. E-cigarette use among youth and young adults: a report of the Surgeon General. Rockville, MD, U.S. Department of Health and Human Services, 2016. https://e-cigarettes.surgeongeneral.gov/documents/2016_sgr_full_report_non-508.pdf. Accessed November 14, 2019.
- Thomas K, Kaplan S. E-cigarettes went unchecked in 10 years of federal inaction. New York Times Oct 14, 2019; updated November 1, 2019. www.nytimes.com/2019/10/14/health/vaping-e-cigarettes-fda.html.
- Cullen KA, Ambrose BK, Gentzke AS, Apelberg BJ, Jamal A, King BA. Notes from the field: use of electronic cigarettes and any tobacco product among middle and high school students—United States, 2011–2018. MMWR Morb Mortal Wkly Rep 2018; 67(45):1276–1277. doi:10.15585/mmwr.mm6745a5
- Gentzke A, Creamer M, Cullen K, et al; Centers for Disease Control and Prevention. Vital signs: tobacco product use among middle and high school students—United States, 2011–2018. MMWR Morb Mortal Wkly Rep 2019; 68(6):157–164. doi:10.15585/mmwr.mm6806e1
- Hammig B, Daniel-Dobbs P, Blunt-Vinti H. Electronic cigarette initiation among minority youth in the United States. Am J Drug Alcohol Abuse 2017; 43(3):306–310. doi:10.1080/00952990.2016.1203926
- Primack BA, Soneji S, Stoolmiller M, Fine MJ, Sargent JD. Progression to traditional cigarette smoking after electronic cigarette use among U.S. adolescents and young adults. JAMA Pediatr 2015; 169(11):1018–1023. doi:10.1001/jamapediatrics.2015.1742
- Leventhal AM, Strong DR, Kirkpatrick MG, et al. Association of electronic cigarette use with initiation of combustible tobacco product smoking in early adolescence. JAMA 2015; 314(7):700–707. doi:10.1001/jama.2015.8950
- Wills TA, Knight R, Sargent JD, Gibbons FX, Pagano I, Williams RJ. Longitudinal study of e-cigarette use and onset of cigarette smoking among high school students in Hawaii. Tob Control 2016; 26(1):34–39. doi:10.1136/tobaccocontrol-2015-052705
- National Center for Chronic Disease Prevention and Health Promotion (US) Office on Smoking and Health. The health consequences of smoking—50 years of progress: a report of the Surgeon General. Atlanta: Centers for Disease Control and Prevention, 2014. www.ncbi.nlm.nih.gov/books/NBK179276/pdf/Bookshelf_NBK179276.pdf. Accessed November 14, 2019.
- Christiani DC. Vaping-induced lung injury. N Engl J Med 2019; Sept 6. Epub ahead of print. doi:10.1056/NEJMe1912032
- Neel J, Aubrey A. Vitamin E suspected in serious lung problems among people who vaped cannabis. NPR Sept 5, 2019. www.npr.org/sections/health-shots/2019/09/05/758005409/vitamin-e-suspected-in-serious-lung-problems-among-people-who-vaped-cannabis. Accessed November 14, 2019.
- White A. Plans for the first e-cigarette went up in smoke 50 years ago. Smithsonian Magazine December 2018. www.smithsonianmag.com/innovation/plans-for-first-e-cigarette-went-up-in-smoke-50-years-ago-180970730.
- Blundell MS, Dargan PI, Wood DM. The dark cloud of recreational drugs and vaping. QJM 2018; 111(3):145–148. doi:10.1093/qjmed/hcx049
- Schulenberg JE, Johnston LD, O’Malley PM, Bachman JG, Miech RA, Patrick ME. Monitoring the future: national survey results on drug use, 1975–2018. 2018 Volume 2. College students & adults ages 19–60. www.monitoringthefuture.org/pubs/monographs/mtf-vol2_2018.pdf. Accessed November 14, 2019.
- Eggers ME, Lee YO, Jackson J, Wiley JL, Porter J, Nonnemaker JM. Youth use of electronic vapor products and blunts for administering cannabis. Addict Behav 2017; 70:79-82. doi:10.1016/j.addbeh.2017.02.020
- Regan AK, Promoff G, Dube SR, Arrazola R. Electronic nicotine delivery systems: adult use and awareness of the “e-cigarette”in the USA. Tob Control 2013; 22(1):19–23. doi:10.1136/tobaccocontrol-2011-050044
- Centers for Disease Control and Prevention. E-cigarette ads and youth. www.cdc.gov/vitalsigns/ecigarette-ads/index.html.
- Noel JK, Rees VW, Connolly GN. Electronic cigarettes: a new “tobacco” industry? Tob Control 2011; 20(1):81. doi:10.1136/tc.2010.038562
- US Food and Drug Administration. Deeming tobacco products to be subject to the federal food, drug, and cosmetic act, as amended by the family smoking prevention and tobacco control act; restrictions on the sale and distribution of tobacco products and required warning statements for tobacco products. Federal Register 2016; 81(90), May 10, 2016. www.govinfo.gov/content/pkg/FR-2016-05-10/pdf/2016-10685.pdf. Accessed November 14, 2019.
- Rom O, Pecorelli A, Valacchi G, Reznick AZ. Are e-cigarettes a safe and good alternative to cigarette smoking? Ann NY Acad Sci 2015; 1340:65–74. doi:10.1111/nyas.12609
- Zhu SH, Sun JY, Bonnevie E, et al. Four hundred and sixty brands of e-cigarettes and counting: implications for product regulation. Tob Control 2014; 23(suppl 3):iii3-iii9. doi:10.1136/tobaccocontrol-2014-051670
- Kong G, Morean ME, Cavallo DA, Camenga DR, Krishnan-Sarin S. Reasons for electronic cigarette experimentation and discontinuation among adolescents and young adults. Nicotine Tob Res 2015; 17(7):847–854. doi:10.1093/ntr/ntu257
- Baca MC. How two Stanford grads aimed for big tech glory and got big tobacco instead. Updated September 4, 2019. The Washington Post September 4, 2019. www.washingtonpost.com/technology/2019/09/04/how-two-stanford-grads-aimed-big-tech-glory-got-big-tobacco-instead. Accessed November 14, 2019.
- Huang J, Duan Z, Kwok J, et al. Vaping versus JUULing: how the extraordinary growth and marketing of JUUL transformed the US retail e-cigarette market. Tob Control 2019; 28(2):146–151. doi:10.1136/tobaccocontrol-2018-054382
- Walley SC, Wilson KM, Winickoff JP, Groner J. A public health crisis: electronic cigarettes, vape, and JUUL. Pediatrics 2019; 143(6):pii:e20182741. doi:10.1542/peds.2018-2741
- Zernike K. F.D.A. cracks down on “juuling” among teenagers. The New York Times April 24, 2018. www.nytimes.com/2018/04/24/health/fda-e-cigarettes-minors-juul.html. Accessed November 14, 2019.
- Ramamurthi D, Chau C, Jackler RK. JUUL and other stealth vaporisers: hiding the habit from parents and teachers. Tob Control 2018 Sep 15; pii:tobaccocontrol-2018-054455. doi:10.1136/tobaccocontrol-2018-054455. [Epub ahead of print]
- Willett JG, Bennett M, Hair EC, et al. Recognition, use and perceptions of JUUL among youth and young adults. Tob Control 2019; 28(1):115–116. doi:10.1136/tobaccocontrol-2018-054273
- Kaplan S. Juul’s new product: less nicotine, more intense vapor. New York Times Nov 27, 2018. www.nytimes.com/2018/11/27/health/juul-ecigarettes-nicotine.html.
- JUUL Labs. JUULpods. www.juul.com/shop/pods. Accessed November 14, 2019.
- Krishnan-Sarin S, Morean M, Kong G, et al. E-cigarettes and “dripping” among high-school youth. Pediatrics 2017; 139(3):pii:e20163224. doi:10.1542/peds.2016-3224
- Kosmider L, Sobczak A, Fik M, et al. Carbonyl compounds in electronic cigarette vapors: effects of nicotine solvent and battery output voltage. Nicotine Tob Res 2014; 16(10):1319–1326. doi:10.1093/ntr/ntu078
- Rawlinson C, Martin S, Frosina J, Wright C. Chemical characterisation of aerosols emitted by electronic cigarettes using thermal desorption-gas chromatography-time of flight mass spectrometry. J Chromatogr A 2017; 1497:144–154. doi:10.1016/j.chroma.2017.02.050
- Lee MS, LeBouf RF, Son YS, Koutrakis P, Christiani DC. Nicotine, aerosol particles, carbonyls and volatile organic compounds in tobacco- and menthol-flavored e-cigarettes. Environ Health 2017; 16(1):42. doi:10.1186/s12940-017-0249-x
- Williams M, Bozhilov K, Ghai S, Talbot P. Elements including metals in the atomizer and aerosol of disposable electronic cigarettes and electronic hookahs. PLoS One 2017; 12(4):e0175430. doi:10.1371/journal.pone.0175430.
- Goniewicz ML, Knysak J, Gawron M, et al. Levels of selected carcinogens and toxicants in vapour from electronic cigarettes. Tob Control 2014; 23(2):133–139. doi:10.1136/tobaccocontrol-2012-050859
- Drope J, Cahn Z, Kennedy R, et al. Key issues surrounding the health impacts of electronic nicotine delivery systems (ENDS) and other sources of nicotine. CA Cancer J Clin 2017; 67(6):449–471. doi:10.3322/caac.21413
- Jabba SV, Jordt SE. Risk analysis for the carcinogen pulegone in mint- and menthol-flavored e-cigarettes and smokeless tobacco products. JAMA Intern Med 2019 Sep 16 [Epub ahead of print]. doi:10.1001/jamainternmed.2019.3649
- Tierney PA, Karpinsky CD, Brown JE, Luo W, Pankow JF. Flavour chemicals in electronic cigarette fluids. Tob Control 2016; 25(e1):e10–e15. doi:10.1136/tobaccocontrol-2014-052175
- Behar RZ, Wang Y, Talbot P. Comparing the cytotoxicity of electronic cigarette fluids, aerosols and solvents. Tob Control 2017; 27(3):325–333. doi:10.1136/tobaccocontrol-2016-053472
- Martin EM, Clapp PW, Rebuli ME, et al. E-cigarette use results in suppression of immune and inflammatory-response genes in nasal epithelial cells similar to cigarette smoke. Am J Physiol Lung Cell Mol Physiol 2016; 311(1):L135–L144. doi:10.1152/ajplung.00170.2016
- Holden VK, Hines SE. Update on flavoring-induced lung disease. Curr Opin Pulm Med 2016;22(2):158–164. doi:10.1097/MCP.0000000000000250
- Siqueira L; Committee on Substance Use and Prevention. Nicotine and tobacco as substances of abuse in children and adolescents. Pediatrics 2017; 139(1):pii:e20163436. doi:10.1542/peds.2016-3436
- England LJ, Bunnell RE, Pechacek TF, Tong VT, McAfee TA. Nicotine and the developing human: a neglected element in the electronic cigarette debate. Am J Prev Med 2015; 49(2):286–293. doi:10.1016/j.amepre.2015.01.015
- Modesto-Lowe V, Alvarado C. E-cigs…are they cool? Talking to teens about e-cigarettes. Clin Pediatr (Phila) 2017; 51(10):947–952. doi:10.1177/0009922817705188
- Prochaska JJ, Benowitz NL. The past, present, and future of nicotine addiction therapy. Annu Rev Med 2017; 67:467–486. doi:10.1146/annurev-med-111314-033712
- Hughes JR, Keely J, Naud S. Shape of the relapse curve and long-term abstinence among untreated smokers. Addiction 2004; 99(1):29–38. doi:10.1111/j.1360-0443.2004.00540.x
- McMillen RC, Gottlieb MA, Shaefer RM, Winickoff JP, Klein JD. Trends in electronic cigarette use among U.S. adults: use is increasing in both smokers and nonsmokers. Nicotine Tob Res 2015;17(10):119_1202. doi:10.1093/ntr/ntu213
- Bullen C, Howe C, Laugesen M, et al. Electronic cigarettes for smoking cessation: a randomised controlled trial. Lancet 2013; 382(9905):1629–1637. doi:10.1016/S0140-6736(13)61842-5
- Hajek P, Phillips-Waller A, Przulj D, et al. A randomized trial of e-cigarettes versus nicotine replacement therapy. N Engl J Med 2019; 380(7):629–637. doi:10.1056/NEJMoa1808779
- Campagna D, Cibella F, Caponnetto P, et al. Changes in breathomics from a 1-year randomized smoking cessation trial of electronic cigarettes. Eur J Clin Invest 2016; 46(8):698–706. doi:10.1111/eci.12651
- Rehan HS, Maini J, Hungin APS. Vaping versus smoking: a quest for efficacy and safety of e-cigarette. Curr Drug Saf 2018; 13(2):92–101. doi:10.2174/1574886313666180227110556
- Zernike K. ‘I can’t stop’: schools struggle with vaping explosion. New York Times April 2, 2018. www.nytimes.com/2018/04/02/health/vaping-ecigarettes-addiction-teen.html.
- Pepper JK, Ribisl KM, Brewer NT. Adolescents’ interest in trying flavoured e-cigarettes. Tob Control 2016; 25(suppl 2):ii62–ii66. doi:10.1136/tobaccocontrol-2016-053174
- Harrell MB, Loukas A, Jackson CD, Marti CN, Perry CL. Flavored tobacco product use among youth and young adults: what if flavors didn’t exist? Tob Regul Sci 2017; 3(2):168–173. doi:10.18001/TRS.3.2.4
- Smith M. Amid vaping crackdown, Michigan to ban sale of flavored e-cigarettes. New York Times Sept 4, 2019. www.nytimes.com/2019/09/04/us/michigan-vaping.html?module=inline.
- Roditis ML, Halpern-Felsher B. Adolescents’ perceptions of risks and benefits of conventional cigarettes, e-cigarettes, and marijuana: a qualitative analysis. J Adolesc Health 2015; 57(2):179–185. doi:10.1016/j.jadohealth.2015.04.002
- Chapman S, Daube M, Maziak W. Should e-cigarette use be permitted in smoke-free public places? No. Tob Control 2017; 26(e1):e3–e4. doi:10.1136/tobaccocontrol-2016-053359
- Marcham CL, Springston JP. Electronic cigarettes in the indoor environment. Rev Env Health 2019; 34(2):105–124. doi:10.1515/reveh-2019-0012
- Chatham-Stephens K, Law R, Taylor E, et al; Centers for Disease Control and Prevention. Notes from the field: calls to poison centers for exposures to electronic cigarettes—United States, September 2010–September 2014. MMWR Morb Mortal Wkly Report 2014; 63(13):292–293. pmid:24699766
Electronic cigarettes and other “vaping” devices have been increasing in popularity among youth and adults since their introduction in the US market in 2007.1 This increase is partially driven by a public perception that vaping is harmless, or at least less harmful than cigarette smoking.2 Vaping fans also argue that current smokers can use vaping as nicotine replacement therapy to help them quit smoking.3
We disagree. Research on the health effects of vaping, though still limited, is accumulating rapidly and making it increasingly clear that this habit is far from harmless. For youth, it is a gateway to addiction to nicotine and other substances. Whether it can help people quit smoking remains to be seen. And recent months have seen reports of serious respiratory illnesses and even deaths linked to vaping.4
In December 2016, the US Surgeon General warned that e-cigarette use among youth and young adults in the United States represents a “major public health concern,”5 and that more adolescents and young adults are now vaping than smoking conventional tobacco products.
This article reviews the issue of vaping in the United States, as well as available evidence regarding its safety.
YOUTH AT RISK
Retail sales of e-cigarettes and vaping devices approach an annual $7 billion.6 A 2014–2015 survey found that 2.4% of the general US population were current users of e-cigarettes, and 8.5% had tried them at least once.3
In 2014, for the first time, e-cigarette use became more common among US youth than traditional cigarettes.5
The odds of taking up vaping are higher among minority youth in the United States, particularly Hispanics.9 This trend is particularly worrisome because several longitudinal studies have shown that adolescents who use e-cigarettes are 3 times as likely to eventually become smokers of traditional cigarettes compared with adolescents who do not use e-cigarettes.10–12
If US youth continue smoking at the current rate, 5.6 million of the current population under age 18, or 1 of every 13, will die early of a smoking-related illness.13
RECENT OUTBREAK OF VAPING-ASSOCIATED LUNG INJURY
As of November 5, 2019, there had been 2,051 cases of vaping-associated lung injury in 49 states (all except Alaska), the District of Columbia, and 1 US territory reported to the US Centers for Disease Control and Prevention (CDC), with 39 confirmed deaths.4 The reported cases include respiratory injury including acute eosinophilic pneumonia, organizing pneumonia, acute respiratory distress syndrome, and hypersensitivity pneumonitis.14
Most of these patients had been vaping tetrahydrocannabinol (THC), though many used both nicotine- and THC-containing products, and others used products containing nicotine exclusively.4 Thus, it is difficult to identify the exact substance or substances that may be contributing to this sudden outbreak among vape users, and many different product sources are currently under investigation.
One substance that may be linked to the epidemic is vitamin E acetate, which the New York State Department of Health has detected in high levels in cannabis vaping cartridges used by patients who developed lung injury.15 The US Food and Drug Administration (FDA) is continuing to analyze vape cartridge samples submitted by affected patients to look for other chemicals that can contribute to the development of serious pulmonary illness.
WHAT IS AN E-CIGARETTE? WHAT IS A VAPE PEN?
Vape pens consist of similar elements but are not necessarily similar in appearance to a conventional cigarette, and may look more like a pen or a USB flash drive. In fact, the Juul device is recharged by plugging it into a USB port.
Vaping devices have many street names, including e-cigs, e-hookahs, vape pens, mods, vapes, and tank systems.
The first US patent application for a device resembling a modern e-cigarette was filed in 1963, but the product never made it to the market.16 Instead, the first commercially successful e-cigarette was created in Beijing in 2003 and introduced to US markets in 2007.
Newer-generation devices have larger batteries and can heat the liquid to higher temperatures, releasing more nicotine and forming additional toxicants such as formaldehyde. Devices lack standardization in terms of design, capacity for safely holding e-liquid, packaging of the e-liquid, and features designed to minimize hazards of use.
Not just nicotine
Many devices are designed for use with other drugs, including THC.17 In a 2018 study, 10.9% of college students reported vaping marijuana in the past 30 days, up from 5.2% in 2017.18
Other substances are being vaped as well.19 In theory, any heat-stable psychoactive recreational drug could be aerosolized and vaped. There are increasing reports of e-liquids containing recreational drugs such as synthetic cannabinoid receptor agonists, crack cocaine, LSD, and methamphetamine.17
Freedom, rebellion, glamour
Sales have risen rapidly since 2007 with widespread advertising on television and in print publications for popular brands, often featuring celebrities.20 Spending on advertising for e-cigarettes and vape devices rose from $6.4 million in 2011 to $115 million in 2014—and that was before the advent of Juul (see below).21
Marketing campaigns for vaping devices mimic the themes previously used successfully by the tobacco industry, eg, freedom, rebellion, and glamour. They also make unsubstantiated claims about health benefits and smoking cessation, though initial websites contained endorsements from physicians, similar to the strategies of tobacco companies in old cigarette ads. Cigarette ads have been prohibited since 1971—but not e-cigarette ads. Moreover, vaping products appear as product placements in television shows and movies, with advocacy groups on social media.22
By law, buyers have to be 18 or 21
Vaping devices can be purchased at vape shops, convenience stores, gas stations, and over the Internet; up to 50% of sales are conducted online.24
Fruit flavors are popular
Zhu et al25 estimated that 7,700 unique vaping flavors exist, with fruit and candy flavors predominating. The most popular flavors are tobacco and mint, followed by fruit, dessert and candy flavors, alcoholic flavors (strawberry daiquiri, margarita), and food flavors.25 These flavors have been associated with higher usage in youth, leading to increased risk of nicotine addiction.26
WHAT IS JUUL?
The Juul device (Juul Labs, www.juul.com) was developed in 2015 by 2 Stanford University graduates. Their goal was to produce a more satisfying and cigarette-like vaping experience, specifically by increasing the amount of nicotine delivered while maintaining smooth and pleasant inhalation. They created an e-liquid that could be vaporized effectively at lower temperatures.27
While more than 400 brands of vaping devices are currently available in the United States,3 Juul has held the largest market share since 2017,28 an estimated 72.1% as of August 2018.29 The surge in popularity of this particular brand is attributed to its trendy design that is similar in size and appearance to a USB flash drive,29 and its offering of sweet flavors such as “crème brûlée” and “cool mint.”
On April 24, 2018, in view of growing concern about the popularity of Juul products among youth, the FDA requested that the company submit documents regarding its marketing tactics, as well as research on the effects of this marketing on product design and public health impact, and information about adverse experiences and complaints.30 The company was forced to change its marketing to appeal less to youth. Now it offers only 3 flavors: “Virginia tobacco,” “classic tobacco,” and “menthol,” although off-brand pods containing a variety of flavors are still available. And some pods are refillable, so users can essentially vape any substance they want.
Although the Juul device delivers a strong dose of nicotine, it is small and therefore easy to hide from parents and teachers, and widespread use has been reported among youth in middle and high schools. Hoodies, hemp jewelry, and backpacks have been designed to hide the devices and allow for easy, hands-free use. YouTube searches for terms such as “Juul,” “hiding Juul at school,” and “Juul in class,” yield thousands of results.31 A 2017 survey reported that 8% of Americans age 15 to 24 had used Juul in the month prior to the survey.32 “To juul” has become a verb.
Each Juul starter kit contains the rechargeable inhalation device plus 4 flavored pods. In the United States, each Juul pod contains nearly as much nicotine as 1 pack of 20 cigarettes in a concentration of 3% or 5%. (Israel and Europe have forced the company to replace the 5% nicotine pods with 1.7% nicotine pods.33) A starter kit costs $49.99, and additional packs of 4 flavored liquid cartridges or pods cost $15.99.34 Other brands of vape pens cost between $15 and $35, and 10-mL bottles of e-liquid cost approximately $7.
What is ‘dripping’?
Hard-core vapers seeking a more intense experience are taking their vaping devices apart and modifying them for “dripping,” ie, directly dripping vape liquids onto the heated coils for inhalation. In a survey, 1 in 4 high school students using vape devices also used them for dripping, citing desires for a thicker cloud of vapor, more intense flavor, “a stronger throat hit,” curiosity, and other reasons.35 Dripping involves higher temperatures, which leads to higher amounts of nicotine delivered, along with more formaldehyde, acetaldehyde, and acetone (see below).36
BAD THINGS IN E-LIQUID AEROSOL
Studies of vape liquids consistently confirm the presence of toxic substances in the resulting vape aerosol.37–40 Depending on the combination of flavorings and solvents in a given e-liquid, a variety of chemicals can be detected in the aerosol from various vaping devices. Chemicals that may be detected include known irritants of respiratory mucosa, as well as various carcinogens. The list includes:
- Organic volatile compounds such as propylene glycol, glycerin, and toluene
- Aldehydes such as formaldehyde (released when propylene glycol is heated to high temperatures), acetaldehyde, and benzaldehyde
- Acetone and acrolein
- Carcinogenic nitrosamines
- Polycyclic aromatic hydrocarbons
- Particulate matter
- Metals including chromium, cadmium, nickel, and lead; and particles of copper, nickel, and silver have been found in electronic nicotine delivery system aerosol in higher levels than in conventional cigarette smoke.41
The specific chemicals detected can vary greatly between brands, even when the flavoring and nicotine content are equivalent, which frequently results in inconsistent and conflicting study findings. The chemicals detected also vary with the voltage or power used to generate the aerosol. Different flavors may carry varying levels of risk; for example, mint- and menthol-flavored e-cigarettes were shown to expose users to dangerous levels of pulegone, a carcinogenic compound banned as a food additive in 2018.42 The concentrations of some of these chemicals are sufficiently high to be of toxicologic concern; for example, one study reported the presence of benzaldehyde in e-cigarette aerosol at twice the workplace exposure limit.43
Biologic effects
In an in vitro study,44 57% of e-liquids studied were found to be cytotoxic to human pulmonary fibroblasts, lung epithelial cells, and human embryonic stem cells. Fruit-flavored e-liquids in particular caused a significant increase in DNA fragmentation. Cell cultures treated with e-cigarette liquids showed increased oxidative stress, reduced cell proliferation, and increased DNA damage,44 which may have implications for carcinogenic risk.
In another study,45 exposure to e-cigarette aerosol as well as conventional cigarette smoke resulted in suppression of genes related to immune and inflammatory response in respiratory epithelial cells. All genes with decreased expression after exposure to conventional cigarette smoke also showed decreased expression with exposure to e-cigarette smoke, which the study authors suggested could lead to immune suppression at the level of the nasal mucosa. Diacetyl and acetoin, chemicals found in certain flavorings, have been linked to bronchiolitis obliterans, or “popcorn lung.”46
Nicotine is not benign
The nicotine itself in many vaping liquids should also not be underestimated. Nicotine has harmful neurocognitive effects and addictive properties, particularly in the developing brains of adolescents and young adults.47 Nicotine exposure during adolescence negatively affects memory, attention, and emotional regulation,48 as well as executive functioning, reward processing, and learning.49
The brain undergoes major structural remodeling in adolescence, and nicotine acetylcholine receptors regulate neural maturation. Early exposure to nicotine disrupts this process, leading to poor executive functioning, difficulty learning, decreased memory, and issues with reward processing.
Fetal exposure, if nicotine products are used during pregnancy, has also been linked to adverse consequences such as deficits in attention and cognition, behavioral effects, and sudden infant death syndrome.5
Much to learn about toxicity
Partly because vaping devices have been available to US consumers only since 2007, limited evidence is available regarding the long-term effects of exposure to the aerosol from these devices in humans.1 Many of the studies mentioned above were in vitro studies or conducted in mouse models. Differences in device design and the composition of the e-liquid among device brands pose a challenge for developing well-designed studies of the long-term health effects of e-cigarette and vape use. Additionally, devices may have different health impacts when used to vape cannabis or other drugs besides nicotine, which requires further investigation.
E-CIGARETTES AND SMOKING CESSATION
Conventional cigarette smoking is a major public health threat, as tobacco use is responsible for 480,000 deaths annually in the United States.50
And smoking is extremely difficult to quit: as many as 80% of smokers who attempt to quit resume smoking within the first month.51 The chance of successfully quitting improves by over 50% if the individual undergoes nicotine replacement therapy, and it improves even more with counseling.50
There are currently 5 types of FDA-approved nicotine replacement therapy products (gum, patch, lozenge, inhaler, nasal spray) to help with smoking cessation. In addition, 2 non-nicotine prescription drugs (varenicline and bupropion) have been approved for treating tobacco dependence.
Can vaping devices be added to the list of nicotine replacement therapy products? Although some manufacturers try to brand their devices as smoking cessation aids, in one study,52 one-third of e-cigarette users said they had either never used conventional cigarettes or had formerly smoked them.
Bullen et al53 randomized smokers interested in quitting to receive either e-cigarettes, nicotine patches, or placebo (nicotine-free) e-cigarettes and followed them for 6 months. Rates of tobacco cessation were less than predicted for the entire study population, resulting in insufficient power to determine the superiority of any single method, but the study authors concluded that nicotine e-cigarettes were “modestly effective” at helping smokers quit, and that abstinence rates may be similar to those with nicotine patches.53
Hajek et al54 randomized 886 smokers to e-cigarette or nicotine replacement products of their choice. After 1 year, 18% of e-cigarette users had stopped smoking, compared with 9.9% of nicotine replacement product users. However, 80% of the e-cigarette users were still using e-cigarettes after 1 year, while only 9% of nicotine replacement product users were still using nicotine replacement therapy products after 1 year.
While quitting conventional cigarette smoking altogether has widely established health benefits, little is known about the health benefits of transitioning from conventional cigarette smoking to reduced conventional cigarette smoking with concomitant use of e-cigarettes.
Campagna et al55 found no beneficial health effects in smokers who partially substituted conventional cigarettes for e-cigarettes.
Many studies found that smokers use e-cigarettes to maintain their habit instead of quitting entirely.56 It has been suggested that any slight increase in effectiveness in smoking cessation by using e-cigarettes compared with other nicotine replacement products could be linked to satisfying of the habitual smoking actions, such as inhaling and bringing the hand to the mouth,24 which are absent when using other nicotine replacement methods such as a nicotine patch.
As with safety information, long-term outcomes regarding the use of vape devices for smoking cessation have not been yet established, as this option is still relatively new.
VAPING AS A GATEWAY DRUG
Another worrisome trend involving electronic nicotine delivery systems is their marketing and branding, which appear to be aimed directly at adolescents and young adults. Juul and other similar products cannot be sold to anyone under the age of 18 (or 21 in 18 states, including California, Massachusetts, New York, and now Ohio). Despite this, Juul and similar products continue to increase in popularity among middle school and high school students.57
While smoking cessation and health improvement are cited as reasons for vaping among middle-aged and older adults, adolescents and young adults more often cite flavor, enjoyment, peer use, and curiosity as reasons for use.
Adolescents are more likely to report interest in trying a vape product flavored with menthol or fruit than tobacco, and commonly hold the belief that fruit-flavored e-cigarettes are less harmful than tobacco-flavored e-cigarettes.58 Harrell et al59 polled youth and young adults who used flavored e-cigarettes, and 78% said they would no longer use the product if their preferred flavor were not available. In September 2019, Michigan became the first state to ban the sale of flavored e-cigarettes in stores and online. Similar bills have been introduced in California, Massachusetts, and New York.60
Myths and misperceptions abound among youth regarding smoking vs vaping. Young people view regular cigarette smoking negatively, as causing cancer, bad breath, and asthma exacerbations. Meanwhile, they believe marijuana is safer and less addictive than traditional cigarette smoking.61 Youth exposed to e-cigarette advertisements viewed e-cigarettes as healthier, more enjoyable, “cool,” safe, and fun.61 The overall public health impact of increasing initiation of smoking, particularly among youth and young adults, should not be underestimated.
SECONDHAND VAPE AND OTHER EXPOSURE RISKS
Cigarette smoking has been banned in many public places, in view of a large body of scientific evidence about the harmful effects of secondhand smoke. Advocates for allowing vaping in public places say that vaping emissions do not harm bystanders, but evidence is insufficient to support this claim.62 One study showed that passive exposure to e-cigarette aerosol generated increases in serum levels of cotinine (a nicotine metabolite) similar to those with passive exposure to conventional cigarette smoke.5
Accidental nicotine poisoning in children as a result of ingesting e-cigarette liquid is also a major concern,63 particularly with sweet flavors such as bubblegum or cheesecake that may be attractive to children.
Calls to US poison control centers with respect to e-cigarettes and vaping increased from 1 per month in September 2010 to 215 in February 2014, with 51% involving children under age 5.64 This trend resulted in the Child Nicotine Poisoning Prevention Act, which passed in 2015 and went into effect in 2016, requiring packaging that is difficult to open for children under age 5.5
Device malfunctions or battery failures have led to explosions that have resulted in substantial injuries to users, as well as house and car fires.49
HOW DO WE DISCOURAGE ADOLESCENT USE?
There are currently no established treatment approaches for adolescents who have become addicted to vaping. A review of the literature regarding treatment modalities used to address adolescent use of tobacco and marijuana provides insight that options such as nicotine replacement therapy and counseling modalities such as cognitive behavioral therapy may be helpful in treating teen vaping addiction. However, more research is needed to determine the effectiveness of these treatments in youth addicted to vaping.
Given that youth who vape even once are more likely to try other types of tobacco, we recommend that parents and healthcare providers start conversations by asking what the young person has seen or heard about vaping. Young people can also be asked what they think the school’s response should be: Do they think vaping should be banned in public places, as cigarettes have been banned? What about the carbon footprint? What are their thoughts on the plastic waste, batteries, and other toxins generated by the e-cigarette industry?
New US laws ban the sale of e-cigarettes and vaping devices to minors in stores and online. These policies are modeled in many cases on environmental control policies that have been previously employed to reduce tobacco use, particularly by youth. For example, changing laws to mandate sales only to individuals age 21 and older in all states can help to decrease access to these products among middle school and high school students.
As with tobacco cessation, education will not be enough. Support of legislation that bans vaping in public places, increases pricing to discourage adolescent use, and other measures used successfully to decrease conventional cigarette smoking can be deployed to decrease the public health impact of e-cigarettes. We recommend further regulation of specific harmful chemicals and clear, detailed ingredient labeling to increase consumer understanding of the risks associated with these products. Additionally, we recommend eliminating flavored e-cigarettes, which are the most appealing type for young users, and raising prices of e-cigarettes and similar products to discourage use by youth.
If current cigarette smokers want to use e-cigarettes to quit, we recommend that clinicians counsel them to eventually completely stop use of traditional cigarettes and switch to using e-cigarettes, instead of becoming a dual user of both types of products or using e-cigarettes indefinitely. After making that switch, they should then work to gradually taper usage and nicotine addiction by reducing the amount of nicotine in the e-liquid. Clinicians should ask patients about use of e-cigarettes and vaping devices specifically, and should counsel nonsmokers to avoid initiation of use.
EVIDENCE OF HARM CONTINUES TO EMERGE
Data about respiratory effects, secondhand exposure, and long-term smoking cessation efficacy are still limited, and it remains as yet unknown what combinations of solvents, flavorings, and nicotine in a given e-liquid will result in the most harmful or least harmful effects. In addition, while much of the information about the safety of these components has been obtained using in vitro or mouse models, increasing reports of serious respiratory illness and rising numbers of deaths linked to vaping make it clear that these findings likely translate to harmful effects in humans.
E-cigarettes may ultimately prove to be less harmful than traditional cigarettes, but it seems likely that with further time and research, serious health risks of e-cigarette use will continue to emerge.
- Sood A, Kesic M, Hernandez M. Electronic cigarettes: one size does not fit all. J Allergy Clin Immunol 2018; 141(6):1973-1982. doi:10.1016/j.jaci.2018.02.029
- Romijnders K, van Osch L, de Vries H, Talhout R. Perceptions and reasons regarding e-cigarette use among users and non-users: a narrative literature review. Int J Environ Res Public Health 2018; 15(6):1190. doi:10.3390/ijerph15061190
- Zhu S, Zhuang Y-L, Wong S, Cummins SE, Tedeschi GJ. E-cigarette use and associated changes in population smoking cessation: evidence from US current population surveys. BMJ 2017; 358:j3262. doi:10.1136/bmj.j3262
- Centers for Disease Control and Prevention. Outbreak of lung injury associated with e-cigarette use, or vaping. Updated November 5, 2019. www.cdc.gov/tobacco/basic_information/e-Cigarettes/severe-Lung-Disease.html. Accessed November 14, 2019.
- US Public Health Services, US Department of Health and Human Services. E-cigarette use among youth and young adults: a report of the Surgeon General. Rockville, MD, U.S. Department of Health and Human Services, 2016. https://e-cigarettes.surgeongeneral.gov/documents/2016_sgr_full_report_non-508.pdf. Accessed November 14, 2019.
- Thomas K, Kaplan S. E-cigarettes went unchecked in 10 years of federal inaction. New York Times Oct 14, 2019; updated November 1, 2019. www.nytimes.com/2019/10/14/health/vaping-e-cigarettes-fda.html.
- Cullen KA, Ambrose BK, Gentzke AS, Apelberg BJ, Jamal A, King BA. Notes from the field: use of electronic cigarettes and any tobacco product among middle and high school students—United States, 2011–2018. MMWR Morb Mortal Wkly Rep 2018; 67(45):1276–1277. doi:10.15585/mmwr.mm6745a5
- Gentzke A, Creamer M, Cullen K, et al; Centers for Disease Control and Prevention. Vital signs: tobacco product use among middle and high school students—United States, 2011–2018. MMWR Morb Mortal Wkly Rep 2019; 68(6):157–164. doi:10.15585/mmwr.mm6806e1
- Hammig B, Daniel-Dobbs P, Blunt-Vinti H. Electronic cigarette initiation among minority youth in the United States. Am J Drug Alcohol Abuse 2017; 43(3):306–310. doi:10.1080/00952990.2016.1203926
- Primack BA, Soneji S, Stoolmiller M, Fine MJ, Sargent JD. Progression to traditional cigarette smoking after electronic cigarette use among U.S. adolescents and young adults. JAMA Pediatr 2015; 169(11):1018–1023. doi:10.1001/jamapediatrics.2015.1742
- Leventhal AM, Strong DR, Kirkpatrick MG, et al. Association of electronic cigarette use with initiation of combustible tobacco product smoking in early adolescence. JAMA 2015; 314(7):700–707. doi:10.1001/jama.2015.8950
- Wills TA, Knight R, Sargent JD, Gibbons FX, Pagano I, Williams RJ. Longitudinal study of e-cigarette use and onset of cigarette smoking among high school students in Hawaii. Tob Control 2016; 26(1):34–39. doi:10.1136/tobaccocontrol-2015-052705
- National Center for Chronic Disease Prevention and Health Promotion (US) Office on Smoking and Health. The health consequences of smoking—50 years of progress: a report of the Surgeon General. Atlanta: Centers for Disease Control and Prevention, 2014. www.ncbi.nlm.nih.gov/books/NBK179276/pdf/Bookshelf_NBK179276.pdf. Accessed November 14, 2019.
- Christiani DC. Vaping-induced lung injury. N Engl J Med 2019; Sept 6. Epub ahead of print. doi:10.1056/NEJMe1912032
- Neel J, Aubrey A. Vitamin E suspected in serious lung problems among people who vaped cannabis. NPR Sept 5, 2019. www.npr.org/sections/health-shots/2019/09/05/758005409/vitamin-e-suspected-in-serious-lung-problems-among-people-who-vaped-cannabis. Accessed November 14, 2019.
- White A. Plans for the first e-cigarette went up in smoke 50 years ago. Smithsonian Magazine December 2018. www.smithsonianmag.com/innovation/plans-for-first-e-cigarette-went-up-in-smoke-50-years-ago-180970730.
- Blundell MS, Dargan PI, Wood DM. The dark cloud of recreational drugs and vaping. QJM 2018; 111(3):145–148. doi:10.1093/qjmed/hcx049
- Schulenberg JE, Johnston LD, O’Malley PM, Bachman JG, Miech RA, Patrick ME. Monitoring the future: national survey results on drug use, 1975–2018. 2018 Volume 2. College students & adults ages 19–60. www.monitoringthefuture.org/pubs/monographs/mtf-vol2_2018.pdf. Accessed November 14, 2019.
- Eggers ME, Lee YO, Jackson J, Wiley JL, Porter J, Nonnemaker JM. Youth use of electronic vapor products and blunts for administering cannabis. Addict Behav 2017; 70:79-82. doi:10.1016/j.addbeh.2017.02.020
- Regan AK, Promoff G, Dube SR, Arrazola R. Electronic nicotine delivery systems: adult use and awareness of the “e-cigarette”in the USA. Tob Control 2013; 22(1):19–23. doi:10.1136/tobaccocontrol-2011-050044
- Centers for Disease Control and Prevention. E-cigarette ads and youth. www.cdc.gov/vitalsigns/ecigarette-ads/index.html.
- Noel JK, Rees VW, Connolly GN. Electronic cigarettes: a new “tobacco” industry? Tob Control 2011; 20(1):81. doi:10.1136/tc.2010.038562
- US Food and Drug Administration. Deeming tobacco products to be subject to the federal food, drug, and cosmetic act, as amended by the family smoking prevention and tobacco control act; restrictions on the sale and distribution of tobacco products and required warning statements for tobacco products. Federal Register 2016; 81(90), May 10, 2016. www.govinfo.gov/content/pkg/FR-2016-05-10/pdf/2016-10685.pdf. Accessed November 14, 2019.
- Rom O, Pecorelli A, Valacchi G, Reznick AZ. Are e-cigarettes a safe and good alternative to cigarette smoking? Ann NY Acad Sci 2015; 1340:65–74. doi:10.1111/nyas.12609
- Zhu SH, Sun JY, Bonnevie E, et al. Four hundred and sixty brands of e-cigarettes and counting: implications for product regulation. Tob Control 2014; 23(suppl 3):iii3-iii9. doi:10.1136/tobaccocontrol-2014-051670
- Kong G, Morean ME, Cavallo DA, Camenga DR, Krishnan-Sarin S. Reasons for electronic cigarette experimentation and discontinuation among adolescents and young adults. Nicotine Tob Res 2015; 17(7):847–854. doi:10.1093/ntr/ntu257
- Baca MC. How two Stanford grads aimed for big tech glory and got big tobacco instead. Updated September 4, 2019. The Washington Post September 4, 2019. www.washingtonpost.com/technology/2019/09/04/how-two-stanford-grads-aimed-big-tech-glory-got-big-tobacco-instead. Accessed November 14, 2019.
- Huang J, Duan Z, Kwok J, et al. Vaping versus JUULing: how the extraordinary growth and marketing of JUUL transformed the US retail e-cigarette market. Tob Control 2019; 28(2):146–151. doi:10.1136/tobaccocontrol-2018-054382
- Walley SC, Wilson KM, Winickoff JP, Groner J. A public health crisis: electronic cigarettes, vape, and JUUL. Pediatrics 2019; 143(6):pii:e20182741. doi:10.1542/peds.2018-2741
- Zernike K. F.D.A. cracks down on “juuling” among teenagers. The New York Times April 24, 2018. www.nytimes.com/2018/04/24/health/fda-e-cigarettes-minors-juul.html. Accessed November 14, 2019.
- Ramamurthi D, Chau C, Jackler RK. JUUL and other stealth vaporisers: hiding the habit from parents and teachers. Tob Control 2018 Sep 15; pii:tobaccocontrol-2018-054455. doi:10.1136/tobaccocontrol-2018-054455. [Epub ahead of print]
- Willett JG, Bennett M, Hair EC, et al. Recognition, use and perceptions of JUUL among youth and young adults. Tob Control 2019; 28(1):115–116. doi:10.1136/tobaccocontrol-2018-054273
- Kaplan S. Juul’s new product: less nicotine, more intense vapor. New York Times Nov 27, 2018. www.nytimes.com/2018/11/27/health/juul-ecigarettes-nicotine.html.
- JUUL Labs. JUULpods. www.juul.com/shop/pods. Accessed November 14, 2019.
- Krishnan-Sarin S, Morean M, Kong G, et al. E-cigarettes and “dripping” among high-school youth. Pediatrics 2017; 139(3):pii:e20163224. doi:10.1542/peds.2016-3224
- Kosmider L, Sobczak A, Fik M, et al. Carbonyl compounds in electronic cigarette vapors: effects of nicotine solvent and battery output voltage. Nicotine Tob Res 2014; 16(10):1319–1326. doi:10.1093/ntr/ntu078
- Rawlinson C, Martin S, Frosina J, Wright C. Chemical characterisation of aerosols emitted by electronic cigarettes using thermal desorption-gas chromatography-time of flight mass spectrometry. J Chromatogr A 2017; 1497:144–154. doi:10.1016/j.chroma.2017.02.050
- Lee MS, LeBouf RF, Son YS, Koutrakis P, Christiani DC. Nicotine, aerosol particles, carbonyls and volatile organic compounds in tobacco- and menthol-flavored e-cigarettes. Environ Health 2017; 16(1):42. doi:10.1186/s12940-017-0249-x
- Williams M, Bozhilov K, Ghai S, Talbot P. Elements including metals in the atomizer and aerosol of disposable electronic cigarettes and electronic hookahs. PLoS One 2017; 12(4):e0175430. doi:10.1371/journal.pone.0175430.
- Goniewicz ML, Knysak J, Gawron M, et al. Levels of selected carcinogens and toxicants in vapour from electronic cigarettes. Tob Control 2014; 23(2):133–139. doi:10.1136/tobaccocontrol-2012-050859
- Drope J, Cahn Z, Kennedy R, et al. Key issues surrounding the health impacts of electronic nicotine delivery systems (ENDS) and other sources of nicotine. CA Cancer J Clin 2017; 67(6):449–471. doi:10.3322/caac.21413
- Jabba SV, Jordt SE. Risk analysis for the carcinogen pulegone in mint- and menthol-flavored e-cigarettes and smokeless tobacco products. JAMA Intern Med 2019 Sep 16 [Epub ahead of print]. doi:10.1001/jamainternmed.2019.3649
- Tierney PA, Karpinsky CD, Brown JE, Luo W, Pankow JF. Flavour chemicals in electronic cigarette fluids. Tob Control 2016; 25(e1):e10–e15. doi:10.1136/tobaccocontrol-2014-052175
- Behar RZ, Wang Y, Talbot P. Comparing the cytotoxicity of electronic cigarette fluids, aerosols and solvents. Tob Control 2017; 27(3):325–333. doi:10.1136/tobaccocontrol-2016-053472
- Martin EM, Clapp PW, Rebuli ME, et al. E-cigarette use results in suppression of immune and inflammatory-response genes in nasal epithelial cells similar to cigarette smoke. Am J Physiol Lung Cell Mol Physiol 2016; 311(1):L135–L144. doi:10.1152/ajplung.00170.2016
- Holden VK, Hines SE. Update on flavoring-induced lung disease. Curr Opin Pulm Med 2016;22(2):158–164. doi:10.1097/MCP.0000000000000250
- Siqueira L; Committee on Substance Use and Prevention. Nicotine and tobacco as substances of abuse in children and adolescents. Pediatrics 2017; 139(1):pii:e20163436. doi:10.1542/peds.2016-3436
- England LJ, Bunnell RE, Pechacek TF, Tong VT, McAfee TA. Nicotine and the developing human: a neglected element in the electronic cigarette debate. Am J Prev Med 2015; 49(2):286–293. doi:10.1016/j.amepre.2015.01.015
- Modesto-Lowe V, Alvarado C. E-cigs…are they cool? Talking to teens about e-cigarettes. Clin Pediatr (Phila) 2017; 51(10):947–952. doi:10.1177/0009922817705188
- Prochaska JJ, Benowitz NL. The past, present, and future of nicotine addiction therapy. Annu Rev Med 2017; 67:467–486. doi:10.1146/annurev-med-111314-033712
- Hughes JR, Keely J, Naud S. Shape of the relapse curve and long-term abstinence among untreated smokers. Addiction 2004; 99(1):29–38. doi:10.1111/j.1360-0443.2004.00540.x
- McMillen RC, Gottlieb MA, Shaefer RM, Winickoff JP, Klein JD. Trends in electronic cigarette use among U.S. adults: use is increasing in both smokers and nonsmokers. Nicotine Tob Res 2015;17(10):119_1202. doi:10.1093/ntr/ntu213
- Bullen C, Howe C, Laugesen M, et al. Electronic cigarettes for smoking cessation: a randomised controlled trial. Lancet 2013; 382(9905):1629–1637. doi:10.1016/S0140-6736(13)61842-5
- Hajek P, Phillips-Waller A, Przulj D, et al. A randomized trial of e-cigarettes versus nicotine replacement therapy. N Engl J Med 2019; 380(7):629–637. doi:10.1056/NEJMoa1808779
- Campagna D, Cibella F, Caponnetto P, et al. Changes in breathomics from a 1-year randomized smoking cessation trial of electronic cigarettes. Eur J Clin Invest 2016; 46(8):698–706. doi:10.1111/eci.12651
- Rehan HS, Maini J, Hungin APS. Vaping versus smoking: a quest for efficacy and safety of e-cigarette. Curr Drug Saf 2018; 13(2):92–101. doi:10.2174/1574886313666180227110556
- Zernike K. ‘I can’t stop’: schools struggle with vaping explosion. New York Times April 2, 2018. www.nytimes.com/2018/04/02/health/vaping-ecigarettes-addiction-teen.html.
- Pepper JK, Ribisl KM, Brewer NT. Adolescents’ interest in trying flavoured e-cigarettes. Tob Control 2016; 25(suppl 2):ii62–ii66. doi:10.1136/tobaccocontrol-2016-053174
- Harrell MB, Loukas A, Jackson CD, Marti CN, Perry CL. Flavored tobacco product use among youth and young adults: what if flavors didn’t exist? Tob Regul Sci 2017; 3(2):168–173. doi:10.18001/TRS.3.2.4
- Smith M. Amid vaping crackdown, Michigan to ban sale of flavored e-cigarettes. New York Times Sept 4, 2019. www.nytimes.com/2019/09/04/us/michigan-vaping.html?module=inline.
- Roditis ML, Halpern-Felsher B. Adolescents’ perceptions of risks and benefits of conventional cigarettes, e-cigarettes, and marijuana: a qualitative analysis. J Adolesc Health 2015; 57(2):179–185. doi:10.1016/j.jadohealth.2015.04.002
- Chapman S, Daube M, Maziak W. Should e-cigarette use be permitted in smoke-free public places? No. Tob Control 2017; 26(e1):e3–e4. doi:10.1136/tobaccocontrol-2016-053359
- Marcham CL, Springston JP. Electronic cigarettes in the indoor environment. Rev Env Health 2019; 34(2):105–124. doi:10.1515/reveh-2019-0012
- Chatham-Stephens K, Law R, Taylor E, et al; Centers for Disease Control and Prevention. Notes from the field: calls to poison centers for exposures to electronic cigarettes—United States, September 2010–September 2014. MMWR Morb Mortal Wkly Report 2014; 63(13):292–293. pmid:24699766
KEY POINTS
- Vaping is a common gateway to tobacco and marijuana use for adolescents and adults.
- The Juul vaping device delivers high nicotine concentrations that may pose a higher risk of nicotine addiction.
- Vaping has had unintended consequences that include poisoning of children who swallowed liquid nicotine, fires and explosions from defective batteries in the devices, and effects on the developing brain.
- Vaping is associated with respiratory illness and, in rare cases, death, likely due to vaporized agents introduced into the lungs. Small amounts of heavy metals, acetone, and other carcinogenic compounds in the vaping aerosol may cause lung damage.