User login
Lumbar spine BMD, bone strength benefits persist after romosozumab-to-alendronate switch
ORLANDO – Patients who took romosozumab for 12 months and then switched to alendronate continued to see benefits in bone mineral density (BMD) of the lumbar spine after 12 months of therapy with alendronate, compared with patients who began taking, and continued to take, alendronate over the same time period, according to findings from a subgroup of the ARCH study presented at the annual meeting of the American Society for Bone and Mineral Research.
“These effects occurred rapidly, as early as month 6, were sustained beyond 12 months after transitioning to alendronate, and are consistent with greater fracture-risk reduction observed in ARCH with romosozumab to alendronate versus alendronate to alendronate,” Jacques P. Brown, MD, FRCPC, of Laval University, Quebec City, said in his presentation.
In the double-blinded ARCH study, 4,093 postmenopausal women with osteoporosis and a previous fracture history were randomized to receive subcutaneous monthly romosozumab 210 mg or oral weekly alendronate 70 mg for 12 months, followed by an open-label period during which romosozumab patients received oral weekly alendronate 70 mg and alendronate patients continued to receive the same dose on the same schedule for an additional 24 months (Saag KG et al. N Eng J Med. 2017 Oct 12. doi: 10.1056/NEJMoa1708322).
Dr. Brown and colleagues performed an imaging substudy of ARCH, which included examining how the romosozumab-to-alendronate and alendronate-only groups improved lumbar spine BMD and lumbar spine bone strength. Lumbar spine BMD was assessed through quantitative CT, and lumbar spine bone strength was measured with finite element analysis. The researchers received quantitative CT images from baseline and at 6 months, 12 months, and 24 months, and determined the percentage change at each of those periods to calculate integral, trabecular, and cortical lumbar spine volumetric BMD (vBMD), and to bone mineral content (BMC). They also measured areal BMD (aBMD) at baseline, 6 months, 12 months, 18 months, and 24 months with dual-energy x-ray absorptiometry.
Overall, 49 romosozumab patients and 41 alendronate patients from the ARCH study were enrolled in the imaging substudy. Of those patients, 76 had vBMD and BMC information available at baseline and one or more time periods post baseline, and 86 patients had finite element analysis data at baseline and one or more postbaseline time periods. Patients in the romosozumab and alendronate groups had similar baseline characteristics with regard to age (73.1 years vs. 72.8 years, respectively), mean lumbar spine BMD T score (–2.82 vs. –3.38), mean total hip BMD T score (–2.65 vs. –2.75), mean femoral neck T score (–2.84 vs. –2.83), mean lumbar spine integral vBMD (130.3 mg/cm3 vs. 120.5 mg/cm3), trabecular vBMD (60.1 mg/cm3 vs. 53.7 mg/cm3) and cortical vBMD (284.6 mg/cm3 vs. 270.9 mg/cm3). Patients in both groups also had similar rates of previous osteoporotic fracture at or after aged 45 years, previous vertebral fracture, and history of hip fracture.
Beginning at 6 months, there were significant least squares mean BMD improvements in both groups, but the romosozumab group had significant improvements in aBMD percentage changes, compared with the alendronate group, which persisted until 24 months (P less than .001 at all time points). Integral, trabecular, and cortical vBMD in the romosozumab group also saw significantly greater increases from baseline, compared with the alendronate group, and those results persisted in the open-label portion of the study for patients in the romosozumab group who transitioned to alendronate and patients in the alendronate to alendronate group (P less than .001 at all time points).
“The rapid and large increases in BMD with romosozumab followed by BMD consolidation where [patients were] transitioning to alendronate, support the important role of romosozumab as a first-line therapy in treating patients who are at very high risk for fracture,” Dr. Brown said.
In regard to BMC, there were larger increases in least squares mean BMC changes from baseline in the cortical compartment than the trabecular compartment, and actual change in bone strength as measured by finite element analysis was highly correlated with integral BMC in the romosozumab group.
Dr. Brown said the study was limited to the small sample size from the imaging substudy of ARCH, and quantitative CT dictated the imaging sites for the substudy, which may have affected patient selection. However, he noted that the characteristics of the ARCH imaging substudy were similar to patients in the overall ARCH study.
Amgen, UCB Pharma, and Astellas Pharma funded the study in part. Amgen and UCB Pharma assisted in the preparation of Dr. Brown’s presentation at ASBMR 2019, including funding costs associated with its development. Dr. Brown and the other coauthors reported relationships with Amgen, UCB Pharma, and other companies in the form of consultancies, grants and research support, speaker’s bureau appointments, paid employment, and stock options.
SOURCE: Brown JP et al. ASBMR 2019, Abstract 1050.
REPORTING FROM ASBMR 2019
Antibiotic Resistance: What the Dermatologist Needs to Know

Questions include:
What is the potential magnitude of concern regarding antibiotic resistance? Is it clinically relevant to dermatologists in their day-to-day practice?
What can dermatologists do to slow the development of antibiotic resistance?
What is the mutant selection window?
How does the mutant selection window apply to topical antibiotics?

Does Diet Matter in Overweight Patients with Migraine?
A very low-calorie ketogenic diet (VLCKD) has a preventive effect in overweight, episodic patients who experience migraine that appears within 1 month, a new study found. Researchers sought to determine the therapeutic effect of a very low-calorie diet in overweight, episodic patients who experience migraine during a weight-loss intervention in which participants alternated randomly between a VLCKD and a very low-calorie non-ketogenic diet (VLCnKD) each for 1 month. The primary outcomes measure was the reduction of migraine days each month compared to a 1-month pre-diet baseline. Among the findings:
- Thirty-five obese migraine sufferers were allocated blindly to 1-month successive VLCKD or VLCnKD in random order.
- During the VLCKD patients experienced ‒3.73 migraine days respect to VLCnKD.
- The 50% responder rate for migraine days was 74.28% during the VLCKD period and 8.57% during VLCnKD.
- Migraine attacks decreased by ‒3.02 during VLCKD respect to VLCnKD.
Di Lorenzo C, Pinto A, Lenca R, et al. A randomized double-blind, cross-over trial of very low-calorie diet in overweight migraine patients: A possible role for ketones? [Published online ahead of print July 28, 2019]. Nutrients. doi: 10.3390/nu11081742.
Adding radiation to immunotherapy may extend PFS in progressive lung cancer
For patients with metastatic non–small cell lung cancer (NSCLC) who have disease progression on immunotherapy, adding stereotactic body radiotherapy (SBRT) could improve progression-free survival (PFS), according to investigators.

Patients with more CD8+ T cells in circulation, and those with higher tumor infiltrating lymphocyte (TIL) scores derived the most benefit from SBRT, lead author Allison Campbell, MD, PhD, of Yale Cancer Center in New Haven, Conn., and colleagues, reported at the annual meeting of the American Society for Radiation Oncology.
“In rare cases, adding radiation to immunotherapy has been shown to result in therapeutic synergy,” Dr. Campbell said. “When we give high-dose radiation to patients on immunotherapy, some tumors that were not targeted by the radiation can shrink, and this is called ‘the abscopal effect.’ ”
The investigators designed the phase 2 trial to determine if the abscopal effect would occur if high-dose radiation was delivered to a single site in patients who had progressed on checkpoint inhibitor therapy. Fifty-six patients were enrolled, all with at least two sites of metastatic NSCLC. Of these patients, 6 had already progressed on immunotherapy, while 50 were naive to immunotherapy and began pembrolizumab during the trial, with 16 eventually progressing; collectively, these 22 patients with disease progression were identified as candidates for SBRT. Almost all candidates (21 out of 22) completed SBRT, which was delivered in three or five high-dose fractions. Only one site was treated, while other sites were tracked over time with computed tomography (CT) to assess for the abscopal effect. In addition, blood was analyzed for circulating immune cell composition.
After a median follow-up of 15.2 months, the disease control rate was 57%, with some abscopal responses detected. Two patients (10%) achieved a partial response lasting more than 1 year, and 10 patients (48%) maintained stable disease after SBRT. Although programmed death-ligand 1 (PD-L1) positivity was associated with a trend toward increased PFS, this was not statistically significant. In contrast, TIL score was significantly correlated with PFS; patients with TIL scores of 2-3 had a median PFS of 6.7 months, compared with 2.2 months among those with TIL scores of 1 or less. Similarly, immune-related adverse events predicted outcome, with patients who experienced such events achieving longer median PFS than those who did not (6.5 vs 2.2 months). Furthermore, blood testing revealed that the best responders had more CD8+ killer T cells and fewer CD4+ regulatory T cells in peripheral blood compared with patients who responded poorly.
After Dr. Campbell’s presentation, Benjamin Movsas, MD, chair of radiation oncology at the Henry Ford Cancer Institute in Detroit, offered some expert insight. “[The findings from this study] suggest perhaps that radiation may be able to reinvigorate the immune system,” Dr. Movsas said. “Maybe we can get more mileage out of the immunotherapy with this approach. Could radiation kind of be like an immune vaccine of sorts? There’s a lot of exciting possibilities.”
Dr. Movsas also noted how biomarker findings may be able to guide treatment decisions, highlighting how T cell populations predicted outcomes. “This era of precision medicine is really helping us improve benefits,” he said. “The immune profile really matters.”
The investigators disclosed relationships with Genentech, AstraZeneca, Merck, and others.
SOURCE: Campbell et al. ASTRO 2019. Abstract 74.
For patients with metastatic non–small cell lung cancer (NSCLC) who have disease progression on immunotherapy, adding stereotactic body radiotherapy (SBRT) could improve progression-free survival (PFS), according to investigators.
Patients with more CD8+ T cells in circulation, and those with higher tumor infiltrating lymphocyte (TIL) scores derived the most benefit from SBRT, lead author Allison Campbell, MD, PhD, of Yale Cancer Center in New Haven, Conn., and colleagues, reported at the annual meeting of the American Society for Radiation Oncology.
“In rare cases, adding radiation to immunotherapy has been shown to result in therapeutic synergy,” Dr. Campbell said. “When we give high-dose radiation to patients on immunotherapy, some tumors that were not targeted by the radiation can shrink, and this is called ‘the abscopal effect.’ ”
The investigators designed the phase 2 trial to determine if the abscopal effect would occur if high-dose radiation was delivered to a single site in patients who had progressed on checkpoint inhibitor therapy. Fifty-six patients were enrolled, all with at least two sites of metastatic NSCLC. Of these patients, 6 had already progressed on immunotherapy, while 50 were naive to immunotherapy and began pembrolizumab during the trial, with 16 eventually progressing; collectively, these 22 patients with disease progression were identified as candidates for SBRT. Almost all candidates (21 out of 22) completed SBRT, which was delivered in three or five high-dose fractions. Only one site was treated, while other sites were tracked over time with computed tomography (CT) to assess for the abscopal effect. In addition, blood was analyzed for circulating immune cell composition.
After a median follow-up of 15.2 months, the disease control rate was 57%, with some abscopal responses detected. Two patients (10%) achieved a partial response lasting more than 1 year, and 10 patients (48%) maintained stable disease after SBRT. Although programmed death-ligand 1 (PD-L1) positivity was associated with a trend toward increased PFS, this was not statistically significant. In contrast, TIL score was significantly correlated with PFS; patients with TIL scores of 2-3 had a median PFS of 6.7 months, compared with 2.2 months among those with TIL scores of 1 or less. Similarly, immune-related adverse events predicted outcome, with patients who experienced such events achieving longer median PFS than those who did not (6.5 vs 2.2 months). Furthermore, blood testing revealed that the best responders had more CD8+ killer T cells and fewer CD4+ regulatory T cells in peripheral blood compared with patients who responded poorly.
After Dr. Campbell’s presentation, Benjamin Movsas, MD, chair of radiation oncology at the Henry Ford Cancer Institute in Detroit, offered some expert insight. “[The findings from this study] suggest perhaps that radiation may be able to reinvigorate the immune system,” Dr. Movsas said. “Maybe we can get more mileage out of the immunotherapy with this approach. Could radiation kind of be like an immune vaccine of sorts? There’s a lot of exciting possibilities.”
Dr. Movsas also noted how biomarker findings may be able to guide treatment decisions, highlighting how T cell populations predicted outcomes. “This era of precision medicine is really helping us improve benefits,” he said. “The immune profile really matters.”
The investigators disclosed relationships with Genentech, AstraZeneca, Merck, and others.
SOURCE: Campbell et al. ASTRO 2019. Abstract 74.
REPORTING FROM ASTRO 2019
Baltimore’s pilot project in outpatient civil commitment
Novel program has gotten off to a rough start
No topic is quite so controversial in psychiatry as outpatient civil commitment.

We all value the right to make our own medical decisions, perhaps even more so when it comes to issues of mental health. The concern, however, is that some patients lack the ability to see that they are ill, and their refusal to participate in treatment leads them to repeated involuntary hospitalizations or to behaviors that result in their incarceration. Mandated care for forensic patients – those who have ended up in the criminal justice system – is not as controversial, but for those who have committed no crime, the legislative struggles can get very heated. Add to that the cost of implementing outpatient civil commitment (OCC), the difficulties in enforcing the orders, the call to include an array of services for participants, the difficulties in ascertaining if these mandates are successful in helping patients live better lives, and the fact that treatment doesn’t always work, then what seems like a simple solution to the problem of noncompliance is actually quite complex.
Maryland is one of four states that does not have OCC. In 2017, it was announced that the city of Baltimore would begin an OCC pilot program. The program, administered by Behavioral Health System Baltimore (BHSB) in partnership with numerous other mental health organizations, has had several fits and starts. The program initially was funded by the Substance Abuse and Mental Health Services Administration (SAMHSA), and the grant required the program to serve a minimum of 75 patients. However, it was soon discovered that there were no written regulations, and that began a 1-year delay while regulations were written, including two periods for open public comment. Once set, BHSB needed to let local hospitals know the program existed and solicit referrals.
When it became clear that they would not be able to serve 75 individuals, BHSB elected to give its funding back to SAMHSA, and a second 3-month delay ensued until the state of Maryland picked up the cost. The Baltimore pilot project in OCC is different from other civil commitment programs. The criteria for inclusion are brief: The patient must be aged over 18 years, be a resident of Baltimore, and must have been retained by a judge at a hospital inpatient civil commitment hearing at least two times in the past year because of noncompliance with outpatient treatment. The referral needs to come from the inpatient unit before the patient is discharged, and entails a “settlement agreement” with a judge, typically the same administrative law judge that visits the hospital weekly for the inpatient commitment hearings. A connection is made with the patient prior to discharge from the inpatient facility.
The Baltimore project also differs in many ways from traditional outpatient commitment programs in other states. In this program, the patient is not mandated to treatment. Instead, the patient is required to meet with the program’s peer-recovery specialist. The recovery specialist provides support for the patient after discharge, facilitates engagement in both psychiatric and somatic medical care, and helps with transportation to appointments. Services for each participant continue for 6 months; the initial SAMHSA grant was for $2.8 million for 4 years.
Nicole McGill, the program’s monitor notes: “When people are repeatedly hospitalized, it signals to us that maybe the system hasn’t been doing what it needs to do. For those people, the OCC pilot aims to be the connection to existing services in the community.”
Of the 19 people who have been referred to the program since October 2017, 9 have been accepted. Six of those patients enrolled voluntarily; three were ordered into the program against their will. Of those three, one patient has refused to meet with the peer-recovery specialist. That patient, however, is enrolled with an Assertive Community Treatment and is not someone who is refusing psychiatric treatment. That patient was enlisted with the hope that more engagement might prevent future hospitalizations.
“We didn’t want to create a program that forced people into treatment,” said Adrienne Breidenstine, vice president for policy and communications for BHSB. “Those programs don’t work. If a program participant chooses not to engage in services, the OCC peers will step up their engagement. There are no punitive or legal consequences; they aren’t brought back to the hospital or taken to jail.”
So far, the program has been well received by its clients. Feedback is solicited through the Mental Health Association of Maryland. One client provided a testimonial saying: “I didn’t know there were so many resources out there. They took me to the food co-op and gave me free sheets. I got a fan. They didn’t waste time getting me that. It helped a lot with the heat. They get me to appointments. They helped so much.”
This fall, BHSB is expanding its services; as of Sept. 9, 2019, any Baltimore resident who is currently hospitalized and has been hospitalized at least one other time in the past 12 months will be eligible for the outpatient “commitment” program; there will no longer be a requirement that these inpatient stays involved retention at a civil commitment hearing or that the patient ever had an involuntary status. Patients who have not been committed to the hospital, however, will only be able to enter the program on a voluntary track.
This model of OCC is a bit of a misnomer: Most of the patients are in the program voluntarily, and they are not being required to go to treatment or take medications. It is a way to get a higher level of service to the sickest of patients who have needed repeated hospitalizations without the objections that get raised when patients are mandated to care. Given the distress that involuntary hospitalization causes, it may well be helpful to expand a voluntary offer of services to all patients who are retained at a hearing, even if only once; perhaps the added support could prevent future decompensations.
For now, the program has had a rough beginning, and the expense is hard to justify for so few patients. For advocates who support outpatient commitment, this program does not go far enough, as there is no requirement to take medications and no consequence for refusal to participate. As the criteria for inclusion are loosened to include those who are repeatedly hospitalized on a voluntary basis, it will be interesting to see if hospitalizations can be prevented and if the quality of life can be improved for these patients.
Dr. Miller is coauthor with Annette Hanson, MD, of “Committed: The Battle Over Involuntary Psychiatric Care” (Baltimore: Johns Hopkins University, 2016). She has a private practice, and is assistant professor of psychiatry and behavioral sciences at Johns Hopkins, both in Baltimore.
Novel program has gotten off to a rough start
Novel program has gotten off to a rough start
No topic is quite so controversial in psychiatry as outpatient civil commitment.
We all value the right to make our own medical decisions, perhaps even more so when it comes to issues of mental health. The concern, however, is that some patients lack the ability to see that they are ill, and their refusal to participate in treatment leads them to repeated involuntary hospitalizations or to behaviors that result in their incarceration. Mandated care for forensic patients – those who have ended up in the criminal justice system – is not as controversial, but for those who have committed no crime, the legislative struggles can get very heated. Add to that the cost of implementing outpatient civil commitment (OCC), the difficulties in enforcing the orders, the call to include an array of services for participants, the difficulties in ascertaining if these mandates are successful in helping patients live better lives, and the fact that treatment doesn’t always work, then what seems like a simple solution to the problem of noncompliance is actually quite complex.
Maryland is one of four states that does not have OCC. In 2017, it was announced that the city of Baltimore would begin an OCC pilot program. The program, administered by Behavioral Health System Baltimore (BHSB) in partnership with numerous other mental health organizations, has had several fits and starts. The program initially was funded by the Substance Abuse and Mental Health Services Administration (SAMHSA), and the grant required the program to serve a minimum of 75 patients. However, it was soon discovered that there were no written regulations, and that began a 1-year delay while regulations were written, including two periods for open public comment. Once set, BHSB needed to let local hospitals know the program existed and solicit referrals.
When it became clear that they would not be able to serve 75 individuals, BHSB elected to give its funding back to SAMHSA, and a second 3-month delay ensued until the state of Maryland picked up the cost. The Baltimore pilot project in OCC is different from other civil commitment programs. The criteria for inclusion are brief: The patient must be aged over 18 years, be a resident of Baltimore, and must have been retained by a judge at a hospital inpatient civil commitment hearing at least two times in the past year because of noncompliance with outpatient treatment. The referral needs to come from the inpatient unit before the patient is discharged, and entails a “settlement agreement” with a judge, typically the same administrative law judge that visits the hospital weekly for the inpatient commitment hearings. A connection is made with the patient prior to discharge from the inpatient facility.
The Baltimore project also differs in many ways from traditional outpatient commitment programs in other states. In this program, the patient is not mandated to treatment. Instead, the patient is required to meet with the program’s peer-recovery specialist. The recovery specialist provides support for the patient after discharge, facilitates engagement in both psychiatric and somatic medical care, and helps with transportation to appointments. Services for each participant continue for 6 months; the initial SAMHSA grant was for $2.8 million for 4 years.
Nicole McGill, the program’s monitor notes: “When people are repeatedly hospitalized, it signals to us that maybe the system hasn’t been doing what it needs to do. For those people, the OCC pilot aims to be the connection to existing services in the community.”
Of the 19 people who have been referred to the program since October 2017, 9 have been accepted. Six of those patients enrolled voluntarily; three were ordered into the program against their will. Of those three, one patient has refused to meet with the peer-recovery specialist. That patient, however, is enrolled with an Assertive Community Treatment and is not someone who is refusing psychiatric treatment. That patient was enlisted with the hope that more engagement might prevent future hospitalizations.
“We didn’t want to create a program that forced people into treatment,” said Adrienne Breidenstine, vice president for policy and communications for BHSB. “Those programs don’t work. If a program participant chooses not to engage in services, the OCC peers will step up their engagement. There are no punitive or legal consequences; they aren’t brought back to the hospital or taken to jail.”
So far, the program has been well received by its clients. Feedback is solicited through the Mental Health Association of Maryland. One client provided a testimonial saying: “I didn’t know there were so many resources out there. They took me to the food co-op and gave me free sheets. I got a fan. They didn’t waste time getting me that. It helped a lot with the heat. They get me to appointments. They helped so much.”
This fall, BHSB is expanding its services; as of Sept. 9, 2019, any Baltimore resident who is currently hospitalized and has been hospitalized at least one other time in the past 12 months will be eligible for the outpatient “commitment” program; there will no longer be a requirement that these inpatient stays involved retention at a civil commitment hearing or that the patient ever had an involuntary status. Patients who have not been committed to the hospital, however, will only be able to enter the program on a voluntary track.
This model of OCC is a bit of a misnomer: Most of the patients are in the program voluntarily, and they are not being required to go to treatment or take medications. It is a way to get a higher level of service to the sickest of patients who have needed repeated hospitalizations without the objections that get raised when patients are mandated to care. Given the distress that involuntary hospitalization causes, it may well be helpful to expand a voluntary offer of services to all patients who are retained at a hearing, even if only once; perhaps the added support could prevent future decompensations.
For now, the program has had a rough beginning, and the expense is hard to justify for so few patients. For advocates who support outpatient commitment, this program does not go far enough, as there is no requirement to take medications and no consequence for refusal to participate. As the criteria for inclusion are loosened to include those who are repeatedly hospitalized on a voluntary basis, it will be interesting to see if hospitalizations can be prevented and if the quality of life can be improved for these patients.
Dr. Miller is coauthor with Annette Hanson, MD, of “Committed: The Battle Over Involuntary Psychiatric Care” (Baltimore: Johns Hopkins University, 2016). She has a private practice, and is assistant professor of psychiatry and behavioral sciences at Johns Hopkins, both in Baltimore.
The P value: What to make of it? A simple guide for the uninitiated
Introduction
Many clinicians consider the P value as an almost magical number that determines whether treatment effects exist or not. Is that a correct understanding?
In order to grasp the conceptual meaning of the P value, consider comparing two treatments, A and B, and finding that A is twice as effective as B. Does it mean that treatment A is better in reality? We cannot be sure from that information alone. It may be that treatment A is truly better than treatment B (i.e., true positive). However, it may also be that by chance we have collected a sample in which more people respond to treatment A, making it appear as more effective, when in reality it is equally effective as treatment B (i.e., false positive).
An arbitrary definition
If the P value is less than 5% (P less than .05) that means that there is less than a 5% probability that we would observe the above results if in reality treatment A and treatment B were equally effective. Since this probability is very small, the convention is to reject the idea that both treatments are equally effective and declare that treatment A is indeed more effective.
The P value is thus a probability, and “statistical significance” depends simply on 5% being considered the cutoff for sufficiently low enough probability to make chance an unlikely explanation for the observed results. As you can see this is an arbitrary cutoff; it could have been 4% or 6%, and the concept would not have changed.1
Power
Thus, simply looking at the P value itself is insufficient. We need to interpret it in light of other information.2 Before doing that, we need to introduce a new related statistical concept, that of “power.” The power of a study can be conceptually understood as the ability to detect a difference if there truly is one. If there is a difference in reality between treatments A and B, then the power of a study is the ability to detect that difference.
Two factors influence power: the effect size (that is, the difference between A and B) and the sample size. If the effect size is large, then even with small samples we can detect it. For example, if treatment A was effective in 100% of the cases, and treatment B only in 10% of cases, then the difference will be clear even with a small number of patients. Conversely, if the effect size is small, then we would need a very large sample size to detect that difference. For example, if treatment A is effective in 20% of cases, and treatment B is effective in 22% of cases, the difference between them could be observed only if we enrolled a very large number of patients. A large sample size increases the power of a study. This has important implications for the interpretation of the P value.
How (not) to interpret the P value
Many clinicians do not consider other factors when interpreting the P value, and assume that the dichotomization of results as “significant” and “nonsignificant” accurately reflects reality.3
Authors may say something like the following: “Treatment A was effective in 50% of patients, and treatment B was effective in 20% of the patients, but there was no difference between them (P = .059).” The reason why they declare this as “no difference” is because there is no “statistically significant difference” if P = .059. However, this does not mean that there is no difference.
First, if the convention for the cutoff value for significance was another arbitrary value, say 0.06, then this would have been a statistically significant finding.
Second, we should pay attention to the magnitude of the P value when interpreting the results. As per definition above, the P value is simply the probability of a false-positive result. However, these probabilities may be greater than 5% with varying degrees. For example, a probability of false positive of 80% (P = .80) is very different from a probability of 6% (P = .059), even though, technically, both are “nonsignificant.” A P value of .059 can be interpreted to mean that there is possibly some “signal” of real difference in the data. It may be that the study above was not powered enough to see the difference of 30 percentage points between the treatments as statistically significant; had the sample size been larger and thus provided greater power, then the finding could have been significant. Instead of reporting that there is no difference, it would be better to say that these results are suggestive of a difference, but that there was not enough power to detect it. Alternatively, P = .059 can be considered as “marginally nonsignificant” to qualitatively differentiate it from larger values, say P = .80, which are clearly nonsignificant.
Third, a key distinction is that between clinical and statistical significance. In the example above, even though the study was not statistically significant (P = .059), a difference of 30% seems clinically important. The difference between clinical and statistical significance can perhaps be better illustrated with the opposite, and more common, mistake. As mentioned, a large sample size increases power, thus the ability to detect even minor differences. For example, if a study enrolls 100,000 participants in each arm, then even a difference of 0.2% between treatments A and B will be statistically significant. However, this difference is clinically irrelevant. Thus, when researchers report “statistically significant” results, careful attention must be paid to the clinical significance of those results. The purpose of the studies is to uncover reality, not to be technical about conventions.
Multiple testing and P value
Finally, another almost universally ignored problem in clinical research papers is that of multiple testing. It is not uncommon to read papers in which the authors present results for 20 different and independent hypotheses tests, and when one of them has a P value less than .05 they declare it as a significant finding. However, this is clearly mistaken. The more tests are made, the higher the probability of false positives. Imagine having 20 balls and only one of them is red. If you pick a random ball only once you have a 5% probability of picking the red one. If, however, you try it 10 different times, the probability of picking the red ball is higher (approximately 40%). Similarly, if we perform only one test, then the probability of a false positive is 5%; however, if we perform many tests, then the probability of a false positive is higher than 5%.
There are three main ways to deal with this problem. The first is to have only one main outcome declaring statistical significance for only that outcome and consider the other outcomes as exploratory. The second is to report on multiple findings and correct for multiple testing. The third is to report on multiple findings, but mention explicitly in the paper that they have not corrected for multiple testing and therefore the findings may be significant by chance.
Conclusion
In summary, the P value is the probability of a false-positive finding, and the cutoff of .05 is arbitrary. Instead of dichotomizing results as “significant” and “nonsignificant” purely based on whether the P value is more or less than .05, a more qualitative approach that takes into account the magnitude of the P value and the sample size should be considered, and multiple testing should be taken into account when declaring significant findings.
Dr. Jovani is a therapeutic endoscopy fellow, division of gastroenterology and hepatology, Johns Hopkins Hospital, Baltimore.
References
1. Guyatt G et al. CMAJ. 1995;152:27-32.
2. Guller U and DeLong ER. J Am Coll Surg. 2004;198:441-58.
3. Greenland S et al. Eur J Epidemiol. 2016;31:337-50.

UV Radiation Exposure in Welders: Impact on the Skin and Eyes
Although solar radiation is the most commonly recognized source of UV radiation (UVR), occupational exposures can contribute due to the intensity and chronicity of exposure. Arc welding is a process whereby metal is fused together by heat produced from an electric arc. The electric arc that forms between the electrode and the base metal emits radiation in the full UV spectrum including UVA (400–315 nm), UVB (315–290 nm), and UVC (290–100 nm) wavelengths. Welders, therefore, have an increased risk for broad-spectrum, intense exposure to UVR, which may play a notable role in UV-related skin disease without proper protection. We report 3 welders with skin disease attributed to occupational exposure to UVR.
Case Reports
Patient 1
A 41-year-old man presented for evaluation of treatment-resistant cutaneous lupus. During the 10-year disease course, the patient was treated by both dermatologists and rheumatologists with frequent exacerbations and poor disease control. At the time of presentation, treatment with hydroxychloroquine 200 mg twice daily, azathioprine 50 mg twice daily, intramuscular methylprednisolone acetateinjectable suspension 40 mg, and prednisone 20 mg daily was failing. Physical examination revealed polycyclic erythematous plaques typical of subacute cutaneous lupus erythematosus. A skin biopsy confirmed the diagnosis. Upon further discussion of exacerbating risk factors, the patient noted UVR exposure while working as a welder. Although he had been previously told to avoid sunlight, he did not realize that this recommendation included all forms of UV light. Once this work exposure was eliminated, he was restarted on hydroxychloroquine 200 mg twice daily and topical steroids, and he responded with complete and sustained clearance of disease. When he returned to welding, utilization of sunscreen and sun-protective clothing enabled him to maintain control of his subacute cutaneous lupus erythematosus on oral hydroxychloroquine 200 mg twice daily and topical steroids.
Patient 2
A 55-year-old man presented with numerous actinic keratoses and persistent erythema in a well-demarcated area involving the forehead, temples, and lateral cheeks but sparing the periorbital area. The patient also experienced UVR exposure from welding (up to 4 to 5 times per week during his career spanning more than 20 years). He cited frequent burns in areas where his protective equipment did not cover his skin. He also reported that he often forgoes wearing protective equipment, even though it is available, and only uses safety goggles due to the extreme heat of the working environment as well as the awkwardness of wearing full protective gear while performing certain aspects of the job.
Patient 3
A 63-year-old man presented with a growth on the left side of the upper forehead. A biopsy revealed a squamous cell carcinoma, keratoacanthoma type. He worked as a welder for 40 years until retiring 1 year prior to presentation. He welded daily and always wore a tall face shield. Although the face shield covered most of his face, the scalp and some parts of the upper face were not well protected. In addition to the keratoacanthoma, which presented just outside of the area protected by the face shield, the patient had numerous actinic keratoses on the scalp.
Comment
Welding and UVR Exposure
Arc welders endure large amounts of UVR exposure, which is substantial enough to have notable health effects. The duration of exposure, electrical current used, angle of exposure, amount of ventilation, and the distance from the welding arc play a role in overall UVR exposure.1,2 Maximum permissible exposure (MPE) limits to UVR have been set by the International Commission on Non-Ionizing Radiation Protection and the National Institute for Occupational Safety and Health.3,4 The quantity of radiation produced by the arc allows for an exposure time of only a few seconds to minutes before surpassing MPE to UV light.1,5 Welders are exposed to total-body UVR doses up to 3000 times the MPE, and mean cumulative exposure calculated over an 8-hour workday can reach 9795 mJ/cm2.6
Workers in close proximity to welders also receive large UVR doses and may not be aware of its hazardous effects. Nearby nonwelders can be exposed to 13 times the MPE of UVR.6 At distances up to 10 m from the arc, the irradiance is large enough to reach MPE to UVR in less than 3 hours.1
Skin and Eye Damage From Welding
Exposure to UVR produced by the welding arc may lead to acute skin or eye reactions, chronic skin or eye disorders, or exacerbation of photosensitive diseases. Common acute problems are photokeratoconjunctivitis (welder’s flash) and skin erythema.7,8
Actinic elastosis, actinic keratoses, ocular melanoma, and photosensitive diseases represent a spectrum of disorders that can present from chronic UV exposure in welders. In a study by Emmett et al7 of 152 welders and 58 controls, actinic elastosis was found to be more frequent in welders than controls. Cases of basal cell carcinoma and squamous cell carcinoma also have been reported in welders.9,10 However, in the study by Emmett et al,7 a statistically significant correlation between welding and skin cancer was not documented. There were limitations in the study, such as small sample size and a young average age of welders.7 Future studies may be needed to further clarify the risk for skin cancer in welders.
Although there is no clear association with skin cancer, an increased risk of ocular melanoma in welders is more clearly established. A meta-analysis of 5 studies found that welding was a significant risk factor for ocular melanoma, with an odds ratio of 2.05 (95% confidence interval, 1.20-3.51).11 Other reported eye damage from chronic UVR exposure includes cataracts, chronic conjunctivitis, and retinal damage.12,13
Case reports of the following photosensitive diseases have been reported to be exacerbated or caused by UV light exposure in welders: discoid lupus erythematosus14; photodermatitis15; broadband photosensitivity with decreased minimal erythema dose to UVA, UVB, and UVC16; UVC-exacerbated atopic dermatitis17; polymorphous light eruption–like skin eruption18; and UVA-induced photoallergy to hydrochlorothiazide and ramipril.19
Prevention of Occupational Exposure to UVR
Occupational Safety and Health Administration guidelines protect workers from excessive exposure to UVR with personal protective equipment (PPE). In addition to UVR protection, PPE needs to protect welders from other risks including trauma from welding debris (slag), fires, electrical burns, and fumes. Online resources from the National Ag Safety Database,20 the American Welding Society,21 and Occupational Safety and Health Administration22,23 are available. These resources advise welders to work in ventilated areas with respirators specific for the metal being welded and to wear clothing and gloves that are not only fire retardant but also UV resistant.20-23 Additional PPE should protect the head, face, and eyes.
Unfortunately, even workers well trained in prevention guidelines may not adequately protect themselves. Some welders forego PPE due to heat, thus exposing themselves to UVR damage in areas that are normally covered. Welders also may forego equipment when working on jobs requiring more detailed welds where clothing, masks, and glasses may be overly bulky and inhibit the worker’s precision. Nontraditional welders, such as artisans or handymen, may not have workplace safety education to be aware of UVR emitted from welding and may not have readily available PPE.
The Figure portrays an amateur welder working without full PPE. Although he is wearing a face shield, he is not wearing fire-retardant clothing, lacks full protective garments, and has no ventilation system.
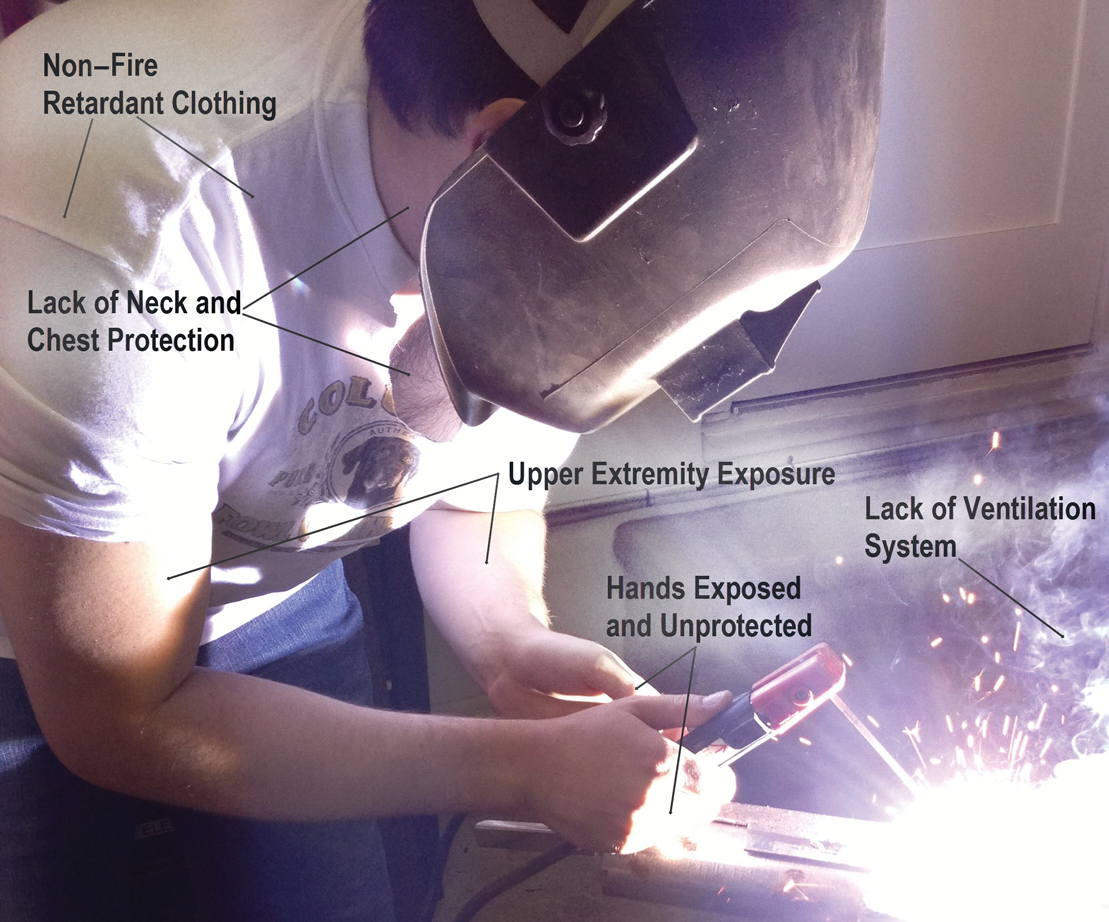
Conclusion
It is important to recognize welding as an occupation with notable exposure to UVR. Personal protective equipment should be the mainstay of prevention. Sunscreen is a useful adjunct but does not cover UVC that is emitted in the welding arc. Screens and welding blankets can be placed around welders to contain UVR and limit nonwelder exposure. Although UVR hazards should be regulated in the workplace as part of regular safety reviews, the clinician can play a role in recognizing this source of UVR in skin disease and in encouraging the use of PPE.
- Okuno T, Ojima J, Saito H. Ultraviolet radiation emitted by CO(2) arc welding. Ann Occup Hyg. 2001;45:597-601.
- Peng CY, Liu HH, Chang CP, et al. Evaluation and monitoring of UVR in shield metal ARC welding processing. Health Phys. 2007;93:101-108.
- The National Institute for Occupational Safety and Health. Criteria for a recommended standard: occupational exposure to ultraviolet radiation. DHHS (NIOSH) publication 73-11009. https://www.cdc.gov/niosh/docs/73-11009/. Updated June 6, 2014. Accessed September 6, 2019.
- International Commission on Non-Ionizing Radiation Protection. Guidelines on limits of exposure to ultraviolet radiation of wavelengths between 180 nm and 400 nm (incoherent optical radiation). Health Phys. 2004;87:171-186.
- Peng CY, Lan CH, Juang YJ, et al. Exposure assessment of aluminum arc welding radiation. Health Phys. 2007;93:298-306.
- Tenkate TD, Collins MJ. Personal ultraviolet radiation exposure of workers in a welding environment. Am Ind Hyg Assoc J. 1997;58:33-38.
- Emmett EA, Buncher CR, Suskind RB, et al. Skin and eye diseases among arc welders and those exposed to welding operations. J Occup Med. 1981;23:85-90.
- Bruze M, Hindsén M, Trulsson L. Dermatitis with an unusual explanation in a welder. Acta Derm Venereol. 1994;74:380-382.
- Donoghue AM, Sinclair MJ. Basal cell carcinoma after frequent episodes of cutaneous erythema and peeling induced by welding. Occup Environ Med. 1999;56:646.
- Currie CL, Monk BE. Welding and non-melanoma skin cancer. Clin Exp Dermatol. 2000;25:28-29.
- Shah CP, Weis E, Lajous M, et al. Intermittent and chronic ultraviolet light exposure and uveal melanoma: a meta-analysis. Ophthalmology. 2005;112:1599-1607.
- Yang X, Shao D, Ding X, et al. Chronic phototoxic maculopathy caused by welding arc in occupational welders. Can J Ophthalmol. 2012;47:45-50.
- Davies KG, Asanga U, Nku CO, et al. Effect of chronic exposure to welding light on Calabar welders. Niger J Physiol Sci. 2007;22:55-58.
- Wozniak KD. Erythematodes chronicus discoides as an occupational disease in an electric welder [in German]. Berufs-Dermatosen. 1971;19:187-196.
- Shehade SA, Roberts PJ, Diffey BL, et al. Photodermatitis due to spot welding. Br J Dermatol. 1987;117:117-119.
- Roelandts R, Huys I. Broad-band and persistent photosensitivity following accidental ultraviolet C overexposure. Photodermatol Photoimmunol Photomed. 1993;9:144-146.
- Elsner P, Hassam S. Occupational UVC-induced exacerbation of atopic dermatitis in a welder. Contact Dermatitis. 1996;35:180-181.
- Majoie IM, van Weelden H, Sybesma IM, et al. Polymorphous light eruption-like skin lesions in welders caused by ultraviolet C light. J Am Acad Dermatol. 2010;62:150-151.
- Wagner SN, Welke F, Goos M. Occupational UVA-induced allergic photodermatitis in a welder due to hydrochlorothiazide and ramipril. Contact Dermatitis. 2000;43:245-246.
- Fluegel L, Rein BK. Arc welding safety. National Ag Safety Database website. http://nasdonline.org/1083/d000873/arc-welding-safety.html. Published May 1989. Accessed September 6, 2019.
- American Welding Society. Personal protective equipment (PPE) for welding and cutting. Fact sheet no. 33-04/14. http://www.aws.org/technical/facts/FACT-33_2014.pdf. Published April 2014. Accessed September 6, 2019.
- Occupational Safety and Health Administration. Eye protection against radiant energy during welding and cutting in shipyard employment. https://www.osha.gov/Publications/OSHAfactsheet-eyeprotection-during-welding.pdf. Published January 2012. Accessed September 6, 2019.
- Occupational Safety and Health Administration. Welding, cutting, and brazing. https://www.osha.gov/SLTC/weldingcuttingbrazing/standards.html. Accessed September 10, 2019.
Although solar radiation is the most commonly recognized source of UV radiation (UVR), occupational exposures can contribute due to the intensity and chronicity of exposure. Arc welding is a process whereby metal is fused together by heat produced from an electric arc. The electric arc that forms between the electrode and the base metal emits radiation in the full UV spectrum including UVA (400–315 nm), UVB (315–290 nm), and UVC (290–100 nm) wavelengths. Welders, therefore, have an increased risk for broad-spectrum, intense exposure to UVR, which may play a notable role in UV-related skin disease without proper protection. We report 3 welders with skin disease attributed to occupational exposure to UVR.
Case Reports
Patient 1
A 41-year-old man presented for evaluation of treatment-resistant cutaneous lupus. During the 10-year disease course, the patient was treated by both dermatologists and rheumatologists with frequent exacerbations and poor disease control. At the time of presentation, treatment with hydroxychloroquine 200 mg twice daily, azathioprine 50 mg twice daily, intramuscular methylprednisolone acetateinjectable suspension 40 mg, and prednisone 20 mg daily was failing. Physical examination revealed polycyclic erythematous plaques typical of subacute cutaneous lupus erythematosus. A skin biopsy confirmed the diagnosis. Upon further discussion of exacerbating risk factors, the patient noted UVR exposure while working as a welder. Although he had been previously told to avoid sunlight, he did not realize that this recommendation included all forms of UV light. Once this work exposure was eliminated, he was restarted on hydroxychloroquine 200 mg twice daily and topical steroids, and he responded with complete and sustained clearance of disease. When he returned to welding, utilization of sunscreen and sun-protective clothing enabled him to maintain control of his subacute cutaneous lupus erythematosus on oral hydroxychloroquine 200 mg twice daily and topical steroids.
Patient 2
A 55-year-old man presented with numerous actinic keratoses and persistent erythema in a well-demarcated area involving the forehead, temples, and lateral cheeks but sparing the periorbital area. The patient also experienced UVR exposure from welding (up to 4 to 5 times per week during his career spanning more than 20 years). He cited frequent burns in areas where his protective equipment did not cover his skin. He also reported that he often forgoes wearing protective equipment, even though it is available, and only uses safety goggles due to the extreme heat of the working environment as well as the awkwardness of wearing full protective gear while performing certain aspects of the job.
Patient 3
A 63-year-old man presented with a growth on the left side of the upper forehead. A biopsy revealed a squamous cell carcinoma, keratoacanthoma type. He worked as a welder for 40 years until retiring 1 year prior to presentation. He welded daily and always wore a tall face shield. Although the face shield covered most of his face, the scalp and some parts of the upper face were not well protected. In addition to the keratoacanthoma, which presented just outside of the area protected by the face shield, the patient had numerous actinic keratoses on the scalp.
Comment
Welding and UVR Exposure
Arc welders endure large amounts of UVR exposure, which is substantial enough to have notable health effects. The duration of exposure, electrical current used, angle of exposure, amount of ventilation, and the distance from the welding arc play a role in overall UVR exposure.1,2 Maximum permissible exposure (MPE) limits to UVR have been set by the International Commission on Non-Ionizing Radiation Protection and the National Institute for Occupational Safety and Health.3,4 The quantity of radiation produced by the arc allows for an exposure time of only a few seconds to minutes before surpassing MPE to UV light.1,5 Welders are exposed to total-body UVR doses up to 3000 times the MPE, and mean cumulative exposure calculated over an 8-hour workday can reach 9795 mJ/cm2.6
Workers in close proximity to welders also receive large UVR doses and may not be aware of its hazardous effects. Nearby nonwelders can be exposed to 13 times the MPE of UVR.6 At distances up to 10 m from the arc, the irradiance is large enough to reach MPE to UVR in less than 3 hours.1
Skin and Eye Damage From Welding
Exposure to UVR produced by the welding arc may lead to acute skin or eye reactions, chronic skin or eye disorders, or exacerbation of photosensitive diseases. Common acute problems are photokeratoconjunctivitis (welder’s flash) and skin erythema.7,8
Actinic elastosis, actinic keratoses, ocular melanoma, and photosensitive diseases represent a spectrum of disorders that can present from chronic UV exposure in welders. In a study by Emmett et al7 of 152 welders and 58 controls, actinic elastosis was found to be more frequent in welders than controls. Cases of basal cell carcinoma and squamous cell carcinoma also have been reported in welders.9,10 However, in the study by Emmett et al,7 a statistically significant correlation between welding and skin cancer was not documented. There were limitations in the study, such as small sample size and a young average age of welders.7 Future studies may be needed to further clarify the risk for skin cancer in welders.
Although there is no clear association with skin cancer, an increased risk of ocular melanoma in welders is more clearly established. A meta-analysis of 5 studies found that welding was a significant risk factor for ocular melanoma, with an odds ratio of 2.05 (95% confidence interval, 1.20-3.51).11 Other reported eye damage from chronic UVR exposure includes cataracts, chronic conjunctivitis, and retinal damage.12,13
Case reports of the following photosensitive diseases have been reported to be exacerbated or caused by UV light exposure in welders: discoid lupus erythematosus14; photodermatitis15; broadband photosensitivity with decreased minimal erythema dose to UVA, UVB, and UVC16; UVC-exacerbated atopic dermatitis17; polymorphous light eruption–like skin eruption18; and UVA-induced photoallergy to hydrochlorothiazide and ramipril.19
Prevention of Occupational Exposure to UVR
Occupational Safety and Health Administration guidelines protect workers from excessive exposure to UVR with personal protective equipment (PPE). In addition to UVR protection, PPE needs to protect welders from other risks including trauma from welding debris (slag), fires, electrical burns, and fumes. Online resources from the National Ag Safety Database,20 the American Welding Society,21 and Occupational Safety and Health Administration22,23 are available. These resources advise welders to work in ventilated areas with respirators specific for the metal being welded and to wear clothing and gloves that are not only fire retardant but also UV resistant.20-23 Additional PPE should protect the head, face, and eyes.
Unfortunately, even workers well trained in prevention guidelines may not adequately protect themselves. Some welders forego PPE due to heat, thus exposing themselves to UVR damage in areas that are normally covered. Welders also may forego equipment when working on jobs requiring more detailed welds where clothing, masks, and glasses may be overly bulky and inhibit the worker’s precision. Nontraditional welders, such as artisans or handymen, may not have workplace safety education to be aware of UVR emitted from welding and may not have readily available PPE.
The Figure portrays an amateur welder working without full PPE. Although he is wearing a face shield, he is not wearing fire-retardant clothing, lacks full protective garments, and has no ventilation system.
Conclusion
It is important to recognize welding as an occupation with notable exposure to UVR. Personal protective equipment should be the mainstay of prevention. Sunscreen is a useful adjunct but does not cover UVC that is emitted in the welding arc. Screens and welding blankets can be placed around welders to contain UVR and limit nonwelder exposure. Although UVR hazards should be regulated in the workplace as part of regular safety reviews, the clinician can play a role in recognizing this source of UVR in skin disease and in encouraging the use of PPE.
- Okuno T, Ojima J, Saito H. Ultraviolet radiation emitted by CO(2) arc welding. Ann Occup Hyg. 2001;45:597-601.
- Peng CY, Liu HH, Chang CP, et al. Evaluation and monitoring of UVR in shield metal ARC welding processing. Health Phys. 2007;93:101-108.
- The National Institute for Occupational Safety and Health. Criteria for a recommended standard: occupational exposure to ultraviolet radiation. DHHS (NIOSH) publication 73-11009. https://www.cdc.gov/niosh/docs/73-11009/. Updated June 6, 2014. Accessed September 6, 2019.
- International Commission on Non-Ionizing Radiation Protection. Guidelines on limits of exposure to ultraviolet radiation of wavelengths between 180 nm and 400 nm (incoherent optical radiation). Health Phys. 2004;87:171-186.
- Peng CY, Lan CH, Juang YJ, et al. Exposure assessment of aluminum arc welding radiation. Health Phys. 2007;93:298-306.
- Tenkate TD, Collins MJ. Personal ultraviolet radiation exposure of workers in a welding environment. Am Ind Hyg Assoc J. 1997;58:33-38.
- Emmett EA, Buncher CR, Suskind RB, et al. Skin and eye diseases among arc welders and those exposed to welding operations. J Occup Med. 1981;23:85-90.
- Bruze M, Hindsén M, Trulsson L. Dermatitis with an unusual explanation in a welder. Acta Derm Venereol. 1994;74:380-382.
- Donoghue AM, Sinclair MJ. Basal cell carcinoma after frequent episodes of cutaneous erythema and peeling induced by welding. Occup Environ Med. 1999;56:646.
- Currie CL, Monk BE. Welding and non-melanoma skin cancer. Clin Exp Dermatol. 2000;25:28-29.
- Shah CP, Weis E, Lajous M, et al. Intermittent and chronic ultraviolet light exposure and uveal melanoma: a meta-analysis. Ophthalmology. 2005;112:1599-1607.
- Yang X, Shao D, Ding X, et al. Chronic phototoxic maculopathy caused by welding arc in occupational welders. Can J Ophthalmol. 2012;47:45-50.
- Davies KG, Asanga U, Nku CO, et al. Effect of chronic exposure to welding light on Calabar welders. Niger J Physiol Sci. 2007;22:55-58.
- Wozniak KD. Erythematodes chronicus discoides as an occupational disease in an electric welder [in German]. Berufs-Dermatosen. 1971;19:187-196.
- Shehade SA, Roberts PJ, Diffey BL, et al. Photodermatitis due to spot welding. Br J Dermatol. 1987;117:117-119.
- Roelandts R, Huys I. Broad-band and persistent photosensitivity following accidental ultraviolet C overexposure. Photodermatol Photoimmunol Photomed. 1993;9:144-146.
- Elsner P, Hassam S. Occupational UVC-induced exacerbation of atopic dermatitis in a welder. Contact Dermatitis. 1996;35:180-181.
- Majoie IM, van Weelden H, Sybesma IM, et al. Polymorphous light eruption-like skin lesions in welders caused by ultraviolet C light. J Am Acad Dermatol. 2010;62:150-151.
- Wagner SN, Welke F, Goos M. Occupational UVA-induced allergic photodermatitis in a welder due to hydrochlorothiazide and ramipril. Contact Dermatitis. 2000;43:245-246.
- Fluegel L, Rein BK. Arc welding safety. National Ag Safety Database website. http://nasdonline.org/1083/d000873/arc-welding-safety.html. Published May 1989. Accessed September 6, 2019.
- American Welding Society. Personal protective equipment (PPE) for welding and cutting. Fact sheet no. 33-04/14. http://www.aws.org/technical/facts/FACT-33_2014.pdf. Published April 2014. Accessed September 6, 2019.
- Occupational Safety and Health Administration. Eye protection against radiant energy during welding and cutting in shipyard employment. https://www.osha.gov/Publications/OSHAfactsheet-eyeprotection-during-welding.pdf. Published January 2012. Accessed September 6, 2019.
- Occupational Safety and Health Administration. Welding, cutting, and brazing. https://www.osha.gov/SLTC/weldingcuttingbrazing/standards.html. Accessed September 10, 2019.
Practice Points
- Arc welding can be a major source of UV radiation exposure.
- Welders should be advised to work with proper ventilation and with welding masks, clothing, and gloves that not only are fire retardant but also are UV resistant.

Is it safe to discharge patients with anemia?
Background: Anemia is common in hospitalized patients and is associated with short- and long-term morbidity and mortality. Current evidence shows that reduced red blood cell (RBC) use and more restrictive transfusion practices do not increase short-term mortality; however, few data exist on the long-term outcomes of anemia.
Study design: Retrospective cohort study.
Setting: Integrated health care system (Kaiser Permanente) with 21 hospitals located in Northern California.
Synopsis: From 2010 to 2014, there were 801,261 hospitalizations among 445,371 patients who survived to discharge. The prevalence of moderate anemia (hemoglobin between 7 and 10 g/dL) at hospital discharge increased from 20% to 25% (P less than .001) while RBC transfusions decreased by 28% (P less than .001). Resolution of moderate anemia within 6 months of hospital discharge decreased from 42% to 34% (P less than .001). RBC transfusion and rehospitalization rates at 6 months decreased as well. During the study period, adjusted 6-month mortality decreased from 16.1% to 15.6% (P = .04) in patients with moderate anemia.
Given the retrospective design of this study, data must be interpreted with caution in determining a causal relationship. The authors also acknowledge that there may be unmeasured confounding variables not accounted for in the study results.
Bottom line: Despite higher rates of moderate anemia at discharge, there was not an associated rise in subsequent RBC transfusions, readmissions, or mortality in the 6 months after hospital discharge.
Citation: Roubinian NH et al. Long-term outcomes among patients discharged from the hospital with moderate anemia: A retrospective cohort study. Ann Intern Med. 2019 Jan 14. doi: 10.7326/M17-3253.
Dr. Schmit is an associate professor of medicine in the division of general and hospital medicine at UT Health San Antonio and a hospitalist at South Texas Veterans Health Care System, also in San Antonio.
Beta-blockers effective, safe for HFrEF with renal dysfunction
PARIS – Beta-blocking drugs were as effective for improving survival in patients with moderately severe renal dysfunction as they were in patients with normal renal function in a meta-analysis of more than 13,000 patients, a finding that seemed to solidify the role for this drug class for essentially all similar heart failure patients, regardless of their renal function.

This evidence could reshape usual care because “renal impairment is often considered a barrier in clinical practice” for starting a beta-blocker drug in patients with heart failure with reduced ejection fraction (HFrEF), Dipak Kotecha, MBChB, said at the annual congress of the European Society of Cardiology.
“We have shown with sufficient sample size that beta-blockers are effective in reducing mortality in patient with HFrEF and in sinus rhythm, even in those with an eGFR [estimated glomerular filtration rate] of 30-44 mL/min per 1.73 m2,” said Dr. Kotecha, a cardiologist at the University of Birmingham (England). “The results suggest that renal impairment should not obstruct the prescription and maintenance of beta-blockers in patients with HFrEF.”
“This important study was a novel attempt to look at [HFrEF] patients with renal insufficiency to see whether they received the same benefit from beta-blockers as other patients, and they did. So renal insufficiency is not a reason to withhold beta-blockers” from these patients, commented Mariell Jessup, MD, a heart failure physician and chief science and medical officer for the American Heart Association in Dallas. “The onus is on clinicians to find a reason not to give a beta-blocker to a patient with HFrEF because they are generally well tolerated and they can have enormous benefit, as we saw in this study,” she said in a video interview.
The analysis run by Dr. Kotecha and associates used data collected in 11 of the pivotal randomized, controlled trial run for beta-blockers during the 1990s and early 2000s, with each study comparing bucindolol, bisoprolol, carvedilol, metoprolol XL, or nebivolol against placebo. The studies collectively enrolled 18,637 patients, which the investigators whittled down in their analysis to 17,433 after excluding patients with a left ventricular ejection fraction below 50% or who were undocumented. The subgroup with HFrEF included 13,861 patient in sinus rhythm at entry, 2,879 with atrial fibrillation, and 693 with an unknown atrial status. The main analysis ran in the 13,861 patients with HFrEF and in sinus rhythm; 14% of this cohort had an eGFR of 30-44 mL/min per 1.73 m2 and 27% had an eGFR of 45-59 mL/min per 1.73 m2. The median age of all patients in the main analysis was 65 years, 23% were women, and their median left ventricular ejection fraction was 27%.
During follow-up of about 3 years, the impact of beta-blocker treatment on survival, compared with placebo, was “substantial” for all strata of patients by renal function, except for those with eGFRs below 30 mL/min per 1.73 m2. (Survival was similar regardless of beta-blocker treatment in the small number of patients with severe renal dysfunction.) The number needed to treat to prevent 1 death in patients with an eGFR of 30-44 mL/min per 1.73 m2 was 21, the same as among patients with an eGFR of 90 mL/min per 1.73 m2 or more, Dr. Kotecha said.
Among the subgroup of patients with atrial fibrillation, beta-blockers appeared to exert no survival benefit, compared with placebo. The investigators did not assess the survival benefits exerted by any individual beta-blocker, compared with the others, and Dr. Kotecha stressed that “my belief is that this is a class effect” and is roughly similar across all the beta-blockers used in the studies.
The analysis also showed good safety and tolerability of the beta-blockers in patients with renal dysfunction. The incidence of adverse events leading to treatment termination was very similar in the beta-blocker and placebo arms, and more than three-quarters of patients in each of the two subgroups with renal dysfunction were maintained on more than 50% of their target beta-blocker dosage.
Dr. Kotecha has been an advisor to Bayer, a speaker on behalf of Atricure, and has received research funding from GlaxoSmithKline and Menarini. Dr. Jessup had no disclosures.
This analysis of individual patient data is very important and extends our knowledge. The results confirm that beta-blocker treatment reduces mortality in patients with heart failure with reduced ejection fraction (HFrEF) and in sinus rhythm who also have moderately severe renal dysfunction with an estimated glomerular filtration rate as low as 30-44 mL/min per 1.73 m2. This is good news for patients with HFrEF and kidney disease. Clinicians often use comorbidities as a reason not to prescribe or up-titrate beta-blockers. These results show that beta-blockers can be used at guideline-directed dosages, even in patients with renal dysfunction. The findings highlight the importance of not looking for excuses to not treat patients with a beta-blocker. Do not worry about renal function.
Theresa A. McDonagh, MD, professor of cardiology at King’s College, London, made these comments as designated discussant for Dr. Kotecha’s report. She had no disclosures.
PARIS – Beta-blocking drugs were as effective for improving survival in patients with moderately severe renal dysfunction as they were in patients with normal renal function in a meta-analysis of more than 13,000 patients, a finding that seemed to solidify the role for this drug class for essentially all similar heart failure patients, regardless of their renal function.
This evidence could reshape usual care because “renal impairment is often considered a barrier in clinical practice” for starting a beta-blocker drug in patients with heart failure with reduced ejection fraction (HFrEF), Dipak Kotecha, MBChB, said at the annual congress of the European Society of Cardiology.
“We have shown with sufficient sample size that beta-blockers are effective in reducing mortality in patient with HFrEF and in sinus rhythm, even in those with an eGFR [estimated glomerular filtration rate] of 30-44 mL/min per 1.73 m2,” said Dr. Kotecha, a cardiologist at the University of Birmingham (England). “The results suggest that renal impairment should not obstruct the prescription and maintenance of beta-blockers in patients with HFrEF.”
“This important study was a novel attempt to look at [HFrEF] patients with renal insufficiency to see whether they received the same benefit from beta-blockers as other patients, and they did. So renal insufficiency is not a reason to withhold beta-blockers” from these patients, commented Mariell Jessup, MD, a heart failure physician and chief science and medical officer for the American Heart Association in Dallas. “The onus is on clinicians to find a reason not to give a beta-blocker to a patient with HFrEF because they are generally well tolerated and they can have enormous benefit, as we saw in this study,” she said in a video interview.
The analysis run by Dr. Kotecha and associates used data collected in 11 of the pivotal randomized, controlled trial run for beta-blockers during the 1990s and early 2000s, with each study comparing bucindolol, bisoprolol, carvedilol, metoprolol XL, or nebivolol against placebo. The studies collectively enrolled 18,637 patients, which the investigators whittled down in their analysis to 17,433 after excluding patients with a left ventricular ejection fraction below 50% or who were undocumented. The subgroup with HFrEF included 13,861 patient in sinus rhythm at entry, 2,879 with atrial fibrillation, and 693 with an unknown atrial status. The main analysis ran in the 13,861 patients with HFrEF and in sinus rhythm; 14% of this cohort had an eGFR of 30-44 mL/min per 1.73 m2 and 27% had an eGFR of 45-59 mL/min per 1.73 m2. The median age of all patients in the main analysis was 65 years, 23% were women, and their median left ventricular ejection fraction was 27%.
During follow-up of about 3 years, the impact of beta-blocker treatment on survival, compared with placebo, was “substantial” for all strata of patients by renal function, except for those with eGFRs below 30 mL/min per 1.73 m2. (Survival was similar regardless of beta-blocker treatment in the small number of patients with severe renal dysfunction.) The number needed to treat to prevent 1 death in patients with an eGFR of 30-44 mL/min per 1.73 m2 was 21, the same as among patients with an eGFR of 90 mL/min per 1.73 m2 or more, Dr. Kotecha said.
Among the subgroup of patients with atrial fibrillation, beta-blockers appeared to exert no survival benefit, compared with placebo. The investigators did not assess the survival benefits exerted by any individual beta-blocker, compared with the others, and Dr. Kotecha stressed that “my belief is that this is a class effect” and is roughly similar across all the beta-blockers used in the studies.
The analysis also showed good safety and tolerability of the beta-blockers in patients with renal dysfunction. The incidence of adverse events leading to treatment termination was very similar in the beta-blocker and placebo arms, and more than three-quarters of patients in each of the two subgroups with renal dysfunction were maintained on more than 50% of their target beta-blocker dosage.
Dr. Kotecha has been an advisor to Bayer, a speaker on behalf of Atricure, and has received research funding from GlaxoSmithKline and Menarini. Dr. Jessup had no disclosures.
REPORTING FROM THE ESC CONGRESS 2019
Cross at the Green, Not in Between

ANSWER
Aside from the usual artifacts from placement on a backboard and from the presence of monitoring devices and wires, the radiograph shows a displaced fracture of the right clavicle. No other significant abnormalities are present.
The patient was ultimately diagnosed with multiple orthopedic injuries, and orthopedics was called to evaluate and manage accordingly.

A 25-year-old man is brought to your facility by EMS transport following an accident while riding a bicycle. Witnesses say he was hit by a car when he suddenly tried to cross a busy intersection. They also report that he was not wearing a helmet and that he was thrown off the bike, landing several feet away.
Initial survey reveals a male who is arousable but nonverbal, just moaning and groaning. There are obvious deformities in both lower extremities and the right upper extremity. The patient’s blood pressure is 100/50 mm Hg and his heart rate, 130 beats/min. Pulse oximetry shows his O2 saturation to be 95% with 100% oxygen via nonrebreather mask. His pupils are equal and reactive bilaterally. Heart and lungs sound clear. Abdomen is soft.
While you continue examining the patient and begin your secondary survey, a portable chest radiograph is obtained (shown). What is your impression?
