User login
Hospitalist Utilization and Performance
The past several years have seen a dramatic increase in the percentage of patients cared for by hospitalists, yet an emerging body of literature examining the association between care given by hospitalists and performance on a number of process measures has shown mixed results. Hospitalists do not appear to provide higher quality of care for pneumonia,1, 2 while results in heart failure are mixed.35 Each of these studies was conducted at a single site, and examined patient‐level effects. More recently, Vasilevskis et al6 assessed the association between the intensity of hospitalist use (measured as the percentage of patients admitted by hospitalists) and performance on process measures. In a cohort of 208 California hospitals, they found a significant improvement in performance on process measures in patients with acute myocardial infarction, heart failure, and pneumonia with increasing percentages of patients admitted by hospitalists.6
To date, no study has examined the association between the use of hospitalists and the publicly reported 30‐day mortality and readmission measures. Specifically, the Centers for Medicare and Medicaid Services (CMS) have developed and now publicly report risk‐standardized 30‐day mortality (RSMR) and readmission rates (RSRR) for Medicare patients hospitalized for 3 common and costly conditionsacute myocardial infarction (AMI), heart failure (HF), and pneumonia.7 Performance on these hospital‐based quality measures varies widely, and vary by hospital volume, ownership status, teaching status, and nurse staffing levels.813 However, even accounting for these characteristics leaves much of the variation in outcomes unexplained. We hypothesized that the presence of hospitalists within a hospital would be associated with higher performance on 30‐day mortality and 30‐day readmission measures for AMI, HF, and pneumonia. We further hypothesized that for hospitals using hospitalists, there would be a positive correlation between increasing percentage of patients admitted by hospitalists and performance on outcome measures. To test these hypotheses, we conducted a national survey of hospitalist leaders, linking data from survey responses to data on publicly reported outcome measures for AMI, HF, and pneumonia.
MATERIALS AND METHODS
Study Sites
Of the 4289 hospitals in operation in 2008, 1945 had 25 or more AMI discharges. We identified hospitals using American Hospital Association (AHA) data, calling hospitals up to 6 times each until we reached our target sample size of 600. Using this methodology, we contacted 1558 hospitals of a possible 1920 with AHA data; of the 1558 called, 598 provided survey results.
Survey Data
Our survey was adapted from the survey developed by Vasilevskis et al.6 The entire survey can be found in the Appendix (see Supporting Information in the online version of this article). Our key questions were: 1) Does your hospital have at least 1 hospitalist program or group? 2) Approximately what percentage of all medical patients in your hospital are admitted by hospitalists? The latter question was intended as an approximation of the intensity of hospitalist use, and has been used in prior studies.6, 14 A more direct measure was not feasible given the complexity of obtaining admission data for such a large and diverse set of hospitals. Respondents were also asked about hospitalist care of AMI, HF, and pneumonia patients. Given the low likelihood of precise estimation of hospitalist participation in care for specific conditions, the response choices were divided into percentage quartiles: 025, 2650, 5175, and 76100. Finally, participants were asked a number of questions regarding hospitalist organizational and clinical characteristics.
Survey Process
We obtained data regarding presence or absence of hospitalists and characteristics of the hospitalist services via phone‐ and fax‐administered survey (see Supporting Information, Appendix, in the online version of this article). Telephone and faxed surveys were administered between February 2010 and January 2011. Hospital telephone numbers were obtained from the 2008 AHA survey database and from a review of each hospital's website. Up to 6 attempts were made to obtain a completed survey from nonrespondents unless participation was specifically refused. Potential respondents were contacted in the following order: hospital medicine department leaders, hospital medicine clinical managers, vice president for medical affairs, chief medical officers, and other hospital executives with knowledge of the hospital medicine services. All respondents agreed with a question asking whether they had direct working knowledge of their hospital medicine services; contacts who said they did not have working knowledge of their hospital medicine services were asked to refer our surveyor to the appropriate person at their site. Absence of a hospitalist program was confirmed by contacting the Medical Staff Office.
Hospital Organizational and Patient‐Mix Characteristics
Hospital‐level organizational characteristics (eg, bed size, teaching status) and patient‐mix characteristics (eg, Medicare and Medicaid inpatient days) were obtained from the 2008 AHA survey database.
Outcome Performance Measures
The 30‐day risk‐standardized mortality and readmission rates (RSMR and RSRR) for 2008 for AMI, HF, and pneumonia were calculated for all admissions for people age 65 and over with traditional fee‐for‐service Medicare. Beneficiaries had to be enrolled for 12 months prior to their hospitalization for any of the 3 conditions, and had to have complete claims data available for that 12‐month period.7 These 6 outcome measures were constructed using hierarchical generalized linear models.1520 Using the RSMR for AMI as an example, for each hospital, the measure is estimated by dividing the predicted number of deaths within 30 days of admission for AMI by the expected number of deaths within 30 days of admission for AMI. This ratio is then divided by the national unadjusted 30‐day mortality rate for AMI, which is obtained using data on deaths from the Medicare beneficiary denominator file. Each measure is adjusted for patient characteristics such as age, gender, and comorbidities. All 6 measures are endorsed by the National Quality Forum (NQF) and are reported publicly by CMS on the Hospital Compare web site.
Statistical Analysis
Comparison of hospital‐ and patient‐level characteristics between hospitals with and without hospitalists was performed using chi‐square tests and Student t tests.
The primary outcome variables are the RSMRs and RSRRs for AMI, HF, and pneumonia. Multivariable linear regression models were used to assess the relationship between hospitals with at least 1 hospitalist group and each dependent variable. Models were adjusted for variables previously reported to be associated with quality of care. Hospital‐level characteristics included core‐based statistical area, teaching status, number of beds, region, safety‐net status, nursing staff ratio (number of registered nurse FTEs/number of hospital FTEs), and presence or absence of cardiac catheterization and coronary bypass capability. Patient‐level characteristics included Medicare and Medicaid inpatient days as a percentage of total inpatient days and percentage of admissions by race (black vs non‐black). The presence of hospitalists was correlated with each of the hospital and patient‐level characteristics. Further analyses of the subset of hospitals that use hospitalists included construction of multivariable linear regression models to assess the relationship between the percentage of patients admitted by hospitalists and the dependent variables. Models were adjusted for the same patient‐ and hospital‐level characteristics.
The institutional review boards at Yale University and University of California, San Francisco approved the study. All analyses were performed using Statistical Analysis Software (SAS) version 9.1 (SAS Institute, Inc, Cary, NC).
RESULTS
Characteristics of Participating Hospitals
Telephone, fax, and e‐mail surveys were attempted with 1558 hospitals; we received 598 completed surveys for a response rate of 40%. There was no difference between responders and nonresponders on any of the 6 outcome variables, the number of Medicare or Medicaid inpatient days, and the percentage of admissions by race. Responders and nonresponders were also similar in size, ownership, safety‐net and teaching status, nursing staff ratio, presence of cardiac catheterization and coronary bypass capability, and core‐based statistical area. They differed only on region of the country, where hospitals in the northwest Central and Pacific regions of the country had larger overall proportions of respondents. All hospitals provided information about the presence or absence of hospitalist programs. The majority of respondents were hospitalist clinical or administrative managers (n = 220) followed by hospitalist leaders (n = 106), other executives (n = 58), vice presidents for medical affairs (n = 39), and chief medical officers (n = 15). Each respondent indicated a working knowledge of their site's hospitalist utilization and practice characteristics. Absence of hospitalist utilization was confirmed by contact with the Medical Staff Office.
Comparisons of Sites With Hospitalists and Those Without Hospitalists
Hospitals with and without hospitalists differed by a number of organizational characteristics (Table 1). Sites with hospitalists were more likely to be larger, nonprofit teaching hospitals, located in metropolitan regions, and have cardiac surgical services. There was no difference in the hospitals' safety‐net status or RN staffing ratio. Hospitals with hospitalists admitted lower percentages of black patients.
| Hospitalist Program | No Hospitalist Program | ||
|---|---|---|---|
| N = 429 | N = 169 | ||
| N (%) | N (%) | P Value | |
| |||
| Core‐based statistical area | <0.0001 | ||
| Division | 94 (21.9%) | 53 (31.4%) | |
| Metro | 275 (64.1%) | 72 (42.6%) | |
| Micro | 52 (12.1%) | 38 (22.5%) | |
| Rural | 8 (1.9%) | 6 (3.6%) | |
| Owner | 0.0003 | ||
| Public | 47 (11.0%) | 20 (11.8%) | |
| Nonprofit | 333 (77.6%) | 108 (63.9%) | |
| Private | 49 (11.4%) | 41 (24.3%) | |
| Teaching status | <0.0001 | ||
| COTH | 54 (12.6%) | 7 (4.1%) | |
| Teaching | 110 (25.6%) | 26 (15.4%) | |
| Other | 265 (61.8%) | 136 (80.5%) | |
| Cardiac type | 0.0003 | ||
| CABG | 286 (66.7%) | 86 (50.9%) | |
| CATH | 79 (18.4%) | 36 (21.3%) | |
| Other | 64 (14.9%) | 47 (27.8%) | |
| Region | 0.007 | ||
| New England | 35 (8.2%) | 3 (1.8%) | |
| Middle Atlantic | 60 (14.0%) | 29 (17.2%) | |
| South Atlantic | 78 (18.2%) | 23 (13.6%) | |
| NE Central | 60 (14.0%) | 35 (20.7%) | |
| SE Central | 31 (7.2%) | 10 (5.9%) | |
| NW Central | 38 (8.9%) | 23 (13.6%) | |
| SW Central | 41 (9.6%) | 21 (12.4%) | |
| Mountain | 22 (5.1%) | 3 (1.8%) | |
| Pacific | 64 (14.9%) | 22 (13.0%) | |
| Safety‐net | 0.53 | ||
| Yes | 72 (16.8%) | 32 (18.9%) | |
| No | 357 (83.2%) | 137 (81.1%) | |
| Mean (SD) | Mean (SD) | P value | |
| RN staffing ratio (n = 455) | 27.3 (17.0) | 26.1 (7.6) | 0.28 |
| Total beds | 315.0 (216.6) | 214.8 (136.0) | <0.0001 |
| % Medicare inpatient days | 47.2 (42) | 49.7 (41) | 0.19 |
| % Medicaid inpatient days | 18.5 (28) | 21.4 (46) | 0.16 |
| % Black | 7.6 (9.6) | 10.6 (17.4) | 0.03 |
Characteristics of Hospitalist Programs and Responsibilities
Of the 429 sites reporting use of hospitalists, the median percentage of patients admitted by hospitalists was 60%, with an interquartile range (IQR) of 35% to 80%. The median number of full‐time equivalent hospitalists per hospital was 8 with an IQR of 5 to 14. The IQR reflects the middle 50% of the distribution of responses, and is not affected by outliers or extreme values. Additional characteristics of hospitalist programs can be found in Table 2. The estimated percentage of patients with AMI, HF, and pneumonia cared for by hospitalists varied considerably, with fewer patients with AMI and more patients with pneumonia under hospitalist care. Overall, a majority of hospitalist groups provided the following services: care of critical care patients, emergency department admission screening, observation unit coverage, coverage for cardiac arrests and rapid response teams, quality improvement or utilization review activities, development of hospital practice guidelines, and participation in implementation of major hospital system projects (such as implementation of an electronic health record system).
| N (%) | |
|---|---|
| |
| Date program established | |
| 19871994 | 9 (2.2%) |
| 19952002 | 130 (32.1%) |
| 20032011 | 266 (65.7%) |
| Missing date | 24 |
| No. of hospitalist FTEs | |
| Median (IQR) | 8 (5, 14) |
| Percent of medical patients admitted by hospitalists | |
| Median (IQR) | 60% (35, 80) |
| No. of hospitalists groups | |
| 1 | 333 (77.6%) |
| 2 | 54 (12.6%) |
| 3 | 36 (8.4%) |
| Don't know | 6 (1.4%) |
| Employment of hospitalists (not mutually exclusive) | |
| Hospital system | 98 (22.8%) |
| Hospital | 185 (43.1%) |
| Local physician practice group | 62 (14.5%) |
| Hospitalist physician practice group (local) | 83 (19.3%) |
| Hospitalist physician practice group (national/regional) | 36 (8.4%) |
| Other/unknown | 36 (8.4%) |
| Any 24‐hr in‐house coverage by hospitalists | |
| Yes | 329 (76.7%) |
| No | 98 (22.8%) |
| 3 | 1 (0.2%) |
| Unknown | 1 (0.2%) |
| No. of hospitalist international medical graduates | |
| Median (IQR) | 3 (1, 6) |
| No. of hospitalists that are <1 yr out of residency | |
| Median (IQR) | 1 (0, 2) |
| Percent of patients with AMI cared for by hospitalists | |
| 0%25% | 148 (34.5%) |
| 26%50% | 67 (15.6%) |
| 51%75% | 50 (11.7%) |
| 76%100% | 54 (12.6%) |
| Don't know | 110 (25.6%) |
| Percent of patients with heart failure cared for by hospitalists | |
| 0%25% | 79 (18.4%) |
| 26%50% | 78 (18.2%) |
| 51%75% | 75 (17.5%) |
| 76%100% | 84 (19.6%) |
| Don't know | 113 (26.3%) |
| Percent of patients with pneumonia cared for by hospitalists | |
| 0%25% | 47 (11.0%) |
| 26%50% | 61 (14.3%) |
| 51%75% | 74 (17.3%) |
| 76%100% | 141 (32.9%) |
| Don't know | 105 (24.5%) |
| Hospitalist provision of services | |
| Care of critical care patients | |
| Hospitalists provide service | 346 (80.7%) |
| Hospitalists do not provide service | 80 (18.7%) |
| Don't know | 3 (0.7%) |
| Emergency department admission screening | |
| Hospitalists provide service | 281 (65.5%) |
| Hospitalists do not provide service | 143 (33.3%) |
| Don't know | 5 (1.2%) |
| Observation unit coverage | |
| Hospitalists provide service | 359 (83.7%) |
| Hospitalists do not provide service | 64 (14.9%) |
| Don't know | 6 (1.4%) |
| Emergency department coverage | |
| Hospitalists provide service | 145 (33.8%) |
| Hospitalists do not provide service | 280 (65.3%) |
| Don't know | 4 (0.9%) |
| Coverage for cardiac arrests | |
| Hospitalists provide service | 283 (66.0%) |
| Hospitalists do not provide service | 135 (31.5%) |
| Don't know | 11 (2.6%) |
| Rapid response team coverage | |
| Hospitalists provide service | 240 (55.9%) |
| Hospitalists do not provide service | 168 (39.2%) |
| Don't know | 21 (4.9%) |
| Quality improvement or utilization review | |
| Hospitalists provide service | 376 (87.7%) |
| Hospitalists do not provide service | 37 (8.6%) |
| Don't know | 16 (3.7%) |
| Hospital practice guideline development | |
| Hospitalists provide service | 339 (79.0%) |
| Hospitalists do not provide service | 55 (12.8%) |
| Don't know | 35 (8.2%) |
| Implementation of major hospital system projects | |
| Hospitalists provide service | 309 (72.0%) |
| Hospitalists do not provide service | 96 (22.4%) |
| Don't know | 24 (5.6%) |
Relationship Between Hospitalist Utilization and Outcomes
Tables 3 and 4 show the comparisons between hospitals with and without hospitalists on each of the 6 outcome measures. In the bivariate analysis (Table 3), there was no statistically significant difference between groups on any of the outcome measures with the exception of the risk‐stratified readmission rate for heart failure. Sites with hospitalists had a lower RSRR for HF than sites without hospitalists (24.7% vs 25.4%, P < 0.0001). These results were similar in the multivariable models as seen in Table 4, in which the beta estimate (slope) was not significantly different for hospitals utilizing hospitalists compared to those that did not, on all measures except the RSRR for HF. For the subset of hospitals that used hospitalists, there was no statistically significant change in any of the 6 outcome measures, with increasing percentage of patients admitted by hospitalists. Table 5 demonstrates that for each RSMR and RSRR, the slope did not consistently increase or decrease with incrementally higher percentages of patients admitted by hospitalists, and the confidence intervals for all estimates crossed zero.
| Hospitalist Program | No Hospitalist Program | ||
|---|---|---|---|
| N = 429 | N = 169 | ||
| Outcome Measure | Mean % (SD) | Mean (SD) | P Value |
| |||
| MI RSMR | 16.0 (1.6) | 16.1 (1.5) | 0.56 |
| MI RSRR | 19.9 (0.88) | 20.0 (0.86) | 0.16 |
| HF RSMR | 11.3 (1.4) | 11.3 (1.4) | 0.77 |
| HF RSRR | 24.7 (1.6) | 25.4 (1.8) | <0.0001 |
| Pneumonia RSMR | 11.7 (1.7) | 12.0 (1.7) | 0.08 |
| Pneumonia RSRR | 18.2 (1.2) | 18.3 (1.1) | 0.28 |
| Adjusted beta estimate (95% CI) | |
|---|---|
| |
| MI RSMR | |
| Hospitalist | 0.001 (0.002, 004) |
| MI RSRR | |
| Hospitalist | 0.001 (0.002, 0.001) |
| HF RSMR | |
| Hospitalist | 0.0004 (0.002, 0.003) |
| HF RSRR | |
| Hospitalist | 0.006 (0.009, 0.003) |
| Pneumonia RSMR | |
| Hospitalist | 0.002 (0.005, 0.001) |
| Pneumonia RSRR | |
| Hospitalist | 0.00001 (0.002, 0.002) |
| Adjusted Beta Estimate (95% CI) | |
|---|---|
| |
| MI RSMR | |
| Percent admit | |
| 0%30% | 0.003 (0.007, 0.002) |
| 32%48% | 0.001 (0.005, 0.006) |
| 50%66% | Ref |
| 70%80% | 0.004 (0.001, 0.009) |
| 85% | 0.004 (0.009, 0.001) |
| MI RSRR | |
| Percent admit | |
| 0%30% | 0.001 (0.002, 0.004) |
| 32%48% | 0.001 (0.004, 0.004) |
| 50%66% | Ref |
| 70%80% | 0.001 (0.002, 0.004) |
| 85% | 0.001 (0.002, 0.004) |
| HF RSMR | |
| Percent admit | |
| 0%30% | 0.001 (0.005, 0.003) |
| 32%48% | 0.002 (0.007, 0.003) |
| 50%66% | Ref |
| 70%80% | 0.002 (0.006, 0.002) |
| 85% | 0.001 (0.004, 0.005) |
| HF RSRR | |
| Percent admit | |
| 0%30% | 0.002 (0.004, 0.007) |
| 32%48% | 0.0003 (0.005, 0.006) |
| 50%66% | Ref |
| 70%80% | 0.001 (0.005, 0.004) |
| 85% | 0.002 (0.007, 0.003) |
| Pneumonia RSMR | |
| Percent admit | |
| 0%30% | 0.001 (0.004, 0.006) |
| 32%48% | 0.00001 (0.006, 0.006) |
| 50%66% | Ref |
| 70%80% | 0.001 (0.004, 0.006) |
| 85% | 0.001 (0.006, 0.005) |
| Pneumonia RSRR | |
| Percent admit | |
| 0%30% | 0.0002 (0.004, 0.003) |
| 32%48% | 0.004 (0.0003, 0.008) |
| 50%66% | Ref |
| 70%80% | 0.001 (0.003, 0.004) |
| 85% | 0.002 (0.002, 0.006) |
DISCUSSION
In this national survey of hospitals, we did not find a significant association between the use of hospitalists and hospitals' performance on 30‐day mortality or readmissions measures for AMI, HF, or pneumonia. While there was a statistically lower 30‐day risk‐standardized readmission rate measure for the heart failure measure among hospitals that use hospitalists, the effect size was small. The survey response rate of 40% is comparable to other surveys of physicians and other healthcare personnel, however, there were no significant differences between responders and nonresponders, so the potential for response bias, while present, is small.
Contrary to the findings of a recent study,21 we did not find a higher readmission rate for any of the 3 conditions in hospitals with hospitalist programs. One advantage of our study is the use of more robust risk‐adjustment methods. Our study used NQF‐endorsed risk‐standardized measures of readmission, which capture readmissions to any hospital for common, high priority conditions where the impact of care coordination and discontinuity of care are paramount. The models use administrative claims data, but have been validated by medical record data. Another advantage is that our study focused on a time period when hospital readmissions were a standard quality benchmark and increasing priority for hospitals, hospitalists, and community‐based care delivery systems. While our study is not able to discern whether patients had primary care physicians or the reason for admission to a hospitalist's care, our data do suggest that hospitalists continue to care for a large percentage of hospitalized patients. Moreover, increasing the proportion of patients being admitted to hospitalists did not affect the risk for readmission, providing perhaps reassuring evidence (or lack of proof) for a direct association between use of hospitalist systems and higher risk for readmission.
While hospitals with hospitalists clearly did not have better mortality or readmission rates, an alternate viewpoint might hold that, despite concerns that hospitalists negatively impact care continuity, our data do not demonstrate an association between readmission rates and use of hospitalist services. It is possible that hospitals that have hospitalists may have more ability to invest in hospital‐based systems of care,22 an association which may incorporate any hospitalist effect, but our results were robust even after testing whether adjustment for hospital factors (such as profit status, size) affected our results.
It is also possible that secular trends in hospitals or hospitalist systems affected our results. A handful of single‐site studies carried out soon after the hospitalist model's earliest descriptions found a reduction in mortality and readmission rates with the implementation of a hospitalist program.2325 Alternatively, it may be that there has been a dilution of the effect of hospitalists as often occurs when any new innovation is spread from early adopter sites to routine practice. Consistent with other multicenter studies from recent eras,21, 26 our article's findings do not demonstrate an association between hospitalists and improved outcomes. Unlike other multicenter studies, we had access to disease‐specific risk‐adjustment methodologies, which may partially account for referral biases related to patient‐specific measures of acute or chronic illness severity.
Changes in the hospitalist effect over time have a number of explanations, some of which are relevant to our study. Recent evidence suggests that complex organizational characteristics, such as organizational values and goals, may contribute to performance on 30‐day mortality for AMI rather than specific processes and protocols27; intense focus on AMI as a quality improvement target is emblematic of a number of national initiatives that may have affected our results. Interestingly, hospitalist systems have changed over time as well. Early in the hospitalist movement, hospitalist systems were implemented largely at the behest of hospitals trying to reduce costs. In recent years, however, hospitalist systems are at least as frequently being implemented because outpatient‐based physicians or surgeons request hospitalists; hospitalists have been focused on care of uncoveredpatients, since the model's earliest description. In addition, some hospitals invest in hospitalist programs based on perceived ability of hospitalists to improve quality and achieve better patient outcomes in an era of payment increasingly being linked to quality of care metrics.
Our study has several limitations, six of which are noted here. First, while the hospitalist model has been widely embraced in the adult medicine field, in the absence of board certification, there is no gold standard definition of a hospitalist. It is therefore possible that some respondents may have represented groups that were identified incorrectly as hospitalists. Second, the data for the primary independent variable of interest was based upon self‐report and, therefore, subject to recall bias and potential misclassification of results. Respondents were not aware of our hypothesis, so the bias should not have been in one particular direction. Third, the data for the outcome variables are from 2008. They may, therefore, not reflect organizational enhancements related to use of hospitalists that are in process, and take years to yield downstream improvements on performance metrics. In addition, of the 429 hospitals that have hospitalist programs, 46 programs were initiated after 2008. While national performance on the 6 outcome variables has been relatively static over time,7 any significant change in hospital performance on these metrics since 2008 could suggest an overestimation or underestimation of the effect of hospitalist programs on patient outcomes. Fourth, we were not able to adjust for additional hospital or health system level characteristics that may be associated with hospitalist use or patient outcomes. Fifth, our regression models had significant collinearity, in that the presence of hospitalists was correlated with each of the covariates. However, this finding would indicate that our estimates may be overly conservative and could have contributed to our nonsignificant findings. Finally, outcomes for 2 of the 3 clinical conditions measured are ones for which hospitalists may less frequently provide care: acute myocardial infarction and heart failure. Outcome measures more relevant for hospitalists may be all‐condition, all‐cause, 30‐day mortality and readmission.
This work adds to the growing body of literature examining the impact of hospitalists on quality of care. To our knowledge, it is the first study to assess the association between hospitalist use and performance on outcome metrics at a national level. While our findings suggest that use of hospitalists alone may not lead to improved performance on outcome measures, a parallel body of research is emerging implicating broader system and organizational factors as key to high performance on outcome measures. It is likely that multiple factors contribute to performance on outcome measures, including type and mix of hospital personnel, patient care processes and workflow, and system level attributes. Comparative effectiveness and implementation research that assess the contextual factors and interventions that lead to successful system improvement and better performance is increasingly needed. It is unlikely that a single factor, such as hospitalist use, will significantly impact 30‐day mortality or readmission and, therefore, multifactorial interventions are likely required. In addition, hospitalist use is a complex intervention as the structure, processes, training, experience, role in the hospital system, and other factors (including quality of hospitalists or the hospitalist program) vary across programs. Rather than focusing on the volume of care delivered by hospitalists, hospitals will likely need to support hospital medicine programs that have the time and expertise to devote to improving the quality and value of care delivered across the hospital system. This study highlights that interventions leading to improvement on core outcome measures are more complex than simply having a hospital medicine program.
Acknowledgements
The authors acknowledge Judy Maselli, MPH, Division of General Internal Medicine, Department of Medicine, University of California, San Francisco, for her assistance with statistical analyses and preparation of tables.
Disclosures: Work on this project was supported by the Robert Wood Johnson Clinical Scholars Program (K.G.); California Healthcare Foundation grant 15763 (A.D.A.); and a grant from the National Heart, Lung, and Blood Institute (NHLBI), study 1U01HL105270‐02 (H.M.K.). Dr Krumholz is the chair of the Cardiac Scientific Advisory Board for United Health and has a research grant with Medtronic through Yale University; Dr Auerbach has a grant through the National Heart, Lung, and Blood Institute (NHLBI). The authors have no other disclosures to report.
- ,,,.Comparison of hospitalists and nonhospitalists regarding core measures of pneumonia care.Am J Manag Care.2007;13:129–132.
- ,,,.Comparison of processes and outcomes of pneumonia care between hospitalists and community‐based primary care physicians.Mayo Clin Proc.2002;77(10):1053–1058.
- ,,,,.Quality of care for patients hospitalized with heart failure: assessing the impact of hospitalists.Arch Intern Med.2002;162(11):1251–1256.
- ,,, et al.Quality of care for decompensated heart failure: comparable performance between academic hospitalists and non‐hospitalists.J Gen Intern Med.2008;23(9):1399–1406.
- ,,.Comparison of practice patterns of hospitalists and community physicians in the care of patients with congestive heart failure.J Hosp Med.2008;3(1):35–41.
- ,,,,.Cross‐sectional analysis of hospitalist prevalence and quality of care in California.J Hosp Med.2010;5(4):200–207.
- Hospital Compare. Department of Health and Human Services. Available at: http://www.hospitalcompare.hhs.gov. Accessed September 3,2011.
- ,.Teaching hospitals and quality of care: a review of the literature.Milbank Q.2002;80(3):569–593.
- ,,, et al.A systematic review and meta‐analysis of studies comparing mortality rates of private for‐profit and private not‐for‐profit hospitals.Can Med Assoc J.2002;166(11):1399–1406.
- ,,,,.Patient and hospital characteristics associated with recommended processes of care for elderly patients hospitalized with pneumonia: results from the Medicare Quality Indicator System Pneumonia Module.Arch Intern Med.2002;162(7):827–833.
- ,,,.Care in U.S. hospitals—The Hospital Quality Alliance Program.N Engl J Med.2005;353(3):265–274.
- ,,, et al.Hospital characteristics and quality of care.JAMA.1992;268(13):1709–1714.
- ,,,,.Nurse‐staffing levels and the quality of care in hospitals.N Engl J Med.2002;346(22):1715–1722.
- ,,,.Health care market trends and the evolution of hospitalist use and roles.J Gen Intern Med.2005;20:101–107.
- ,,, et al.An administrative claims model suitable for profiling hospital performance based on 30‐day mortality rates among patients with an acute myocardial infarction.Circulation.2006;113:1683–1692.
- ,,, et al.An administrative claims measure suitable for profiling hospital performance based on 30‐day all‐cause readmission rates among patients with acute myocardial infarction.Circulation.2011;4:243–252.
- ,,, et al.An administrative claims measure suitable for profiling hospital performance on the basis of 30‐day all‐cause readmission rates among patients with heart failure.Circ Cardiovasc Qual Outcomes.2008;1:29–37.
- ,,, et al.An administrative claims model suitable for profiling hospital performance based on 30‐day mortality rates among patients with heart failure.Circulation.2006;113:1693–1701.
- ,,, et al.An administrative claims model for profiling hospital 30‐day mortality rates for pneumonia patients.PLoS ONE.2011;6(4):e17401.
- ,,, et al.Development, validation and results of a measure of 30‐day readmission following hospitalization for pneumonia.J Hosp Med.2011;6:142–150.
- ,.Association of hospitalist care with medical utilization after discharge: evidence of cost shift from a cohort study.Ann Intern Med.2011;155:152–159.
- ,,,.California hospital leaders' views of hospitalists: meeting needs of the present and future.J Hosp Med.2009;4:528–534.
- ,,, et al.Effects of physician experience on costs and outcomes on an academic general medicine service: results of a trial of hospitalists.Ann Intern Med.2002;137:866–874.
- ,,,,,.Implementation of a voluntary hospitalist service at a community teaching hospital: improved clinical efficiency and patients outcomes.Ann Intern Med.2002;137:859–865.
- ,,,.A comparative study of unscheduled hospital readmissions in a resident‐staffed teaching service and a hospitalist‐based service.South Med J.2009;102:145–149.
- ,,,,,.Outcomes of care by hospitalists, general internists, and family physicians.N Engl J Med.2007;357:2589–2600.
- ,,, et al.What distinguishes top‐performing hospitals in acute myocardial infarction mortality rates?Ann Intern Med.2011;154:384–390.
The past several years have seen a dramatic increase in the percentage of patients cared for by hospitalists, yet an emerging body of literature examining the association between care given by hospitalists and performance on a number of process measures has shown mixed results. Hospitalists do not appear to provide higher quality of care for pneumonia,1, 2 while results in heart failure are mixed.35 Each of these studies was conducted at a single site, and examined patient‐level effects. More recently, Vasilevskis et al6 assessed the association between the intensity of hospitalist use (measured as the percentage of patients admitted by hospitalists) and performance on process measures. In a cohort of 208 California hospitals, they found a significant improvement in performance on process measures in patients with acute myocardial infarction, heart failure, and pneumonia with increasing percentages of patients admitted by hospitalists.6
To date, no study has examined the association between the use of hospitalists and the publicly reported 30‐day mortality and readmission measures. Specifically, the Centers for Medicare and Medicaid Services (CMS) have developed and now publicly report risk‐standardized 30‐day mortality (RSMR) and readmission rates (RSRR) for Medicare patients hospitalized for 3 common and costly conditionsacute myocardial infarction (AMI), heart failure (HF), and pneumonia.7 Performance on these hospital‐based quality measures varies widely, and vary by hospital volume, ownership status, teaching status, and nurse staffing levels.813 However, even accounting for these characteristics leaves much of the variation in outcomes unexplained. We hypothesized that the presence of hospitalists within a hospital would be associated with higher performance on 30‐day mortality and 30‐day readmission measures for AMI, HF, and pneumonia. We further hypothesized that for hospitals using hospitalists, there would be a positive correlation between increasing percentage of patients admitted by hospitalists and performance on outcome measures. To test these hypotheses, we conducted a national survey of hospitalist leaders, linking data from survey responses to data on publicly reported outcome measures for AMI, HF, and pneumonia.
MATERIALS AND METHODS
Study Sites
Of the 4289 hospitals in operation in 2008, 1945 had 25 or more AMI discharges. We identified hospitals using American Hospital Association (AHA) data, calling hospitals up to 6 times each until we reached our target sample size of 600. Using this methodology, we contacted 1558 hospitals of a possible 1920 with AHA data; of the 1558 called, 598 provided survey results.
Survey Data
Our survey was adapted from the survey developed by Vasilevskis et al.6 The entire survey can be found in the Appendix (see Supporting Information in the online version of this article). Our key questions were: 1) Does your hospital have at least 1 hospitalist program or group? 2) Approximately what percentage of all medical patients in your hospital are admitted by hospitalists? The latter question was intended as an approximation of the intensity of hospitalist use, and has been used in prior studies.6, 14 A more direct measure was not feasible given the complexity of obtaining admission data for such a large and diverse set of hospitals. Respondents were also asked about hospitalist care of AMI, HF, and pneumonia patients. Given the low likelihood of precise estimation of hospitalist participation in care for specific conditions, the response choices were divided into percentage quartiles: 025, 2650, 5175, and 76100. Finally, participants were asked a number of questions regarding hospitalist organizational and clinical characteristics.
Survey Process
We obtained data regarding presence or absence of hospitalists and characteristics of the hospitalist services via phone‐ and fax‐administered survey (see Supporting Information, Appendix, in the online version of this article). Telephone and faxed surveys were administered between February 2010 and January 2011. Hospital telephone numbers were obtained from the 2008 AHA survey database and from a review of each hospital's website. Up to 6 attempts were made to obtain a completed survey from nonrespondents unless participation was specifically refused. Potential respondents were contacted in the following order: hospital medicine department leaders, hospital medicine clinical managers, vice president for medical affairs, chief medical officers, and other hospital executives with knowledge of the hospital medicine services. All respondents agreed with a question asking whether they had direct working knowledge of their hospital medicine services; contacts who said they did not have working knowledge of their hospital medicine services were asked to refer our surveyor to the appropriate person at their site. Absence of a hospitalist program was confirmed by contacting the Medical Staff Office.
Hospital Organizational and Patient‐Mix Characteristics
Hospital‐level organizational characteristics (eg, bed size, teaching status) and patient‐mix characteristics (eg, Medicare and Medicaid inpatient days) were obtained from the 2008 AHA survey database.
Outcome Performance Measures
The 30‐day risk‐standardized mortality and readmission rates (RSMR and RSRR) for 2008 for AMI, HF, and pneumonia were calculated for all admissions for people age 65 and over with traditional fee‐for‐service Medicare. Beneficiaries had to be enrolled for 12 months prior to their hospitalization for any of the 3 conditions, and had to have complete claims data available for that 12‐month period.7 These 6 outcome measures were constructed using hierarchical generalized linear models.1520 Using the RSMR for AMI as an example, for each hospital, the measure is estimated by dividing the predicted number of deaths within 30 days of admission for AMI by the expected number of deaths within 30 days of admission for AMI. This ratio is then divided by the national unadjusted 30‐day mortality rate for AMI, which is obtained using data on deaths from the Medicare beneficiary denominator file. Each measure is adjusted for patient characteristics such as age, gender, and comorbidities. All 6 measures are endorsed by the National Quality Forum (NQF) and are reported publicly by CMS on the Hospital Compare web site.
Statistical Analysis
Comparison of hospital‐ and patient‐level characteristics between hospitals with and without hospitalists was performed using chi‐square tests and Student t tests.
The primary outcome variables are the RSMRs and RSRRs for AMI, HF, and pneumonia. Multivariable linear regression models were used to assess the relationship between hospitals with at least 1 hospitalist group and each dependent variable. Models were adjusted for variables previously reported to be associated with quality of care. Hospital‐level characteristics included core‐based statistical area, teaching status, number of beds, region, safety‐net status, nursing staff ratio (number of registered nurse FTEs/number of hospital FTEs), and presence or absence of cardiac catheterization and coronary bypass capability. Patient‐level characteristics included Medicare and Medicaid inpatient days as a percentage of total inpatient days and percentage of admissions by race (black vs non‐black). The presence of hospitalists was correlated with each of the hospital and patient‐level characteristics. Further analyses of the subset of hospitals that use hospitalists included construction of multivariable linear regression models to assess the relationship between the percentage of patients admitted by hospitalists and the dependent variables. Models were adjusted for the same patient‐ and hospital‐level characteristics.
The institutional review boards at Yale University and University of California, San Francisco approved the study. All analyses were performed using Statistical Analysis Software (SAS) version 9.1 (SAS Institute, Inc, Cary, NC).
RESULTS
Characteristics of Participating Hospitals
Telephone, fax, and e‐mail surveys were attempted with 1558 hospitals; we received 598 completed surveys for a response rate of 40%. There was no difference between responders and nonresponders on any of the 6 outcome variables, the number of Medicare or Medicaid inpatient days, and the percentage of admissions by race. Responders and nonresponders were also similar in size, ownership, safety‐net and teaching status, nursing staff ratio, presence of cardiac catheterization and coronary bypass capability, and core‐based statistical area. They differed only on region of the country, where hospitals in the northwest Central and Pacific regions of the country had larger overall proportions of respondents. All hospitals provided information about the presence or absence of hospitalist programs. The majority of respondents were hospitalist clinical or administrative managers (n = 220) followed by hospitalist leaders (n = 106), other executives (n = 58), vice presidents for medical affairs (n = 39), and chief medical officers (n = 15). Each respondent indicated a working knowledge of their site's hospitalist utilization and practice characteristics. Absence of hospitalist utilization was confirmed by contact with the Medical Staff Office.
Comparisons of Sites With Hospitalists and Those Without Hospitalists
Hospitals with and without hospitalists differed by a number of organizational characteristics (Table 1). Sites with hospitalists were more likely to be larger, nonprofit teaching hospitals, located in metropolitan regions, and have cardiac surgical services. There was no difference in the hospitals' safety‐net status or RN staffing ratio. Hospitals with hospitalists admitted lower percentages of black patients.
| Hospitalist Program | No Hospitalist Program | ||
|---|---|---|---|
| N = 429 | N = 169 | ||
| N (%) | N (%) | P Value | |
| |||
| Core‐based statistical area | <0.0001 | ||
| Division | 94 (21.9%) | 53 (31.4%) | |
| Metro | 275 (64.1%) | 72 (42.6%) | |
| Micro | 52 (12.1%) | 38 (22.5%) | |
| Rural | 8 (1.9%) | 6 (3.6%) | |
| Owner | 0.0003 | ||
| Public | 47 (11.0%) | 20 (11.8%) | |
| Nonprofit | 333 (77.6%) | 108 (63.9%) | |
| Private | 49 (11.4%) | 41 (24.3%) | |
| Teaching status | <0.0001 | ||
| COTH | 54 (12.6%) | 7 (4.1%) | |
| Teaching | 110 (25.6%) | 26 (15.4%) | |
| Other | 265 (61.8%) | 136 (80.5%) | |
| Cardiac type | 0.0003 | ||
| CABG | 286 (66.7%) | 86 (50.9%) | |
| CATH | 79 (18.4%) | 36 (21.3%) | |
| Other | 64 (14.9%) | 47 (27.8%) | |
| Region | 0.007 | ||
| New England | 35 (8.2%) | 3 (1.8%) | |
| Middle Atlantic | 60 (14.0%) | 29 (17.2%) | |
| South Atlantic | 78 (18.2%) | 23 (13.6%) | |
| NE Central | 60 (14.0%) | 35 (20.7%) | |
| SE Central | 31 (7.2%) | 10 (5.9%) | |
| NW Central | 38 (8.9%) | 23 (13.6%) | |
| SW Central | 41 (9.6%) | 21 (12.4%) | |
| Mountain | 22 (5.1%) | 3 (1.8%) | |
| Pacific | 64 (14.9%) | 22 (13.0%) | |
| Safety‐net | 0.53 | ||
| Yes | 72 (16.8%) | 32 (18.9%) | |
| No | 357 (83.2%) | 137 (81.1%) | |
| Mean (SD) | Mean (SD) | P value | |
| RN staffing ratio (n = 455) | 27.3 (17.0) | 26.1 (7.6) | 0.28 |
| Total beds | 315.0 (216.6) | 214.8 (136.0) | <0.0001 |
| % Medicare inpatient days | 47.2 (42) | 49.7 (41) | 0.19 |
| % Medicaid inpatient days | 18.5 (28) | 21.4 (46) | 0.16 |
| % Black | 7.6 (9.6) | 10.6 (17.4) | 0.03 |
Characteristics of Hospitalist Programs and Responsibilities
Of the 429 sites reporting use of hospitalists, the median percentage of patients admitted by hospitalists was 60%, with an interquartile range (IQR) of 35% to 80%. The median number of full‐time equivalent hospitalists per hospital was 8 with an IQR of 5 to 14. The IQR reflects the middle 50% of the distribution of responses, and is not affected by outliers or extreme values. Additional characteristics of hospitalist programs can be found in Table 2. The estimated percentage of patients with AMI, HF, and pneumonia cared for by hospitalists varied considerably, with fewer patients with AMI and more patients with pneumonia under hospitalist care. Overall, a majority of hospitalist groups provided the following services: care of critical care patients, emergency department admission screening, observation unit coverage, coverage for cardiac arrests and rapid response teams, quality improvement or utilization review activities, development of hospital practice guidelines, and participation in implementation of major hospital system projects (such as implementation of an electronic health record system).
| N (%) | |
|---|---|
| |
| Date program established | |
| 19871994 | 9 (2.2%) |
| 19952002 | 130 (32.1%) |
| 20032011 | 266 (65.7%) |
| Missing date | 24 |
| No. of hospitalist FTEs | |
| Median (IQR) | 8 (5, 14) |
| Percent of medical patients admitted by hospitalists | |
| Median (IQR) | 60% (35, 80) |
| No. of hospitalists groups | |
| 1 | 333 (77.6%) |
| 2 | 54 (12.6%) |
| 3 | 36 (8.4%) |
| Don't know | 6 (1.4%) |
| Employment of hospitalists (not mutually exclusive) | |
| Hospital system | 98 (22.8%) |
| Hospital | 185 (43.1%) |
| Local physician practice group | 62 (14.5%) |
| Hospitalist physician practice group (local) | 83 (19.3%) |
| Hospitalist physician practice group (national/regional) | 36 (8.4%) |
| Other/unknown | 36 (8.4%) |
| Any 24‐hr in‐house coverage by hospitalists | |
| Yes | 329 (76.7%) |
| No | 98 (22.8%) |
| 3 | 1 (0.2%) |
| Unknown | 1 (0.2%) |
| No. of hospitalist international medical graduates | |
| Median (IQR) | 3 (1, 6) |
| No. of hospitalists that are <1 yr out of residency | |
| Median (IQR) | 1 (0, 2) |
| Percent of patients with AMI cared for by hospitalists | |
| 0%25% | 148 (34.5%) |
| 26%50% | 67 (15.6%) |
| 51%75% | 50 (11.7%) |
| 76%100% | 54 (12.6%) |
| Don't know | 110 (25.6%) |
| Percent of patients with heart failure cared for by hospitalists | |
| 0%25% | 79 (18.4%) |
| 26%50% | 78 (18.2%) |
| 51%75% | 75 (17.5%) |
| 76%100% | 84 (19.6%) |
| Don't know | 113 (26.3%) |
| Percent of patients with pneumonia cared for by hospitalists | |
| 0%25% | 47 (11.0%) |
| 26%50% | 61 (14.3%) |
| 51%75% | 74 (17.3%) |
| 76%100% | 141 (32.9%) |
| Don't know | 105 (24.5%) |
| Hospitalist provision of services | |
| Care of critical care patients | |
| Hospitalists provide service | 346 (80.7%) |
| Hospitalists do not provide service | 80 (18.7%) |
| Don't know | 3 (0.7%) |
| Emergency department admission screening | |
| Hospitalists provide service | 281 (65.5%) |
| Hospitalists do not provide service | 143 (33.3%) |
| Don't know | 5 (1.2%) |
| Observation unit coverage | |
| Hospitalists provide service | 359 (83.7%) |
| Hospitalists do not provide service | 64 (14.9%) |
| Don't know | 6 (1.4%) |
| Emergency department coverage | |
| Hospitalists provide service | 145 (33.8%) |
| Hospitalists do not provide service | 280 (65.3%) |
| Don't know | 4 (0.9%) |
| Coverage for cardiac arrests | |
| Hospitalists provide service | 283 (66.0%) |
| Hospitalists do not provide service | 135 (31.5%) |
| Don't know | 11 (2.6%) |
| Rapid response team coverage | |
| Hospitalists provide service | 240 (55.9%) |
| Hospitalists do not provide service | 168 (39.2%) |
| Don't know | 21 (4.9%) |
| Quality improvement or utilization review | |
| Hospitalists provide service | 376 (87.7%) |
| Hospitalists do not provide service | 37 (8.6%) |
| Don't know | 16 (3.7%) |
| Hospital practice guideline development | |
| Hospitalists provide service | 339 (79.0%) |
| Hospitalists do not provide service | 55 (12.8%) |
| Don't know | 35 (8.2%) |
| Implementation of major hospital system projects | |
| Hospitalists provide service | 309 (72.0%) |
| Hospitalists do not provide service | 96 (22.4%) |
| Don't know | 24 (5.6%) |
Relationship Between Hospitalist Utilization and Outcomes
Tables 3 and 4 show the comparisons between hospitals with and without hospitalists on each of the 6 outcome measures. In the bivariate analysis (Table 3), there was no statistically significant difference between groups on any of the outcome measures with the exception of the risk‐stratified readmission rate for heart failure. Sites with hospitalists had a lower RSRR for HF than sites without hospitalists (24.7% vs 25.4%, P < 0.0001). These results were similar in the multivariable models as seen in Table 4, in which the beta estimate (slope) was not significantly different for hospitals utilizing hospitalists compared to those that did not, on all measures except the RSRR for HF. For the subset of hospitals that used hospitalists, there was no statistically significant change in any of the 6 outcome measures, with increasing percentage of patients admitted by hospitalists. Table 5 demonstrates that for each RSMR and RSRR, the slope did not consistently increase or decrease with incrementally higher percentages of patients admitted by hospitalists, and the confidence intervals for all estimates crossed zero.
| Hospitalist Program | No Hospitalist Program | ||
|---|---|---|---|
| N = 429 | N = 169 | ||
| Outcome Measure | Mean % (SD) | Mean (SD) | P Value |
| |||
| MI RSMR | 16.0 (1.6) | 16.1 (1.5) | 0.56 |
| MI RSRR | 19.9 (0.88) | 20.0 (0.86) | 0.16 |
| HF RSMR | 11.3 (1.4) | 11.3 (1.4) | 0.77 |
| HF RSRR | 24.7 (1.6) | 25.4 (1.8) | <0.0001 |
| Pneumonia RSMR | 11.7 (1.7) | 12.0 (1.7) | 0.08 |
| Pneumonia RSRR | 18.2 (1.2) | 18.3 (1.1) | 0.28 |
| Adjusted beta estimate (95% CI) | |
|---|---|
| |
| MI RSMR | |
| Hospitalist | 0.001 (0.002, 004) |
| MI RSRR | |
| Hospitalist | 0.001 (0.002, 0.001) |
| HF RSMR | |
| Hospitalist | 0.0004 (0.002, 0.003) |
| HF RSRR | |
| Hospitalist | 0.006 (0.009, 0.003) |
| Pneumonia RSMR | |
| Hospitalist | 0.002 (0.005, 0.001) |
| Pneumonia RSRR | |
| Hospitalist | 0.00001 (0.002, 0.002) |
| Adjusted Beta Estimate (95% CI) | |
|---|---|
| |
| MI RSMR | |
| Percent admit | |
| 0%30% | 0.003 (0.007, 0.002) |
| 32%48% | 0.001 (0.005, 0.006) |
| 50%66% | Ref |
| 70%80% | 0.004 (0.001, 0.009) |
| 85% | 0.004 (0.009, 0.001) |
| MI RSRR | |
| Percent admit | |
| 0%30% | 0.001 (0.002, 0.004) |
| 32%48% | 0.001 (0.004, 0.004) |
| 50%66% | Ref |
| 70%80% | 0.001 (0.002, 0.004) |
| 85% | 0.001 (0.002, 0.004) |
| HF RSMR | |
| Percent admit | |
| 0%30% | 0.001 (0.005, 0.003) |
| 32%48% | 0.002 (0.007, 0.003) |
| 50%66% | Ref |
| 70%80% | 0.002 (0.006, 0.002) |
| 85% | 0.001 (0.004, 0.005) |
| HF RSRR | |
| Percent admit | |
| 0%30% | 0.002 (0.004, 0.007) |
| 32%48% | 0.0003 (0.005, 0.006) |
| 50%66% | Ref |
| 70%80% | 0.001 (0.005, 0.004) |
| 85% | 0.002 (0.007, 0.003) |
| Pneumonia RSMR | |
| Percent admit | |
| 0%30% | 0.001 (0.004, 0.006) |
| 32%48% | 0.00001 (0.006, 0.006) |
| 50%66% | Ref |
| 70%80% | 0.001 (0.004, 0.006) |
| 85% | 0.001 (0.006, 0.005) |
| Pneumonia RSRR | |
| Percent admit | |
| 0%30% | 0.0002 (0.004, 0.003) |
| 32%48% | 0.004 (0.0003, 0.008) |
| 50%66% | Ref |
| 70%80% | 0.001 (0.003, 0.004) |
| 85% | 0.002 (0.002, 0.006) |
DISCUSSION
In this national survey of hospitals, we did not find a significant association between the use of hospitalists and hospitals' performance on 30‐day mortality or readmissions measures for AMI, HF, or pneumonia. While there was a statistically lower 30‐day risk‐standardized readmission rate measure for the heart failure measure among hospitals that use hospitalists, the effect size was small. The survey response rate of 40% is comparable to other surveys of physicians and other healthcare personnel, however, there were no significant differences between responders and nonresponders, so the potential for response bias, while present, is small.
Contrary to the findings of a recent study,21 we did not find a higher readmission rate for any of the 3 conditions in hospitals with hospitalist programs. One advantage of our study is the use of more robust risk‐adjustment methods. Our study used NQF‐endorsed risk‐standardized measures of readmission, which capture readmissions to any hospital for common, high priority conditions where the impact of care coordination and discontinuity of care are paramount. The models use administrative claims data, but have been validated by medical record data. Another advantage is that our study focused on a time period when hospital readmissions were a standard quality benchmark and increasing priority for hospitals, hospitalists, and community‐based care delivery systems. While our study is not able to discern whether patients had primary care physicians or the reason for admission to a hospitalist's care, our data do suggest that hospitalists continue to care for a large percentage of hospitalized patients. Moreover, increasing the proportion of patients being admitted to hospitalists did not affect the risk for readmission, providing perhaps reassuring evidence (or lack of proof) for a direct association between use of hospitalist systems and higher risk for readmission.
While hospitals with hospitalists clearly did not have better mortality or readmission rates, an alternate viewpoint might hold that, despite concerns that hospitalists negatively impact care continuity, our data do not demonstrate an association between readmission rates and use of hospitalist services. It is possible that hospitals that have hospitalists may have more ability to invest in hospital‐based systems of care,22 an association which may incorporate any hospitalist effect, but our results were robust even after testing whether adjustment for hospital factors (such as profit status, size) affected our results.
It is also possible that secular trends in hospitals or hospitalist systems affected our results. A handful of single‐site studies carried out soon after the hospitalist model's earliest descriptions found a reduction in mortality and readmission rates with the implementation of a hospitalist program.2325 Alternatively, it may be that there has been a dilution of the effect of hospitalists as often occurs when any new innovation is spread from early adopter sites to routine practice. Consistent with other multicenter studies from recent eras,21, 26 our article's findings do not demonstrate an association between hospitalists and improved outcomes. Unlike other multicenter studies, we had access to disease‐specific risk‐adjustment methodologies, which may partially account for referral biases related to patient‐specific measures of acute or chronic illness severity.
Changes in the hospitalist effect over time have a number of explanations, some of which are relevant to our study. Recent evidence suggests that complex organizational characteristics, such as organizational values and goals, may contribute to performance on 30‐day mortality for AMI rather than specific processes and protocols27; intense focus on AMI as a quality improvement target is emblematic of a number of national initiatives that may have affected our results. Interestingly, hospitalist systems have changed over time as well. Early in the hospitalist movement, hospitalist systems were implemented largely at the behest of hospitals trying to reduce costs. In recent years, however, hospitalist systems are at least as frequently being implemented because outpatient‐based physicians or surgeons request hospitalists; hospitalists have been focused on care of uncoveredpatients, since the model's earliest description. In addition, some hospitals invest in hospitalist programs based on perceived ability of hospitalists to improve quality and achieve better patient outcomes in an era of payment increasingly being linked to quality of care metrics.
Our study has several limitations, six of which are noted here. First, while the hospitalist model has been widely embraced in the adult medicine field, in the absence of board certification, there is no gold standard definition of a hospitalist. It is therefore possible that some respondents may have represented groups that were identified incorrectly as hospitalists. Second, the data for the primary independent variable of interest was based upon self‐report and, therefore, subject to recall bias and potential misclassification of results. Respondents were not aware of our hypothesis, so the bias should not have been in one particular direction. Third, the data for the outcome variables are from 2008. They may, therefore, not reflect organizational enhancements related to use of hospitalists that are in process, and take years to yield downstream improvements on performance metrics. In addition, of the 429 hospitals that have hospitalist programs, 46 programs were initiated after 2008. While national performance on the 6 outcome variables has been relatively static over time,7 any significant change in hospital performance on these metrics since 2008 could suggest an overestimation or underestimation of the effect of hospitalist programs on patient outcomes. Fourth, we were not able to adjust for additional hospital or health system level characteristics that may be associated with hospitalist use or patient outcomes. Fifth, our regression models had significant collinearity, in that the presence of hospitalists was correlated with each of the covariates. However, this finding would indicate that our estimates may be overly conservative and could have contributed to our nonsignificant findings. Finally, outcomes for 2 of the 3 clinical conditions measured are ones for which hospitalists may less frequently provide care: acute myocardial infarction and heart failure. Outcome measures more relevant for hospitalists may be all‐condition, all‐cause, 30‐day mortality and readmission.
This work adds to the growing body of literature examining the impact of hospitalists on quality of care. To our knowledge, it is the first study to assess the association between hospitalist use and performance on outcome metrics at a national level. While our findings suggest that use of hospitalists alone may not lead to improved performance on outcome measures, a parallel body of research is emerging implicating broader system and organizational factors as key to high performance on outcome measures. It is likely that multiple factors contribute to performance on outcome measures, including type and mix of hospital personnel, patient care processes and workflow, and system level attributes. Comparative effectiveness and implementation research that assess the contextual factors and interventions that lead to successful system improvement and better performance is increasingly needed. It is unlikely that a single factor, such as hospitalist use, will significantly impact 30‐day mortality or readmission and, therefore, multifactorial interventions are likely required. In addition, hospitalist use is a complex intervention as the structure, processes, training, experience, role in the hospital system, and other factors (including quality of hospitalists or the hospitalist program) vary across programs. Rather than focusing on the volume of care delivered by hospitalists, hospitals will likely need to support hospital medicine programs that have the time and expertise to devote to improving the quality and value of care delivered across the hospital system. This study highlights that interventions leading to improvement on core outcome measures are more complex than simply having a hospital medicine program.
Acknowledgements
The authors acknowledge Judy Maselli, MPH, Division of General Internal Medicine, Department of Medicine, University of California, San Francisco, for her assistance with statistical analyses and preparation of tables.
Disclosures: Work on this project was supported by the Robert Wood Johnson Clinical Scholars Program (K.G.); California Healthcare Foundation grant 15763 (A.D.A.); and a grant from the National Heart, Lung, and Blood Institute (NHLBI), study 1U01HL105270‐02 (H.M.K.). Dr Krumholz is the chair of the Cardiac Scientific Advisory Board for United Health and has a research grant with Medtronic through Yale University; Dr Auerbach has a grant through the National Heart, Lung, and Blood Institute (NHLBI). The authors have no other disclosures to report.
- ,,,.Comparison of hospitalists and nonhospitalists regarding core measures of pneumonia care.Am J Manag Care.2007;13:129–132.
- ,,,.Comparison of processes and outcomes of pneumonia care between hospitalists and community‐based primary care physicians.Mayo Clin Proc.2002;77(10):1053–1058.
- ,,,,.Quality of care for patients hospitalized with heart failure: assessing the impact of hospitalists.Arch Intern Med.2002;162(11):1251–1256.
- ,,, et al.Quality of care for decompensated heart failure: comparable performance between academic hospitalists and non‐hospitalists.J Gen Intern Med.2008;23(9):1399–1406.
- ,,.Comparison of practice patterns of hospitalists and community physicians in the care of patients with congestive heart failure.J Hosp Med.2008;3(1):35–41.
- ,,,,.Cross‐sectional analysis of hospitalist prevalence and quality of care in California.J Hosp Med.2010;5(4):200–207.
- Hospital Compare. Department of Health and Human Services. Available at: http://www.hospitalcompare.hhs.gov. Accessed September 3,2011.
- ,.Teaching hospitals and quality of care: a review of the literature.Milbank Q.2002;80(3):569–593.
- ,,, et al.A systematic review and meta‐analysis of studies comparing mortality rates of private for‐profit and private not‐for‐profit hospitals.Can Med Assoc J.2002;166(11):1399–1406.
- ,,,,.Patient and hospital characteristics associated with recommended processes of care for elderly patients hospitalized with pneumonia: results from the Medicare Quality Indicator System Pneumonia Module.Arch Intern Med.2002;162(7):827–833.
- ,,,.Care in U.S. hospitals—The Hospital Quality Alliance Program.N Engl J Med.2005;353(3):265–274.
- ,,, et al.Hospital characteristics and quality of care.JAMA.1992;268(13):1709–1714.
- ,,,,.Nurse‐staffing levels and the quality of care in hospitals.N Engl J Med.2002;346(22):1715–1722.
- ,,,.Health care market trends and the evolution of hospitalist use and roles.J Gen Intern Med.2005;20:101–107.
- ,,, et al.An administrative claims model suitable for profiling hospital performance based on 30‐day mortality rates among patients with an acute myocardial infarction.Circulation.2006;113:1683–1692.
- ,,, et al.An administrative claims measure suitable for profiling hospital performance based on 30‐day all‐cause readmission rates among patients with acute myocardial infarction.Circulation.2011;4:243–252.
- ,,, et al.An administrative claims measure suitable for profiling hospital performance on the basis of 30‐day all‐cause readmission rates among patients with heart failure.Circ Cardiovasc Qual Outcomes.2008;1:29–37.
- ,,, et al.An administrative claims model suitable for profiling hospital performance based on 30‐day mortality rates among patients with heart failure.Circulation.2006;113:1693–1701.
- ,,, et al.An administrative claims model for profiling hospital 30‐day mortality rates for pneumonia patients.PLoS ONE.2011;6(4):e17401.
- ,,, et al.Development, validation and results of a measure of 30‐day readmission following hospitalization for pneumonia.J Hosp Med.2011;6:142–150.
- ,.Association of hospitalist care with medical utilization after discharge: evidence of cost shift from a cohort study.Ann Intern Med.2011;155:152–159.
- ,,,.California hospital leaders' views of hospitalists: meeting needs of the present and future.J Hosp Med.2009;4:528–534.
- ,,, et al.Effects of physician experience on costs and outcomes on an academic general medicine service: results of a trial of hospitalists.Ann Intern Med.2002;137:866–874.
- ,,,,,.Implementation of a voluntary hospitalist service at a community teaching hospital: improved clinical efficiency and patients outcomes.Ann Intern Med.2002;137:859–865.
- ,,,.A comparative study of unscheduled hospital readmissions in a resident‐staffed teaching service and a hospitalist‐based service.South Med J.2009;102:145–149.
- ,,,,,.Outcomes of care by hospitalists, general internists, and family physicians.N Engl J Med.2007;357:2589–2600.
- ,,, et al.What distinguishes top‐performing hospitals in acute myocardial infarction mortality rates?Ann Intern Med.2011;154:384–390.
Copyright © 2012 Society of Hospital Medicine
2.0
Ten years ago, leaders in Hospital Medicine saw the need for a peer‐reviewed Hospital Medicine journal, a key step in the growth of the field. However, there was no small amount of uncertainty as to whether there was room for another medical publication, or whether Hospital Medicine was ready for its own journal.
It's clear now that we should not have been worried. Our specialty has grown in size and influence, and the Journal of Hospital Medicine's growth has progressed along a similar track, linked to the success of the many leaders in our field, including the founders of the Society of Hospital Medicine: John Nelson, MD, MHM, Win Whitcomb, MD, MHM, and Bob Wachter, MD, MHM. Support from them in selecting the Founding Editor, Mark V. Williams, ensured his success in assembling an outstanding editorial team, developing JHM's editorial process, and setting this journal as the bestand not just the onlyjournal for hospitalists to publish their work. JHM serves as both a beacon and a mirror for the field of Hospital Medicine, and I am honored for the opportunity to lead this dynamic journal. I also owe special thanks to the Society of Hospital Medicine and the outstanding team at Wiley‐Blackwell, who have made my transition to this role a smooth one.
After the transition, JHM will continue to be a mirror for Hospital Medicine in that it will reflect the scholarship and innovation of hospitalists' scholarly work in research, quality improvement, education, and clinical excellence. From a practical standpoint, this means JHM will continue to do what it has done so successfully to date: provide fair, insightful, and rapid evaluation and publication of articles that are scientifically rigorous and have an impact on hospitalists and their patients. Being an effective mirror also means the journal will need to be in tune with technological advances in publication and learning. Few of us read paper journals any longer, and the move from print to digital and mobile media provides an important opportunity for this journal. Expanding the means by which we disseminate JHM's findings, highlight evidence, and promote knowledge that impacts our field is a clear direction for the journal.
At the transition from JHM 1.0 to JHM 2.0, the journal is positioned to be a beacon for the field by publishing papers that address new and rapidly evolving issues that will affect hospitalists and their patients. JHM and my editorial team eagerly seek submission of manuscripts on these issues delineated below.
Even if health care reform legislation evolves or changes after the 2012 elections, the need to improve health care value across multiple phases of care is unlikely to disappear. The medical home and accountable care organizations will prompt hospitalists to work with outpatient partners to achieve improvements; focus on readmissions and high‐utilization patients may catalyze integration even without larger changes. This evolution plays to hospitalists' traditional strengths as innovators and leaders of health system innovations while erasing the boundaries between inpatient and outpatient phases of care. How the field adapts toor even better, anticipateschanges in care delivery is a momentous opportunity.
Hospitalists will continue to be leaders in quality and safety improvement, but the need to develop innovations that are effective, scalable, and widely adoptable is growing even more acute. Stated alternately, we need to develop innovations quickly and rigorously, so that neither time nor resources are wasted. Fortunately, there is likely to be financial support for projects that link improvement and evaluation from the Center for Medicare and Medicaid Innovations (CMMI). It is a fair bet that a large number of the CMMI's target issues will be ones that hospitalists also find important, and which are ripe for inquiry.
Shifting from quality to outcomes will prompt a revisiting of how we measure our success as hospitalists. Achieving success in process benchmarks will no longer be sufficient, as our practices will increasingly be measured by our patients' experience, functional status, quality of life, and clinical events (of which measures of safety are a part)both within the walls of the hospital and afterwardrather than solely relying on whether patients appropriately received a drug or procedure during their stay. The need to improve outcomes will immediately bump up against the disappointingly small proportion of measures or evidence that apply to the typical Hospital Medicine patient. Developing these new measures, and the evidence for how to improve them, will be a key challenge for the field of Hospital Medicine. Outcome development and comparisons are a clear focus of the Patient‐Centered Outcomes Research Institute. Again, studies documenting such research will find a welcome home at JHM.
The role of information technology in how hospitalists provide care to patients, decide on best practices, communicate with physicians and patients, and manage their practices is becoming central. A huge, nationwide natural experiment is underway as health systems work to meet meaningful use criteria, and oftentimes hospitalists are central to these efforts. Disseminating best practices, implementing innovative systems, and creating workflows that meet the needs of hospitalists' patients is a key short‐term need, and one our field is uniquely positioned to address.
Finally, the practice of Hospital Medicine continues to evolve. In teaching centers, hospitalists are leading educators of medical students and residents; developing training models that reflect newer thinking about how to teach a 21st‐century physician is a key need for the field. The importance of adaptations to work‐hour reductions for residents cannot be overstated, but attention must be paid to how hospitalists' work hours impact patient care as well. Comanagement systemswhether for medical subspecialties (ie, cancer or heart failure) or surgical specialtieshave yet to fulfill their promise, yet demand for comanagement grows. How might comanagement systems be adapted and targeted so that they become more effective?
Not being a futurist or even slightly omniscient, I am sure this list is neither exhaustive nor final. In my 15 or so years in Hospital Medicine, I know firsthand that the field is vigorous, innovative, and full of surprises. Fortunately, JHM is attuned to changes happening now as well as issues on the horizon, and will always strive to be an even better messenger for Hospital Medicine as a professional and academic specialty.1 In that way, JHM 2.0 will be the same as JHM 1.0. I'm excited to shepherd JHM's ongoing growth and look forward to my years at the helm.
Acknowledgements
Funding Source: Dr. Auerbach is supported by National Heart, Lung, and Blood Institute Grant K24 K24HL098372.
Disclosure: The author discloses no relevant or financial conflicts of interest.
- .Editor transition—getting up off the couch and walking out the door.J Hosp Med.2011;6:485–486.
Ten years ago, leaders in Hospital Medicine saw the need for a peer‐reviewed Hospital Medicine journal, a key step in the growth of the field. However, there was no small amount of uncertainty as to whether there was room for another medical publication, or whether Hospital Medicine was ready for its own journal.
It's clear now that we should not have been worried. Our specialty has grown in size and influence, and the Journal of Hospital Medicine's growth has progressed along a similar track, linked to the success of the many leaders in our field, including the founders of the Society of Hospital Medicine: John Nelson, MD, MHM, Win Whitcomb, MD, MHM, and Bob Wachter, MD, MHM. Support from them in selecting the Founding Editor, Mark V. Williams, ensured his success in assembling an outstanding editorial team, developing JHM's editorial process, and setting this journal as the bestand not just the onlyjournal for hospitalists to publish their work. JHM serves as both a beacon and a mirror for the field of Hospital Medicine, and I am honored for the opportunity to lead this dynamic journal. I also owe special thanks to the Society of Hospital Medicine and the outstanding team at Wiley‐Blackwell, who have made my transition to this role a smooth one.
After the transition, JHM will continue to be a mirror for Hospital Medicine in that it will reflect the scholarship and innovation of hospitalists' scholarly work in research, quality improvement, education, and clinical excellence. From a practical standpoint, this means JHM will continue to do what it has done so successfully to date: provide fair, insightful, and rapid evaluation and publication of articles that are scientifically rigorous and have an impact on hospitalists and their patients. Being an effective mirror also means the journal will need to be in tune with technological advances in publication and learning. Few of us read paper journals any longer, and the move from print to digital and mobile media provides an important opportunity for this journal. Expanding the means by which we disseminate JHM's findings, highlight evidence, and promote knowledge that impacts our field is a clear direction for the journal.
At the transition from JHM 1.0 to JHM 2.0, the journal is positioned to be a beacon for the field by publishing papers that address new and rapidly evolving issues that will affect hospitalists and their patients. JHM and my editorial team eagerly seek submission of manuscripts on these issues delineated below.
Even if health care reform legislation evolves or changes after the 2012 elections, the need to improve health care value across multiple phases of care is unlikely to disappear. The medical home and accountable care organizations will prompt hospitalists to work with outpatient partners to achieve improvements; focus on readmissions and high‐utilization patients may catalyze integration even without larger changes. This evolution plays to hospitalists' traditional strengths as innovators and leaders of health system innovations while erasing the boundaries between inpatient and outpatient phases of care. How the field adapts toor even better, anticipateschanges in care delivery is a momentous opportunity.
Hospitalists will continue to be leaders in quality and safety improvement, but the need to develop innovations that are effective, scalable, and widely adoptable is growing even more acute. Stated alternately, we need to develop innovations quickly and rigorously, so that neither time nor resources are wasted. Fortunately, there is likely to be financial support for projects that link improvement and evaluation from the Center for Medicare and Medicaid Innovations (CMMI). It is a fair bet that a large number of the CMMI's target issues will be ones that hospitalists also find important, and which are ripe for inquiry.
Shifting from quality to outcomes will prompt a revisiting of how we measure our success as hospitalists. Achieving success in process benchmarks will no longer be sufficient, as our practices will increasingly be measured by our patients' experience, functional status, quality of life, and clinical events (of which measures of safety are a part)both within the walls of the hospital and afterwardrather than solely relying on whether patients appropriately received a drug or procedure during their stay. The need to improve outcomes will immediately bump up against the disappointingly small proportion of measures or evidence that apply to the typical Hospital Medicine patient. Developing these new measures, and the evidence for how to improve them, will be a key challenge for the field of Hospital Medicine. Outcome development and comparisons are a clear focus of the Patient‐Centered Outcomes Research Institute. Again, studies documenting such research will find a welcome home at JHM.
The role of information technology in how hospitalists provide care to patients, decide on best practices, communicate with physicians and patients, and manage their practices is becoming central. A huge, nationwide natural experiment is underway as health systems work to meet meaningful use criteria, and oftentimes hospitalists are central to these efforts. Disseminating best practices, implementing innovative systems, and creating workflows that meet the needs of hospitalists' patients is a key short‐term need, and one our field is uniquely positioned to address.
Finally, the practice of Hospital Medicine continues to evolve. In teaching centers, hospitalists are leading educators of medical students and residents; developing training models that reflect newer thinking about how to teach a 21st‐century physician is a key need for the field. The importance of adaptations to work‐hour reductions for residents cannot be overstated, but attention must be paid to how hospitalists' work hours impact patient care as well. Comanagement systemswhether for medical subspecialties (ie, cancer or heart failure) or surgical specialtieshave yet to fulfill their promise, yet demand for comanagement grows. How might comanagement systems be adapted and targeted so that they become more effective?
Not being a futurist or even slightly omniscient, I am sure this list is neither exhaustive nor final. In my 15 or so years in Hospital Medicine, I know firsthand that the field is vigorous, innovative, and full of surprises. Fortunately, JHM is attuned to changes happening now as well as issues on the horizon, and will always strive to be an even better messenger for Hospital Medicine as a professional and academic specialty.1 In that way, JHM 2.0 will be the same as JHM 1.0. I'm excited to shepherd JHM's ongoing growth and look forward to my years at the helm.
Acknowledgements
Funding Source: Dr. Auerbach is supported by National Heart, Lung, and Blood Institute Grant K24 K24HL098372.
Disclosure: The author discloses no relevant or financial conflicts of interest.
- .Editor transition—getting up off the couch and walking out the door.J Hosp Med.2011;6:485–486.
- .Editor transition—getting up off the couch and walking out the door.J Hosp Med.2011;6:485–486.
Patient Satisfaction With Procedural Care
In order to improve resident supervision and timeliness of invasive bedside procedures such as paracentesis, thoracentesis, and lumbar puncture, some academic medical centers have implemented procedure services that focus on providing high‐quality procedural care.1, 2
Procedure services have the potential to affect patient satisfaction, a key indicator in quality of care measurment.3 Having senior physicians present increases patient comfort during outpatient case presentations4 and improves patient satisfaction with explanations of tests and medications.5 However, we had concerns that teaching during a procedure may heighten patient anxiety. Patients are reluctant to be the first patient of a resident or medical student for a procedure,68 and patients are more likely to refuse consent to have a resident perform complex procedures.8 In previous studies, patient satisfaction with gynecological exams and flexible sigmoidoscopy performed by residents was comparable to satisfaction with those performed by staff physicians,9, 10 though in the case of flexible sigmoidoscopy, procedure duration was slightly longer.10 Few, if any, data describe bedside teaching or patient impressions of physician communication during procedures.
We carried out a prospective study of patient perceptions of the University of California San Francisco (UCSF) Hospitalist Procedure Service (HPS). Our study had the primary goal of understanding how our modelwhich involves bedside procedural teaching and feedback in real time (eg, as the procedure is performed)is perceived by patients.
Patients and Methods
Site
Our survey was carried out at UCSF Moffitt‐Long Hospital, a 560‐bed university teaching hospital and the primary university hospital for the University of California San Francisco. This study was reviewed and approved by the Committee on Human Research at UCSF.
Procedure Service
The HPS is composed of two interns who rotate for 2 weeks on a mandatory rotation performing the majority of the procedures done by the service. Every procedure is supervised by an attending hospitalist who has received extended training from interventional radiologists and emergency department ultrasound faculty. Patients are referred to the service by their primary admitting team. Interns receive procedure‐specific didactics, demonstration, and practice with procedure kits, supplemental readings, computer‐based procedure modules, and evidence‐based summaries of procedure‐related considerations. All interns also attend a half‐day procedure simulation session to review procedural and ultrasound techniques.
While interns obtain informed consent and prepare the patient for the procedure, the attending and intern team communicate the following points with each patient: 1) identification as the dedicated procedure team, separate from the primary team caring for the patient; 2) attending self‐identification as the supervisor; 3) attention to stepwise communication with the patient during the procedure; 4) attention to patient comfort throughout the procedure; 5) emphasis on patient safety through the use of time‐outs, sterile technique, and ultrasound when appropriate; and 6) the intention to discuss best practice and teach during the procedure.
All paracentesis and thoracentesis sites are marked by using bedside ultrasound (S‐Cath, SonoSite, Bothell, WA) guidance prior to and, if needed, during the procedure. Ultrasound is occasionally used for marking joint aspiration and lumbar puncture.11 Interns are responsible for making an initial site marking, which is then confirmed by the attending physician. Although not systematized, our service encourages the intern and attending to communicate about proper technique during the procedure itself. For example, attendings ask questions about technique based on evidence in the literature (eg, Why do you replace the stylet in a lumbar puncture needle prior to removal?) or about trouble shooting (eg, What would you do if the flow of ascites stops during this paracentesis?) and also correct any errors in technique (Recall the angle you intended to use based on the ultrasound view).
Patients
Patients are referred to the procedure service by their primary team; referrals are accepted for patients on all services at all levels of care, including the emergency department (ED) and the intensive care unit (ICU). Participants in this study were referred for one of our target procedures (paracentesis, thoracentesis, or lumbar puncture) between November 2008 and July 2009. Patients gave written consent for the supplemental survey independent of consent for the procedure. All consents and procedures were performed in a patient's hospital room and one family member was allowed to stay in the room if desired by the patient. After the completion of the procedure, the attending on the procedure service at the time, which included study authors D.S. and M.M., approached consecutive patients who spoke and read English and were deemed to have capacity to consent for their own procedure to be surveyed. Patients were considered to have capacity to consent based on commonly accepted criteria described in the literature.12, 13 Patients were also excluded if their procedure was performed by the attending alone, if they had repeated procedures done by the service, or if they were too altered or critically ill to participate in the survey.
Survey
Our survey was developed through identification of items reported in the literature,1421 as well as items newly developed for purposes of examining our primary aims. Newly developed questions focused on patients' satisfaction with major aspects of procedure performance as well as the quality and impact of communication with the patient and between members of the team. Two open‐text questions were included to allow patients to share what went well with the procedure as well as areas for improvement. The research team developed a pool of question items for potential inclusion in a patient satisfaction questionnaire. These items were then shown to a group of research‐oriented health professionals, who meet regularly to review academic research protocols. The group provided their opinions about the content and comprehension of the questions, and the written survey employed was a result of their revisions (see Appendix in Supporting Information online).
Written surveys were distributed to patients by the hospitalist attending on service following the procedure as permitted by patients' severity of illness and availability. Surveys were anonymous and self‐administered by the patient or a family member who was in the room for the procedure; all questions were voluntary. A nurse was made responsible for collecting the survey when possible. Survey results were entered into a database without identifiers, with limited demographic information; patient gender, age, and procedure type were included by the attending hospitalist at the end of the survey. A separate and more detailed procedure database was kept of all procedures performed and was used to record patient consent or reason for not consenting as well as documented receipt of a completed survey. This non‐anonymous database contained detailed supplemental information including patient age, level of care, referring service, presence of bloody fluid at any point during the procedure, and physician‐reported immediate complications at the bedside in free text.
Analysis
Reported immediate complications were classified into major and minor based on reported definitions in the literature.2226 Similar to previous studies, major immediate complications were defined as those requiring further procedural intervention, medical therapy, or both.27 Major complications were defined as: bleeding requiring transfusion, pneumothorax requiring a chest tube, respiratory failure, bowel perforation, cerebral herniation or shock, cerebrospinal fluid (CSF) leak requiring intervention, and transfer to a higher level of care. For patients receiving a thoracentesis, chart review was performed to determine the presence of a follow‐up chest x‐ray, the presence of a pneumothorax, or clinical evidence for re‐expansion pulmonary edema. We analyzed differences between respondents and non‐respondents using Chi‐square tests for categorical variables (gender, level of care, referring service, procedure type, bloody fluid, and immediate reported complications) and independent t tests for continuous variables (age).
After review of the open‐ended fields, responses were classified into the following categories: pain control, physician skill, professionalism, communication, symptom relief, procedure duration, and miscellaneous comments. Responses regarding patient perceptions of physician communication were dichotomized into positive (1 = Strongly Agree, 2 = Agree) and negative (3 = Neutral, 4 = Disagree, and 5 = Strongly Disagree), and independent t tests were used to determine the contribution of factors, such as age, while Chi‐square tests were used for the contribution of gender and procedure type. All statistical tests were performed by using the SAS statistical application program (version 9.2).
Results
Respondent Characteristics
Of 324 procedures performed by the HPS during the study period, 95 (29%) were eligible for consent. Of the 229 patients not eligible for consent, 32 (10%) were excluded because the procedure was performed by the attending alone, 76 (23%) lacked English proficiency or literacy, 66 (20%) had altered mental status, 32 (10%) were intubated and/or had severe illness precluding consent, and 23 (7%) were repeat procedures on patients who had previously completed the survey. Only two patients specifically requested an attending to perform the procedure after an introduction to the service. Of the 95 patients eligible for consent, 89 were consented for the survey, and 65 (68%) completed the survey. Of the six eligible, non‐consented patients, all were leaving the floor immediately following the procedure, and time did not allow for consent and survey distribution. There were no differences between eligible responders and nonresponders in age, gender, procedure, requesting service, presence of bloody fluid, or physician‐reported immediate complications (Table 1).
| Demographics | Respondera (n = 65) | Nonresponder (n = 24) |
|---|---|---|
| ||
| Age, y [mean (SD)] | 55.4 (15.7) | 50.4 (17.4) |
| Male gender, n (%) male | 41 (63.1) | 11 (45.8) |
| Procedure, n (%) | ||
| Paracentesis | 31 (47.7) | 10 (41.7) |
| Thoracentesis | 17 (25.8) | 6 (25.0) |
| Lumbar puncture | 15 (22.7) | 7 (29.2) |
| Arthrocentesis | 2 (3.0) | 1 (4.2) |
| Patient location, n (%) | ||
| Floor | 47 (72.3) | 19 (79.2) |
| Step down/telemetry | 17 (26.1) | 3 (12.5) |
| Intensive care unit | 1 (1.5) | 2 (8.3) |
| Service requesting, n (%) | ||
| Medicine | 29 (44.6) | 10 (41.7) |
| Cardiology | 6 (9.1) | 3 (12.5) |
| Liver transplant | 20 (30.3) | 7 (29.2) |
| Bone marrow transplant | 7 (10.6) | 1 (4.2) |
| Surgery | 0 | 1 (4.2) |
| Neurosurgery | 1 (1.5) | 1 (4.2) |
| Other | 2 (3.0) | 1 (4.2) |
| Reported presence of bloody fluid at any point in the procedure, n (%) | 9 (13.6) | 4 (16.7) |
| Other reported immediate complications | ||
| Equipment malfunction | 2 (3.0) | 1 (4.2) |
| Significant cough/pleuritic pain | 1 (1.5) | 1 (4.2) |
| Transient oxygen desaturation | 1 (1.5) | 0 |
| Ascites leak | 0 | 0 |
| Hematoma | 0 | 0 |
| Persistent bleeding | 0 | 0 |
| Transfer to a higher level of care | 0 | 0 |
Complications
As complications would likely play a role in procedure satisfaction, we describe immediate complications for the study population. Of the 324 procedures performed during the study period, no patient had predefined major immediate complications. Upon further chart review of the 96 patients that had a thoracentesis performed, all had a follow‐up chest x‐ray and none suffered an iatrogenic pneumothorax or re‐expansion pulmonary edema. Minor immediate complications for the 324 procedures were reported as follows: postprocedure pain in four patients (1.2%), cough in nine patients (2.8%), five equipment malfunctions (1.5%), four ascites leaks (1.2%), and one incisional bleed requiring a suture for hemostasis (0.3%). There was no significant difference in complications between those consented for the survey and the total study population.
Procedure Satisfaction
More than 90% of patients were satisfied or very satisfied with most aspects of the procedure, including the informed consent process, pain control, expertise, and courtesy of physicians (Table 2). The percentage of patients satisfied with the duration of procedure (88%) was lower than for other measures of satisfaction. Of the 38 patients receiving therapeutic procedures, 34 (89%) were satisfied or highly satisfied with the improvement in symptoms following the procedure.
| Very Satisfied and Satisfied No. (%) | Neutral No. (%) | Dissatisfied and Very Dissatisfied No. (%) | N/A No. (%) | |
|---|---|---|---|---|
| Your overall procedure experience | 65 (100) | 0 (0) | 0 (0) | 0 (0) |
| Explanation of the procedure, risks, and benefits before the procedure | 64 (99) | 1 (2) | 0 (0) | 0 (0) |
| Pain control during the procedure | 60 (92) | 5 (8) | 0 (0) | 0 (0) |
| Expertise/skill of the physicians performing your procedure | 62 (95) | 3 (5) | 0 (0) | 0 (0) |
| Courtesy and bedside manner of the physicians performing your procedure | 65 (100) | 0 (0) | 0 (0) | 0 (0) |
| The time it took to perform your procedure | 57 (88) | 6 (9) | 0 (0) | 2 (3) |
| Improvement in your symptoms following this procedure, if applicable | 34 (52) | 7 (11) | 0 (0) | 24 (37) |
When asked what went well with the procedure, 59 (91%) respondents provided additional comments and feedback. Each response was classified as described in the Methods section. Of the free text responses, 8 of the 59 patients (14%) commented on the attention to pain control (eg, The caring and attention to my pain was most important to me), 5 (8%) on the skills of the operators (Great examination of the entire stomach region with the ultrasound to ensure the best position of the catheter), 6 (10%) on the courtesy and professionalism of the team (eg, Courteous, team‐feeling, addressed my concerns), 9 (15%) on their communication with the team (eg, The doctors made me feel very comfortable before the procedure by laying out the plan and explaining each part of the procedure), and 8 (14%) on relief of their symptoms (eg, There was an almost immediate and significant improvement in my breathing, bloating, and pain). Twenty‐three of the 59 comments (39%) were categorized as miscellaneous (eg, All went great. I fell asleep).
When asked areas for improvement, 55 (85%) patients responded. Thirty‐three patients (60%) reported that nothing could be improved or they instructed the team to just keep doing what you are doing, while 22 (40%) patients expressed a concern. Responses were categorized in a similar fashion to the positive responses. Five of the 22 negative comments (23%) reported that the procedure took too long (eg, Procedure could have been shorter. I got tired sitting up), 4 (18%) commented on pain control (eg, The poke for marking my skin hurt more than the anesthetic. I was surprised), 6 (27%) felt communication was a problem (eg, Discuss the steps with the patient audibly, no whispering, speak clearly), and 7 (32%) had miscellaneous concerns (eg, Try not to do this procedure right after another one).
Physician Communication
Sixty‐four patients (98%) reported that the physicians performing their procedure communicated with each other during the procedure (Table 3). Although one patient did not feel that the physicians communicated with each other, he or she still answered the follow‐up questions regarding perceptions of physician communication. We excluded this patient from our analysis as his or her answers may not be reliable. The majority of patients (84%) reported this communication as reassuring and felt it was a normal part of procedure performance (94%). Those that did not agree that physician communication was reassuring did not differ in average age (P = 0.307), gender (P = 0.511), or procedure type (P = 0.562).
| Strongly Agree and Agree No. (%) | Neutral No. (%) | Disagree, and Strongly Disagree No. (%) | |
|---|---|---|---|
| I felt that the physicians talking to each other about my procedure was reassuring to me | 54 (84) | 10 (16) | 0 (0) |
| Physicians talking to each other while doing a procedure is a normal part of doing a procedure | 60 (94) | 4 (6) | 0 (0) |
Of all positive and negative comments, five specifically addressed communication between physicians. Most (four) reflected satisfaction with bedside teaching (eg, They discussed the procedure in a professional manner and eased my mind at all times) and with having an expert in the room (eg, [The team] discussed things like needle placement, which was nice because there was a second opinion right there in the room). Patients also felt that it was good to experience the teaching, with one patient reporting that the best part of the procedure was watching doctors learn from each other. Patients did not express specific reservations about bedside teaching, resident technique, or fear of complications in free text.
Discussion
Even though novice interns performed procedures and simultaneous bedside teaching, patient satisfaction with a teaching procedure service was high, and reported complication rates were low. In addition, a majority of patients found discussions related to teaching activities reassuring and potentially important to their perception of care quality. Analogous studies examining patient satisfaction with endoscopic care found similar rates of patient satisfaction with endoscopists' bedside manner, technical skills, and pain control, but these studies included sedated patients.21 Our results are unique, as we evaluated awake patients with attention to perception of bedside teaching with novice interns.
Our findings offer an alternative strategy for bedside procedural teaching that employs transparency in the use of an expert and a trainee to introduce patients to bedside teaching by experts, which is not common at many academic medical centers.28 Patients may have been reassured by a clear explanation of the role of the service and the providers involved as well as an assurance of expertise and attention to patient comfort and safety. In addition to patient satisfaction, this model has the potential to impact both the safety of bedside procedures and housestaff education around procedure performance. For example, pneumothorax rates using our procedure service model are lower than those published (0% vs. 4% for ultrasound‐guided thoracentesis and 8.5% for thoracentesis by less experienced clinicians).29
Providers may be reluctant to teach at the bedside of awake patients for fear of heightening patient anxiety over trainee inexperience. In the 1960s similar fears were raised over the concern for patient anxiety with bedside rounding,30 but later studies revealed these concerns to be largely unfounded. Instead, bedside rounds have been shown to positively influence patients' feelings about their hospital experience and their relationships with their physicians compared with patients whose case presentations were made in a conference room.31, 32 Given the opportunity to comment on areas for improvement, patients in our study specifically elaborated regarding pain control, communication, and efficiency problems. Although 16% of patients did not find the communication of physicians reassuring, none of the negative comments reflected problems with bedside teaching, but rather concepts such as desiring a better explanation of steps throughout the procedure. Specifically, patients desire better communication for unanticipated pain.
There are several limitations to this study. Lack of patient satisfaction data from a control group of patients whose procedures were performed by attendings or housestaff alone limits our ability to draw conclusions about our satisfaction scores. The scarce applicable literature offers only imperfect comparison data. Because hospitalists were not blinded to the survey, attending behavior may have been subject to a Hawthorne effect.33 Consenting patients after the procedure could have provided hospitalists with an opportunity to exclude patients who appeared less satisfied with their procedure; however, attempts were made to prevent this behavior by requiring strict accounting of why a patient was not consented for the study. Use of alternative personnel for consent such as nurses was explored, but was found not to be feasible due to limited resources. These data are only applicable to English‐speaking patients who are literate and well enough to complete a survey. It is not clear whether the experience for other patients would reflect the same outcomes. It is plausible that non‐English‐speaking patients might have more concerns about incomprehensible conversations taking place during their procedure. Although the surveys were anonymous and patients were told that the proceduralists would not see individual responses, responses may have been biased out of patient concern that their response might affect their care. Hospitalists obtaining consent, however, were careful to stress anonymity and the distinction between the primary team and the procedure team.
Academic hospitals are struggling with providing quality procedural care while balancing housestaff education and experience.28 With hospitalists playing an increasingly prominent role in housestaff education and patient satisfaction initiatives, the supervision of housestaff by trained hospitalist faculty may help meet both aims in the performance of invasive bedside procedures, particularly at institutions where simulation training resources are limited. Although concern may exist for potential patient anxiety with bedside teaching, our data demonstrate high levels of patient satisfaction with a hospitalist procedure service despite novice procedure performers and an emphasis on teaching during the procedure.
- ,,, et al.Creation of an innovative inpatient medical procedure service and a method to evaluate house staff competency.J Gen Intern Med.2004;19(5 Pt 2):510–513.
- ,,, et al.Impact of a bedside procedure service on general medicine inpatients: A firm‐based trial.J Hosp Med.2007;2(3):143–149.
- Hospital Care Quality Information from the Consumer Perspective (HCAHPS).Quality Assurance Guidelines.Baltimore, MD:Centers for Medicare 113(8):657–662.
- ,,,,.The effect of bedside case presentations on patients' perceptions of their medical care.N Engl J Med.1997;336(16):1150–1155.
- ,,,.‘Sorry, it's my first time!’ Will patients consent to medical students learning procedures?Med Educ.2005;39(4):365–369.
- ,.Ethical considerations surrounding first time procedures: a study and analysis of patient attitudes toward spinal taps by students.Kennedy Inst Ethics J.1992;2(3):217–231.
- ,,,.Patients' willingness to allow residents to learn to practice medical procedures.Acad Med.2004;79(2):144–147.
- ,,.Patient satisfaction with gynecologic care provided by family practice resident physicians.Fam Pract Res J.1991;11(4):421–428.
- ,,.Resident participation in flexible sigmoidoscopy does not affect patient satisfaction.Am J Gastroenterol.2000;95(6):1563–1566.
- ,.Bedside ultrasound for difficult lumbar puncture.J Emerg Med.2005;28(2):197–200.
- ,.Conducting the Assessment. In:Assessing Competence to Consent to Treatment: A Guide for Physicians and Other Health Professionals.First Edition ed.New York, NY:Oxford University Press;1998:80–91.
- ,.Care of Ill, Socially Complicated Patients. In:Medical Management of Vulnerable 2007:407–418.
- ,,,,.Interventional radiologic procedures: patient anxiety, perception of pain, understanding of procedure, and satisfaction with medication‐‐a prospective study.Radiology.2000;215(3):684–688.
- ,,,,.Improving the assessment of (in)patients' satisfaction with hospital care.Med Care.2001;39(3):270–283.
- ,,,.Factors determining inpatient satisfaction with care.Soc Sci Med.2002;54(4):493–504.
- ,,,.Reliability and validity of the Satisfaction with Hospital Care Questionnaire.Int J Qual Health Care.2002;14(6):471–482.
- ,,,,.A randomized trial of four patient satisfaction questionnaires.Med Care.2003;41(12):1343–1352.
- ,,, et al.Development and validation of an in‐patient satisfaction questionnaire.Int J Qual Health Care.2005;17(6):465–472.
- ,,,.Central venous port catheters: evaluation of patients' satisfaction with implantation under local anesthesia.J Vasc Access.2009;10(1):27–32.
- ,,,.Factors influencing patient satisfaction when undergoing endoscopic procedures.Gastrointest Endosc.2009;69(4):883–91, quiz 891.e1.
- ,,, et al.Complications associated with thoracentesis. A prospective, randomized study comparing three different methods.Arch Intern Med.1990;150(4):873–877.
- ,,, et al.Risk of complications after abdominal paracentesis in cirrhotic patients: a prospective study.Clin Gastroenterol Hepatol.2009;7(8):906–909.
- ,,, et al.Performance standards for therapeutic abdominal paracentesis.Hepatology.2004;40(2):484–488.
- ,,,,.Lumbar puncture: its indications, contraindications, complications and technique.Rev Neurol.2007;45(7):433–436.
- .How to perform a lumbar puncture with the patient in the seated position.Br J Hosp Med (Lond).2006;67(3):M46–7.
- ,,.Are commonly used resident measurements associated with procedural skills in internal medicine residency training?J Gen Intern Med.2007;22(3):357–361.
- ,,,MERN Group,.Supervising the Supervisors‐Procedural Training and Supervision in Internal Medicine Residency.J Gen Intern Med.2010.
- ,,,.Pneumothorax following thoracentesis: a systematic review and meta‐analysis.Arch Intern Med.2010;170(4):332–339.
- ,,.The emotional impact of ward rounds.J Mt Sinai Hosp NY.1956;23(6):782–803.
- ,,,.The physiologic and psychological effects of the bedside presentation.N Engl J Med.1989;321(18):1273–1275.
- ,,,,.The effect of bedside case presentations on patients' perceptions of their medical care.N Engl J Med.1997;336(16):1150–1155.
- .Hawthorne effects and research into professional practice.J Eval Clin Pract.2001;7(1):65–70.
In order to improve resident supervision and timeliness of invasive bedside procedures such as paracentesis, thoracentesis, and lumbar puncture, some academic medical centers have implemented procedure services that focus on providing high‐quality procedural care.1, 2
Procedure services have the potential to affect patient satisfaction, a key indicator in quality of care measurment.3 Having senior physicians present increases patient comfort during outpatient case presentations4 and improves patient satisfaction with explanations of tests and medications.5 However, we had concerns that teaching during a procedure may heighten patient anxiety. Patients are reluctant to be the first patient of a resident or medical student for a procedure,68 and patients are more likely to refuse consent to have a resident perform complex procedures.8 In previous studies, patient satisfaction with gynecological exams and flexible sigmoidoscopy performed by residents was comparable to satisfaction with those performed by staff physicians,9, 10 though in the case of flexible sigmoidoscopy, procedure duration was slightly longer.10 Few, if any, data describe bedside teaching or patient impressions of physician communication during procedures.
We carried out a prospective study of patient perceptions of the University of California San Francisco (UCSF) Hospitalist Procedure Service (HPS). Our study had the primary goal of understanding how our modelwhich involves bedside procedural teaching and feedback in real time (eg, as the procedure is performed)is perceived by patients.
Patients and Methods
Site
Our survey was carried out at UCSF Moffitt‐Long Hospital, a 560‐bed university teaching hospital and the primary university hospital for the University of California San Francisco. This study was reviewed and approved by the Committee on Human Research at UCSF.
Procedure Service
The HPS is composed of two interns who rotate for 2 weeks on a mandatory rotation performing the majority of the procedures done by the service. Every procedure is supervised by an attending hospitalist who has received extended training from interventional radiologists and emergency department ultrasound faculty. Patients are referred to the service by their primary admitting team. Interns receive procedure‐specific didactics, demonstration, and practice with procedure kits, supplemental readings, computer‐based procedure modules, and evidence‐based summaries of procedure‐related considerations. All interns also attend a half‐day procedure simulation session to review procedural and ultrasound techniques.
While interns obtain informed consent and prepare the patient for the procedure, the attending and intern team communicate the following points with each patient: 1) identification as the dedicated procedure team, separate from the primary team caring for the patient; 2) attending self‐identification as the supervisor; 3) attention to stepwise communication with the patient during the procedure; 4) attention to patient comfort throughout the procedure; 5) emphasis on patient safety through the use of time‐outs, sterile technique, and ultrasound when appropriate; and 6) the intention to discuss best practice and teach during the procedure.
All paracentesis and thoracentesis sites are marked by using bedside ultrasound (S‐Cath, SonoSite, Bothell, WA) guidance prior to and, if needed, during the procedure. Ultrasound is occasionally used for marking joint aspiration and lumbar puncture.11 Interns are responsible for making an initial site marking, which is then confirmed by the attending physician. Although not systematized, our service encourages the intern and attending to communicate about proper technique during the procedure itself. For example, attendings ask questions about technique based on evidence in the literature (eg, Why do you replace the stylet in a lumbar puncture needle prior to removal?) or about trouble shooting (eg, What would you do if the flow of ascites stops during this paracentesis?) and also correct any errors in technique (Recall the angle you intended to use based on the ultrasound view).
Patients
Patients are referred to the procedure service by their primary team; referrals are accepted for patients on all services at all levels of care, including the emergency department (ED) and the intensive care unit (ICU). Participants in this study were referred for one of our target procedures (paracentesis, thoracentesis, or lumbar puncture) between November 2008 and July 2009. Patients gave written consent for the supplemental survey independent of consent for the procedure. All consents and procedures were performed in a patient's hospital room and one family member was allowed to stay in the room if desired by the patient. After the completion of the procedure, the attending on the procedure service at the time, which included study authors D.S. and M.M., approached consecutive patients who spoke and read English and were deemed to have capacity to consent for their own procedure to be surveyed. Patients were considered to have capacity to consent based on commonly accepted criteria described in the literature.12, 13 Patients were also excluded if their procedure was performed by the attending alone, if they had repeated procedures done by the service, or if they were too altered or critically ill to participate in the survey.
Survey
Our survey was developed through identification of items reported in the literature,1421 as well as items newly developed for purposes of examining our primary aims. Newly developed questions focused on patients' satisfaction with major aspects of procedure performance as well as the quality and impact of communication with the patient and between members of the team. Two open‐text questions were included to allow patients to share what went well with the procedure as well as areas for improvement. The research team developed a pool of question items for potential inclusion in a patient satisfaction questionnaire. These items were then shown to a group of research‐oriented health professionals, who meet regularly to review academic research protocols. The group provided their opinions about the content and comprehension of the questions, and the written survey employed was a result of their revisions (see Appendix in Supporting Information online).
Written surveys were distributed to patients by the hospitalist attending on service following the procedure as permitted by patients' severity of illness and availability. Surveys were anonymous and self‐administered by the patient or a family member who was in the room for the procedure; all questions were voluntary. A nurse was made responsible for collecting the survey when possible. Survey results were entered into a database without identifiers, with limited demographic information; patient gender, age, and procedure type were included by the attending hospitalist at the end of the survey. A separate and more detailed procedure database was kept of all procedures performed and was used to record patient consent or reason for not consenting as well as documented receipt of a completed survey. This non‐anonymous database contained detailed supplemental information including patient age, level of care, referring service, presence of bloody fluid at any point during the procedure, and physician‐reported immediate complications at the bedside in free text.
Analysis
Reported immediate complications were classified into major and minor based on reported definitions in the literature.2226 Similar to previous studies, major immediate complications were defined as those requiring further procedural intervention, medical therapy, or both.27 Major complications were defined as: bleeding requiring transfusion, pneumothorax requiring a chest tube, respiratory failure, bowel perforation, cerebral herniation or shock, cerebrospinal fluid (CSF) leak requiring intervention, and transfer to a higher level of care. For patients receiving a thoracentesis, chart review was performed to determine the presence of a follow‐up chest x‐ray, the presence of a pneumothorax, or clinical evidence for re‐expansion pulmonary edema. We analyzed differences between respondents and non‐respondents using Chi‐square tests for categorical variables (gender, level of care, referring service, procedure type, bloody fluid, and immediate reported complications) and independent t tests for continuous variables (age).
After review of the open‐ended fields, responses were classified into the following categories: pain control, physician skill, professionalism, communication, symptom relief, procedure duration, and miscellaneous comments. Responses regarding patient perceptions of physician communication were dichotomized into positive (1 = Strongly Agree, 2 = Agree) and negative (3 = Neutral, 4 = Disagree, and 5 = Strongly Disagree), and independent t tests were used to determine the contribution of factors, such as age, while Chi‐square tests were used for the contribution of gender and procedure type. All statistical tests were performed by using the SAS statistical application program (version 9.2).
Results
Respondent Characteristics
Of 324 procedures performed by the HPS during the study period, 95 (29%) were eligible for consent. Of the 229 patients not eligible for consent, 32 (10%) were excluded because the procedure was performed by the attending alone, 76 (23%) lacked English proficiency or literacy, 66 (20%) had altered mental status, 32 (10%) were intubated and/or had severe illness precluding consent, and 23 (7%) were repeat procedures on patients who had previously completed the survey. Only two patients specifically requested an attending to perform the procedure after an introduction to the service. Of the 95 patients eligible for consent, 89 were consented for the survey, and 65 (68%) completed the survey. Of the six eligible, non‐consented patients, all were leaving the floor immediately following the procedure, and time did not allow for consent and survey distribution. There were no differences between eligible responders and nonresponders in age, gender, procedure, requesting service, presence of bloody fluid, or physician‐reported immediate complications (Table 1).
| Demographics | Respondera (n = 65) | Nonresponder (n = 24) |
|---|---|---|
| ||
| Age, y [mean (SD)] | 55.4 (15.7) | 50.4 (17.4) |
| Male gender, n (%) male | 41 (63.1) | 11 (45.8) |
| Procedure, n (%) | ||
| Paracentesis | 31 (47.7) | 10 (41.7) |
| Thoracentesis | 17 (25.8) | 6 (25.0) |
| Lumbar puncture | 15 (22.7) | 7 (29.2) |
| Arthrocentesis | 2 (3.0) | 1 (4.2) |
| Patient location, n (%) | ||
| Floor | 47 (72.3) | 19 (79.2) |
| Step down/telemetry | 17 (26.1) | 3 (12.5) |
| Intensive care unit | 1 (1.5) | 2 (8.3) |
| Service requesting, n (%) | ||
| Medicine | 29 (44.6) | 10 (41.7) |
| Cardiology | 6 (9.1) | 3 (12.5) |
| Liver transplant | 20 (30.3) | 7 (29.2) |
| Bone marrow transplant | 7 (10.6) | 1 (4.2) |
| Surgery | 0 | 1 (4.2) |
| Neurosurgery | 1 (1.5) | 1 (4.2) |
| Other | 2 (3.0) | 1 (4.2) |
| Reported presence of bloody fluid at any point in the procedure, n (%) | 9 (13.6) | 4 (16.7) |
| Other reported immediate complications | ||
| Equipment malfunction | 2 (3.0) | 1 (4.2) |
| Significant cough/pleuritic pain | 1 (1.5) | 1 (4.2) |
| Transient oxygen desaturation | 1 (1.5) | 0 |
| Ascites leak | 0 | 0 |
| Hematoma | 0 | 0 |
| Persistent bleeding | 0 | 0 |
| Transfer to a higher level of care | 0 | 0 |
Complications
As complications would likely play a role in procedure satisfaction, we describe immediate complications for the study population. Of the 324 procedures performed during the study period, no patient had predefined major immediate complications. Upon further chart review of the 96 patients that had a thoracentesis performed, all had a follow‐up chest x‐ray and none suffered an iatrogenic pneumothorax or re‐expansion pulmonary edema. Minor immediate complications for the 324 procedures were reported as follows: postprocedure pain in four patients (1.2%), cough in nine patients (2.8%), five equipment malfunctions (1.5%), four ascites leaks (1.2%), and one incisional bleed requiring a suture for hemostasis (0.3%). There was no significant difference in complications between those consented for the survey and the total study population.
Procedure Satisfaction
More than 90% of patients were satisfied or very satisfied with most aspects of the procedure, including the informed consent process, pain control, expertise, and courtesy of physicians (Table 2). The percentage of patients satisfied with the duration of procedure (88%) was lower than for other measures of satisfaction. Of the 38 patients receiving therapeutic procedures, 34 (89%) were satisfied or highly satisfied with the improvement in symptoms following the procedure.
| Very Satisfied and Satisfied No. (%) | Neutral No. (%) | Dissatisfied and Very Dissatisfied No. (%) | N/A No. (%) | |
|---|---|---|---|---|
| Your overall procedure experience | 65 (100) | 0 (0) | 0 (0) | 0 (0) |
| Explanation of the procedure, risks, and benefits before the procedure | 64 (99) | 1 (2) | 0 (0) | 0 (0) |
| Pain control during the procedure | 60 (92) | 5 (8) | 0 (0) | 0 (0) |
| Expertise/skill of the physicians performing your procedure | 62 (95) | 3 (5) | 0 (0) | 0 (0) |
| Courtesy and bedside manner of the physicians performing your procedure | 65 (100) | 0 (0) | 0 (0) | 0 (0) |
| The time it took to perform your procedure | 57 (88) | 6 (9) | 0 (0) | 2 (3) |
| Improvement in your symptoms following this procedure, if applicable | 34 (52) | 7 (11) | 0 (0) | 24 (37) |
When asked what went well with the procedure, 59 (91%) respondents provided additional comments and feedback. Each response was classified as described in the Methods section. Of the free text responses, 8 of the 59 patients (14%) commented on the attention to pain control (eg, The caring and attention to my pain was most important to me), 5 (8%) on the skills of the operators (Great examination of the entire stomach region with the ultrasound to ensure the best position of the catheter), 6 (10%) on the courtesy and professionalism of the team (eg, Courteous, team‐feeling, addressed my concerns), 9 (15%) on their communication with the team (eg, The doctors made me feel very comfortable before the procedure by laying out the plan and explaining each part of the procedure), and 8 (14%) on relief of their symptoms (eg, There was an almost immediate and significant improvement in my breathing, bloating, and pain). Twenty‐three of the 59 comments (39%) were categorized as miscellaneous (eg, All went great. I fell asleep).
When asked areas for improvement, 55 (85%) patients responded. Thirty‐three patients (60%) reported that nothing could be improved or they instructed the team to just keep doing what you are doing, while 22 (40%) patients expressed a concern. Responses were categorized in a similar fashion to the positive responses. Five of the 22 negative comments (23%) reported that the procedure took too long (eg, Procedure could have been shorter. I got tired sitting up), 4 (18%) commented on pain control (eg, The poke for marking my skin hurt more than the anesthetic. I was surprised), 6 (27%) felt communication was a problem (eg, Discuss the steps with the patient audibly, no whispering, speak clearly), and 7 (32%) had miscellaneous concerns (eg, Try not to do this procedure right after another one).
Physician Communication
Sixty‐four patients (98%) reported that the physicians performing their procedure communicated with each other during the procedure (Table 3). Although one patient did not feel that the physicians communicated with each other, he or she still answered the follow‐up questions regarding perceptions of physician communication. We excluded this patient from our analysis as his or her answers may not be reliable. The majority of patients (84%) reported this communication as reassuring and felt it was a normal part of procedure performance (94%). Those that did not agree that physician communication was reassuring did not differ in average age (P = 0.307), gender (P = 0.511), or procedure type (P = 0.562).
| Strongly Agree and Agree No. (%) | Neutral No. (%) | Disagree, and Strongly Disagree No. (%) | |
|---|---|---|---|
| I felt that the physicians talking to each other about my procedure was reassuring to me | 54 (84) | 10 (16) | 0 (0) |
| Physicians talking to each other while doing a procedure is a normal part of doing a procedure | 60 (94) | 4 (6) | 0 (0) |
Of all positive and negative comments, five specifically addressed communication between physicians. Most (four) reflected satisfaction with bedside teaching (eg, They discussed the procedure in a professional manner and eased my mind at all times) and with having an expert in the room (eg, [The team] discussed things like needle placement, which was nice because there was a second opinion right there in the room). Patients also felt that it was good to experience the teaching, with one patient reporting that the best part of the procedure was watching doctors learn from each other. Patients did not express specific reservations about bedside teaching, resident technique, or fear of complications in free text.
Discussion
Even though novice interns performed procedures and simultaneous bedside teaching, patient satisfaction with a teaching procedure service was high, and reported complication rates were low. In addition, a majority of patients found discussions related to teaching activities reassuring and potentially important to their perception of care quality. Analogous studies examining patient satisfaction with endoscopic care found similar rates of patient satisfaction with endoscopists' bedside manner, technical skills, and pain control, but these studies included sedated patients.21 Our results are unique, as we evaluated awake patients with attention to perception of bedside teaching with novice interns.
Our findings offer an alternative strategy for bedside procedural teaching that employs transparency in the use of an expert and a trainee to introduce patients to bedside teaching by experts, which is not common at many academic medical centers.28 Patients may have been reassured by a clear explanation of the role of the service and the providers involved as well as an assurance of expertise and attention to patient comfort and safety. In addition to patient satisfaction, this model has the potential to impact both the safety of bedside procedures and housestaff education around procedure performance. For example, pneumothorax rates using our procedure service model are lower than those published (0% vs. 4% for ultrasound‐guided thoracentesis and 8.5% for thoracentesis by less experienced clinicians).29
Providers may be reluctant to teach at the bedside of awake patients for fear of heightening patient anxiety over trainee inexperience. In the 1960s similar fears were raised over the concern for patient anxiety with bedside rounding,30 but later studies revealed these concerns to be largely unfounded. Instead, bedside rounds have been shown to positively influence patients' feelings about their hospital experience and their relationships with their physicians compared with patients whose case presentations were made in a conference room.31, 32 Given the opportunity to comment on areas for improvement, patients in our study specifically elaborated regarding pain control, communication, and efficiency problems. Although 16% of patients did not find the communication of physicians reassuring, none of the negative comments reflected problems with bedside teaching, but rather concepts such as desiring a better explanation of steps throughout the procedure. Specifically, patients desire better communication for unanticipated pain.
There are several limitations to this study. Lack of patient satisfaction data from a control group of patients whose procedures were performed by attendings or housestaff alone limits our ability to draw conclusions about our satisfaction scores. The scarce applicable literature offers only imperfect comparison data. Because hospitalists were not blinded to the survey, attending behavior may have been subject to a Hawthorne effect.33 Consenting patients after the procedure could have provided hospitalists with an opportunity to exclude patients who appeared less satisfied with their procedure; however, attempts were made to prevent this behavior by requiring strict accounting of why a patient was not consented for the study. Use of alternative personnel for consent such as nurses was explored, but was found not to be feasible due to limited resources. These data are only applicable to English‐speaking patients who are literate and well enough to complete a survey. It is not clear whether the experience for other patients would reflect the same outcomes. It is plausible that non‐English‐speaking patients might have more concerns about incomprehensible conversations taking place during their procedure. Although the surveys were anonymous and patients were told that the proceduralists would not see individual responses, responses may have been biased out of patient concern that their response might affect their care. Hospitalists obtaining consent, however, were careful to stress anonymity and the distinction between the primary team and the procedure team.
Academic hospitals are struggling with providing quality procedural care while balancing housestaff education and experience.28 With hospitalists playing an increasingly prominent role in housestaff education and patient satisfaction initiatives, the supervision of housestaff by trained hospitalist faculty may help meet both aims in the performance of invasive bedside procedures, particularly at institutions where simulation training resources are limited. Although concern may exist for potential patient anxiety with bedside teaching, our data demonstrate high levels of patient satisfaction with a hospitalist procedure service despite novice procedure performers and an emphasis on teaching during the procedure.
- ,,, et al.Creation of an innovative inpatient medical procedure service and a method to evaluate house staff competency.J Gen Intern Med.2004;19(5 Pt 2):510–513.
- ,,, et al.Impact of a bedside procedure service on general medicine inpatients: A firm‐based trial.J Hosp Med.2007;2(3):143–149.
- Hospital Care Quality Information from the Consumer Perspective (HCAHPS).Quality Assurance Guidelines.Baltimore, MD:Centers for Medicare 113(8):657–662.
- ,,,,.The effect of bedside case presentations on patients' perceptions of their medical care.N Engl J Med.1997;336(16):1150–1155.
- ,,,.‘Sorry, it's my first time!’ Will patients consent to medical students learning procedures?Med Educ.2005;39(4):365–369.
- ,.Ethical considerations surrounding first time procedures: a study and analysis of patient attitudes toward spinal taps by students.Kennedy Inst Ethics J.1992;2(3):217–231.
- ,,,.Patients' willingness to allow residents to learn to practice medical procedures.Acad Med.2004;79(2):144–147.
- ,,.Patient satisfaction with gynecologic care provided by family practice resident physicians.Fam Pract Res J.1991;11(4):421–428.
- ,,.Resident participation in flexible sigmoidoscopy does not affect patient satisfaction.Am J Gastroenterol.2000;95(6):1563–1566.
- ,.Bedside ultrasound for difficult lumbar puncture.J Emerg Med.2005;28(2):197–200.
- ,.Conducting the Assessment. In:Assessing Competence to Consent to Treatment: A Guide for Physicians and Other Health Professionals.First Edition ed.New York, NY:Oxford University Press;1998:80–91.
- ,.Care of Ill, Socially Complicated Patients. In:Medical Management of Vulnerable 2007:407–418.
- ,,,,.Interventional radiologic procedures: patient anxiety, perception of pain, understanding of procedure, and satisfaction with medication‐‐a prospective study.Radiology.2000;215(3):684–688.
- ,,,,.Improving the assessment of (in)patients' satisfaction with hospital care.Med Care.2001;39(3):270–283.
- ,,,.Factors determining inpatient satisfaction with care.Soc Sci Med.2002;54(4):493–504.
- ,,,.Reliability and validity of the Satisfaction with Hospital Care Questionnaire.Int J Qual Health Care.2002;14(6):471–482.
- ,,,,.A randomized trial of four patient satisfaction questionnaires.Med Care.2003;41(12):1343–1352.
- ,,, et al.Development and validation of an in‐patient satisfaction questionnaire.Int J Qual Health Care.2005;17(6):465–472.
- ,,,.Central venous port catheters: evaluation of patients' satisfaction with implantation under local anesthesia.J Vasc Access.2009;10(1):27–32.
- ,,,.Factors influencing patient satisfaction when undergoing endoscopic procedures.Gastrointest Endosc.2009;69(4):883–91, quiz 891.e1.
- ,,, et al.Complications associated with thoracentesis. A prospective, randomized study comparing three different methods.Arch Intern Med.1990;150(4):873–877.
- ,,, et al.Risk of complications after abdominal paracentesis in cirrhotic patients: a prospective study.Clin Gastroenterol Hepatol.2009;7(8):906–909.
- ,,, et al.Performance standards for therapeutic abdominal paracentesis.Hepatology.2004;40(2):484–488.
- ,,,,.Lumbar puncture: its indications, contraindications, complications and technique.Rev Neurol.2007;45(7):433–436.
- .How to perform a lumbar puncture with the patient in the seated position.Br J Hosp Med (Lond).2006;67(3):M46–7.
- ,,.Are commonly used resident measurements associated with procedural skills in internal medicine residency training?J Gen Intern Med.2007;22(3):357–361.
- ,,,MERN Group,.Supervising the Supervisors‐Procedural Training and Supervision in Internal Medicine Residency.J Gen Intern Med.2010.
- ,,,.Pneumothorax following thoracentesis: a systematic review and meta‐analysis.Arch Intern Med.2010;170(4):332–339.
- ,,.The emotional impact of ward rounds.J Mt Sinai Hosp NY.1956;23(6):782–803.
- ,,,.The physiologic and psychological effects of the bedside presentation.N Engl J Med.1989;321(18):1273–1275.
- ,,,,.The effect of bedside case presentations on patients' perceptions of their medical care.N Engl J Med.1997;336(16):1150–1155.
- .Hawthorne effects and research into professional practice.J Eval Clin Pract.2001;7(1):65–70.
Copyright © 2011 Society of Hospital Medicine
Survey of Academic Hospitalist Leaders
Hospitalists are hospital‐based physicians whose primary professional focus is patient care, education, research, and administrative activities related to hospital medicine.1 Initially, community‐based hospitals were far more likely to employ hospitalists than academic centers. However, today most academic centers employ hospitalist models and it is now a fully recognized entity in academic settings.2
While much has been written about the structure, business operations, and potential benefits of nonteaching (clinical) hospitalist programs,3, 4 there is little known about the current state of academic hospitalist programs or their challenges. For example, who are the leaders of academic hospitalist medicine groups? Given the youth of the field, are academic hospitalists receiving adequate mentorship and are they advancing academically? What are future directions and goals for academic hospitalist groups?
To better understand academic hospitalist programs, we surveyed division chiefs and academic hospitalist leaders to explore existing business models and operations, the status of mentorship, and key issues in growth and retention.
Methods
Sites and Subjects
We targeted potential hospital medicine group leaders by identifying academic medical centers using Association of American Medical Colleges (AAMC), the Accreditation Council for Graduate Medical Education (ACGME), the Association of Chiefs of General Internal Medicine (ACGIM), and the Society of Hospital Medicine (SHM) lists of sites with teaching missions. We then used publicly available data (eg, from websites maintained by the sites) to identify physician leaders who: 1) self identified as a leader of a hospitalist group at an academic medical center (or a Chief of Division of General Internal Medicine which managed a hospitalist group) in the SHM database, 2) were listed as such on the website, or 3) were members of ACGIM and listed as a hospitalist group leader at a university based medical center.
Survey Development
Our survey was based on questions used in previous research by the authors,5 with additional questions regarding operations of academic hospitalist programs, growth and retention of hospitalists, and mentorship developed by the study authors. Questions were pretested among a selected group of members of the Society of General Internal Medicine (SGIM) Academic Hospitalist Task Force and the SHM Academic Hospitalist Interest Group, after which the survey was refined and converted into its electronic form.
Survey Methods
The email survey process began in April 2007 with an initial survey sent to those physicians identified using preexisting data, as described. Our survey asked first if recipients were directly responsible for the oversight of a hospitalist group (eg, the division chief or director of the hospital medicine group) and if they practiced at an academic medical center. Only respondents who answered yes to both of these criteria were invited to respond to our survey. Those who felt the survey did not apply to them were invited to forward the email survey on to the appropriate person at their site or respond that their hospital had no hospital medicine service. Subsequent reminder emails were sent to nonrespondents at 10‐day intervals up to a total of four times. This survey was granted exempt status from the UCSF Institutional Review Board.
Statistical Methods
Response rates and frequencies and distribution of survey responses were analyzed using univariable statistics.
Results
Characteristics of Responding Sites
We received responses from 57 (40%) of the academic sites identified as having an academic hospital medicine group. Hospitalist group leaders at responding sites had been in their current position 3.8 years, graduated medical school approximately 15 years prior, and were either Assistant (40%), Associate (32%), or Full Professors (23%). Group leaders reported that the vast majority (91%) of group full‐time members were in junior faculty positions (Instructor or Assistant Professor), who were working full‐time. On average, responding programs were 6 years old (formed in 2001) and currently had 10.0 total full time equivalents (FTEs). A total of 38 of the groups (67%) were part of the larger Division of General Internal Medicine, whereas 9 groups (16 %) were their own division within the Department of Medicine. The remaining 17% were part of another division.
Mentorship Practices In Academic Hospital Medicine Groups
As one mechanism of mentorship, annual performance reviews were offered in most programs (88%). These were usually performed by the general medicine division chief or hospitalist leader. Mentoring relationships for clinician investigators (CI) were most often from personnel outside the hospitalist group, whereas clinician‐educators (CE) most often were mentored by faculty inside the group.
Hospitalist Leaders' Priorities and Impressions of Growth, Opportunities, Career Development and Barriers
Hospitalist leaders reported the highest priorities for hospitalist leaders were developing research and teaching programs, and minimizing turnover. Other priorities included achieving financial stability, applying for extramural funding, and reducing clinical workload (Table 2). Only 14% of respondents noted that becoming a separate division was a priority.0
| Characteristic | n (%) |
|---|---|
| |
| Group leader characteristics | |
| Academic rank | |
| Assistant professor/other | 26 (45) |
| Associate professor | 18 (32) |
| Full professor | 13 (23) |
| Years in position (mean, range) | 3.8 (2.07.0) |
| Group characteristics | |
| Hospital medicine place in school of medicine | |
| Within the department of medicine | 55 (98) |
| Separate division | 9 (16) |
| Within division of general medicine | 38 (67) |
| Other | 9 (16) |
| Not in the department of medicine | 1 (2) |
| Program size (mean, range) | |
| Number of hospitalists in program | 10 (718) |
| Number of FTE | 11 (3.512) |
| FTE's hired in past 2 years (July 2005 to survey date) | 4.0 (2.27.0) |
| Hospitalist activities | |
| Medicine consultation | 52 (91) |
| Quality improvement projects | 52 (91) |
| Nonteaching attending | 44 (77) |
| Comanagement of surgical patients | 44 (77) |
| 24‐hour coverage | 24 (61) |
| Manage patient transfer requests | 32 (56) |
| Peer review/morbidity and mortality | 31 (54) |
| Education program leadership | 29 (51) |
| Medical student program leadership | 29 (51) |
| Palliative care program | 23 (40) |
| Preoperative clinic | 23 (40) |
| Emergency department triage | 14 (25) |
| Post discharge follow‐up clinic | 13 (23) |
| Skill nursing facility coverage | 4 (7) |
| Other | 15 (26) |
| Mentorship Activity | n (%) |
|---|---|
| Programs performing annual reviews with faculty | 50 (88) |
| Who performs the annual review? | |
| General Medicine Division Chief | 9 (18) |
| Hospitalist leader | 18 (36) |
| Both | 13 (26) |
| Other (eg, Department Chair, Chief Medical Officer) | 10 (20) |
| Who is the primary source of mentorship for clinician‐educators? | |
| Senior faculty within the group | 43 (77) |
| Generalist faculty outside the group, but within the institution | 6 (11) |
| Subspecialty Internal Medicine faculty outside the group, but within the institution | 3 (5) |
| Non‐Internal Medicine (eg, surgeon, epidemiologist) outside the group, but within the institution | 0 (0) |
| Faculty from another institution | 0 (0) |
| Don't know | 4 (7) |
| Who is the primary source of mentorship for clinician‐investigators? | |
| Senior faculty within the group | 6 (12) |
| Generalist faculty outside the group, but within the institution | 13 (25) |
| Subspecialty internal medicine faculty outside the group, but within the institution | 6 (12) |
| Non‐Internal Medicine (eg, surgeon, epidemiologist) outside the group, but within the institution | 2 (4) |
| Faculty from another institution | 3 (6) |
| Don't know | 2 (4) |
| Not applicable; no clinician investigators | 20 (38) |
| Highest Priority, n (%) | Intermediate Priority, n (%) | Lowest Priority, n (%) | Not a Priority, n (%) | NA, n (%) | |
|---|---|---|---|---|---|
| Reducing individual faculty clinical workload | 9 (16) | 22 (3) | 11 (2) | 14 (2) | 0 (0) |
| Achieving financial stability | 13 (24) | 30 (55) | 6 (11) | 6 (11) | 0 (0) |
| Minimizing turnover | 22 (39) | 27 (48) | 6 (11) | 1 (2) | 0 (0) |
| Developing teaching programs | 22 (39) | 29 (52) | 3 (5) | 2 (4) | 0 (0) |
| Becoming a separate division | 3 (5) | 5 (9) | 11 (20) | 23 (41) | 14 (25) |
| Developing research | 25 (45) | 18 (32) | 5 (9) | 6 (11) | 2 (4) |
| Applying for extramural funding | 10 (18) | 24 (43) | 10 (18) | 8 (14) | 4 (7) |
| Strongly Agree, n (%) | Agree, n (%) | Neutral, n (%) | Disagree, n (%) | Strongly Disagree, n (%) | NA, n (%) | |
|---|---|---|---|---|---|---|
| Growth and sustainability | ||||||
| Availability of funds is limiting expansion of academic functions (eg, education and research) | 20 (36) | 21 (38) | 5 (9) | 7 (12) | 3 (5) | 0 (0) |
| Availability of funds is limiting expansion of clinical functions (eg, development of new services) | 11 (20) | 17 (30) | 14 (25) | 10 (18) | 4 (7) | 0 (0) |
| My faculty are developing sustainable nonclinical activities | 9 (16) | 23 (41) | 12 (21) | 9 (16) | 3 (5) | 0 (0) |
| Career development | ||||||
| Mentorship is a major issue for my clinician‐educator faculty | 14 (25) | 28 (50) | 7 (12) | 4 (7) | 1 (2) | 2 (4) |
| Mentorship is a major issue for my research faculty | 22 (40) | 10 (18) | 4 (7) | 3 (5) | 2 (4) | 14 (25) |
| External support for hospital medicine group | ||||||
| There is investment in the development of academic functions of our hospitalist program from my hospital | 4 (7) | 12 (21) | 10 (18) | 22 (39) | 8 (14) | 0 (0) |
| There is investment in the development of academic functions of our hospitalist program from the Department of Medicine | 22 (40) | 17 (31) | 8 (15) | 4 (7) | 2 (4) | 2 (4) |
In general, academic hospitalist leaders reported that Departments of Medicine and Divisions of General Medicine (where applicable) were invested in the development of their academic functions. Yet, more than half of program directors reported that hospitals were not supportive. Moreover, lack of funds limited the expansion of their academic or clinical functions (Table 3). Additionally, while the majority either strongly agree or agree that their faculty are developing sustainable nonclinical activities (57%), they perceive that they are at risk for burnout (69%), and that lack of mentorship is a major issue for both CE (75%) and research faculty (58%). Lastly, while program directors strongly agree or agree (71%) that their hospitalist groups are respected by other academic physicians, they additionally strongly agree or agree that their Departments of Medicine (58%) and other Divisions (78%) view their hospitalist program as a clinical service rather than an academic program.
Discussion
Our survey provides a unique snapshot of academic hospitalist groups, highlighting a perceived lack of support and respect for their programs, a need to increase education and scholarly activities, and a desire to better prepare faculty for academic promotion.
Academic hospitalist groups and leaders reflected what one would expect from a field that is just over a decade old. Program leaders were relatively new to their position, as were their division group members. As a result, it is not surprising that most of the academic hospitalist leaders identified mentorship as a major issue. We were encouraged to see that most programs were offering annual reviews. However, the majority of these annual reviews were performed by the group leaders, many of whom are relatively junior (40% Assistant Professors) and may not be experienced in mentoring and performing annual reviews. Importantly, the absence of a mentor (or a high‐quality, experienced one) among physicians, and specifically hospitalists, may result in fewer peer‐reviewed first author and non‐peer‐reviewed publications, and less experience leading a teaching session at a national meeting.6 Research suggests that effective mentoring may help faculty increase career satisfaction and productivity and reduce their risk for burn‐out.7 Hospitalist groups might benefit nationally from focusing specifically on finding adequate mentorship either within or outside their groups. In addition, national organizations such as the SHM and the SGIM could potentially help these groups and individual hospitalists in creating mentorship networks and a mentoring infrastructure.
Academic hospitalist leaders were concerned about the ability of their faculty to develop sustainable nonclinical activities and scholarship. Notably, more than 40% of surveyed leaders agreed or strongly agreed that their faculty were not developing sustainable nonclinical activities. For individual faculty, the inability to develop scholarly activities and engage in academic pursuits may create challenges in getting promoted by traditional academic pathways. Some have recognized this issue and tried to develop practical solutions.2 In addition, academic hospitalists often engage in nonclinical activities such as quality improvement or patient safety which do not fit in the traditional tripartite mission of academics (clinical care, education, and research). In this survey, more than 90% of groups were engaged in quality improvement projects and over half in peer review exercises (Table 1). As many of these scholarly activities require innovation, sophisticated data analysis, and can have far‐reaching and substantial impacts on healthcare, some have argued these should be considered as part of the promotion process.8 Notably, the SGIM Academic Hospitalist Taskforce has created the Quality Portfolio, a structured adjunct to promotions packets to organize and document work in quality improvement and patient safety.9
While there were few CI in the divisions surveyed, building CI programs was a major priority of programs. In programs reporting the presence of CI's, they report limited access to research support. This highlights the potential role and benefit of post residency training in designing and conducting clinical research whether in a traditional general internal medicine fellowship or in 1 of the many growing hospital medicine fellowships.10 There also appears to be a need for funding to support the research careers of junior hospitalists. While access to effective mentorship is integrally linked to achieving increased academic accomplishments, there is certainly an ample call for research in the areas of quality improvement, patient safety; systems‐based practice, hospital efficiency, transitions of care,11 perioperative medicine,12 and education.2, 13, 14 While providing lower costs per admission and lower lengths of stay, hospitalists seem well‐positioned to spearhead active research in cost‐effectiveness in the hospital.14 Additionally, a quality portfolio, documenting such quality improvement projects, has been suggested as an effective means to provide a record of this work for academic promotion.9
The diverse activities of today's hospitalists are transforming the traditional view of academic work and are critical to the growth of hospitals, patient care, and development of the field of hospital medicine itself. Until these areas are fully embraced as legitimate areas of academic productivity and scholarship, the academic advancement of hospitalists will be slow.
It is unclear from our survey if academic hospitalist programs are truly getting the support they need to succeed. On one hand, there was general agreement that the Departments of Medicine and Divisions of General and Hospital Medicine were invested in the development of the academic accomplishments. Yet, the majority of program directors believed that they are viewed by the Department or Division as a clinical rather than an academic program. Moreover, over half of program directors report that their hospital was not supportive and therefore have limited the expansion of their hospitalist groups' educational and research activities. Lastly, for a large majority of programs, unavailable funding also acted to limit growth and expansion of academic functions. In a mere 2 decades, Emergency Medicine has become one of the largest US specialties and yet research and funding in the field have been lagging and are limiting academic expansion. Junior faculty seeking research careers struggled to find support and mentorship within their emergency medicine divisions.15 Challenges faced by academic emergency medicine provide important historical perspective for the even more rapidly growing field of academic hospital medicine. Learning from the Academic Emergency Medicine experience, academic hospitalists should proactively identify scholarship and research opportunities unique to hospitalist and fitting the needs of academic institutions. Involvement in national medical organizations, such as SGIM‐SHM‐ACGIM Academic Hospitalist Academy, or the SGIM Academic Hospitalist Task Force, where skill and career development is the focus, will undoubtedly promote the success of academic hospitalist. Expanding valuable niches of expertise, such as quality control, perioperative medicine and care transitions, create an indispensible component of hospital care. Lastly mentoring programs for academic hospitalist within SHM and SGIM are also essential for networking and career development. There are several limitations to our study. Our response rate of 40% was relatively low, and our results may not be representative of all academic hospitalist division chiefs and their programs, may be overstating the perceived difficulties of the survey sample, or conversely missing a large portion too overwhelmed by current duties who lacked the time to complete the survey. Having said this, our survey methodology targeted sites where we could identify potentialnot confirmedhospitalist groups and hospitalist group leaders. For this reason, our response rate could be higher (if some of our contacts were in error). Our results are a cross‐sectional survey based on self report and are subject to recall bias. In addition, our study was carried out in 2007, and while issues such as mentorship may remain important, our results regarding financial arrangements may not be applicable to the current economic climate. Finally, while improving mentorship was identified as a principle objective for program leaders, we did not explore the existing quality of mentorship, nor perceived shortfalls. This should be the subject of future exploration.
The vast majority of academic hospital medicine programs continue to view inadequate support, expanding research, mentorship, and academic promotion as critical issues for the future. Thus, further understanding of these features, and interventions to allow for success, are of crucial importance in the continued development of academic hospitalists. Our study supports the need for mentoring and career development programs, targeting academic hospitalists and their leaders. In addition, attention should be paid to activities that support career fit, creating sustainable and viable job descriptions for academic hospitalists, and preventing burnout.16 At the same time we must expand the traditional view of scholarship and training and advocate for promotion criteria that value the unique contributions of hospitalists to become in line with the broad areas that hospitalists work.
- Anonymous. Definition of a hospitalist.2009. Society of Hospital Medicine Homepage/General Information. Available at: http://www.hospitalmedicine.org/AM/Template.cfm?Section=Hospitalist_Definition4:240–246.
- ,,,,.Resource‐based relative value scale analysis between teaching and nonteaching hospitalist services.Health Care Management.2009;1(28):81–85.
- ,,, et al.Effects of physician experience on costs and outcomes on an academic general medicine service.Ann Intern Med.2002;137:866–874.
- ,,,.Hospitalists and the practice of inpatient medicine.Ann Intern Med.1999;130:343–349.
- ,,,,,.Rates, predictors and consequences of low career satisfaction and burnout in academic hospital medicine.J Hosp Med.2009;4(S1):24–25.
- ,.Mentoring faculty in academic medicine: a new paradigm?.J Gen Intern Med.2005;20(9):866–870.
- ,.Clinicians in quality improvement: a new career pathway in academic medicine.JAMA.2009;301(7):766–768.
- ,,,.Academic hospitalist taskforce quality portfolio rationale and development. 02/23/2009; Quality portfolio introduction. Available at:http://www.sgim.org/index.cfm?pageId=846. Accessed July 2010.
- ,,,.Hospital medicine fellowships: works in progress.Am J Med.2006;119:72e1–72e7.
- ,,,.Promoting effective care transitions of hospital discharge. A review of key issues for hospitalists.J. Hosp Med.2007;2:314–323.
- ,.Hospitalists and anesthesiologists as perioperative physicians: are their roles complementary?Proc (Bayl Univ Med Cent).2007;20(2):140–142.
- .A systematic review of outcomes and quality measures in adult patients cared for by hospitalists vs nonhospitalist.Mayo Clin Proc.2009;84(3):248–254.
- .Reflections: the hospitalist movement a decade later.J Hosp Med.2006;1:248–252.
- .Anyone, Anything, Anytime A History of Emergency Medicine.1st ed.Philadelphia, PA:Mosby‐Elsevier;2006.
- ,,, et al.Career fit and burnout among academic faculty.Arch Intern Med.2009;169(10):990–995.
Hospitalists are hospital‐based physicians whose primary professional focus is patient care, education, research, and administrative activities related to hospital medicine.1 Initially, community‐based hospitals were far more likely to employ hospitalists than academic centers. However, today most academic centers employ hospitalist models and it is now a fully recognized entity in academic settings.2
While much has been written about the structure, business operations, and potential benefits of nonteaching (clinical) hospitalist programs,3, 4 there is little known about the current state of academic hospitalist programs or their challenges. For example, who are the leaders of academic hospitalist medicine groups? Given the youth of the field, are academic hospitalists receiving adequate mentorship and are they advancing academically? What are future directions and goals for academic hospitalist groups?
To better understand academic hospitalist programs, we surveyed division chiefs and academic hospitalist leaders to explore existing business models and operations, the status of mentorship, and key issues in growth and retention.
Methods
Sites and Subjects
We targeted potential hospital medicine group leaders by identifying academic medical centers using Association of American Medical Colleges (AAMC), the Accreditation Council for Graduate Medical Education (ACGME), the Association of Chiefs of General Internal Medicine (ACGIM), and the Society of Hospital Medicine (SHM) lists of sites with teaching missions. We then used publicly available data (eg, from websites maintained by the sites) to identify physician leaders who: 1) self identified as a leader of a hospitalist group at an academic medical center (or a Chief of Division of General Internal Medicine which managed a hospitalist group) in the SHM database, 2) were listed as such on the website, or 3) were members of ACGIM and listed as a hospitalist group leader at a university based medical center.
Survey Development
Our survey was based on questions used in previous research by the authors,5 with additional questions regarding operations of academic hospitalist programs, growth and retention of hospitalists, and mentorship developed by the study authors. Questions were pretested among a selected group of members of the Society of General Internal Medicine (SGIM) Academic Hospitalist Task Force and the SHM Academic Hospitalist Interest Group, after which the survey was refined and converted into its electronic form.
Survey Methods
The email survey process began in April 2007 with an initial survey sent to those physicians identified using preexisting data, as described. Our survey asked first if recipients were directly responsible for the oversight of a hospitalist group (eg, the division chief or director of the hospital medicine group) and if they practiced at an academic medical center. Only respondents who answered yes to both of these criteria were invited to respond to our survey. Those who felt the survey did not apply to them were invited to forward the email survey on to the appropriate person at their site or respond that their hospital had no hospital medicine service. Subsequent reminder emails were sent to nonrespondents at 10‐day intervals up to a total of four times. This survey was granted exempt status from the UCSF Institutional Review Board.
Statistical Methods
Response rates and frequencies and distribution of survey responses were analyzed using univariable statistics.
Results
Characteristics of Responding Sites
We received responses from 57 (40%) of the academic sites identified as having an academic hospital medicine group. Hospitalist group leaders at responding sites had been in their current position 3.8 years, graduated medical school approximately 15 years prior, and were either Assistant (40%), Associate (32%), or Full Professors (23%). Group leaders reported that the vast majority (91%) of group full‐time members were in junior faculty positions (Instructor or Assistant Professor), who were working full‐time. On average, responding programs were 6 years old (formed in 2001) and currently had 10.0 total full time equivalents (FTEs). A total of 38 of the groups (67%) were part of the larger Division of General Internal Medicine, whereas 9 groups (16 %) were their own division within the Department of Medicine. The remaining 17% were part of another division.
Mentorship Practices In Academic Hospital Medicine Groups
As one mechanism of mentorship, annual performance reviews were offered in most programs (88%). These were usually performed by the general medicine division chief or hospitalist leader. Mentoring relationships for clinician investigators (CI) were most often from personnel outside the hospitalist group, whereas clinician‐educators (CE) most often were mentored by faculty inside the group.
Hospitalist Leaders' Priorities and Impressions of Growth, Opportunities, Career Development and Barriers
Hospitalist leaders reported the highest priorities for hospitalist leaders were developing research and teaching programs, and minimizing turnover. Other priorities included achieving financial stability, applying for extramural funding, and reducing clinical workload (Table 2). Only 14% of respondents noted that becoming a separate division was a priority.0
| Characteristic | n (%) |
|---|---|
| |
| Group leader characteristics | |
| Academic rank | |
| Assistant professor/other | 26 (45) |
| Associate professor | 18 (32) |
| Full professor | 13 (23) |
| Years in position (mean, range) | 3.8 (2.07.0) |
| Group characteristics | |
| Hospital medicine place in school of medicine | |
| Within the department of medicine | 55 (98) |
| Separate division | 9 (16) |
| Within division of general medicine | 38 (67) |
| Other | 9 (16) |
| Not in the department of medicine | 1 (2) |
| Program size (mean, range) | |
| Number of hospitalists in program | 10 (718) |
| Number of FTE | 11 (3.512) |
| FTE's hired in past 2 years (July 2005 to survey date) | 4.0 (2.27.0) |
| Hospitalist activities | |
| Medicine consultation | 52 (91) |
| Quality improvement projects | 52 (91) |
| Nonteaching attending | 44 (77) |
| Comanagement of surgical patients | 44 (77) |
| 24‐hour coverage | 24 (61) |
| Manage patient transfer requests | 32 (56) |
| Peer review/morbidity and mortality | 31 (54) |
| Education program leadership | 29 (51) |
| Medical student program leadership | 29 (51) |
| Palliative care program | 23 (40) |
| Preoperative clinic | 23 (40) |
| Emergency department triage | 14 (25) |
| Post discharge follow‐up clinic | 13 (23) |
| Skill nursing facility coverage | 4 (7) |
| Other | 15 (26) |
| Mentorship Activity | n (%) |
|---|---|
| Programs performing annual reviews with faculty | 50 (88) |
| Who performs the annual review? | |
| General Medicine Division Chief | 9 (18) |
| Hospitalist leader | 18 (36) |
| Both | 13 (26) |
| Other (eg, Department Chair, Chief Medical Officer) | 10 (20) |
| Who is the primary source of mentorship for clinician‐educators? | |
| Senior faculty within the group | 43 (77) |
| Generalist faculty outside the group, but within the institution | 6 (11) |
| Subspecialty Internal Medicine faculty outside the group, but within the institution | 3 (5) |
| Non‐Internal Medicine (eg, surgeon, epidemiologist) outside the group, but within the institution | 0 (0) |
| Faculty from another institution | 0 (0) |
| Don't know | 4 (7) |
| Who is the primary source of mentorship for clinician‐investigators? | |
| Senior faculty within the group | 6 (12) |
| Generalist faculty outside the group, but within the institution | 13 (25) |
| Subspecialty internal medicine faculty outside the group, but within the institution | 6 (12) |
| Non‐Internal Medicine (eg, surgeon, epidemiologist) outside the group, but within the institution | 2 (4) |
| Faculty from another institution | 3 (6) |
| Don't know | 2 (4) |
| Not applicable; no clinician investigators | 20 (38) |
| Highest Priority, n (%) | Intermediate Priority, n (%) | Lowest Priority, n (%) | Not a Priority, n (%) | NA, n (%) | |
|---|---|---|---|---|---|
| Reducing individual faculty clinical workload | 9 (16) | 22 (3) | 11 (2) | 14 (2) | 0 (0) |
| Achieving financial stability | 13 (24) | 30 (55) | 6 (11) | 6 (11) | 0 (0) |
| Minimizing turnover | 22 (39) | 27 (48) | 6 (11) | 1 (2) | 0 (0) |
| Developing teaching programs | 22 (39) | 29 (52) | 3 (5) | 2 (4) | 0 (0) |
| Becoming a separate division | 3 (5) | 5 (9) | 11 (20) | 23 (41) | 14 (25) |
| Developing research | 25 (45) | 18 (32) | 5 (9) | 6 (11) | 2 (4) |
| Applying for extramural funding | 10 (18) | 24 (43) | 10 (18) | 8 (14) | 4 (7) |
| Strongly Agree, n (%) | Agree, n (%) | Neutral, n (%) | Disagree, n (%) | Strongly Disagree, n (%) | NA, n (%) | |
|---|---|---|---|---|---|---|
| Growth and sustainability | ||||||
| Availability of funds is limiting expansion of academic functions (eg, education and research) | 20 (36) | 21 (38) | 5 (9) | 7 (12) | 3 (5) | 0 (0) |
| Availability of funds is limiting expansion of clinical functions (eg, development of new services) | 11 (20) | 17 (30) | 14 (25) | 10 (18) | 4 (7) | 0 (0) |
| My faculty are developing sustainable nonclinical activities | 9 (16) | 23 (41) | 12 (21) | 9 (16) | 3 (5) | 0 (0) |
| Career development | ||||||
| Mentorship is a major issue for my clinician‐educator faculty | 14 (25) | 28 (50) | 7 (12) | 4 (7) | 1 (2) | 2 (4) |
| Mentorship is a major issue for my research faculty | 22 (40) | 10 (18) | 4 (7) | 3 (5) | 2 (4) | 14 (25) |
| External support for hospital medicine group | ||||||
| There is investment in the development of academic functions of our hospitalist program from my hospital | 4 (7) | 12 (21) | 10 (18) | 22 (39) | 8 (14) | 0 (0) |
| There is investment in the development of academic functions of our hospitalist program from the Department of Medicine | 22 (40) | 17 (31) | 8 (15) | 4 (7) | 2 (4) | 2 (4) |
In general, academic hospitalist leaders reported that Departments of Medicine and Divisions of General Medicine (where applicable) were invested in the development of their academic functions. Yet, more than half of program directors reported that hospitals were not supportive. Moreover, lack of funds limited the expansion of their academic or clinical functions (Table 3). Additionally, while the majority either strongly agree or agree that their faculty are developing sustainable nonclinical activities (57%), they perceive that they are at risk for burnout (69%), and that lack of mentorship is a major issue for both CE (75%) and research faculty (58%). Lastly, while program directors strongly agree or agree (71%) that their hospitalist groups are respected by other academic physicians, they additionally strongly agree or agree that their Departments of Medicine (58%) and other Divisions (78%) view their hospitalist program as a clinical service rather than an academic program.
Discussion
Our survey provides a unique snapshot of academic hospitalist groups, highlighting a perceived lack of support and respect for their programs, a need to increase education and scholarly activities, and a desire to better prepare faculty for academic promotion.
Academic hospitalist groups and leaders reflected what one would expect from a field that is just over a decade old. Program leaders were relatively new to their position, as were their division group members. As a result, it is not surprising that most of the academic hospitalist leaders identified mentorship as a major issue. We were encouraged to see that most programs were offering annual reviews. However, the majority of these annual reviews were performed by the group leaders, many of whom are relatively junior (40% Assistant Professors) and may not be experienced in mentoring and performing annual reviews. Importantly, the absence of a mentor (or a high‐quality, experienced one) among physicians, and specifically hospitalists, may result in fewer peer‐reviewed first author and non‐peer‐reviewed publications, and less experience leading a teaching session at a national meeting.6 Research suggests that effective mentoring may help faculty increase career satisfaction and productivity and reduce their risk for burn‐out.7 Hospitalist groups might benefit nationally from focusing specifically on finding adequate mentorship either within or outside their groups. In addition, national organizations such as the SHM and the SGIM could potentially help these groups and individual hospitalists in creating mentorship networks and a mentoring infrastructure.
Academic hospitalist leaders were concerned about the ability of their faculty to develop sustainable nonclinical activities and scholarship. Notably, more than 40% of surveyed leaders agreed or strongly agreed that their faculty were not developing sustainable nonclinical activities. For individual faculty, the inability to develop scholarly activities and engage in academic pursuits may create challenges in getting promoted by traditional academic pathways. Some have recognized this issue and tried to develop practical solutions.2 In addition, academic hospitalists often engage in nonclinical activities such as quality improvement or patient safety which do not fit in the traditional tripartite mission of academics (clinical care, education, and research). In this survey, more than 90% of groups were engaged in quality improvement projects and over half in peer review exercises (Table 1). As many of these scholarly activities require innovation, sophisticated data analysis, and can have far‐reaching and substantial impacts on healthcare, some have argued these should be considered as part of the promotion process.8 Notably, the SGIM Academic Hospitalist Taskforce has created the Quality Portfolio, a structured adjunct to promotions packets to organize and document work in quality improvement and patient safety.9
While there were few CI in the divisions surveyed, building CI programs was a major priority of programs. In programs reporting the presence of CI's, they report limited access to research support. This highlights the potential role and benefit of post residency training in designing and conducting clinical research whether in a traditional general internal medicine fellowship or in 1 of the many growing hospital medicine fellowships.10 There also appears to be a need for funding to support the research careers of junior hospitalists. While access to effective mentorship is integrally linked to achieving increased academic accomplishments, there is certainly an ample call for research in the areas of quality improvement, patient safety; systems‐based practice, hospital efficiency, transitions of care,11 perioperative medicine,12 and education.2, 13, 14 While providing lower costs per admission and lower lengths of stay, hospitalists seem well‐positioned to spearhead active research in cost‐effectiveness in the hospital.14 Additionally, a quality portfolio, documenting such quality improvement projects, has been suggested as an effective means to provide a record of this work for academic promotion.9
The diverse activities of today's hospitalists are transforming the traditional view of academic work and are critical to the growth of hospitals, patient care, and development of the field of hospital medicine itself. Until these areas are fully embraced as legitimate areas of academic productivity and scholarship, the academic advancement of hospitalists will be slow.
It is unclear from our survey if academic hospitalist programs are truly getting the support they need to succeed. On one hand, there was general agreement that the Departments of Medicine and Divisions of General and Hospital Medicine were invested in the development of the academic accomplishments. Yet, the majority of program directors believed that they are viewed by the Department or Division as a clinical rather than an academic program. Moreover, over half of program directors report that their hospital was not supportive and therefore have limited the expansion of their hospitalist groups' educational and research activities. Lastly, for a large majority of programs, unavailable funding also acted to limit growth and expansion of academic functions. In a mere 2 decades, Emergency Medicine has become one of the largest US specialties and yet research and funding in the field have been lagging and are limiting academic expansion. Junior faculty seeking research careers struggled to find support and mentorship within their emergency medicine divisions.15 Challenges faced by academic emergency medicine provide important historical perspective for the even more rapidly growing field of academic hospital medicine. Learning from the Academic Emergency Medicine experience, academic hospitalists should proactively identify scholarship and research opportunities unique to hospitalist and fitting the needs of academic institutions. Involvement in national medical organizations, such as SGIM‐SHM‐ACGIM Academic Hospitalist Academy, or the SGIM Academic Hospitalist Task Force, where skill and career development is the focus, will undoubtedly promote the success of academic hospitalist. Expanding valuable niches of expertise, such as quality control, perioperative medicine and care transitions, create an indispensible component of hospital care. Lastly mentoring programs for academic hospitalist within SHM and SGIM are also essential for networking and career development. There are several limitations to our study. Our response rate of 40% was relatively low, and our results may not be representative of all academic hospitalist division chiefs and their programs, may be overstating the perceived difficulties of the survey sample, or conversely missing a large portion too overwhelmed by current duties who lacked the time to complete the survey. Having said this, our survey methodology targeted sites where we could identify potentialnot confirmedhospitalist groups and hospitalist group leaders. For this reason, our response rate could be higher (if some of our contacts were in error). Our results are a cross‐sectional survey based on self report and are subject to recall bias. In addition, our study was carried out in 2007, and while issues such as mentorship may remain important, our results regarding financial arrangements may not be applicable to the current economic climate. Finally, while improving mentorship was identified as a principle objective for program leaders, we did not explore the existing quality of mentorship, nor perceived shortfalls. This should be the subject of future exploration.
The vast majority of academic hospital medicine programs continue to view inadequate support, expanding research, mentorship, and academic promotion as critical issues for the future. Thus, further understanding of these features, and interventions to allow for success, are of crucial importance in the continued development of academic hospitalists. Our study supports the need for mentoring and career development programs, targeting academic hospitalists and their leaders. In addition, attention should be paid to activities that support career fit, creating sustainable and viable job descriptions for academic hospitalists, and preventing burnout.16 At the same time we must expand the traditional view of scholarship and training and advocate for promotion criteria that value the unique contributions of hospitalists to become in line with the broad areas that hospitalists work.
- Anonymous. Definition of a hospitalist.2009. Society of Hospital Medicine Homepage/General Information. Available at: http://www.hospitalmedicine.org/AM/Template.cfm?Section=Hospitalist_Definition4:240–246.
- ,,,,.Resource‐based relative value scale analysis between teaching and nonteaching hospitalist services.Health Care Management.2009;1(28):81–85.
- ,,, et al.Effects of physician experience on costs and outcomes on an academic general medicine service.Ann Intern Med.2002;137:866–874.
- ,,,.Hospitalists and the practice of inpatient medicine.Ann Intern Med.1999;130:343–349.
- ,,,,,.Rates, predictors and consequences of low career satisfaction and burnout in academic hospital medicine.J Hosp Med.2009;4(S1):24–25.
- ,.Mentoring faculty in academic medicine: a new paradigm?.J Gen Intern Med.2005;20(9):866–870.
- ,.Clinicians in quality improvement: a new career pathway in academic medicine.JAMA.2009;301(7):766–768.
- ,,,.Academic hospitalist taskforce quality portfolio rationale and development. 02/23/2009; Quality portfolio introduction. Available at:http://www.sgim.org/index.cfm?pageId=846. Accessed July 2010.
- ,,,.Hospital medicine fellowships: works in progress.Am J Med.2006;119:72e1–72e7.
- ,,,.Promoting effective care transitions of hospital discharge. A review of key issues for hospitalists.J. Hosp Med.2007;2:314–323.
- ,.Hospitalists and anesthesiologists as perioperative physicians: are their roles complementary?Proc (Bayl Univ Med Cent).2007;20(2):140–142.
- .A systematic review of outcomes and quality measures in adult patients cared for by hospitalists vs nonhospitalist.Mayo Clin Proc.2009;84(3):248–254.
- .Reflections: the hospitalist movement a decade later.J Hosp Med.2006;1:248–252.
- .Anyone, Anything, Anytime A History of Emergency Medicine.1st ed.Philadelphia, PA:Mosby‐Elsevier;2006.
- ,,, et al.Career fit and burnout among academic faculty.Arch Intern Med.2009;169(10):990–995.
Copyright © 2011 Society of Hospital Medicine
Language Barriers and Hospital Care
Forty‐five‐million Americans speak a language other than English and more than 19 million of these speak English less than very wellor are limited English proficient (LEP).1 The number of non‐English‐speaking and LEP people in the US has risen in recent decades, presenting a challenge to healthcare systems to provide high‐quality, patient‐centered care for these patients.2
For outpatients, language barriers are a fundamental contributor to gaps in health care. In the clinic setting, patients who do not speak English well have less access to a usual source of care and lower rates of physician visits and preventive services.36 Even when patients with language barriers do have access to care, they have poorer adherence, decreased comprehension of their diagnoses, decreased satisfaction with care, and increased medication complications.710
Few studies, however, have examined how language influences outcomes of hospital care. Compared to English‐speakers, patients who do not speak English well may experience longer lengths of stay,11 and have more adverse events while in the hospital.12 However, these previous studies have not investigated outcomes immediately post‐hospitalization, such as readmission rates and mortality, nor have they directly addressed the interaction between ethnicity and language.
To understand these questions, we analyzed data collected from a university‐based teaching hospital which cares for patients of diverse cultural and language backgrounds. Using these data, we examined how patients' primary language influenced hospital costs, length of stay (LOS), 30‐day readmission, and 30‐day mortality risk.
Patients and Methods
Patient Population and Setting
Our study examined patients admitted to the General Medicine Service at the University of California, San Francisco Medical Center (UCSF) between July 1, 2001 and June 30th, 2003, the time period during which UCSF participated in the Multicenter Hospitalist Trial (MHT) a prospective quasi‐randomized trial of hospitalist care for general medicine patients.13, 14
UCSF Moffitt‐Long Hospital is a 400‐bed urban academic medical center which provides services to the City and County of San Francisco, an ethnically and linguistically diverse area. UCSF employs staff language interpreters in Spanish, Chinese and Russian who travel to its many outpatient clinics, Comprehensive Cancer Center, Children's Hospital, as well as to Moffitt‐Long Hospital upon request; phone interpretation is also available when in‐person interpreters are not available, for off hours needs and for less common languages. During the period of this study there were no specific inpatient guidelines in place for use of interpretation services at UCSF, nor were there any specific interventions targeting LEP or non‐English speaking inpatients.
Patients were eligible for the MHT if they were 18 years of age or older and admitted at random to a hospitalist or non‐hospitalist physician (eg, outpatient general internist attending on average 1‐month/year); a minority of patients were cared for directly by their primary care physician while in the hospital, and were excluded. For purposes of our study, which merged MHT data with hospital administrative data on primary language, we further excluded all admissions for patients for whom primary language was missing (n = 5), whose listing was unknown or other language (n = 78), sign language (n = 3) or whose language was listed but was not one of the included languages (n = 258). Included languages were English, Chinese, Russian and Spanish. Because LOS and cost data were skewed, we excluded those admissions with the top 1% longest stays and the top 1% highest cost (n = 176); these exclusions did not alter the proportion of admissions across language and ethnicity. In addition, we excluded 102 admissions that were missing data on cost and 11 with costs <$500 and which were likely to be erroneous. Our research was approved by the UCSF Institutional Review Board.
Data Sources
We collected administrative data from Transition Systems Inc (TSI, Boston, MA) billing databases at UCSF as part of the MHT. These data include patient demographics, insurance, costs, ICD‐9CM diagnostic codes, admission and discharge dates in Uniform Bill 92 format. Patient mortality information was collected as part of the MHT using the National Death Index.14
Language data were collected from a separate patient‐registration database (STOR) at UCSF. Information on a patient's primary language is entered at the time each patient first registers at UCSF, whether for the index hospitalization or for prior clinic visits, and is based generally on patient self report. As part of our validation step, we cross‐checked 829 STOR language entries against patient reports and found 91% agreement with the majority of the errors classifying non‐English speakers as English‐speakers.
Measures
Predictor
Our primary language variable was derived using language designations collected from patient registration databases described above. Using these data we specified our key language groups as English, Chinese (Cantonese or Mandarin), Russian, or Spanish.
Outcomes
LOS and total cost of hospital stay for each hospitalization derived from administrative data sources. Readmissions were identified at the time patients were readmitted to UCSF (eg, flagged in administrative data). Mortality was determined by whether an individual patient with an admission in the database was recorded in the National Death Index as dead within 30‐days of admission.
Covariates
Additional covariates included age at admission, gender, ethnicity as recorded in registration databases (White, African American, Asian, Latino, Other), insurance, principal billing diagnosis, whether or not a patient received intensive care unit (ICU) care, type of admitting attending physician (Hospitalist/non‐Hospitalist), and an administrative Charlson comorbidity score.15 To collapse the principal diagnoses into categories, we used the Healthcare Cost and Utilization Project (HCUP)'s Clinical Classification System, which allowed us to classify each diagnosis in 1 of 14 generally accepted categories.16
Analysis
Statistical analyses were performed using STATA statistical software (STATACorp, Version 9, College Station, TX). We examined descriptive means and proportions for all variables, including sociodemographic, hospitalization, comorbidity and outcome variables. We compared English and non‐English speakers on all covariate and outcome variables using t‐tests for comparison of means and chi‐square for comparison of categorical variables.
It was not possible to fully test the language‐by‐ethnicity interactionwhether or not the impact of language varied by ethnic groupbecause many cells of the joint distribution were very sparse (eg, the sample contained very few non‐English‐speaking African Americans). Therefore, to better understand the influence of English vs. non‐English language usage across different ethnic groups, we created a combined language‐ethnicity predictor variable which categorized each subject first by language and then for the English‐speakers by ethnicity. For example, a Chinese, Spanish or Russian speaker would be categorized as such, and an English‐speaker could fall into the English‐White, English‐African American, English‐Asian or English‐Latino group. This allowed us to test whether there were any differences in language effects across the White, Asian, and Latino ethnicities, and any difference in ethnicity effects among English‐speakers.
Because cost and LOS were skewed, we used negative binomial models for LOS and log transformed costs. We performed a sensitivity analysis testing whether our results were robust to the exclusion of the admissions with the top 1% LOS and top 1% cost. We used logistic regression for the 30‐day readmission and mortality outcomes.
Our primary predictor was the language‐ethnicity variable described above. To determine the independent association between this predictor and our key outcomes, we then built models which included additional potential confounders selected either for face validity or because of observed confounding with other covariates. Our inclusion of potential confounders was limited by the variables available in the administrative database; thus, we were not able to pursue detailed analyses of communication and literacy factors and their interaction with our predictor or their independent impact on outcomes. Models also included a linear spline with a single knot at age 65 years as a further adjustment for age in Medicare recipients.1719 For the 30‐day readmission outcome model, we excluded those admissions for which the patient either died in the hospital or was discharged to hospice care. Within each model we tested the impact of a language barrier using custom contrasts. This allowed us to examine the language‐ethnicity effect aggregating all non‐English speakers compared to all English‐speakers, comparing each non‐English speaking group to all English‐speakers, comparing Chinese speakers to English‐speaking Asians and Spanish speakers to English‐speaking‐Latinos, as well as to test whether the effect of English language is the same across ethnicities.
Results
Admission Characteristics of the Sample
A total of 7023 patients were admitted to the General Medicine service, 5877 (84%) of whom were English‐speakers and 1146 (16%) non‐English‐speakers (Table 1). Overall, half of the admitted patients were women (50%), and the vast majority was insured (93%). The most common principal diagnoses were respiratory and gastrointestinal disorders. Only a small number of non‐English speakers 164 (14%) were recorded in the UCSF Interpreter Services database as having had any interaction with a professional staff interpreter during their hospitalization.
| English (n = 5877) n (%) | Non‐English (n = 1146) n (%) | |
|---|---|---|
| ||
| Socio‐economic variables | ||
| Language‐ethnicity | ||
| English | ||
| White | 3066 (52.2) | |
| African American | 1351 (23.0) | |
| Asian | 544 (9.3) | |
| Latino | 298 (5.1) | |
| Other | 618 (10.5) | |
| Chinese speakers | 584 (51.0) | |
| Spanish speakers | 272 (25.3) | |
| Russian speakers | 290 (23.7) | |
| Age mean (SD) (range 18‐105) | 58.8 (20.3) | 72.3 (15.5) |
| Gender | ||
| Male | 2967 (50.5) | 514 (44.8) |
| Female | 2910 (49.5) | 632 (55.2) |
| Insurance | ||
| Medicare | 2878 (49.0) | 800 (69.8) |
| Medicaid | 1201 (20.4) | 193 (16.8) |
| Commercial | 1358 (23.1) | 106 (9.3) |
| Charity/other | 440 (7.5) | 47 (4.1) |
| Hospitalization variables | ||
| Admitted to ICU | ||
| Yes | 721 (12.3) | 149 (13.0) |
| Attending physician | ||
| Hospitalist | 3950 (67.2) | 781 (68.2) |
| Comorbidity variables | ||
| Principal Diagnosis | ||
| Respiratory disorder | 1061 (18.1) | 225 (19.6) |
| Gastrointestinal disorder | 963 (16.4) | 205 (17.9) |
| Circulatory disorder | 613 (10.4) | 140 (12.2) |
| Endocrine/metabolism | 671 (11.4) | 80 (7.0) |
| Injury/poisoning | 475 (8.1) | 64 (5.6) |
| Malignancy | 395 (6.7) | 107 (9.3) |
| Renal/urinary disorder | 383 (6.5) | 108 (9.4) |
| Skin disorder | 278 (4.7) | 28 (2.9) |
| Infection/fatigue NOS | 206 (3.5) | 45 (3.4) |
| Blood disorder (non‐malignant) | 189 (3.2) | 38 (3.3) |
| Musculoskeletal/connective tissue disorder | 164 (2.8) | 33 (2.9) |
| Mental disorder/substance abuse | 171 (2.9) | 7 (0.6) |
| Nervous system/brain infection | 137 (2.3) | 26 (2.3) |
| Unclassified | 171 (2.9) | 40 (3.5) |
| Charlson Index score mean (SD) | 0.97 1.33 | 1.10 1.42 |
Among English speakers, Whites and African Americans were the most common ethnicities; however, more than 500 admissions were categorized as Asian ethnicity, and more than 600 as patients of other ethnicity. Close to 300 admissions were for Latinos. Among non‐English speakers, Chinese speakers had the largest number of admissions (n = 584), while Spanish and Russian speakers had similar numbers (n = 272 and 290 respectively).
Non‐English speakers were older, more likely to be female, more likely to be insured by Medicare, and more likely to have a higher comorbidity index score. While comorbidity scores were similar among non‐English speakers (Chinese 1.13 1.50; Russian 1.09 1.37; Spanish 1.06 1.30), they differed considerably among English speakers (White 0.94 1.29; African American 1.05 1.40; Asian 1.04 1.45; Latino 0.89 1.23; Other 0.91 1.29).
Hospital Outcome by Language‐Ethnicity Group (Table 2)
When aggregated together, non‐English speakers were somewhat more likely to be dead at 30‐days and have lower cost admissions; however, they did not differ from English speakers on LOS or readmission rates. While differences among disaggregated language‐ethnicity groups were not all statistically significant, English‐speaking Whites had the longest LOS (mean = 4.9 days) and highest costs (mean = $10,530). English‐speaking African Americans, Chinese and Spanish speakers had the highest 30‐day readmission rates; whereas, English‐speaking Latinos and Russian speakers had markedly lower 30‐day readmission rates (2.5% and 6.4%, respectively). Chinese speakers had the highest 30‐day mortality, followed by English speaking Whites and Asians.
| Language‐Ethnicity Groups | LOS* Mean #Days (SD) | Cost Mean Cost $ (SD) | 30‐Day Readmission, n (%) | 30‐Day Mortality, n (%) |
|---|---|---|---|---|
| ||||
| English speakers (all) | 4.7 (4.5) | 10,035 (15,041) | 648 (11.9) | 613 (10.4) |
| White | 4.9 (5.1) | 10,530 (15,894) | 322 (11.4) | 377 (12.3) |
| African American | 4.5 (4.8) | 9107 (13,314) | 227 (17.5) | 91 (6.7) |
| Asian | 4.3 (4.5) | 9933 (15,607) | 43 (8.8) | 67 (12.3) |
| Latino | 4.6 (4.8) | 9823 (14,113) | 7 (2.5) | 18 (6.0) |
| Other | 4.5 (4.8) | 9662 (14,016) | 49 (8.5) | 60 (9.7) |
| Non‐English speakers (all) | 4.5 (4.5) | 9515 (13,213) | 117 (11.0) | 147 (12.8) |
| Chinese speakers | 4.5 (4.6) | 9505 (12,841) | 69 (12.8) | 85 (14.6) |
| Spanish speakers | 4.5 (4.5) | 9115 (13,846) | 31 (12.0) | 28 (10.3) |
| Russian speakers | 4.7 (4.2) | 9846 (13,360) | 17 (6.4) | 34 (11.7) |
We further investigated differences among English speakers to better understand the very high rate of readmission for African Americans and the very low rate for English‐speaking Latinos. African Americans were on average younger than other English speakers (55 19 years vs. 60 21 years; P < 0.001); but, they had higher comorbidity scores than other English speakers (1.05 1.40 vs. 0.94 1.31; P = 0.008), and were more likely to be admitted for non‐malignant blood disorders (eg, sickle cell disease), endocrine disorders (eg, diabetes mellitus), and circulatory disorders (eg, stroke). In contrast, English‐speaking Latinos were also younger than other English speakers (53 21 years vs. 59 20 years; P < 0.001), but they trended toward lower comorbidity scores (0.87 1.23 vs. 0.97 1.33; P = 0.2), and were more likely to be admitted for gastrointestinal and musculoskeletal disorders, and less likely to be admitted for malignancy and endocrine disorders.
Multivariate Analyses: Association of Aggregated and Disaggregated Language‐Ethnicity Groups With Hospital Outcomes (Table 3)
In multivariate models examining aggregated language‐ethnicity groups, non‐English speakers had a trend toward higher odds of readmission at 30‐days post‐discharge than the English‐speaking group (odds ratio [OR], 1.3; 95% confidence interval [CI], 1.0‐1.7). There were no significant differences for LOS, cost, or 30‐day mortality. Compared to English speakers, Chinese and Spanish speakers had 70% and 50% higher adjusted odds of readmission at 30‐days post‐discharge respectively, while Russian speakers' odds of readmission was not increased. Additionally, Chinese speakers had 7% shorter LOS than English‐speakers. There were no significant differences among any of the language‐ethnicity groups for 30‐day mortality. The increased odds of readmission for Chinese and Spanish speakers compared to English speakers was robust to reinclusion of the admissions with the top 1% LOS and top 1% cost.
| Language Categorization | LOS, % Difference (95% CI) | Total Cost, % Difference (95% CI) | 30‐Day Readmission,* OR (95% CI) | Mortality, OR (95% CI) |
|---|---|---|---|---|
| ||||
| All English speakers | Reference | Reference | Reference | Reference |
| Non‐English speakers | 3.1 (8.7 to 3.1) | 2.5 (8.3 to 2.1) | 1.3 (1.0 to 1.7) | 0.9 (0.7 to 1.2) |
| All English speakers | Reference | Reference | Reference | Reference |
| Chinese speakers | 7.2 (13.9 to 0) | 5.3 (12.2 to 2.1) | 1.7 (1.2 to 2.3) | 1.0 (0.8 to 1.4) |
| Spanish speakers | 3.0 (12.6 to 7.6) | 3.0 (12.7 to 7.7) | 1.5 (1.0 to 2.3) | 0.9 (0.6 to 1.5) |
| Russian speakers | 1.5 (8.3 to 12.2) | 0.9 (8.9 to 11.8) | 0.8 (0.5 to 1.4) | 0.8 (0.5 to 1.2) |
Multivariate Analyses: Association of Language for Asians and Latinos, and of Ethnicity for English speakers, With Hospital Outcomes (Table 4)
Both Chinese and Spanish speakers had significantly higher odds of 30‐day readmission than their English speaking Asian and Latino counterparts. There were no significant differences in LOS, cost, or 30‐day mortality in this within‐ethnicity analysis. Among English speakers, admissions for patients with Asian ethnicity were 15% shorter and resulted in 9% lower costs than for Whites. While LOS and cost were similar for English‐speaking Latino and White admissions, English‐speaking Latinos had markedly lower odds of 30‐day readmission than their White counterparts. Whereas African‐Americans had 6% shorter LOS, 40% higher odds of readmission and 30% lower odds of mortality at 30‐days than English speaking Whites.
| Language‐Ethnicity Comparisons | LOS, % Difference (95% CI) | Total Cost, % Difference (95% CI) | 30‐Day Readmission,* OR (95% CI) | Mortality, OR (95% CI) |
|---|---|---|---|---|
| ||||
| English speaking Asians | Reference | Reference | Reference | Reference |
| Chinese speakers | 2.2 (7.4 to 12.7) | 0.3 (9.2 to 10.7) | 1.5 (1.0 to 2.3) | 0.8 (0.6 to 1.2) |
| English speaking Latinos | Reference | Reference | Reference | Reference |
| Spanish speakers | 4.5 (16.8 to 9.5) | 1.2 (14.0 to 13.5) | 5.7 (2.4 to 13.2) | 1.2 (0.6 to 2.4) |
| English‐White | Reference | Reference | Reference | Reference |
| English‐African American | 6.2 (11.3 to 0.9) | 4.4 (9.6 to 1.1) | 1.4 (1.1 to 1.7) | 0.6 (0.5 to 0.8) |
| English‐Asian | 14.6 (20.9 to 7.9) | 8.6 (15.4 to 1.4) | 0.8 (0.5 to 1.0) | 1.0 (0.7 to 1.4) |
| English‐Latino | 4.5 (13.5 to 5.4) | 5.0 (14.0 to 5.0) | 0.2 (0.1 to 0.4) | 0.6 (0.4 to 1.0) |
Conclusion/Discussion
Our results indicate that language barriers may contribute to higher readmission rates for non‐English speakers, but that they have less impact on care efficiency or mortality. This finding of an association between language and readmission, without a similar association with efficiency, suggests a potentially communication‐critical step in care.20, 21 Patients with language barriers are more likely to experience adverse events, and those events are often caused by errors in communication.12 It is conceivable that higher readmission risk for Chinese and Spanish speakers in our study was, at least in part, due to gaps in communication that are present in all patient groups, and exacerbated by the presence of a language barrier. This barrier is likely present during hospitalization but magnified at discharge, limiting caregivers' ability to understand patients' needs for home care, while simultaneously limiting patients' understanding of the discharge plan. After discharge, it is also possible that non‐English speakers are less able to communicate their needs as they arise, ormore subtlyfeel less supported by a primarily English speaking healthcare system. As in other clinical arenas,22 it is quite possible that increased access to professional interpreters in the hospital setting, and particularly at the time of discharge, would enhance communication and outcomes for LEP patients. Our interpreter services data showed that the patients in our study had quite limited access to staff professional interpreters.
Our findings differ somewhat from those of John‐Baptiste et al.,11 who found that language barriers contributed to increased LOS for patients with cardiac and major surgical diagnoses. Our study's findings are akin to recent research suggesting that being a monolingual Spanish speaker or receiving interpreter services may not significantly impact LOS or cost of hospitalization,23 and that LOS and in‐hospital mortality do not differ for non‐English speakers and English speakers after acute myocardial infarction.24 These studies, along with our results, suggest that that care efficiency in the hospital may be driven much more by clinical acuity (eg, the need to respond rapidly to urgent clinical signs such as hypotension, fever and respiratory distress) than by adequacy of communication. For example, elderly LEP patients may be even more likely than English speakers to have vigilant family members at the bedside throughout their hospitalization due to their need for communication assistance; these family members can quickly alert hospital staff to concerning changes in the patient's condition.
Our results also suggest the possibility that language and ethnicity are not monolithic concepts, and that even within language and ethnic groups there are potential differences in care pattern. For example, not speaking English may be a surrogate marker for unmeasured factors such as social supports and access to care. Language is intimately associated with culture; it remains plausible that cultural differences between highly acculturated and less acculturated members of a given ethno‐cultural group may have contributed to our observed differences in readmission rates. Differences in culture and associated factors, such as social support or use of multiple hospital systems, may account for lack of higher readmission risk in Russian speakers, while Chinese and Spanish speakers had higher readmission risk.
In addition, our finding that English‐speaking Latinos had lower readmission risk than any other group may be more consistent with their clinical characteristicseg, younger age, fewer comorbiditiesthan with cultural factors. Our finding that African American patients had the highest readmission risk in our hospital was both surprising and concerning. Some of this increased risk may be explained by clinical characteristics, such as higher comorbidities and higher rates of diagnoses leading to frequent admissions (eg, sickle cell disease); however, the reasons for this disparity deserves further investigation.
Our study has limitations. First, our data are administrative, and lack information about patients' educational attainment, social support, acculturation, utilization of other hospital systems, and usual source of care. Despite this, we were able to account for many significant covariates that might contribute to readmission rates, including age, insurance status, gender, comorbidities, and admission to the intensive care unit.2528 Second, our information about patients' English language proficiency is limited. While direct assessments of English proficiency are more accurate ways to determine a patient's ability to communicate with health care providers in English,29 our language validation work conducted in preparation for this study suggests that most of our patients recorded as having a non‐English primary language (87%) also have a low score on a language acculturation scale.
Third, only 14% of our non‐English speaking subjects utilized professional staff interpreters, and we had no information on the use of professional telephonic interpreters, or ad hoc interpretersfamily members, non‐interpreter staff membersand their impact on our results. It is well‐documented that ad hoc interpreters are used frequently in healthcare, particularly in the hospital setting, and thus we can assume this to be true in our study.30, 31 As noted above, it is likely that the advocacy of family members and friends at the bedside helped to minimize potential differences in care efficiency for patients with language barriers. Finally, our study was performed at a single university based hospital and may not produce results which are applicable to other care settings.
Our findings point to several avenues for future research on language barriers and hospitalized patients. First, the field would benefit from an examination of the impact of easy access to professional interpreters during hospitalization on outcomes of hospital care, in particular on readmission rates. Second, there is need for development and assessment of best practices for creating a culture of professional interpreter utilization in the hospital among physicians and nursing staff. Third, investigation of the role of caregiver presence in the hospital room and how this might differ by patient culture, age and language ability may further elucidate some of the differences across language groups observed in our study. Lastly, a more granular investigation of clinician‐patient communication and the importance of interpersonal processes of care on both patient satisfaction and understanding of and adherence to discharge instructions could lead to the development of detailed interventions to enhance this communication and these outcomes as it has done for communication‐sensitive outcomes in the outpatient arena.3234
In summary, our study suggests that higher risk for readmission can be added to the unfortunate list of outcomes which are worsened due to language barriers, pointing to transition from the hospital as a potentially communication‐critical step in care which may be amenable to intervention. Our findings also suggest that this risk can vary even between groups of patients who do not speak English primarily. Whether and to what degree language and communication barriers aloneincluding access to professional interpreters and patient‐centered communicationduring hospitalization, or differences in caregiver social support both during and after hospitalization as well as access to care post‐hospitalization contribute to these findings is a worthy subject of future research.
Acknowledgements
The authors acknowledge Dr. Eliseo J. Prez‐Stable for his mentorship on this project.
- ,. Language Use and English‐Speaking Ability:2000. Available at: http://www.census.gov/prod/2003pubs/c2kbr‐29.pdf. Accessed January 2010.
- U.S. Department of Health and Human Services.2006National Healthcare Disparities Report. AHRQ Publication No. 070012; 2006.
- ,,,.Disparities in health care by race, ethnicity, and language among the insured: findings from a national sample.Med Care.2002;40(1):52–59.
- ,.The effect of physician‐patient communication on mammography utilization by different ethnic groups.Med Care.1991;29(11):1065–1082.
- ,.Language of interview:relevance for research of Southwest Hispanics.Am J Pub Health.1991;81(11):1399–1404.
- ,,,.Is language a barrier to the use of preventive services?J Gen Intern Med.1997;12(8):472–477.
- ,,,.Impact of language barriers on patient satisfaction in an emergency department.JGIM.1999;14:82–87.
- .Patient comprehension of doctor‐patient communication on discharge from the emergency department.J Emerg Med.1997;15(1):1–7.
- ,,, et al.Drug complications in outpatients.J Gen Intern Med.2000;15:149–154.
- .Language concordance as a determinant of patient compliance and emergency room use in patients with asthma.Med Care.1988;26(12):1119–1128.
- ,,,et al.The effect of English language proficiency on length of stay and in‐hospital mortality.J Gen Intern Med.2004;19:221–228.
- ,,,.Language proficiency and adverse events in US hospitals: a pilot study.Int J Qual Health Care.2007;19(2):60–67.
- ,,, et al.Factors associated with discussion of care plans and code status at the time of hospital admission: results from the Multicenter Hospitalist Study.J Hosp Med.2008;3(6):437–445.
- ,,, et al.Quality of care for decompensated heart failure: comparable performance between academic hospitalists and non‐hospitalists.J Gen Intern Med.2008;23(9):1399–1406.
- ,,,.A new method of classifying prognostic comorbidity in longitudinal studies: development and validation.J Chronic Dis.1987;40(5):373–383.
- AHRQ. Healthcare Cost and Utilizlation Project: Tools 132(3):191–200.
- ,,.Free knot splines for logistic models and threshold selection.Comput Methods Programs Biomed.2005;77(1):1–9.
- ,,,,.Statistical methods in epidemiology: a comparison of statistical methods to analyze dose‐response and trend analysis in epidemiologic studies.J Clin Epidemiol.1998;51(12):1223–1233.
- The Care Transitions Project. Health Care Policy and Research, Practitioner Tools. Available at: http://www.caretransitions.org/practitioner_tools.asp.
- AHRQ. Improving safety at the point of care. Available at: http://www.ahrq.gov/qual/pips. Accessed January2010.
- ,,,.Do professional interpreters improve clinical care for patients with limited english proficiency? A systematic review of the literature.Health Serv Res.2007;42(2):727–754.
- ,,.The impact of an enhanced interpreter service intervention on hospital costs and patient satisfaction.J Gen Intern Med.2007;22 Suppl 2:306–311.
- ,,,,.Acute myocardial infarction length of stay and hospital mortality are not associated with language preference.J Gen Intern Med.2008;23(2):190–194.
- ,,.A systematic literature review of factors affecting outcome in older medical patients admitted to hospital.Age Ageing.2004;33(2):110–115.
- ,,,,,.Risk factors and prognostic predictors of unexpected intensive care unit admission within 3 days after ED discharge.Am J Emerg Med.2007;25(9):1009–1014.
- ,.Effect of gender, ethnicity, pulmonary disease, and symptom stability on rehospitalization in patients with heart failure.Am J Cardiol.2007;100(7):1139–1144.
- ,,,.Bouncing back: patterns and predictors of complicated transitions 30 days after hospitalization for acute ischemic stroke.J Am Geriatr Soc.2007;55(3):365–373.
- ,,,,.Identification of limited English proficient patients in clinical care.J Gen Intern Med.2008;23(10):1555–1560.
- ,,,,.Hospital langague services for patients with limited English proficiency: results from a national survey.Health Research October2006.
- ,.Hospitals, Language, and Culture: a Snapshot of the Nation. The Joint Commission and The California Endowment;2007.
- ,,, et al.A randomized controlled trial of interventions to enhance patient‐physician partnership, patient adherence and high blood pressure control among ethnic minorities and poor persons: study protocol NCT00123045.Implement Sci.2009;4:7.
- ,,,,.Interpersonal processes of care and patient satisfaction: do associations differ by race, ethnicity, and language?Health Serv Res.2009;44(4):1326–1344.
- ,,,.Understanding concordance in patient‐physician relationships: personal and ethnic dimensions of shared identity.Ann Fam Med.2008;6(3):198–205.
Forty‐five‐million Americans speak a language other than English and more than 19 million of these speak English less than very wellor are limited English proficient (LEP).1 The number of non‐English‐speaking and LEP people in the US has risen in recent decades, presenting a challenge to healthcare systems to provide high‐quality, patient‐centered care for these patients.2
For outpatients, language barriers are a fundamental contributor to gaps in health care. In the clinic setting, patients who do not speak English well have less access to a usual source of care and lower rates of physician visits and preventive services.36 Even when patients with language barriers do have access to care, they have poorer adherence, decreased comprehension of their diagnoses, decreased satisfaction with care, and increased medication complications.710
Few studies, however, have examined how language influences outcomes of hospital care. Compared to English‐speakers, patients who do not speak English well may experience longer lengths of stay,11 and have more adverse events while in the hospital.12 However, these previous studies have not investigated outcomes immediately post‐hospitalization, such as readmission rates and mortality, nor have they directly addressed the interaction between ethnicity and language.
To understand these questions, we analyzed data collected from a university‐based teaching hospital which cares for patients of diverse cultural and language backgrounds. Using these data, we examined how patients' primary language influenced hospital costs, length of stay (LOS), 30‐day readmission, and 30‐day mortality risk.
Patients and Methods
Patient Population and Setting
Our study examined patients admitted to the General Medicine Service at the University of California, San Francisco Medical Center (UCSF) between July 1, 2001 and June 30th, 2003, the time period during which UCSF participated in the Multicenter Hospitalist Trial (MHT) a prospective quasi‐randomized trial of hospitalist care for general medicine patients.13, 14
UCSF Moffitt‐Long Hospital is a 400‐bed urban academic medical center which provides services to the City and County of San Francisco, an ethnically and linguistically diverse area. UCSF employs staff language interpreters in Spanish, Chinese and Russian who travel to its many outpatient clinics, Comprehensive Cancer Center, Children's Hospital, as well as to Moffitt‐Long Hospital upon request; phone interpretation is also available when in‐person interpreters are not available, for off hours needs and for less common languages. During the period of this study there were no specific inpatient guidelines in place for use of interpretation services at UCSF, nor were there any specific interventions targeting LEP or non‐English speaking inpatients.
Patients were eligible for the MHT if they were 18 years of age or older and admitted at random to a hospitalist or non‐hospitalist physician (eg, outpatient general internist attending on average 1‐month/year); a minority of patients were cared for directly by their primary care physician while in the hospital, and were excluded. For purposes of our study, which merged MHT data with hospital administrative data on primary language, we further excluded all admissions for patients for whom primary language was missing (n = 5), whose listing was unknown or other language (n = 78), sign language (n = 3) or whose language was listed but was not one of the included languages (n = 258). Included languages were English, Chinese, Russian and Spanish. Because LOS and cost data were skewed, we excluded those admissions with the top 1% longest stays and the top 1% highest cost (n = 176); these exclusions did not alter the proportion of admissions across language and ethnicity. In addition, we excluded 102 admissions that were missing data on cost and 11 with costs <$500 and which were likely to be erroneous. Our research was approved by the UCSF Institutional Review Board.
Data Sources
We collected administrative data from Transition Systems Inc (TSI, Boston, MA) billing databases at UCSF as part of the MHT. These data include patient demographics, insurance, costs, ICD‐9CM diagnostic codes, admission and discharge dates in Uniform Bill 92 format. Patient mortality information was collected as part of the MHT using the National Death Index.14
Language data were collected from a separate patient‐registration database (STOR) at UCSF. Information on a patient's primary language is entered at the time each patient first registers at UCSF, whether for the index hospitalization or for prior clinic visits, and is based generally on patient self report. As part of our validation step, we cross‐checked 829 STOR language entries against patient reports and found 91% agreement with the majority of the errors classifying non‐English speakers as English‐speakers.
Measures
Predictor
Our primary language variable was derived using language designations collected from patient registration databases described above. Using these data we specified our key language groups as English, Chinese (Cantonese or Mandarin), Russian, or Spanish.
Outcomes
LOS and total cost of hospital stay for each hospitalization derived from administrative data sources. Readmissions were identified at the time patients were readmitted to UCSF (eg, flagged in administrative data). Mortality was determined by whether an individual patient with an admission in the database was recorded in the National Death Index as dead within 30‐days of admission.
Covariates
Additional covariates included age at admission, gender, ethnicity as recorded in registration databases (White, African American, Asian, Latino, Other), insurance, principal billing diagnosis, whether or not a patient received intensive care unit (ICU) care, type of admitting attending physician (Hospitalist/non‐Hospitalist), and an administrative Charlson comorbidity score.15 To collapse the principal diagnoses into categories, we used the Healthcare Cost and Utilization Project (HCUP)'s Clinical Classification System, which allowed us to classify each diagnosis in 1 of 14 generally accepted categories.16
Analysis
Statistical analyses were performed using STATA statistical software (STATACorp, Version 9, College Station, TX). We examined descriptive means and proportions for all variables, including sociodemographic, hospitalization, comorbidity and outcome variables. We compared English and non‐English speakers on all covariate and outcome variables using t‐tests for comparison of means and chi‐square for comparison of categorical variables.
It was not possible to fully test the language‐by‐ethnicity interactionwhether or not the impact of language varied by ethnic groupbecause many cells of the joint distribution were very sparse (eg, the sample contained very few non‐English‐speaking African Americans). Therefore, to better understand the influence of English vs. non‐English language usage across different ethnic groups, we created a combined language‐ethnicity predictor variable which categorized each subject first by language and then for the English‐speakers by ethnicity. For example, a Chinese, Spanish or Russian speaker would be categorized as such, and an English‐speaker could fall into the English‐White, English‐African American, English‐Asian or English‐Latino group. This allowed us to test whether there were any differences in language effects across the White, Asian, and Latino ethnicities, and any difference in ethnicity effects among English‐speakers.
Because cost and LOS were skewed, we used negative binomial models for LOS and log transformed costs. We performed a sensitivity analysis testing whether our results were robust to the exclusion of the admissions with the top 1% LOS and top 1% cost. We used logistic regression for the 30‐day readmission and mortality outcomes.
Our primary predictor was the language‐ethnicity variable described above. To determine the independent association between this predictor and our key outcomes, we then built models which included additional potential confounders selected either for face validity or because of observed confounding with other covariates. Our inclusion of potential confounders was limited by the variables available in the administrative database; thus, we were not able to pursue detailed analyses of communication and literacy factors and their interaction with our predictor or their independent impact on outcomes. Models also included a linear spline with a single knot at age 65 years as a further adjustment for age in Medicare recipients.1719 For the 30‐day readmission outcome model, we excluded those admissions for which the patient either died in the hospital or was discharged to hospice care. Within each model we tested the impact of a language barrier using custom contrasts. This allowed us to examine the language‐ethnicity effect aggregating all non‐English speakers compared to all English‐speakers, comparing each non‐English speaking group to all English‐speakers, comparing Chinese speakers to English‐speaking Asians and Spanish speakers to English‐speaking‐Latinos, as well as to test whether the effect of English language is the same across ethnicities.
Results
Admission Characteristics of the Sample
A total of 7023 patients were admitted to the General Medicine service, 5877 (84%) of whom were English‐speakers and 1146 (16%) non‐English‐speakers (Table 1). Overall, half of the admitted patients were women (50%), and the vast majority was insured (93%). The most common principal diagnoses were respiratory and gastrointestinal disorders. Only a small number of non‐English speakers 164 (14%) were recorded in the UCSF Interpreter Services database as having had any interaction with a professional staff interpreter during their hospitalization.
| English (n = 5877) n (%) | Non‐English (n = 1146) n (%) | |
|---|---|---|
| ||
| Socio‐economic variables | ||
| Language‐ethnicity | ||
| English | ||
| White | 3066 (52.2) | |
| African American | 1351 (23.0) | |
| Asian | 544 (9.3) | |
| Latino | 298 (5.1) | |
| Other | 618 (10.5) | |
| Chinese speakers | 584 (51.0) | |
| Spanish speakers | 272 (25.3) | |
| Russian speakers | 290 (23.7) | |
| Age mean (SD) (range 18‐105) | 58.8 (20.3) | 72.3 (15.5) |
| Gender | ||
| Male | 2967 (50.5) | 514 (44.8) |
| Female | 2910 (49.5) | 632 (55.2) |
| Insurance | ||
| Medicare | 2878 (49.0) | 800 (69.8) |
| Medicaid | 1201 (20.4) | 193 (16.8) |
| Commercial | 1358 (23.1) | 106 (9.3) |
| Charity/other | 440 (7.5) | 47 (4.1) |
| Hospitalization variables | ||
| Admitted to ICU | ||
| Yes | 721 (12.3) | 149 (13.0) |
| Attending physician | ||
| Hospitalist | 3950 (67.2) | 781 (68.2) |
| Comorbidity variables | ||
| Principal Diagnosis | ||
| Respiratory disorder | 1061 (18.1) | 225 (19.6) |
| Gastrointestinal disorder | 963 (16.4) | 205 (17.9) |
| Circulatory disorder | 613 (10.4) | 140 (12.2) |
| Endocrine/metabolism | 671 (11.4) | 80 (7.0) |
| Injury/poisoning | 475 (8.1) | 64 (5.6) |
| Malignancy | 395 (6.7) | 107 (9.3) |
| Renal/urinary disorder | 383 (6.5) | 108 (9.4) |
| Skin disorder | 278 (4.7) | 28 (2.9) |
| Infection/fatigue NOS | 206 (3.5) | 45 (3.4) |
| Blood disorder (non‐malignant) | 189 (3.2) | 38 (3.3) |
| Musculoskeletal/connective tissue disorder | 164 (2.8) | 33 (2.9) |
| Mental disorder/substance abuse | 171 (2.9) | 7 (0.6) |
| Nervous system/brain infection | 137 (2.3) | 26 (2.3) |
| Unclassified | 171 (2.9) | 40 (3.5) |
| Charlson Index score mean (SD) | 0.97 1.33 | 1.10 1.42 |
Among English speakers, Whites and African Americans were the most common ethnicities; however, more than 500 admissions were categorized as Asian ethnicity, and more than 600 as patients of other ethnicity. Close to 300 admissions were for Latinos. Among non‐English speakers, Chinese speakers had the largest number of admissions (n = 584), while Spanish and Russian speakers had similar numbers (n = 272 and 290 respectively).
Non‐English speakers were older, more likely to be female, more likely to be insured by Medicare, and more likely to have a higher comorbidity index score. While comorbidity scores were similar among non‐English speakers (Chinese 1.13 1.50; Russian 1.09 1.37; Spanish 1.06 1.30), they differed considerably among English speakers (White 0.94 1.29; African American 1.05 1.40; Asian 1.04 1.45; Latino 0.89 1.23; Other 0.91 1.29).
Hospital Outcome by Language‐Ethnicity Group (Table 2)
When aggregated together, non‐English speakers were somewhat more likely to be dead at 30‐days and have lower cost admissions; however, they did not differ from English speakers on LOS or readmission rates. While differences among disaggregated language‐ethnicity groups were not all statistically significant, English‐speaking Whites had the longest LOS (mean = 4.9 days) and highest costs (mean = $10,530). English‐speaking African Americans, Chinese and Spanish speakers had the highest 30‐day readmission rates; whereas, English‐speaking Latinos and Russian speakers had markedly lower 30‐day readmission rates (2.5% and 6.4%, respectively). Chinese speakers had the highest 30‐day mortality, followed by English speaking Whites and Asians.
| Language‐Ethnicity Groups | LOS* Mean #Days (SD) | Cost Mean Cost $ (SD) | 30‐Day Readmission, n (%) | 30‐Day Mortality, n (%) |
|---|---|---|---|---|
| ||||
| English speakers (all) | 4.7 (4.5) | 10,035 (15,041) | 648 (11.9) | 613 (10.4) |
| White | 4.9 (5.1) | 10,530 (15,894) | 322 (11.4) | 377 (12.3) |
| African American | 4.5 (4.8) | 9107 (13,314) | 227 (17.5) | 91 (6.7) |
| Asian | 4.3 (4.5) | 9933 (15,607) | 43 (8.8) | 67 (12.3) |
| Latino | 4.6 (4.8) | 9823 (14,113) | 7 (2.5) | 18 (6.0) |
| Other | 4.5 (4.8) | 9662 (14,016) | 49 (8.5) | 60 (9.7) |
| Non‐English speakers (all) | 4.5 (4.5) | 9515 (13,213) | 117 (11.0) | 147 (12.8) |
| Chinese speakers | 4.5 (4.6) | 9505 (12,841) | 69 (12.8) | 85 (14.6) |
| Spanish speakers | 4.5 (4.5) | 9115 (13,846) | 31 (12.0) | 28 (10.3) |
| Russian speakers | 4.7 (4.2) | 9846 (13,360) | 17 (6.4) | 34 (11.7) |
We further investigated differences among English speakers to better understand the very high rate of readmission for African Americans and the very low rate for English‐speaking Latinos. African Americans were on average younger than other English speakers (55 19 years vs. 60 21 years; P < 0.001); but, they had higher comorbidity scores than other English speakers (1.05 1.40 vs. 0.94 1.31; P = 0.008), and were more likely to be admitted for non‐malignant blood disorders (eg, sickle cell disease), endocrine disorders (eg, diabetes mellitus), and circulatory disorders (eg, stroke). In contrast, English‐speaking Latinos were also younger than other English speakers (53 21 years vs. 59 20 years; P < 0.001), but they trended toward lower comorbidity scores (0.87 1.23 vs. 0.97 1.33; P = 0.2), and were more likely to be admitted for gastrointestinal and musculoskeletal disorders, and less likely to be admitted for malignancy and endocrine disorders.
Multivariate Analyses: Association of Aggregated and Disaggregated Language‐Ethnicity Groups With Hospital Outcomes (Table 3)
In multivariate models examining aggregated language‐ethnicity groups, non‐English speakers had a trend toward higher odds of readmission at 30‐days post‐discharge than the English‐speaking group (odds ratio [OR], 1.3; 95% confidence interval [CI], 1.0‐1.7). There were no significant differences for LOS, cost, or 30‐day mortality. Compared to English speakers, Chinese and Spanish speakers had 70% and 50% higher adjusted odds of readmission at 30‐days post‐discharge respectively, while Russian speakers' odds of readmission was not increased. Additionally, Chinese speakers had 7% shorter LOS than English‐speakers. There were no significant differences among any of the language‐ethnicity groups for 30‐day mortality. The increased odds of readmission for Chinese and Spanish speakers compared to English speakers was robust to reinclusion of the admissions with the top 1% LOS and top 1% cost.
| Language Categorization | LOS, % Difference (95% CI) | Total Cost, % Difference (95% CI) | 30‐Day Readmission,* OR (95% CI) | Mortality, OR (95% CI) |
|---|---|---|---|---|
| ||||
| All English speakers | Reference | Reference | Reference | Reference |
| Non‐English speakers | 3.1 (8.7 to 3.1) | 2.5 (8.3 to 2.1) | 1.3 (1.0 to 1.7) | 0.9 (0.7 to 1.2) |
| All English speakers | Reference | Reference | Reference | Reference |
| Chinese speakers | 7.2 (13.9 to 0) | 5.3 (12.2 to 2.1) | 1.7 (1.2 to 2.3) | 1.0 (0.8 to 1.4) |
| Spanish speakers | 3.0 (12.6 to 7.6) | 3.0 (12.7 to 7.7) | 1.5 (1.0 to 2.3) | 0.9 (0.6 to 1.5) |
| Russian speakers | 1.5 (8.3 to 12.2) | 0.9 (8.9 to 11.8) | 0.8 (0.5 to 1.4) | 0.8 (0.5 to 1.2) |
Multivariate Analyses: Association of Language for Asians and Latinos, and of Ethnicity for English speakers, With Hospital Outcomes (Table 4)
Both Chinese and Spanish speakers had significantly higher odds of 30‐day readmission than their English speaking Asian and Latino counterparts. There were no significant differences in LOS, cost, or 30‐day mortality in this within‐ethnicity analysis. Among English speakers, admissions for patients with Asian ethnicity were 15% shorter and resulted in 9% lower costs than for Whites. While LOS and cost were similar for English‐speaking Latino and White admissions, English‐speaking Latinos had markedly lower odds of 30‐day readmission than their White counterparts. Whereas African‐Americans had 6% shorter LOS, 40% higher odds of readmission and 30% lower odds of mortality at 30‐days than English speaking Whites.
| Language‐Ethnicity Comparisons | LOS, % Difference (95% CI) | Total Cost, % Difference (95% CI) | 30‐Day Readmission,* OR (95% CI) | Mortality, OR (95% CI) |
|---|---|---|---|---|
| ||||
| English speaking Asians | Reference | Reference | Reference | Reference |
| Chinese speakers | 2.2 (7.4 to 12.7) | 0.3 (9.2 to 10.7) | 1.5 (1.0 to 2.3) | 0.8 (0.6 to 1.2) |
| English speaking Latinos | Reference | Reference | Reference | Reference |
| Spanish speakers | 4.5 (16.8 to 9.5) | 1.2 (14.0 to 13.5) | 5.7 (2.4 to 13.2) | 1.2 (0.6 to 2.4) |
| English‐White | Reference | Reference | Reference | Reference |
| English‐African American | 6.2 (11.3 to 0.9) | 4.4 (9.6 to 1.1) | 1.4 (1.1 to 1.7) | 0.6 (0.5 to 0.8) |
| English‐Asian | 14.6 (20.9 to 7.9) | 8.6 (15.4 to 1.4) | 0.8 (0.5 to 1.0) | 1.0 (0.7 to 1.4) |
| English‐Latino | 4.5 (13.5 to 5.4) | 5.0 (14.0 to 5.0) | 0.2 (0.1 to 0.4) | 0.6 (0.4 to 1.0) |
Conclusion/Discussion
Our results indicate that language barriers may contribute to higher readmission rates for non‐English speakers, but that they have less impact on care efficiency or mortality. This finding of an association between language and readmission, without a similar association with efficiency, suggests a potentially communication‐critical step in care.20, 21 Patients with language barriers are more likely to experience adverse events, and those events are often caused by errors in communication.12 It is conceivable that higher readmission risk for Chinese and Spanish speakers in our study was, at least in part, due to gaps in communication that are present in all patient groups, and exacerbated by the presence of a language barrier. This barrier is likely present during hospitalization but magnified at discharge, limiting caregivers' ability to understand patients' needs for home care, while simultaneously limiting patients' understanding of the discharge plan. After discharge, it is also possible that non‐English speakers are less able to communicate their needs as they arise, ormore subtlyfeel less supported by a primarily English speaking healthcare system. As in other clinical arenas,22 it is quite possible that increased access to professional interpreters in the hospital setting, and particularly at the time of discharge, would enhance communication and outcomes for LEP patients. Our interpreter services data showed that the patients in our study had quite limited access to staff professional interpreters.
Our findings differ somewhat from those of John‐Baptiste et al.,11 who found that language barriers contributed to increased LOS for patients with cardiac and major surgical diagnoses. Our study's findings are akin to recent research suggesting that being a monolingual Spanish speaker or receiving interpreter services may not significantly impact LOS or cost of hospitalization,23 and that LOS and in‐hospital mortality do not differ for non‐English speakers and English speakers after acute myocardial infarction.24 These studies, along with our results, suggest that that care efficiency in the hospital may be driven much more by clinical acuity (eg, the need to respond rapidly to urgent clinical signs such as hypotension, fever and respiratory distress) than by adequacy of communication. For example, elderly LEP patients may be even more likely than English speakers to have vigilant family members at the bedside throughout their hospitalization due to their need for communication assistance; these family members can quickly alert hospital staff to concerning changes in the patient's condition.
Our results also suggest the possibility that language and ethnicity are not monolithic concepts, and that even within language and ethnic groups there are potential differences in care pattern. For example, not speaking English may be a surrogate marker for unmeasured factors such as social supports and access to care. Language is intimately associated with culture; it remains plausible that cultural differences between highly acculturated and less acculturated members of a given ethno‐cultural group may have contributed to our observed differences in readmission rates. Differences in culture and associated factors, such as social support or use of multiple hospital systems, may account for lack of higher readmission risk in Russian speakers, while Chinese and Spanish speakers had higher readmission risk.
In addition, our finding that English‐speaking Latinos had lower readmission risk than any other group may be more consistent with their clinical characteristicseg, younger age, fewer comorbiditiesthan with cultural factors. Our finding that African American patients had the highest readmission risk in our hospital was both surprising and concerning. Some of this increased risk may be explained by clinical characteristics, such as higher comorbidities and higher rates of diagnoses leading to frequent admissions (eg, sickle cell disease); however, the reasons for this disparity deserves further investigation.
Our study has limitations. First, our data are administrative, and lack information about patients' educational attainment, social support, acculturation, utilization of other hospital systems, and usual source of care. Despite this, we were able to account for many significant covariates that might contribute to readmission rates, including age, insurance status, gender, comorbidities, and admission to the intensive care unit.2528 Second, our information about patients' English language proficiency is limited. While direct assessments of English proficiency are more accurate ways to determine a patient's ability to communicate with health care providers in English,29 our language validation work conducted in preparation for this study suggests that most of our patients recorded as having a non‐English primary language (87%) also have a low score on a language acculturation scale.
Third, only 14% of our non‐English speaking subjects utilized professional staff interpreters, and we had no information on the use of professional telephonic interpreters, or ad hoc interpretersfamily members, non‐interpreter staff membersand their impact on our results. It is well‐documented that ad hoc interpreters are used frequently in healthcare, particularly in the hospital setting, and thus we can assume this to be true in our study.30, 31 As noted above, it is likely that the advocacy of family members and friends at the bedside helped to minimize potential differences in care efficiency for patients with language barriers. Finally, our study was performed at a single university based hospital and may not produce results which are applicable to other care settings.
Our findings point to several avenues for future research on language barriers and hospitalized patients. First, the field would benefit from an examination of the impact of easy access to professional interpreters during hospitalization on outcomes of hospital care, in particular on readmission rates. Second, there is need for development and assessment of best practices for creating a culture of professional interpreter utilization in the hospital among physicians and nursing staff. Third, investigation of the role of caregiver presence in the hospital room and how this might differ by patient culture, age and language ability may further elucidate some of the differences across language groups observed in our study. Lastly, a more granular investigation of clinician‐patient communication and the importance of interpersonal processes of care on both patient satisfaction and understanding of and adherence to discharge instructions could lead to the development of detailed interventions to enhance this communication and these outcomes as it has done for communication‐sensitive outcomes in the outpatient arena.3234
In summary, our study suggests that higher risk for readmission can be added to the unfortunate list of outcomes which are worsened due to language barriers, pointing to transition from the hospital as a potentially communication‐critical step in care which may be amenable to intervention. Our findings also suggest that this risk can vary even between groups of patients who do not speak English primarily. Whether and to what degree language and communication barriers aloneincluding access to professional interpreters and patient‐centered communicationduring hospitalization, or differences in caregiver social support both during and after hospitalization as well as access to care post‐hospitalization contribute to these findings is a worthy subject of future research.
Acknowledgements
The authors acknowledge Dr. Eliseo J. Prez‐Stable for his mentorship on this project.
- ,. Language Use and English‐Speaking Ability:2000. Available at: http://www.census.gov/prod/2003pubs/c2kbr‐29.pdf. Accessed January 2010.
- U.S. Department of Health and Human Services.2006National Healthcare Disparities Report. AHRQ Publication No. 070012; 2006.
- ,,,.Disparities in health care by race, ethnicity, and language among the insured: findings from a national sample.Med Care.2002;40(1):52–59.
- ,.The effect of physician‐patient communication on mammography utilization by different ethnic groups.Med Care.1991;29(11):1065–1082.
- ,.Language of interview:relevance for research of Southwest Hispanics.Am J Pub Health.1991;81(11):1399–1404.
- ,,,.Is language a barrier to the use of preventive services?J Gen Intern Med.1997;12(8):472–477.
- ,,,.Impact of language barriers on patient satisfaction in an emergency department.JGIM.1999;14:82–87.
- .Patient comprehension of doctor‐patient communication on discharge from the emergency department.J Emerg Med.1997;15(1):1–7.
- ,,, et al.Drug complications in outpatients.J Gen Intern Med.2000;15:149–154.
- .Language concordance as a determinant of patient compliance and emergency room use in patients with asthma.Med Care.1988;26(12):1119–1128.
- ,,,et al.The effect of English language proficiency on length of stay and in‐hospital mortality.J Gen Intern Med.2004;19:221–228.
- ,,,.Language proficiency and adverse events in US hospitals: a pilot study.Int J Qual Health Care.2007;19(2):60–67.
- ,,, et al.Factors associated with discussion of care plans and code status at the time of hospital admission: results from the Multicenter Hospitalist Study.J Hosp Med.2008;3(6):437–445.
- ,,, et al.Quality of care for decompensated heart failure: comparable performance between academic hospitalists and non‐hospitalists.J Gen Intern Med.2008;23(9):1399–1406.
- ,,,.A new method of classifying prognostic comorbidity in longitudinal studies: development and validation.J Chronic Dis.1987;40(5):373–383.
- AHRQ. Healthcare Cost and Utilizlation Project: Tools 132(3):191–200.
- ,,.Free knot splines for logistic models and threshold selection.Comput Methods Programs Biomed.2005;77(1):1–9.
- ,,,,.Statistical methods in epidemiology: a comparison of statistical methods to analyze dose‐response and trend analysis in epidemiologic studies.J Clin Epidemiol.1998;51(12):1223–1233.
- The Care Transitions Project. Health Care Policy and Research, Practitioner Tools. Available at: http://www.caretransitions.org/practitioner_tools.asp.
- AHRQ. Improving safety at the point of care. Available at: http://www.ahrq.gov/qual/pips. Accessed January2010.
- ,,,.Do professional interpreters improve clinical care for patients with limited english proficiency? A systematic review of the literature.Health Serv Res.2007;42(2):727–754.
- ,,.The impact of an enhanced interpreter service intervention on hospital costs and patient satisfaction.J Gen Intern Med.2007;22 Suppl 2:306–311.
- ,,,,.Acute myocardial infarction length of stay and hospital mortality are not associated with language preference.J Gen Intern Med.2008;23(2):190–194.
- ,,.A systematic literature review of factors affecting outcome in older medical patients admitted to hospital.Age Ageing.2004;33(2):110–115.
- ,,,,,.Risk factors and prognostic predictors of unexpected intensive care unit admission within 3 days after ED discharge.Am J Emerg Med.2007;25(9):1009–1014.
- ,.Effect of gender, ethnicity, pulmonary disease, and symptom stability on rehospitalization in patients with heart failure.Am J Cardiol.2007;100(7):1139–1144.
- ,,,.Bouncing back: patterns and predictors of complicated transitions 30 days after hospitalization for acute ischemic stroke.J Am Geriatr Soc.2007;55(3):365–373.
- ,,,,.Identification of limited English proficient patients in clinical care.J Gen Intern Med.2008;23(10):1555–1560.
- ,,,,.Hospital langague services for patients with limited English proficiency: results from a national survey.Health Research October2006.
- ,.Hospitals, Language, and Culture: a Snapshot of the Nation. The Joint Commission and The California Endowment;2007.
- ,,, et al.A randomized controlled trial of interventions to enhance patient‐physician partnership, patient adherence and high blood pressure control among ethnic minorities and poor persons: study protocol NCT00123045.Implement Sci.2009;4:7.
- ,,,,.Interpersonal processes of care and patient satisfaction: do associations differ by race, ethnicity, and language?Health Serv Res.2009;44(4):1326–1344.
- ,,,.Understanding concordance in patient‐physician relationships: personal and ethnic dimensions of shared identity.Ann Fam Med.2008;6(3):198–205.
Copyright © 2010 Society of Hospital Medicine
Hospitalists and Quality of Care
Quality of care in US hospitals is inconsistent and often below accepted standards.1 This observation has catalyzed a number of performance measurement initiatives intended to publicize gaps and spur quality improvement.2 As the field has evolved, organizational factors such as teaching status, ownership model, nurse staffing levels, and hospital volume have been found to be associated with performance on quality measures.1, 3‐7 Hospitalists represent a more recent change in the organization of inpatient care8 that may impact hospital‐level performance. In fact, most hospitals provide financial support to hospitalists, not only for hopes of improving efficiency, but also for improving quality and safety.9
Only a few single‐site studies have examined the impact of hospitalists on quality of care for common medical conditions (ie, pneumonia, congestive heart failure, and acute myocardial infarction), and each has focused on patient‐level effects. Rifkin et al.10, 11 did not find differences between hospitalists' and nonhospitalists' patients in terms of pneumonia process measures. Roytman et al.12 found hospitalists more frequently prescribed afterload‐reducing agents for congestive heart failure (CHF), but other studies have shown no differences in care quality for heart failure.13, 14 Importantly, no studies have examined the role of hospitalists in the care of patients with acute myocardial infarction (AMI). In addition, studies have not addressed the effect of hospitalists at the hospital level to understand whether hospitalists have broader system‐level effects reflected by overall hospital performance.
We hypothesized that the presence of hospitalists within a hospital would be associated with improvements in hospital‐level adherence to publicly reported quality process measures, and having a greater percentage of patients admitted by hospitalists would be associated with improved performance. To test these hypotheses, we linked data from a statewide census of hospitalists with data collected as part of a hospital quality‐reporting initiative.
Materials and Methods
Study Sites
We examined the performance of 209 hospitals (63% of all 334 non‐federal facilities in California) participating in the California Hospital Assessment and Reporting Taskforce (CHART) at the time of the survey. CHART is a voluntary quality reporting initiative that began publicly reporting hospital quality data in January 2006.
Hospital‐level Organizational, Case‐mix, and Quality Data
Hospital organizational characteristics (eg, bed size) were obtained from publicly available discharge and utilization data sets from the California Office of Statewide Health Planning and Development (OSHPD). We also linked hospital‐level patient‐mix data (eg, race) from these OSHPD files.
We obtained quality of care data from CHART for January 2006 through June 2007, the time period corresponding to the survey. Quality metrics included 16 measures collected by the Center for Medicare and Medicaid Services (www.cms.hhs.gov) and extensively used in quality research.1, 4, 13, 15‐17 Rather than define a single measure, we examined multiple process measures, anticipating differential impacts of hospitalists on various processes of care for AMI, CHF, and pneumonia. Measures were further divided among those that are usually measured upon initial presentation to the hospital and those that are measured throughout the entire hospitalization and discharge. This division reflects the division of care in the hospital, where emergency room physicians are likely to have a more critical role for admission processes.
Survey Process
We surveyed all nonfederal, acute care hospitals in California that participated in CHART.2 We first identified contacts at each site via professional society mailing lists. We then sent web‐based surveys to all with available email addresses and a fax/paper survey to the remainder. We surveyed individuals between October 2006 and April 2007 and repeated the process at intervals of 1 to 3 weeks. For remaining nonrespondents, we placed a direct call unless consent to survey had been specifically refused. We contacted the following persons in sequence: (1) hospital executives or administrative leaders; (2) hospital medicine department leaders; (3) admitting emergency room personnel or medical staff officers; and (4) hospital website information. In the case of multiple responses with disagreement, the hospital/hospitalist leader's response was treated as the primary source. At each step, respondents were asked to answer questions only if they had a direct working knowledge of their hospitalist services.
Survey Data
Our key survey question to all respondents included whether the respondents could confirm their hospitals had at least one hospitalist medicine group. Hospital leaders were also asked to participate in a more comprehensive survey of their organizational and clinical characteristics. Within the comprehensive survey, leaders also provided estimates of the percent of general medical patients admitted by hospitalists. This measure, used in prior surveys of hospital leaders,9 was intended to be an easily understood approximation of the intensity of hospitalist utilization in any given hospital. A more rigorous, direct measure was not feasible due to the complexity of obtaining admission data over such a large, diverse set of hospitals.
Process Performance Measures
AMI measures assessed at admission included aspirin and ‐blocker administration within 24 hours of arrival. AMI measures assessed at discharge included aspirin administration, ‐blocker administration, angiotensin converting enzyme inhibitor (ACE‐I) (or angiotensin receptor blocker [ARB]) administration for left ventricular (LV) dysfunction, and smoking cessation counseling. There were no CHF admission measures. CHF discharge measures included assessment of LV function, the use of an ACE‐I or ARB for LV dysfunction, and smoking cessation counseling. Pneumonia admission measures included the drawing of blood cultures prior to the receipt of antibiotics, timely administration of initial antibiotics (<8 hours), and antibiotics consistent with recommendations. Pneumonia discharge measures included pneumococcal vaccination, flu vaccination, and smoking cessation counseling.
For each performance measure, we quantified the percentage of missed quality opportunities, defined as the number of patients who did not receive a care process divided by the number of eligible patients, multiplied by 100. In addition, we calculated composite scores for admission and discharge measures across each condition. We summed the numerators and denominators of individual performance measures to generate a disease‐specific composite numerator and denominator. Both individual and composite scores were produced using methodology outlined by the Center for Medicare & Medicaid Services.18 In order to retain as representative a sample of hospitals as possible, we calculated composite scores for hospitals that had a minimum of 25 observations in at least 2 of the quality indicators that made up each composite score.
Statistical Analysis
We used chi‐square tests, Student t tests, and Mann‐Whitney tests, where appropriate, to compare hospital‐level characteristics of hospitals that utilized hospitalists vs. those that did not. Similar analyses were performed among the subset of hospitals that utilized hospitalists. Among this subgroup of hospitals, we compared hospital‐level characteristics between hospitals that provided information regarding the percent of patients admitted by hospitalists vs. those who did not provide this information.
We used multivariable, generalized linear regression models to assess the relationship between having at least 1 hospitalist group and the percentage of missed quality of care measures. Because percentages were not normally distributed (ie, a majority of hospitals had few missed opportunities, while a minority had many), multivariable models employed log‐link functions with a gamma distribution.19, 20 Coefficients for our key predictor (presence of hospitalists) were transformed back to the original units (percentage of missed quality opportunities) so that a positive coefficient represented a higher number of quality measures missed relative to hospitals without hospitalists. Models were adjusted for factors previously reported to be associated with care quality. Hospital organizational characteristics included the number of beds, teaching status, registered nursing (RN) hours per adjusted patient day, and hospital ownership (for‐profit vs. not‐for‐profit). Hospital patient mix factors included annual percentage of admissions by insurance status (Medicare, Medicaid, other), annual percentage of admissions by race (white vs. nonwhite), annual percentage of do‐not‐resuscitate status at admission, and mean diagnosis‐related group‐based case‐mix index.21 We additionally adjusted for the number of cardiac catheterizations, a measure that moderately correlates with the number of cardiologists and technology utilization.22‐24 In our subset analysis among those hospitals with hospitalists, our key predictor for regression analyses was the percentage of patients admitted by hospitalists. For ease of interpretation, the percentage of patients admitted by hospitalists was centered on the mean across all respondent hospitals, and we report the effect of increasing by 10% the percentage of patients admitted by hospitalists. Models were adjusted for the same hospital organizational characteristics listed above. For those models, a positive coefficient also meant a higher number of measures missed.
For both sets of predictors, we additionally tested for the presence of interactions between the predictors and hospital bed size (both continuous as well as dichotomized at 150 beds) in composite measure performance, given the possibility that any hospitalist effect may be greater among smaller, resource‐limited hospitals. Tests for interaction were performed with the likelihood ratio test. In addition, to minimize any potential bias or loss of power that might result from limiting the analysis to hospitals with complete data, we used the multivariate imputation by chained equations method, as implemented in STATA 9.2 (StataCorp, College Station, TX), to create 10 imputed datasets.25 Imputation of missing values was restricted to confounding variables. Standard methods were then used to combine results over the 10 imputed datasets. We also applied Bonferroni corrections to composite measure tests based on the number of composites generated (n = 5). Thus, for the 5 inpatient composites created, standard definitions of significance (P 0.05) were corrected by dividing composite P values by 5, requiring P 0.01 for significance. The institutional review board of the University of California, San Francisco, approved the study. All analyses were performed using STATA 9.2.
Results
Characteristics of Participating Sites
There were 209 eligible hospitals. All 209 (100%) hospitals provided data about the presence or absence of hospitalists via at least 1 of our survey strategies. The majority of identification of hospitalist utilization was via contact with either hospital or hospitalist leaders, n = 147 (70.3%). Web‐sites informed hospitalist prevalence in only 3 (1.4%) hospitals. There were 8 (3.8%) occurrences of disagreement between sources, all of which had available hospital/hospitalist leader responses. Only 1 (0.5%) hospital did not have the minimum 25 patients eligible for any disease‐specific quality measures during the data reporting period. Collectively, the remaining 208 hospitals accounted for 81% of California's acute care hospital population.
Comparisons of Sites With Hospitalists and Those Without
A total of 170 hospitals (82%) participating in CHART used hospitalists. Hospitals with and without hospitalists differed by a variety of characteristics (Table 1). Sites with hospitalists were larger, less likely to be for‐profit, had more registered nursing hours per day, and performed more cardiac catheterizations.
| Characteristic | Hospitals Without Hospitalists (n = 38) | Hospitals With Hospitalists (n = 170) | P Value* |
|---|---|---|---|
| |||
| Number of beds, n (% of hospitals) | <0.001 | ||
| 0‐99 | 16 (42.1) | 14 (8.2) | |
| 100‐199 | 8 (21.1) | 44 (25.9) | |
| 200‐299 | 7 (18.4) | 42 (24.7) | |
| 300+ | 7 (18.4) | 70 (41.2) | |
| For profit, n (% of hospitals) | 9 (23.7) | 18 (10.6) | 0.03 |
| Teaching hospital, n (% of hospitals) | 7 (18.4) | 55 (32.4) | 0.09 |
| RN hours per adjusted patient day, number of hours (IQR) | 7.4 (5.7‐8.6) | 8.5 (7.4‐9.9) | <0.001 |
| Annual cardiac catheterizations, n (IQR) | 0 (0‐356) | 210 (0‐813) | 0.007 |
| Hospital total census days, n (IQR) | 37161 (14910‐59750) | 60626 (34402‐87950) | <0.001 |
| ICU total census, n (IQR) | 2193 (1132‐4289) | 3855 (2489‐6379) | <0.001 |
| Medicare insurance, % patients (IQR) | 36.9 (28.5‐48.0) | 35.3(28.2‐44.3) | 0.95 |
| Medicaid insurance, % patients (IQR) | 21.0 (12.7‐48.3) | 16.6 (5.6‐27.6) | 0.02 |
| Race, white, % patients (IQR) | 53.7 (26.0‐82.7) | 59.1 (45.6‐74.3) | 0.73 |
| DNR at admission, % patients (IQR) | 3.6 (2.0‐6.4) | 4.4 (2.7‐7.1) | 0.12 |
| Case‐mix index, index (IQR) | 1.05 (0.90‐1.21) | 1.13 (1.01‐1.26) | 0.11 |
Relationship Between Hospitalist Group Utilization and the Percentage of Missed Quality Opportunities
Table 2 shows the frequency of missed quality opportunities in sites with hospitalists compared to those without. In general, for both individual and composite measures of quality, multivariable adjustment modestly attenuated the observed differences between the 2 groups of hospitals. We present only the more conservative adjusted estimates.
| Quality Measure | Number of Hospitals | Adjusted Mean % Missed Quality Opportunities (95% CI) | Difference With Hospitalists | Relative % Change | P Value | |
|---|---|---|---|---|---|---|
| Hospitals Without Hospitalists | Hospitals With Hospitalists | |||||
| ||||||
| Acute myocardial infarction | ||||||
| Admission measures | ||||||
| Aspirin at admission | 193 | 3.7 (2.4‐5.1) | 3.4 (2.3‐4.4) | 0.3 | 10.0 | 0.44 |
| Beta‐blocker at admission | 186 | 7.8 (4.7‐10.9) | 6.4 (4.4‐8.3) | 1.4 | 18.3 | 0.19 |
| AMI admission composite | 186 | 5.5 (3.6‐7.5) | 4.8 (3.4‐6.1) | 0.7 | 14.3 | 0.26 |
| Hospital/discharge measures | ||||||
| Aspirin at discharge | 173 | 7.5 (4.5‐10.4) | 5.2 (3.4‐6.9) | 2.3 | 31.0 | 0.02 |
| Beta‐blocker at discharge | 179 | 6.6 (3.8‐9.4) | 5.9 (3.6‐8.2) | 0.7 | 9.6 | 0.54 |
| ACE‐I/ARB at discharge | 119 | 20.7 (9.5‐31.8) | 11.8 (6.6‐17.0) | 8.9 | 43.0 | 0.006 |
| Smoking cessation counseling | 193 | 3.8 (2.4‐5.1) | 3.4 (2.4‐4.4) | 0.4 | 10.0 | 0.44 |
| AMI hospital/discharge composite | 179 | 6.4 (4.1‐8.6) | 5.3 (3.7‐6.8) | 1.1 | 17.6 | 0.16 |
| Congestive heart failure | ||||||
| Hospital/discharge measures | ||||||
| Ejection fraction assessment | 208 | 12.6 (7.7‐17.6) | 6.5 (4.6‐8.4) | 6.1 | 48.2 | <0.001 |
| ACE‐I/ARB at discharge | 201 | 14.7 (10.0‐19.4) | 12.9 (9.8‐16.1) | 1.8 | 12.1 | 0.31 |
| Smoking cessation counseling | 168 | 9.1 (2.9‐15.4) | 9.0 (4.2‐13.8) | 0.1 | 1.8 | 0.98 |
| CHF hospital/discharge composite | 201 | 12.2 (7.9‐16.5) | 8.2 (6.2‐10.2) | 4.0 | 33.1 | 0.006* |
| Pneumonia | ||||||
| Admission measures | ||||||
| Blood culture before antibiotics | 206 | 12.0 (9.1‐14.9) | 10.9 (8.8‐13.0) | 1.1 | 9.1 | 0.29 |
| Timing of antibiotics <8 hours | 208 | 5.8 (4.1‐7.5) | 6.2 (4.7‐7.7) | 0.4 | 6.9 | 0.56 |
| Initial antibiotic consistent with recommendations | 207 | 15.0 (11.6‐18.6) | 13.8 (10.9‐16.8) | 1.2 | 8.1 | 0.27 |
| Pneumonia admission composite | 207 | 10.5 (8.5‐12.5) | 9.9 (8.3‐11.5) | 0.6 | 5.9 | 0.37 |
| Hospital/discharge measures | ||||||
| Pneumonia vaccine | 208 | 29.4 (19.5‐39.2) | 27.1 (19.9‐34.3) | 2.3 | 7.7 | 0.54 |
| Influenza vaccine | 207 | 36.9 (25.4‐48.4) | 35.0 (27.0‐43.1) | 1.9 | 5.2 | 0.67 |
| Smoking cessation counseling | 196 | 15.4 (7.8‐23.1) | 13.9 (8.9‐18.9) | 1.5 | 10.2 | 0.59 |
| Pneumonia hospital/discharge composite | 207 | 29.6 (20.5‐38.7) | 27.3 (20.9‐33.6) | 2.3 | 7.8 | 0.51 |
Compared to hospitals without hospitalists, those with hospitalists did not have any statistically significant differences in the individual and composite admission measures for each of the disease processes. In contrast, there were statistically significant differences between hospitalist and nonhospitalist sites for many individual cardiac processes of care that typically occur after admission from the emergency room (ie, LV function assessment for CHF) or those that occurred at discharge (ie, aspirin and ACE‐I/ARB at discharge for AMI). Similarly, the composite discharge scores for AMI and CHF revealed better overall process measure performance at sites with hospitalists, although the AMI composite did not meet statistical significance. There were no statistically significant differences between groups for the pneumonia process measures assessed at discharge. In addition, for composite measures there were no statistically significant interactions between hospitalist prevalence and bed size, although there was a trend (P = 0.06) for the CHF discharge composite, with a larger effect of hospitalists among smaller hospitals.
Percent of Patients Admitted by Hospitalists
Of the 171 hospitals with hospitalists, 71 (42%) estimated the percent of patients admitted by their hospitalist physicians. Among the respondents, the mean and median percentages of medical patients admitted by hospitalists were 51% (SD = 25%) and 49% (IQR = 30‐70%), respectively. Thirty hospitals were above the sample mean. Compared to nonrespondent sites, respondent hospitals took care of more white patients; otherwise, respondent and nonrespondent hospitals were similar in terms of bed size, location, performance across each measure, and other observable characteristics (Supporting Information, Appendix 1).
Relationship Between the Estimated Percentages of Medical Patients Admitted by Hospitalists and Missed Quality Opportunities
Table 3 displays the change in missed quality measures associated with each additional 10% of patients estimated to be admitted by hospitalists. A higher estimated percentage of patients admitted by hospitalists was associated with statistically significant improvements in quality of care across a majority of individual measures and for all composite discharge measures regardless of condition. For example, every 10% increase in the mean estimated number of patients admitted by hospitalists was associated with a mean of 0.6% (P < 0.001), 0.5% (P = 0.004), and 1.5% (P = 0.006) fewer missed quality opportunities for AMI, CHF, and pneumonia discharge process measures composites, respectively. In addition, for these composite measures, there were no statistically significant interactions between the estimated percentage of patients admitted by hospitalists and bed size (dichotomized at 150 beds), although there was a trend (P = 0.09) for the AMI discharge composite, with a larger effect of hospitalists among smaller hospitals.
| Quality Measure | Number of Hospitals | Adjusted % Missed Quality Opportunities (95% CI) | Difference With Hospitalists | Relative Percent Change | P Value | |
|---|---|---|---|---|---|---|
| Among Hospitals With Mean % of Patients Admitted by Hospitalists | Among Hospitals With Mean + 10% of Patients Admitted by Hospitalists | |||||
| ||||||
| Acute myocardial infarction | ||||||
| Admission measures | ||||||
| Aspirin at admission | 70 | 3.4 (2.3‐4.6) | 3.1 (2.0‐3.1) | 0.3 | 10.2 | 0.001 |
| Beta‐blocker at admission | 65 | 5.8 (3.4‐8.2) | 5.1 (3.0‐7.3) | 0.7 | 11.9 | <0.001 |
| AMI admission composite | 65 | 4.5 (2.9‐6.1) | 4.0 (2.6‐5.5) | 0.5 | 11.1 | <0.001* |
| Hospital/discharge measures | ||||||
| Aspirin at discharge | 62 | 5.1 (3.3‐6.9) | 4.6 (3.1‐6.2) | 0.5 | 9.0 | 0.03 |
| Beta‐blocker at discharge | 63 | 5.1 (2.9‐7.2) | 4.3 (2.5‐6.0) | 0.8 | 15.4 | <0.001 |
| ACE‐I/ARB at discharge | 44 | 11.4 (6.2‐16.6) | 10.3 (5.4‐15.1) | 1.1 | 10.0 | 0.02 |
| Smoking cessation counseling | 70 | 3.4 (2.3‐4.6) | 3.1 (2.0‐4.1) | 0.3 | 10.2 | 0.001 |
| AMI hospital/discharge composite | 63 | 5.0 (3.3‐6.7) | 4.4 (3.0‐5.8) | 0.6 | 11.3 | 0.001* |
| Congestive heart failure | ||||||
| Hospital/discharge measures | ||||||
| Ejection fraction assessment | 71 | 5.9 (4.1‐7.6) | 5.6 (3.9‐7.2) | 0.3 | 2.9 | 0.07 |
| ACE‐I/ARB at discharge | 70 | 12.3 (8.6‐16.0) | 11.4 (7.9‐15.0) | 0.9 | 7.1 | 0.008* |
| Smoking cessation counseling | 56 | 8.4 (4.1‐12.6) | 8.2 (4.2‐12.3) | 0.2 | 1.7 | 0.67 |
| CHF hospital/discharge composite | 70 | 7.7 (5.8‐9.6) | 7.2 (5.4‐9.0) | 0.5 | 6.0 | 0.004* |
| Pneumonia | ||||||
| Admission measures | ||||||
| Timing of antibiotics <8 hours | 71 | 5.9 (4.2‐7.6) | 5.9 (4.1‐7.7) | 0.0 | 0.0 | 0.98 |
| Blood culture before antibiotics | 71 | 10.0 (8.0‐12.0) | 9.8 (7.7‐11.8) | 0.2 | 2.6 | 0.18 |
| Initial antibiotic consistent with recommendations | 71 | 13.3 (10.4‐16.2) | 12.9 (9.9‐15.9) | 0.4 | 2.8 | 0.20 |
| Pneumonia admission composite | 71 | 9.4 (7.7‐11.1) | 9.2 (7.6‐10.9) | 0.2 | 1.8 | 0.23 |
| Hospital/discharge measures | ||||||
| Pneumonia vaccine | 71 | 27.0 (19.2‐34.8) | 24.7 (17.2‐32.2) | 2.3 | 8.4 | 0.006 |
| Influenza vaccine | 71 | 34.1 (25.9‐42.2) | 32.6 (24.7‐40.5) | 1.5 | 4.3 | 0.03 |
| Smoking cessation counseling | 67 | 15.2 (9.8‐20.7) | 15.0 (9.6‐20.4) | 0.2 | 2.0 | 0.56 |
| Pneumonia hospital/discharge composite | 71 | 26.7 (20.3‐33.1) | 25.2 (19.0‐31.3) | 1.5 | 5.8 | 0.006* |
In order to test the robustness of our results, we carried out 2 secondary analyses. First, we used multivariable models to generate a propensity score representing the predicted probability of being assigned to a hospital with hospitalists. We then used the propensity score as an additional covariate in subsequent multivariable models. In addition, we performed a complete‐case analysis (including only hospitals with complete data, n = 204) as a check on the sensitivity of our results to missing data. Neither analysis produced results substantially different from those presented.
Discussion
In this cross‐sectional analysis of hospitals participating in a voluntary quality reporting initiative, hospitals with at least 1 hospitalist group had fewer missed discharge care process measures for CHF, even after adjusting for hospital‐level characteristics. In addition, as the estimated percentage of patients admitted by hospitalists increased, the percentage of missed quality opportunities decreased across all measures. The observed relationships were most apparent for measures that could be completed at any time during the hospitalization and at discharge. While it is likely that hospitalists are a marker of a hospital's ability to invest in systems (and as a result, care improvement initiatives), the presence of a potential dose‐response relationship suggests that hospitalists themselves may have a role in improving processes of care.
Our study suggests a generally positive, but mixed, picture of hospitalists' effects on quality process measure performance. Lack of uniformity across measures may depend on the timing of the process measure (eg, whether or not the process is measured at admission or discharge). For example, in contrast to admission process measures, we more commonly observed a positive association between hospitalists and care quality on process measures targeting processes that generally took place later in hospitalization or at discharge. Many admission process measures (eg, door to antibiotic time, blood cultures, and appropriate initial antibiotics) likely occurred prior to hospitalist involvement in most cases and were instead under the direction of emergency medicine physicians. Performance on these measures would not be expected to relate to use of hospitalists, and that is what we observed.
In addition to the timing of when a process was measured or took place, associations between hospitalists and care quality vary by disease. The apparent variation in impact of hospitalists by disease (more impact for cardiac conditions, less for pneumonia) may relate primarily to the characteristics of the processes of care that were measured for each condition. For example, one‐half of the pneumonia process measures related to care occurring within a few hours of admission, while the other one‐half (smoking cessation advice and streptococcal and influenza vaccines) were often administered per protocol or by nonphysician providers.26‐29 However, more of the cardiac measures required physician action (eg, prescription of an ACE‐I at discharge). Alternatively, unmeasured confounders important in the delivery of cardiac care might play an important role in the relationship between hospitalists and cardiac process measure performance.
Our approach to defining hospitalists bears mention as well. While a dichotomous measure of having hospitalists available was only statistically significant for the single CHF discharge composite measure, our measure of hospitalist availabilitythe percentage of patients admitted by hospitalistswas more strongly associated with a larger number of quality measures. Contrast between the dichotomous and continuous measures may have statistical explanations (the power to see differences between 2 groups is more limited with use of a binary predictor, which itself can be subject to bias),30 but may also indicate a dose‐response relationship. A larger number of admissions to hospitalists may help standardize practices, as care is concentrated in a smaller number of physicians' hands. Moreover, larger hospitalist programs may be more likely to have implemented care standardization or quality improvement processes or to have been incorporated into (or lead) hospitals' quality infrastructures. Finally, presence of larger hospitalist groups may be a marker for a hospital's capacity to make hospital‐wide investments in improvement. However, the association between the percentage of patients admitted by hospitalists and care quality persisted even after adjustment for many measures plausibly associated with ability to invest in care quality.
Our study has several limitations. First, although we used a widely accepted definition of hospitalists endorsed by the Society of Hospital Medicine, there are no gold standard definitions for a hospitalist's job description or skill set. As a result, it is possible that a model utilizing rotating internists (from a multispecialty group) might have been misidentified as a hospitalist model. Second, our findings represent a convenience sample of hospitals in a voluntary reporting initiative (CHART) and may not be applicable to hospitals that are less able to participate in such an endeavor. CHART hospitals are recognized to be better performers than the overall California population of hospitals, potentially decreasing variability in our quality of care measures.2 Third, there were significant differences between our comparison groups within the CHART hospitals, including sample size. Although we attempted to adjust our analyses for many important potential confounders and applied conservative measures to assess statistical significance, given the baseline differences, we cannot rule out the possibility of residual confounding by unmeasured factors. Fourth, as described above, this observational study cannot provide robust evidence to support conclusions regarding causality. Fifth, the estimation of the percent of patients admitted by hospitalists is unvalidated and based upon self‐reported and incomplete (41% of respondents) data. We are somewhat reassured by the fact that respondents and nonresponders were similar across all hospital characteristics, as well as outcomes. Sixth, misclassification of the estimated percentage of patients admitted by hospitalists may have influenced our results. Although possible, misclassification often biases results toward the null, potentially weakening any observed association. Given that our respondents were not aware of our hypotheses, there is no reason to expect recall issues to bias the results one way or the other. Finally, for many performance measures, overall performance was excellent among all hospitals (eg, aspirin at admission) with limited variability, thus limiting the ability to assess for differences.
In summary, in a large, cross‐sectional study of California hospitals participating in a voluntary quality reporting initiative, the presence of hospitalists was associated with modest improvements in hospital‐level performance of quality process measures. In addition, we found a relationship between the percentage of patients admitted by hospitalists and improved process measure adherence. Although we cannot determine causality, our data support the hypothesis that dedicated hospital physicians can positively affect the quality of care. Future research should examine this relationship in other settings and should address causality using broader measures of quality including both processes and outcomes.
Acknowledgements
The authors acknowledge Teresa Chipps, BS, Center for Health Services Research, Division of General Internal Medicine and Public Health, Department of Medicine, Vanderbilt University, Nashville, TN, for her administrative and editorial assistance in the preparation of this manuscript.
- ,,,.Care in U.S. hospitals—the Hospital Quality Alliance Program.N Engl J Med.2005;353:265–274.
- CalHospitalCompare.org: online report card simplifies the search for quality hospital care. Available at: http://www.chcf.org/topics/hospitals/index.cfm?itemID=131387. Accessed September 2009.
- ,,, et al.Hospital characteristics and quality of care.JAMA.1992;268:1709–1714.
- ,,,,.Patient and hospital characteristics associated with recommended processes of care for elderly patients hospitalized with pneumonia: results from the Medicare quality indicator system pneumonia module.Arch Intern Med.2002;162:827–833.
- ,,, et al.A systematic review and meta‐analysis of studies comparing mortality rates of private for‐profit and private not‐for‐profit hospitals.CMAJ.2002;166:1399–1406.
- ,.Teaching hospitals and quality of care: a review of the literature.Milbank Q.2002;80:569–593.
- ,,,,.Nurse‐staffing levels and the quality of care in hospitals.N Engl J Med.2002;346:1715–1722.
- ,,,.Growth in the care of older patients by hospitalists in the United States.N Engl J Med.2009;360:1102–1112.
- ,,,.Health care market trends and the evolution of hospitalist use and roles.J Gen Intern Med.2005;20:101–107.
- ,,,.Comparison of processes and outcomes of pneumonia care between hospitalists and community‐based primary care physicians.Mayo Clin Proc.2002;77:1053–1058.
- ,,,.Comparison of hospitalists and nonhospitalists regarding core measures of pneumonia care.Am J Manag Care.2007;13:129–132.
- ,,.Comparison of practice patterns of hospitalists and community physicians in the care of patients with congestive heart failure.J Hosp Med.2008;3:35–41.
- ,,, et al.Quality of care for decompensated heart failure: comparable performance between academic hospitalists and non‐hospitalists.J Gen Intern Med.2008;23:1399–1406.
- ,,,,.Quality of care for patients hospitalized with heart failure: assessing the impact of hospitalists.Arch Intern Med.2002;162:1251–1256.
- ,,,.The inverse relationship between mortality rates and performance in the Hospital Quality Alliance measures.Health Aff.2007;26:1104–1110.
- ,,,,.Does the Leapfrog program help identify high‐quality hospitals?Jt Comm J Qual Patient Saf.2008;34:318–325.
- ,,,,,.Outcomes of care by hospitalists, general internists, and family physicians.N Engl J Med.2007;357:2589–2600.
- CMS HQI demonstration project—composite quality score methodology overview. Available at: http://www.cms.hhs.gov/HospitalQualityInits/downloads/HospitalCompositeQualityScoreMethodologyOverview.pdf. Accessed September 2009.
- ,,.Modeling risk using generalized linear models.J Health Econ.1999;18:153–171.
- ,,.Generalized modeling approaches to risk adjustment of skewed outcomes data.J Health Econ.2005;24:465–488.
- ,,, et al.Quality of care for the treatment of acute medical conditions in US hospitals.Arch Intern Med.2006;166:2511–2517.
- ,,, et al.The Dartmouth Atlas of Cardiovascular Health Care.Chicago:AHA Press;1999. Current data from the Dartmouth Institute for Health Policy and Clinical Practice, Lebanon, NH. Available at: http://www.dartmouthatlas.org/atlases/atlas_ series.shtm. Accessed September 2009.
- ,,.Differences in per capita rates of revascularization and in choice of revascularization procedure for eleven states.BMC Health Serv Res.2006;6:35.
- ,,.The relationship between physician supply, cardiovascular health service use and cardiac disease burden in Ontario: supply‐need mismatch.Can J Card.2008;24:187.
- .Multiple imputation: a primer.Stat Methods Med Res.1999;8:3–15.
- .Nursing intervention and smoking cessation: Meta‐analysis update.Heart Lung.2006;35:147–163.
- .Ten‐year durability and success of an organized program to increase influenza and pneumococcal vaccination rates among high‐risk adults.Am J Med.1998;105:385–392.
- ,,, et al.Role of student pharmacist interns in hospital‐based standing orders pneumococcal vaccination program.J Am Pharm Assoc.2007;47:404–409.
- ,,,.Effect of a pharmacist‐managed program of pneumococcal and influenza immunization on vaccination rates among adult inpatients.Am J Health Syst Pharm.2003;60:1767–1771.
- ,,.Dichotomizing continuous predictors in multiple regression: a bad idea.Stat Med.2006;25:127–141.
Quality of care in US hospitals is inconsistent and often below accepted standards.1 This observation has catalyzed a number of performance measurement initiatives intended to publicize gaps and spur quality improvement.2 As the field has evolved, organizational factors such as teaching status, ownership model, nurse staffing levels, and hospital volume have been found to be associated with performance on quality measures.1, 3‐7 Hospitalists represent a more recent change in the organization of inpatient care8 that may impact hospital‐level performance. In fact, most hospitals provide financial support to hospitalists, not only for hopes of improving efficiency, but also for improving quality and safety.9
Only a few single‐site studies have examined the impact of hospitalists on quality of care for common medical conditions (ie, pneumonia, congestive heart failure, and acute myocardial infarction), and each has focused on patient‐level effects. Rifkin et al.10, 11 did not find differences between hospitalists' and nonhospitalists' patients in terms of pneumonia process measures. Roytman et al.12 found hospitalists more frequently prescribed afterload‐reducing agents for congestive heart failure (CHF), but other studies have shown no differences in care quality for heart failure.13, 14 Importantly, no studies have examined the role of hospitalists in the care of patients with acute myocardial infarction (AMI). In addition, studies have not addressed the effect of hospitalists at the hospital level to understand whether hospitalists have broader system‐level effects reflected by overall hospital performance.
We hypothesized that the presence of hospitalists within a hospital would be associated with improvements in hospital‐level adherence to publicly reported quality process measures, and having a greater percentage of patients admitted by hospitalists would be associated with improved performance. To test these hypotheses, we linked data from a statewide census of hospitalists with data collected as part of a hospital quality‐reporting initiative.
Materials and Methods
Study Sites
We examined the performance of 209 hospitals (63% of all 334 non‐federal facilities in California) participating in the California Hospital Assessment and Reporting Taskforce (CHART) at the time of the survey. CHART is a voluntary quality reporting initiative that began publicly reporting hospital quality data in January 2006.
Hospital‐level Organizational, Case‐mix, and Quality Data
Hospital organizational characteristics (eg, bed size) were obtained from publicly available discharge and utilization data sets from the California Office of Statewide Health Planning and Development (OSHPD). We also linked hospital‐level patient‐mix data (eg, race) from these OSHPD files.
We obtained quality of care data from CHART for January 2006 through June 2007, the time period corresponding to the survey. Quality metrics included 16 measures collected by the Center for Medicare and Medicaid Services (www.cms.hhs.gov) and extensively used in quality research.1, 4, 13, 15‐17 Rather than define a single measure, we examined multiple process measures, anticipating differential impacts of hospitalists on various processes of care for AMI, CHF, and pneumonia. Measures were further divided among those that are usually measured upon initial presentation to the hospital and those that are measured throughout the entire hospitalization and discharge. This division reflects the division of care in the hospital, where emergency room physicians are likely to have a more critical role for admission processes.
Survey Process
We surveyed all nonfederal, acute care hospitals in California that participated in CHART.2 We first identified contacts at each site via professional society mailing lists. We then sent web‐based surveys to all with available email addresses and a fax/paper survey to the remainder. We surveyed individuals between October 2006 and April 2007 and repeated the process at intervals of 1 to 3 weeks. For remaining nonrespondents, we placed a direct call unless consent to survey had been specifically refused. We contacted the following persons in sequence: (1) hospital executives or administrative leaders; (2) hospital medicine department leaders; (3) admitting emergency room personnel or medical staff officers; and (4) hospital website information. In the case of multiple responses with disagreement, the hospital/hospitalist leader's response was treated as the primary source. At each step, respondents were asked to answer questions only if they had a direct working knowledge of their hospitalist services.
Survey Data
Our key survey question to all respondents included whether the respondents could confirm their hospitals had at least one hospitalist medicine group. Hospital leaders were also asked to participate in a more comprehensive survey of their organizational and clinical characteristics. Within the comprehensive survey, leaders also provided estimates of the percent of general medical patients admitted by hospitalists. This measure, used in prior surveys of hospital leaders,9 was intended to be an easily understood approximation of the intensity of hospitalist utilization in any given hospital. A more rigorous, direct measure was not feasible due to the complexity of obtaining admission data over such a large, diverse set of hospitals.
Process Performance Measures
AMI measures assessed at admission included aspirin and ‐blocker administration within 24 hours of arrival. AMI measures assessed at discharge included aspirin administration, ‐blocker administration, angiotensin converting enzyme inhibitor (ACE‐I) (or angiotensin receptor blocker [ARB]) administration for left ventricular (LV) dysfunction, and smoking cessation counseling. There were no CHF admission measures. CHF discharge measures included assessment of LV function, the use of an ACE‐I or ARB for LV dysfunction, and smoking cessation counseling. Pneumonia admission measures included the drawing of blood cultures prior to the receipt of antibiotics, timely administration of initial antibiotics (<8 hours), and antibiotics consistent with recommendations. Pneumonia discharge measures included pneumococcal vaccination, flu vaccination, and smoking cessation counseling.
For each performance measure, we quantified the percentage of missed quality opportunities, defined as the number of patients who did not receive a care process divided by the number of eligible patients, multiplied by 100. In addition, we calculated composite scores for admission and discharge measures across each condition. We summed the numerators and denominators of individual performance measures to generate a disease‐specific composite numerator and denominator. Both individual and composite scores were produced using methodology outlined by the Center for Medicare & Medicaid Services.18 In order to retain as representative a sample of hospitals as possible, we calculated composite scores for hospitals that had a minimum of 25 observations in at least 2 of the quality indicators that made up each composite score.
Statistical Analysis
We used chi‐square tests, Student t tests, and Mann‐Whitney tests, where appropriate, to compare hospital‐level characteristics of hospitals that utilized hospitalists vs. those that did not. Similar analyses were performed among the subset of hospitals that utilized hospitalists. Among this subgroup of hospitals, we compared hospital‐level characteristics between hospitals that provided information regarding the percent of patients admitted by hospitalists vs. those who did not provide this information.
We used multivariable, generalized linear regression models to assess the relationship between having at least 1 hospitalist group and the percentage of missed quality of care measures. Because percentages were not normally distributed (ie, a majority of hospitals had few missed opportunities, while a minority had many), multivariable models employed log‐link functions with a gamma distribution.19, 20 Coefficients for our key predictor (presence of hospitalists) were transformed back to the original units (percentage of missed quality opportunities) so that a positive coefficient represented a higher number of quality measures missed relative to hospitals without hospitalists. Models were adjusted for factors previously reported to be associated with care quality. Hospital organizational characteristics included the number of beds, teaching status, registered nursing (RN) hours per adjusted patient day, and hospital ownership (for‐profit vs. not‐for‐profit). Hospital patient mix factors included annual percentage of admissions by insurance status (Medicare, Medicaid, other), annual percentage of admissions by race (white vs. nonwhite), annual percentage of do‐not‐resuscitate status at admission, and mean diagnosis‐related group‐based case‐mix index.21 We additionally adjusted for the number of cardiac catheterizations, a measure that moderately correlates with the number of cardiologists and technology utilization.22‐24 In our subset analysis among those hospitals with hospitalists, our key predictor for regression analyses was the percentage of patients admitted by hospitalists. For ease of interpretation, the percentage of patients admitted by hospitalists was centered on the mean across all respondent hospitals, and we report the effect of increasing by 10% the percentage of patients admitted by hospitalists. Models were adjusted for the same hospital organizational characteristics listed above. For those models, a positive coefficient also meant a higher number of measures missed.
For both sets of predictors, we additionally tested for the presence of interactions between the predictors and hospital bed size (both continuous as well as dichotomized at 150 beds) in composite measure performance, given the possibility that any hospitalist effect may be greater among smaller, resource‐limited hospitals. Tests for interaction were performed with the likelihood ratio test. In addition, to minimize any potential bias or loss of power that might result from limiting the analysis to hospitals with complete data, we used the multivariate imputation by chained equations method, as implemented in STATA 9.2 (StataCorp, College Station, TX), to create 10 imputed datasets.25 Imputation of missing values was restricted to confounding variables. Standard methods were then used to combine results over the 10 imputed datasets. We also applied Bonferroni corrections to composite measure tests based on the number of composites generated (n = 5). Thus, for the 5 inpatient composites created, standard definitions of significance (P 0.05) were corrected by dividing composite P values by 5, requiring P 0.01 for significance. The institutional review board of the University of California, San Francisco, approved the study. All analyses were performed using STATA 9.2.
Results
Characteristics of Participating Sites
There were 209 eligible hospitals. All 209 (100%) hospitals provided data about the presence or absence of hospitalists via at least 1 of our survey strategies. The majority of identification of hospitalist utilization was via contact with either hospital or hospitalist leaders, n = 147 (70.3%). Web‐sites informed hospitalist prevalence in only 3 (1.4%) hospitals. There were 8 (3.8%) occurrences of disagreement between sources, all of which had available hospital/hospitalist leader responses. Only 1 (0.5%) hospital did not have the minimum 25 patients eligible for any disease‐specific quality measures during the data reporting period. Collectively, the remaining 208 hospitals accounted for 81% of California's acute care hospital population.
Comparisons of Sites With Hospitalists and Those Without
A total of 170 hospitals (82%) participating in CHART used hospitalists. Hospitals with and without hospitalists differed by a variety of characteristics (Table 1). Sites with hospitalists were larger, less likely to be for‐profit, had more registered nursing hours per day, and performed more cardiac catheterizations.
| Characteristic | Hospitals Without Hospitalists (n = 38) | Hospitals With Hospitalists (n = 170) | P Value* |
|---|---|---|---|
| |||
| Number of beds, n (% of hospitals) | <0.001 | ||
| 0‐99 | 16 (42.1) | 14 (8.2) | |
| 100‐199 | 8 (21.1) | 44 (25.9) | |
| 200‐299 | 7 (18.4) | 42 (24.7) | |
| 300+ | 7 (18.4) | 70 (41.2) | |
| For profit, n (% of hospitals) | 9 (23.7) | 18 (10.6) | 0.03 |
| Teaching hospital, n (% of hospitals) | 7 (18.4) | 55 (32.4) | 0.09 |
| RN hours per adjusted patient day, number of hours (IQR) | 7.4 (5.7‐8.6) | 8.5 (7.4‐9.9) | <0.001 |
| Annual cardiac catheterizations, n (IQR) | 0 (0‐356) | 210 (0‐813) | 0.007 |
| Hospital total census days, n (IQR) | 37161 (14910‐59750) | 60626 (34402‐87950) | <0.001 |
| ICU total census, n (IQR) | 2193 (1132‐4289) | 3855 (2489‐6379) | <0.001 |
| Medicare insurance, % patients (IQR) | 36.9 (28.5‐48.0) | 35.3(28.2‐44.3) | 0.95 |
| Medicaid insurance, % patients (IQR) | 21.0 (12.7‐48.3) | 16.6 (5.6‐27.6) | 0.02 |
| Race, white, % patients (IQR) | 53.7 (26.0‐82.7) | 59.1 (45.6‐74.3) | 0.73 |
| DNR at admission, % patients (IQR) | 3.6 (2.0‐6.4) | 4.4 (2.7‐7.1) | 0.12 |
| Case‐mix index, index (IQR) | 1.05 (0.90‐1.21) | 1.13 (1.01‐1.26) | 0.11 |
Relationship Between Hospitalist Group Utilization and the Percentage of Missed Quality Opportunities
Table 2 shows the frequency of missed quality opportunities in sites with hospitalists compared to those without. In general, for both individual and composite measures of quality, multivariable adjustment modestly attenuated the observed differences between the 2 groups of hospitals. We present only the more conservative adjusted estimates.
| Quality Measure | Number of Hospitals | Adjusted Mean % Missed Quality Opportunities (95% CI) | Difference With Hospitalists | Relative % Change | P Value | |
|---|---|---|---|---|---|---|
| Hospitals Without Hospitalists | Hospitals With Hospitalists | |||||
| ||||||
| Acute myocardial infarction | ||||||
| Admission measures | ||||||
| Aspirin at admission | 193 | 3.7 (2.4‐5.1) | 3.4 (2.3‐4.4) | 0.3 | 10.0 | 0.44 |
| Beta‐blocker at admission | 186 | 7.8 (4.7‐10.9) | 6.4 (4.4‐8.3) | 1.4 | 18.3 | 0.19 |
| AMI admission composite | 186 | 5.5 (3.6‐7.5) | 4.8 (3.4‐6.1) | 0.7 | 14.3 | 0.26 |
| Hospital/discharge measures | ||||||
| Aspirin at discharge | 173 | 7.5 (4.5‐10.4) | 5.2 (3.4‐6.9) | 2.3 | 31.0 | 0.02 |
| Beta‐blocker at discharge | 179 | 6.6 (3.8‐9.4) | 5.9 (3.6‐8.2) | 0.7 | 9.6 | 0.54 |
| ACE‐I/ARB at discharge | 119 | 20.7 (9.5‐31.8) | 11.8 (6.6‐17.0) | 8.9 | 43.0 | 0.006 |
| Smoking cessation counseling | 193 | 3.8 (2.4‐5.1) | 3.4 (2.4‐4.4) | 0.4 | 10.0 | 0.44 |
| AMI hospital/discharge composite | 179 | 6.4 (4.1‐8.6) | 5.3 (3.7‐6.8) | 1.1 | 17.6 | 0.16 |
| Congestive heart failure | ||||||
| Hospital/discharge measures | ||||||
| Ejection fraction assessment | 208 | 12.6 (7.7‐17.6) | 6.5 (4.6‐8.4) | 6.1 | 48.2 | <0.001 |
| ACE‐I/ARB at discharge | 201 | 14.7 (10.0‐19.4) | 12.9 (9.8‐16.1) | 1.8 | 12.1 | 0.31 |
| Smoking cessation counseling | 168 | 9.1 (2.9‐15.4) | 9.0 (4.2‐13.8) | 0.1 | 1.8 | 0.98 |
| CHF hospital/discharge composite | 201 | 12.2 (7.9‐16.5) | 8.2 (6.2‐10.2) | 4.0 | 33.1 | 0.006* |
| Pneumonia | ||||||
| Admission measures | ||||||
| Blood culture before antibiotics | 206 | 12.0 (9.1‐14.9) | 10.9 (8.8‐13.0) | 1.1 | 9.1 | 0.29 |
| Timing of antibiotics <8 hours | 208 | 5.8 (4.1‐7.5) | 6.2 (4.7‐7.7) | 0.4 | 6.9 | 0.56 |
| Initial antibiotic consistent with recommendations | 207 | 15.0 (11.6‐18.6) | 13.8 (10.9‐16.8) | 1.2 | 8.1 | 0.27 |
| Pneumonia admission composite | 207 | 10.5 (8.5‐12.5) | 9.9 (8.3‐11.5) | 0.6 | 5.9 | 0.37 |
| Hospital/discharge measures | ||||||
| Pneumonia vaccine | 208 | 29.4 (19.5‐39.2) | 27.1 (19.9‐34.3) | 2.3 | 7.7 | 0.54 |
| Influenza vaccine | 207 | 36.9 (25.4‐48.4) | 35.0 (27.0‐43.1) | 1.9 | 5.2 | 0.67 |
| Smoking cessation counseling | 196 | 15.4 (7.8‐23.1) | 13.9 (8.9‐18.9) | 1.5 | 10.2 | 0.59 |
| Pneumonia hospital/discharge composite | 207 | 29.6 (20.5‐38.7) | 27.3 (20.9‐33.6) | 2.3 | 7.8 | 0.51 |
Compared to hospitals without hospitalists, those with hospitalists did not have any statistically significant differences in the individual and composite admission measures for each of the disease processes. In contrast, there were statistically significant differences between hospitalist and nonhospitalist sites for many individual cardiac processes of care that typically occur after admission from the emergency room (ie, LV function assessment for CHF) or those that occurred at discharge (ie, aspirin and ACE‐I/ARB at discharge for AMI). Similarly, the composite discharge scores for AMI and CHF revealed better overall process measure performance at sites with hospitalists, although the AMI composite did not meet statistical significance. There were no statistically significant differences between groups for the pneumonia process measures assessed at discharge. In addition, for composite measures there were no statistically significant interactions between hospitalist prevalence and bed size, although there was a trend (P = 0.06) for the CHF discharge composite, with a larger effect of hospitalists among smaller hospitals.
Percent of Patients Admitted by Hospitalists
Of the 171 hospitals with hospitalists, 71 (42%) estimated the percent of patients admitted by their hospitalist physicians. Among the respondents, the mean and median percentages of medical patients admitted by hospitalists were 51% (SD = 25%) and 49% (IQR = 30‐70%), respectively. Thirty hospitals were above the sample mean. Compared to nonrespondent sites, respondent hospitals took care of more white patients; otherwise, respondent and nonrespondent hospitals were similar in terms of bed size, location, performance across each measure, and other observable characteristics (Supporting Information, Appendix 1).
Relationship Between the Estimated Percentages of Medical Patients Admitted by Hospitalists and Missed Quality Opportunities
Table 3 displays the change in missed quality measures associated with each additional 10% of patients estimated to be admitted by hospitalists. A higher estimated percentage of patients admitted by hospitalists was associated with statistically significant improvements in quality of care across a majority of individual measures and for all composite discharge measures regardless of condition. For example, every 10% increase in the mean estimated number of patients admitted by hospitalists was associated with a mean of 0.6% (P < 0.001), 0.5% (P = 0.004), and 1.5% (P = 0.006) fewer missed quality opportunities for AMI, CHF, and pneumonia discharge process measures composites, respectively. In addition, for these composite measures, there were no statistically significant interactions between the estimated percentage of patients admitted by hospitalists and bed size (dichotomized at 150 beds), although there was a trend (P = 0.09) for the AMI discharge composite, with a larger effect of hospitalists among smaller hospitals.
| Quality Measure | Number of Hospitals | Adjusted % Missed Quality Opportunities (95% CI) | Difference With Hospitalists | Relative Percent Change | P Value | |
|---|---|---|---|---|---|---|
| Among Hospitals With Mean % of Patients Admitted by Hospitalists | Among Hospitals With Mean + 10% of Patients Admitted by Hospitalists | |||||
| ||||||
| Acute myocardial infarction | ||||||
| Admission measures | ||||||
| Aspirin at admission | 70 | 3.4 (2.3‐4.6) | 3.1 (2.0‐3.1) | 0.3 | 10.2 | 0.001 |
| Beta‐blocker at admission | 65 | 5.8 (3.4‐8.2) | 5.1 (3.0‐7.3) | 0.7 | 11.9 | <0.001 |
| AMI admission composite | 65 | 4.5 (2.9‐6.1) | 4.0 (2.6‐5.5) | 0.5 | 11.1 | <0.001* |
| Hospital/discharge measures | ||||||
| Aspirin at discharge | 62 | 5.1 (3.3‐6.9) | 4.6 (3.1‐6.2) | 0.5 | 9.0 | 0.03 |
| Beta‐blocker at discharge | 63 | 5.1 (2.9‐7.2) | 4.3 (2.5‐6.0) | 0.8 | 15.4 | <0.001 |
| ACE‐I/ARB at discharge | 44 | 11.4 (6.2‐16.6) | 10.3 (5.4‐15.1) | 1.1 | 10.0 | 0.02 |
| Smoking cessation counseling | 70 | 3.4 (2.3‐4.6) | 3.1 (2.0‐4.1) | 0.3 | 10.2 | 0.001 |
| AMI hospital/discharge composite | 63 | 5.0 (3.3‐6.7) | 4.4 (3.0‐5.8) | 0.6 | 11.3 | 0.001* |
| Congestive heart failure | ||||||
| Hospital/discharge measures | ||||||
| Ejection fraction assessment | 71 | 5.9 (4.1‐7.6) | 5.6 (3.9‐7.2) | 0.3 | 2.9 | 0.07 |
| ACE‐I/ARB at discharge | 70 | 12.3 (8.6‐16.0) | 11.4 (7.9‐15.0) | 0.9 | 7.1 | 0.008* |
| Smoking cessation counseling | 56 | 8.4 (4.1‐12.6) | 8.2 (4.2‐12.3) | 0.2 | 1.7 | 0.67 |
| CHF hospital/discharge composite | 70 | 7.7 (5.8‐9.6) | 7.2 (5.4‐9.0) | 0.5 | 6.0 | 0.004* |
| Pneumonia | ||||||
| Admission measures | ||||||
| Timing of antibiotics <8 hours | 71 | 5.9 (4.2‐7.6) | 5.9 (4.1‐7.7) | 0.0 | 0.0 | 0.98 |
| Blood culture before antibiotics | 71 | 10.0 (8.0‐12.0) | 9.8 (7.7‐11.8) | 0.2 | 2.6 | 0.18 |
| Initial antibiotic consistent with recommendations | 71 | 13.3 (10.4‐16.2) | 12.9 (9.9‐15.9) | 0.4 | 2.8 | 0.20 |
| Pneumonia admission composite | 71 | 9.4 (7.7‐11.1) | 9.2 (7.6‐10.9) | 0.2 | 1.8 | 0.23 |
| Hospital/discharge measures | ||||||
| Pneumonia vaccine | 71 | 27.0 (19.2‐34.8) | 24.7 (17.2‐32.2) | 2.3 | 8.4 | 0.006 |
| Influenza vaccine | 71 | 34.1 (25.9‐42.2) | 32.6 (24.7‐40.5) | 1.5 | 4.3 | 0.03 |
| Smoking cessation counseling | 67 | 15.2 (9.8‐20.7) | 15.0 (9.6‐20.4) | 0.2 | 2.0 | 0.56 |
| Pneumonia hospital/discharge composite | 71 | 26.7 (20.3‐33.1) | 25.2 (19.0‐31.3) | 1.5 | 5.8 | 0.006* |
In order to test the robustness of our results, we carried out 2 secondary analyses. First, we used multivariable models to generate a propensity score representing the predicted probability of being assigned to a hospital with hospitalists. We then used the propensity score as an additional covariate in subsequent multivariable models. In addition, we performed a complete‐case analysis (including only hospitals with complete data, n = 204) as a check on the sensitivity of our results to missing data. Neither analysis produced results substantially different from those presented.
Discussion
In this cross‐sectional analysis of hospitals participating in a voluntary quality reporting initiative, hospitals with at least 1 hospitalist group had fewer missed discharge care process measures for CHF, even after adjusting for hospital‐level characteristics. In addition, as the estimated percentage of patients admitted by hospitalists increased, the percentage of missed quality opportunities decreased across all measures. The observed relationships were most apparent for measures that could be completed at any time during the hospitalization and at discharge. While it is likely that hospitalists are a marker of a hospital's ability to invest in systems (and as a result, care improvement initiatives), the presence of a potential dose‐response relationship suggests that hospitalists themselves may have a role in improving processes of care.
Our study suggests a generally positive, but mixed, picture of hospitalists' effects on quality process measure performance. Lack of uniformity across measures may depend on the timing of the process measure (eg, whether or not the process is measured at admission or discharge). For example, in contrast to admission process measures, we more commonly observed a positive association between hospitalists and care quality on process measures targeting processes that generally took place later in hospitalization or at discharge. Many admission process measures (eg, door to antibiotic time, blood cultures, and appropriate initial antibiotics) likely occurred prior to hospitalist involvement in most cases and were instead under the direction of emergency medicine physicians. Performance on these measures would not be expected to relate to use of hospitalists, and that is what we observed.
In addition to the timing of when a process was measured or took place, associations between hospitalists and care quality vary by disease. The apparent variation in impact of hospitalists by disease (more impact for cardiac conditions, less for pneumonia) may relate primarily to the characteristics of the processes of care that were measured for each condition. For example, one‐half of the pneumonia process measures related to care occurring within a few hours of admission, while the other one‐half (smoking cessation advice and streptococcal and influenza vaccines) were often administered per protocol or by nonphysician providers.26‐29 However, more of the cardiac measures required physician action (eg, prescription of an ACE‐I at discharge). Alternatively, unmeasured confounders important in the delivery of cardiac care might play an important role in the relationship between hospitalists and cardiac process measure performance.
Our approach to defining hospitalists bears mention as well. While a dichotomous measure of having hospitalists available was only statistically significant for the single CHF discharge composite measure, our measure of hospitalist availabilitythe percentage of patients admitted by hospitalistswas more strongly associated with a larger number of quality measures. Contrast between the dichotomous and continuous measures may have statistical explanations (the power to see differences between 2 groups is more limited with use of a binary predictor, which itself can be subject to bias),30 but may also indicate a dose‐response relationship. A larger number of admissions to hospitalists may help standardize practices, as care is concentrated in a smaller number of physicians' hands. Moreover, larger hospitalist programs may be more likely to have implemented care standardization or quality improvement processes or to have been incorporated into (or lead) hospitals' quality infrastructures. Finally, presence of larger hospitalist groups may be a marker for a hospital's capacity to make hospital‐wide investments in improvement. However, the association between the percentage of patients admitted by hospitalists and care quality persisted even after adjustment for many measures plausibly associated with ability to invest in care quality.
Our study has several limitations. First, although we used a widely accepted definition of hospitalists endorsed by the Society of Hospital Medicine, there are no gold standard definitions for a hospitalist's job description or skill set. As a result, it is possible that a model utilizing rotating internists (from a multispecialty group) might have been misidentified as a hospitalist model. Second, our findings represent a convenience sample of hospitals in a voluntary reporting initiative (CHART) and may not be applicable to hospitals that are less able to participate in such an endeavor. CHART hospitals are recognized to be better performers than the overall California population of hospitals, potentially decreasing variability in our quality of care measures.2 Third, there were significant differences between our comparison groups within the CHART hospitals, including sample size. Although we attempted to adjust our analyses for many important potential confounders and applied conservative measures to assess statistical significance, given the baseline differences, we cannot rule out the possibility of residual confounding by unmeasured factors. Fourth, as described above, this observational study cannot provide robust evidence to support conclusions regarding causality. Fifth, the estimation of the percent of patients admitted by hospitalists is unvalidated and based upon self‐reported and incomplete (41% of respondents) data. We are somewhat reassured by the fact that respondents and nonresponders were similar across all hospital characteristics, as well as outcomes. Sixth, misclassification of the estimated percentage of patients admitted by hospitalists may have influenced our results. Although possible, misclassification often biases results toward the null, potentially weakening any observed association. Given that our respondents were not aware of our hypotheses, there is no reason to expect recall issues to bias the results one way or the other. Finally, for many performance measures, overall performance was excellent among all hospitals (eg, aspirin at admission) with limited variability, thus limiting the ability to assess for differences.
In summary, in a large, cross‐sectional study of California hospitals participating in a voluntary quality reporting initiative, the presence of hospitalists was associated with modest improvements in hospital‐level performance of quality process measures. In addition, we found a relationship between the percentage of patients admitted by hospitalists and improved process measure adherence. Although we cannot determine causality, our data support the hypothesis that dedicated hospital physicians can positively affect the quality of care. Future research should examine this relationship in other settings and should address causality using broader measures of quality including both processes and outcomes.
Acknowledgements
The authors acknowledge Teresa Chipps, BS, Center for Health Services Research, Division of General Internal Medicine and Public Health, Department of Medicine, Vanderbilt University, Nashville, TN, for her administrative and editorial assistance in the preparation of this manuscript.
- ,,,.Care in U.S. hospitals—the Hospital Quality Alliance Program.N Engl J Med.2005;353:265–274.
- CalHospitalCompare.org: online report card simplifies the search for quality hospital care. Available at: http://www.chcf.org/topics/hospitals/index.cfm?itemID=131387. Accessed September 2009.
- ,,, et al.Hospital characteristics and quality of care.JAMA.1992;268:1709–1714.
- ,,,,.Patient and hospital characteristics associated with recommended processes of care for elderly patients hospitalized with pneumonia: results from the Medicare quality indicator system pneumonia module.Arch Intern Med.2002;162:827–833.
- ,,, et al.A systematic review and meta‐analysis of studies comparing mortality rates of private for‐profit and private not‐for‐profit hospitals.CMAJ.2002;166:1399–1406.
- ,.Teaching hospitals and quality of care: a review of the literature.Milbank Q.2002;80:569–593.
- ,,,,.Nurse‐staffing levels and the quality of care in hospitals.N Engl J Med.2002;346:1715–1722.
- ,,,.Growth in the care of older patients by hospitalists in the United States.N Engl J Med.2009;360:1102–1112.
- ,,,.Health care market trends and the evolution of hospitalist use and roles.J Gen Intern Med.2005;20:101–107.
- ,,,.Comparison of processes and outcomes of pneumonia care between hospitalists and community‐based primary care physicians.Mayo Clin Proc.2002;77:1053–1058.
- ,,,.Comparison of hospitalists and nonhospitalists regarding core measures of pneumonia care.Am J Manag Care.2007;13:129–132.
- ,,.Comparison of practice patterns of hospitalists and community physicians in the care of patients with congestive heart failure.J Hosp Med.2008;3:35–41.
- ,,, et al.Quality of care for decompensated heart failure: comparable performance between academic hospitalists and non‐hospitalists.J Gen Intern Med.2008;23:1399–1406.
- ,,,,.Quality of care for patients hospitalized with heart failure: assessing the impact of hospitalists.Arch Intern Med.2002;162:1251–1256.
- ,,,.The inverse relationship between mortality rates and performance in the Hospital Quality Alliance measures.Health Aff.2007;26:1104–1110.
- ,,,,.Does the Leapfrog program help identify high‐quality hospitals?Jt Comm J Qual Patient Saf.2008;34:318–325.
- ,,,,,.Outcomes of care by hospitalists, general internists, and family physicians.N Engl J Med.2007;357:2589–2600.
- CMS HQI demonstration project—composite quality score methodology overview. Available at: http://www.cms.hhs.gov/HospitalQualityInits/downloads/HospitalCompositeQualityScoreMethodologyOverview.pdf. Accessed September 2009.
- ,,.Modeling risk using generalized linear models.J Health Econ.1999;18:153–171.
- ,,.Generalized modeling approaches to risk adjustment of skewed outcomes data.J Health Econ.2005;24:465–488.
- ,,, et al.Quality of care for the treatment of acute medical conditions in US hospitals.Arch Intern Med.2006;166:2511–2517.
- ,,, et al.The Dartmouth Atlas of Cardiovascular Health Care.Chicago:AHA Press;1999. Current data from the Dartmouth Institute for Health Policy and Clinical Practice, Lebanon, NH. Available at: http://www.dartmouthatlas.org/atlases/atlas_ series.shtm. Accessed September 2009.
- ,,.Differences in per capita rates of revascularization and in choice of revascularization procedure for eleven states.BMC Health Serv Res.2006;6:35.
- ,,.The relationship between physician supply, cardiovascular health service use and cardiac disease burden in Ontario: supply‐need mismatch.Can J Card.2008;24:187.
- .Multiple imputation: a primer.Stat Methods Med Res.1999;8:3–15.
- .Nursing intervention and smoking cessation: Meta‐analysis update.Heart Lung.2006;35:147–163.
- .Ten‐year durability and success of an organized program to increase influenza and pneumococcal vaccination rates among high‐risk adults.Am J Med.1998;105:385–392.
- ,,, et al.Role of student pharmacist interns in hospital‐based standing orders pneumococcal vaccination program.J Am Pharm Assoc.2007;47:404–409.
- ,,,.Effect of a pharmacist‐managed program of pneumococcal and influenza immunization on vaccination rates among adult inpatients.Am J Health Syst Pharm.2003;60:1767–1771.
- ,,.Dichotomizing continuous predictors in multiple regression: a bad idea.Stat Med.2006;25:127–141.
Copyright © 2010 Society of Hospital Medicine
ICU Characteristics in Michigan
Organization of physician services in intensive care units (ICUs) varies widely and influences mortality, morbidity, and costs of care. Intensive care provided by intensivists in a high‐intensity physician staffing model, in which intensivists are the sole attending physicians or consult on all patients, has been associated with desirable outcomes such as decreased length of stay, resource utilization, and mortality.1‐4 As a result, higher intensity ICU models have been recommended by various healthcare agencies, including the National Quality Forum and the Leapfrog Group.5‐7
One national survey indicated that 47% of ICUs surveyed had some intensivist coverage and only 4% of intensive care units met Leapfrog high‐intensity model standards.8 However, only one‐third of ICUs responded to this survey, smaller ICUs were overrepresented, and the survey may not have reflected the influence of newer policy initiatives because it was conducted in 1997. Though the attributes by which intensivists improve patient outcomes is unknown, researchers have suggested it is by having a knowledgeable physician present in the ICU, having a physician communicate with other clinicians and families, and by having a physician who manages the ICU by writing policies and procedures and administrative activities.9
Results have been conflicting as patients managed by intensivists have also been found to have an increased mortality, particularly when managed on an elective consultation basis in an open ICU, where patient orders are written by several physician specialties.10, 11 Alternative ICU staffing models, such as the use of hospitalists, have been utilized to compensate for the intensivist workforce shortage. Hospitalists often provide ICU care, although they are seldom board‐certified in critical care. Hospitalist care has been shown to provide clinical and efficiency benefits such as decreased length of hospital stay.12‐14
Understanding the manner in which critical care is currently delivered, particularly the utilization of intensivist and nonintensivist care providers, can provide insights into subsequent allocation of a limited intensivist workforce as nonintensivist care providers such as hospitalists become more available. To understand how intensivists and other practitioners, such as hospitalists, deliver critical care in Michigan, we performed a cross‐sectional survey of Michigan hospitals participating in the Keystone ICU project, a statewide quality‐improvement initiative.
Methods
The hospitals involved and the methods of Keystone ICU have been published previously.15 The Keystone ICU project is a collaborative quality improvement initiative first organized in October 2003 by the Michigan Health and Hospitals Association (MHA) Keystone Center for Patient Safety and Quality. At its inception, 103 ICUs voluntarily agreed to participate in Keystone ICU and reported data representing 85% of ICU beds in Michigan. Nonparticipating hospitals (n = 37) were smaller, 79% having fewer than 100 beds, many of which did not have ICUs. All ICUs from the 72 hospitals participating in the Keystone ICU project as of July 2005 were asked to complete surveys as part of ongoing data collection.
Keystone ICU sought to improve safety culture, increase adherence to evidence‐based practices among patients receiving mechanical ventilation, and reduce central lineassociated bloodstream infections and ventilator‐associated pneumonia through a number of interventions. Keystone also encouraged teams to standardize their physician staffing, and presented teams with evidence regarding the benefits of ICU physician staffing. Because many of the ICUs were small and believed it was not practical to staff their ICUs with intensivists, Keystone encouraged ICUs to create as many of the attributes of intensivist staffing as possible: having someone present who is knowledgeable, able to manage at the unit level, and who communicates well with clinicians and families.9 As part of this project, we developed a survey to describe the physician staffing in Michigan ICUs. Additional elements of the survey sought to ascertain how medical decision‐making occurred, which decisions were made by what types of clinicians, and who performed various procedures in the ICU.
Survey Development
The survey for this study was developed based on expert opinion and on previous work by the research team (A.D.A., P.J.P., S.A.F.). The survey was pilot tested in a small group of non‐Michigan hospitals and found to be understandable and readable. The survey was then revised and disseminated to all hospitals participating in the Keystone ICU project. Construct validity was determined by review of literature and discussion with the research team (A.D.A., P.J.P., S.A.F., R.C.H.). Content validity was determined by the pilot test, which included interviews with the individuals who pilot‐tested the survey. The survey sought to describe the organization of ICU physician services (including both intensivist and nonintensivist). A copy of the survey is available upon request.
Survey Protocol
Surveys were sent by e‐mail to the official nurse and/or physician project leader at each site in July 2005 from contact information provided by MHA. Another copy of the survey was emailed to ICUs that did not respond to the initial survey after 3 months and, if needed, a third survey was sent at 6 months with a follow‐up telephone call by 1 of the investigators (R.C.H.). The completed surveys were returned to MHA for compilation and analysis. The research project was reviewed by the University of Michigan Institutional Review Board and determined to be exempt from ongoing IRB review per federal exemption category 45 CFR 46.101.(b). The funder was not involved in the design of the study, collection, analysis, and interpretation of the data, or the decision to approve publication of the finished manuscript.
Statistical Analysis
Survey respondents were first characterized using simple univariable and bivariable methods. When appropriate, groups were compared based on chi‐square, Mann‐Whitney U test, or t test. Additionally, a series of multivariable analyses was performed, which sought to understand structural factors associated with the presence of higher‐intensity models, as well as use of hospitalists or intensivists. Results of the multivariate analysis are reported as odds ratios (ORs) and 95% confidence intervals (CIs). The critical region was defined as an alpha of 0.05. Statistical analysis was performed using SAS (version 9.1; SAS Institute, Inc., Cary, NC).
Results
Response Rate
Ninety‐seven responses were received, including at least 1 response from every Keystone ICU hospital located in Michigan. Because our goal was to describe the organization of ICU physician services in non‐Federal hospitals, 1 Michigan VA hospital was eliminated from further consideration. Four hospitals with more than 1 ICU, which delivered care identically in all of their ICUs, provided 1 response and were counted as 1 site. As a result, 96 survey responses representing 115 ICUs in 72 Michigan hospitals were each counted as 1 site in the analysis. This included responses from ICUs not included in earlier analyses, which joined Keystone ICU after earlier work had been underway.15
Baseline Demographics
The mean (standard deviation [SD]) hospital size represented in the survey was 280 (22) beds, with a median of 249 (range, 40‐1031) beds. The mean size (SD) of the ICU was 13.3 (7.0) beds, median 12 beds, range 4 to 42 beds. There were 16 ICUs dedicated exclusively to the care of medicine patients, 14 dedicated surgical units, 8 dedicated cardiac ICUs, and 3 dedicated Neuro ICUs. The remainder had a mixed patient population. Seventy‐one ICUs (74%) cared for medical patients, 69 (72%) cared for surgical patients, 64 (67%) cared for cardiac patients, and 52 (53%) cared for neurological patients.
ICU Staffing Models
To better understand the role of intensivists in critical care delivery in Michigan, we examined differences in sites where patients are managed as closed sites exclusively by intensivists (closed ICU sites) in comparison to ICUs that had multiple attending specialties (open ICU sites). In addition, ICU sites where intensivists made most clinical decisionsa circumstance likely reflecting a high‐intensity staffing model of care5were compared with ICUs sites where decision‐making was made by nonintensivists or was shared (Table 1). Twenty‐four of 96 (25%) ICU sites were closed, and only intensivists served as the attending of record. Hospitals with closed ICUs or in which intensivists made most clinical decisions were larger and had larger ICUs than sites with open ICUs or with nonintensivist decision‐making (P < 0.05). These 24 closed sites represented 17 of 72 hospitals (24%), with the remainder of hospitals (76%) not having closed ICUs. Intensivists participated in rounds in 43 of 72 sites (60%) that were not closed. House officer participation in the care of ICU patients was not related to the presence or absence of intensivists (2 = 0.04; P = 0.847), although the average size of hospitals with house officers was larger than those without house officers (P < 0.0001).
| Closed ICUs (n = 24) [n (%)] | Open ICUs (n = 72) [n (%)] | Intensivist Decision‐making (n = 30) [n (%)] | Shared Decision‐making (n = 31) [n (%)] | Nonintensivist Decision‐making (n = 34) [n (%)] | |
|---|---|---|---|---|---|
| |||||
| ICU beds (mean SD) | 21.8 15.3* | 15.2 13.0* | 21.3 18.7* | 19.2 13.4 | 10.5 5.2* |
| Hospital beds (mean SD) | 489.8 295.3* | 326.3 222.6* | 460.8 222.3* | 408.6 259.7 | 247.8 230.0* |
| Nonintensivist attendings | |||||
| Hospitalist | 34 (47.2) | 9 (30) | 14 (45.1) | 13 (38.2) | |
| Primary care physician | 55 (76.4) | 11 (36.7) | 23 (74.2) | 27 (79.4) | |
| Cardiologist | 54 (75) | 10 (33.3) | 25 (80.6) | 23 (67.6) | |
| Pulmonologist | 34 (47.2) | 9 (30) | 15 (48.3) | 15 (44.1) | |
| Other IM specialist | 48 (66.7) | 11 (36.7) | 25 (80.6) | 17 (50) | |
| Surgeon | 59 (81.9) | 14 (46.7) | 25 (80.6) | 27 (79.4) | |
| Critical care board certification (% of attending physicians) | (n = 28) | (n = 31) | (n = 33) | ||
| 100 | 11 (45.8) | 7 (10.1) | 11 (39.3) | 6 (19.4) | 0 (0) |
| 75 | 3 (12.5) | 6 (8.7) | 7 (25.0) | 2 (6.5) | 0 (0) |
| 50 | 2 (8.3) | 4 (5.8) | 3 (10.7) | 2 (6.5) | 1 (3.0) |
| <50 | 8 (33.3) | 52 (75.4) | 7 (25.0) | 21 (67.7) | 32 (97.0) |
| ICU administration | |||||
| ICU director financial support | 18 (75.0) | 49 (68.1) | 25 (83.3) | 23 (74.2) | 18 (52.9) |
| Meeting with ICU team | 21 (87.5) | 56 (77.8) | 26 (86.7) | 27 (87.1) | 23 (67.7) |
| M&M sessions | 9 (37.5) | 33 (45.8) | 16 (53.3) | 12 (38.7) | 14 (41.2) |
Multivariate analysis determined that the presence of hospitalists serving as attending physicians was strongly associated with an open ICU (OR = 12.2; 95%CI = 2.5‐60.2), as was the absence of intensivists at the site (OR = 12.2; 95%CI = 1.4‐105.8), while ICU and hospital size were not associated. When the analyses were limited to hospitals with intensivists (n = 69), decision‐making by intensivists was not associated with ICU or hospital size (OR = 1.0; 95%CI = 1.0‐1.0); or whether hospitalists acted as attendings (OR = 0.7; 95%CI = 0.2‐2.0).
Board Certification and ICU Administration
Only 18 sites (20%) acknowledged that 100% of their ICU attending physicians were board‐certified in critical care, with nearly two‐thirds of sites having fewer than 50% critical‐care board‐certified attending physicians (Table 1). The medical director of the ICU met for an administrative meeting with the ICU team of nurses, respiratory therapists, and other personnel on a regular (ie, at least quarterly) basis at 77 sites (80%) and held regular morbidity and mortality sessions to discuss ICU care with other physicians who work in the ICU at 43 sites (45%). The majority of sites (n = 67; 70%) provided salary support for the ICU medical director.
Critical‐care board‐certification was more common at sites with closed ICUs and at sites where decision‐making was performed by intensivists (P < 0.001). However, board‐certification was not uniform in closed ICUs (100% certification = 46%, >50% certification = 67%) or in ICUs where intensivists made most decisions (100% certification = 39%, >50% certification = 75%).
Hospitals in which hospitalists served as attending physicians were less likely to have 50% or greater critical‐care board‐certification in their ICU (OR = 0.13; 95%CI = 0.03‐0.50). ICU size, hospital size, and years in practice were not associated with critical‐care board‐certification. Hospital size, ICU size, and the presence of intensivists or hospitalists were not associated with whether the medical director receives support from the hospital.
Physician Extenders
Nineteen sites (20%) reported the utilization of advanced practice nurses; 15 sites (16%) reported use of physician assistants; and 7 sites (7%) reported use of both advance practice nurses and physician assistants to provide intensive care. Physician extenders were not more likely to work in closed ICUs (10/24) than in open ICUs (14/72) (2 = 3.63; P = 0.57).
Of the 27 sites reporting use of advanced practice nurses or physician assistants, the role of physician extenders was described as being similar to physicians in 8 sites (30%), somewhat autonomous but with limitations in 18 (67%), and in a role closer to a ward clerk or assistant in 1 site (4%). The activities of physician extenders included writing orders at 24 of these 27 sites (89%); writing progress notes at 25 sites (92%); communicating with consultants at 24 (89%) and with primary care physicians at 22 sites (82%); and coordinating discharge plans at 20 sites (74%). Physician extenders rounded alone at 16 sites (33%).
Clinical Activities
Intensivists participated in daily rounds at most sites (n = 67; 70%). Nonintensivists served as attending of record in 72 (75%) sites. Nonintensivist physicians participating in daily patient rounds were: surgeons (n = 66; 68% of sites), primary care physicians (n = 61; 64%), nonpulmonary internal medicine specialists (n = 53; 55%), cardiologists (n = 58; 60%), non‐critical‐care pulmonologists (n = 39; 41%), and hospitalists (n = 36; 38%). Intensivists were the primary decision‐makers at 30 sites (31%), nonintensivists at 34 (35%), and decision making was shared at 31 (32%).
At more than one‐half of sites, decisions regarding mechanical ventilation, the use of sedatives or paralytics, and the choice of vasopressor agents were made by intensivists, with other decisionssuch as the decision to call consultants, choice of antibiotics, or family meetingsshared between intensivists and nonintensivists more than 40% of the time (Table 2). During regular working hours, invasive procedures were performed by multiple clinicians, including house officers, intensivists, surgeons, and anesthesiologists and were not the province of any particular type of clinician (Table 3).
| Decision‐making | |||
|---|---|---|---|
| Intensivist n (%) | Nonintensivist n (%) | Shared n (%) | |
| |||
| Ventilator management | 62 (66.7) | 24 (25.8) | 7 (7.5) |
| Choice of ventilator weaning strategies | 64 (68.8) | 24 (25.8) | 5 (5.4) |
| Decision to extubate | 63 (68.5) | 24 (26.1) | 5 (5.4) |
| Choice of sedation or paralytic agents | 56 (65.1) | 24 (27.9) | 6 (7.0) |
| Choice of vasopressor agents | 47 (51.1) | 25 (27.1) | 20 (21.7) |
| Decision to call other consultants (eg, cardiology, infectious diseases) | 19 (20.4) | 31 (33.3) | 43 (46.2) |
| Choices related to more general medical management (eg, antibiotics, diabetes management) | 30 (32.2) | 25 (26.9) | 38 (40.1) |
| Family meetings, code status discussions | 26 (28.6) | 26 (28.6) | 39 (42.8) |
| Procedure | Hospitalist n (%) | Intensivist n (%) | Surgeon n (%) | Anesthesiologist n (%) | House Officer or Other MD n (%) | Other non‐MD n (%) |
|---|---|---|---|---|---|---|
| Arterial line placement | 15 (15.6) | 50 (52.1) | 40 (41.7) | 31 (32.3) | 59 (61.4) | 7 (7.3) |
| Femoral venous line placement | 14 (14.6) | 54 (56.3) | 42 (43.8) | 17 (17.7) | 55 (57.3) | 4 (4.2) |
| Subclavian or internal jugular line placement | 14 (14.6) | 54 (56.2) | 47 (49.0) | 25 (26.0) | 62 (64.6) | 5 (5.2) |
| Pulmonary artery catheterization | 8 (8.3) | 56 (58.3) | 24 (25.0) | 21 (21.9) | 54 (56.2) | 2 (2.1) |
| Intubation | 14 (14.6) | 47 (49.0) | 14 (14.6) | 74 (77.1) | 42 (43.8) | 15 (15.6) |
| Bronchoscopy | 2 (2.1) | 67 (69.8) | 17 (17.7) | 5 (5.2) | 29 (30.2) | 0 (0) |
Regardless of the staffing model employed, the majority of sites (88%) provided care on a call‐based, rather than shift‐based system. Nighttime admissions and cross‐coverage issues were handled by house officers at more than one‐third of sites, with nonintensivist house physicians performing these tasks at 15% of sites (Table 4). Intensivists managed cross‐coverage issues by telephone at 29% of sites, and saw new admissions in person after hours at 8% of sites. Intensivists did not deliver care in scheduled shifts at any of these sites.
| Care Provider | Nighttime Admissions n (%) | Cross‐coverage n (%) |
|---|---|---|
| ||
| Emergency room physician | 13 (13.5) | 8 (8.3) |
| House physician | 15 (15.6) | 17 (17.7) |
| House officer | 42 (43.8) | 37 (38.5) |
| ICU nurse | 5 (5.2) | 10 (10.4) |
| PA or NP | 8 (8.3) | 5 (5.2) |
| Intensivist in person | 8 (8.3) | |
| Intensivist by telephone | 28 (29.2) | |
| Other | 9 (9.4) | 9 (9.4) |
Discussion
As all Keystone ICU participating sites responded to the questionnaire, we believe these results to be representative of critical care practice in the state of Michigan at the present time. Michigan ICU staffing structures are variable. Only a minority (25%) of Michigan Keystone ICU sites operated in an environment where intensivists are the only attending physicians of record. Although intensivists rounded in 60% of sites not utilizing a closed model, 75% of sites had nonintensivist attending physicians, with primary care physicians and hospitalists commonly providing ICU services. The utilization of hospitalists to provide critical care services was found in the absence of intensivists, regardless of hospital or ICU size.
Closed ICUs were seen in larger hospitals and in larger ICUs. This finding is similar to data obtained on a national level.8‐16 A high‐intensity model of care was also uncommon, although decision‐making was at least shared between intensivists and nonintensivists at two‐thirds of sites. These findings are in keeping with the observation that intensivist‐directed care advocated by the Leapfrog Group has not been widely implemented,17 including in Michigan, a regional rollout leader for the Leapfrog Group.
Fewer ICUs reported utilizing a nonintensivist model than was reported in the survey by Angus et al.,8 where approximately one‐half of ICUs delivered care in this manner. This survey was performed in 1997, prior to the launch of the Leapfrog Group effort, and may have reflected a relative over representation of smaller, general ICUs. Our study is the first statewide analysis of critical care practices in the postLeapfrog Group era. Our finding that an array of approaches to critical care delivery existed in Michigan, even when intensivists rounded on patients, is similar to that found among Leapfrog‐compliant hospitals sampled from several regions of the United States.18
Other than intensivists, surgeons, primary care, and hospitalist physicians provided care in Michigan ICUs. The hospitalist movement is relatively new.19 However, in our survey 37.5% of sites had hospitalists serving as attending physicians. Although the closed ICU model was more prevalent in larger ICUs and hospitals, the use of a hospitalist model to staff ICUs was not related to hospital size, but was instead a function of whether or not intensivists were present in a given setting. In lieu of a projected shortage of intensivists, we believe this confirms the crucial role that hospitalists will play in the provision of critical care services in the future.
The attributes of intensivist care that led to improved outcomes in previous studies1‐4 are unknown. To the extent that the involvement of intensivists on an elective rather than mandatory consultative basis may explain the higher mortality found in 1 recent study,1011 we hypothesize that having a knowledgeable physician present who communicates with clinicians and families and manages at the unit level is an important factor leading to improved outcomes. While hospitalists can have these attributes, their knowledge of specific critical care therapies and technologies may vary with the extent of their ICU training and experience. Further research should seek to quantify the attributes by which intensivists are associated with improved outcomes and seek ways to foster those attributes among hospitalists who participate in critical care delivery. Central to this will be ensuring that training programs ensure competency in critical care therapies and technologies among hospitalists and other non‐ICU physicians.
We recognize several limitations in this study. First, the validity of the survey may introduce misclassification of ICU staffing. However, the survey instrument was informed by previously‐validated instruments and experts in ICU physician staffing and hospitalist care. Second, we did not link variation in staffing to outcomes. While such analysis is important, it is beyond the scope of this survey. Third, our study was conducted in 1 state and the results may not be generalizable across the United States. Nevertheless, Michigan is a large state with a diverse array of hospitals, and as our study sample broadly represented this diversity, we believe our results are likely to be generalizable.
In conclusion, few ICUs in Michigan are closed and many utilize nonintensivist critical‐care providers such as hospitalists, primary care providers, and physician extenders to deliver clinical care. Our findings have significant implications for future efforts at a national level that involve the training of hospitalists and their acceptance as critical care practitioners. We suggest future research involving intensive care delivery focus on the feasibility of training sufficient hospitalists to satisfy a growing need for critical care that cannot be filled by intensivists, along with strategic planning to insure the model of care provided is commensurate with the complexity of illness. Although this approach appears to be occurring in Michigan on an ad hoc basis, we believe coordination between larger, intensivist‐run ICUs and smaller, nonintensivist‐run ICUs should be formalized in order to optimize the delivery of intensive care.25
- ,,, et al.;the members of the American College of Critical Care Medicine Task Force on Models for the Definition of an Intensivist and the Practice of Critical Care Medicine. Critical care delivery in the intensive care unit: defining clinical roles and the best practice model.Crit Care Med.2001;29;2007–2019.
- ,,, et al.Effects of organizational change in the medical intensive care unit of a teaching hospital: a comparison of “open” and “closed” formats.JAMA.1996;276:24–31.
- ,,, et al.A “closed” medical intensive care unit (MICU) improves resource utilization when compared with an “open” MICU.Am J Respir Crit Care Med.1998;157:1468–1473.
- ,,, et al.Effects of an organized critical care service on outcomes and resource utilization: a cohort study.Crit Care Med.1999;27:270–274.
- ,,,,,.Physician staffing patterns and clinical outcomes in critically ill patients.JAMA.2002;288:2151–2162.
- Leapfrog Group. Leapfrog Group Factsheet: ICU physician staffing (IPS). Available at: http://www.leapfroggroup.org/media/file/Leapfrog‐ICU_ Physician_Staffing_Fact_Sheet.pdf. Accessed June 2009.
- National Quality Forum. Safe Practices for Better Healthcare. Available at: http://www.qualityforum.org/pdf/reports/safe_practices.pdf. Accessed June 2009.
- ,,,,,; on behalf of the Committee on Manpower for Pulmonary and Critical Care Societies (COMPACCS).Critical care delivery in the United States: distribution of services and compliance with Leapfrog recommendations.Crit Care Med.2006;34:1016–1024.
- ,,, et al.Team care: beyond open and closed intensive care units.Curr Opin Crit Care.2006;12:604–608.
- ,,,,,.Association between critical care physician management and patient mortality in the intensive care unit.Ann Intern Med.2008;148:801–809.
- ,.Are intensivists safe?Ann Intern Med.2008;148:877–878.
- ,,,,,.Implementation of a voluntary hospitalist service at a community teaching hospital: improved clinical efficiency and patient outcomes.Ann Intern Med.2002;137:859–865.
- ,,, et al.Effects of physician experience on costs and outcomes on an academic general medicine service: results of a trial of hospitalists.Ann Intern Med.2002;137:866–874.
- ,,,,,.Outcomes of care by hospitalists, general internists and family physicians.N Engl J Med.2007;357:2589–2600.
- ,,, et al.An intervention to decrease catheter‐related bloodstream infections in the ICU.N Engl J Med.2006;355:2725–2732.
- ,,, et al.Descriptive analysis of critical care units in the United States.Crit Care Med.1992;20:846–863.
- .Leapfrog and critical care: evidence‐ and reality‐based intensive care for the 21st century.Am J Med.2004;116:188–193.
- ,,,,.The organization of intensive care unit physician services.Crit Care Med.2007;35:2256–2261.
- ,.The evolution of the hospitalist movement in the USA.Clin Med.2002;2:327–330.
- ,,, et al.Guidelines on critical care services and personnel: recommendations based on a system of categorization of three levels of care.Crit Care Med.2003;31:2677–2683.
Organization of physician services in intensive care units (ICUs) varies widely and influences mortality, morbidity, and costs of care. Intensive care provided by intensivists in a high‐intensity physician staffing model, in which intensivists are the sole attending physicians or consult on all patients, has been associated with desirable outcomes such as decreased length of stay, resource utilization, and mortality.1‐4 As a result, higher intensity ICU models have been recommended by various healthcare agencies, including the National Quality Forum and the Leapfrog Group.5‐7
One national survey indicated that 47% of ICUs surveyed had some intensivist coverage and only 4% of intensive care units met Leapfrog high‐intensity model standards.8 However, only one‐third of ICUs responded to this survey, smaller ICUs were overrepresented, and the survey may not have reflected the influence of newer policy initiatives because it was conducted in 1997. Though the attributes by which intensivists improve patient outcomes is unknown, researchers have suggested it is by having a knowledgeable physician present in the ICU, having a physician communicate with other clinicians and families, and by having a physician who manages the ICU by writing policies and procedures and administrative activities.9
Results have been conflicting as patients managed by intensivists have also been found to have an increased mortality, particularly when managed on an elective consultation basis in an open ICU, where patient orders are written by several physician specialties.10, 11 Alternative ICU staffing models, such as the use of hospitalists, have been utilized to compensate for the intensivist workforce shortage. Hospitalists often provide ICU care, although they are seldom board‐certified in critical care. Hospitalist care has been shown to provide clinical and efficiency benefits such as decreased length of hospital stay.12‐14
Understanding the manner in which critical care is currently delivered, particularly the utilization of intensivist and nonintensivist care providers, can provide insights into subsequent allocation of a limited intensivist workforce as nonintensivist care providers such as hospitalists become more available. To understand how intensivists and other practitioners, such as hospitalists, deliver critical care in Michigan, we performed a cross‐sectional survey of Michigan hospitals participating in the Keystone ICU project, a statewide quality‐improvement initiative.
Methods
The hospitals involved and the methods of Keystone ICU have been published previously.15 The Keystone ICU project is a collaborative quality improvement initiative first organized in October 2003 by the Michigan Health and Hospitals Association (MHA) Keystone Center for Patient Safety and Quality. At its inception, 103 ICUs voluntarily agreed to participate in Keystone ICU and reported data representing 85% of ICU beds in Michigan. Nonparticipating hospitals (n = 37) were smaller, 79% having fewer than 100 beds, many of which did not have ICUs. All ICUs from the 72 hospitals participating in the Keystone ICU project as of July 2005 were asked to complete surveys as part of ongoing data collection.
Keystone ICU sought to improve safety culture, increase adherence to evidence‐based practices among patients receiving mechanical ventilation, and reduce central lineassociated bloodstream infections and ventilator‐associated pneumonia through a number of interventions. Keystone also encouraged teams to standardize their physician staffing, and presented teams with evidence regarding the benefits of ICU physician staffing. Because many of the ICUs were small and believed it was not practical to staff their ICUs with intensivists, Keystone encouraged ICUs to create as many of the attributes of intensivist staffing as possible: having someone present who is knowledgeable, able to manage at the unit level, and who communicates well with clinicians and families.9 As part of this project, we developed a survey to describe the physician staffing in Michigan ICUs. Additional elements of the survey sought to ascertain how medical decision‐making occurred, which decisions were made by what types of clinicians, and who performed various procedures in the ICU.
Survey Development
The survey for this study was developed based on expert opinion and on previous work by the research team (A.D.A., P.J.P., S.A.F.). The survey was pilot tested in a small group of non‐Michigan hospitals and found to be understandable and readable. The survey was then revised and disseminated to all hospitals participating in the Keystone ICU project. Construct validity was determined by review of literature and discussion with the research team (A.D.A., P.J.P., S.A.F., R.C.H.). Content validity was determined by the pilot test, which included interviews with the individuals who pilot‐tested the survey. The survey sought to describe the organization of ICU physician services (including both intensivist and nonintensivist). A copy of the survey is available upon request.
Survey Protocol
Surveys were sent by e‐mail to the official nurse and/or physician project leader at each site in July 2005 from contact information provided by MHA. Another copy of the survey was emailed to ICUs that did not respond to the initial survey after 3 months and, if needed, a third survey was sent at 6 months with a follow‐up telephone call by 1 of the investigators (R.C.H.). The completed surveys were returned to MHA for compilation and analysis. The research project was reviewed by the University of Michigan Institutional Review Board and determined to be exempt from ongoing IRB review per federal exemption category 45 CFR 46.101.(b). The funder was not involved in the design of the study, collection, analysis, and interpretation of the data, or the decision to approve publication of the finished manuscript.
Statistical Analysis
Survey respondents were first characterized using simple univariable and bivariable methods. When appropriate, groups were compared based on chi‐square, Mann‐Whitney U test, or t test. Additionally, a series of multivariable analyses was performed, which sought to understand structural factors associated with the presence of higher‐intensity models, as well as use of hospitalists or intensivists. Results of the multivariate analysis are reported as odds ratios (ORs) and 95% confidence intervals (CIs). The critical region was defined as an alpha of 0.05. Statistical analysis was performed using SAS (version 9.1; SAS Institute, Inc., Cary, NC).
Results
Response Rate
Ninety‐seven responses were received, including at least 1 response from every Keystone ICU hospital located in Michigan. Because our goal was to describe the organization of ICU physician services in non‐Federal hospitals, 1 Michigan VA hospital was eliminated from further consideration. Four hospitals with more than 1 ICU, which delivered care identically in all of their ICUs, provided 1 response and were counted as 1 site. As a result, 96 survey responses representing 115 ICUs in 72 Michigan hospitals were each counted as 1 site in the analysis. This included responses from ICUs not included in earlier analyses, which joined Keystone ICU after earlier work had been underway.15
Baseline Demographics
The mean (standard deviation [SD]) hospital size represented in the survey was 280 (22) beds, with a median of 249 (range, 40‐1031) beds. The mean size (SD) of the ICU was 13.3 (7.0) beds, median 12 beds, range 4 to 42 beds. There were 16 ICUs dedicated exclusively to the care of medicine patients, 14 dedicated surgical units, 8 dedicated cardiac ICUs, and 3 dedicated Neuro ICUs. The remainder had a mixed patient population. Seventy‐one ICUs (74%) cared for medical patients, 69 (72%) cared for surgical patients, 64 (67%) cared for cardiac patients, and 52 (53%) cared for neurological patients.
ICU Staffing Models
To better understand the role of intensivists in critical care delivery in Michigan, we examined differences in sites where patients are managed as closed sites exclusively by intensivists (closed ICU sites) in comparison to ICUs that had multiple attending specialties (open ICU sites). In addition, ICU sites where intensivists made most clinical decisionsa circumstance likely reflecting a high‐intensity staffing model of care5were compared with ICUs sites where decision‐making was made by nonintensivists or was shared (Table 1). Twenty‐four of 96 (25%) ICU sites were closed, and only intensivists served as the attending of record. Hospitals with closed ICUs or in which intensivists made most clinical decisions were larger and had larger ICUs than sites with open ICUs or with nonintensivist decision‐making (P < 0.05). These 24 closed sites represented 17 of 72 hospitals (24%), with the remainder of hospitals (76%) not having closed ICUs. Intensivists participated in rounds in 43 of 72 sites (60%) that were not closed. House officer participation in the care of ICU patients was not related to the presence or absence of intensivists (2 = 0.04; P = 0.847), although the average size of hospitals with house officers was larger than those without house officers (P < 0.0001).
| Closed ICUs (n = 24) [n (%)] | Open ICUs (n = 72) [n (%)] | Intensivist Decision‐making (n = 30) [n (%)] | Shared Decision‐making (n = 31) [n (%)] | Nonintensivist Decision‐making (n = 34) [n (%)] | |
|---|---|---|---|---|---|
| |||||
| ICU beds (mean SD) | 21.8 15.3* | 15.2 13.0* | 21.3 18.7* | 19.2 13.4 | 10.5 5.2* |
| Hospital beds (mean SD) | 489.8 295.3* | 326.3 222.6* | 460.8 222.3* | 408.6 259.7 | 247.8 230.0* |
| Nonintensivist attendings | |||||
| Hospitalist | 34 (47.2) | 9 (30) | 14 (45.1) | 13 (38.2) | |
| Primary care physician | 55 (76.4) | 11 (36.7) | 23 (74.2) | 27 (79.4) | |
| Cardiologist | 54 (75) | 10 (33.3) | 25 (80.6) | 23 (67.6) | |
| Pulmonologist | 34 (47.2) | 9 (30) | 15 (48.3) | 15 (44.1) | |
| Other IM specialist | 48 (66.7) | 11 (36.7) | 25 (80.6) | 17 (50) | |
| Surgeon | 59 (81.9) | 14 (46.7) | 25 (80.6) | 27 (79.4) | |
| Critical care board certification (% of attending physicians) | (n = 28) | (n = 31) | (n = 33) | ||
| 100 | 11 (45.8) | 7 (10.1) | 11 (39.3) | 6 (19.4) | 0 (0) |
| 75 | 3 (12.5) | 6 (8.7) | 7 (25.0) | 2 (6.5) | 0 (0) |
| 50 | 2 (8.3) | 4 (5.8) | 3 (10.7) | 2 (6.5) | 1 (3.0) |
| <50 | 8 (33.3) | 52 (75.4) | 7 (25.0) | 21 (67.7) | 32 (97.0) |
| ICU administration | |||||
| ICU director financial support | 18 (75.0) | 49 (68.1) | 25 (83.3) | 23 (74.2) | 18 (52.9) |
| Meeting with ICU team | 21 (87.5) | 56 (77.8) | 26 (86.7) | 27 (87.1) | 23 (67.7) |
| M&M sessions | 9 (37.5) | 33 (45.8) | 16 (53.3) | 12 (38.7) | 14 (41.2) |
Multivariate analysis determined that the presence of hospitalists serving as attending physicians was strongly associated with an open ICU (OR = 12.2; 95%CI = 2.5‐60.2), as was the absence of intensivists at the site (OR = 12.2; 95%CI = 1.4‐105.8), while ICU and hospital size were not associated. When the analyses were limited to hospitals with intensivists (n = 69), decision‐making by intensivists was not associated with ICU or hospital size (OR = 1.0; 95%CI = 1.0‐1.0); or whether hospitalists acted as attendings (OR = 0.7; 95%CI = 0.2‐2.0).
Board Certification and ICU Administration
Only 18 sites (20%) acknowledged that 100% of their ICU attending physicians were board‐certified in critical care, with nearly two‐thirds of sites having fewer than 50% critical‐care board‐certified attending physicians (Table 1). The medical director of the ICU met for an administrative meeting with the ICU team of nurses, respiratory therapists, and other personnel on a regular (ie, at least quarterly) basis at 77 sites (80%) and held regular morbidity and mortality sessions to discuss ICU care with other physicians who work in the ICU at 43 sites (45%). The majority of sites (n = 67; 70%) provided salary support for the ICU medical director.
Critical‐care board‐certification was more common at sites with closed ICUs and at sites where decision‐making was performed by intensivists (P < 0.001). However, board‐certification was not uniform in closed ICUs (100% certification = 46%, >50% certification = 67%) or in ICUs where intensivists made most decisions (100% certification = 39%, >50% certification = 75%).
Hospitals in which hospitalists served as attending physicians were less likely to have 50% or greater critical‐care board‐certification in their ICU (OR = 0.13; 95%CI = 0.03‐0.50). ICU size, hospital size, and years in practice were not associated with critical‐care board‐certification. Hospital size, ICU size, and the presence of intensivists or hospitalists were not associated with whether the medical director receives support from the hospital.
Physician Extenders
Nineteen sites (20%) reported the utilization of advanced practice nurses; 15 sites (16%) reported use of physician assistants; and 7 sites (7%) reported use of both advance practice nurses and physician assistants to provide intensive care. Physician extenders were not more likely to work in closed ICUs (10/24) than in open ICUs (14/72) (2 = 3.63; P = 0.57).
Of the 27 sites reporting use of advanced practice nurses or physician assistants, the role of physician extenders was described as being similar to physicians in 8 sites (30%), somewhat autonomous but with limitations in 18 (67%), and in a role closer to a ward clerk or assistant in 1 site (4%). The activities of physician extenders included writing orders at 24 of these 27 sites (89%); writing progress notes at 25 sites (92%); communicating with consultants at 24 (89%) and with primary care physicians at 22 sites (82%); and coordinating discharge plans at 20 sites (74%). Physician extenders rounded alone at 16 sites (33%).
Clinical Activities
Intensivists participated in daily rounds at most sites (n = 67; 70%). Nonintensivists served as attending of record in 72 (75%) sites. Nonintensivist physicians participating in daily patient rounds were: surgeons (n = 66; 68% of sites), primary care physicians (n = 61; 64%), nonpulmonary internal medicine specialists (n = 53; 55%), cardiologists (n = 58; 60%), non‐critical‐care pulmonologists (n = 39; 41%), and hospitalists (n = 36; 38%). Intensivists were the primary decision‐makers at 30 sites (31%), nonintensivists at 34 (35%), and decision making was shared at 31 (32%).
At more than one‐half of sites, decisions regarding mechanical ventilation, the use of sedatives or paralytics, and the choice of vasopressor agents were made by intensivists, with other decisionssuch as the decision to call consultants, choice of antibiotics, or family meetingsshared between intensivists and nonintensivists more than 40% of the time (Table 2). During regular working hours, invasive procedures were performed by multiple clinicians, including house officers, intensivists, surgeons, and anesthesiologists and were not the province of any particular type of clinician (Table 3).
| Decision‐making | |||
|---|---|---|---|
| Intensivist n (%) | Nonintensivist n (%) | Shared n (%) | |
| |||
| Ventilator management | 62 (66.7) | 24 (25.8) | 7 (7.5) |
| Choice of ventilator weaning strategies | 64 (68.8) | 24 (25.8) | 5 (5.4) |
| Decision to extubate | 63 (68.5) | 24 (26.1) | 5 (5.4) |
| Choice of sedation or paralytic agents | 56 (65.1) | 24 (27.9) | 6 (7.0) |
| Choice of vasopressor agents | 47 (51.1) | 25 (27.1) | 20 (21.7) |
| Decision to call other consultants (eg, cardiology, infectious diseases) | 19 (20.4) | 31 (33.3) | 43 (46.2) |
| Choices related to more general medical management (eg, antibiotics, diabetes management) | 30 (32.2) | 25 (26.9) | 38 (40.1) |
| Family meetings, code status discussions | 26 (28.6) | 26 (28.6) | 39 (42.8) |
| Procedure | Hospitalist n (%) | Intensivist n (%) | Surgeon n (%) | Anesthesiologist n (%) | House Officer or Other MD n (%) | Other non‐MD n (%) |
|---|---|---|---|---|---|---|
| Arterial line placement | 15 (15.6) | 50 (52.1) | 40 (41.7) | 31 (32.3) | 59 (61.4) | 7 (7.3) |
| Femoral venous line placement | 14 (14.6) | 54 (56.3) | 42 (43.8) | 17 (17.7) | 55 (57.3) | 4 (4.2) |
| Subclavian or internal jugular line placement | 14 (14.6) | 54 (56.2) | 47 (49.0) | 25 (26.0) | 62 (64.6) | 5 (5.2) |
| Pulmonary artery catheterization | 8 (8.3) | 56 (58.3) | 24 (25.0) | 21 (21.9) | 54 (56.2) | 2 (2.1) |
| Intubation | 14 (14.6) | 47 (49.0) | 14 (14.6) | 74 (77.1) | 42 (43.8) | 15 (15.6) |
| Bronchoscopy | 2 (2.1) | 67 (69.8) | 17 (17.7) | 5 (5.2) | 29 (30.2) | 0 (0) |
Regardless of the staffing model employed, the majority of sites (88%) provided care on a call‐based, rather than shift‐based system. Nighttime admissions and cross‐coverage issues were handled by house officers at more than one‐third of sites, with nonintensivist house physicians performing these tasks at 15% of sites (Table 4). Intensivists managed cross‐coverage issues by telephone at 29% of sites, and saw new admissions in person after hours at 8% of sites. Intensivists did not deliver care in scheduled shifts at any of these sites.
| Care Provider | Nighttime Admissions n (%) | Cross‐coverage n (%) |
|---|---|---|
| ||
| Emergency room physician | 13 (13.5) | 8 (8.3) |
| House physician | 15 (15.6) | 17 (17.7) |
| House officer | 42 (43.8) | 37 (38.5) |
| ICU nurse | 5 (5.2) | 10 (10.4) |
| PA or NP | 8 (8.3) | 5 (5.2) |
| Intensivist in person | 8 (8.3) | |
| Intensivist by telephone | 28 (29.2) | |
| Other | 9 (9.4) | 9 (9.4) |
Discussion
As all Keystone ICU participating sites responded to the questionnaire, we believe these results to be representative of critical care practice in the state of Michigan at the present time. Michigan ICU staffing structures are variable. Only a minority (25%) of Michigan Keystone ICU sites operated in an environment where intensivists are the only attending physicians of record. Although intensivists rounded in 60% of sites not utilizing a closed model, 75% of sites had nonintensivist attending physicians, with primary care physicians and hospitalists commonly providing ICU services. The utilization of hospitalists to provide critical care services was found in the absence of intensivists, regardless of hospital or ICU size.
Closed ICUs were seen in larger hospitals and in larger ICUs. This finding is similar to data obtained on a national level.8‐16 A high‐intensity model of care was also uncommon, although decision‐making was at least shared between intensivists and nonintensivists at two‐thirds of sites. These findings are in keeping with the observation that intensivist‐directed care advocated by the Leapfrog Group has not been widely implemented,17 including in Michigan, a regional rollout leader for the Leapfrog Group.
Fewer ICUs reported utilizing a nonintensivist model than was reported in the survey by Angus et al.,8 where approximately one‐half of ICUs delivered care in this manner. This survey was performed in 1997, prior to the launch of the Leapfrog Group effort, and may have reflected a relative over representation of smaller, general ICUs. Our study is the first statewide analysis of critical care practices in the postLeapfrog Group era. Our finding that an array of approaches to critical care delivery existed in Michigan, even when intensivists rounded on patients, is similar to that found among Leapfrog‐compliant hospitals sampled from several regions of the United States.18
Other than intensivists, surgeons, primary care, and hospitalist physicians provided care in Michigan ICUs. The hospitalist movement is relatively new.19 However, in our survey 37.5% of sites had hospitalists serving as attending physicians. Although the closed ICU model was more prevalent in larger ICUs and hospitals, the use of a hospitalist model to staff ICUs was not related to hospital size, but was instead a function of whether or not intensivists were present in a given setting. In lieu of a projected shortage of intensivists, we believe this confirms the crucial role that hospitalists will play in the provision of critical care services in the future.
The attributes of intensivist care that led to improved outcomes in previous studies1‐4 are unknown. To the extent that the involvement of intensivists on an elective rather than mandatory consultative basis may explain the higher mortality found in 1 recent study,1011 we hypothesize that having a knowledgeable physician present who communicates with clinicians and families and manages at the unit level is an important factor leading to improved outcomes. While hospitalists can have these attributes, their knowledge of specific critical care therapies and technologies may vary with the extent of their ICU training and experience. Further research should seek to quantify the attributes by which intensivists are associated with improved outcomes and seek ways to foster those attributes among hospitalists who participate in critical care delivery. Central to this will be ensuring that training programs ensure competency in critical care therapies and technologies among hospitalists and other non‐ICU physicians.
We recognize several limitations in this study. First, the validity of the survey may introduce misclassification of ICU staffing. However, the survey instrument was informed by previously‐validated instruments and experts in ICU physician staffing and hospitalist care. Second, we did not link variation in staffing to outcomes. While such analysis is important, it is beyond the scope of this survey. Third, our study was conducted in 1 state and the results may not be generalizable across the United States. Nevertheless, Michigan is a large state with a diverse array of hospitals, and as our study sample broadly represented this diversity, we believe our results are likely to be generalizable.
In conclusion, few ICUs in Michigan are closed and many utilize nonintensivist critical‐care providers such as hospitalists, primary care providers, and physician extenders to deliver clinical care. Our findings have significant implications for future efforts at a national level that involve the training of hospitalists and their acceptance as critical care practitioners. We suggest future research involving intensive care delivery focus on the feasibility of training sufficient hospitalists to satisfy a growing need for critical care that cannot be filled by intensivists, along with strategic planning to insure the model of care provided is commensurate with the complexity of illness. Although this approach appears to be occurring in Michigan on an ad hoc basis, we believe coordination between larger, intensivist‐run ICUs and smaller, nonintensivist‐run ICUs should be formalized in order to optimize the delivery of intensive care.25
- ,,, et al.;the members of the American College of Critical Care Medicine Task Force on Models for the Definition of an Intensivist and the Practice of Critical Care Medicine. Critical care delivery in the intensive care unit: defining clinical roles and the best practice model.Crit Care Med.2001;29;2007–2019.
- ,,, et al.Effects of organizational change in the medical intensive care unit of a teaching hospital: a comparison of “open” and “closed” formats.JAMA.1996;276:24–31.
- ,,, et al.A “closed” medical intensive care unit (MICU) improves resource utilization when compared with an “open” MICU.Am J Respir Crit Care Med.1998;157:1468–1473.
- ,,, et al.Effects of an organized critical care service on outcomes and resource utilization: a cohort study.Crit Care Med.1999;27:270–274.
- ,,,,,.Physician staffing patterns and clinical outcomes in critically ill patients.JAMA.2002;288:2151–2162.
- Leapfrog Group. Leapfrog Group Factsheet: ICU physician staffing (IPS). Available at: http://www.leapfroggroup.org/media/file/Leapfrog‐ICU_ Physician_Staffing_Fact_Sheet.pdf. Accessed June 2009.
- National Quality Forum. Safe Practices for Better Healthcare. Available at: http://www.qualityforum.org/pdf/reports/safe_practices.pdf. Accessed June 2009.
- ,,,,,; on behalf of the Committee on Manpower for Pulmonary and Critical Care Societies (COMPACCS).Critical care delivery in the United States: distribution of services and compliance with Leapfrog recommendations.Crit Care Med.2006;34:1016–1024.
- ,,, et al.Team care: beyond open and closed intensive care units.Curr Opin Crit Care.2006;12:604–608.
- ,,,,,.Association between critical care physician management and patient mortality in the intensive care unit.Ann Intern Med.2008;148:801–809.
- ,.Are intensivists safe?Ann Intern Med.2008;148:877–878.
- ,,,,,.Implementation of a voluntary hospitalist service at a community teaching hospital: improved clinical efficiency and patient outcomes.Ann Intern Med.2002;137:859–865.
- ,,, et al.Effects of physician experience on costs and outcomes on an academic general medicine service: results of a trial of hospitalists.Ann Intern Med.2002;137:866–874.
- ,,,,,.Outcomes of care by hospitalists, general internists and family physicians.N Engl J Med.2007;357:2589–2600.
- ,,, et al.An intervention to decrease catheter‐related bloodstream infections in the ICU.N Engl J Med.2006;355:2725–2732.
- ,,, et al.Descriptive analysis of critical care units in the United States.Crit Care Med.1992;20:846–863.
- .Leapfrog and critical care: evidence‐ and reality‐based intensive care for the 21st century.Am J Med.2004;116:188–193.
- ,,,,.The organization of intensive care unit physician services.Crit Care Med.2007;35:2256–2261.
- ,.The evolution of the hospitalist movement in the USA.Clin Med.2002;2:327–330.
- ,,, et al.Guidelines on critical care services and personnel: recommendations based on a system of categorization of three levels of care.Crit Care Med.2003;31:2677–2683.
Copyright © 2010 Society of Hospital Medicine
Hospital Leader Survey
In the late 1990s, hospitalist systems grew rapidly in an environment where cost containment was paramount, complexity of patients increased, and outpatient practices experienced increasing productivity and efficiency pressures.15 While the healthcare delivery environment has changed significantly since that time,68 hospitalists have continued to become more common. In fact, the field's present size of more than 25,000 has already exceeded early projections, and there are no signs of slackening demand.911
Growth has been attributed to primary care physicians' increasing focus on outpatient care, hospitals' response to financial pressures, and the need to facilitate improved communication among various hospital care providers.1216 Hospital leadership has played a similarly important role in fueling the growth of hospitalists, particularly since the vast majority of programs require and receive institutional (usually hospital) support.17 However, the factors that continue to influence leaders' decisions to utilize hospitalists and the current and future needs that hospitalists are fulfilling are unknown. Each of these factors is likely to impact growth of the field, as well as the clinical and organizational identity of hospitalists. In addition, an understanding of the market demand for hospitalists' competencies and the roles they play in the hospital may inform any changes in board certification and training for hospitalists.11, 1821
To gain a more complete understanding of a key part of the engine driving the growth of hospitalists, we performed a cross‐sectional survey of California hospital leaders who were involved with the funding or administration of their hospitalist groups. Our survey aimed to understand: (1) the prevalence of hospitalist groups in California hospitals, (2) hospital leaders' rationale for initiating the use of hospitalists, (3) the scope of clinical and nonclinical practice of hospitalists, and 4) hospital leaders' perspective on the need for further training and/or certification.
Materials and Methods
Sites and Subjects
We targeted all nonfederal, nonspecialty, acute care hospitals in California (n = 334) for this survey. We limited our survey to California in order to maximize our local resources and to improve implementation of and response to the survey. Additionally, California's size and diversity gives it disproportionate impact and potential generalizability. At each site, we focused our efforts on identifying and surveying executives or administrative leaders involved in organizational and staff decisions, specifically the decision whether or not to hire and/or fund a hospitalist program and potentially direct its activities (described in more detail below). The University of California, San Francisco, Committee on Human Research approved the research protocol.
We identified hospital leaders at each site by merging information from multiple sources. These included the American Hospital Association database, the California Hospital Association, the Hospital Association of Southern California (HASC), the California Health Care Safety Net Institute, and individual hospital websites.
Survey Development
Our survey was based upon instruments used in previous research examining hospital medicine group organizational structure15, 22 and enhanced with questions developed by the research team (A.D.A., E.E.V., R.M.W.). The survey was pretested in an advisory group of 5 hospital Chief Executive Officers (CEOs), Chief Medical Officers (CMOs), and Vice Presidents for Medical Affairs (VPMAs) from sites across California. Based on their input, we removed, edited, or added questions to our survey. This advisory group also helped the research team design our survey process.
Our final survey defined a hospitalist as a physician who spends all or the majority of his or her clinical, administrative, educational, or research activities in the care of hospitalized patients.4 We collected data in 4 areas: (1) We asked hospital leaders to confirm the presence or absence of at least 1 hospitalist group practicing within the surveyed hospital. We also asked for the year the first hospitalist group began practicing within the specified hospital. (2) We asked hospital leaders to indicate, among a prespecified list of 11 choices, the reason(s) they implemented a hospitalist group at the surveyed hospital. Surveyed categories included: (a) care for uncovered patients (patients without an identified doctor and/or uninsured), (b) improve costs, (c) improve length of stay, (d) improve emergency department throughput, (e) primary care provider demand, (f) improve patient satisfaction, (g) improve emergency room staffing, (h) quality improvement needs, (i) specialist physician demand, (j) overnight coverage, and (k) surgical comanagement. Due to the close relationship between cost and length of stay, we combined these 2 categories into a single category for reporting and analysis. This resulted in 10 final categories. We asked leaders who did not identify a practicing hospitalist group about the likelihood of hospitalists practicing at their hospital within the next 5 years and the reason(s) for future implementation. (3) We asked leaders to describe the services currently provided among a prespecified list of clinical care duties that go beyond the scope of inpatient general internal medicine (eg, surgical comanagement, rapid response team leadership) as well as nonclinical duties (eg, quality improvement activities, systems project implementation). If hospitalists did not currently provide the identified service, we asked leaders to indicate if they would be inclined to involve hospitalists in the specified service in the future. (4) Finally, we asked hospital leaders their opinion regarding the need for further training or certification for hospitalists.
Survey Protocol
We administered surveys between October 2006 and April 2007. We initially emailed the survey. We repeated this process for nonrespondents at intervals of 1 to 3 weeks after the initial emailing. Next, we sent nonrespondents a physical mailing with a reminder letter. Finally, we made phone calls to those who had not responded within 4 weeks of the last mailed letter. We asked survey recipients to respond only if they felt they had an adequate working knowledge of the hospitalist service at their hospital. If they did not feel they could adequately answer all questions, we allowed them to forward the instrument to others with a better working knowledge of the service.
Because we allowed recipients to forward the survey, we occasionally received 2 surveys from 1 site. In this case, we selected the survey according to the following prioritization order: (1) CEOs/COOs, (2) CMOs, (3) VPMAs, and (4) other vice presidents (VPs) or executive/administrative leaders with staff organization knowledge and responsibilities.
Hospital Descriptive Data
We obtained hospital organizational data from the California Office of Statewide Health Planning and Development's (OSHPD) publicly available Case Mix Index Data, hospital Annual Financial Data, aggregated Patient Discharge Data, and Utilization Data from 2006.23 Organizational characteristics included hospital size, location, profit status, payor mix, and diagnosis‐related groupbased case‐mix. Teaching status was determined from the 2005 American Hospital Association database. Membership status in California's voluntary quality reporting initiative, California Hospital Assessment and Reporting Taskforce (CHART), was publicly available at
Statistical Analyses
We performed univariable analyses to characterize survey respondents, followed by bivariable analyses to compare hospital characteristics and patient mix of responding and nonresponding hospitals. We used similar methods to characterize respondent hospitals with and without at least 1 hospitalist group. We compared continuous data with the Students t tests or Mann‐Whitney tests as appropriate and categorical data with chi‐square tests.
We then summarized the number of times a specific rationale was cited by hospital leaders for implementing a hospitalist group. Among hospitals that did not have a hospitalist system in place at the time of the survey, we asked if they were planning on starting one within the next 5 years. For these hospitals, we used content analysis to summarize open‐ended responses in order to understand factors that are currently influencing these hospital leaders to consider implementing a hospitalist group.
Next, we aimed to understand what clinical and nonclinical roles hospitalists were performing in hospitals with established hospitalist programs. Clinical activities were divided into general clinical areas, triage/emergency‐related, or administrative activities. First, we summarized the number and percent of programs performing each clinical and nonclinical activity. This was followed by logistic regression analyses to assess whether the time period that hospitalist groups began practicing or additional hospital characteristics predicted the performance of individual hospitalist activities. To guard against overfitting of models, analyses were limited to rationales that were cited a minimum of 50 times.24 Hospital factors were selected on the basis of face validity and advisory group input and included hospital bed size, ownership status (public vs. private), teaching status, and membership status in CHART. We divided the year of hospitalist program implementation into 3 time periods: (1) before 2002, (2) between 2002 and 2004, and (3) 2005 or later.
Finally, we described the percentage of hospitals that favored having their hospitalist group(s) perform each of the identified clinical or nonclinical activities, if they were not already performing them. We performed analyses with statistical software (Stata Version 9.2, College Station, TX).
Results
Respondent Characteristics
We received 200 survey responses. Of those, we excluded 15 duplicates (eg, a survey from both the CEO and VPMA) and 6 responses identified as coming from hospitalists who did not have a leadership position in the hospital. Thus, the final hospital leader survey response rate was 54% (n = 179). Forty‐six percent of the final responses were from CEOs or COOs; 37% of responses were from CMOs, VPMAs, and medical directors; and the remaining 17% of responses were from other VPs or administrative directors.
Respondent and nonrespondent hospitals were statistically similar in terms of teaching status and participation in CHART. Hospital patient census, intensive care unit census, payer mix, and diagnosis‐related groupbased case‐mix revealed no statistically significant differences between groups (P > 0.05). Respondent hospitals tended to have fewer beds and were more often for‐profit compared to nonrespondents (P = 0.05 and P < 0.01, respectively).
Descriptive Characteristics of Hospitals with Hospitalists
Sixty‐four percent (n = 115) of hospital leaders stated that they utilized hospitalists for at least some patients. Hospitals with hospitalists were statistically more likely (P < 0.05) to be larger, a major teaching hospital, or a member of a voluntary quality reporting initiative (Table 1).
| Variable | Hospitals without Hospitalists (n = 64) [n (%)] | Hospitals with Hospitalists (n = 115) [n (%)] | P Value* |
|---|---|---|---|
| |||
| Hospital size (total number of beds) | |||
| 0‐99 | 33 (51.6) | 18 (15.7) | <0.001 |
| 100‐199 | 19 (29.7) | 32 (27.8) | |
| 200‐299 | 5 (7.8) | 23 (20.0) | |
| 300+ | 7 (10.9) | 42 (36.5) | |
| Hospital control | 0.12 | ||
| City/county | 8 (12.5) | 7 (6.1) | |
| District | 15 (23.4) | 17 (14.8) | |
| For‐profit | 10 (15.6) | 16 (13.9) | |
| Non‐profit | 31 (48.4) | 71 (61.7) | |
| University of California | 0 (0.0) | 4 (3.5) | |
| Teaching hospital | 8 (12.5) | 30 (26.1) | 0.03 |
| Member of voluntary quality reporting initiative | 27 (42.2) | 93 (80.9) | <0.001 |
Among all hospitals with hospitalists, 39% estimated that hospitalists cared for at least one‐half of admitted medical patients, and 7% stated that hospitalists cared for all patients. Twenty‐four percent of respondents were unable to provide a quantitative estimate of the percent of patients cared for by hospitalists. When asked about expectations of growth in the coming year, 57% of respondents with hospitalists expected to see increases in the number of hospitalists at their hospital, and none expected a decrease. Among the 64 respondent hospitals that currently did not have a hospitalist program, 44% (n = 28) of the hospital leaders felt hospitalists would be managing patients in the future. Of those, 93% felt this would occur within the next 2 years.
Reasons for Implementing Hospitalists
Hospital leaders reported that the most important reasons for implementing a hospitalist model included caring for uncovered patients (68%), decreasing hospital costs and length of stay (63%), and improving throughput in the emergency room (62%). We provide additional reasons in Figure 1. In addition, leaders often identified multiple factors in the decision to utilize hospitalists, including demand from primary care doctors, patient satisfaction, and quality improvement. Among the 28 hospitals that currently did not have hospitalists but anticipated that they would soon (data not shown), the need to improve quality was the most commonly cited reason (54% of respondents) for expecting to start a program within 2 years, followed by demand from primary care doctors (46% of respondents).

Clinical Practice of Hospitalists and Expectations for Future Growth
Hospitalists perform a wide array of clinical and nonclinical duties (Figure 2). In addition to general medical care, the most common clinical activities of hospitalists included screening medical admissions from the emergency room for appropriateness of admission and triaging to appropriate level of care (67%), triaging patients transferred from an outside hospital (72%), and comanaging surgical patients (66%). The most common nonclinical activity was participation in quality improvement activities (72%). Multivariable analyses demonstrated that the performance of the most prevalent activities was not usually associated with the year of hospitalist implementation or hospital characteristics. An exception was that newly initiated programs had a statistically significant decreased odds of involvement in clinical guideline development (odds ratio [OR], 0.3; 95% confidence interval [CI], 0.1‐0.9) and a trend toward decreased leadership in quality improvement (OR, 0.3; 95% CI, 0.1‐1.1). Hospitalists at teaching hospitals had increased odds of managing patient transfers (OR, 4.7; 95% CI, 1.0‐21.2), whereas for‐profit hospitals had lower odds of screening patients in the emergency room (OR, 0.1; 95% CI, 0.0‐0.7).
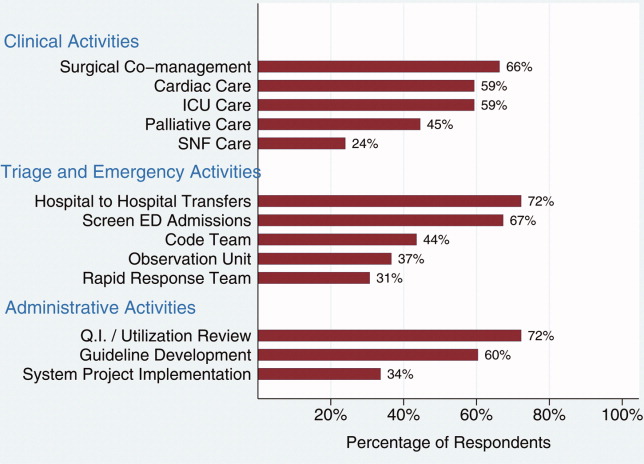
Among those hospitals with hospitalists who were not presently involved in any of the above activities, there was a widespread interest among hospital leaders to have their hospitalist group(s) lead or participate in them (Figure 3). The most commonly cited activities included participation in inpatient clinical guideline development (85%), implementation of system‐wide projects (81%) (eg, computerized physician order entry system), participation on a rapid response team (80%), and caring for patients in an observation unit (80%).
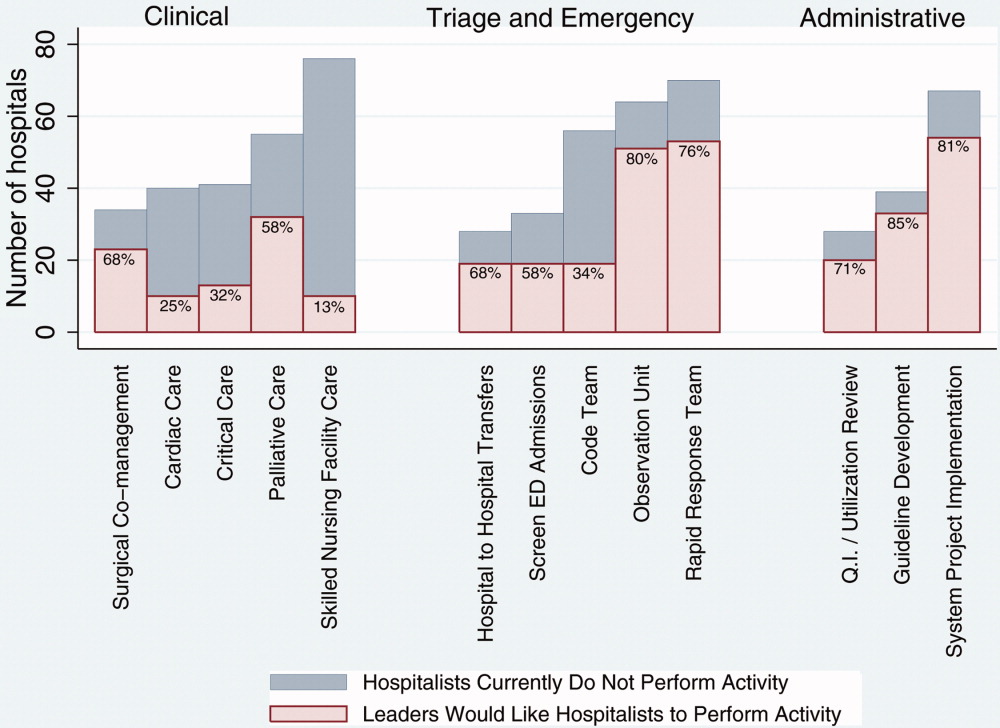
Training and Certification for Hospitalists
About two‐thirds (64%) of hospital leaders with a hospitalist group(s) agreed or strongly agreed that hospitalists should have additional training and/or certification. Seventeen percent were undecided, whereas 11% either disagreed or strongly disagreed, and the remaining 8% did not provide an opinion.
Discussion
Most California hospital leaders reported utilizing hospitalists, and a substantial number of those without a hospitalist service plan to implement one in the next 5 years. Our data suggest that the number of hospitalists and their roles will continue to expand, with quality improvement activities and participation in clinical roles outside of general medical care being key priorities for future growth. Interestingly, much of this growth may not be catalyzed by past drivers (such as need to contain costs or length of stay) but by increasing need to implement quality and safety initiatives, as well as demand from other physicians. As a result, the field of hospital medicine will grow in numbers and breadth of practice. Defining the typical practice of a hospitalist may become more challenging.
Consistent with previous work,11, 16 our data suggest widespread adoption of hospitalists. While our data demonstrates that academic hospitals in California were more likely to have hospitalists, it is also important to note that hospitalist systems were widespread across a wide range of hospital sizes and ownership types. The prevalence appears likely to increase in the future. None of the hospitals surveyed planned to eliminate or reduce the size of their programs. Among hospitals without a hospitalist program, 44% (n = 28) reported they were going to implement a hospitalist group within the next 2 years. Future workforce development must consider this growth in order to increase physician supply to meet the demands of hospitalist growth.
Consistent with prior surveys of hospitalists and the healthcare marketplace,13, 15, 16, 25 our survey of hospital leaders suggests that the care of uncovered patients and the goal of improving hospital efficiency are key reasons for implementing hospitalists. Although these are important, we found that hospital leaders have additional intentions when implementing or expanding hospitalist systems, including improving patient satisfaction and quality. Although quality improvement activities were not among the most common reasons that leaders originally implemented programs, the most established programs had increased odds (relative to the most recently implemented programs) of leading quality improvement and clinical guideline activities. This may reflect a natural progression over time for hospitalist groups to develop from a patient‐focused clinical role to one that incorporates responsibilities that increasingly impact the hospital system and organization. The interest in utilizing hospitalists for leadership in quality improvement was widely expressed among those leaders who had yet to utilize hospitalists. Interestingly, this driver remains even as evidence for whether hospitalist practices produce measurable differences in care outcomes is mixed.26, 27 Nevertheless, hospital leaders are under increasing pressure to improve quality and safety (driven by public reporting and pay‐for‐performance initiatives), and many leaders appear to believe that hospitalists will be a key part of the solution.13, 28
In addition to quality improvement, continued demand for hospitalists may result from growing clinical demands, including clinical support for medical specialists and surgeons. A majority of leaders acknowledged current or future interest in having hospitalists comanage surgical patients, with the hope that such practices will improve surgeons' productivity and clinical outcomes.16, 29, 30 In addition, hospitalists may address potential shortages in specialty areas. For example, having hospitalists participate in critical care may partly ameliorate the impact of a large national shortage of critical care physicians.12, 31 If hospitalists are to assume major roles in the provision of critical care (particularly if not comanaging patients with intensivists), they may require some augmented training in the intensive care unit.
Our results paint a picture of a rapidly expanding field, both in scope and in number. Hospitalists appear to be performing a wide range of clinical, triage, and administrative activities, and there is demand among hospital leadership for hospitalists to take on additional responsibilities. Interestingly, it appears that participation in most clinical and nonclinical activities occur across the spectrum of organizational characteristics, and demand is not limited only to large or academic hospitals. Participation in such a broad array of activities brings into question the need for additional training and certification of hospitalists. While the need for hospitalists to receive additional training has been posited in the past, our data suggest there is a perceived need from the hospital administration as well. This additional training (and subsequent certification) would likely need to encompass many of the practices we have identified as core to hospitalists' practice. In addition to ensuring adequate training, policymakers will need to consider the supply of physicians necessary to meet the present and, likely, future demand for hospitalists. This is especially important in light of recent evidence of continued decreasing interest in general internal medicine, the main pool from which hospitalists are drawn.32 A shortage of internists is likely to influence expansion plans by hospitals in terms of activities in which leaders ask hospitalists to engage, or the number of hospitalists overall.
Our study has several limitations. First, a substantial number of nonrespondents may potentially bias our results. Despite this, we have drawn results across a wide range of hospitals, and the characteristics of responders and nonresponders are very similar. In addition, our study exclusively examines the responses of leaders in California hospitals. Although we sampled a large and heterogeneous group of hospitals, these results may not be entirely generalizable to other regions. As a cross‐sectional survey of hospital executives, responses are subject to leaders' recall. In particular, the reasons for implementation provided by leaders of older programs may potentially reflect contemporary reasons for hospitalist utilization rather than the original reasons. Another limitation of our study is our focus on hospital leaders' reports of prevalence and the clinical/nonclinical activities of hospitalists. Since senior executives often help begin a program but become less involved over time, executives' answers may well underestimate the prevalence of hospitalists and the breadth of their clinical practices, particularly in more mature programs. For instance, hospitalists that are part of an independent practice association (IPA) may provide functions for the IPA group that the hospital itself does not direct or fund. This effect may be more pronounced among the largest hospitals that may be organizationally complex, perhaps making suspect the responses from 7 very large hospitals that claimed not to utilize hospitalists. Finally, we collected information regarding the reasons for hospitalist group implementation and the services they provide by means of a prespecified list of answers. Although a thorough literature review and expert advisory panel guided the development of prespecified lists, they are by no means exhaustive. As a result, our prespecified lists may miss some important reasons for implementation, or services provided by hospitalists, that one could identify using an open‐ended survey. In addition, in the case of multiple responses from hospital leaders, we gave equal weight to responses. This has the effect of overestimating the weight of reasons that were less important, while underestimating the weight of reasons that may have been more important in the decision making process of implementing a hospitalist group.
While nonhospitalist physicians continue to provide a considerable proportion of hospital care for medical patients, hospitalists are assuming a larger role in the care of a growing number of patients in the hospital. The ongoing need to increase care efficiency drives some of this growth, but pressures to improve care quality and demand from other physicians are increasingly important drivers of growth. As the field grows and clinical roles diversify, there must be increased focus placed on the training requirements of hospitalists to reflect the scope of current practice and meet hospital needs to improve quality and efficiency.
Acknowledgements
The authors acknowledge Teresa Chipps, BS, Department of Medicine (General Internal Medicine and Public Health), Center for Health Services Research, Vanderbilt University, Nashville, TN, for her administrative and editorial assistance in the preparation of the manuscript.
- ,,,,,.Implementation of a hospitalist system in a large health maintenance organization: the Kaiser Permanente experience.Ann Intern Med.1999;130:355–359.
- ,,.Primary care family physicians and 2 hospitalist models: comparison of outcomes, processes, and costs.J Fam Pract.2002;51:1021–1027.
- ,.Effects of an HMO hospitalist program on inpatient utilization.Am J Manag Care.2001;7:1051–1057.
- ,.The emerging role of “hospitalists” in the American health care system.N Engl J Med.1996;335:514–517.
- .The hospitalist model: perspectives of the patient, the internist, and internal medicine.Ann Intern Med.1999;130:368–372.
- ,,,.The changing face of managed care.Health Aff.2002;21:11–23.
- .The death of managed care: a regulatory autopsy.J Health Polit Policy Law.2005;30:427–452.
- .The end of managed care.JAMA.2001;285:2622–2628.
- ,,,,,.Trends in market demand for internal medicine 1999 to 2004: an analysis of physician job advertisements.J Gen Intern Med.2006;21:1079–1085.
- ,,,.Growth in the care of older patients by hospitalists in the United States.N Engl J Med.2009;360:1102–1112.
- ,,,.The status of hospital medicine groups in the United States.J Hosp Med.2006;1:75–80.
- .Leapfrog and critical care: evidence‐ and reality‐based intensive care for the 21st century.Am J Med.2004;116:188–193.
- ,,,.Health care market trends and the evolution of hospitalist use and roles.J Gen Intern Med.2005;20:101–107.
- ,,,.Financial pressures spur physician entrepreneurialism.Health Aff.2004;23:70–81.
- ,,,,,.Physician attitudes toward and prevalence of the hospitalist model of care: results of a national survey.Am J Med.2000;109:648–653.
- ,,,.Hospitalists and care transitions: the divorce of inpatient and outpatient care.Health Aff.2008;27:1315–1327.
- Society of Hospital Medicine. 2005‐2006 SHM Survey: State of the Hospital Medicine Movement. Available at: http://dev.hospitalmedicine.org/AM/Template.cfm?Section=Survey2:102–104.
- ,,,.Hospitalists' perceptions of their residency training needs: results of a national survey.Am J Med.2001;111:247–254.
- ,,,,.The spectrum of community‐based hospitalist practice: A call to tailor internal medicine residency training.Arch Intern Med.2007;167:727–728.
- ,,,,.Fulfilling the promise of hospital medicine: tailoring internal medicine training to address hospitalists' needs.J Gen Intern Med.2008;23:1110–1115.
- ,,,.Hospitalists and the practice of inpatient medicine: results of a survey of the national association of inpatient physicians.Ann Intern Med.1999;130:343–349.
- Office of Statewide Health Planning and Development. Healthcare Information Division ‐ Data Products. Available at: http://www.oshpd.ca.gov/HID/DataFlow/HospMain.html. Accessed May2009.
- ,.Relaxing the rule of ten events per variable in logistic and Cox regression.Am J Epidemiol.2007;165:710–718.
- ,,.Hospital‐physician relations: cooperation, competition, or separation?Health Aff.2007;26:w31–w43.
- ,,,,,.Outcomes of care by hospitalists, general internists, and family physicians.N Engl J Med.2007;357:2589–2600.
- ,,, et al.Quality of care for decompensated heart failure: comparable performance between academic hospitalists and non‐hospitalists.J Gen Intern Med.2008;23:1399–1406.
- ,,.The impact of quality‐reporting programs on hospital operations.Health Aff.2006;25:1412–1422.
- ,,, et al.Medical and surgical comanagement after elective hip and knee arthroplasty: a randomized, controlled trial.Ann Intern Med.2004;141:28–38.
- ,,.Associations between the hospitalist model of care and quality‐of‐care‐related outcomes in patients undergoing hip fracture surgery.Mayo Clin Proc.2006;81:28–31.
- ,,, et al.The critical care crisis in the United States: a report from the profession.Chest.2004;125:1514–1517.
- ,,, et al.Factors associated with medical students' career choices regarding internal medicine.JAMA.2008;300:1154–1164.
In the late 1990s, hospitalist systems grew rapidly in an environment where cost containment was paramount, complexity of patients increased, and outpatient practices experienced increasing productivity and efficiency pressures.15 While the healthcare delivery environment has changed significantly since that time,68 hospitalists have continued to become more common. In fact, the field's present size of more than 25,000 has already exceeded early projections, and there are no signs of slackening demand.911
Growth has been attributed to primary care physicians' increasing focus on outpatient care, hospitals' response to financial pressures, and the need to facilitate improved communication among various hospital care providers.1216 Hospital leadership has played a similarly important role in fueling the growth of hospitalists, particularly since the vast majority of programs require and receive institutional (usually hospital) support.17 However, the factors that continue to influence leaders' decisions to utilize hospitalists and the current and future needs that hospitalists are fulfilling are unknown. Each of these factors is likely to impact growth of the field, as well as the clinical and organizational identity of hospitalists. In addition, an understanding of the market demand for hospitalists' competencies and the roles they play in the hospital may inform any changes in board certification and training for hospitalists.11, 1821
To gain a more complete understanding of a key part of the engine driving the growth of hospitalists, we performed a cross‐sectional survey of California hospital leaders who were involved with the funding or administration of their hospitalist groups. Our survey aimed to understand: (1) the prevalence of hospitalist groups in California hospitals, (2) hospital leaders' rationale for initiating the use of hospitalists, (3) the scope of clinical and nonclinical practice of hospitalists, and 4) hospital leaders' perspective on the need for further training and/or certification.
Materials and Methods
Sites and Subjects
We targeted all nonfederal, nonspecialty, acute care hospitals in California (n = 334) for this survey. We limited our survey to California in order to maximize our local resources and to improve implementation of and response to the survey. Additionally, California's size and diversity gives it disproportionate impact and potential generalizability. At each site, we focused our efforts on identifying and surveying executives or administrative leaders involved in organizational and staff decisions, specifically the decision whether or not to hire and/or fund a hospitalist program and potentially direct its activities (described in more detail below). The University of California, San Francisco, Committee on Human Research approved the research protocol.
We identified hospital leaders at each site by merging information from multiple sources. These included the American Hospital Association database, the California Hospital Association, the Hospital Association of Southern California (HASC), the California Health Care Safety Net Institute, and individual hospital websites.
Survey Development
Our survey was based upon instruments used in previous research examining hospital medicine group organizational structure15, 22 and enhanced with questions developed by the research team (A.D.A., E.E.V., R.M.W.). The survey was pretested in an advisory group of 5 hospital Chief Executive Officers (CEOs), Chief Medical Officers (CMOs), and Vice Presidents for Medical Affairs (VPMAs) from sites across California. Based on their input, we removed, edited, or added questions to our survey. This advisory group also helped the research team design our survey process.
Our final survey defined a hospitalist as a physician who spends all or the majority of his or her clinical, administrative, educational, or research activities in the care of hospitalized patients.4 We collected data in 4 areas: (1) We asked hospital leaders to confirm the presence or absence of at least 1 hospitalist group practicing within the surveyed hospital. We also asked for the year the first hospitalist group began practicing within the specified hospital. (2) We asked hospital leaders to indicate, among a prespecified list of 11 choices, the reason(s) they implemented a hospitalist group at the surveyed hospital. Surveyed categories included: (a) care for uncovered patients (patients without an identified doctor and/or uninsured), (b) improve costs, (c) improve length of stay, (d) improve emergency department throughput, (e) primary care provider demand, (f) improve patient satisfaction, (g) improve emergency room staffing, (h) quality improvement needs, (i) specialist physician demand, (j) overnight coverage, and (k) surgical comanagement. Due to the close relationship between cost and length of stay, we combined these 2 categories into a single category for reporting and analysis. This resulted in 10 final categories. We asked leaders who did not identify a practicing hospitalist group about the likelihood of hospitalists practicing at their hospital within the next 5 years and the reason(s) for future implementation. (3) We asked leaders to describe the services currently provided among a prespecified list of clinical care duties that go beyond the scope of inpatient general internal medicine (eg, surgical comanagement, rapid response team leadership) as well as nonclinical duties (eg, quality improvement activities, systems project implementation). If hospitalists did not currently provide the identified service, we asked leaders to indicate if they would be inclined to involve hospitalists in the specified service in the future. (4) Finally, we asked hospital leaders their opinion regarding the need for further training or certification for hospitalists.
Survey Protocol
We administered surveys between October 2006 and April 2007. We initially emailed the survey. We repeated this process for nonrespondents at intervals of 1 to 3 weeks after the initial emailing. Next, we sent nonrespondents a physical mailing with a reminder letter. Finally, we made phone calls to those who had not responded within 4 weeks of the last mailed letter. We asked survey recipients to respond only if they felt they had an adequate working knowledge of the hospitalist service at their hospital. If they did not feel they could adequately answer all questions, we allowed them to forward the instrument to others with a better working knowledge of the service.
Because we allowed recipients to forward the survey, we occasionally received 2 surveys from 1 site. In this case, we selected the survey according to the following prioritization order: (1) CEOs/COOs, (2) CMOs, (3) VPMAs, and (4) other vice presidents (VPs) or executive/administrative leaders with staff organization knowledge and responsibilities.
Hospital Descriptive Data
We obtained hospital organizational data from the California Office of Statewide Health Planning and Development's (OSHPD) publicly available Case Mix Index Data, hospital Annual Financial Data, aggregated Patient Discharge Data, and Utilization Data from 2006.23 Organizational characteristics included hospital size, location, profit status, payor mix, and diagnosis‐related groupbased case‐mix. Teaching status was determined from the 2005 American Hospital Association database. Membership status in California's voluntary quality reporting initiative, California Hospital Assessment and Reporting Taskforce (CHART), was publicly available at
Statistical Analyses
We performed univariable analyses to characterize survey respondents, followed by bivariable analyses to compare hospital characteristics and patient mix of responding and nonresponding hospitals. We used similar methods to characterize respondent hospitals with and without at least 1 hospitalist group. We compared continuous data with the Students t tests or Mann‐Whitney tests as appropriate and categorical data with chi‐square tests.
We then summarized the number of times a specific rationale was cited by hospital leaders for implementing a hospitalist group. Among hospitals that did not have a hospitalist system in place at the time of the survey, we asked if they were planning on starting one within the next 5 years. For these hospitals, we used content analysis to summarize open‐ended responses in order to understand factors that are currently influencing these hospital leaders to consider implementing a hospitalist group.
Next, we aimed to understand what clinical and nonclinical roles hospitalists were performing in hospitals with established hospitalist programs. Clinical activities were divided into general clinical areas, triage/emergency‐related, or administrative activities. First, we summarized the number and percent of programs performing each clinical and nonclinical activity. This was followed by logistic regression analyses to assess whether the time period that hospitalist groups began practicing or additional hospital characteristics predicted the performance of individual hospitalist activities. To guard against overfitting of models, analyses were limited to rationales that were cited a minimum of 50 times.24 Hospital factors were selected on the basis of face validity and advisory group input and included hospital bed size, ownership status (public vs. private), teaching status, and membership status in CHART. We divided the year of hospitalist program implementation into 3 time periods: (1) before 2002, (2) between 2002 and 2004, and (3) 2005 or later.
Finally, we described the percentage of hospitals that favored having their hospitalist group(s) perform each of the identified clinical or nonclinical activities, if they were not already performing them. We performed analyses with statistical software (Stata Version 9.2, College Station, TX).
Results
Respondent Characteristics
We received 200 survey responses. Of those, we excluded 15 duplicates (eg, a survey from both the CEO and VPMA) and 6 responses identified as coming from hospitalists who did not have a leadership position in the hospital. Thus, the final hospital leader survey response rate was 54% (n = 179). Forty‐six percent of the final responses were from CEOs or COOs; 37% of responses were from CMOs, VPMAs, and medical directors; and the remaining 17% of responses were from other VPs or administrative directors.
Respondent and nonrespondent hospitals were statistically similar in terms of teaching status and participation in CHART. Hospital patient census, intensive care unit census, payer mix, and diagnosis‐related groupbased case‐mix revealed no statistically significant differences between groups (P > 0.05). Respondent hospitals tended to have fewer beds and were more often for‐profit compared to nonrespondents (P = 0.05 and P < 0.01, respectively).
Descriptive Characteristics of Hospitals with Hospitalists
Sixty‐four percent (n = 115) of hospital leaders stated that they utilized hospitalists for at least some patients. Hospitals with hospitalists were statistically more likely (P < 0.05) to be larger, a major teaching hospital, or a member of a voluntary quality reporting initiative (Table 1).
| Variable | Hospitals without Hospitalists (n = 64) [n (%)] | Hospitals with Hospitalists (n = 115) [n (%)] | P Value* |
|---|---|---|---|
| |||
| Hospital size (total number of beds) | |||
| 0‐99 | 33 (51.6) | 18 (15.7) | <0.001 |
| 100‐199 | 19 (29.7) | 32 (27.8) | |
| 200‐299 | 5 (7.8) | 23 (20.0) | |
| 300+ | 7 (10.9) | 42 (36.5) | |
| Hospital control | 0.12 | ||
| City/county | 8 (12.5) | 7 (6.1) | |
| District | 15 (23.4) | 17 (14.8) | |
| For‐profit | 10 (15.6) | 16 (13.9) | |
| Non‐profit | 31 (48.4) | 71 (61.7) | |
| University of California | 0 (0.0) | 4 (3.5) | |
| Teaching hospital | 8 (12.5) | 30 (26.1) | 0.03 |
| Member of voluntary quality reporting initiative | 27 (42.2) | 93 (80.9) | <0.001 |
Among all hospitals with hospitalists, 39% estimated that hospitalists cared for at least one‐half of admitted medical patients, and 7% stated that hospitalists cared for all patients. Twenty‐four percent of respondents were unable to provide a quantitative estimate of the percent of patients cared for by hospitalists. When asked about expectations of growth in the coming year, 57% of respondents with hospitalists expected to see increases in the number of hospitalists at their hospital, and none expected a decrease. Among the 64 respondent hospitals that currently did not have a hospitalist program, 44% (n = 28) of the hospital leaders felt hospitalists would be managing patients in the future. Of those, 93% felt this would occur within the next 2 years.
Reasons for Implementing Hospitalists
Hospital leaders reported that the most important reasons for implementing a hospitalist model included caring for uncovered patients (68%), decreasing hospital costs and length of stay (63%), and improving throughput in the emergency room (62%). We provide additional reasons in Figure 1. In addition, leaders often identified multiple factors in the decision to utilize hospitalists, including demand from primary care doctors, patient satisfaction, and quality improvement. Among the 28 hospitals that currently did not have hospitalists but anticipated that they would soon (data not shown), the need to improve quality was the most commonly cited reason (54% of respondents) for expecting to start a program within 2 years, followed by demand from primary care doctors (46% of respondents).
Clinical Practice of Hospitalists and Expectations for Future Growth
Hospitalists perform a wide array of clinical and nonclinical duties (Figure 2). In addition to general medical care, the most common clinical activities of hospitalists included screening medical admissions from the emergency room for appropriateness of admission and triaging to appropriate level of care (67%), triaging patients transferred from an outside hospital (72%), and comanaging surgical patients (66%). The most common nonclinical activity was participation in quality improvement activities (72%). Multivariable analyses demonstrated that the performance of the most prevalent activities was not usually associated with the year of hospitalist implementation or hospital characteristics. An exception was that newly initiated programs had a statistically significant decreased odds of involvement in clinical guideline development (odds ratio [OR], 0.3; 95% confidence interval [CI], 0.1‐0.9) and a trend toward decreased leadership in quality improvement (OR, 0.3; 95% CI, 0.1‐1.1). Hospitalists at teaching hospitals had increased odds of managing patient transfers (OR, 4.7; 95% CI, 1.0‐21.2), whereas for‐profit hospitals had lower odds of screening patients in the emergency room (OR, 0.1; 95% CI, 0.0‐0.7).
Among those hospitals with hospitalists who were not presently involved in any of the above activities, there was a widespread interest among hospital leaders to have their hospitalist group(s) lead or participate in them (Figure 3). The most commonly cited activities included participation in inpatient clinical guideline development (85%), implementation of system‐wide projects (81%) (eg, computerized physician order entry system), participation on a rapid response team (80%), and caring for patients in an observation unit (80%).
Training and Certification for Hospitalists
About two‐thirds (64%) of hospital leaders with a hospitalist group(s) agreed or strongly agreed that hospitalists should have additional training and/or certification. Seventeen percent were undecided, whereas 11% either disagreed or strongly disagreed, and the remaining 8% did not provide an opinion.
Discussion
Most California hospital leaders reported utilizing hospitalists, and a substantial number of those without a hospitalist service plan to implement one in the next 5 years. Our data suggest that the number of hospitalists and their roles will continue to expand, with quality improvement activities and participation in clinical roles outside of general medical care being key priorities for future growth. Interestingly, much of this growth may not be catalyzed by past drivers (such as need to contain costs or length of stay) but by increasing need to implement quality and safety initiatives, as well as demand from other physicians. As a result, the field of hospital medicine will grow in numbers and breadth of practice. Defining the typical practice of a hospitalist may become more challenging.
Consistent with previous work,11, 16 our data suggest widespread adoption of hospitalists. While our data demonstrates that academic hospitals in California were more likely to have hospitalists, it is also important to note that hospitalist systems were widespread across a wide range of hospital sizes and ownership types. The prevalence appears likely to increase in the future. None of the hospitals surveyed planned to eliminate or reduce the size of their programs. Among hospitals without a hospitalist program, 44% (n = 28) reported they were going to implement a hospitalist group within the next 2 years. Future workforce development must consider this growth in order to increase physician supply to meet the demands of hospitalist growth.
Consistent with prior surveys of hospitalists and the healthcare marketplace,13, 15, 16, 25 our survey of hospital leaders suggests that the care of uncovered patients and the goal of improving hospital efficiency are key reasons for implementing hospitalists. Although these are important, we found that hospital leaders have additional intentions when implementing or expanding hospitalist systems, including improving patient satisfaction and quality. Although quality improvement activities were not among the most common reasons that leaders originally implemented programs, the most established programs had increased odds (relative to the most recently implemented programs) of leading quality improvement and clinical guideline activities. This may reflect a natural progression over time for hospitalist groups to develop from a patient‐focused clinical role to one that incorporates responsibilities that increasingly impact the hospital system and organization. The interest in utilizing hospitalists for leadership in quality improvement was widely expressed among those leaders who had yet to utilize hospitalists. Interestingly, this driver remains even as evidence for whether hospitalist practices produce measurable differences in care outcomes is mixed.26, 27 Nevertheless, hospital leaders are under increasing pressure to improve quality and safety (driven by public reporting and pay‐for‐performance initiatives), and many leaders appear to believe that hospitalists will be a key part of the solution.13, 28
In addition to quality improvement, continued demand for hospitalists may result from growing clinical demands, including clinical support for medical specialists and surgeons. A majority of leaders acknowledged current or future interest in having hospitalists comanage surgical patients, with the hope that such practices will improve surgeons' productivity and clinical outcomes.16, 29, 30 In addition, hospitalists may address potential shortages in specialty areas. For example, having hospitalists participate in critical care may partly ameliorate the impact of a large national shortage of critical care physicians.12, 31 If hospitalists are to assume major roles in the provision of critical care (particularly if not comanaging patients with intensivists), they may require some augmented training in the intensive care unit.
Our results paint a picture of a rapidly expanding field, both in scope and in number. Hospitalists appear to be performing a wide range of clinical, triage, and administrative activities, and there is demand among hospital leadership for hospitalists to take on additional responsibilities. Interestingly, it appears that participation in most clinical and nonclinical activities occur across the spectrum of organizational characteristics, and demand is not limited only to large or academic hospitals. Participation in such a broad array of activities brings into question the need for additional training and certification of hospitalists. While the need for hospitalists to receive additional training has been posited in the past, our data suggest there is a perceived need from the hospital administration as well. This additional training (and subsequent certification) would likely need to encompass many of the practices we have identified as core to hospitalists' practice. In addition to ensuring adequate training, policymakers will need to consider the supply of physicians necessary to meet the present and, likely, future demand for hospitalists. This is especially important in light of recent evidence of continued decreasing interest in general internal medicine, the main pool from which hospitalists are drawn.32 A shortage of internists is likely to influence expansion plans by hospitals in terms of activities in which leaders ask hospitalists to engage, or the number of hospitalists overall.
Our study has several limitations. First, a substantial number of nonrespondents may potentially bias our results. Despite this, we have drawn results across a wide range of hospitals, and the characteristics of responders and nonresponders are very similar. In addition, our study exclusively examines the responses of leaders in California hospitals. Although we sampled a large and heterogeneous group of hospitals, these results may not be entirely generalizable to other regions. As a cross‐sectional survey of hospital executives, responses are subject to leaders' recall. In particular, the reasons for implementation provided by leaders of older programs may potentially reflect contemporary reasons for hospitalist utilization rather than the original reasons. Another limitation of our study is our focus on hospital leaders' reports of prevalence and the clinical/nonclinical activities of hospitalists. Since senior executives often help begin a program but become less involved over time, executives' answers may well underestimate the prevalence of hospitalists and the breadth of their clinical practices, particularly in more mature programs. For instance, hospitalists that are part of an independent practice association (IPA) may provide functions for the IPA group that the hospital itself does not direct or fund. This effect may be more pronounced among the largest hospitals that may be organizationally complex, perhaps making suspect the responses from 7 very large hospitals that claimed not to utilize hospitalists. Finally, we collected information regarding the reasons for hospitalist group implementation and the services they provide by means of a prespecified list of answers. Although a thorough literature review and expert advisory panel guided the development of prespecified lists, they are by no means exhaustive. As a result, our prespecified lists may miss some important reasons for implementation, or services provided by hospitalists, that one could identify using an open‐ended survey. In addition, in the case of multiple responses from hospital leaders, we gave equal weight to responses. This has the effect of overestimating the weight of reasons that were less important, while underestimating the weight of reasons that may have been more important in the decision making process of implementing a hospitalist group.
While nonhospitalist physicians continue to provide a considerable proportion of hospital care for medical patients, hospitalists are assuming a larger role in the care of a growing number of patients in the hospital. The ongoing need to increase care efficiency drives some of this growth, but pressures to improve care quality and demand from other physicians are increasingly important drivers of growth. As the field grows and clinical roles diversify, there must be increased focus placed on the training requirements of hospitalists to reflect the scope of current practice and meet hospital needs to improve quality and efficiency.
Acknowledgements
The authors acknowledge Teresa Chipps, BS, Department of Medicine (General Internal Medicine and Public Health), Center for Health Services Research, Vanderbilt University, Nashville, TN, for her administrative and editorial assistance in the preparation of the manuscript.
- ,,,,,.Implementation of a hospitalist system in a large health maintenance organization: the Kaiser Permanente experience.Ann Intern Med.1999;130:355–359.
- ,,.Primary care family physicians and 2 hospitalist models: comparison of outcomes, processes, and costs.J Fam Pract.2002;51:1021–1027.
- ,.Effects of an HMO hospitalist program on inpatient utilization.Am J Manag Care.2001;7:1051–1057.
- ,.The emerging role of “hospitalists” in the American health care system.N Engl J Med.1996;335:514–517.
- .The hospitalist model: perspectives of the patient, the internist, and internal medicine.Ann Intern Med.1999;130:368–372.
- ,,,.The changing face of managed care.Health Aff.2002;21:11–23.
- .The death of managed care: a regulatory autopsy.J Health Polit Policy Law.2005;30:427–452.
- .The end of managed care.JAMA.2001;285:2622–2628.
- ,,,,,.Trends in market demand for internal medicine 1999 to 2004: an analysis of physician job advertisements.J Gen Intern Med.2006;21:1079–1085.
- ,,,.Growth in the care of older patients by hospitalists in the United States.N Engl J Med.2009;360:1102–1112.
- ,,,.The status of hospital medicine groups in the United States.J Hosp Med.2006;1:75–80.
- .Leapfrog and critical care: evidence‐ and reality‐based intensive care for the 21st century.Am J Med.2004;116:188–193.
- ,,,.Health care market trends and the evolution of hospitalist use and roles.J Gen Intern Med.2005;20:101–107.
- ,,,.Financial pressures spur physician entrepreneurialism.Health Aff.2004;23:70–81.
- ,,,,,.Physician attitudes toward and prevalence of the hospitalist model of care: results of a national survey.Am J Med.2000;109:648–653.
- ,,,.Hospitalists and care transitions: the divorce of inpatient and outpatient care.Health Aff.2008;27:1315–1327.
- Society of Hospital Medicine. 2005‐2006 SHM Survey: State of the Hospital Medicine Movement. Available at: http://dev.hospitalmedicine.org/AM/Template.cfm?Section=Survey2:102–104.
- ,,,.Hospitalists' perceptions of their residency training needs: results of a national survey.Am J Med.2001;111:247–254.
- ,,,,.The spectrum of community‐based hospitalist practice: A call to tailor internal medicine residency training.Arch Intern Med.2007;167:727–728.
- ,,,,.Fulfilling the promise of hospital medicine: tailoring internal medicine training to address hospitalists' needs.J Gen Intern Med.2008;23:1110–1115.
- ,,,.Hospitalists and the practice of inpatient medicine: results of a survey of the national association of inpatient physicians.Ann Intern Med.1999;130:343–349.
- Office of Statewide Health Planning and Development. Healthcare Information Division ‐ Data Products. Available at: http://www.oshpd.ca.gov/HID/DataFlow/HospMain.html. Accessed May2009.
- ,.Relaxing the rule of ten events per variable in logistic and Cox regression.Am J Epidemiol.2007;165:710–718.
- ,,.Hospital‐physician relations: cooperation, competition, or separation?Health Aff.2007;26:w31–w43.
- ,,,,,.Outcomes of care by hospitalists, general internists, and family physicians.N Engl J Med.2007;357:2589–2600.
- ,,, et al.Quality of care for decompensated heart failure: comparable performance between academic hospitalists and non‐hospitalists.J Gen Intern Med.2008;23:1399–1406.
- ,,.The impact of quality‐reporting programs on hospital operations.Health Aff.2006;25:1412–1422.
- ,,, et al.Medical and surgical comanagement after elective hip and knee arthroplasty: a randomized, controlled trial.Ann Intern Med.2004;141:28–38.
- ,,.Associations between the hospitalist model of care and quality‐of‐care‐related outcomes in patients undergoing hip fracture surgery.Mayo Clin Proc.2006;81:28–31.
- ,,, et al.The critical care crisis in the United States: a report from the profession.Chest.2004;125:1514–1517.
- ,,, et al.Factors associated with medical students' career choices regarding internal medicine.JAMA.2008;300:1154–1164.
Copyright © 2009 Society of Hospital Medicine
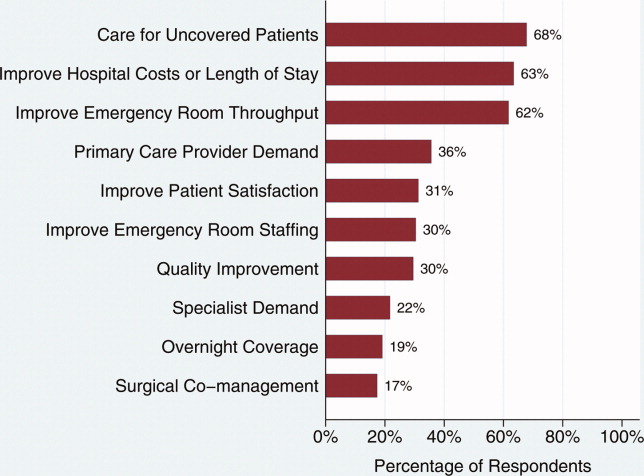
Duty Hours and Resident Inpatient Teaching
Hospital medicine is the fastest growing specialty in the history of medicine, and nearly 20% of hospitalists work in academic settings.1 Academic hospitalists often wear many hats; one of their main responsibilities is to supervise and teach residents and students. Hospitalists have responded to a number of changes to the landscape of medicine over the last 5 years, but none has had a more profound impact on an academic hospitalist's clinical teaching duties than the mandated reduction in duty hours (duty‐hour restrictions [DHR]).
In 2003, the Accreditation Council for Graduate Medical Education (ACGME) limited resident duty hours to 80 per week with no more than 30 consecutive hours,2 as a response to concerns about the impact of long duty hours on resident education, well‐being, and patient safety and pressures from impending legislation.3, 4 Data suggest many positive outcomes of these mandates,510 but one unforeseen consequence may be diminished time residents spend on teaching.1114
Academic hospitalists partner with residents to provide care and contribute to the learning of the medical team. The time spent teaching has many merits for residents, as they are valuable teachers of medical students15 and many find teaching enjoyable.16 Teaching also increases residents' own medical knowledge.17
Previous studies have demonstrated that some residents report teaching less since DHR.11, 13 Furthermore, greater than 75% of faculty educators, specifically those in Internal Medicine where the majority of academic hospitalists practice, perceive that since DHR, residents are teaching less.13 Given these concerns, and the benefits of resident teaching, it is important for academic hospitalists to understand the effects that DHR may have regarding the amount of time residents spend teaching and its consequences, in order to respond to this shift in the educational landscape and ensure trainee education while delivering exemplary patient care.
To better understand the factors related to and impact of resident teaching time since DHR, we performed a cross‐sectional survey of internal medicine residents at the University of California, San Francisco (UCSF). We hypothesize that workload elements of resident life are associated with the amount of time spent teaching. We also posit that the amount of time spent teaching may impact resident well‐being and perceptions of patient care.
Methods
Sites and Subjects
Descriptions of the survey protocol, including development and methods, have been published.11, 18 This study was performed at UCSF. The study was approved by the institutional review board at UCSF, and all 164 residents in internal medicine were eligible to participate. Data were collected beginning 1 month after DHR were implemented in February 2003 and collected for a total of 4 months.
Survey Development
After reviewing the literature and observing the residents over 1 month, the investigators identified domains pertaining to resident workload, quality of life, and patient care practices. An open‐ended question survey was created with questions regarding these domains, and given as a pilot survey to a group of residents ineligible for the study. Based on responses to the open‐ended questions, the investigators then developed a set of closed‐response items to the original questions. To establish content validity, the survey was reviewed by experts in medical education, outcomes research, and psychometrics, after which items were eliminated or reformatted if necessary. As a final check for usability and clarity, the survey was then pretested on non‐internal medicine house‐staff at the medical center and recent graduates of residency programs.
Survey Measures
Demographics
Residents were asked to report their age (30 or >30 years), sex, postgraduate year (PGY), and training program (primary care, categorical, or preliminary).
Teaching Time
Residents were asked, compared to the same (or equivalent) inpatient rotation BEFORE February 2003, how much time did you spend teaching during your most recent inpatient rotation? Answers rated on a 5‐point scale, 1 being much less, and 5 being much more. Responses were dichotomized into less or same or more as described in the Results section.
Hours Worked
Residents were asked, During your most recent inpatient rotation, how many hours did you work in 1 average week? Possible answers: 50‐59, 60‐69, 70‐79, 80‐89, 90‐99, and 100. Responses were dichotomized into <80 or 80.
Time Spent on Nonphysician Administrative Tasks
Residents were asked to report, What percent of your time is spent doing tasks that could be completed by a non‐MD? Answers ranging between 0 and 100% were filled into a blank space by the resident.
Emotional Exhaustion
A single score defined as being emotionally overextended and exhausted by work. Constructed as the mean of two highly‐correlated item responses (Cronbach's alpha = 0.84): During your most recent workweek, how often did you feel overwhelmed at work? and During your most recent workweek, how often did you feel worn out? Responses ranged from 1 (never) to 5 (very often).
Satisfaction with Patient Care
During your most recent inpatient rotation workweek, how satisfied were you with the quality of patient care you provided? Rated on a 10‐point scale with 1 being completely unsatisfied and 10 being completely satisfied.
Statistical Analyses
Univariate statistics were used first to characterize the distribution and frequency of the residents' responses. Bivariate associations among variables were assessed with correlation analyses and t‐tests.
Three regression models were constructed. First, a multivariate logistic regression model identified factors independently associated with self‐reported decreased teaching time. Variables were selected for the model based on prior hypotheses regarding factors related to decreased teaching time, observed relationships among variables, or to retain face validity of the model: age (30 versus >30 years), sex, PGY (PGY1 versus PGY2, PGY3), program (primary care versus categorical), hours worked/week, and percentage of time spent on administrative tasks. Next, a linear regression model examined the relationship between teaching time and emotional exhaustion, controlling for age, sex, PGY, program, hours worked, and time spent on administrative tasks. Finally, a linear regression model determined which of the factors in the second model, plus emotional exhaustion, were independently associated with satisfaction with patient care. All variables were retained in each model.
Results
The Residents
Of 164 eligible residents, 125 (76%) returned the survey. Sex, PGY, and program were similar between respondents and nonrespondents (P > 0.2, P > 0.45, and P > 0.6, respectively). Respondents were equally distributed among year of training, with 36.6% PGY‐1, 35.8% PGY‐2, and 27.6% PGY‐3. Most respondents were female (60%), younger than age 30 years (70%), and enrolled in the categorical residency program (62%). All (100%) reported being aware of the system changes intended to reduce hours to <80 hours/week, and 35% reported working >80 hours/week after DHR. All PGY‐1s had completed inpatient months prior to being surveyed.
Factors Associated With Spending Less Time Teaching
Of the 126 respondents, 107 completed the question regarding time teaching; 8 don't know responses were coded as missing, yielding an analytic n of 99 (60%). Twenty‐four (24.2%) residents reported spending less (n = 21) or much less (n = 3) time teaching after DHR began. Because only three individuals reported much less teaching time after DHR, the group was not large enough to yield meaningful or stable analytic results, so the groups were combined. Bivariate comparisons between those who reported less teaching compared to those who reported the same or more are shown in Table 1.
| Characteristic | Those Who Teach Same or More (n = 75) | Those Who Teach Less or Much Less (n = 24) | P Value* |
|---|---|---|---|
| |||
| PGY, n (%) | 0.0013 | ||
| PGY‐1 | 41 (93.2) | 3 (6.8) | |
| PGY‐2 | 23 (63.9) | 13 (36.1) | |
| PGY‐3 | 11 (57.9) | 8 (42.1) | |
| Training program, primary care, n (%) | 29 (38.7) | 6 (25.0) | 0.33 |
| Sex, female, n (%) | 43 (57.3) | 11 (45.8) | 0.35 |
| Age 30 years, n (%) | 55 (75.3) | 16 (66.7) | 0.43 |
| Number of hours worked <80, n (%) | 43 (58.1) | 22 (91.7) | 0.002 |
In multivariate models, working <80 hours/week (odds ratio [OR], 5.99; 95% confidence interval [CI], 1.11‐32.48]), being a PGY‐2 (OR, 7.14; 95% CI, 1.56‐32.79]) or PGY‐3 (OR, 8.23; 95% CI, 1.44‐47.09), and reporting more time on administrative tasks (OR, 1.03; 95% CI, 1.00‐1.06) were associated with reports of spending less time teaching (Table 2).
| Characteristic | OR (CI) |
|---|---|
| |
| Number of hours worked <80 | 5.99 (1.11‐32.48) |
| Age >30 years | 0.91 (0.28‐2.45) |
| Female | 0.83 (0.28‐2.45) |
| PGY‐2 | 7.14 (1.56‐32.79) |
| PGY‐3 | 8.23 (1.44‐47.09) |
| Primary care program | 0.75 (0.22‐2.51) |
| Time spent on nonphysician administrative tasks | 1.03 (1.00‐1.06) |
Impacts of Spending Less Time Teaching
In bivariate comparisons, residents who reported reduced teaching time were less emotionally exhausted (P = 0.006) and more satisfied with the patient care they provided (P = 0.003) (Table 3). In the multivariate analysis, emotional exhaustion was significantly associated with satisfaction with patient care ( = 0.52; P = 0.01), but spending less time teaching was not ( = 0.32; P = 0.46). These analyses reveal that while there was a direct relationship between emotional exhaustion and satisfaction with patient care, the relationship between teaching time and satisfaction with patient care was mediated through emotional exhaustion.
| Time Spent Teaching | P Value | ||
|---|---|---|---|
| Less or Much Less [Mean (SD)] | Same or More [Mean (SD)] | ||
| |||
| Frequency of emotional exhaustion* | 2.6 (0.8) | 3.2 (0.9) | 0.006 |
| Satisfaction with patient care | 8.1 (1.2) | 7.1 (1.8) | 0.003 |
Discussion
In this cross‐sectional survey of internal medicine residents, we found that roughly 25% of residents report spending less time teaching since DHR. Spending less time teaching was associated with working <80 hours/week, being PGY‐2 or PGY‐3 residents, and spending more time on administrative tasks. Residents' reports of spending less time teaching were in turn associated with less emotional exhaustion and more satisfaction with the quality of patient care they provided.
As hospitalists have been shown to be more effective, and possibly better, teachers than nonhospitalists,19 and are increasingly responsible for teaching duties on academic medical services,1 our findings of some residents spending less time teaching since DHR may necessitate changes in hospitalist teaching roles to adapt to this previously unrecognized shift. Although the majority of the residents in our cohort did not experience diminished teaching time, the educational impact of diminished teaching time for the quarter of our cohort that taught less frequently post‐DHR is noteworthy, as these changes affect over 22,000 internal medicine residents. Our findings enhance previous work suggesting that DHR may have some negative effects on resident education.68, 1114, 20 We also found that those who spend less time teaching are more likely to be senior residents, the main teachers of medical students,21 and therefore a reduction in time spent teaching may adversely impact medical students, as previously described.22 Academic hospitalists, in order to maintain and ensure high levels of education and educational satisfaction in the post‐DHR era will likely benefit from recognizing and responding to this change.
Our study also found that spending less time teaching was associated with fewer reports of emotional exhaustion and perceptions of higher quality patient care. Though residents enjoy teaching and would prefer to spend more time teaching if service responsibilities were fewer and if time allowed,16 it is possible that when the total amount of time to accomplish tasks in a week or day are limited, spending time teaching may lead to increased stress and pressure, overwhelming residents and leading to increased emotional exhaustion. Less emotional exhaustion and higher perceptions of patient care are positive outcomes that are, in fact, aligned with the ACGME DHR goals24 and are of prime importance to academic hospitalists as educators, role‐models, and care providers.
Balancing the challenges of a reduction of time spent teaching and the possible benefits of the reduction will necessitate both individual and system‐wide responses. Hospitalists are uniquely poised to develop these responses, which will likely have widespread impacts not only in education but also in patient care and satisfaction with the inpatient experience. Some of these responses may include teaching innovations, such as honing skills for brief teaching, incorporating focused, patient‐driven teaching and emphasizing teachable moments,2325 or workflow innovations, including decreased administrative tasks for residents or changes to the workday schedule to enhance protected teaching time. Hospitalists may also need to increase their time contribution to teaching the medical team or structure more planned didactic sessions for residents and students to ensure that educational sessions are occurring.
Many new hospitalists were trained during duty hour limitations, but the majority were not.1 The landscape of teaching on the medical wards since DHR is dramatically different, speckled with the discontinuities of multiple cross‐coverage residents.26 Residents may have unconsciously acclimated to the system change, and our findings, which give a time‐specific glimpse of the changes that took place with DHR, may inform some of the reasons behind the educational concerns of late.
Our study has several limitations. As a cross‐sectional study, we describe associations and cannot discern causal pathways, but we believe that these associations themselves enhance our understanding of the consequences of DHR. We relied upon self‐reports of teaching time, which are subject to bias. These self‐reports, however, give insight into the resident's perspective of their experience, which is, in and of itself, noteworthy. This study is also subject to recall bias, and we attempted to minimize this by administering the survey just after DHR was implemented and by carefully framing the comparisons. Findings may be sensing secular events such as the challenges of a large system change or a difficult ward month. That said, our findings are consistent with other current survey studies of resident teaching time,1114 thus validating many of the conclusions from our collected data. As the survey was given shortly after DHR, it may not have accounted for initial obstacles of the new system; however, the survey was given over 4 months following DHR implementation at our institution, which we believe allowed the residency program time to adjust to the new organizational system while allowing for real‐time feedback. Our study was conducted at a single site; however, because the medical system studied is comprised of three hospitals, each of which used a variety of dayfloat and nightfloat interventions similar to systems at other institutions, we believe the variability within our system increases the generalizability of this study to other institutions. Finally, these data were collected in 2003, and since that time, programs have likely made significant adjustments in their rotation schedules and team structure and may look different now than previously. We believe that the timing of this study adequately characterizes the potential loss of teaching time pre‐DHR and post‐DHR in a way that current data cannot, due to resident acclimatization to culture change, and therefore may better inform hospitalists regarding changes that may be implicit as opposed to explicit in resident teaching.
In conclusion, DHR has resulted in profound changes in teaching hospitals. Since education and patient care are central to the mission of academic hospitalists, they need to be aware of the potential for diminished teaching time by some of their residents, the factors that effect that change, and its impact on patient care. Hospitalists can use this information to create new systems of care delivery and education to optimize the resident and patient experience. As the duty hour issue has come again to the forefront, with the new Institute of Medicine Committee on Optimizing Graduated Medical Trainee (Resident) Hours and Work Schedules to Improve Patient Safety recommendations policies regarding duty hours,27 it is keenly important that hospitalists understand the potentially unforeseen consequences of DHR on important aspects of resident work such as teaching.
- Society of Hospital Medicine (SHM). 2008. 2007‐2008 SHM Bi‐Annual Survey: The Authoritative Source on the State of the Hospital Medicine Movement. Philadelphia, PA: Society of Hospital Medicine.
- Accreditation Council for Graduate Medical Education. Resident Duty Hours Common Program Requirements. Available at: http://www. acgme.org/acWebsite/dutyHours/dh_dutyHoursCommonPR.pdf). Accessed December2008.
- , , ;ACGME Work Group on Resident Duty Hours.Accreditation Council for Graduate Medical Education. New requirements for resident duty hours.JAMA.2002;288(9):1112–1114.
- , , , .The impact of duty hours on resident self reports of errors.J Gen Intern Med.2007;22(2):205–209.
- , , , , .The effects of work‐hour limitations on resident well‐being, patient care, and education in an internal medicine residency program.Arch Intern Med.2005;165(22):2601–2606.
- , , , .Burnout and internal medicine resident work‐hour restrictions.Arch Intern Med.2005;165(22):2595–2600.
- , , , .Resident perceptions of the impact of work hour limitations.J Gen Intern Med.2007;22(7):969–975.
- , , , , .Implementing duty hour restrictions without diminishing patient care or education.Acad Med.2006;81(1):68–75.
- , , , .Changes in outcomes for internal medicine inpatients after work‐hour regulations.Ann Intern Med.2007;147:97–103.
- , .Changes in hospital mortality associated with residency work hour regulations.Ann Intern Med.2007;147:73–80.
- , , , , .Impact of reduced duty hours on residents' educational satisfaction at the University of California, San Francisco.Acad Med.2006;81(1):76–81.
- , , , , , .The impact of resident duty hours reform on the internal medicine core clerkship: results from the clerkship directors in internal medicine survey.Acad Med.2006;81(12):1038–1044.
- , , , , , .Too little time to teach? Medical student education and work‐hour restriction.Mil Med.2007;172(10):1053–1057.
- , , .Impact of duty hour limitations on resident and student education in obstetrics and gynecology.J Reprod Med.2007;52(5):345–348.
- , .Medical students' perceptions of themselves and residents as teachers.Med Teach.1992;14:133–138.
- , , .Teaching in the clinical setting: factors influencing residents' perceptions, confidence and behavior.J Med Educ.1984;18:360–365.
- , , .Residents' perceptions of their role as teachers.J Med Educ.1988;63:900–905.
- , , , .The impact of duty hours on resident self reports of errors.J Gen Intern Med.2007;22(2):205–209.
- , , , , .Effects of hospitalist attending physicians on trainee satisfaction with teaching and with internal medicine rotations.Arch Intern Med.2004;164(17):1866–1871.
- , , .Resident job satisfaction: one year of duty hours.Am J Obstet Gynecol.2005;193(5):1823–1826.
- .House staff attitudes toward teaching.J Med Educ.1970;45(3):156–159.
- , , , .Medical students' perceptions of resident teaching: have duty hours regulations had an impact?Ann Surg.2005;242(4):548–553.
- , .Teaching internal medicine residents in the new era.J Gen Intern Med.2006;21:447–452.
- , , , .A five‐step “microskills” model of clinical teaching.J Am Board Fam Pract.1992;5(4):419–424.
- , , , , .Strategies for efficient and effective teaching in the ambulatory care setting.Acad Med.1997;72(4):277–280.
- , , , , .Managing discontinuity in academic medical centers: strategies for a safe and effective resident sign‐out.J Hosp Med.2006;1(4):257–266.
- Resident Duty Hours: Enhancing Sleep, Supervision, and Safety. Ulmer C, Wolman DM, Johns MME, eds.Committee on Optimizing Graduate Medical Trainee (Resident) Hours and Work Schedule to Improve Patient Safety, Institutes of Medicine.Washington, D.C.The National Academics Press,2008.
Hospital medicine is the fastest growing specialty in the history of medicine, and nearly 20% of hospitalists work in academic settings.1 Academic hospitalists often wear many hats; one of their main responsibilities is to supervise and teach residents and students. Hospitalists have responded to a number of changes to the landscape of medicine over the last 5 years, but none has had a more profound impact on an academic hospitalist's clinical teaching duties than the mandated reduction in duty hours (duty‐hour restrictions [DHR]).
In 2003, the Accreditation Council for Graduate Medical Education (ACGME) limited resident duty hours to 80 per week with no more than 30 consecutive hours,2 as a response to concerns about the impact of long duty hours on resident education, well‐being, and patient safety and pressures from impending legislation.3, 4 Data suggest many positive outcomes of these mandates,510 but one unforeseen consequence may be diminished time residents spend on teaching.1114
Academic hospitalists partner with residents to provide care and contribute to the learning of the medical team. The time spent teaching has many merits for residents, as they are valuable teachers of medical students15 and many find teaching enjoyable.16 Teaching also increases residents' own medical knowledge.17
Previous studies have demonstrated that some residents report teaching less since DHR.11, 13 Furthermore, greater than 75% of faculty educators, specifically those in Internal Medicine where the majority of academic hospitalists practice, perceive that since DHR, residents are teaching less.13 Given these concerns, and the benefits of resident teaching, it is important for academic hospitalists to understand the effects that DHR may have regarding the amount of time residents spend teaching and its consequences, in order to respond to this shift in the educational landscape and ensure trainee education while delivering exemplary patient care.
To better understand the factors related to and impact of resident teaching time since DHR, we performed a cross‐sectional survey of internal medicine residents at the University of California, San Francisco (UCSF). We hypothesize that workload elements of resident life are associated with the amount of time spent teaching. We also posit that the amount of time spent teaching may impact resident well‐being and perceptions of patient care.
Methods
Sites and Subjects
Descriptions of the survey protocol, including development and methods, have been published.11, 18 This study was performed at UCSF. The study was approved by the institutional review board at UCSF, and all 164 residents in internal medicine were eligible to participate. Data were collected beginning 1 month after DHR were implemented in February 2003 and collected for a total of 4 months.
Survey Development
After reviewing the literature and observing the residents over 1 month, the investigators identified domains pertaining to resident workload, quality of life, and patient care practices. An open‐ended question survey was created with questions regarding these domains, and given as a pilot survey to a group of residents ineligible for the study. Based on responses to the open‐ended questions, the investigators then developed a set of closed‐response items to the original questions. To establish content validity, the survey was reviewed by experts in medical education, outcomes research, and psychometrics, after which items were eliminated or reformatted if necessary. As a final check for usability and clarity, the survey was then pretested on non‐internal medicine house‐staff at the medical center and recent graduates of residency programs.
Survey Measures
Demographics
Residents were asked to report their age (30 or >30 years), sex, postgraduate year (PGY), and training program (primary care, categorical, or preliminary).
Teaching Time
Residents were asked, compared to the same (or equivalent) inpatient rotation BEFORE February 2003, how much time did you spend teaching during your most recent inpatient rotation? Answers rated on a 5‐point scale, 1 being much less, and 5 being much more. Responses were dichotomized into less or same or more as described in the Results section.
Hours Worked
Residents were asked, During your most recent inpatient rotation, how many hours did you work in 1 average week? Possible answers: 50‐59, 60‐69, 70‐79, 80‐89, 90‐99, and 100. Responses were dichotomized into <80 or 80.
Time Spent on Nonphysician Administrative Tasks
Residents were asked to report, What percent of your time is spent doing tasks that could be completed by a non‐MD? Answers ranging between 0 and 100% were filled into a blank space by the resident.
Emotional Exhaustion
A single score defined as being emotionally overextended and exhausted by work. Constructed as the mean of two highly‐correlated item responses (Cronbach's alpha = 0.84): During your most recent workweek, how often did you feel overwhelmed at work? and During your most recent workweek, how often did you feel worn out? Responses ranged from 1 (never) to 5 (very often).
Satisfaction with Patient Care
During your most recent inpatient rotation workweek, how satisfied were you with the quality of patient care you provided? Rated on a 10‐point scale with 1 being completely unsatisfied and 10 being completely satisfied.
Statistical Analyses
Univariate statistics were used first to characterize the distribution and frequency of the residents' responses. Bivariate associations among variables were assessed with correlation analyses and t‐tests.
Three regression models were constructed. First, a multivariate logistic regression model identified factors independently associated with self‐reported decreased teaching time. Variables were selected for the model based on prior hypotheses regarding factors related to decreased teaching time, observed relationships among variables, or to retain face validity of the model: age (30 versus >30 years), sex, PGY (PGY1 versus PGY2, PGY3), program (primary care versus categorical), hours worked/week, and percentage of time spent on administrative tasks. Next, a linear regression model examined the relationship between teaching time and emotional exhaustion, controlling for age, sex, PGY, program, hours worked, and time spent on administrative tasks. Finally, a linear regression model determined which of the factors in the second model, plus emotional exhaustion, were independently associated with satisfaction with patient care. All variables were retained in each model.
Results
The Residents
Of 164 eligible residents, 125 (76%) returned the survey. Sex, PGY, and program were similar between respondents and nonrespondents (P > 0.2, P > 0.45, and P > 0.6, respectively). Respondents were equally distributed among year of training, with 36.6% PGY‐1, 35.8% PGY‐2, and 27.6% PGY‐3. Most respondents were female (60%), younger than age 30 years (70%), and enrolled in the categorical residency program (62%). All (100%) reported being aware of the system changes intended to reduce hours to <80 hours/week, and 35% reported working >80 hours/week after DHR. All PGY‐1s had completed inpatient months prior to being surveyed.
Factors Associated With Spending Less Time Teaching
Of the 126 respondents, 107 completed the question regarding time teaching; 8 don't know responses were coded as missing, yielding an analytic n of 99 (60%). Twenty‐four (24.2%) residents reported spending less (n = 21) or much less (n = 3) time teaching after DHR began. Because only three individuals reported much less teaching time after DHR, the group was not large enough to yield meaningful or stable analytic results, so the groups were combined. Bivariate comparisons between those who reported less teaching compared to those who reported the same or more are shown in Table 1.
| Characteristic | Those Who Teach Same or More (n = 75) | Those Who Teach Less or Much Less (n = 24) | P Value* |
|---|---|---|---|
| |||
| PGY, n (%) | 0.0013 | ||
| PGY‐1 | 41 (93.2) | 3 (6.8) | |
| PGY‐2 | 23 (63.9) | 13 (36.1) | |
| PGY‐3 | 11 (57.9) | 8 (42.1) | |
| Training program, primary care, n (%) | 29 (38.7) | 6 (25.0) | 0.33 |
| Sex, female, n (%) | 43 (57.3) | 11 (45.8) | 0.35 |
| Age 30 years, n (%) | 55 (75.3) | 16 (66.7) | 0.43 |
| Number of hours worked <80, n (%) | 43 (58.1) | 22 (91.7) | 0.002 |
In multivariate models, working <80 hours/week (odds ratio [OR], 5.99; 95% confidence interval [CI], 1.11‐32.48]), being a PGY‐2 (OR, 7.14; 95% CI, 1.56‐32.79]) or PGY‐3 (OR, 8.23; 95% CI, 1.44‐47.09), and reporting more time on administrative tasks (OR, 1.03; 95% CI, 1.00‐1.06) were associated with reports of spending less time teaching (Table 2).
| Characteristic | OR (CI) |
|---|---|
| |
| Number of hours worked <80 | 5.99 (1.11‐32.48) |
| Age >30 years | 0.91 (0.28‐2.45) |
| Female | 0.83 (0.28‐2.45) |
| PGY‐2 | 7.14 (1.56‐32.79) |
| PGY‐3 | 8.23 (1.44‐47.09) |
| Primary care program | 0.75 (0.22‐2.51) |
| Time spent on nonphysician administrative tasks | 1.03 (1.00‐1.06) |
Impacts of Spending Less Time Teaching
In bivariate comparisons, residents who reported reduced teaching time were less emotionally exhausted (P = 0.006) and more satisfied with the patient care they provided (P = 0.003) (Table 3). In the multivariate analysis, emotional exhaustion was significantly associated with satisfaction with patient care ( = 0.52; P = 0.01), but spending less time teaching was not ( = 0.32; P = 0.46). These analyses reveal that while there was a direct relationship between emotional exhaustion and satisfaction with patient care, the relationship between teaching time and satisfaction with patient care was mediated through emotional exhaustion.
| Time Spent Teaching | P Value | ||
|---|---|---|---|
| Less or Much Less [Mean (SD)] | Same or More [Mean (SD)] | ||
| |||
| Frequency of emotional exhaustion* | 2.6 (0.8) | 3.2 (0.9) | 0.006 |
| Satisfaction with patient care | 8.1 (1.2) | 7.1 (1.8) | 0.003 |
Discussion
In this cross‐sectional survey of internal medicine residents, we found that roughly 25% of residents report spending less time teaching since DHR. Spending less time teaching was associated with working <80 hours/week, being PGY‐2 or PGY‐3 residents, and spending more time on administrative tasks. Residents' reports of spending less time teaching were in turn associated with less emotional exhaustion and more satisfaction with the quality of patient care they provided.
As hospitalists have been shown to be more effective, and possibly better, teachers than nonhospitalists,19 and are increasingly responsible for teaching duties on academic medical services,1 our findings of some residents spending less time teaching since DHR may necessitate changes in hospitalist teaching roles to adapt to this previously unrecognized shift. Although the majority of the residents in our cohort did not experience diminished teaching time, the educational impact of diminished teaching time for the quarter of our cohort that taught less frequently post‐DHR is noteworthy, as these changes affect over 22,000 internal medicine residents. Our findings enhance previous work suggesting that DHR may have some negative effects on resident education.68, 1114, 20 We also found that those who spend less time teaching are more likely to be senior residents, the main teachers of medical students,21 and therefore a reduction in time spent teaching may adversely impact medical students, as previously described.22 Academic hospitalists, in order to maintain and ensure high levels of education and educational satisfaction in the post‐DHR era will likely benefit from recognizing and responding to this change.
Our study also found that spending less time teaching was associated with fewer reports of emotional exhaustion and perceptions of higher quality patient care. Though residents enjoy teaching and would prefer to spend more time teaching if service responsibilities were fewer and if time allowed,16 it is possible that when the total amount of time to accomplish tasks in a week or day are limited, spending time teaching may lead to increased stress and pressure, overwhelming residents and leading to increased emotional exhaustion. Less emotional exhaustion and higher perceptions of patient care are positive outcomes that are, in fact, aligned with the ACGME DHR goals24 and are of prime importance to academic hospitalists as educators, role‐models, and care providers.
Balancing the challenges of a reduction of time spent teaching and the possible benefits of the reduction will necessitate both individual and system‐wide responses. Hospitalists are uniquely poised to develop these responses, which will likely have widespread impacts not only in education but also in patient care and satisfaction with the inpatient experience. Some of these responses may include teaching innovations, such as honing skills for brief teaching, incorporating focused, patient‐driven teaching and emphasizing teachable moments,2325 or workflow innovations, including decreased administrative tasks for residents or changes to the workday schedule to enhance protected teaching time. Hospitalists may also need to increase their time contribution to teaching the medical team or structure more planned didactic sessions for residents and students to ensure that educational sessions are occurring.
Many new hospitalists were trained during duty hour limitations, but the majority were not.1 The landscape of teaching on the medical wards since DHR is dramatically different, speckled with the discontinuities of multiple cross‐coverage residents.26 Residents may have unconsciously acclimated to the system change, and our findings, which give a time‐specific glimpse of the changes that took place with DHR, may inform some of the reasons behind the educational concerns of late.
Our study has several limitations. As a cross‐sectional study, we describe associations and cannot discern causal pathways, but we believe that these associations themselves enhance our understanding of the consequences of DHR. We relied upon self‐reports of teaching time, which are subject to bias. These self‐reports, however, give insight into the resident's perspective of their experience, which is, in and of itself, noteworthy. This study is also subject to recall bias, and we attempted to minimize this by administering the survey just after DHR was implemented and by carefully framing the comparisons. Findings may be sensing secular events such as the challenges of a large system change or a difficult ward month. That said, our findings are consistent with other current survey studies of resident teaching time,1114 thus validating many of the conclusions from our collected data. As the survey was given shortly after DHR, it may not have accounted for initial obstacles of the new system; however, the survey was given over 4 months following DHR implementation at our institution, which we believe allowed the residency program time to adjust to the new organizational system while allowing for real‐time feedback. Our study was conducted at a single site; however, because the medical system studied is comprised of three hospitals, each of which used a variety of dayfloat and nightfloat interventions similar to systems at other institutions, we believe the variability within our system increases the generalizability of this study to other institutions. Finally, these data were collected in 2003, and since that time, programs have likely made significant adjustments in their rotation schedules and team structure and may look different now than previously. We believe that the timing of this study adequately characterizes the potential loss of teaching time pre‐DHR and post‐DHR in a way that current data cannot, due to resident acclimatization to culture change, and therefore may better inform hospitalists regarding changes that may be implicit as opposed to explicit in resident teaching.
In conclusion, DHR has resulted in profound changes in teaching hospitals. Since education and patient care are central to the mission of academic hospitalists, they need to be aware of the potential for diminished teaching time by some of their residents, the factors that effect that change, and its impact on patient care. Hospitalists can use this information to create new systems of care delivery and education to optimize the resident and patient experience. As the duty hour issue has come again to the forefront, with the new Institute of Medicine Committee on Optimizing Graduated Medical Trainee (Resident) Hours and Work Schedules to Improve Patient Safety recommendations policies regarding duty hours,27 it is keenly important that hospitalists understand the potentially unforeseen consequences of DHR on important aspects of resident work such as teaching.
- Society of Hospital Medicine (SHM). 2008. 2007‐2008 SHM Bi‐Annual Survey: The Authoritative Source on the State of the Hospital Medicine Movement. Philadelphia, PA: Society of Hospital Medicine.
- Accreditation Council for Graduate Medical Education. Resident Duty Hours Common Program Requirements. Available at: http://www. acgme.org/acWebsite/dutyHours/dh_dutyHoursCommonPR.pdf). Accessed December2008.
- , , ;ACGME Work Group on Resident Duty Hours.Accreditation Council for Graduate Medical Education. New requirements for resident duty hours.JAMA.2002;288(9):1112–1114.
- , , , .The impact of duty hours on resident self reports of errors.J Gen Intern Med.2007;22(2):205–209.
- , , , , .The effects of work‐hour limitations on resident well‐being, patient care, and education in an internal medicine residency program.Arch Intern Med.2005;165(22):2601–2606.
- , , , .Burnout and internal medicine resident work‐hour restrictions.Arch Intern Med.2005;165(22):2595–2600.
- , , , .Resident perceptions of the impact of work hour limitations.J Gen Intern Med.2007;22(7):969–975.
- , , , , .Implementing duty hour restrictions without diminishing patient care or education.Acad Med.2006;81(1):68–75.
- , , , .Changes in outcomes for internal medicine inpatients after work‐hour regulations.Ann Intern Med.2007;147:97–103.
- , .Changes in hospital mortality associated with residency work hour regulations.Ann Intern Med.2007;147:73–80.
- , , , , .Impact of reduced duty hours on residents' educational satisfaction at the University of California, San Francisco.Acad Med.2006;81(1):76–81.
- , , , , , .The impact of resident duty hours reform on the internal medicine core clerkship: results from the clerkship directors in internal medicine survey.Acad Med.2006;81(12):1038–1044.
- , , , , , .Too little time to teach? Medical student education and work‐hour restriction.Mil Med.2007;172(10):1053–1057.
- , , .Impact of duty hour limitations on resident and student education in obstetrics and gynecology.J Reprod Med.2007;52(5):345–348.
- , .Medical students' perceptions of themselves and residents as teachers.Med Teach.1992;14:133–138.
- , , .Teaching in the clinical setting: factors influencing residents' perceptions, confidence and behavior.J Med Educ.1984;18:360–365.
- , , .Residents' perceptions of their role as teachers.J Med Educ.1988;63:900–905.
- , , , .The impact of duty hours on resident self reports of errors.J Gen Intern Med.2007;22(2):205–209.
- , , , , .Effects of hospitalist attending physicians on trainee satisfaction with teaching and with internal medicine rotations.Arch Intern Med.2004;164(17):1866–1871.
- , , .Resident job satisfaction: one year of duty hours.Am J Obstet Gynecol.2005;193(5):1823–1826.
- .House staff attitudes toward teaching.J Med Educ.1970;45(3):156–159.
- , , , .Medical students' perceptions of resident teaching: have duty hours regulations had an impact?Ann Surg.2005;242(4):548–553.
- , .Teaching internal medicine residents in the new era.J Gen Intern Med.2006;21:447–452.
- , , , .A five‐step “microskills” model of clinical teaching.J Am Board Fam Pract.1992;5(4):419–424.
- , , , , .Strategies for efficient and effective teaching in the ambulatory care setting.Acad Med.1997;72(4):277–280.
- , , , , .Managing discontinuity in academic medical centers: strategies for a safe and effective resident sign‐out.J Hosp Med.2006;1(4):257–266.
- Resident Duty Hours: Enhancing Sleep, Supervision, and Safety. Ulmer C, Wolman DM, Johns MME, eds.Committee on Optimizing Graduate Medical Trainee (Resident) Hours and Work Schedule to Improve Patient Safety, Institutes of Medicine.Washington, D.C.The National Academics Press,2008.
Copyright © 2009 Society of Hospital Medicine
Factors of Care Plan Discussions at Admission
Despite an ideal of dying at home, most Americans die in hospitals.1 Patients and families are clear about what they need from the healthcare system at the end of life: relief of distressing symptoms, the opportunity to communicate with physicians and others about death and dying, and the assurance that they will be attended to and comforted by their physicians as they approach death.2, 3 However, discussions about patient preferences for care occur infrequently,47 even though patients want to discuss care with their doctor,68 and physicians believe these discussions are their responsibility.9
The most prominent work in this area occurred in the Study to Understand Prognoses and Preferences for Outcomes and Risks of Treatments (SUPPORT) study, which focused on patients with advanced disease, often in the intensive care unit.4 Furthermore, few studies have focused on general medical patients, and healthcare has changed in important ways since SUPPORT's publication. First, the Patient Self‐Determination Act (PSDA) requires that all patients be asked about their care wishes at the time of admission and document the presence of an advanced directive.10, 11 Second, there is growing awareness of the need to improve palliative care for all hospitalized patients, with many advocating that hospitalization itself is a reason to ask about patient's preferences for care regardless of a patient's level of chronic or acute illness.12 Finally, emergence of hospitalists,1316 movement toward closed intensive care units,17, 18 and changes in residency training have increased segmentation in care of hospitalized patients.15, 18
To overcome limitations of previous literature and update our knowledge of how care discussions take place in the current healthcare environment, we analyzed data from a large study of patients admitted to general medicine services at 6 academic centers. Using this robust dataset, which included prospectively collected information about preferences for communication with their physician, we performed statistical analyses to understand which patient clinical, sociodemographic, and preference‐related factors, as well as factors related to their site of care, were associated with documentation that a code status discussion took place at the time of hospital admission.
PATIENTS AND METHODS
Sites
The Multicenter Hospitalist Study (MCHS) was a multicenter trial of general medical services that enrolled patients at 6 geographically diverse centers: The University of Chicago (which also served as the coordinating center), University of Iowa Hospitals and Clinics, University of California San Francisco, University of Wisconsin, University of New Mexico, and Brigham and Women's Hospital.19
Each site was selected to participate in the MCHS because patients on their general medicine service were admitted to hospitalist and nonhospitalist physicians in a random fashion (eg, based on predetermined call schedule based on day of the week). As teaching hospitals, house officers provided direct care to patients hospitalized at each center; nonteaching services were not present at the sites during the period of this study.
During the period of this study, each site complied with PSDA requirements for noting that patients had been informed about their right to create an advance directive, but no sites had a guideline or other program in place specifically intended to facilitate physician‐patient communication about care wishes. Two sites had active Hospice or Palliative Care services, and another 2 had Geriatrics Consultation services, but none had standard protocols mandating involvement of these consultants at the time of admission, the time when our key outcomes were documented.
Patients
Patients were eligible for inclusion in the MCHS if they were older than 18 years of age and were admitted at random to a hospitalist or nonhospitalist physician; we excluded patients from MCHS if they were admitted specifically under the care of their primary care physician or subspecialist (eg, admitted for chemotherapy) or were a prison inmate. Patients meeting these eligibility criteria were then approached for purposes of informed consent.
Data Collection
Data for this study were obtained from administrative data, patient interview, and chart abstraction as in previous work.14 Administrative data were drawn from cost‐accounting databases at each participating hospital; administrative data were used to provide cost and length of stay data, as well as information about patient insurance type, age, and sex.
We interviewed patients immediately after informed consent was obtained, with both taking place generally within 24 hours of admission. Interviews collected data about patient preferences for care and functional status,20 and other data not reliably available from administrative sources (such as housing situation).
Patient care plan before admission was taken from notes and orders written in the first 24 hours of hospitalization, as mentioned above. Using criteria we employed in previous work,21 a care discussion (CD) was defined as documentation of a discussion between patients (or family) and at least 1 physician (primary physician, hospitalist, consulting physician, or house officer) during the first 24 hours of hospitalization. CDs needed to specify that the person who wrote the note had actually spoken with the patient or their family for the purposes of determining preferences for care, and that this discussion resulted in a specific care plan. Thus, notations such as do not resuscitate/do not intubate, or spoke with family, questions answered, did not qualify as CDs, but a note stating the patient continues to want full efforts was counted as a CD.
Principal investigators at each site were responsible for training and overseeing interviewing and chart abstraction activities at each site, with central oversight of data quality provided by the central coordinating center. Upon receipt at the data coordinating center, all data were examined for missing, nonsensical, or outlier data with errors referred back to the participating sites for correction.
Statistical Analysis
For bivariable comparisons of patients with and without CDs, we used chi‐squared or Mann‐Whitney U‐tests, as appropriate.
Variables with P < 0.20 in bivariable comparisons were selected for initial inclusion in models. Then, using automated forward and stepwise selection techniques as well as manually entered variables, we fit multivariable generalized estimating equations permitting clustering of effects at the physician level to determine the independent association between the multiple factors tested and presence of a CD. In order to guard against the threat of multiple testing, we retained variables at a significance level of P < 0.01; variables were also retained because of observed confounding with other independent variables, or to maintain face validity of the model. All analyses were performed using SAS 9.0 for Windows (SAS Institute Inc., Cary, NC).
RESULTS
Patient Sociodemographics (Table 1)
A total of 17,097 of 33,638 patients (50.8%) were interviewed and gave consent for chart abstraction. Of these patients, 1776 (10.3%) had a CD documented in the first 24 hours of hospitalization. Patients with documented CDs were older, more often white, had completed more years of education, were more likely to have lived in a nursing home prior to admission, and more likely to have been hospitalized in the last 12 months. The proportion of patients with CDs was highly variable across site of enrollment, from 2.8%‐24.9%.
| Value | No Documented CD (n = 15321, 89.7%) | Documented CD (n = 1776, 10.3%) | P* |
|---|---|---|---|
| |||
| Age (Median, 95%CI)* | 56 (55, 56) | 69 (67, 71) | < 0.0001 |
| Female (n, %) | 8390 (54.8%) | 990 (55.7%) | 0.4312 |
| Race (n, %) | |||
| White | 6640 (43.3%) | 938 (52.8%) | < 0.0001 |
| African American | 4673 (30.5%) | 280 (15.8%) | |
| Asian | 532 (3.5%) | 167 (9.4%) | |
| American Indian | 325 (2.1%) | 26 (1.5%) | |
| Other | 1951 (12.7%) | 241 (13.6%) | |
| Refused/Don't know | 1200 (7.8%) | 124 (7.0%) | |
| Ethnicity (n, %) | |||
| Hispanic or Latino Ethnicity | 1724 (11.3%) | 183 (10.3%) | 0.0039 |
| Insurance type (n, %) | |||
| Charity | 481 (3.4%) | 14 (0.8%) | < 0.0001 |
| Indemnity | 3983 (28.2%) | 327 (19.3%) | |
| Medicaid | 2487 (17.6%) | 195 (11.5%) | |
| Medicare | 6418 (45.5%) | 1114 (65.9%) | |
| Other | 105 (0.7%) | 4 (0.2%) | |
| Self pay | 628 (4.5%) | 36 (2.1%) | |
| Self‐reported education (n, %) | |||
| Junior high school or less | 1297 (8.5%) | 217 (12.2%) | < 0.0001 |
| Some high school | 2146 (14.0%) | 182 (10.2%) | |
| High school graduate | 4435 (28.9%) | 465 (26.2%) | |
| Some college or junior college | 3521 (23.0%) | 347 (19.5%) | |
| College graduate | 1729 (11.3%) | 255 (14.4%) | |
| Post‐graduate | 1191 (7.8%) | 173 (9.7%) | |
| Refused/Don't know | 1002 (6.5%) | 137 (7.7%) | |
| Self reported income (n, %) | |||
| $2,500 or less | 1079 (7.0%) | 108 (6.1%) | 0.0002 |
| $2,501 to $5,000 | 424 (2.8%) | 33 (1.9%) | |
| $5,001 to $10,000 | 1436 (9.4%) | 211 (11.9%) | |
| $10,001 to $15,000 | 1080 (7.0%) | 141 (7.9%) | |
| $15,001 to $25,000 | 1054 (6.9%) | 134 (7.5%) | |
| $25,001 to $35,000 | 837 (5.5%) | 74 (4.2%) | |
| $35,001 to $50,000 | 882 (5.8%) | 94 (5.3%) | |
| $50,001 to $100,000 | 1027 (6.7%) | 125 (7.0%) | |
| $100,001 to $200,000 | 357 (2.3%) | 57 (3.2%) | |
| Over $200,000 | 245 (1.6%) | 34 (1.9%) | |
| Don't know/refused | 6900 (45.0%) | 765 (43.1%) | |
| Housing situation (n, %) | |||
| Own apartment or house | 11887 (77.6%) | 1264 (71.2%) | < 0.0001 |
| A relative or friend's apartment or house | 1804 (11.8%) | 217 (12.2%) | |
| A nursing home, group home, or long‐term care facility | 663 (4.3%) | 204 (11.5%) | |
| A homeless shelter | 258 (1.7%) | 27 (1.5%) | |
| Other | 709 (4.6%) | 64 (3.6%) | |
| Marital status (n, %) | |||
| Married | 4992 (32.6%) | 603 (34.0%) | < 0.0001 |
| Living as if married | 440 (2.9%) | 32 (1.8%) | |
| Divorced | 2027 (13.2%) | 199 (11.2%) | |
| Separated | 569 (3.7%) | 30 (1.7%) | |
| Widowed | 2577 (16.8%) | 487 (27.4%) | |
| Single | 4074 (26.6%) | 364 (20.5%) | |
| Refused | 642 (4.2%) | 61 (3.4%) | |
| Hospitalized in the last 12 months (n, %) | 7602 (49.6%) | 1011 (56.9%) | < 0.0001 |
| Site of enrollment (n, %) | |||
| A | 4602 (30.0%) | 135 (7.6%) | < 0.0001 |
| B | 1595 (10.4%) | 158 (8.9%) | |
| C | 3017 (19.7%) | 998 (56.2%) | |
| D | 2387 (15.6%) | 212 (11.9%) | |
| E | 2057 (13.4%) | 131 (7.4%) | |
| F | 1663 (10.9%) | 142 (8.0%) | |
Patient Self‐Reported Health Status and Comorbid Illness (Table 2)
Patients with CDs more often reported a lot of difficulties with bathing, eating, or dressing; household chores; and moderate activities. Patients with CDs were more likely to report accomplishing less than they would like due to their health. They were more likely to have cancer, depression, a history of stroke, and heart disease, but less likely to have diabetes or human immunodeficiency virus.
| Value | No Documented CD (n = 15321, 89.7%) | Documented CD (n = 1776, 10.3%) | P** |
|---|---|---|---|
| |||
| Thinking back again to one month ago, did any impairment or health problem cause you to need help of other persons with personal care needs, such as eating, bathing, dressing, or getting around the home? (n, %) | |||
| No | 10673 (69.7%) | 973 (54.8%) | < 0.0001 |
| Yes, a little | 1933 (12.6%) | 268 (15.1%) | |
| Yes, a lot | 2127 (13.9%) | 487 (27.4%) | |
| Don't know | 588 (3.8%) | 48 (2.7%) | |
| Thinking back to one month ago, did any impairment or health problem cause you to need help in handling everyday household chores, necessary business, shopping, or getting around for other purposes? (n, %) | |||
| No | 7262 (47.4%) | 566 (31.9%) | < 0.0001 |
| Yes, a little | 2692 (17.6%) | 324 (18.2%) | |
| Yes, a lot | 4126 (26.9%) | 825 (46.5%) | |
| Don't know | 1241 (8.1%) | 61 (3.4%) | |
| As far as you know do you have any of the following health conditions at the present time? (n, %) | |||
| Cancer | |||
| No | 13281 (86.7%) | 1376 (77.5%) | < 0.0001 |
| Yes | 1751 (11.4%) | 351 (19.8%) | |
| Not sure | 289 (1.9%) | 49 (2.8%) | |
| Depression | |||
| No | 10269 (67.0%) | 1099 (61.9%) | < 0.0001 |
| Yes | 4730 (30.9%) | 624 (35.1%) | |
| Not sure | 322 (2.1%) | 53 (3.0%) | |
| Diabetes | |||
| No | 10902 (71.2%) | 1356 (76.4%) | < 0.0001 |
| Yes | 4132 (27.0%) | 394 (22.2%) | |
| Not sure | 287 (1.9%) | 26 (1.5%) | |
| Heart trouble | |||
| No | 10251 (66.9%) | 1080 (60.8%) | < 0.0001 |
| Yes | 4491 (29.3%) | 627 (35.3%) | |
| Not sure | 579 (3.8%) | 69 (3.9%) | |
| HIV or AIDS | |||
| No | 14300 (93.3%) | 1679 (94.5%) | 0.026 |
| Yes | 912 (6.0%) | 80 (4.5%) | |
| Not sure | 109 (0.7%) | 17 (1.0%) | |
| Stroke | |||
| No | 13344 (87.1%) | 1494 (84.1%) | 0.0005 |
| Yes | 1722 (11.2%) | 236 (13.3%) | |
| Not sure | 255 (1.7%) | 46 (2.6%) | |
Patient Preferences, Care Plan Documentation, and Care Coordination at Admission (Table 3)
Patients who had documented CDs were less likely to prefer my doctor give me choices regarding my care, and more often disagreed with the statement I prefer to leave care decisions to my physician. These patients were also more likely to have a durable power of attorney or living will in their chart, or have an alternate decision‐maker noted. The majority of patients without a documented CD (79.9%) had no notation of their care wishes, compared to 29.7% in patients with a documented CD. Patients with a documented CD were more likely to have a regular medical provider and a note in the chart from their primary care physician.
| Value | No Documented CD (n = 15321, 89.7%) | Documented CD (n = 1776, 10.3%) | P* |
|---|---|---|---|
| |||
| I prefer my doctor give me choices regarding my care** (n, %) | |||
| Definitely agree | 11619 (75.8%) | 1247 (70.2%) | < 0.0001 |
| Somewhat agree | 1912 (12.5%) | 252 (14.2%) | |
| Somewhat disagree | 488 (3.2%) | 76 (4.3%) | |
| Definitely disagree | 414 (2.7%) | 87 (4.9%) | |
| Don't know | 888 (5.8%) | 114 (6.4%) | |
| I prefer to leave care decisions to my physician** (n, %) | |||
| Definitely agree | 5660 (36.9%) | 613 (34.5%) | < 0.0001 |
| Somewhat agree | 4539 (29.6%) | 493 (27.8%) | |
| Somewhat disagree | 2265 (14.8%) | 257 (14.5%) | |
| Definitely disagree | 1956 (12.8%) | 304 (17.1%) | |
| Don't know | 901 (5.9%) | 109 (6.1%) | |
| Documentation of care wishes before hospitalization (n, %) | |||
| No documentation | 12238 (79.9%) | 527 (29.7%) | < 0.0001 |
| Full support | 2624 (17.1%) | 742 (41.8%) | |
| Do not resuscitate or intubate (DNR/DNI) | 264 (1.7%) | 370 (20.8%) | |
| Hospice | 53 (0.3%) | 22 (1.2%) | |
| Other limitation (eg, no pressors) | 142 (0.9%) | 115 (6.5%) | |
| Had durable power of attorney in chart (n, %) | 286 (1.9%) | 133 (7.5%) | < 0.0001 |
| Had a living will in chart (n, %) | 266 (1.7%) | 142 (8.0%) | < 0.0001 |
| Alternate decision maker named in chart (n, %) | 2770 (18.1%) | 638 (35.9%) | < 0.0001 |
| Patient noted to be unable to participate in their care at admission (eg, confused, unable to respond) (n, %) | 1227 (8.0%) | 431 (24.3%) | < 0.0001 |
| Inpatient team documented discussion with primary care physician (n, %) | 627 (4.1%) | 136 (7.7%) | < 0.0001 |
| Do not have a regular medical provider** (n, %) | 3836 (25.0%) | 254 (14.3%) | < 0.0001 |
| Note from primary care physician in chart (n, %) | 148 (1.0%) | 39 (2.2%) | < 0.0001 |
Factors Associated with Documented Care Discussions (Table 4)
Using predictor variables presented in Tables 1‐3, we then constructed multivariable models seeking to understand factors independently associated with documentation of code status in the entire cohort, as well as among patients who had no preexisting care wishes.
| Entire Cohort (n = 17097) | Patients with No Documentation of Preadmission Wishes (n = 12765) | |||
|---|---|---|---|---|
| Adjusted Odds Ratio (95% CI) | P Value | Adjusted Odds Ratio (95% CI) | P Value | |
| Preadmission Code Status | ||||
| No documentation | Referent | NA | ||
| Full support | 3.22 (2.28, 4.55) | < 0.0001 | NA | |
| Do not resuscitate or intubate (DNR/DNI) | 11.32 (8.52, 15.04) | < 0.0001 | NA | |
| Hospice | 4.02 (2.33, 6.94) | < 0.0001 | NA | |
| Other limitation (eg, no pressors) | 10.13 (7.35, 13.96) | < 0.0001 | NA | |
| Insurance type | ||||
| Medicare | Referent | Referent | ||
| Charity care | 0.50 (0.30, 0.85) | 0.0099 | 0.56 (0.25, 1.25) | 0.1589 |
| Commercial | 0.81 (0.69, 0.95) | 0.0090 | 0.66 (0.52, 0.85) | 0.0009 |
| Medicaid | 0.69 (0.57, 0.82) | < 0.0001 | 0.49 (0.36, 0.67) | < 0.0001 |
| Other | 0.46 (0.18, 1.13) | 0.0912 | 0.60 (0.17, 2.12) | 0.4302 |
| Self pay | 0.70 (0.52, 0.95) | 0.0203 | 0.49 (0.29, 0.81) | 0.0060 |
| Any limitations in bathing, toileting, dressing or feeding self? | ||||
| No | Referent | Referent | ||
| Yes, a little | 1.25 (1.10, 1.42) | 0.0007 | 1.31 (1.03, 1.67) | 0.0272 |
| Yes, a lot | 1.25 (1.09, 1.43) | 0.0015 | 1.42 (1.11, 1.81) | 0.0055 |
| Unable to respond | 0.81 (0.59, 1.12) | 0.2006 | 0.80 (0.45, 1.41) | 0.4299 |
| Patient has a documented surrogate decision maker | 1.72 (1.47, 2.02) | < 0.0001 | 2.08 (1.62, 2.66) | < 0.0001 |
| Patient noted to be unable to participate in their care at admission (eg, confused, unable to respond) | 1.63 (1.37, 1.94) | < 0.0001 | 2.20 (1.60, 3.02) | < 0.0001 |
| Notation that team had spoken to primary care physician at admission | 1.65 (1.29, 2.11) | < 0.0001 | 1.45 (0.92, 2.28) | 0.1116 |
| History of cancer | ||||
| No | Referent | Referent | ||
| Yes | 1.31 (1.13, 1.51) | 0.0003 | 1.26 (0.96, 1.65) | 0.0960 |
| Not sure | 1.26 (0.87, 1.82) | 0.2162 | 1.80 (1.03, 3.15) | 0.0396 |
| History of diabetes | ||||
| No | Referent | Referent | ||
| Yes | 0.87 (0.75, 1.003) | 0.0543 | 0.79 (0.62, 0.997) | 0.0467 |
| Not sure | 0.61 (0.38, 0.99) | 0.0445 | 0.84 (0.43, 1.65) | 0.6183 |
| Housing situation | ||||
| Own house or apartment | Referent | Referent | ||
| Relative or friend's apartment or house | 1.22 (1.03, 1.45) | 0.0229 | 1.29 (0.97, 1.71) | 0.0783 |
| Nursing home, group home, or long‐term care facility | 1.42 (1.16, 1.74) | 0.0006 | 1.74 (1.27, 2.40) | 0.0007 |
| Homeless shelter | 1.12 (0.72, 1.73) | 0.6204 | 0.87 (0.46, 1.63) | 0.6559 |
| Other/Don't know | 1.02 (0.75, 1.40) | 0.8987 | 1.35 (0.78, 2.36) | 0.2859 |
| Age Group | ||||
| <50 | Referent | Referent | ||
| 5059 | 1.19 (0.99, 1.43) | 0.0647 | 1.18 (0.88, 1.59) | 0.2583 |
| 6069 | 1.18 (0.99, 1.40) | 0.0585 | 1.20 (0.88, 1.66) | 0.2549 |
| 7079 | 1.10 (0.91, 1.33) | 0.3178 | 1.19 (0.85, 1.67) | 0.3033 |
| 8089 | 1.23 (1.03, 1.47) | 0.0207 | 1.34 (0.96, 1.88) | 0.0879 |
| 90+ | 1.45 (1.12, 1.88) | 0.0045 | 1.44 (0.94, 2.20) | 0.0934 |
| Site of Enrollment | ||||
| A | Referent | Referent | ||
| B | 1.74 (1.16, 2.61) | 0.007 | 4.95 (2.90, 8.45) | < 0.0001 |
| C | 5.14 (3.42, 7.74) | < 0.0001 | 26.36 (17.28, 40.23) | < 0.0001 |
| D | 4.19 (2.64, 6.66) | < 0.0001 | 8.06 (4.63, 14.03) | < 0.0001 |
| E | 3.00 (1.82, 4.9) | < 0.0001 | 5.30 (2.71, 10.38) | < 0.0001 |
| F | 4.09 (2.69, 6.23) | < 0.0001 | 2.32 (1.32, 4.08) | 0.0037 |
In the entire cohort, insurance type was independently associated with likelihood of a care discussion, with patients with Medicare having greater adjusted odds ratio for a CD than patients with all other forms of insurance, even after adjusting for age. Patients who had functional limitations with bathing, toileting, and feeding; had a documented surrogate decision maker; were unable to participate in their care; had cancer; or did not live in their own home were more likely to have a documented CD. Subjects with diabetes were less likely to have a CD, although this was of borderline significance. Patients whose team had documented a CD with the patients' primary physician were also more likely to have a discussion noted. However, the magnitude of these predictors was small compared to the independent effects attributable to the site the patient was enrolled or whether the patient had any preexisting documentation. Whereas the adjusted odds ratio associated with clinical or functional measures (such as age, cancer) were generally between 1.5 and 2.5, the range of odds ratios associated with having any documentation of care wishes (compared to no documentation) were all greater than 3, and the odds ratios associated with site of enrollment were 1.7 or higher.
We observed similar findings in analyses limited to patients with no preexisting care documentation. While clinical, sociodemographic, and functional factors remained statistically associated with a CD (albeit with wider confidence intervals due to smaller sample sizes), the effect of the patient's site of enrollment became even more striking (Table 4).
DISCUSSION
In this multicenter study of hospitalized general medical patients, documentation of CDs were highly dependent on where patients received care and whether patients had previous documentation of a care plan. In contrast, although clinical, prognostic, and socioeconomic factors were also associated with whether physicians documented asking patients about their wishes for care, the influence of these factors was modest.
Improving communication between patients and their physicians during an episode of acute illness has been a long‐standing goal, with the Study to Understand Prognoses and Preferences for Outcomes of Treatment (SUPPORT) trial providing the most notable example of an effort to improve patient care through aligning patient wishes, prognosis, and aggressiveness for care. However, even the SUPPORT interventiona robust, well‐implemented, and highly labor‐intensive strategywas not able to achieve this goal. In their summary of SUPPORT study findings, the authors suggested that the likelihood of and effectiveness of communication in seriously ill patients may be powerfully influenced by patient and caregiver culture4; our findings may partially confirm SUPPORT's conclusions.
Preexisting documentation in our study would not have included mandated documentation that someone had given the patient information about advance directives (as mandated by the PSDA), but rather a specification for that advance care plan. This distinction means that preexisting documentation in our study represented a previous decision by the patient (or the patient and their physician) to have made a plan, and an association with hospital discussions may be because the first conversation is the hardest to undertake; subsequent discussions then represent confirmatory or clarifying discussions that may be less difficult to broach (particularly for less experienced trainees). A CD may have also been prompted when documentation was unclear, or when a change in prognosis took place (eg, a new diagnosis of metastatic cancer).22 Alternatively, a preexisting plan may serve as a reminder for clinicians to discuss code status, signify patients who are more willing to broach this subject, and either seem more approachable or bring up the topic themselves.
The influence of site on documentation and CD provides additional evidence that caregiver culture played a role in CDs. Although this variation may have been in part due to culture around documentation practices more generally, it is important to note that none of our participating centers had a policy for documentation of care wishes or patient‐doctor communication, or a policy mandating these discussions in any specific patient group. Furthermore, site‐related differences were seen even in patients with no preexisting documentation, and were seen after adjustment for other documentation or communication practices (eg, documenting a discussion with the patient's primary care provider), making it unlikely that documentation practices are solely responsible for our results. Persistence of variations in care documentation raises interesting questions, particularly when one considers recent data describing variations in end‐of‐life care between similar academic centers (one of which was a participating site in this trial).23 Given that the sites in our study represent diverse institutions yet share a number of characteristics, understanding the specific practices or aspects of medical culture that promote conversations may provide insights in how to improve this promotion elsewhere.
Our results would argue that mandates to document code status on admission may be unlikely to improve communication unless sites also develop an approach to using this newly documented information as a prompt for subsequent discussions. In nursing home settings, documentation of advance directives may reduce resource use, but it is unclear whether similar effects will be seen in hospital settings.24 It is also a challenge to insure that documentation of a care plan in the nursing home is communicated to the providers in the hospital.25 The PSDA was a first step in this direction, but its effects on improving communication are uncertain.26 Our results would confirm that the PSDA or systems to mandate documentation are not solutions in themselves, but are 2 steps in a larger process.
We do not want to discount our findings of less frequent CDs among patients of lower socioeconomic status, where gaps in quality of care, communication, and outcomes are well‐recognized.27 As such, our results delineate yet another area where practice can and should be improved for vulnerable patients. However, factors related to site of care and documentation may provide opportunities to improve care even more profoundly and within a fairly discrete (if complex) acute episode of care. Having said this, our results also demonstrate a potential pitfall of using code status documentation for risk‐adjustment, because such notation may be more dependent on local documentation patterns than clinical appropriateness.
Our study has a number of limitations. As an observational study, our findings are likely prone to biases related to unadjusted confounding due to comorbidity. The influence of comorbidity would seem to have been most important in biasing the effects of preexisting documentation, where documentation would be associated with more unaccounted comorbidity. However, there were no differences in documentation even after accounting for prognosis by adjusting for age, functional status, and a valid comorbidity score.28 As we have pointed out, our key outcome is based on documentation of communication and not actual communication, and as such may be biased in subtle ways not related to site of care or the items tested in our model. While we cannot directly eliminate the possibility of documentation biases in our results using statistical methods, it is important to point out that our chart abstraction protocol used highly specific criteria to detect these discussions, and therefore may under‐detect discussions which may have been documented in less detail. Our study did not examine whether documentation of CDs influenced subsequent care. However, previous studies have shown that advance care planning has only a minor influence on care.29 However, communication about preferences at the time of admission, when the need for specific care decisions may be more evident, may be more likely to influence hospital care. Our results show that previous documentation is associated with discussions early in an admission. Such discussion may affect care, even if the decision made is different than what was previously documented. In addition, patients who were included in our study (those able to provide consent and participate in an interview) may be healthier or more cognitively intact than a general population of hospitalized patients. However, how this would have affected our results is unclear. Being able to speak and consent for oneself are key facilitators to communication, but sicker patients who cannot consent or speak for themselves might also be more likely to have care planning decisions made based on illness severity; documentation in these patients may be more driven by whether such notes were required because of the involvement of home health services (or skilled nursing facilities). Finally, although our study is one of the largest examinations of in‐hospital communication to date and its implications for resident education are worth noting, the sites involved in the MCHS may not be representative of nonteaching hospitals, or community‐based teaching hospitals.
Our results suggest that, although comorbid illness and socioeconomic status play an important role in determining which patients receive CDs at the time of admission, these factors are substantially less powerful than preexisting documentation practices and culture or care practices specific to their site of care. These results suggest that future work should consider organizational characteristics and culture as important targets for interventions to improve care planning in hospitalized patients.
- Committee on Care at the End of Life, Institute of Medicine.Approaching Death: Improving Care at the End of Life.Field MJ,Cassel CK, eds.Washington, DC:National Academy Press;1997.
- ,,,,,.Factors considered important at the end of life by patients, family, physicians, and other care providers.JAMA.2000;284(19):2476–2482.
- ,,,,,.In search of a good death: observations of patients, families, and providers.Ann Intern Med.2000;132(10):825–832.
- The SUPPORT Principal Investigators.A controlled trial to improve care for seriously ill hospitalized patients. The study to understand prognoses and preferences for outcomes and risks of treatments (SUPPORT).JAMA.1995;274(20):1591–1598.
- ,.Choices about cardiopulmonary resuscitation in the hospital. When do physicians talk with patients?N Engl J Med.1984;310(17):1089–1093.
- ,,, et al.Patient preferences for communication with physicians about end‐of‐life decisions. SUPPORT Investigators. Study to Understand Prognoses and Preference for Outcomes and Risks of Treatment.Ann Intern Med.1997;127(1):1–12.
- ,,,.Discussing cardiopulmonary resuscitation: a study of elderly outpatients.J Gen Intern Med.1988;3(4):317–321.
- ,,,,.Educating the elderly: cardiopulmonary resuscitation decisions before and after intervention.J Am Geriatr Soc.1991;39(4):372–377.
- ,,,.Factors influencing physicians in recommending in‐hospital cardiopulmonary resuscitation.Arch Intern Med.1993;153(17):1999–2003.
- Federal Register. 42 USC 1395‐1396. Patient Self‐Determination Act1990.
- ,,.Advance directives on admission. Clinical implications and analysis of the Patient Self‐Determination Act of 1990.JAMA.1991;266(3):402–405.
- ,,.A new doctor in the house: ethical issues in hospitalist systems.JAMA.1999;282(2):171–174.
- ,,,,,.Implementation of a hospitalist service at a community teaching hospital: improving clinical efficiency and patient outcomes.Ann Intern Med.2002;137:859–865.
- ,,, et al.Effects of hospitalist physicians on an academic general medical service: results of a randomized trial.Ann Intern Med.2002;137:866–874.
- ,.The hospitalist movement 5 years later.JAMA.2002;287(4):487–494.
- ,,,,.Reorganizing an academic medical service: impact on cost, quality, patient satisfaction, and education.JAMA.1998;279(19):1560–1565.
- ,,,,,.Physician staffing patterns and clinical outcomes in critically ill patients: a systematic review.JAMA.2002;288(17):2151–2162.
- ,,, et al.Organizational characteristics of intensive care units related to outcomes of abdominal aortic surgery.JAMA.1999;281(14):1310–1317.
- ,,, et al.Effects of inpatient experience on outcomes and costs in a multicenter trial of academic hospitalists.J Gen Intern Med.2005;20(Suppl 1):141–142.
- ,,.SF‐12: How to Score the SF‐12 Physical and Mental Health Summary Scales.2nd ed.Boston, MA:New England Medical Center, The Health Institute;1995.
- ,.End‐of‐life care in a voluntary hospitalist model: effects on communication, processes of care, and patient symptoms.Am J Med.2004;116(10):669–675.
- ,,,.Role of written advance directives in decision making: insights from qualitative and quantitative data.J Gen Intern Med.1998;13(7):439–446.
- ,,,,.Evaluating the efficiency of California providers in caring for patients with chronic illnesses.Health Aff (Millwood).2005 Jul‐Dec;Suppl Web Exclusives:W5–526–43.
- ,,, et al.Systematic implementation of an advance directive program in nursing homes: a randomized controlled trial.JAMA.2000;283(11):1437–1444.
- ,.Meeting palliative care needs in post‐acute care settings: “to help them live until they die”.JAMA.2006;295(6):681–686.
- ,,, et al.Advance directives for seriously ill hospitalized patients: effectiveness with the patient self‐determination act and the SUPPORT intervention. SUPPORT Investigators. Study to Understand Prognoses and Preferences for Outcomes and Risks of Treatment.J Am Geriatr Soc.1997;45(4):500–507.
- Institute of Medicine.Unequal Treatment: Confronting Racial and Ethnic Disparities in Health Care.Smedley BD,Stith AY,Nelson AR, eds.Washington, DC:National Academies Press;2003.
- ,,.Use of a self‐report‐generated Charlson Comorbidity Index for predicting mortality.Med Care.2005;43(6):607–615.
- ,,.Can clinical interventions change care at the end of life?Ann Intern Med.1997;126(5):381–388.
Despite an ideal of dying at home, most Americans die in hospitals.1 Patients and families are clear about what they need from the healthcare system at the end of life: relief of distressing symptoms, the opportunity to communicate with physicians and others about death and dying, and the assurance that they will be attended to and comforted by their physicians as they approach death.2, 3 However, discussions about patient preferences for care occur infrequently,47 even though patients want to discuss care with their doctor,68 and physicians believe these discussions are their responsibility.9
The most prominent work in this area occurred in the Study to Understand Prognoses and Preferences for Outcomes and Risks of Treatments (SUPPORT) study, which focused on patients with advanced disease, often in the intensive care unit.4 Furthermore, few studies have focused on general medical patients, and healthcare has changed in important ways since SUPPORT's publication. First, the Patient Self‐Determination Act (PSDA) requires that all patients be asked about their care wishes at the time of admission and document the presence of an advanced directive.10, 11 Second, there is growing awareness of the need to improve palliative care for all hospitalized patients, with many advocating that hospitalization itself is a reason to ask about patient's preferences for care regardless of a patient's level of chronic or acute illness.12 Finally, emergence of hospitalists,1316 movement toward closed intensive care units,17, 18 and changes in residency training have increased segmentation in care of hospitalized patients.15, 18
To overcome limitations of previous literature and update our knowledge of how care discussions take place in the current healthcare environment, we analyzed data from a large study of patients admitted to general medicine services at 6 academic centers. Using this robust dataset, which included prospectively collected information about preferences for communication with their physician, we performed statistical analyses to understand which patient clinical, sociodemographic, and preference‐related factors, as well as factors related to their site of care, were associated with documentation that a code status discussion took place at the time of hospital admission.
PATIENTS AND METHODS
Sites
The Multicenter Hospitalist Study (MCHS) was a multicenter trial of general medical services that enrolled patients at 6 geographically diverse centers: The University of Chicago (which also served as the coordinating center), University of Iowa Hospitals and Clinics, University of California San Francisco, University of Wisconsin, University of New Mexico, and Brigham and Women's Hospital.19
Each site was selected to participate in the MCHS because patients on their general medicine service were admitted to hospitalist and nonhospitalist physicians in a random fashion (eg, based on predetermined call schedule based on day of the week). As teaching hospitals, house officers provided direct care to patients hospitalized at each center; nonteaching services were not present at the sites during the period of this study.
During the period of this study, each site complied with PSDA requirements for noting that patients had been informed about their right to create an advance directive, but no sites had a guideline or other program in place specifically intended to facilitate physician‐patient communication about care wishes. Two sites had active Hospice or Palliative Care services, and another 2 had Geriatrics Consultation services, but none had standard protocols mandating involvement of these consultants at the time of admission, the time when our key outcomes were documented.
Patients
Patients were eligible for inclusion in the MCHS if they were older than 18 years of age and were admitted at random to a hospitalist or nonhospitalist physician; we excluded patients from MCHS if they were admitted specifically under the care of their primary care physician or subspecialist (eg, admitted for chemotherapy) or were a prison inmate. Patients meeting these eligibility criteria were then approached for purposes of informed consent.
Data Collection
Data for this study were obtained from administrative data, patient interview, and chart abstraction as in previous work.14 Administrative data were drawn from cost‐accounting databases at each participating hospital; administrative data were used to provide cost and length of stay data, as well as information about patient insurance type, age, and sex.
We interviewed patients immediately after informed consent was obtained, with both taking place generally within 24 hours of admission. Interviews collected data about patient preferences for care and functional status,20 and other data not reliably available from administrative sources (such as housing situation).
Patient care plan before admission was taken from notes and orders written in the first 24 hours of hospitalization, as mentioned above. Using criteria we employed in previous work,21 a care discussion (CD) was defined as documentation of a discussion between patients (or family) and at least 1 physician (primary physician, hospitalist, consulting physician, or house officer) during the first 24 hours of hospitalization. CDs needed to specify that the person who wrote the note had actually spoken with the patient or their family for the purposes of determining preferences for care, and that this discussion resulted in a specific care plan. Thus, notations such as do not resuscitate/do not intubate, or spoke with family, questions answered, did not qualify as CDs, but a note stating the patient continues to want full efforts was counted as a CD.
Principal investigators at each site were responsible for training and overseeing interviewing and chart abstraction activities at each site, with central oversight of data quality provided by the central coordinating center. Upon receipt at the data coordinating center, all data were examined for missing, nonsensical, or outlier data with errors referred back to the participating sites for correction.
Statistical Analysis
For bivariable comparisons of patients with and without CDs, we used chi‐squared or Mann‐Whitney U‐tests, as appropriate.
Variables with P < 0.20 in bivariable comparisons were selected for initial inclusion in models. Then, using automated forward and stepwise selection techniques as well as manually entered variables, we fit multivariable generalized estimating equations permitting clustering of effects at the physician level to determine the independent association between the multiple factors tested and presence of a CD. In order to guard against the threat of multiple testing, we retained variables at a significance level of P < 0.01; variables were also retained because of observed confounding with other independent variables, or to maintain face validity of the model. All analyses were performed using SAS 9.0 for Windows (SAS Institute Inc., Cary, NC).
RESULTS
Patient Sociodemographics (Table 1)
A total of 17,097 of 33,638 patients (50.8%) were interviewed and gave consent for chart abstraction. Of these patients, 1776 (10.3%) had a CD documented in the first 24 hours of hospitalization. Patients with documented CDs were older, more often white, had completed more years of education, were more likely to have lived in a nursing home prior to admission, and more likely to have been hospitalized in the last 12 months. The proportion of patients with CDs was highly variable across site of enrollment, from 2.8%‐24.9%.
| Value | No Documented CD (n = 15321, 89.7%) | Documented CD (n = 1776, 10.3%) | P* |
|---|---|---|---|
| |||
| Age (Median, 95%CI)* | 56 (55, 56) | 69 (67, 71) | < 0.0001 |
| Female (n, %) | 8390 (54.8%) | 990 (55.7%) | 0.4312 |
| Race (n, %) | |||
| White | 6640 (43.3%) | 938 (52.8%) | < 0.0001 |
| African American | 4673 (30.5%) | 280 (15.8%) | |
| Asian | 532 (3.5%) | 167 (9.4%) | |
| American Indian | 325 (2.1%) | 26 (1.5%) | |
| Other | 1951 (12.7%) | 241 (13.6%) | |
| Refused/Don't know | 1200 (7.8%) | 124 (7.0%) | |
| Ethnicity (n, %) | |||
| Hispanic or Latino Ethnicity | 1724 (11.3%) | 183 (10.3%) | 0.0039 |
| Insurance type (n, %) | |||
| Charity | 481 (3.4%) | 14 (0.8%) | < 0.0001 |
| Indemnity | 3983 (28.2%) | 327 (19.3%) | |
| Medicaid | 2487 (17.6%) | 195 (11.5%) | |
| Medicare | 6418 (45.5%) | 1114 (65.9%) | |
| Other | 105 (0.7%) | 4 (0.2%) | |
| Self pay | 628 (4.5%) | 36 (2.1%) | |
| Self‐reported education (n, %) | |||
| Junior high school or less | 1297 (8.5%) | 217 (12.2%) | < 0.0001 |
| Some high school | 2146 (14.0%) | 182 (10.2%) | |
| High school graduate | 4435 (28.9%) | 465 (26.2%) | |
| Some college or junior college | 3521 (23.0%) | 347 (19.5%) | |
| College graduate | 1729 (11.3%) | 255 (14.4%) | |
| Post‐graduate | 1191 (7.8%) | 173 (9.7%) | |
| Refused/Don't know | 1002 (6.5%) | 137 (7.7%) | |
| Self reported income (n, %) | |||
| $2,500 or less | 1079 (7.0%) | 108 (6.1%) | 0.0002 |
| $2,501 to $5,000 | 424 (2.8%) | 33 (1.9%) | |
| $5,001 to $10,000 | 1436 (9.4%) | 211 (11.9%) | |
| $10,001 to $15,000 | 1080 (7.0%) | 141 (7.9%) | |
| $15,001 to $25,000 | 1054 (6.9%) | 134 (7.5%) | |
| $25,001 to $35,000 | 837 (5.5%) | 74 (4.2%) | |
| $35,001 to $50,000 | 882 (5.8%) | 94 (5.3%) | |
| $50,001 to $100,000 | 1027 (6.7%) | 125 (7.0%) | |
| $100,001 to $200,000 | 357 (2.3%) | 57 (3.2%) | |
| Over $200,000 | 245 (1.6%) | 34 (1.9%) | |
| Don't know/refused | 6900 (45.0%) | 765 (43.1%) | |
| Housing situation (n, %) | |||
| Own apartment or house | 11887 (77.6%) | 1264 (71.2%) | < 0.0001 |
| A relative or friend's apartment or house | 1804 (11.8%) | 217 (12.2%) | |
| A nursing home, group home, or long‐term care facility | 663 (4.3%) | 204 (11.5%) | |
| A homeless shelter | 258 (1.7%) | 27 (1.5%) | |
| Other | 709 (4.6%) | 64 (3.6%) | |
| Marital status (n, %) | |||
| Married | 4992 (32.6%) | 603 (34.0%) | < 0.0001 |
| Living as if married | 440 (2.9%) | 32 (1.8%) | |
| Divorced | 2027 (13.2%) | 199 (11.2%) | |
| Separated | 569 (3.7%) | 30 (1.7%) | |
| Widowed | 2577 (16.8%) | 487 (27.4%) | |
| Single | 4074 (26.6%) | 364 (20.5%) | |
| Refused | 642 (4.2%) | 61 (3.4%) | |
| Hospitalized in the last 12 months (n, %) | 7602 (49.6%) | 1011 (56.9%) | < 0.0001 |
| Site of enrollment (n, %) | |||
| A | 4602 (30.0%) | 135 (7.6%) | < 0.0001 |
| B | 1595 (10.4%) | 158 (8.9%) | |
| C | 3017 (19.7%) | 998 (56.2%) | |
| D | 2387 (15.6%) | 212 (11.9%) | |
| E | 2057 (13.4%) | 131 (7.4%) | |
| F | 1663 (10.9%) | 142 (8.0%) | |
Patient Self‐Reported Health Status and Comorbid Illness (Table 2)
Patients with CDs more often reported a lot of difficulties with bathing, eating, or dressing; household chores; and moderate activities. Patients with CDs were more likely to report accomplishing less than they would like due to their health. They were more likely to have cancer, depression, a history of stroke, and heart disease, but less likely to have diabetes or human immunodeficiency virus.
| Value | No Documented CD (n = 15321, 89.7%) | Documented CD (n = 1776, 10.3%) | P** |
|---|---|---|---|
| |||
| Thinking back again to one month ago, did any impairment or health problem cause you to need help of other persons with personal care needs, such as eating, bathing, dressing, or getting around the home? (n, %) | |||
| No | 10673 (69.7%) | 973 (54.8%) | < 0.0001 |
| Yes, a little | 1933 (12.6%) | 268 (15.1%) | |
| Yes, a lot | 2127 (13.9%) | 487 (27.4%) | |
| Don't know | 588 (3.8%) | 48 (2.7%) | |
| Thinking back to one month ago, did any impairment or health problem cause you to need help in handling everyday household chores, necessary business, shopping, or getting around for other purposes? (n, %) | |||
| No | 7262 (47.4%) | 566 (31.9%) | < 0.0001 |
| Yes, a little | 2692 (17.6%) | 324 (18.2%) | |
| Yes, a lot | 4126 (26.9%) | 825 (46.5%) | |
| Don't know | 1241 (8.1%) | 61 (3.4%) | |
| As far as you know do you have any of the following health conditions at the present time? (n, %) | |||
| Cancer | |||
| No | 13281 (86.7%) | 1376 (77.5%) | < 0.0001 |
| Yes | 1751 (11.4%) | 351 (19.8%) | |
| Not sure | 289 (1.9%) | 49 (2.8%) | |
| Depression | |||
| No | 10269 (67.0%) | 1099 (61.9%) | < 0.0001 |
| Yes | 4730 (30.9%) | 624 (35.1%) | |
| Not sure | 322 (2.1%) | 53 (3.0%) | |
| Diabetes | |||
| No | 10902 (71.2%) | 1356 (76.4%) | < 0.0001 |
| Yes | 4132 (27.0%) | 394 (22.2%) | |
| Not sure | 287 (1.9%) | 26 (1.5%) | |
| Heart trouble | |||
| No | 10251 (66.9%) | 1080 (60.8%) | < 0.0001 |
| Yes | 4491 (29.3%) | 627 (35.3%) | |
| Not sure | 579 (3.8%) | 69 (3.9%) | |
| HIV or AIDS | |||
| No | 14300 (93.3%) | 1679 (94.5%) | 0.026 |
| Yes | 912 (6.0%) | 80 (4.5%) | |
| Not sure | 109 (0.7%) | 17 (1.0%) | |
| Stroke | |||
| No | 13344 (87.1%) | 1494 (84.1%) | 0.0005 |
| Yes | 1722 (11.2%) | 236 (13.3%) | |
| Not sure | 255 (1.7%) | 46 (2.6%) | |
Patient Preferences, Care Plan Documentation, and Care Coordination at Admission (Table 3)
Patients who had documented CDs were less likely to prefer my doctor give me choices regarding my care, and more often disagreed with the statement I prefer to leave care decisions to my physician. These patients were also more likely to have a durable power of attorney or living will in their chart, or have an alternate decision‐maker noted. The majority of patients without a documented CD (79.9%) had no notation of their care wishes, compared to 29.7% in patients with a documented CD. Patients with a documented CD were more likely to have a regular medical provider and a note in the chart from their primary care physician.
| Value | No Documented CD (n = 15321, 89.7%) | Documented CD (n = 1776, 10.3%) | P* |
|---|---|---|---|
| |||
| I prefer my doctor give me choices regarding my care** (n, %) | |||
| Definitely agree | 11619 (75.8%) | 1247 (70.2%) | < 0.0001 |
| Somewhat agree | 1912 (12.5%) | 252 (14.2%) | |
| Somewhat disagree | 488 (3.2%) | 76 (4.3%) | |
| Definitely disagree | 414 (2.7%) | 87 (4.9%) | |
| Don't know | 888 (5.8%) | 114 (6.4%) | |
| I prefer to leave care decisions to my physician** (n, %) | |||
| Definitely agree | 5660 (36.9%) | 613 (34.5%) | < 0.0001 |
| Somewhat agree | 4539 (29.6%) | 493 (27.8%) | |
| Somewhat disagree | 2265 (14.8%) | 257 (14.5%) | |
| Definitely disagree | 1956 (12.8%) | 304 (17.1%) | |
| Don't know | 901 (5.9%) | 109 (6.1%) | |
| Documentation of care wishes before hospitalization (n, %) | |||
| No documentation | 12238 (79.9%) | 527 (29.7%) | < 0.0001 |
| Full support | 2624 (17.1%) | 742 (41.8%) | |
| Do not resuscitate or intubate (DNR/DNI) | 264 (1.7%) | 370 (20.8%) | |
| Hospice | 53 (0.3%) | 22 (1.2%) | |
| Other limitation (eg, no pressors) | 142 (0.9%) | 115 (6.5%) | |
| Had durable power of attorney in chart (n, %) | 286 (1.9%) | 133 (7.5%) | < 0.0001 |
| Had a living will in chart (n, %) | 266 (1.7%) | 142 (8.0%) | < 0.0001 |
| Alternate decision maker named in chart (n, %) | 2770 (18.1%) | 638 (35.9%) | < 0.0001 |
| Patient noted to be unable to participate in their care at admission (eg, confused, unable to respond) (n, %) | 1227 (8.0%) | 431 (24.3%) | < 0.0001 |
| Inpatient team documented discussion with primary care physician (n, %) | 627 (4.1%) | 136 (7.7%) | < 0.0001 |
| Do not have a regular medical provider** (n, %) | 3836 (25.0%) | 254 (14.3%) | < 0.0001 |
| Note from primary care physician in chart (n, %) | 148 (1.0%) | 39 (2.2%) | < 0.0001 |
Factors Associated with Documented Care Discussions (Table 4)
Using predictor variables presented in Tables 1‐3, we then constructed multivariable models seeking to understand factors independently associated with documentation of code status in the entire cohort, as well as among patients who had no preexisting care wishes.
| Entire Cohort (n = 17097) | Patients with No Documentation of Preadmission Wishes (n = 12765) | |||
|---|---|---|---|---|
| Adjusted Odds Ratio (95% CI) | P Value | Adjusted Odds Ratio (95% CI) | P Value | |
| Preadmission Code Status | ||||
| No documentation | Referent | NA | ||
| Full support | 3.22 (2.28, 4.55) | < 0.0001 | NA | |
| Do not resuscitate or intubate (DNR/DNI) | 11.32 (8.52, 15.04) | < 0.0001 | NA | |
| Hospice | 4.02 (2.33, 6.94) | < 0.0001 | NA | |
| Other limitation (eg, no pressors) | 10.13 (7.35, 13.96) | < 0.0001 | NA | |
| Insurance type | ||||
| Medicare | Referent | Referent | ||
| Charity care | 0.50 (0.30, 0.85) | 0.0099 | 0.56 (0.25, 1.25) | 0.1589 |
| Commercial | 0.81 (0.69, 0.95) | 0.0090 | 0.66 (0.52, 0.85) | 0.0009 |
| Medicaid | 0.69 (0.57, 0.82) | < 0.0001 | 0.49 (0.36, 0.67) | < 0.0001 |
| Other | 0.46 (0.18, 1.13) | 0.0912 | 0.60 (0.17, 2.12) | 0.4302 |
| Self pay | 0.70 (0.52, 0.95) | 0.0203 | 0.49 (0.29, 0.81) | 0.0060 |
| Any limitations in bathing, toileting, dressing or feeding self? | ||||
| No | Referent | Referent | ||
| Yes, a little | 1.25 (1.10, 1.42) | 0.0007 | 1.31 (1.03, 1.67) | 0.0272 |
| Yes, a lot | 1.25 (1.09, 1.43) | 0.0015 | 1.42 (1.11, 1.81) | 0.0055 |
| Unable to respond | 0.81 (0.59, 1.12) | 0.2006 | 0.80 (0.45, 1.41) | 0.4299 |
| Patient has a documented surrogate decision maker | 1.72 (1.47, 2.02) | < 0.0001 | 2.08 (1.62, 2.66) | < 0.0001 |
| Patient noted to be unable to participate in their care at admission (eg, confused, unable to respond) | 1.63 (1.37, 1.94) | < 0.0001 | 2.20 (1.60, 3.02) | < 0.0001 |
| Notation that team had spoken to primary care physician at admission | 1.65 (1.29, 2.11) | < 0.0001 | 1.45 (0.92, 2.28) | 0.1116 |
| History of cancer | ||||
| No | Referent | Referent | ||
| Yes | 1.31 (1.13, 1.51) | 0.0003 | 1.26 (0.96, 1.65) | 0.0960 |
| Not sure | 1.26 (0.87, 1.82) | 0.2162 | 1.80 (1.03, 3.15) | 0.0396 |
| History of diabetes | ||||
| No | Referent | Referent | ||
| Yes | 0.87 (0.75, 1.003) | 0.0543 | 0.79 (0.62, 0.997) | 0.0467 |
| Not sure | 0.61 (0.38, 0.99) | 0.0445 | 0.84 (0.43, 1.65) | 0.6183 |
| Housing situation | ||||
| Own house or apartment | Referent | Referent | ||
| Relative or friend's apartment or house | 1.22 (1.03, 1.45) | 0.0229 | 1.29 (0.97, 1.71) | 0.0783 |
| Nursing home, group home, or long‐term care facility | 1.42 (1.16, 1.74) | 0.0006 | 1.74 (1.27, 2.40) | 0.0007 |
| Homeless shelter | 1.12 (0.72, 1.73) | 0.6204 | 0.87 (0.46, 1.63) | 0.6559 |
| Other/Don't know | 1.02 (0.75, 1.40) | 0.8987 | 1.35 (0.78, 2.36) | 0.2859 |
| Age Group | ||||
| <50 | Referent | Referent | ||
| 5059 | 1.19 (0.99, 1.43) | 0.0647 | 1.18 (0.88, 1.59) | 0.2583 |
| 6069 | 1.18 (0.99, 1.40) | 0.0585 | 1.20 (0.88, 1.66) | 0.2549 |
| 7079 | 1.10 (0.91, 1.33) | 0.3178 | 1.19 (0.85, 1.67) | 0.3033 |
| 8089 | 1.23 (1.03, 1.47) | 0.0207 | 1.34 (0.96, 1.88) | 0.0879 |
| 90+ | 1.45 (1.12, 1.88) | 0.0045 | 1.44 (0.94, 2.20) | 0.0934 |
| Site of Enrollment | ||||
| A | Referent | Referent | ||
| B | 1.74 (1.16, 2.61) | 0.007 | 4.95 (2.90, 8.45) | < 0.0001 |
| C | 5.14 (3.42, 7.74) | < 0.0001 | 26.36 (17.28, 40.23) | < 0.0001 |
| D | 4.19 (2.64, 6.66) | < 0.0001 | 8.06 (4.63, 14.03) | < 0.0001 |
| E | 3.00 (1.82, 4.9) | < 0.0001 | 5.30 (2.71, 10.38) | < 0.0001 |
| F | 4.09 (2.69, 6.23) | < 0.0001 | 2.32 (1.32, 4.08) | 0.0037 |
In the entire cohort, insurance type was independently associated with likelihood of a care discussion, with patients with Medicare having greater adjusted odds ratio for a CD than patients with all other forms of insurance, even after adjusting for age. Patients who had functional limitations with bathing, toileting, and feeding; had a documented surrogate decision maker; were unable to participate in their care; had cancer; or did not live in their own home were more likely to have a documented CD. Subjects with diabetes were less likely to have a CD, although this was of borderline significance. Patients whose team had documented a CD with the patients' primary physician were also more likely to have a discussion noted. However, the magnitude of these predictors was small compared to the independent effects attributable to the site the patient was enrolled or whether the patient had any preexisting documentation. Whereas the adjusted odds ratio associated with clinical or functional measures (such as age, cancer) were generally between 1.5 and 2.5, the range of odds ratios associated with having any documentation of care wishes (compared to no documentation) were all greater than 3, and the odds ratios associated with site of enrollment were 1.7 or higher.
We observed similar findings in analyses limited to patients with no preexisting care documentation. While clinical, sociodemographic, and functional factors remained statistically associated with a CD (albeit with wider confidence intervals due to smaller sample sizes), the effect of the patient's site of enrollment became even more striking (Table 4).
DISCUSSION
In this multicenter study of hospitalized general medical patients, documentation of CDs were highly dependent on where patients received care and whether patients had previous documentation of a care plan. In contrast, although clinical, prognostic, and socioeconomic factors were also associated with whether physicians documented asking patients about their wishes for care, the influence of these factors was modest.
Improving communication between patients and their physicians during an episode of acute illness has been a long‐standing goal, with the Study to Understand Prognoses and Preferences for Outcomes of Treatment (SUPPORT) trial providing the most notable example of an effort to improve patient care through aligning patient wishes, prognosis, and aggressiveness for care. However, even the SUPPORT interventiona robust, well‐implemented, and highly labor‐intensive strategywas not able to achieve this goal. In their summary of SUPPORT study findings, the authors suggested that the likelihood of and effectiveness of communication in seriously ill patients may be powerfully influenced by patient and caregiver culture4; our findings may partially confirm SUPPORT's conclusions.
Preexisting documentation in our study would not have included mandated documentation that someone had given the patient information about advance directives (as mandated by the PSDA), but rather a specification for that advance care plan. This distinction means that preexisting documentation in our study represented a previous decision by the patient (or the patient and their physician) to have made a plan, and an association with hospital discussions may be because the first conversation is the hardest to undertake; subsequent discussions then represent confirmatory or clarifying discussions that may be less difficult to broach (particularly for less experienced trainees). A CD may have also been prompted when documentation was unclear, or when a change in prognosis took place (eg, a new diagnosis of metastatic cancer).22 Alternatively, a preexisting plan may serve as a reminder for clinicians to discuss code status, signify patients who are more willing to broach this subject, and either seem more approachable or bring up the topic themselves.
The influence of site on documentation and CD provides additional evidence that caregiver culture played a role in CDs. Although this variation may have been in part due to culture around documentation practices more generally, it is important to note that none of our participating centers had a policy for documentation of care wishes or patient‐doctor communication, or a policy mandating these discussions in any specific patient group. Furthermore, site‐related differences were seen even in patients with no preexisting documentation, and were seen after adjustment for other documentation or communication practices (eg, documenting a discussion with the patient's primary care provider), making it unlikely that documentation practices are solely responsible for our results. Persistence of variations in care documentation raises interesting questions, particularly when one considers recent data describing variations in end‐of‐life care between similar academic centers (one of which was a participating site in this trial).23 Given that the sites in our study represent diverse institutions yet share a number of characteristics, understanding the specific practices or aspects of medical culture that promote conversations may provide insights in how to improve this promotion elsewhere.
Our results would argue that mandates to document code status on admission may be unlikely to improve communication unless sites also develop an approach to using this newly documented information as a prompt for subsequent discussions. In nursing home settings, documentation of advance directives may reduce resource use, but it is unclear whether similar effects will be seen in hospital settings.24 It is also a challenge to insure that documentation of a care plan in the nursing home is communicated to the providers in the hospital.25 The PSDA was a first step in this direction, but its effects on improving communication are uncertain.26 Our results would confirm that the PSDA or systems to mandate documentation are not solutions in themselves, but are 2 steps in a larger process.
We do not want to discount our findings of less frequent CDs among patients of lower socioeconomic status, where gaps in quality of care, communication, and outcomes are well‐recognized.27 As such, our results delineate yet another area where practice can and should be improved for vulnerable patients. However, factors related to site of care and documentation may provide opportunities to improve care even more profoundly and within a fairly discrete (if complex) acute episode of care. Having said this, our results also demonstrate a potential pitfall of using code status documentation for risk‐adjustment, because such notation may be more dependent on local documentation patterns than clinical appropriateness.
Our study has a number of limitations. As an observational study, our findings are likely prone to biases related to unadjusted confounding due to comorbidity. The influence of comorbidity would seem to have been most important in biasing the effects of preexisting documentation, where documentation would be associated with more unaccounted comorbidity. However, there were no differences in documentation even after accounting for prognosis by adjusting for age, functional status, and a valid comorbidity score.28 As we have pointed out, our key outcome is based on documentation of communication and not actual communication, and as such may be biased in subtle ways not related to site of care or the items tested in our model. While we cannot directly eliminate the possibility of documentation biases in our results using statistical methods, it is important to point out that our chart abstraction protocol used highly specific criteria to detect these discussions, and therefore may under‐detect discussions which may have been documented in less detail. Our study did not examine whether documentation of CDs influenced subsequent care. However, previous studies have shown that advance care planning has only a minor influence on care.29 However, communication about preferences at the time of admission, when the need for specific care decisions may be more evident, may be more likely to influence hospital care. Our results show that previous documentation is associated with discussions early in an admission. Such discussion may affect care, even if the decision made is different than what was previously documented. In addition, patients who were included in our study (those able to provide consent and participate in an interview) may be healthier or more cognitively intact than a general population of hospitalized patients. However, how this would have affected our results is unclear. Being able to speak and consent for oneself are key facilitators to communication, but sicker patients who cannot consent or speak for themselves might also be more likely to have care planning decisions made based on illness severity; documentation in these patients may be more driven by whether such notes were required because of the involvement of home health services (or skilled nursing facilities). Finally, although our study is one of the largest examinations of in‐hospital communication to date and its implications for resident education are worth noting, the sites involved in the MCHS may not be representative of nonteaching hospitals, or community‐based teaching hospitals.
Our results suggest that, although comorbid illness and socioeconomic status play an important role in determining which patients receive CDs at the time of admission, these factors are substantially less powerful than preexisting documentation practices and culture or care practices specific to their site of care. These results suggest that future work should consider organizational characteristics and culture as important targets for interventions to improve care planning in hospitalized patients.
- Committee on Care at the End of Life, Institute of Medicine.Approaching Death: Improving Care at the End of Life.Field MJ,Cassel CK, eds.Washington, DC:National Academy Press;1997.
- ,,,,,.Factors considered important at the end of life by patients, family, physicians, and other care providers.JAMA.2000;284(19):2476–2482.
- ,,,,,.In search of a good death: observations of patients, families, and providers.Ann Intern Med.2000;132(10):825–832.
- The SUPPORT Principal Investigators.A controlled trial to improve care for seriously ill hospitalized patients. The study to understand prognoses and preferences for outcomes and risks of treatments (SUPPORT).JAMA.1995;274(20):1591–1598.
- ,.Choices about cardiopulmonary resuscitation in the hospital. When do physicians talk with patients?N Engl J Med.1984;310(17):1089–1093.
- ,,, et al.Patient preferences for communication with physicians about end‐of‐life decisions. SUPPORT Investigators. Study to Understand Prognoses and Preference for Outcomes and Risks of Treatment.Ann Intern Med.1997;127(1):1–12.
- ,,,.Discussing cardiopulmonary resuscitation: a study of elderly outpatients.J Gen Intern Med.1988;3(4):317–321.
- ,,,,.Educating the elderly: cardiopulmonary resuscitation decisions before and after intervention.J Am Geriatr Soc.1991;39(4):372–377.
- ,,,.Factors influencing physicians in recommending in‐hospital cardiopulmonary resuscitation.Arch Intern Med.1993;153(17):1999–2003.
- Federal Register. 42 USC 1395‐1396. Patient Self‐Determination Act1990.
- ,,.Advance directives on admission. Clinical implications and analysis of the Patient Self‐Determination Act of 1990.JAMA.1991;266(3):402–405.
- ,,.A new doctor in the house: ethical issues in hospitalist systems.JAMA.1999;282(2):171–174.
- ,,,,,.Implementation of a hospitalist service at a community teaching hospital: improving clinical efficiency and patient outcomes.Ann Intern Med.2002;137:859–865.
- ,,, et al.Effects of hospitalist physicians on an academic general medical service: results of a randomized trial.Ann Intern Med.2002;137:866–874.
- ,.The hospitalist movement 5 years later.JAMA.2002;287(4):487–494.
- ,,,,.Reorganizing an academic medical service: impact on cost, quality, patient satisfaction, and education.JAMA.1998;279(19):1560–1565.
- ,,,,,.Physician staffing patterns and clinical outcomes in critically ill patients: a systematic review.JAMA.2002;288(17):2151–2162.
- ,,, et al.Organizational characteristics of intensive care units related to outcomes of abdominal aortic surgery.JAMA.1999;281(14):1310–1317.
- ,,, et al.Effects of inpatient experience on outcomes and costs in a multicenter trial of academic hospitalists.J Gen Intern Med.2005;20(Suppl 1):141–142.
- ,,.SF‐12: How to Score the SF‐12 Physical and Mental Health Summary Scales.2nd ed.Boston, MA:New England Medical Center, The Health Institute;1995.
- ,.End‐of‐life care in a voluntary hospitalist model: effects on communication, processes of care, and patient symptoms.Am J Med.2004;116(10):669–675.
- ,,,.Role of written advance directives in decision making: insights from qualitative and quantitative data.J Gen Intern Med.1998;13(7):439–446.
- ,,,,.Evaluating the efficiency of California providers in caring for patients with chronic illnesses.Health Aff (Millwood).2005 Jul‐Dec;Suppl Web Exclusives:W5–526–43.
- ,,, et al.Systematic implementation of an advance directive program in nursing homes: a randomized controlled trial.JAMA.2000;283(11):1437–1444.
- ,.Meeting palliative care needs in post‐acute care settings: “to help them live until they die”.JAMA.2006;295(6):681–686.
- ,,, et al.Advance directives for seriously ill hospitalized patients: effectiveness with the patient self‐determination act and the SUPPORT intervention. SUPPORT Investigators. Study to Understand Prognoses and Preferences for Outcomes and Risks of Treatment.J Am Geriatr Soc.1997;45(4):500–507.
- Institute of Medicine.Unequal Treatment: Confronting Racial and Ethnic Disparities in Health Care.Smedley BD,Stith AY,Nelson AR, eds.Washington, DC:National Academies Press;2003.
- ,,.Use of a self‐report‐generated Charlson Comorbidity Index for predicting mortality.Med Care.2005;43(6):607–615.
- ,,.Can clinical interventions change care at the end of life?Ann Intern Med.1997;126(5):381–388.
Copyright © 2008 Society of Hospital Medicine