User login
Racism joins COVID-19 at the primary care table
Primary care clinicians, already experiencing all-time high stress levels related to COVID-19, are now struggling to cope with the fallout from racism and the death of George Floyd, according to a survey conducted June 5-8.
When asked how the situation has affected their practices, two-thirds of the survey’s 586 respondents said that George Floyd’s death and related events had been the subject of practice conversations and 12% “drew clear connections between the current racial unrest and the health of their patients,” the Larry A. Green Center said in a recent statement.
One-third of the clinicians also said that recent racism-related events have had a negative effect on their own well-being, and that connection was expressed even more strongly in a related survey of 1,111 patients that was conducted June 8.
In that survey, about 65% of patients said that racism affected emotional, psychological, and behavioral health, and 40% noted that George Floyd’s death had a negative impact on the well-being of friends, the Larry A. Green Center said in partnership with the Primary Care Collaborative and 3rd Conversation.
“The fact that so many patients and clinicians agree that racism is a driver of health points to the incredible role primary care plays in creating safe spaces to process deep societal and personal issues,” said Christine Bechtel, cofounder of 3rd Conversation, a community of patients and providers.
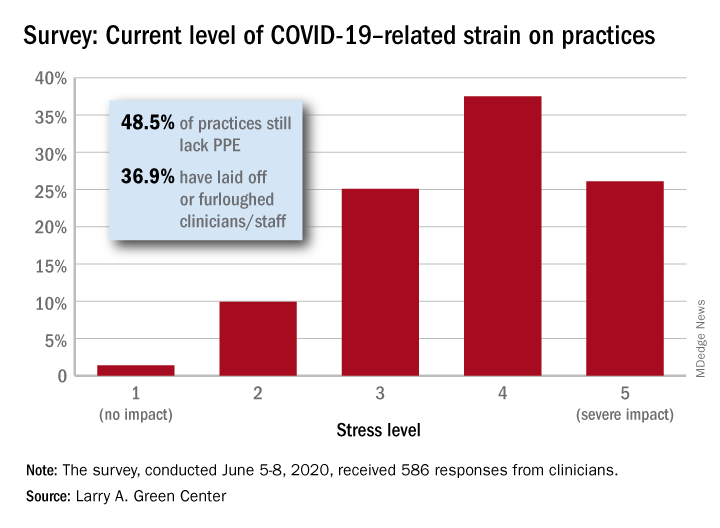
COVID-19, in the meantime, is still doing its thing. Almost two-thirds (63%) of respondents to the clinician survey said that stress levels at their practices had reached all-time-high levels in the last 4 weeks.
Just 1.4% of the primary care clinicians said that the pandemic had put no strain on their practices (see graph), and just 10% rated that strain as a 2 on a scale of 1-5, the center said. Among the stressors:
About 49% continue to lack PPE.
About 40% still have no or limited ability for testing.
About 37% of practice settings still report layoffs and furloughs.
About 31% report that clinician salaries are still being skipped or deferred.
“Both public and private policy makers must take immediate steps to stabilize primary care,” said Ann Greiner, president and CEO of the Primary Care Collaborative. “This financial support is necessary but not sufficient. Instead, we need wholesale reform of payment in order to achieve the kind of high-performing primary care that truly meets patient needs.”
Primary care clinicians, already experiencing all-time high stress levels related to COVID-19, are now struggling to cope with the fallout from racism and the death of George Floyd, according to a survey conducted June 5-8.
When asked how the situation has affected their practices, two-thirds of the survey’s 586 respondents said that George Floyd’s death and related events had been the subject of practice conversations and 12% “drew clear connections between the current racial unrest and the health of their patients,” the Larry A. Green Center said in a recent statement.
One-third of the clinicians also said that recent racism-related events have had a negative effect on their own well-being, and that connection was expressed even more strongly in a related survey of 1,111 patients that was conducted June 8.
In that survey, about 65% of patients said that racism affected emotional, psychological, and behavioral health, and 40% noted that George Floyd’s death had a negative impact on the well-being of friends, the Larry A. Green Center said in partnership with the Primary Care Collaborative and 3rd Conversation.
“The fact that so many patients and clinicians agree that racism is a driver of health points to the incredible role primary care plays in creating safe spaces to process deep societal and personal issues,” said Christine Bechtel, cofounder of 3rd Conversation, a community of patients and providers.
COVID-19, in the meantime, is still doing its thing. Almost two-thirds (63%) of respondents to the clinician survey said that stress levels at their practices had reached all-time-high levels in the last 4 weeks.
Just 1.4% of the primary care clinicians said that the pandemic had put no strain on their practices (see graph), and just 10% rated that strain as a 2 on a scale of 1-5, the center said. Among the stressors:
About 49% continue to lack PPE.
About 40% still have no or limited ability for testing.
About 37% of practice settings still report layoffs and furloughs.
About 31% report that clinician salaries are still being skipped or deferred.
“Both public and private policy makers must take immediate steps to stabilize primary care,” said Ann Greiner, president and CEO of the Primary Care Collaborative. “This financial support is necessary but not sufficient. Instead, we need wholesale reform of payment in order to achieve the kind of high-performing primary care that truly meets patient needs.”
New long-term data for antipsychotic in pediatric bipolar depression
The antipsychotic lurasidone (Latuda, Sunovion Pharmaceuticals) has long-term efficacy in the treatment of bipolar depression (BD) in children and adolescents, new research suggests.
In an open-label extension study involving patients aged 10-17 years, up to 2 years of treatment with lurasidone was associated with continued improvement in depressive symptoms. There were progressively higher rates of remission, recovery, and sustained remission.
Coinvestigator Manpreet K. Singh, MD, director of the Stanford Pediatric Mood Disorders Program, Stanford (Calif.) University, noted that early onset of BD is common. Although in pediatric populations, prevalence has been fairly stable at around 1.8%, these patients have “a very limited number of treatment options available for the depressed phases of BD,” which is often predominant and can be difficult to identify.
“A lot of youths who are experiencing depressive symptoms in the context of having had a manic episode will often have a relapsing and remitting course, even after the acute phase of treatment, so because kids can be on medications for long periods of time, a better understanding of what works ... is very important,” Dr. Singh said in an interview.
The findings were presented at the virtual American Society of Clinical Psychopharmacology (ASCP) 2020 annual meeting.
Long-term Efficacy
The Food and Drug Administration approved lurasidone as monotherapy for BD in children and adolescents in 2018. The aim of the current study was to evaluate the drug’s long-term efficacy in achieving response or remission in this population.
A total of 305 children who completed an initial 6-week double-blind study of lurasidone versus placebo entered the 2-year, open-label extension study. In the extension, they either continued taking lurasidone or were switched from placebo to lurasidone 20-80 mg/day. Of this group, 195 children completed 52 weeks of treatment, and 93 completed 104 weeks of treatment.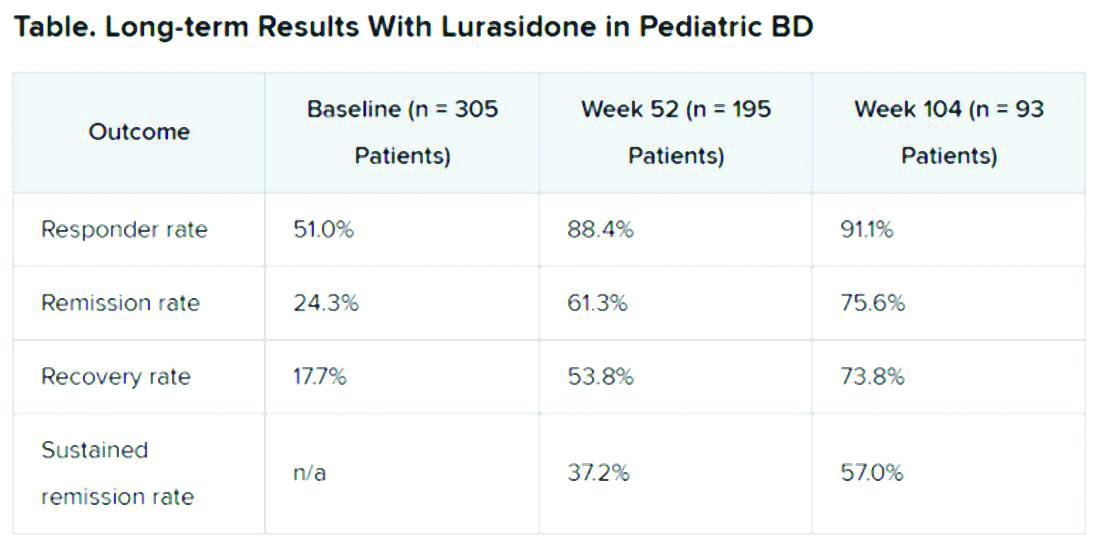
Efficacy was measured with the Children’s Depression Rating Scale, Revised (CDRS-R) and the Clinical Global Impression, Bipolar Depression Severity scale (CGI-BP-S). Functioning was evaluated with the clinician-rated Children’s Global Assessment Scale (CGAS); on that scale, a score of 70 or higher indicates no clinically meaningful functional impairment.
Remission criteria were met if a patient achieved a CDRS-R total score of 28 or less, a Young Mania Rating Scale (YMRS) total score of 8 or less, and a CGI-BP-S depression score of 3 or less.
Recovery criteria were met if a patient achieved remission and had a CGAS score of at least 70.
Sustained remission, a more stringent outcome, required that the patient meet remission criteria for at least 24 consecutive weeks.
In addition, there was a strong inverse correlation (r = –0.71) between depression severity, as measured by CDRS-R total score, and functioning, as measured by the CGAS.
“That’s the cool thing: As the depression symptoms and severity came down, the overall functioning in these kids improved,” Dr. Singh noted.
“This improvement in functioning ends up being much more clinically relevant and useful to clinicians than just showing an improvement in a set of symptoms because what brings a kid – or even an adult, for that matter – to see a clinician to get treatment is because something about their symptoms is causing significant functional impairment,” she said.
“So this is the take-home message: You can see that lurasidone ... demonstrates not just recovery from depressive symptoms but that this reduction in depressive symptoms corresponds to an improvement in functioning for these youths,” she added.
Potential Limitations
Commenting on the study, Christoph U. Correll, MD, professor of child and adolescent psychiatry, Charite Universitatsmedizin, Berlin, Germany, noted that BD is difficult to treat, especially for patients who are going through “a developmentally vulnerable phase of their lives.”
“Lurasidone is the only monotherapy approved for bipolar depression in youth and is fairly well tolerated,” said Dr. Correll, who was not part of the research. He added that the long-term effectiveness data on response and remission “add relevant information” to the field.
However, he noted that it is not clear whether the high and increasing rates of response and remission were based on the reporting of observed cases or on last-observation-carried-forward analyses. “Given the naturally high dropout rate in such a long-term study and the potential for a survival bias, this is a relevant methodological question that affects the interpretation of the data,” he said.
“Nevertheless, the very favorable results for cumulative response, remission, and sustained remission add to the evidence that lurasidone is an effective treatment for youth with bipolar depression. Since efficacy cannot be interpreted in isolation, data describing the tolerability, including long-term cardiometabolic effects, will be important complementary data to consider,” Dr. Correll said.
The study was funded by Sunovion Pharmaceuticals. Dr. Singh is on the advisory board for Sunovion, is a consultant for Google X and Limbix, and receives royalties from American Psychiatric Association Publishing. She has also received research support from Stanford’s Maternal Child Health Research Institute and Department of Psychiatry, the National Institute of Mental Health, the National Institute on Aging, Johnson and Johnson, Allergan, PCORI, and the Brain and Behavior Research Foundation. Dr. Correll has been a consultant or adviser to and has received honoraria from Sunovion, as well as Acadia, Alkermes, Allergan, Angelini, Axsome, Gedeon Richter, Gerson Lehrman Group, Intra-Cellular Therapies, Janssen/J&J, LB Pharma, Lundbeck, MedAvante-ProPhase, Medscape, Neurocrine, Noven, Otsuka, Pfizer, Recordati, Rovi, Sumitomo Dainippon, Supernus, Takeda, and Teva.
A version of this article originally appeared on Medscape.com.
FROM ASCP 2020
Surge in colonoscopies postponed by COVID-19 expected
An expected surge in the number of people seeking colonoscopy after the peak of the COVID-19 pandemic passes could cause physicians to rethink patient prioritization, could create a strain on endoscopy capacity, and might raise the specter of detecting colorectal cancer in more patients at a later stage of disease.

Furthermore, months of delay in diagnosis of colorectal cancer (CRC) could shorten survival, although more data is needed, according to expert analysis from a gastroenterologist, a medical oncologist, and a colorectal surgeon.
“It has been a big decrease in the number of colonoscopies performed at our hospital in Alicante, Spain,” Rodrigo Jover Martinez, MD, PhD, said during a COVID-19 and Digestive Health webinar presented by United European Gastroenterology (UEG). He estimated colonoscopy procedures are down 60%-90%, and the number of CRC surgeries has dropped by 60%. “As you know, the COVID-19 pandemic is hitting Europe hard.”
When patients do return, “the backlog will be huge ... in already exhausted endoscopy units,” predicted Dr. Martinez, a gastroenterologist at Hospital General Universitario in Alicante.
Multiple risks
Not knowing which patients with CRC will develop severe COVID-19 infection is another challenge, Bartomeu Massuti, MD, of the medical oncology service at the Hospital General Universitario de Alicante, said during the webinar.
Caution is warranted because “we know cancer patients have an increased risk of infection.” However, he added, most evidence supports an elevated risk for bacterial infections, not viral infections.
Therefore, physicians must continue to balance the risks associated with potential COVID-19 exposure against the risks associated with postponed treatment, Dr. Massuti said. “The goal of oncology care is to try to maintain the preplanned treatment and follow-up. We need mainly to avoid stopping or delaying treatment ... because we will lose efficacy in oncology disease outcomes.”
Imran Aslam, MD, PhD, a colorectal surgeon who moderated and presented during the webinar, agreed: “By delaying the treatment, we might do harm to our patients.”
Dr. Aslam cited data about clinical costs of delaying CRC surgery. A 2019 population-based study in PLOS ONE evaluated different times from diagnosis to treatment. The researchers found a delay of more than 150 days “significantly reduced survival, even during stage I, II, and III disease,” he said. The stage I hazard ratio was 2.66, compared with a reference HR of 1.00 for 90 days or fewer. They also reported elevated risk for people with stage II CRC (HR, 2.80), stage III CRC (HR, 2.70), and stage IV CRC (HR, 1.36).
“This could become more and more abysmal if the pandemic continues,” added Dr. Aslam, consultant colorectal surgeon at University Hospitals of Coventry and Warwickshire, England.
Prioritizing patients
Restarting endoscopy with prioritization strategies and increasing patient capacity are possible solutions. Dr. Martinez suggested a four-quadrant matrix in which physicians place patients into “now,” “next,” “delayed,” or “never” categories based on clinical indicators. The priority 1 “now” patients, for example, will be those with suspected CRC based on physical examination, imaging results, and/or an abnormal fecal immunochemical test result.
He suggested, furthermore, that more widespread CRC screening can resume once “endoscopy units have been alleviated of priority 1, symptomatic patients.”
Dr. Massuti concurred with Dr. Martinez’s call to prioritize patients carefully. He suggested a green, yellow, and red classification system based on treatment priority recommendations from the European Society for Medical Oncology. The green group, for example, should receive priority for intervention based on a condition that is immediately clinically unstable or life threatening.
“The main goal is to preserve the continuum of care,” he added.
Another concern – although data are limited – is that treatment might also increase risk of mortality among cancer patients with COVID-19, according to a cohort study of nearly 1,000 such patients reported May 2020 in The Lancet. Dr. Massuti, who was not affiliated with the research, noted that 12% of the patients had GI tumors. In addition to increased risk associated with male sex (odds ratio, 1.63), cytotoxic cancer treatment in the prior 4 weeks increased risk (OR, 1.47), as did surgery in the same time frame (OR, 1.52).
“This means patients on treatment have an increased risk of mortality,” Dr. Massuti said.
Moving forward
Implementing telehealth information and communication technologies will continue to grow in importance, Dr. Massuti said. Dr. Aslam noted that video consultation with patients before surgery is already replacing face-to-face interaction, and most follow-up care at his hospital is now done by telephone.
Postoperative care is just as essential in the COVID-19 era, if not more so. “We need to be very vigilant to manage postoperative complications – any symptoms of pyrexia or sepsis, or any sign of COVID,” Dr. Aslam said, including postoperative fever. “If there is any doubt, do a chest CT scan.”
Dr. Aslam predicted the time to perform endoscopy or surgery for each patient will be longer, “so the number of patients done in 1 day will be less than 4 months ago.” In addition, elective surgery patients at his institution undergo COVID-19 testing twice, 3 days apart, prior to intervention.
“This disease will continue in the community for a while, so we have to continue what we’ve done well, like social distancing,” Dr. Aslam said. “We’ve gone through a storm and we are awaiting a tsunami. That tsunami of patients will overwhelm us in the coming months.”
Dr. Martinez, Dr. Massuti, and Dr. Aslam had no relevant disclosures.
An expected surge in the number of people seeking colonoscopy after the peak of the COVID-19 pandemic passes could cause physicians to rethink patient prioritization, could create a strain on endoscopy capacity, and might raise the specter of detecting colorectal cancer in more patients at a later stage of disease.
Furthermore, months of delay in diagnosis of colorectal cancer (CRC) could shorten survival, although more data is needed, according to expert analysis from a gastroenterologist, a medical oncologist, and a colorectal surgeon.
“It has been a big decrease in the number of colonoscopies performed at our hospital in Alicante, Spain,” Rodrigo Jover Martinez, MD, PhD, said during a COVID-19 and Digestive Health webinar presented by United European Gastroenterology (UEG). He estimated colonoscopy procedures are down 60%-90%, and the number of CRC surgeries has dropped by 60%. “As you know, the COVID-19 pandemic is hitting Europe hard.”
When patients do return, “the backlog will be huge ... in already exhausted endoscopy units,” predicted Dr. Martinez, a gastroenterologist at Hospital General Universitario in Alicante.
Multiple risks
Not knowing which patients with CRC will develop severe COVID-19 infection is another challenge, Bartomeu Massuti, MD, of the medical oncology service at the Hospital General Universitario de Alicante, said during the webinar.
Caution is warranted because “we know cancer patients have an increased risk of infection.” However, he added, most evidence supports an elevated risk for bacterial infections, not viral infections.
Therefore, physicians must continue to balance the risks associated with potential COVID-19 exposure against the risks associated with postponed treatment, Dr. Massuti said. “The goal of oncology care is to try to maintain the preplanned treatment and follow-up. We need mainly to avoid stopping or delaying treatment ... because we will lose efficacy in oncology disease outcomes.”
Imran Aslam, MD, PhD, a colorectal surgeon who moderated and presented during the webinar, agreed: “By delaying the treatment, we might do harm to our patients.”
Dr. Aslam cited data about clinical costs of delaying CRC surgery. A 2019 population-based study in PLOS ONE evaluated different times from diagnosis to treatment. The researchers found a delay of more than 150 days “significantly reduced survival, even during stage I, II, and III disease,” he said. The stage I hazard ratio was 2.66, compared with a reference HR of 1.00 for 90 days or fewer. They also reported elevated risk for people with stage II CRC (HR, 2.80), stage III CRC (HR, 2.70), and stage IV CRC (HR, 1.36).
“This could become more and more abysmal if the pandemic continues,” added Dr. Aslam, consultant colorectal surgeon at University Hospitals of Coventry and Warwickshire, England.
Prioritizing patients
Restarting endoscopy with prioritization strategies and increasing patient capacity are possible solutions. Dr. Martinez suggested a four-quadrant matrix in which physicians place patients into “now,” “next,” “delayed,” or “never” categories based on clinical indicators. The priority 1 “now” patients, for example, will be those with suspected CRC based on physical examination, imaging results, and/or an abnormal fecal immunochemical test result.
He suggested, furthermore, that more widespread CRC screening can resume once “endoscopy units have been alleviated of priority 1, symptomatic patients.”
Dr. Massuti concurred with Dr. Martinez’s call to prioritize patients carefully. He suggested a green, yellow, and red classification system based on treatment priority recommendations from the European Society for Medical Oncology. The green group, for example, should receive priority for intervention based on a condition that is immediately clinically unstable or life threatening.
“The main goal is to preserve the continuum of care,” he added.
Another concern – although data are limited – is that treatment might also increase risk of mortality among cancer patients with COVID-19, according to a cohort study of nearly 1,000 such patients reported May 2020 in The Lancet. Dr. Massuti, who was not affiliated with the research, noted that 12% of the patients had GI tumors. In addition to increased risk associated with male sex (odds ratio, 1.63), cytotoxic cancer treatment in the prior 4 weeks increased risk (OR, 1.47), as did surgery in the same time frame (OR, 1.52).
“This means patients on treatment have an increased risk of mortality,” Dr. Massuti said.
Moving forward
Implementing telehealth information and communication technologies will continue to grow in importance, Dr. Massuti said. Dr. Aslam noted that video consultation with patients before surgery is already replacing face-to-face interaction, and most follow-up care at his hospital is now done by telephone.
Postoperative care is just as essential in the COVID-19 era, if not more so. “We need to be very vigilant to manage postoperative complications – any symptoms of pyrexia or sepsis, or any sign of COVID,” Dr. Aslam said, including postoperative fever. “If there is any doubt, do a chest CT scan.”
Dr. Aslam predicted the time to perform endoscopy or surgery for each patient will be longer, “so the number of patients done in 1 day will be less than 4 months ago.” In addition, elective surgery patients at his institution undergo COVID-19 testing twice, 3 days apart, prior to intervention.
“This disease will continue in the community for a while, so we have to continue what we’ve done well, like social distancing,” Dr. Aslam said. “We’ve gone through a storm and we are awaiting a tsunami. That tsunami of patients will overwhelm us in the coming months.”
Dr. Martinez, Dr. Massuti, and Dr. Aslam had no relevant disclosures.
Mortality differs by LVEF between women and men
, Simon Stewart, PhD, reported at the European Society of Cardiology Heart Failure Discoveries virtual meeting.
This analysis from the ongoing National Echocardiography Database of Australia (NEDA) included 499,153 men and women who underwent echocardiography in routine clinical practice for a variety of indications, with more than 3 million person-years of follow-up.
This study broke new ground. There is surprisingly little information from routine clinical practice to describe the spectrum and prognostic importance of left ventricular ejection fraction (LVEF). Indeed, most data have come from clinical trials in patients with heart failure with reduced ejection fraction (HFrEF), in which women are traditionally underrepresented. By comparison, the NEDA analysis included 237,046 women in routine care, noted Dr. Stewart, a National Health and Medical Research Council of Australia Senior Principal Research Fellow at Torrens University in Adelaide.
Among the novel findings in the new NEDA analysis: an LVEF below 50% was more than twice as common in men than women, occurring in 17.6% and 8.3%, respectively. Also, women had a higher average LVEF: 64.2%, compared with 59.5% in men. The overall 1- and 5-year all-cause mortality rates in the half-million participants were 5.8% and 18.4%.
Cardiovascular-related mortality occurred in 7.1% of women in median of 5.6 years of follow-up and in 8.1% of men with 5.5 years of follow-up.
All-cause and cardiovascular mortality rates followed a J-shaped curve, with the clear nadir occurring at an LVEF of 65%-69.9% in both women and men. But for LVEF values outside the nadir, a striking sex-based difference was present. Cardiovascular mortality, when adjusted for body mass index, age, heart rate, valvular heart disease, E-wave velocity, and other potential confounders, wasn’t significantly different between men whose LVEF was 65%-69.9% and those with an LVEF of 45%-64.9%. It started climbing in earnest only at an LVEF below 45%. In contrast, women with an LVEF of 45%-54.9% had a statistically significant twofold increased cardiovascular mortality rate compared to those in the nadir. Moreover, women with an LVEF of 55%-59.9% showed a trend in the same unwanted direction.
High LVEF, higher mortality in women
Dr. Stewart drew attention to an inflection point in the mortality curve for women whereby mortality began climbing at LVEF values of 70% or more. Values in that high range were documented in 72,379 women and 51,317 men.
He noted that the NEDA finding of an increasing mortality risk at LVEFs of at least 70%, especially in women, is similar to a recent report from another big data study, this one involving more than 200,000 patients who underwent echocardiography in routine clinical practice in the Geisinger health system in Pennsylvania. The investigators found in this retrospective study that during a median of 4 years of follow-up after echocardiography, the adjusted risk for all-cause mortality followed a U-shaped curve. The nadir of risk occurred in patients with an LVEF of 60%-65%, with a 1.71-fold increased risk at an LVEF at 70% or more and a near-identical 1.73-fold increased risk at an LVEF of 35%-40%. In this study, however, which was less than half the size of the NEDA analysis, the U-shaped LVEF/mortality curve applied to both men and women. Similar findings were seen in a validation cohort of nearly 36,000 patients from New Zealand (Eur Heart J. 2020 Mar 21;41[12]:1249-57).
The investigators predicted that in addition to the existing categories of HFrEF, heart failure with preserved ejection fraction (HFpEF), and the more recently proposed heart failure with midrange ejection fraction (HFmrEF), their results “may herald the recognition of a new phenotype characterized by supranormal LVEF,” with a moniker of HFsnEF.
New treatment opportunity for women?
Discussant Lars Lund, MD, PhD, professor of cardiology at the Karolinska Institute, Stockholm, said that it’s not possible to make any statements about what constitutes a “normal” LVEF in men or women based on the NEDA study, since all participants underwent medically indicated echocardiography. He added that what he found most interesting about the NEDA analysis was the observation that women with mid-range or mildly reduced LVEF had increased mortality, while men didn’t. That’s a finding that helps explain the suggestion of possible benefit for sacubitril-valsartan in patients with lower ejection fraction and in women in the PARAGON-HF trial of angiotensin-neprilysin inhibition in patients with heart failure with preserved ejection fraction (N Engl J Med. 2019 Oct 24;381[17]:1609-20).
Dr. Lund expressed the hope that the NEDA investigators will do an analysis of the relationship between echocardiographic left atrial size and mortality. Dr. Stewart replied that, as a matter of fact,such a study is planned. The enormous and continuously growing NEDA database has already been used to provide new insights into aortic stenosis and pulmonary hypertension, he noted.
Session moderator Andrew Coats, MD, incoming president of the ESC Heart Failure Association, said that there are many different methods used for echocardiographic measurement of LVEF. He wondered about the validity of pooling them in a single analysis.
Dr. Stewart replied that NEDA software applies a hierarchical weighting of the various methods used to quantify LVEF. And the submitted data come from the top echocardiography laboratories throughout Australia.
“We’ve done some sensitivity analyses around the different methods of quantifying LVEF and we get the same patterns,” he said. “We’re comfortable with the validity of what we’ve done. The big data allows us to do that.”
Dr. Stewart reported receiving speakers fees and travel support from Novartis, a partial funder of NEDA.
SOURCE: Stewart S. ESC Heart Failure 2020.
FROM ESC HEART FAILURE 2020
Disparate study results on elective labor costs fuel debate
Cost concerns have circulated regarding elective induction of labor, a method that’s become increasingly popular in the United States. Two studies in Obstetrics & Gynecology, however, offer no consensus on the cost burden of this method.
A retrospective analysis of a large cohort in California reported higher costs for induction, compared with spontaneous labor, after accounting for variables such as parity, mode of delivery, and gestational age. A prospective study of five Utah hospitals found no significant cost differences between induction and expectant management.
The ARRIVE trial (A Randomized Trial of Induction versus Expectant Management), a multicenter study that compared elective labor induction at 39 weeks of gestation with spontaneous labor in low-risk nulliparous women, suggests that induction may have some benefits. While its researchers found no differences in perinatal outcomes, induction cases had fewer cesareans, fewer hypertensive disorders, and fewer newborns requiring respiratory support.
One key question that remains following ARRIVE is whether this practice should be implemented universally, Alyssa R. Hersh, MD, MPH, lead author of the California study, said in an interview. Quantifying the costs associated with elective labor is important because “health care in the United States is already much more expensive than in other countries, and [elective labor] could have a dramatic impact on annual health care costs.”
In a retrospective analysis, Dr. Hersh, of the Oregon Health & Science University, Portland, and her colleagues examined data from more than 1.2 million women in California with singleton, nonanomalous births. They excluded for multiple factors such as medically indicated induction of labor, placenta previa, breech presentation, or planned cesarean delivery.
Estimating cost differences between elective induction and spontaneous labor for mothers and neonates, they stratified results by vaginal or cesarean delivery, parity, gestational age at delivery, and geographic location. Elective induced labor represented 15% of the overall cohort of 1.2 million women.
Among vaginal deliveries, median maternal hospitalization costs were $10,175 in the induction group and $9,462 in the spontaneous labor group. For cesarean deliveries, the median costs were $20,294 with induction of labor and $18,812 with spontaneous labor.
Costs of maternal hospitalization with elective induction of labor were significantly higher than that of spontaneous labor, regardless of parity, mode of delivery, and gestational age at delivery, the authors reported. Comparing costs at rural and urban areas, the induction group saw higher maternal hospitalization costs and longer lengths of stay regardless of scenario.
Neonatal care was the one metric that incurred lower costs and lengths of stay in the induction group. Fewer adverse outcomes in this group could explain this outlier. “However, because this is observational data, we cannot elucidate what exactly contributed to these decreased costs,” Dr. Hersh and colleagues noted.
Timeliness was another limitation. “It is important to note that our study was conducted between 2007 and 2011, and the patients undergoing elective induction of labor during those years may differ from women undergoing elective induction of labor currently,” the authors acknowledged.
Another study by Brett D. Einerson, MD, MPH, of the University of Utah Health, Salt Lake City, and associates evaluated the actual hospital costs of patients undergoing elective induction and expectant management in a subset of patients from the ARRIVE trial.
“If, medically speaking, induction is equal to expectant management or has some benefit, as the larger ARRIVE trial suggests, we wanted to know: At what cost?” Dr. Einerson said in an interview.
Study participants hailed from five Utah hospitals within two health systems: the University of Utah Health and Intermountain Healthcare. Taking available data for 1,231 enrollees, investigators randomized 608 to labor induction and 623 to spontaneous labor. They measured actual hospital costs using advanced value-based analytics platforms at the Utah hospitals, comparing cost means and reporting the relative difference between induction and expectant management.
Overall, they found no significant differences between the mean total cost of elective induction and expectant management (adjusted mean difference, +4.7%). This was the case for other metrics: Costs did not vary among the five health systems or in most phases of care, including maternal inpatient postpartum care, maternal outpatient care after discharge, neonatal hospital care, and neonatal care after discharge.
The induction group did incur higher maternal inpatient intrapartum and delivery care costs (17%). However, these were offset by savings achieved during outpatient antenatal care (–47%). The assumption was additional costs of time spent on the labor ward might overwhelm cost savings elsewhere (reduced cesarean deliveries, fewer prenatal appointments and tests). “But this was not the case,” Dr. Einerson said.
Ultimately, the study was not large enough to find smaller differences in cost, he noted. It was only large enough to say that cost didn’t differentiate between arms with a margin of +/–7%. “A cost increase (or cost savings) with induction of 7% is meaningful over time and on a national scale,” Dr. Einerson explained.
Taken together, the two studies show that cost is not an insurmountable barrier to elective induced labor, Jeffrey L. Ecker, MD, and Mark A. Clapp, MD, MPH, wrote in an accompanying editorial (Obstet Gynecol. 2020;136[1]:6-7).
“This will be especially true if we are innovative and creatively adapt our facilities and spaces, thinking about where and how some of the required care can be appropriately and more economically offered,” they noted.
“Specifically, strategies to safely reduce labor and delivery time for inductions of labor, including considering and studying outpatient cervical ripening, may make elective induction of labor at 39 weeks of gestation even less costly and even more feasible to offer to all women,” suggested Dr. Ecker and Dr. Clapp, both at Massachusetts General Hospital and Harvard Medical School, both in Boston.
Dr. Hersh and coauthors had no relevant financial disclosures, and there was no external funding for their study. Dr. Einerson and most coauthors reported no relevant financial disclosures; one coauthor reported receiving funds from GestVision as a consultant, and another coauthor reported funds paid to her or her institution from some pharmaceutical companies when she was primary investigator on various trials or a consultant. This study was supported by grants from the Eunice Kennedy Shriver National Institute of Child Health and Human Development. Neither Dr. Ecker nor Dr Clapp had any relevant financial disclosures or received any funding.
SOURCES: Hersh AR et al. Obstet Gynecol. 2020. doi: 10.1097/AOG.0000000000003865; Einerson BD et al. Obstet Gynecol. 2020. doi: 10.1097/AOG.0000000000003930.

Liposomal bupivacaine excreted in breast milk, but levels appear safe
based on a prospective cohort study.

Over the course of 4 days, relative neonatal dosages of bupivacaine were less than 1%, remaining below the 10% threshold of concern, reported Hiba J. Mustafa, MD, of the University of Minnesota, Minneapolis, and colleagues.
Liposomal bupivacaine can achieve up to 4 days of postcesarean pain control, which is significantly longer than the 8 hours provided by standard bupivacaine, the investigators wrote in Obstetrics & Gynecology. But usage of the liposomal formulation has not been widespread, they noted, partly because of a lack of clinical studies evaluating breast milk transfer and neonatal safety.
To address this knowledge gap, Dr. Mustafa and colleagues enrolled 30 healthy pregnant women scheduled to undergo cesarean birth at full term. All patients were aged 18-40 years, with an American Society of Anesthesiologists physical status of I or II. Exclusion criteria included a number of maternal and neonatal health concerns, such as sensitivity to local anesthetics, metabolic disorders, fetal anomaly, fetal growth restriction, and others.
The day of surgery, before the procedure, maternal blood samples were collected and used for baseline measurements.
Each woman received a spinal anesthetic including 150 mcg of morphine, 15 mcg of intrathecal fentanyl, and 1.4-1.6 mL of 0.75% hyperbaric bupivacaine hydrochloride. Within 30 minutes after birth, a bilateral transversus abdominus plane block was performed using 266 mg of 1.3% liposomal bupivacaine and 52 mg of 0.25% bupivacaine hydrochloride.
Using the block as time point zero, maternal blood and breast milk samples were collected at hour 2, 6, 12, 24, 48, 72, and 96. Sparse sampling was employed, such that participants were randomly assigned in a 1:1 ratio to provide paired blood and milk samples at hour 2, 12, and 48; or hour 6, 24, 72, and 96. Bupivacaine was quantified in samples by liquid chromatography–tandem mass spectrometry.
Using these data, the investigators determined bupivacaine concentrations in plasma and milk, milk/plasma area under the curve (AUC) ratios, neonatal dosage, and relative neonatal dosage. In addition, adverse events in both mothers and neonates were recorded for 2 weeks post partum.
Mean bupivacaine concentrations peaked in breast milk at 6 hours, at 58 ng/mL. This peak was followed by a steady reduction to an “almost undetectable” level of 5.2 ng/mL at 96 hours. Maternal plasma levels peaked first at hour 6 (155.9 ng/mL), then again at hour 48 (225.8 ng/mL), followed by a steady decline until hour 96, when the level reached 80.6 ng/mL.
Relative mean concentrations of milk to plasma were 44%, 36%, 28%, and 18% at hour 2, 6, 12, and 24, respectively. AUC ratios were used to represent exposure across various time intervals. For instance, the AUC ratio for milk/plasma from hour 0 to hour 2 was 0.45. The AUC findings declined steadily until the final ratio, which spanned hour 0 to hour 96, at 0.15.
These AUC ratios allowed for calculation of neonatal dosage and relative neonatal dosage using an average daily milk intake of 150 mL/kg per day. For the longest range, spanning from hour 0 to hour 96, the neonatal dosage was 15,155.4 ng/kg, which translated to a relative neonatal dosage of 0.396%.
No mothers or neonates experienced adverse events.
“Bupivacaine was transferred into mother’s milk such that an exclusively breastfeeding neonate would ingest less than 1% (relative neonatal dosage) of the maternal dose,” the investigators wrote, noting that this falls safely below the acceptable threshold of 10%.
“Because bupivacaine is metabolized primarily in the liver, a neonate’s absorption will likely be even lower [than modeled] given the first-pass effect,” they added.
Based on these findings, Dr. Mustafa and colleagues concluded that “the level of bupivacaine ingested by the sucking neonate is acceptable and compatible with breastfeeding.”
Michael G. Ross MD, MPH, Distinguished Professor of Obstetrics and Gynecology and Public Health at Geffen School of Medicine at the University of California, Los Angeles, commented that, this study adds to the literature of drug excretion into breast milk. “For the vast majority of drugs with passive transfer from maternal plasma to breast milk, the effective dosages of exclusive breastfeeding neonates are approximately 5% of the maternal (oral) dose. In the present study, the authors demonstrated a relative neonatal dosage of less than 1%. This low value results from consequences of minimal maternal plasma absorption (in the present case from transversus abdominis injection), maternal volume of distribution, transfer into breast milk, and the volume of milk ingestion. These results should provide reassurance for the safety of breastfeeding term infants under the conditions of the study.
“There are a number of study concerns, including the inability to differentiate absorption of the spinal bupivacaine from the liposomal bupivacaine, the lack of paired maternal plasma and breast milk sample, and the lack of detail as to how much milk was expressed for each sample. Importantly, breast milk composition varies from foremilk to hindmilk. Thus, a single sample may not accurately reflect the composition ingested by the infant. The suggestion of two peaks in maternal plasma concentration was not demonstrated statistically and may be an artifact of the timing of spinal and liposomal injections, or the fact that different patients were studied at each time period.
“Most importantly, despite the demonstrated safety, the authors acknowledge conflicting results of clinical benefits of liposomal bupivacaine injection. As such, I recommend that postcesarean transversus abdominis blocks be performed only under institutional review board-approved study protocols,” said Dr. Ross, codirector of the Institute for Women’ and Children’s Health at the Lundquist Institute, Torrance, Calif.*
The study was funded by the Thrasher Research Fund. The investigators reported no conflicts of interest. Dr. Ross had no relevant financial disclosures.
SOURCE: Mustafa et al. Obstet Gynecol. 2020 Jun 6. doi: 10.1097/AOG.0000000000003886.
*This article was updated 6/16/2020.
based on a prospective cohort study.
Over the course of 4 days, relative neonatal dosages of bupivacaine were less than 1%, remaining below the 10% threshold of concern, reported Hiba J. Mustafa, MD, of the University of Minnesota, Minneapolis, and colleagues.
Liposomal bupivacaine can achieve up to 4 days of postcesarean pain control, which is significantly longer than the 8 hours provided by standard bupivacaine, the investigators wrote in Obstetrics & Gynecology. But usage of the liposomal formulation has not been widespread, they noted, partly because of a lack of clinical studies evaluating breast milk transfer and neonatal safety.
To address this knowledge gap, Dr. Mustafa and colleagues enrolled 30 healthy pregnant women scheduled to undergo cesarean birth at full term. All patients were aged 18-40 years, with an American Society of Anesthesiologists physical status of I or II. Exclusion criteria included a number of maternal and neonatal health concerns, such as sensitivity to local anesthetics, metabolic disorders, fetal anomaly, fetal growth restriction, and others.
The day of surgery, before the procedure, maternal blood samples were collected and used for baseline measurements.
Each woman received a spinal anesthetic including 150 mcg of morphine, 15 mcg of intrathecal fentanyl, and 1.4-1.6 mL of 0.75% hyperbaric bupivacaine hydrochloride. Within 30 minutes after birth, a bilateral transversus abdominus plane block was performed using 266 mg of 1.3% liposomal bupivacaine and 52 mg of 0.25% bupivacaine hydrochloride.
Using the block as time point zero, maternal blood and breast milk samples were collected at hour 2, 6, 12, 24, 48, 72, and 96. Sparse sampling was employed, such that participants were randomly assigned in a 1:1 ratio to provide paired blood and milk samples at hour 2, 12, and 48; or hour 6, 24, 72, and 96. Bupivacaine was quantified in samples by liquid chromatography–tandem mass spectrometry.
Using these data, the investigators determined bupivacaine concentrations in plasma and milk, milk/plasma area under the curve (AUC) ratios, neonatal dosage, and relative neonatal dosage. In addition, adverse events in both mothers and neonates were recorded for 2 weeks post partum.
Mean bupivacaine concentrations peaked in breast milk at 6 hours, at 58 ng/mL. This peak was followed by a steady reduction to an “almost undetectable” level of 5.2 ng/mL at 96 hours. Maternal plasma levels peaked first at hour 6 (155.9 ng/mL), then again at hour 48 (225.8 ng/mL), followed by a steady decline until hour 96, when the level reached 80.6 ng/mL.
Relative mean concentrations of milk to plasma were 44%, 36%, 28%, and 18% at hour 2, 6, 12, and 24, respectively. AUC ratios were used to represent exposure across various time intervals. For instance, the AUC ratio for milk/plasma from hour 0 to hour 2 was 0.45. The AUC findings declined steadily until the final ratio, which spanned hour 0 to hour 96, at 0.15.
These AUC ratios allowed for calculation of neonatal dosage and relative neonatal dosage using an average daily milk intake of 150 mL/kg per day. For the longest range, spanning from hour 0 to hour 96, the neonatal dosage was 15,155.4 ng/kg, which translated to a relative neonatal dosage of 0.396%.
No mothers or neonates experienced adverse events.
“Bupivacaine was transferred into mother’s milk such that an exclusively breastfeeding neonate would ingest less than 1% (relative neonatal dosage) of the maternal dose,” the investigators wrote, noting that this falls safely below the acceptable threshold of 10%.
“Because bupivacaine is metabolized primarily in the liver, a neonate’s absorption will likely be even lower [than modeled] given the first-pass effect,” they added.
Based on these findings, Dr. Mustafa and colleagues concluded that “the level of bupivacaine ingested by the sucking neonate is acceptable and compatible with breastfeeding.”
Michael G. Ross MD, MPH, Distinguished Professor of Obstetrics and Gynecology and Public Health at Geffen School of Medicine at the University of California, Los Angeles, commented that, this study adds to the literature of drug excretion into breast milk. “For the vast majority of drugs with passive transfer from maternal plasma to breast milk, the effective dosages of exclusive breastfeeding neonates are approximately 5% of the maternal (oral) dose. In the present study, the authors demonstrated a relative neonatal dosage of less than 1%. This low value results from consequences of minimal maternal plasma absorption (in the present case from transversus abdominis injection), maternal volume of distribution, transfer into breast milk, and the volume of milk ingestion. These results should provide reassurance for the safety of breastfeeding term infants under the conditions of the study.
“There are a number of study concerns, including the inability to differentiate absorption of the spinal bupivacaine from the liposomal bupivacaine, the lack of paired maternal plasma and breast milk sample, and the lack of detail as to how much milk was expressed for each sample. Importantly, breast milk composition varies from foremilk to hindmilk. Thus, a single sample may not accurately reflect the composition ingested by the infant. The suggestion of two peaks in maternal plasma concentration was not demonstrated statistically and may be an artifact of the timing of spinal and liposomal injections, or the fact that different patients were studied at each time period.
“Most importantly, despite the demonstrated safety, the authors acknowledge conflicting results of clinical benefits of liposomal bupivacaine injection. As such, I recommend that postcesarean transversus abdominis blocks be performed only under institutional review board-approved study protocols,” said Dr. Ross, codirector of the Institute for Women’ and Children’s Health at the Lundquist Institute, Torrance, Calif.*
The study was funded by the Thrasher Research Fund. The investigators reported no conflicts of interest. Dr. Ross had no relevant financial disclosures.
SOURCE: Mustafa et al. Obstet Gynecol. 2020 Jun 6. doi: 10.1097/AOG.0000000000003886.
*This article was updated 6/16/2020.
FROM OBSTETRICS & GYNECOLOGY

So you want to be an expert witness?
Acting as an expert witness in a legal matter can be a nice way to compliment your practice. However, it is important to understand the role of experts, as well as their duties and obligations. Expert witnesses are called to testify on the basis of their specialized knowledge, not necessarily their direct knowledge of events and issues in the case.

Medical experts often play an important role in the evaluation, development, and preparation of a case long before it ever goes to trial. In some states, to even file a medical malpractice complaint a plaintiff is required to have the case evaluated by an expert and obtain a written report outlining why the plaintiff has a reasonable and meritorious cause for filing such an action.
There are different types of expert witness testimony. Experts can give opinion testimony as a physician who provided treatment to the plaintiff and whose conduct is not at issue. The second type of expert witness is a retained or controlled expert witness. This is a person giving opinion testimony after being retained by a lawyer on behalf of one of the parties to the lawsuit.
Before you give deposition or trial testimony, your opinions must be disclosed in writing and provided to the other parties in the case. In federal court, this is governed by Federal Rule of Civil Procedure 26. If the case is pending in state court, your written opinions are governed by local court rules. In both cases, the written opinions should be thorough and complete because you will not be allowed to testify to new opinions at the time of trial but will generally be allowed to expand upon those disclosed in writing at your deposition trial.
In order for a jury to hear your opinions at trial, your opinions must be reliable. In federal court, expert testimony is governed by Federal Rule of Evidence 702, which states:
A witness who is qualified as an expert by knowledge, skill, experience, training, or education may testify in the form of an opinion or otherwise if:
a) the expert’s scientific, technical, or other specialized knowledge will help the trier of fact to understand the evidence or to determine a fact in issue;
b) the testimony is based on sufficient facts or data;
c) the testimony is the product of reliable principles and methods; and
d) the expert has reliably applied the principles and methods to the facts of the case.
This means, that if a fact or evidence at issue involves scientific, technical, or specialized knowledge that is outside the scope of an ordinary layman’s experience, or involves complex issues challenging a layman’s comprehension, expert testimony is required. The scientific evidence must not just be relevant but also reliable. Expert opinions will be scrutinized to see if they are based on scientific testing or review of scientific data rather than just assumptions or speculation. Additionally, the experts must be qualified by their knowledge, skill, experience, training, or education. Given these parameters, it should come as no surprise that expert trial testimony is required for all medical malpractice cases.
Some states follow the “new or novel rule” which dictates that expert testimony is only admissible if the methodology or scientific principal on which the opinion is based is sufficiently established to have gained general acceptance in the particular field in which it belongs. This means that the evidence must be generally accepted as reliable in the relevant scientific community. New or novel techniques will be placed under the scrutiny of this standard. Courts will look at papers, books, journals, and case law to make a determination as to the reliability and general acceptance. Failure to meet the requisite standards may render a physician ineligible to testify.
If you are considering acting as an expert witness there are a few basic dos and don’ts to keep in mind:
Do be mindful of your criticism. If testifying in a medical malpractice case, you will be giving sworn testimony as to whether another physician deviated from the standard of care. Be aware that your testimony can later be used against you if your conduct is ever at issue, or if you contradict yourself in another case. Attorneys often look for prior testimony to use when questioning you at deposition and trial.
Do be aware of any applicable professional society guidelines. Many professional societies publish ethical guidelines as it relates to expert medical testimony. Be aware of those and know that you may be asked about them, especially if you are a member of that society.
Do be prepared for basic areas of cross-examination. There are a few tried and true areas that will always be the subject of cross-examination. Any perceived bias you may have, your fees, and whether you do more work for plaintiffs versus defendants are a just few examples. You should also be prepared to be cross-examined on the differences between personal practice (what you do) and an actual deviation from the standard of care.
Do keep written communication to a minimum. All communication between the expert physician and the attorney is potentially discoverable by the other side. The rules differ for state and federal courts. Emails, draft reports, and written questions all cause the creation of unnecessary side issues and areas of cross-examination. The best practice is for all substantive communication to be done by phone.
Do be clear in what you are charging. It is not unusual for an expert to charge one hourly rate for record review, and a different rate for testimony. Your fee schedule should also note that any travel expenses you incur will also be invoiced. Your hourly rate should be appropriate for your area of practice. In our experience, gastroenterologists typically charge $400.00-$600.00 an hour for record review, and $550.00-$700.00 an hour for testimony.
Do not submit an invoice until after your deposition. Submitting invoices before your deposition creates unnecessary cross-examination issues. At the time of retention, speak to the attorney and ask if you will be able to submit invoices as you work. Most attorneys prefer invoices be submitted after your deposition. Because the wheels of justice often turn slowly, you could be waiting an equally long time to submit an invoice and get paid. One way to avoid this dilemma is to require a retainer at the time of retention.
Do not sign up with an expert finder service. Resist the urge to sign up with an expert finder service. The best medical experts come from referrals from other attorneys or physicians. Expert retention via an expert finder service creates the impression that you are a “hired gun” in the business of being a professional expert and can diminish your credibility. The finder services also charge a commission or fee.
As a gastroenterologist, you have the specialized knowledge to provide expert testimony regarding the cause of an injury and extent of damages in cases where you have treated a patient. You also have the type of education and training necessary to serve as an independent expert. Doing so is a serious task that can be time consuming and stressful. However, it can also be rewarding and allow you to make sure a fair and just outcome occurs.
This article is for general informational purposes only. Please consult your own attorney if you have questions. This information is not intended to create an attorney-client relationship.
Mr. Mills is an equity partner at Cunningham, Meyer & Vedrine PC in Chicago. Ms. Lindbert is a partner at Cunningham, Meyer & Vedrine PC. Both focus their practices on defending doctors and hospitals in medical malpractice actions.
Acting as an expert witness in a legal matter can be a nice way to compliment your practice. However, it is important to understand the role of experts, as well as their duties and obligations. Expert witnesses are called to testify on the basis of their specialized knowledge, not necessarily their direct knowledge of events and issues in the case.
Medical experts often play an important role in the evaluation, development, and preparation of a case long before it ever goes to trial. In some states, to even file a medical malpractice complaint a plaintiff is required to have the case evaluated by an expert and obtain a written report outlining why the plaintiff has a reasonable and meritorious cause for filing such an action.
There are different types of expert witness testimony. Experts can give opinion testimony as a physician who provided treatment to the plaintiff and whose conduct is not at issue. The second type of expert witness is a retained or controlled expert witness. This is a person giving opinion testimony after being retained by a lawyer on behalf of one of the parties to the lawsuit.
Before you give deposition or trial testimony, your opinions must be disclosed in writing and provided to the other parties in the case. In federal court, this is governed by Federal Rule of Civil Procedure 26. If the case is pending in state court, your written opinions are governed by local court rules. In both cases, the written opinions should be thorough and complete because you will not be allowed to testify to new opinions at the time of trial but will generally be allowed to expand upon those disclosed in writing at your deposition trial.
In order for a jury to hear your opinions at trial, your opinions must be reliable. In federal court, expert testimony is governed by Federal Rule of Evidence 702, which states:
A witness who is qualified as an expert by knowledge, skill, experience, training, or education may testify in the form of an opinion or otherwise if:
a) the expert’s scientific, technical, or other specialized knowledge will help the trier of fact to understand the evidence or to determine a fact in issue;
b) the testimony is based on sufficient facts or data;
c) the testimony is the product of reliable principles and methods; and
d) the expert has reliably applied the principles and methods to the facts of the case.
This means, that if a fact or evidence at issue involves scientific, technical, or specialized knowledge that is outside the scope of an ordinary layman’s experience, or involves complex issues challenging a layman’s comprehension, expert testimony is required. The scientific evidence must not just be relevant but also reliable. Expert opinions will be scrutinized to see if they are based on scientific testing or review of scientific data rather than just assumptions or speculation. Additionally, the experts must be qualified by their knowledge, skill, experience, training, or education. Given these parameters, it should come as no surprise that expert trial testimony is required for all medical malpractice cases.
Some states follow the “new or novel rule” which dictates that expert testimony is only admissible if the methodology or scientific principal on which the opinion is based is sufficiently established to have gained general acceptance in the particular field in which it belongs. This means that the evidence must be generally accepted as reliable in the relevant scientific community. New or novel techniques will be placed under the scrutiny of this standard. Courts will look at papers, books, journals, and case law to make a determination as to the reliability and general acceptance. Failure to meet the requisite standards may render a physician ineligible to testify.
If you are considering acting as an expert witness there are a few basic dos and don’ts to keep in mind:
Do be mindful of your criticism. If testifying in a medical malpractice case, you will be giving sworn testimony as to whether another physician deviated from the standard of care. Be aware that your testimony can later be used against you if your conduct is ever at issue, or if you contradict yourself in another case. Attorneys often look for prior testimony to use when questioning you at deposition and trial.
Do be aware of any applicable professional society guidelines. Many professional societies publish ethical guidelines as it relates to expert medical testimony. Be aware of those and know that you may be asked about them, especially if you are a member of that society.
Do be prepared for basic areas of cross-examination. There are a few tried and true areas that will always be the subject of cross-examination. Any perceived bias you may have, your fees, and whether you do more work for plaintiffs versus defendants are a just few examples. You should also be prepared to be cross-examined on the differences between personal practice (what you do) and an actual deviation from the standard of care.
Do keep written communication to a minimum. All communication between the expert physician and the attorney is potentially discoverable by the other side. The rules differ for state and federal courts. Emails, draft reports, and written questions all cause the creation of unnecessary side issues and areas of cross-examination. The best practice is for all substantive communication to be done by phone.
Do be clear in what you are charging. It is not unusual for an expert to charge one hourly rate for record review, and a different rate for testimony. Your fee schedule should also note that any travel expenses you incur will also be invoiced. Your hourly rate should be appropriate for your area of practice. In our experience, gastroenterologists typically charge $400.00-$600.00 an hour for record review, and $550.00-$700.00 an hour for testimony.
Do not submit an invoice until after your deposition. Submitting invoices before your deposition creates unnecessary cross-examination issues. At the time of retention, speak to the attorney and ask if you will be able to submit invoices as you work. Most attorneys prefer invoices be submitted after your deposition. Because the wheels of justice often turn slowly, you could be waiting an equally long time to submit an invoice and get paid. One way to avoid this dilemma is to require a retainer at the time of retention.
Do not sign up with an expert finder service. Resist the urge to sign up with an expert finder service. The best medical experts come from referrals from other attorneys or physicians. Expert retention via an expert finder service creates the impression that you are a “hired gun” in the business of being a professional expert and can diminish your credibility. The finder services also charge a commission or fee.
As a gastroenterologist, you have the specialized knowledge to provide expert testimony regarding the cause of an injury and extent of damages in cases where you have treated a patient. You also have the type of education and training necessary to serve as an independent expert. Doing so is a serious task that can be time consuming and stressful. However, it can also be rewarding and allow you to make sure a fair and just outcome occurs.
This article is for general informational purposes only. Please consult your own attorney if you have questions. This information is not intended to create an attorney-client relationship.
Mr. Mills is an equity partner at Cunningham, Meyer & Vedrine PC in Chicago. Ms. Lindbert is a partner at Cunningham, Meyer & Vedrine PC. Both focus their practices on defending doctors and hospitals in medical malpractice actions.
Daily Recap: Feds seek COVID-19 info through app, hospitalists take on new roles
Here are the stories our MDedge editors across specialties think you need to know about today:
FDA seeks COVID-19 info through CURE ID
Federal health officials are asking clinicians to use the free CURE ID mobile app and web platform as a tool to collect information on the treatment of patients with COVID-19. CURE ID is an Internet-based data repository first developed in 2013 as a collaboration between the Food and Drug Administration and the National Center for Advancing Translational Sciences, part of the National Institutes of Health. It provides licensed clinicians worldwide with an opportunity to report novel uses of existing drugs for patients with difficult-to-treat infectious diseases, including COVID-19, through a website, a smartphone, or other mobile device. “By utilizing the CURE ID platform now for COVID-19 case collection – in conjunction with data gathered from other registries, EHR systems, and clinical trials – data collected during an outbreak can be improved and coordinated,” said Heather A. Stone, MPH, a health science policy analyst in the office of medical policy at the FDA’s Center for Drug Evaluation and Research. “This may allow us to find possible treatments to help ease this pandemic, and prepare us better to fight the next one.” Read more.
Hospitalists take on new roles in COVID era
Whether it’s working shifts in the ICU, caring for ventilator patients, or reporting to postanesthesia care units and post-acute or step-down units, hospitalists are stepping into a variety of new roles as part of their frontline response to the COVID-19 pandemic. Valerie Vaughn, MD, a hospitalist with Michigan Medicine and assistant professor of medicine at the University of Michigan in Ann Arbor, was doing research on how to reduce overuse of antibiotics in hospitals when the COVID-19 crisis hit and dramatically redefined her job. “We were afraid that we might have 3,000 to 5,000 hospitalized COVID patients by now, based on predictive modeling done while the pandemic was still growing exponentially,” she explained. Although Michigan continues to have high COVID-19 infection rates, centered on nearby Detroit, “things are a lot better today than they were 4 weeks ago.” Dr. Vaughn helped to mobilize a team of 25 hospitalists, along with other health care professionals, who volunteered to manage COVID-19 patients in the ICU and other hospital units. Read more.
COVID-19 recommendations for rheumatic disease treatment
The European League Against Rheumatism (EULAR) issued provisional recommendations for the management of rheumatic and musculoskeletal diseases in the context of SARS-CoV-2. Contrary to earlier expectations, there is no indication that patients with rheumatic and musculoskeletal diseases have a higher risk of contracting the virus or have a worse course if they do, according to the task force that worked on the recommendations. The task force also pointed out that rheumatology drugs are being used to treat COVID-19 patients who don’t have rheumatic diseases, raising the possibility of a shortage of disease-modifying antirheumatic drugs. Read more.
Mental health visits are 19% of ED costs
Mental and substance use disorders represented 19% of all emergency department visits in 2017 and cost $14.6 billion, according to figures from the Agency for Healthcare Research and Quality. The most costly mental and substance use disorder diagnosis was anxiety and fear-related disorders, accounting for $5.6 billion worth of visits, following by depressive disorders and alcohol-related disorders. Read more.
Food deserts linked to health issues in pregnancy
Living in a neighborhood lacking adequate access to affordable, high-quality food is associated with a somewhat greater risk of developing pregnancy morbidity, according to an observational study. Researchers found that women who lived in a food desert had a 1.6 times greater odds of pregnancy comorbidity than if they did not. “An additional, albeit less obvious factor that may be unique to patients suffering disproportionately from obstetric morbidity is exposure to toxic elements,” the researchers reported in Obstetrics & Gynecology. “It has been shown in a previous study that low-income, predominantly black communities of pregnant women may suffer disproportionately from lead or arsenic exposure.” Read more.
For more on COVID-19, visit our Resource Center. All of our latest news is available on MDedge.com.
Infectious Diseases Board Review: Menopause in Women Living With HIV
More than half of the 37.9 million persons living with HIV (PLWH) worldwide are women.1 Between 2010 and 2016, 58% of women living with HIV (WLWH) in the United States were older than 45 years.2 As such, an increasing number of WLWH are entering menopause and living well beyond menopause. Despite this, health care providers expressed a lack of confidence in managing menopause in WLWH, and menopausal symptoms often are not recognized by providers.3 Enhancing our knowledge about menopause in WLWH is important, since the physiologic changes associated with menopause impact short- and long-term quality of life and mortality.
Test your knowledge of this topic HERE.
Amenorrhea
Menstrual irregularities, including amenorrhea and anovulation, are more frequently found in women of low socioeconomic status, presumably due to associated physical and emotional stress.4 In addition, women with low body mass index (BMI) have decreased serum estradiol levels, which lead to amenorrhea.4,5 Furthermore, low parity and many legal and illegal drugs are associated with amenorrhea, including hormonal contraceptives, opiates, stimulants, antipsychotics, and chemotherapeutic agents.6-8
Test your knowledge of this topic HERE.
Age at Menopause
In the United States, the median age of menopause is between 50 and 52 years in middle-class white women.11,12 Earlier menopause has been observed in women who are African American, are nulliparous, have a lower BMI, smoke tobacco, and have more stress, less education, and higher unemployment rates.11,13,14 Because 57% of women diagnosed with HIV in 2018 were African American and many WLWH have other risk factors associated with earlier menopause, studies examining the age of menopause in WLWH need to use a comparator group of women without HIV with similar characteristics and control for these factors to determine the influence of HIV on the age of menopause.
Menopause-Associated Symptoms
The perimenopausal period, which begins, on average, 4 years prior to the final menstrual period, is characterized by hormonal fluctuations leading to irregular menstrual cycles.19,20 Symptoms associated with these physiologic changes during the perimenopausal period include vasomotor symptoms (hot flashes), genitourinary symptoms (vaginal dryness and dyspareunia), anxiety, depression, sleep disturbances, and joint aches.21,22 Such menopausal symptoms can be distressing and negatively impact quality of life.23 In WLWH, severe menopausal symptoms have been associated with suboptimal adherence to antiretroviral therapy (ART).24
Vasomotor
In the United States, the most common symptom during perimenopause is hot flashes, which occur in 38% to 80% of women.32,33 Vasomotor symptoms are most common in women who smoke, use illicit substances, have a high BMI, are of lower socioeconomic status, and are African American.11 As expected, prior studies focusing on hot flash prevalence among premenopausal, perimenopausal, and postmenopausal WLWH found that postmenopausal women experience more hot flashes than premenopausal or perimenopausal women.27,28 In addition, a comparison of women with and without HIV demonstrated a higher prevalence of hot flashes among WLWH.26,29 Vasomotor symptoms can be severely distressing, with hot flashes contributing to increased risk of depression.25,34 In a cross-sectional analysis of 835 WLWH and 335 women without HIV from the WIHS cohort, persistent vasomotor symptoms predicted elevated depressive symptoms in both WLWH and women without HIV.34 In a similar cross-sectional analysis of 536 women, among whom 54% were WLWH and 37% were perimenopausal, psychological symptoms were prevalent in 61% of the women with vasomotor symptoms.29
Genitourinary
Estrogen deficiency, which accompanies the perimenopausal period, leads to vulvovaginal atrophy (VVA), manifesting with symptoms of vaginal dryness, itching, burning, urinary urgency, and dyspareunia (painful intercourse).33,35,36 Unlike vasomotor symptoms, which diminish with time, genitourinary symptoms generally worsen if left untreated.37 Furthermore, these symptoms are often underreported and underdiagnosed.38,39 VVA was found in 43% to 84% of postmenopausal women.36,40,41 In the AGATA study, the prevalence of VVA was associated with years since menopause. 36 Vaginal dryness and dyspareunia were common.
Psychiatric
Anxiety and depression are also common symptoms in perimenopausal women.46-48 Studies have shown that depression is diagnosed 2.5 times more frequently among perimenopausal women than premenopausal women.48 In a study by Miller et al that focused on 536 WLWH, among whom 37% were perimenopausal, 89% reported psychological symptoms.29 Ferreira et al found that perimenopausal WLWH had an increased incidence of psychological symptoms, such as depression and anxiety, compared to women without HIV infection.26 Whether this increased prevalence of psychological symptoms seen in WLWH can be attributed to menopause is unclear, since one third to one half of men and women living with HIV experience symptoms of depression.49 However, in the WIHS, which compared findings from 835 WLWH to findings from 335 women without HIV from all menopausal stages, elevated depressive symptoms were seen in the early perimenopausal period.34 There was no increased incidence of such symptoms during the premenopausal or postmenopausal stage, suggesting that factors related to menopause contribute to depressive symptoms during the perimenopausal stage.34
Other Symptoms
Sleep disturbances are common among perimenopausal women, with an estimated prevalence between 38% and 46%.52-54 Hot flashes, anxiety, and depression appear to be factors that contribute to sleep difficulty.52-54 In a cross-sectional study of 273 WLWH and 264 women without HIV between 40 and 60 years of age, insomnia was found in 51% of perimenopausal and 53% of postmenopausal WLWH. The prevalence of insomnia in WLWH and women without HIV was the same.55 Joint aches are also commonly reported in the perimenopausal period, with a prevalence as high as 50% to 60% among perimenopausal women in the United States.22,29 Miller and colleagues found that 63% of menopausal WLWH reported arthralgia.29
Test your knowledge of this topic HERE.
Treatment
Despite the increased severity of menopausal symptoms experienced among WLWH, menopausal replacement therapy (MRT) is used less frequently in WLWH than in women living without HIV.55 Topical treatment is recommended for women who are experiencing vaginal dryness. First-line treatment is topical nonhormonal therapy, such as moisturizers and lubricants.56 If symptoms are not relieved, then topical vaginal estrogen therapy is recommended.56 Randomized placebo-controlled studies have verified the safety and efficacy of topical estrogen in the general population, and there is no reason to expect different outcomes in WLWH.57,58
Cardiovascular Risk
Estrogen deficiency that occurs during menopause leads to an increased risk of cardiovascular disease, particularly with changes in lipid profiles, insulin resistance, and body composition (eg, increased fat mass and waist circumference).61 HIV infection also is associated with a higher risk of cardiovascular disease, with studies consistently reporting a 1.5- to 2-fold increase in the rate of cardiovascular events in PLWH compared to persons without HIV.62 The inflammatory effects of HIV as well as ART exposure, specifically to PIs and abacavir, increase the risk for cardiovascular disease.62 In addition, traditional risk factors, including dyslipidemia, contribute to cardiovascular disease risk in this population.63,64
Osteoporosis
Menopause, with its associated estrogen deficiency, is the most important risk factor linked to increased bone turnover and bone loss.70 In addition, HIV is associated with bone loss, with low bone mineral density (BMD) described even among men and premenopausal women with HIV infection.71 Although decreased BMD associated with HIV stabilizes or even improves after initiation of ART in the younger population,72-74 chronic inflammation caused by HIV stimulates osteoclast differentiation and resorption.71 Other factors that appear to contribute to decreased BMD among PLWH include ART; vitamin D deficiency; low BMI; poor nutrition; inactivity; use of tobacco, alcohol, and illicit drugs; hepatitis B and C coinfection; and frailty, defined as increased vulnerability to stresses related to aging.72-80 Among ARTs, tenofovir disoproxil fumarate is associated with an increased risk of osteoporosis, and switching from this agent to tenofovir alafenamide improves bone density.81 Prolonged amenorrhea is also an added risk factor for osteoporosis in WLWH.82
Cognition
Both men and women living with HIV are at higher risk for cognitive impairment, ranging from minor cognitive-motor disorder to HIV-associated dementia.91 In addition, the menopause transition is characterized by cognitive changes, such as memory loss and difficulty concentrating.92,93 Studies focusing on the effects of both HIV infection and menopause on cognition have been limited thus far. A cross-sectional study demonstrated that HIV infection, but not menopausal stage, was associated with worse performance on cognitive measures.94 While menopausal stage was not associated with cognitive decline, menopausal symptoms like depression, anxiety, and vasomotor symptoms were associated with lower cognitive performance, highlighting the importance of recognition and treatment of menopausal symptoms.94
Test your knowledge of this topic HERE.
Cervical Dysplasia
WLWH are at increased risk for low- and high-grade squamous intraepithelial lesions (SILs) and more rapid progression to cervical carcinoma, as compared to women without HIV.95 This increased risk of cervical disease is associated with age, human papillomavirus genotype, and degree of immunosuppression.96 In addition, menopause appears to affect the risk of cervical disease. Postmenopausal WLWH had a higher risk of progression of SILs and persistence of lower-grade SILs compared to premenopausal women.97,98 Although studies on progression to cervical cancer in postmenopausal WLWH remain limited, current data suggest that postmenopausal WLWH should continue to be monitored and screened similarly to premenopausal women.
HIV Acquisition and Transmission
Women aged 50 years and older are primarily exposed to HIV through heterosexual contact.99 While the lack of awareness of HIV risk and less frequent use of barrier protection can contribute to new HIV infection in older women, physiologic changes associated with menopause also may be playing a role.100 Vaginal wall thinning and immunologic changes of the cervix that occur during menopause may serve as a risk factor for HIV acquisition. The cervicovaginal mucosa of postmenopausal women had higher levels of p24 antigen after ex vivo HIV-1 infection, suggesting higher susceptibility to acquire HIV infection.101 Postmenopausal women have been shown to have increased cervical CCR5 expression, which serves as an entry point of HIV into target cells.102 Finally, anti-HIV-1 activity was significantly decreased in postmenopausal women compared to premenopausal women.103 In addition, ex vivo studies demonstrated reduced tenofovir disoproxil fumarate and emtricitabine triphosphate concentrations in cervical tissue of postmenopausal women, suggesting that postmenopausal women may need higher doses of pre-exposure prophylaxis to achieve protective efficacy.104
HIV Progression
With prior data suggesting that younger persons experience better immunologic and virologic responses to ART,107-109 it had previously been hypothesized that virologic and immunologic responses to ART will decline once WLWH reach menopause. However, current studies suggest that menopause does not affect the progression of HIV and that ART-naive women should respond to ART, regardless of their menopausal status. Treatment responses to ART, determined by the median changes in CD4 cell counts and percentages and viral load, in ART-naive individuals did not differ between premenopausal and postmenopausal women.110 In addition, there appear to be no significant changes in CD4 cell counts as WLWH progress through menopause.111
Conclusion
As individuals with HIV infection live longer, an increasing number of women will enter menopause and live many years beyond menopause. WLWH experience earlier and more severe menopausal symptoms, but evidence on the appropriate management of these symptoms is still lacking. These conditions require proper surveillance, and can be prevented with an improved understanding of the effects of menopause on WLWH. However, there remain significant gaps in our understanding of menopause in WLWH. As practitioners encounter an increasing number of perimenopausal and postmenopausal WLWH, studies of the effects of HIV on comorbidities and symptoms of menopause and their appropriate management are necessary to improve care of WLWH.
Test your knowledge of this topic HERE.
1. UNAIDS. AIDSInfo. 2019 estimates https://www.unaids.org/en/resources/infographics/girls-and-women-living-with-HIV. Accessed April 30, 2020.
2. Centers for Disease Control and Prevention. Estimated HIV incidence and prevalence in the United States, 2010–2016. HIV Surveillance Supplemental Report 2019;24(No. 1). www.cdc.gov/hiv/library/reports/hiv-surveillance.html. Accessed April 30, 2020.
3. Chirwa M, Ma R, Guallar C, et al. Managing menopause in women living with HIV: A survey of primary care practitioners. Post Reprod Health. 2017;23:111-115.
4. Munster K, Helm P, Schmidt L. Secondary amenorrhea: Prevalence and medical contract–A cross sectional study from a Danish county. Br J Obstet Gynecol. 1992;99:430-433.
5. Vyver E, Steinegger C, Katzman DK, et al. Eating disorders and menstrual dysfunction in adolescents. Ann N Y Acad Sci. 2008;1135: 253-264.
6. Cejtin HE, Evans CT, Greenblatt R, et al. Prolonged amenorrhea and resumption of menses in women with HIV. J Womens Health (Larchmt). 2018;27:1441‐1448.
7. Bai J, Greenwald E, Caterini H, et al. Drug-related menstrual aberrations. Obstet Gynecol. 1974;44:713-719.
8. Cejtin HE, Kalinowski A, Bacchetti P. Effects of human immunodeficiency virus on protracted amenorrhea and ovarian dysfunction. Obstet Gynecol. 2006;108:1423-1431.
9. King EM, Albert AY, Murray MCM. HIV and amenorrhea: a meta-analysis. AIDS. 2019;33:483‐491.
10. Watts DH, Spino C, Zaborski L. Comparison of gynecologic history and laboratory results in HIV-positive women with CDR+ lymphocyte counts between 200 and 500 cells/μl and below 100 cells/ μl. J Acquir Immune Defic Syndr Hum Retrovirol. 1999;20:455-462.
11. Gold EB, Crawford SL, Avis NE, et al. Factors related to age at natural menopause: longitudinal analyses from SWAN. Am J Epidemiol. 2013;178:70-83.
12. Thomas F, Renaud F, Benefice E, et al. International variability of ages at menarche and menopause: patterns and main determinants. Hum Biol. 2001;73:271-290.
13. Bromberger JT, Matthews KA, Kuller LH, et al. Prospective study of the determinants of age at menopause. Am J Epidemiol. 1997; 145:24-33.
14. Schoenbaum E, Hartel D, Lo Y, et al. HIV infection, drug use, and onset of natural menopause. Clinical Infect Dis. 2005;41: 1517-1524.
15. Research on the menopause in the 1990s. Report of a WHO scientific group. World Health Organ Tech Rep Ser. 1996;866:1-107.
16. de Pommerol M, Hessamfar M, Lawson-Ayayi S, et al. Menopause and HIV infection: age at onset and associated factors, ANRS CO3 Aquitaine cohort. Int J STD AIDS. 2011;22:67-72.
17. Calvet G, Grinsztejn G. Predictors of early menopause in HIV infected women: a prospective cohort study. Am J Obstet Gynecol. 2015;212:765.
18. Cejtin SH, Taylor R, Watts DH. Assessment of menopausal status among women in the Women’s Interagency HIV study (WIHS). Proceedings of the XV International AIDS Conference; July 11-16, 2004; Bangkok, Thailand.
19. Taffe JR, Dennerstein L. Menstrual patterns leading to the final menstrual period. Menopause. 2002;9:32-40.
20. Miro F, Parker SW, Aspinall LJ, et al. Origins and consequences of the elongation of the human menstrual cycle during the menopausal transition: the FREEDOM Study. J Clin Endocrinol Metab. 2004;89:4910-4915.
21. McKinlay SM, Brambilla DJ, Posner JG. The normal menopause transition. Maturitas. 1992;14:103-115.
22. Blümel JE, Chedraui P, Baron G, et al. Menopause could be involved in the pathogenesis of muscle and joint aches in mid-aged women. Maturitas. 2013;75:94-100.
23. Woods NF, Mitchell ES. Symptoms interference with work and relationships during the menopausal transition and early postmenopause: observations from the Seattle Midlife Women’s Health Study. Menopause. 2011;18:654-661.
24. Duff PK, Money DM, Ogilvie GS, et al. Severe menopausal symptoms associated with reduced adherence to antiretroviral therapy among perimenopausal and menopausal women living with HIV in Metro Vancouver. Menopause. 2018;25:531-537.
25. Johnson TM, Cohen HW, Howard AA, et al. Attribution of menopause symptoms in human immunodeficiency virus–infected or at-risk drug-using women. Menopause. 2008;15:551-557.
26. Ferreira CE, Pinto-Neto AM, Conde DM, et al. Menopausal symptoms in women infected with HIV: prevalence and associated factors. Gynecol Endocrinol. 2007;23:198-205.
27. Fantry L, Zhan M, Taylor G, et al. Age at menopause and menopausal symptoms in HIV-infected women. AIDS Patient Care STD. 2005;19:703-711.
28. Boonyanurak P, Bunupuradah T, Wilawan K, et al. Age at menopause and menopause-related symptoms in human immunodeficiency virus-infected Thai women. Menopause. 2012;19: 820-824.
29. Miller SA, Santoro N, Lo Y. Menopausal symptoms in HIV-infected and drug-using women. Menopause. 2005;12:348-356.
30. Looby S, Shifren J, Corless I. Increased hot flash severity and related interference in perimenopausal HIV-infected women. Menopause. 2014;21:403-409.
31. Schnall R, Jia H, Olender S, et al. In people living with HIV (PLWH), menopause (natural or surgical) contributes to the greater symptom burden in women: results from an online US survey. Menopause. 2018;25:744-752.
32. Thurston RC, Joffe H. Vasomotor symptoms and menopause: findings from the Study of Women’s Health across the Nation. Obstet Gynecol Clin North Am. 2011;38:489-501.
33. Woods NF, Mitchell ES. Symptoms during the perimenopause: prevalence, severity, trajectory, and significance in women’s lives. Am J Med. 2005;118 Suppl 12B:14-24.
34. Maki PM, Rubin LH, Cohen M, et al. Depressive symptoms are increased in the early perimenopausal stage in ethnically diverse human immunodeficiency virus-infected and human immunodeficiency virus-uninfected women. Menopause. 2012;19: 1215-1233.
35. Dennerstein L, Dudley EC, Hopper JL, et al. A prospective population-based study of menopausal symptoms. Obstet Gynecol. 2000;96:351-358.
36. Palma F, Volpe A, Villa P, et al. Vaginal atrophy of women in postmenopause. Results from a multicentric observational study: The AGATA study. Maturitas. 2016;83:40-44.
37. Cutler WB, Garcia CR, McCoy N. Perimenopausal sexuality. Arch Sex Behav. 1987;16:225-234.
38. Moreira ED, Glasser DB, Nicolosi A, et al. GSSAB Investigators’ Group. Sexual problems and help-seeking behavior in adults in the United Kingdom and continental Europe. BJU Int. 2008;101:1005-1111.
39. MacBride MB, Rhodes DJ, Shuster LT. Vulvovaginal atrophy. Mayo Clin Proc. 2010;85:87-94.
40. Nappi RE, Kokot-Kierepa M. Women’s voices in the menopause: results from an international survey on vaginal atrophy. Maturitas. 2010;67:233-238.
41. Santoro N, Komi J. Prevalence and impact of vaginal symptoms among postmenopausal women. J Sex Med. 2009;6:2133-2142.
42. Valadares AL, Pinto-Neto AM, Conde DM, et al. A population-based study of dyspareunia in a cohort of middle-aged Brazilian women. Menopause. 2008;15:1184-1190.
43. Latthe P, Migini L, Gray R, et al. Factors predisposing women to chronic pelvic pain: a systemic review. BMJ. 2006;332:749-755.
44. Potter DA, Moreno A, Luther MF, et al. Effects of follicular-phase cocaine administration on menstrual and ovarian cyclicity in rhesus monkeys. Am J Obstet Gynecol. 1998;178:118-125.
45. Valadares AL, Pinto-Neto AM, Gomes D, et al. Dyspareunia in HIV-positive and HIV-negative middle-aged women: a cross-sectional study. BMJ Open. 2014;4:e004974.
46. Bromberger JT, Meyer PM, Kravitz HM, et al. Psychologic distress and natural menopause: a multiethnic community study. Am J Public Health. 2001;91:1435-1442.
47. Avis NE, Brambilla D, McKinlay SM, Vass K. A longitudinal analysis of the association between menopause and depression. Results from the Massachusetts Women’s Health Study. Ann Epidemiol. 1994;4:214-220.
48. Freeman EW, Sammel MD, Lin H, Nelson DB. Associations of hormones and menopausal status with depressed mood in women with no history of depression. Arch Gen Psychiatry. 2006; 63:375-382.
49. Eller LS, Corless I, Bunch EH, et al. Self-care strategies for depressive symptoms in people with HIV disease. J Adv Nurs. 2005;51:119-130.
50. Fuh JL, Wang SJ, Lee SJ, et al. A longitudinal study of cognition change during early menopausal transition in a rural community. Maturitas. 2006;53:447-453.
51. Hinkin CH, Castellon SA, Atkinson JH, et al. Neuropsychiatric aspects of HIV infection among older adults. J Clin Epidemiol. 2001;54:S44-S52
52. Kravitz HM, Ganz PA, Bromberger J, et al. Sleep difficulty in women at midlife: a community survey of sleep and the menopausal transition. Menopause. 2003;10:19-28.
53. Freedman RR, Roehrs TA. Effects of REM sleep and ambient temperature on hot flash-induced sleep disturbance. Menopause. 2006;13:576-583.
54. Erlik Y, Tataryn IV, Meldrum DR, et al. Association of waking episodes aspects of HIV infection among older adults. J Clin Epidemiol. 2001;54:S44–52.
55. Lui-Filho JF, Valadares AR, Gomes D, et al. Menopausal symptoms and associated factors in HIV-positive women. Maturitas. 2013;76:172-178.
56. Management of symptomatic vulvovaginal atrophy: 2013 position statement of The North American Menopause Society. Menopause. 2013;20:888‐904.
57. Fernandes T, Pedro AO, Baccaro LF, et al. Hormonal, metabolic, and endometrial safety of testosterone vaginal cream versus estrogens for the treatment of vulvovaginal atrophy in postmenopausal women: a randomized, placebo-controlled study. Menopause. 2018; 25:641‐647.
58. Kroll R, Archer DF, Lin Y, et al. A randomized, multicenter, double-blind study to evaluate the safety and efficacy of estradiol vaginal cream 0.003% in postmenopausal women with dyspareunia as the most bothersome symptom. Menopause. 2018;25:133‐138.
59. Panel on Antiretroviral Guidelines for Adults and Adolescents. Guidelines for the use of antiretroviral agents in adults and adolescents with HIV. Department of Health and Human Services. Tables 21a-d.www.aidsinfo.nih.gov/ContentFiles/ AdultandAdolescentGL.pdf. Accessed May 4, 2020.
60. Tittle, V, Bull, L, Boffito, M. Pharmacokinetic and pharmacodynamics drug interactions between antiretrovirals and oral contraceptives. Clin Pharmacokinet. 2015;54:23-34.
61. Sower M, Zheng H, Tomey K, et al. Changes in body composition in women over six years at midlife: ovarian and chronological aging. J Clin Endocrin Metab. 2007;92:895- 901.
62. Eyawo O, Brockman G, Goldsmith CH, et al. Risk of myocardial infarction among people living with HIV: an updated systematic review and meta-analysis. BMJ Open. 2019;9:e025874.
63. Flooris-Moore M, Howard AA, Lo Y, et al. Increased serum lipids are associated with higher CD4 lymphocyte count in HIV-infected women. HIV Med. 2006;7:421-430.
64. Hadigan C, Meigs JB, Corcoran C, et al. Metabolic abnormalities and cardiovascular disease risk factors in adults with human immunodeficiency virus infection and lipodystrophy. Clin Infect Dis. 2001;32:130-139.
65. Grinspoon S, Carr A. Cardiovascular risk and body fat abnormalities in HIV-infected adults. N Engl J Med. 2005; 352:48–62.
66. Study of Fat Redistribution and Metabolic Change in HIV Infection (FRAM). Fat distribution in women with HIV infection. J Acquir Immune Defic Syndr. 2006;42:562-571.
67. Alcaide ML, Parmigiani A, Pallikkuth S, et al. Immune activation in HIV-infected aging women on antiretrovirals--implications for age-associated comorbidities: a cross-sectional pilot study. PLoS One. 2013;8:e63804.
68. Karim R, Mack WJ, Kono N, et al. Gonadotropin and sex steroid levels in HIV-infected premenopausal women and their association with subclinical atherosclerosis in HIV-infected and -uninfected women in the women’s interagency HIV study (WIHS). J Clin Endocrinol Metab. 2013;98:E610‐E618.
69. Looby SE, Fitch KV, Srinivasa S, et al. Reduced ovarian reserve relates to monocyte activation and subclinical coronary atherosclerotic plaque in women with HIV. AIDS. 2016;30:383‐393.
70. Akhter MP, Lappe JM, Davies KM, et al. Transmenopausal changes in the trabecular bone structure. Bone. 2007;41:111-116.
71. Gibellini D, De Crignis E, Ponti C. HIV-1 triggers apoptosis in primary osteoblasts and HOBIT cells through TNF-alpha activation. J Med Virol. 2008;80:1507-1514.
72. Cassetti I, Madruga JV, Suleiman JM, et al. The safety and efficacy of tenofovir DF in combination with lamivudine and efavirenz through 6 years in antiretroviral-naive HIV- 1-infected patients. HIV Clin Trials. 2007;8:164-172.
73. McComsey GA, Kitch D, Daar ES, et al. Bone mineral density and fractures in antiretroviral-naive persons randomized to receive abacavir-lamivudine or tenofovir disoproxil fumarate-emtricitabine along with efavirenz or atazanavir-ritonavir: AIDS Clinical Trials Group A5224s, a substudy of ACTG A5202. J Infect Dis. 2011;203: 1791-1801.
74. Hansen AB, Obel N, Nielsen H, et al. Bone mineral density changes in protease inhibitor-sparing vs. nucleoside reverse transcriptase inhibitor-sparing highly active antiretroviral therapy: Data from a randomized trial. HIV Med. 2011;12:157-165.
75. FDao CN, Patel P, Overton ET, et al. Study to understand the natural history of HIV and AIDS in the era of effective therapy (SUN) investigators. Low vitamin D among HIV-infected adults: prevalence of and risk factors for low vitamin D levels in cohort of HIV-infected adults and comparison to prevalence among adults in the US general population. Clin Infect Dis. 2011;52:396-405.
76. Jacobson DL, Spiegelman D, Know TK, Wilson IB. Evolution and predictors of change in total bone mineral density over time in HIV-infected men and women in the nutrition for healthy living study. J Acquir Immune Defic Syndr Hum Retrovirol. 2008;49:298-308.
77. Kanis JA, Borgstrom F, De Laet C, et al. Assessment of fracture risk. Osteoporosis Int. 2005;16:581-589.
78. Pedrazzoni M, Vescovi L, Maninetti M, et al. Effects of chronic heroine abuse on bone and mineral metabolism. Acta Endocrinol. 1993;129:42-45.
79. Lo Re V 3rd, Guaraldi G, Leonard MB, et al. Viral hepatitis is associated with reduced bone mineral density in HIV-infected women but not men. AIDS. 1990;23:2191-2198.
80. Bregigeon S, Galinier A, Zaegel-Faucher O, et al. Frailty in HIV infected people: a new risk factor for bone mineral density loss [published correction appears in AIDS. AIDS. 2017;31: 1573‐1577.
81. Mills A, Arribas JR, Andrade-Villanueva J, et al. Switching from tenofovir disoproxil fumarate to tenofovir alafenamide in antiretroviral regimens for virologically suppressed adults with HIV-1 infection: a randomised, active-controlled, multicentre, open-label, phase 3, non-inferiority study. Lancet Infect Dis. 2015;16:43-45.
82. King EM, Nesbitt A, Albert AYK, et al. Prolonged amenorrhea and low hip bone mineral density in women living with HIV-a controlled cross-sectional study. J Acquir Immune Defic Syndr. 2020;83:
486‐495.
83. Yin MT, Mcmahon DJ, Ferris DC, et al. Low bone mass and high bone turnover in postmenopausal human immunodeficiency virus-infected women. J Clin Endocrinol Metab. 2010;95:620-629.
84. Yin MT, Modarresi R, Shane E, et al. Effects of HIV infection and antiretroviral therapy with ritonavir on induction of osteoclast-like cells in postmenopausal women. Osteoporos Int. 2011;22:1459-1466.
85. Sharma A, Cohen HW, Freeman R, et al. Prospective evaluation of bone mineral density among middle-aged HIV-infected and uninfected women: association between methadone use and bone loss. Maturitas. 2011;70:295-301.
86. Sharma A, Flom PL, Rosen CJ, et al. Racial differences in bone loss and relation to menopause among HIV-infected and uninfected women. Bone. 2015;77:24-30.
87. Aberg JA, Gallant JE, Ghanem KG, et al, Infectious Diseases Society of America. Primary care guidelines for the management of persons infected with HIV: 2013 update by the HIV medicine association of the Infectious Diseases Society of America. Clin Infect Dis. 2014;58:1‐10.
88. National Osteoporosis Foundation. Clinician’s guide to prevention and treatment of osteoporosis 2014. Washington, DC: National Osteoporosis Foundation; 2014.
89. Yin MT, Choudhury A, Bucovsky M, et al. A randomized placebo-controlled trial of low- versus moderate-dose vitamin d3 supplementation on bone mineral density in postmenopausal women with HIV. J Acquir Immune Defic Syndr. 2019;80:342-349.
90. McComsey GA, Tebas P, Shane E, et al. Bone disease in HIV infection: a practical review and recommendations for HIV care providers. Clin Infect Dis. 2010;51:937-946.
91. Price RW. Neurological complications of HIV infection. Lancet. 1996;348:445-452.
92. Soares CN, Maki PM. Menopausal transition, mood, and cognition: an integrated view to close the gaps. Menopause. 2010;17:812-814.
93. Greendale GA, Wight RG, Huang MH, et al. Menopause-associated symptoms and cognitive performance: results from the study of women’s health across the nation. Am J Epidemiol. 2010;171:1214-1224.
94. Rubin LH, Sundermann EE, Cook JA, et al. An investigation of menopausal stage and symptoms on cognition in HIV-infected women. Menopause. 2014;21:997-1006.
95. Ellerbrock TV, Chiasson MA, Bush TJ, et al. Incidence of cervical squamous intraepithelial lesions in HIV-infected women. JAMA. 2000;283:1031-1037.
96. Mandelblatt JS, Kanetsky P, Eggert L, et al. Is HIV infection a cofactor for cervical squamous cell neoplasia? Cancer Epidemiol Biomarkers Prev. 1999;8:97-106.
97. Kim SC, Messing S, Shah K, et al. Effects of highly active antiretroviral therapy (HAART) and menopause on risk of progression of cervical dysplasia in human immune deficiency virus (HIV) infected women. Infect Dis Obstet Gynecol. 2013;2013:784718.
98. Ceccaldi PF, Ferreira C, Coussy F, et al. Cervical disease in postmenopausal HIV-1 infected women. J Gynecol Obstet Biol Reprod. 2010;39:466-470.
99. Centers for Disease Control and Prevention. HIV and older Americans. www.cdc.gov/hiv/group/age/olderamericans/index.html. Accessed May 11, 2020.
100. Levy JA, Ory MG, Crystal S. HIV/AIDS interventions for midlife and older adults: current status and challenges. J Acquir Immune Defic Syndr. 2003;33 Suppl 2:S59-S67.
101. Thurman AR, Yousefieh N, Chandra N, et al. Comparison of mucosal markers of human immunodeficiency virus susceptibility in healthy premenopausal versus postmenopausal women. AIDS Res Hum Retroviruses. 2017;33:807-819.
102. Meditz AL, Moreau KL, MaWhinney S, et al. CCR5 expression is elevated on endocervical CD4+ T cells in healthy postmenopausal women. J Acquir Immune Defic Syndr. 2012;59:221-228.
103. Chappell CA, Isaacs CE, Xu W, et al. The effect of menopause on the innate antiviral activity of cervicovaginal lavage. Am J Obstet Gynecol. 2015;213:204.
104. Nicol MR, Brewers LM, Kashuba ADM, et al. The role of menopause in tenofovir diphosphate and emtricitabine triphosphate concentrations in cervical tissue. AIDS. 2018;32:11-15.
105. Melo KC, Melo MR, Ricci BV, Segurado AC. Correlates of human immunodeficiency virus cervicovaginal shedding among postmenopausal and fertile-aged women. Menopause. 2012;19:150-156.
106. Landolt NK, Do T, Kasipong N, et al. Low-level genital HIV shedding in Thai HIV-infected women with suppressed plasma viral load after menopause: a longitudinal study. J Virus Erad. 2017;3:204-207.
107. Viard JP, Mocroft A, Chiesi A, et al. Influence of age of CD4 cell recovery in human immunodeficiency virus-infected patients receiving highly active antiretroviral therapy: evidence from the Euro SIDA study. J Infect Dis. 2001;193:1290-1294.
108. Grabar S, Kousignian I, Sobel A, et al. Immunological and clinical responses to highly active antiretroviral therapy over 50 years of age. Results from the French Hospital Database on HIV. AIDS. 2004;18:2029-2038.
109. Cuzin L, Delpierre C, Gerard S, et al. Immunologic and clinical responses to highly active antiretroviral therapy in patients with HIV infection aged >50 years. Clin Infect Dis. 2007;45:654-657.
110. Patterson KB, Cohn SE, Uynik J, et al. Treatment responses in antiretroviral treatment-naïve premenopausal and postmenopausal HIV-1 infected women: an analysis from AIDS clinical trials group studies. Clin Infect Dis. 2009;49:473476.
111. van Benthem BH, Vernazza P, Coutinho RA, et al. The impact of pregnancy and menopause on CD4 lymphocyte count in HIV-infected women. AIDS. 2002;16:919-922.
More than half of the 37.9 million persons living with HIV (PLWH) worldwide are women.1 Between 2010 and 2016, 58% of women living with HIV (WLWH) in the United States were older than 45 years.2 As such, an increasing number of WLWH are entering menopause and living well beyond menopause. Despite this, health care providers expressed a lack of confidence in managing menopause in WLWH, and menopausal symptoms often are not recognized by providers.3 Enhancing our knowledge about menopause in WLWH is important, since the physiologic changes associated with menopause impact short- and long-term quality of life and mortality.
Test your knowledge of this topic HERE.
Amenorrhea
Menstrual irregularities, including amenorrhea and anovulation, are more frequently found in women of low socioeconomic status, presumably due to associated physical and emotional stress.4 In addition, women with low body mass index (BMI) have decreased serum estradiol levels, which lead to amenorrhea.4,5 Furthermore, low parity and many legal and illegal drugs are associated with amenorrhea, including hormonal contraceptives, opiates, stimulants, antipsychotics, and chemotherapeutic agents.6-8
Test your knowledge of this topic HERE.
Age at Menopause
In the United States, the median age of menopause is between 50 and 52 years in middle-class white women.11,12 Earlier menopause has been observed in women who are African American, are nulliparous, have a lower BMI, smoke tobacco, and have more stress, less education, and higher unemployment rates.11,13,14 Because 57% of women diagnosed with HIV in 2018 were African American and many WLWH have other risk factors associated with earlier menopause, studies examining the age of menopause in WLWH need to use a comparator group of women without HIV with similar characteristics and control for these factors to determine the influence of HIV on the age of menopause.
Menopause-Associated Symptoms
The perimenopausal period, which begins, on average, 4 years prior to the final menstrual period, is characterized by hormonal fluctuations leading to irregular menstrual cycles.19,20 Symptoms associated with these physiologic changes during the perimenopausal period include vasomotor symptoms (hot flashes), genitourinary symptoms (vaginal dryness and dyspareunia), anxiety, depression, sleep disturbances, and joint aches.21,22 Such menopausal symptoms can be distressing and negatively impact quality of life.23 In WLWH, severe menopausal symptoms have been associated with suboptimal adherence to antiretroviral therapy (ART).24
Vasomotor
In the United States, the most common symptom during perimenopause is hot flashes, which occur in 38% to 80% of women.32,33 Vasomotor symptoms are most common in women who smoke, use illicit substances, have a high BMI, are of lower socioeconomic status, and are African American.11 As expected, prior studies focusing on hot flash prevalence among premenopausal, perimenopausal, and postmenopausal WLWH found that postmenopausal women experience more hot flashes than premenopausal or perimenopausal women.27,28 In addition, a comparison of women with and without HIV demonstrated a higher prevalence of hot flashes among WLWH.26,29 Vasomotor symptoms can be severely distressing, with hot flashes contributing to increased risk of depression.25,34 In a cross-sectional analysis of 835 WLWH and 335 women without HIV from the WIHS cohort, persistent vasomotor symptoms predicted elevated depressive symptoms in both WLWH and women without HIV.34 In a similar cross-sectional analysis of 536 women, among whom 54% were WLWH and 37% were perimenopausal, psychological symptoms were prevalent in 61% of the women with vasomotor symptoms.29
Genitourinary
Estrogen deficiency, which accompanies the perimenopausal period, leads to vulvovaginal atrophy (VVA), manifesting with symptoms of vaginal dryness, itching, burning, urinary urgency, and dyspareunia (painful intercourse).33,35,36 Unlike vasomotor symptoms, which diminish with time, genitourinary symptoms generally worsen if left untreated.37 Furthermore, these symptoms are often underreported and underdiagnosed.38,39 VVA was found in 43% to 84% of postmenopausal women.36,40,41 In the AGATA study, the prevalence of VVA was associated with years since menopause. 36 Vaginal dryness and dyspareunia were common.
Psychiatric
Anxiety and depression are also common symptoms in perimenopausal women.46-48 Studies have shown that depression is diagnosed 2.5 times more frequently among perimenopausal women than premenopausal women.48 In a study by Miller et al that focused on 536 WLWH, among whom 37% were perimenopausal, 89% reported psychological symptoms.29 Ferreira et al found that perimenopausal WLWH had an increased incidence of psychological symptoms, such as depression and anxiety, compared to women without HIV infection.26 Whether this increased prevalence of psychological symptoms seen in WLWH can be attributed to menopause is unclear, since one third to one half of men and women living with HIV experience symptoms of depression.49 However, in the WIHS, which compared findings from 835 WLWH to findings from 335 women without HIV from all menopausal stages, elevated depressive symptoms were seen in the early perimenopausal period.34 There was no increased incidence of such symptoms during the premenopausal or postmenopausal stage, suggesting that factors related to menopause contribute to depressive symptoms during the perimenopausal stage.34
Other Symptoms
Sleep disturbances are common among perimenopausal women, with an estimated prevalence between 38% and 46%.52-54 Hot flashes, anxiety, and depression appear to be factors that contribute to sleep difficulty.52-54 In a cross-sectional study of 273 WLWH and 264 women without HIV between 40 and 60 years of age, insomnia was found in 51% of perimenopausal and 53% of postmenopausal WLWH. The prevalence of insomnia in WLWH and women without HIV was the same.55 Joint aches are also commonly reported in the perimenopausal period, with a prevalence as high as 50% to 60% among perimenopausal women in the United States.22,29 Miller and colleagues found that 63% of menopausal WLWH reported arthralgia.29
Test your knowledge of this topic HERE.
Treatment
Despite the increased severity of menopausal symptoms experienced among WLWH, menopausal replacement therapy (MRT) is used less frequently in WLWH than in women living without HIV.55 Topical treatment is recommended for women who are experiencing vaginal dryness. First-line treatment is topical nonhormonal therapy, such as moisturizers and lubricants.56 If symptoms are not relieved, then topical vaginal estrogen therapy is recommended.56 Randomized placebo-controlled studies have verified the safety and efficacy of topical estrogen in the general population, and there is no reason to expect different outcomes in WLWH.57,58
Cardiovascular Risk
Estrogen deficiency that occurs during menopause leads to an increased risk of cardiovascular disease, particularly with changes in lipid profiles, insulin resistance, and body composition (eg, increased fat mass and waist circumference).61 HIV infection also is associated with a higher risk of cardiovascular disease, with studies consistently reporting a 1.5- to 2-fold increase in the rate of cardiovascular events in PLWH compared to persons without HIV.62 The inflammatory effects of HIV as well as ART exposure, specifically to PIs and abacavir, increase the risk for cardiovascular disease.62 In addition, traditional risk factors, including dyslipidemia, contribute to cardiovascular disease risk in this population.63,64
Osteoporosis
Menopause, with its associated estrogen deficiency, is the most important risk factor linked to increased bone turnover and bone loss.70 In addition, HIV is associated with bone loss, with low bone mineral density (BMD) described even among men and premenopausal women with HIV infection.71 Although decreased BMD associated with HIV stabilizes or even improves after initiation of ART in the younger population,72-74 chronic inflammation caused by HIV stimulates osteoclast differentiation and resorption.71 Other factors that appear to contribute to decreased BMD among PLWH include ART; vitamin D deficiency; low BMI; poor nutrition; inactivity; use of tobacco, alcohol, and illicit drugs; hepatitis B and C coinfection; and frailty, defined as increased vulnerability to stresses related to aging.72-80 Among ARTs, tenofovir disoproxil fumarate is associated with an increased risk of osteoporosis, and switching from this agent to tenofovir alafenamide improves bone density.81 Prolonged amenorrhea is also an added risk factor for osteoporosis in WLWH.82
Cognition
Both men and women living with HIV are at higher risk for cognitive impairment, ranging from minor cognitive-motor disorder to HIV-associated dementia.91 In addition, the menopause transition is characterized by cognitive changes, such as memory loss and difficulty concentrating.92,93 Studies focusing on the effects of both HIV infection and menopause on cognition have been limited thus far. A cross-sectional study demonstrated that HIV infection, but not menopausal stage, was associated with worse performance on cognitive measures.94 While menopausal stage was not associated with cognitive decline, menopausal symptoms like depression, anxiety, and vasomotor symptoms were associated with lower cognitive performance, highlighting the importance of recognition and treatment of menopausal symptoms.94
Test your knowledge of this topic HERE.
Cervical Dysplasia
WLWH are at increased risk for low- and high-grade squamous intraepithelial lesions (SILs) and more rapid progression to cervical carcinoma, as compared to women without HIV.95 This increased risk of cervical disease is associated with age, human papillomavirus genotype, and degree of immunosuppression.96 In addition, menopause appears to affect the risk of cervical disease. Postmenopausal WLWH had a higher risk of progression of SILs and persistence of lower-grade SILs compared to premenopausal women.97,98 Although studies on progression to cervical cancer in postmenopausal WLWH remain limited, current data suggest that postmenopausal WLWH should continue to be monitored and screened similarly to premenopausal women.
HIV Acquisition and Transmission
Women aged 50 years and older are primarily exposed to HIV through heterosexual contact.99 While the lack of awareness of HIV risk and less frequent use of barrier protection can contribute to new HIV infection in older women, physiologic changes associated with menopause also may be playing a role.100 Vaginal wall thinning and immunologic changes of the cervix that occur during menopause may serve as a risk factor for HIV acquisition. The cervicovaginal mucosa of postmenopausal women had higher levels of p24 antigen after ex vivo HIV-1 infection, suggesting higher susceptibility to acquire HIV infection.101 Postmenopausal women have been shown to have increased cervical CCR5 expression, which serves as an entry point of HIV into target cells.102 Finally, anti-HIV-1 activity was significantly decreased in postmenopausal women compared to premenopausal women.103 In addition, ex vivo studies demonstrated reduced tenofovir disoproxil fumarate and emtricitabine triphosphate concentrations in cervical tissue of postmenopausal women, suggesting that postmenopausal women may need higher doses of pre-exposure prophylaxis to achieve protective efficacy.104
HIV Progression
With prior data suggesting that younger persons experience better immunologic and virologic responses to ART,107-109 it had previously been hypothesized that virologic and immunologic responses to ART will decline once WLWH reach menopause. However, current studies suggest that menopause does not affect the progression of HIV and that ART-naive women should respond to ART, regardless of their menopausal status. Treatment responses to ART, determined by the median changes in CD4 cell counts and percentages and viral load, in ART-naive individuals did not differ between premenopausal and postmenopausal women.110 In addition, there appear to be no significant changes in CD4 cell counts as WLWH progress through menopause.111
Conclusion
As individuals with HIV infection live longer, an increasing number of women will enter menopause and live many years beyond menopause. WLWH experience earlier and more severe menopausal symptoms, but evidence on the appropriate management of these symptoms is still lacking. These conditions require proper surveillance, and can be prevented with an improved understanding of the effects of menopause on WLWH. However, there remain significant gaps in our understanding of menopause in WLWH. As practitioners encounter an increasing number of perimenopausal and postmenopausal WLWH, studies of the effects of HIV on comorbidities and symptoms of menopause and their appropriate management are necessary to improve care of WLWH.
Test your knowledge of this topic HERE.
1. UNAIDS. AIDSInfo. 2019 estimates https://www.unaids.org/en/resources/infographics/girls-and-women-living-with-HIV. Accessed April 30, 2020.
2. Centers for Disease Control and Prevention. Estimated HIV incidence and prevalence in the United States, 2010–2016. HIV Surveillance Supplemental Report 2019;24(No. 1). www.cdc.gov/hiv/library/reports/hiv-surveillance.html. Accessed April 30, 2020.
3. Chirwa M, Ma R, Guallar C, et al. Managing menopause in women living with HIV: A survey of primary care practitioners. Post Reprod Health. 2017;23:111-115.
4. Munster K, Helm P, Schmidt L. Secondary amenorrhea: Prevalence and medical contract–A cross sectional study from a Danish county. Br J Obstet Gynecol. 1992;99:430-433.
5. Vyver E, Steinegger C, Katzman DK, et al. Eating disorders and menstrual dysfunction in adolescents. Ann N Y Acad Sci. 2008;1135: 253-264.
6. Cejtin HE, Evans CT, Greenblatt R, et al. Prolonged amenorrhea and resumption of menses in women with HIV. J Womens Health (Larchmt). 2018;27:1441‐1448.
7. Bai J, Greenwald E, Caterini H, et al. Drug-related menstrual aberrations. Obstet Gynecol. 1974;44:713-719.
8. Cejtin HE, Kalinowski A, Bacchetti P. Effects of human immunodeficiency virus on protracted amenorrhea and ovarian dysfunction. Obstet Gynecol. 2006;108:1423-1431.
9. King EM, Albert AY, Murray MCM. HIV and amenorrhea: a meta-analysis. AIDS. 2019;33:483‐491.
10. Watts DH, Spino C, Zaborski L. Comparison of gynecologic history and laboratory results in HIV-positive women with CDR+ lymphocyte counts between 200 and 500 cells/μl and below 100 cells/ μl. J Acquir Immune Defic Syndr Hum Retrovirol. 1999;20:455-462.
11. Gold EB, Crawford SL, Avis NE, et al. Factors related to age at natural menopause: longitudinal analyses from SWAN. Am J Epidemiol. 2013;178:70-83.
12. Thomas F, Renaud F, Benefice E, et al. International variability of ages at menarche and menopause: patterns and main determinants. Hum Biol. 2001;73:271-290.
13. Bromberger JT, Matthews KA, Kuller LH, et al. Prospective study of the determinants of age at menopause. Am J Epidemiol. 1997; 145:24-33.
14. Schoenbaum E, Hartel D, Lo Y, et al. HIV infection, drug use, and onset of natural menopause. Clinical Infect Dis. 2005;41: 1517-1524.
15. Research on the menopause in the 1990s. Report of a WHO scientific group. World Health Organ Tech Rep Ser. 1996;866:1-107.
16. de Pommerol M, Hessamfar M, Lawson-Ayayi S, et al. Menopause and HIV infection: age at onset and associated factors, ANRS CO3 Aquitaine cohort. Int J STD AIDS. 2011;22:67-72.
17. Calvet G, Grinsztejn G. Predictors of early menopause in HIV infected women: a prospective cohort study. Am J Obstet Gynecol. 2015;212:765.
18. Cejtin SH, Taylor R, Watts DH. Assessment of menopausal status among women in the Women’s Interagency HIV study (WIHS). Proceedings of the XV International AIDS Conference; July 11-16, 2004; Bangkok, Thailand.
19. Taffe JR, Dennerstein L. Menstrual patterns leading to the final menstrual period. Menopause. 2002;9:32-40.
20. Miro F, Parker SW, Aspinall LJ, et al. Origins and consequences of the elongation of the human menstrual cycle during the menopausal transition: the FREEDOM Study. J Clin Endocrinol Metab. 2004;89:4910-4915.
21. McKinlay SM, Brambilla DJ, Posner JG. The normal menopause transition. Maturitas. 1992;14:103-115.
22. Blümel JE, Chedraui P, Baron G, et al. Menopause could be involved in the pathogenesis of muscle and joint aches in mid-aged women. Maturitas. 2013;75:94-100.
23. Woods NF, Mitchell ES. Symptoms interference with work and relationships during the menopausal transition and early postmenopause: observations from the Seattle Midlife Women’s Health Study. Menopause. 2011;18:654-661.
24. Duff PK, Money DM, Ogilvie GS, et al. Severe menopausal symptoms associated with reduced adherence to antiretroviral therapy among perimenopausal and menopausal women living with HIV in Metro Vancouver. Menopause. 2018;25:531-537.
25. Johnson TM, Cohen HW, Howard AA, et al. Attribution of menopause symptoms in human immunodeficiency virus–infected or at-risk drug-using women. Menopause. 2008;15:551-557.
26. Ferreira CE, Pinto-Neto AM, Conde DM, et al. Menopausal symptoms in women infected with HIV: prevalence and associated factors. Gynecol Endocrinol. 2007;23:198-205.
27. Fantry L, Zhan M, Taylor G, et al. Age at menopause and menopausal symptoms in HIV-infected women. AIDS Patient Care STD. 2005;19:703-711.
28. Boonyanurak P, Bunupuradah T, Wilawan K, et al. Age at menopause and menopause-related symptoms in human immunodeficiency virus-infected Thai women. Menopause. 2012;19: 820-824.
29. Miller SA, Santoro N, Lo Y. Menopausal symptoms in HIV-infected and drug-using women. Menopause. 2005;12:348-356.
30. Looby S, Shifren J, Corless I. Increased hot flash severity and related interference in perimenopausal HIV-infected women. Menopause. 2014;21:403-409.
31. Schnall R, Jia H, Olender S, et al. In people living with HIV (PLWH), menopause (natural or surgical) contributes to the greater symptom burden in women: results from an online US survey. Menopause. 2018;25:744-752.
32. Thurston RC, Joffe H. Vasomotor symptoms and menopause: findings from the Study of Women’s Health across the Nation. Obstet Gynecol Clin North Am. 2011;38:489-501.
33. Woods NF, Mitchell ES. Symptoms during the perimenopause: prevalence, severity, trajectory, and significance in women’s lives. Am J Med. 2005;118 Suppl 12B:14-24.
34. Maki PM, Rubin LH, Cohen M, et al. Depressive symptoms are increased in the early perimenopausal stage in ethnically diverse human immunodeficiency virus-infected and human immunodeficiency virus-uninfected women. Menopause. 2012;19: 1215-1233.
35. Dennerstein L, Dudley EC, Hopper JL, et al. A prospective population-based study of menopausal symptoms. Obstet Gynecol. 2000;96:351-358.
36. Palma F, Volpe A, Villa P, et al. Vaginal atrophy of women in postmenopause. Results from a multicentric observational study: The AGATA study. Maturitas. 2016;83:40-44.
37. Cutler WB, Garcia CR, McCoy N. Perimenopausal sexuality. Arch Sex Behav. 1987;16:225-234.
38. Moreira ED, Glasser DB, Nicolosi A, et al. GSSAB Investigators’ Group. Sexual problems and help-seeking behavior in adults in the United Kingdom and continental Europe. BJU Int. 2008;101:1005-1111.
39. MacBride MB, Rhodes DJ, Shuster LT. Vulvovaginal atrophy. Mayo Clin Proc. 2010;85:87-94.
40. Nappi RE, Kokot-Kierepa M. Women’s voices in the menopause: results from an international survey on vaginal atrophy. Maturitas. 2010;67:233-238.
41. Santoro N, Komi J. Prevalence and impact of vaginal symptoms among postmenopausal women. J Sex Med. 2009;6:2133-2142.
42. Valadares AL, Pinto-Neto AM, Conde DM, et al. A population-based study of dyspareunia in a cohort of middle-aged Brazilian women. Menopause. 2008;15:1184-1190.
43. Latthe P, Migini L, Gray R, et al. Factors predisposing women to chronic pelvic pain: a systemic review. BMJ. 2006;332:749-755.
44. Potter DA, Moreno A, Luther MF, et al. Effects of follicular-phase cocaine administration on menstrual and ovarian cyclicity in rhesus monkeys. Am J Obstet Gynecol. 1998;178:118-125.
45. Valadares AL, Pinto-Neto AM, Gomes D, et al. Dyspareunia in HIV-positive and HIV-negative middle-aged women: a cross-sectional study. BMJ Open. 2014;4:e004974.
46. Bromberger JT, Meyer PM, Kravitz HM, et al. Psychologic distress and natural menopause: a multiethnic community study. Am J Public Health. 2001;91:1435-1442.
47. Avis NE, Brambilla D, McKinlay SM, Vass K. A longitudinal analysis of the association between menopause and depression. Results from the Massachusetts Women’s Health Study. Ann Epidemiol. 1994;4:214-220.
48. Freeman EW, Sammel MD, Lin H, Nelson DB. Associations of hormones and menopausal status with depressed mood in women with no history of depression. Arch Gen Psychiatry. 2006; 63:375-382.
49. Eller LS, Corless I, Bunch EH, et al. Self-care strategies for depressive symptoms in people with HIV disease. J Adv Nurs. 2005;51:119-130.
50. Fuh JL, Wang SJ, Lee SJ, et al. A longitudinal study of cognition change during early menopausal transition in a rural community. Maturitas. 2006;53:447-453.
51. Hinkin CH, Castellon SA, Atkinson JH, et al. Neuropsychiatric aspects of HIV infection among older adults. J Clin Epidemiol. 2001;54:S44-S52
52. Kravitz HM, Ganz PA, Bromberger J, et al. Sleep difficulty in women at midlife: a community survey of sleep and the menopausal transition. Menopause. 2003;10:19-28.
53. Freedman RR, Roehrs TA. Effects of REM sleep and ambient temperature on hot flash-induced sleep disturbance. Menopause. 2006;13:576-583.
54. Erlik Y, Tataryn IV, Meldrum DR, et al. Association of waking episodes aspects of HIV infection among older adults. J Clin Epidemiol. 2001;54:S44–52.
55. Lui-Filho JF, Valadares AR, Gomes D, et al. Menopausal symptoms and associated factors in HIV-positive women. Maturitas. 2013;76:172-178.
56. Management of symptomatic vulvovaginal atrophy: 2013 position statement of The North American Menopause Society. Menopause. 2013;20:888‐904.
57. Fernandes T, Pedro AO, Baccaro LF, et al. Hormonal, metabolic, and endometrial safety of testosterone vaginal cream versus estrogens for the treatment of vulvovaginal atrophy in postmenopausal women: a randomized, placebo-controlled study. Menopause. 2018; 25:641‐647.
58. Kroll R, Archer DF, Lin Y, et al. A randomized, multicenter, double-blind study to evaluate the safety and efficacy of estradiol vaginal cream 0.003% in postmenopausal women with dyspareunia as the most bothersome symptom. Menopause. 2018;25:133‐138.
59. Panel on Antiretroviral Guidelines for Adults and Adolescents. Guidelines for the use of antiretroviral agents in adults and adolescents with HIV. Department of Health and Human Services. Tables 21a-d.www.aidsinfo.nih.gov/ContentFiles/ AdultandAdolescentGL.pdf. Accessed May 4, 2020.
60. Tittle, V, Bull, L, Boffito, M. Pharmacokinetic and pharmacodynamics drug interactions between antiretrovirals and oral contraceptives. Clin Pharmacokinet. 2015;54:23-34.
61. Sower M, Zheng H, Tomey K, et al. Changes in body composition in women over six years at midlife: ovarian and chronological aging. J Clin Endocrin Metab. 2007;92:895- 901.
62. Eyawo O, Brockman G, Goldsmith CH, et al. Risk of myocardial infarction among people living with HIV: an updated systematic review and meta-analysis. BMJ Open. 2019;9:e025874.
63. Flooris-Moore M, Howard AA, Lo Y, et al. Increased serum lipids are associated with higher CD4 lymphocyte count in HIV-infected women. HIV Med. 2006;7:421-430.
64. Hadigan C, Meigs JB, Corcoran C, et al. Metabolic abnormalities and cardiovascular disease risk factors in adults with human immunodeficiency virus infection and lipodystrophy. Clin Infect Dis. 2001;32:130-139.
65. Grinspoon S, Carr A. Cardiovascular risk and body fat abnormalities in HIV-infected adults. N Engl J Med. 2005; 352:48–62.
66. Study of Fat Redistribution and Metabolic Change in HIV Infection (FRAM). Fat distribution in women with HIV infection. J Acquir Immune Defic Syndr. 2006;42:562-571.
67. Alcaide ML, Parmigiani A, Pallikkuth S, et al. Immune activation in HIV-infected aging women on antiretrovirals--implications for age-associated comorbidities: a cross-sectional pilot study. PLoS One. 2013;8:e63804.
68. Karim R, Mack WJ, Kono N, et al. Gonadotropin and sex steroid levels in HIV-infected premenopausal women and their association with subclinical atherosclerosis in HIV-infected and -uninfected women in the women’s interagency HIV study (WIHS). J Clin Endocrinol Metab. 2013;98:E610‐E618.
69. Looby SE, Fitch KV, Srinivasa S, et al. Reduced ovarian reserve relates to monocyte activation and subclinical coronary atherosclerotic plaque in women with HIV. AIDS. 2016;30:383‐393.
70. Akhter MP, Lappe JM, Davies KM, et al. Transmenopausal changes in the trabecular bone structure. Bone. 2007;41:111-116.
71. Gibellini D, De Crignis E, Ponti C. HIV-1 triggers apoptosis in primary osteoblasts and HOBIT cells through TNF-alpha activation. J Med Virol. 2008;80:1507-1514.
72. Cassetti I, Madruga JV, Suleiman JM, et al. The safety and efficacy of tenofovir DF in combination with lamivudine and efavirenz through 6 years in antiretroviral-naive HIV- 1-infected patients. HIV Clin Trials. 2007;8:164-172.
73. McComsey GA, Kitch D, Daar ES, et al. Bone mineral density and fractures in antiretroviral-naive persons randomized to receive abacavir-lamivudine or tenofovir disoproxil fumarate-emtricitabine along with efavirenz or atazanavir-ritonavir: AIDS Clinical Trials Group A5224s, a substudy of ACTG A5202. J Infect Dis. 2011;203: 1791-1801.
74. Hansen AB, Obel N, Nielsen H, et al. Bone mineral density changes in protease inhibitor-sparing vs. nucleoside reverse transcriptase inhibitor-sparing highly active antiretroviral therapy: Data from a randomized trial. HIV Med. 2011;12:157-165.
75. FDao CN, Patel P, Overton ET, et al. Study to understand the natural history of HIV and AIDS in the era of effective therapy (SUN) investigators. Low vitamin D among HIV-infected adults: prevalence of and risk factors for low vitamin D levels in cohort of HIV-infected adults and comparison to prevalence among adults in the US general population. Clin Infect Dis. 2011;52:396-405.
76. Jacobson DL, Spiegelman D, Know TK, Wilson IB. Evolution and predictors of change in total bone mineral density over time in HIV-infected men and women in the nutrition for healthy living study. J Acquir Immune Defic Syndr Hum Retrovirol. 2008;49:298-308.
77. Kanis JA, Borgstrom F, De Laet C, et al. Assessment of fracture risk. Osteoporosis Int. 2005;16:581-589.
78. Pedrazzoni M, Vescovi L, Maninetti M, et al. Effects of chronic heroine abuse on bone and mineral metabolism. Acta Endocrinol. 1993;129:42-45.
79. Lo Re V 3rd, Guaraldi G, Leonard MB, et al. Viral hepatitis is associated with reduced bone mineral density in HIV-infected women but not men. AIDS. 1990;23:2191-2198.
80. Bregigeon S, Galinier A, Zaegel-Faucher O, et al. Frailty in HIV infected people: a new risk factor for bone mineral density loss [published correction appears in AIDS. AIDS. 2017;31: 1573‐1577.
81. Mills A, Arribas JR, Andrade-Villanueva J, et al. Switching from tenofovir disoproxil fumarate to tenofovir alafenamide in antiretroviral regimens for virologically suppressed adults with HIV-1 infection: a randomised, active-controlled, multicentre, open-label, phase 3, non-inferiority study. Lancet Infect Dis. 2015;16:43-45.
82. King EM, Nesbitt A, Albert AYK, et al. Prolonged amenorrhea and low hip bone mineral density in women living with HIV-a controlled cross-sectional study. J Acquir Immune Defic Syndr. 2020;83:
486‐495.
83. Yin MT, Mcmahon DJ, Ferris DC, et al. Low bone mass and high bone turnover in postmenopausal human immunodeficiency virus-infected women. J Clin Endocrinol Metab. 2010;95:620-629.
84. Yin MT, Modarresi R, Shane E, et al. Effects of HIV infection and antiretroviral therapy with ritonavir on induction of osteoclast-like cells in postmenopausal women. Osteoporos Int. 2011;22:1459-1466.
85. Sharma A, Cohen HW, Freeman R, et al. Prospective evaluation of bone mineral density among middle-aged HIV-infected and uninfected women: association between methadone use and bone loss. Maturitas. 2011;70:295-301.
86. Sharma A, Flom PL, Rosen CJ, et al. Racial differences in bone loss and relation to menopause among HIV-infected and uninfected women. Bone. 2015;77:24-30.
87. Aberg JA, Gallant JE, Ghanem KG, et al, Infectious Diseases Society of America. Primary care guidelines for the management of persons infected with HIV: 2013 update by the HIV medicine association of the Infectious Diseases Society of America. Clin Infect Dis. 2014;58:1‐10.
88. National Osteoporosis Foundation. Clinician’s guide to prevention and treatment of osteoporosis 2014. Washington, DC: National Osteoporosis Foundation; 2014.
89. Yin MT, Choudhury A, Bucovsky M, et al. A randomized placebo-controlled trial of low- versus moderate-dose vitamin d3 supplementation on bone mineral density in postmenopausal women with HIV. J Acquir Immune Defic Syndr. 2019;80:342-349.
90. McComsey GA, Tebas P, Shane E, et al. Bone disease in HIV infection: a practical review and recommendations for HIV care providers. Clin Infect Dis. 2010;51:937-946.
91. Price RW. Neurological complications of HIV infection. Lancet. 1996;348:445-452.
92. Soares CN, Maki PM. Menopausal transition, mood, and cognition: an integrated view to close the gaps. Menopause. 2010;17:812-814.
93. Greendale GA, Wight RG, Huang MH, et al. Menopause-associated symptoms and cognitive performance: results from the study of women’s health across the nation. Am J Epidemiol. 2010;171:1214-1224.
94. Rubin LH, Sundermann EE, Cook JA, et al. An investigation of menopausal stage and symptoms on cognition in HIV-infected women. Menopause. 2014;21:997-1006.
95. Ellerbrock TV, Chiasson MA, Bush TJ, et al. Incidence of cervical squamous intraepithelial lesions in HIV-infected women. JAMA. 2000;283:1031-1037.
96. Mandelblatt JS, Kanetsky P, Eggert L, et al. Is HIV infection a cofactor for cervical squamous cell neoplasia? Cancer Epidemiol Biomarkers Prev. 1999;8:97-106.
97. Kim SC, Messing S, Shah K, et al. Effects of highly active antiretroviral therapy (HAART) and menopause on risk of progression of cervical dysplasia in human immune deficiency virus (HIV) infected women. Infect Dis Obstet Gynecol. 2013;2013:784718.
98. Ceccaldi PF, Ferreira C, Coussy F, et al. Cervical disease in postmenopausal HIV-1 infected women. J Gynecol Obstet Biol Reprod. 2010;39:466-470.
99. Centers for Disease Control and Prevention. HIV and older Americans. www.cdc.gov/hiv/group/age/olderamericans/index.html. Accessed May 11, 2020.
100. Levy JA, Ory MG, Crystal S. HIV/AIDS interventions for midlife and older adults: current status and challenges. J Acquir Immune Defic Syndr. 2003;33 Suppl 2:S59-S67.
101. Thurman AR, Yousefieh N, Chandra N, et al. Comparison of mucosal markers of human immunodeficiency virus susceptibility in healthy premenopausal versus postmenopausal women. AIDS Res Hum Retroviruses. 2017;33:807-819.
102. Meditz AL, Moreau KL, MaWhinney S, et al. CCR5 expression is elevated on endocervical CD4+ T cells in healthy postmenopausal women. J Acquir Immune Defic Syndr. 2012;59:221-228.
103. Chappell CA, Isaacs CE, Xu W, et al. The effect of menopause on the innate antiviral activity of cervicovaginal lavage. Am J Obstet Gynecol. 2015;213:204.
104. Nicol MR, Brewers LM, Kashuba ADM, et al. The role of menopause in tenofovir diphosphate and emtricitabine triphosphate concentrations in cervical tissue. AIDS. 2018;32:11-15.
105. Melo KC, Melo MR, Ricci BV, Segurado AC. Correlates of human immunodeficiency virus cervicovaginal shedding among postmenopausal and fertile-aged women. Menopause. 2012;19:150-156.
106. Landolt NK, Do T, Kasipong N, et al. Low-level genital HIV shedding in Thai HIV-infected women with suppressed plasma viral load after menopause: a longitudinal study. J Virus Erad. 2017;3:204-207.
107. Viard JP, Mocroft A, Chiesi A, et al. Influence of age of CD4 cell recovery in human immunodeficiency virus-infected patients receiving highly active antiretroviral therapy: evidence from the Euro SIDA study. J Infect Dis. 2001;193:1290-1294.
108. Grabar S, Kousignian I, Sobel A, et al. Immunological and clinical responses to highly active antiretroviral therapy over 50 years of age. Results from the French Hospital Database on HIV. AIDS. 2004;18:2029-2038.
109. Cuzin L, Delpierre C, Gerard S, et al. Immunologic and clinical responses to highly active antiretroviral therapy in patients with HIV infection aged >50 years. Clin Infect Dis. 2007;45:654-657.
110. Patterson KB, Cohn SE, Uynik J, et al. Treatment responses in antiretroviral treatment-naïve premenopausal and postmenopausal HIV-1 infected women: an analysis from AIDS clinical trials group studies. Clin Infect Dis. 2009;49:473476.
111. van Benthem BH, Vernazza P, Coutinho RA, et al. The impact of pregnancy and menopause on CD4 lymphocyte count in HIV-infected women. AIDS. 2002;16:919-922.
Entheseal lesions, bone density linked with incident PsA in psoriasis patients
Structural entheseal lesions and reduced bone mineral density detected using high-resolution CT imaging of a pair of knuckle joints in patients with psoriasis strongly linked with subsequent development of psoriatic arthritis (PsA) in a single-center study with 114 patients followed for an average of 2.3 years.

“These findings substantiate the concept of mechano-inflammation in the pathogenesis of psoriatic disease,” and suggest that interventions with high efficacy for controlling entheseal inflammation may be a “particularly valuable strategy in interfering with the onset of PsA in patients with psoriatic disease,” David Simon, MD, said at the annual European Congress of Rheumatology, held online this year due to COVID-19.
The study, which is now published in Arthritis & Rheumatology, began with 377 patients with psoriasis who had been referred to the University Hospital in Erlangen, Germany, during 2011-2018, and who tested positive on the German Psoriasis Arthritis Diagnostic questionnaire. The researchers excluded patients with existing signs of PsA, any arthritis or enthesitis or other signs of inflammatory rheumatic disease, and they also excluded patients who had not undergoing a high-resolution peripheral quantitative CT (HR-pQCT) examination of the second and third metacarpal joints of the patient’s nondominant hand, which left 114 patients for their analysis. During a mean follow-up of 28 months, 24 patients (27%) developed PsA. The study patients were an average age of 45 years, and they had been diagnosed with psoriasis for an average of about 16 years.
Dr. Simon and associates used the baseline HR-pQCT scans to make two assessments of each patient: the presence of structural entheseal lesions (SEL) in the two metacarpal joints and the calculated volumetric bone mineral density (vBMD). Their analysis showed that the number and severity of SEL were increased among patients who later developed PsA. In a multivariable model that adjusted for age, sex, body mass index, duration of psoriasis, and arthralgia, patients with any SEL had a fivefold higher rate of developing PsA, compared with patients with no SEL, reported Dr. Simon, a rheumatologist at Erlangen University Hospital.
The analysis of vBMD also showed a strong link between bone density at the entheseal sites of the two studied joints and subsequent PsA development. For every standard deviation increase in vBMD at these sites the subsequent rate of PsA incidence fell by about 67% in an analysis that controlled for the same covariants as well as presence of SEL. The same relationship between higher vBMD and a lower risk for PsA held for both total vBMD measurement and for cortical vBMD, but only at the entheseal site. Levels of vBMD at the intra-articular site of the joints had no statistically significant relationship with subsequent PsA development.
The two metrics also appeared to identify additive risks. Nearly 90% of patients with at least one SEL who also had low vBMD at the entheseal site developed PsA during follow-up, compared with about a 50% rate among patients with at least one SEL but high vBMD.
The imaging method used to run these analyses, HR-pQCT, remains for the time being a “research technique” that “is not generalizable for routine practice,” but further development of this method or of a surrogate measure might make it feasible for future widespread practice, commented Iain McInnes, MD, PhD, president of the European League Against Rheumatism and professor of rheumatology and director of the Institute of Infection, Immunity, and Inflammation at the University of Glasgow.
“We’ve thought for many years that psoriasis and psoriatic arthritis are on a spectrum, and this work is consistent with the idea that some patients with psoriasis develop tissue involvement at entheses and joints,” Dr. McInnes said in an interview. The higher incidence of PsA seen in patients with adverse SEL and vBMD markers was in an “interesting range” that warrants further study. A next step is to run an intervention study in which patients with these adverse markers would receive an intervention randomized against placebo to see if it improved their outcomes, he suggested. Good candidate agents to study in psoriasis patients who have these adverse markers include drugs that inhibit the action of interleukin-17, drugs that target the p19 cytokine subunit of IL-23, and possibly Janus kinase inhibitor drugs.
Dr. Simon has been a consultant to AbbVie and Eli Lilly, a speaker on behalf of Eli Lilly, Janssen, and Novartis, and has received research funding from Eli Lilly and Novartis. Dr. McInnes has been a consultant to AbbVie, Bristol-Myers Squibb, Celgene, Eli Lilly, Gilead, Janssen, Novartis, Pfizer, and UCB, and he has received research funding from Bristol-Myers Squibb, Celgene, Eli Lilly, Janssen, and UCB.
SOURCE: Simon D et al. Ann Rheum Dis. 2020 Jun;79[suppl 1]:33-4, Abstract OP0051.
Structural entheseal lesions and reduced bone mineral density detected using high-resolution CT imaging of a pair of knuckle joints in patients with psoriasis strongly linked with subsequent development of psoriatic arthritis (PsA) in a single-center study with 114 patients followed for an average of 2.3 years.
“These findings substantiate the concept of mechano-inflammation in the pathogenesis of psoriatic disease,” and suggest that interventions with high efficacy for controlling entheseal inflammation may be a “particularly valuable strategy in interfering with the onset of PsA in patients with psoriatic disease,” David Simon, MD, said at the annual European Congress of Rheumatology, held online this year due to COVID-19.
The study, which is now published in Arthritis & Rheumatology, began with 377 patients with psoriasis who had been referred to the University Hospital in Erlangen, Germany, during 2011-2018, and who tested positive on the German Psoriasis Arthritis Diagnostic questionnaire. The researchers excluded patients with existing signs of PsA, any arthritis or enthesitis or other signs of inflammatory rheumatic disease, and they also excluded patients who had not undergoing a high-resolution peripheral quantitative CT (HR-pQCT) examination of the second and third metacarpal joints of the patient’s nondominant hand, which left 114 patients for their analysis. During a mean follow-up of 28 months, 24 patients (27%) developed PsA. The study patients were an average age of 45 years, and they had been diagnosed with psoriasis for an average of about 16 years.
Dr. Simon and associates used the baseline HR-pQCT scans to make two assessments of each patient: the presence of structural entheseal lesions (SEL) in the two metacarpal joints and the calculated volumetric bone mineral density (vBMD). Their analysis showed that the number and severity of SEL were increased among patients who later developed PsA. In a multivariable model that adjusted for age, sex, body mass index, duration of psoriasis, and arthralgia, patients with any SEL had a fivefold higher rate of developing PsA, compared with patients with no SEL, reported Dr. Simon, a rheumatologist at Erlangen University Hospital.
The analysis of vBMD also showed a strong link between bone density at the entheseal sites of the two studied joints and subsequent PsA development. For every standard deviation increase in vBMD at these sites the subsequent rate of PsA incidence fell by about 67% in an analysis that controlled for the same covariants as well as presence of SEL. The same relationship between higher vBMD and a lower risk for PsA held for both total vBMD measurement and for cortical vBMD, but only at the entheseal site. Levels of vBMD at the intra-articular site of the joints had no statistically significant relationship with subsequent PsA development.
The two metrics also appeared to identify additive risks. Nearly 90% of patients with at least one SEL who also had low vBMD at the entheseal site developed PsA during follow-up, compared with about a 50% rate among patients with at least one SEL but high vBMD.
The imaging method used to run these analyses, HR-pQCT, remains for the time being a “research technique” that “is not generalizable for routine practice,” but further development of this method or of a surrogate measure might make it feasible for future widespread practice, commented Iain McInnes, MD, PhD, president of the European League Against Rheumatism and professor of rheumatology and director of the Institute of Infection, Immunity, and Inflammation at the University of Glasgow.
“We’ve thought for many years that psoriasis and psoriatic arthritis are on a spectrum, and this work is consistent with the idea that some patients with psoriasis develop tissue involvement at entheses and joints,” Dr. McInnes said in an interview. The higher incidence of PsA seen in patients with adverse SEL and vBMD markers was in an “interesting range” that warrants further study. A next step is to run an intervention study in which patients with these adverse markers would receive an intervention randomized against placebo to see if it improved their outcomes, he suggested. Good candidate agents to study in psoriasis patients who have these adverse markers include drugs that inhibit the action of interleukin-17, drugs that target the p19 cytokine subunit of IL-23, and possibly Janus kinase inhibitor drugs.
Dr. Simon has been a consultant to AbbVie and Eli Lilly, a speaker on behalf of Eli Lilly, Janssen, and Novartis, and has received research funding from Eli Lilly and Novartis. Dr. McInnes has been a consultant to AbbVie, Bristol-Myers Squibb, Celgene, Eli Lilly, Gilead, Janssen, Novartis, Pfizer, and UCB, and he has received research funding from Bristol-Myers Squibb, Celgene, Eli Lilly, Janssen, and UCB.
SOURCE: Simon D et al. Ann Rheum Dis. 2020 Jun;79[suppl 1]:33-4, Abstract OP0051.
FROM THE EULAR 2020 E-CONGRESS