User login
What to do when stimulants fail for ADHD
NEW ORLEANS – A variety of reasons can contribute to the failure of stimulants to treat ADHD in children, such as comorbidities, missed diagnoses, inadequate medication dosage, side effects, major life changes, and other factors in the home or school environments, said Alison Schonwald, MD, of Harvard Medical School, Boston.

Stimulant medications indicated for ADHD usually work in 70%-75% of school-age children, but that leaves one in four children whose condition can be more challenging to treat, she said.
“Look around you,” Dr. Schonwald told a packed room at the annual meeting of the American Academy of Pediatrics. “You’re not the only one struggling with this topic.” She sprinkled her presentation with case studies of patients with ADHD for whom stimulants weren’t working, examples that the audience clearly found familiar.
The three steps you already know to do with treatment-resistant children sound simple: assess the child for factors linked to their poor response; develop a new treatment plan; and use Food and Drug Administration-approved nonstimulant medications, including off-label options, in a new plan.
But in the office, the process can be anything but simple when you must consider school and family environments, comorbidities, and other factors potentially complicating the child’s ability to function well.
Comorbidities
To start, Dr. Schonwald provided a chart of common coexisting problems in children with ADHD that included the recommended assessment and intervention:
- Mood and self-esteem issues call for the depression section of the patient health questionnaire (PHQ9) and Moods and Feelings questionnaire (MFQ), followed by interventions such as individual and peer group therapy and exercise.
- Anxiety can be assessed with the Screen for Child Anxiety Related Disorders (SCARED) and Spence Children’s Anxiety Scale, then treated similarly to mood and self-esteem issues.
- Bullying or trauma require taking a history during an interview, and treatment with individual and peer group therapy.
- Substance abuse should be assessed with the CRAFFT screening tool (Car, Relax, Alone, Forget, Friends, Trouble) and Screening to Brief Intervention (S2BI) Tool, then treated according to best practices.
- Executive function, low cognitive abilities, and poor adaptive skills require a review of the child’s Individualized Education Program (IEP) testing, followed by personalized school and home interventions.
- Poor social skills, assessed in an interview, also require personalized interventions at home and in school.
Doctors also may need to consider other common comorbidities in children with ADHD, such as bipolar disorder, depression, learning disabilities, oppositional defiant disorder, and tic disorders.
Tic disorders typically have an onset around 7 years old and peak in midadolescence, declining in late teen years. An estimated 35%-90% of children with Tourette syndrome have ADHD, Dr. Schonwald said (Dev Med Child Neurol. 2006 Jul;48[7]:616-21).
Managing treatment with stimulants
A common dosage amount for stimulants is 2.5-5 mg, but that dose may be too low for children, Dr. Schonwald said. She recommended increasing it until an effect is seen and stopping at the effective dose level the child can tolerate. The maximum recommended by the FDA is 60 mg/day for short-acting stimulants and 72 mg/day for extended-release ones, but some research has shown dosage can go even higher without causing toxic effects (J Child Adolesc Psychopharmacol. 2010 Feb;20[1]:49-54).
Dr. Schonwald also suggested trying both methylphenidate and amphetamine medication, while recognizing the latter tends to have more stimulant-related side effects.
Adherence is another consideration because multiple studies show high rates of noncompliance or discontinuation, such as up to 19% discontinuation for long-acting and 38% for short-acting stimulants (J Clin Psychiatry. 2015 Nov;76(11):e1459-68; Postgrad Med. 2012 May;124(3):139-48). A study of a school cohort in Philadelphia found only about one in five children were adherent (J Am Acad Child Adolesc Psychiatry. 2011 May;50[5]:480-9).
One potential solution to adherence challenges are pill reminder smartphone apps, such as Medisafe Medication Management, Pill Reminder-All in One, MyTherapy: Medication Reminder, and CareZone.
Dr. Schonwald noted several factors that can influence children’s response to stimulants. Among children with comorbid intellectual disability, for example, the response rate is lower than the average 75% of children without the disability, hovering around 40%-50% (Res Dev Disabil. 2018 Dec;83:217-32). Those who get more sleep tend to have improved attention, compared with children with less sleep (Atten Defic Hyperact Disord. 2017 Mar;9[1]:31-38).
She also offered strategies to manage problematic adverse effects from stimulants. Those experiencing weight loss can take their stimulant after breakfast, drink whole milk, and consider taking drug holidays.
To reduce stomachaches, children should take their medication with food, and you should look at whether the child is taking the lowest effective dose they can and whether anxiety may be involved. Similarly, children with headaches should take stimulants with food, and you should look at the dosage and ask whether the patient is getting adequate sleep.
Strategies to address difficulty falling asleep can include taking the stimulant earlier in the day or switching to a shorter-acting form, dexmethylphenidate, or another stimulant. If they’re having trouble staying asleep, inquire about sleep hygiene, and look for associations with other factors that might explain why the child is experiencing new problems with staying asleep. If these strategies are unsuccessful, you can consider prescribing melatonin or clonidine.
Alternatives to stimulants
Several medications besides stimulants are available to prescribe to children with ADHD if they aren’t responding adequately to stimulants, Dr. Schonwald said.
Atomoxetine performed better than placebo in treatment studies, with similar weight loss effects, albeit the lowest mean effect size in clinician ratings (Lancet Psychiatry. 2018 Sep;5[9]:727-38). Dr. Schonwald recommended starting atomoxetine in children under 40 kg at 0.5 mg/kg for 4 days, then increasing to 1.2 mg/kg/day. For children over 40 kg, the dose can start at 40 mg. Maximum dose can range from 1.4 to 1.8 mg/kg or 100 mg/day.
About 7% of white children and 2% of African American children are poor metabolizers of atomoxetine, and the drug has interactions with dextromethorphan, fluoxetine, and paroxetine, she noted. Side effects can include abdominal pain, dry mouth, fatigue, mood swings, nausea, and vomiting.
Two alpha-adrenergics that you can consider are clonidine and guanfacine. Clonidine, a hypotensive drug given at a dose of 0.05-0.2 mg up to three times a day, is helpful for hyperactivity and impulsivity rather than attention difficulties. Side effects can include depression, headache, rebound hypertension, and sedation, and it’s only FDA approved for ages 12 years and older.
An extended release version of clonidine (Kapvay) is approved for monotherapy or adjunctive therapy for ADHD; it led to improvements in ADHD–Rating Scale-IV scores as soon as the second week in an 8-week randomized controlled trial. Mild to moderate somnolence was the most common adverse event, and changes on electrocardiograms were minor (J Am Acad Child Adolesc Psychiatry. 2011 Feb;50[2]:171-9).
Guanfacine, also a hypotensive drug, given at a dose of 0.5-2 mg up to three times a day, has fewer data about its use for ADHD but appears to treat attention problems more effectively than hyperactivity. Also approved only for ages 12 years and older, guanfacine is less sedating, and its side effects can include agitation, headache , and insomnia. An extended-release version of guanfacine (brand name Intuniv) showed statistically significant reductions in ADHD Rating Scale-IV scores in a 9-week, double-blind, randomized, controlled trial. Side effects including fatigue, sedation, and somnolence occurred in the first 2 weeks but generally resolved, and participants returned to baseline during dose maintenance and tapering (J Am Acad Child Adolesc Psychiatry. 2009 Feb;48[2]:155-65).
Intuniv doses should start at 1 mg/day and increase no more than 1 mg/week, Dr. Schonwald said, until reaching a maintenance dose of 1-4 mg once daily, depending on the patient’s clinical response and tolerability. Children also must be able to swallow the pill whole.
Treating preschoolers
Preschool children are particularly difficult to diagnose given their normal range of temperament and development, Dr. Schonwald said. Their symptoms could be resulting from another diagnosis or from circumstances in the environment.
You should consider potential comorbidities and whether the child’s symptoms are situational or pervasive. About 55% of preschoolers have at least one comorbidity, she said (Infants & Young Children. 2006 Apr-Jun;19[2]:109-122.)
That said, stimulants usually are effective in very young children whose primary concern is ADHD. In a randomized controlled trial of 303 preschoolers, significantly more children experienced reduced ADHD symptoms with methylphenidate than with placebo. The trial’s “data suggest that preschoolers with ADHD need to start with low methylphenidate doses. Treatment may best begin using methylphenidate–immediate release at 2.5 mg twice daily, and then be increased to 7.5 mg three times a day during the course of 1 week. The mean optimal total daily [methylphenidate] dose for preschoolers was 14.2 plus or minus 8.1 mg/day” (J Am Acad Child Adolesc Psychiatry. 2006 Nov;45[11]:1284-93).
In treating preschoolers, if the patient’s symptoms appear to get worse after starting a stimulant, you can consider a medication change. If symptoms are much worse, consider a lower dose or a different stimulant class, or whether the diagnosis is appropriate.
Five common components of poor behavior in preschoolers with ADHD include agitation, anxiety, explosively, hyperactivity, and impulsivity. If these issues are occurring throughout the day, consider reducing the dose or switching drug classes.
If it’s only occurring in the morning, Dr. Schonwald said, optimize the morning structure and consider giving the medication earlier in the morning or adding a short-acting booster. If it’s occurring in late afternoon, consider a booster and reducing high-demand activities for the child.
If a preschooler experiences some benefit from the stimulant but still has problems, adjunctive atomoxetine or an alpha adrenergic may help. Those medications also are recommended if the child has no benefit with the stimulant or cannot tolerate the lowest therapeutic dose.
Dr. Schonwald said she had no relevant financial disclosures.
NEW ORLEANS – A variety of reasons can contribute to the failure of stimulants to treat ADHD in children, such as comorbidities, missed diagnoses, inadequate medication dosage, side effects, major life changes, and other factors in the home or school environments, said Alison Schonwald, MD, of Harvard Medical School, Boston.
Stimulant medications indicated for ADHD usually work in 70%-75% of school-age children, but that leaves one in four children whose condition can be more challenging to treat, she said.
“Look around you,” Dr. Schonwald told a packed room at the annual meeting of the American Academy of Pediatrics. “You’re not the only one struggling with this topic.” She sprinkled her presentation with case studies of patients with ADHD for whom stimulants weren’t working, examples that the audience clearly found familiar.
The three steps you already know to do with treatment-resistant children sound simple: assess the child for factors linked to their poor response; develop a new treatment plan; and use Food and Drug Administration-approved nonstimulant medications, including off-label options, in a new plan.
But in the office, the process can be anything but simple when you must consider school and family environments, comorbidities, and other factors potentially complicating the child’s ability to function well.
Comorbidities
To start, Dr. Schonwald provided a chart of common coexisting problems in children with ADHD that included the recommended assessment and intervention:
- Mood and self-esteem issues call for the depression section of the patient health questionnaire (PHQ9) and Moods and Feelings questionnaire (MFQ), followed by interventions such as individual and peer group therapy and exercise.
- Anxiety can be assessed with the Screen for Child Anxiety Related Disorders (SCARED) and Spence Children’s Anxiety Scale, then treated similarly to mood and self-esteem issues.
- Bullying or trauma require taking a history during an interview, and treatment with individual and peer group therapy.
- Substance abuse should be assessed with the CRAFFT screening tool (Car, Relax, Alone, Forget, Friends, Trouble) and Screening to Brief Intervention (S2BI) Tool, then treated according to best practices.
- Executive function, low cognitive abilities, and poor adaptive skills require a review of the child’s Individualized Education Program (IEP) testing, followed by personalized school and home interventions.
- Poor social skills, assessed in an interview, also require personalized interventions at home and in school.
Doctors also may need to consider other common comorbidities in children with ADHD, such as bipolar disorder, depression, learning disabilities, oppositional defiant disorder, and tic disorders.
Tic disorders typically have an onset around 7 years old and peak in midadolescence, declining in late teen years. An estimated 35%-90% of children with Tourette syndrome have ADHD, Dr. Schonwald said (Dev Med Child Neurol. 2006 Jul;48[7]:616-21).
Managing treatment with stimulants
A common dosage amount for stimulants is 2.5-5 mg, but that dose may be too low for children, Dr. Schonwald said. She recommended increasing it until an effect is seen and stopping at the effective dose level the child can tolerate. The maximum recommended by the FDA is 60 mg/day for short-acting stimulants and 72 mg/day for extended-release ones, but some research has shown dosage can go even higher without causing toxic effects (J Child Adolesc Psychopharmacol. 2010 Feb;20[1]:49-54).
Dr. Schonwald also suggested trying both methylphenidate and amphetamine medication, while recognizing the latter tends to have more stimulant-related side effects.
Adherence is another consideration because multiple studies show high rates of noncompliance or discontinuation, such as up to 19% discontinuation for long-acting and 38% for short-acting stimulants (J Clin Psychiatry. 2015 Nov;76(11):e1459-68; Postgrad Med. 2012 May;124(3):139-48). A study of a school cohort in Philadelphia found only about one in five children were adherent (J Am Acad Child Adolesc Psychiatry. 2011 May;50[5]:480-9).
One potential solution to adherence challenges are pill reminder smartphone apps, such as Medisafe Medication Management, Pill Reminder-All in One, MyTherapy: Medication Reminder, and CareZone.
Dr. Schonwald noted several factors that can influence children’s response to stimulants. Among children with comorbid intellectual disability, for example, the response rate is lower than the average 75% of children without the disability, hovering around 40%-50% (Res Dev Disabil. 2018 Dec;83:217-32). Those who get more sleep tend to have improved attention, compared with children with less sleep (Atten Defic Hyperact Disord. 2017 Mar;9[1]:31-38).
She also offered strategies to manage problematic adverse effects from stimulants. Those experiencing weight loss can take their stimulant after breakfast, drink whole milk, and consider taking drug holidays.
To reduce stomachaches, children should take their medication with food, and you should look at whether the child is taking the lowest effective dose they can and whether anxiety may be involved. Similarly, children with headaches should take stimulants with food, and you should look at the dosage and ask whether the patient is getting adequate sleep.
Strategies to address difficulty falling asleep can include taking the stimulant earlier in the day or switching to a shorter-acting form, dexmethylphenidate, or another stimulant. If they’re having trouble staying asleep, inquire about sleep hygiene, and look for associations with other factors that might explain why the child is experiencing new problems with staying asleep. If these strategies are unsuccessful, you can consider prescribing melatonin or clonidine.
Alternatives to stimulants
Several medications besides stimulants are available to prescribe to children with ADHD if they aren’t responding adequately to stimulants, Dr. Schonwald said.
Atomoxetine performed better than placebo in treatment studies, with similar weight loss effects, albeit the lowest mean effect size in clinician ratings (Lancet Psychiatry. 2018 Sep;5[9]:727-38). Dr. Schonwald recommended starting atomoxetine in children under 40 kg at 0.5 mg/kg for 4 days, then increasing to 1.2 mg/kg/day. For children over 40 kg, the dose can start at 40 mg. Maximum dose can range from 1.4 to 1.8 mg/kg or 100 mg/day.
About 7% of white children and 2% of African American children are poor metabolizers of atomoxetine, and the drug has interactions with dextromethorphan, fluoxetine, and paroxetine, she noted. Side effects can include abdominal pain, dry mouth, fatigue, mood swings, nausea, and vomiting.
Two alpha-adrenergics that you can consider are clonidine and guanfacine. Clonidine, a hypotensive drug given at a dose of 0.05-0.2 mg up to three times a day, is helpful for hyperactivity and impulsivity rather than attention difficulties. Side effects can include depression, headache, rebound hypertension, and sedation, and it’s only FDA approved for ages 12 years and older.
An extended release version of clonidine (Kapvay) is approved for monotherapy or adjunctive therapy for ADHD; it led to improvements in ADHD–Rating Scale-IV scores as soon as the second week in an 8-week randomized controlled trial. Mild to moderate somnolence was the most common adverse event, and changes on electrocardiograms were minor (J Am Acad Child Adolesc Psychiatry. 2011 Feb;50[2]:171-9).
Guanfacine, also a hypotensive drug, given at a dose of 0.5-2 mg up to three times a day, has fewer data about its use for ADHD but appears to treat attention problems more effectively than hyperactivity. Also approved only for ages 12 years and older, guanfacine is less sedating, and its side effects can include agitation, headache , and insomnia. An extended-release version of guanfacine (brand name Intuniv) showed statistically significant reductions in ADHD Rating Scale-IV scores in a 9-week, double-blind, randomized, controlled trial. Side effects including fatigue, sedation, and somnolence occurred in the first 2 weeks but generally resolved, and participants returned to baseline during dose maintenance and tapering (J Am Acad Child Adolesc Psychiatry. 2009 Feb;48[2]:155-65).
Intuniv doses should start at 1 mg/day and increase no more than 1 mg/week, Dr. Schonwald said, until reaching a maintenance dose of 1-4 mg once daily, depending on the patient’s clinical response and tolerability. Children also must be able to swallow the pill whole.
Treating preschoolers
Preschool children are particularly difficult to diagnose given their normal range of temperament and development, Dr. Schonwald said. Their symptoms could be resulting from another diagnosis or from circumstances in the environment.
You should consider potential comorbidities and whether the child’s symptoms are situational or pervasive. About 55% of preschoolers have at least one comorbidity, she said (Infants & Young Children. 2006 Apr-Jun;19[2]:109-122.)
That said, stimulants usually are effective in very young children whose primary concern is ADHD. In a randomized controlled trial of 303 preschoolers, significantly more children experienced reduced ADHD symptoms with methylphenidate than with placebo. The trial’s “data suggest that preschoolers with ADHD need to start with low methylphenidate doses. Treatment may best begin using methylphenidate–immediate release at 2.5 mg twice daily, and then be increased to 7.5 mg three times a day during the course of 1 week. The mean optimal total daily [methylphenidate] dose for preschoolers was 14.2 plus or minus 8.1 mg/day” (J Am Acad Child Adolesc Psychiatry. 2006 Nov;45[11]:1284-93).
In treating preschoolers, if the patient’s symptoms appear to get worse after starting a stimulant, you can consider a medication change. If symptoms are much worse, consider a lower dose or a different stimulant class, or whether the diagnosis is appropriate.
Five common components of poor behavior in preschoolers with ADHD include agitation, anxiety, explosively, hyperactivity, and impulsivity. If these issues are occurring throughout the day, consider reducing the dose or switching drug classes.
If it’s only occurring in the morning, Dr. Schonwald said, optimize the morning structure and consider giving the medication earlier in the morning or adding a short-acting booster. If it’s occurring in late afternoon, consider a booster and reducing high-demand activities for the child.
If a preschooler experiences some benefit from the stimulant but still has problems, adjunctive atomoxetine or an alpha adrenergic may help. Those medications also are recommended if the child has no benefit with the stimulant or cannot tolerate the lowest therapeutic dose.
Dr. Schonwald said she had no relevant financial disclosures.
EXPERT ANALYSIS FROM AAP 2019
Should supplemental MRI be used in otherwise average-risk women with extremely dense breasts?
While the frequency of dense breasts decreases with age, approximately 10% of women in the United States have extremely dense breasts (Breast Imaging, Reporting, and Data System [BI-RADS] category D), and another 40% have heterogeneously dense breasts (BI-RADS category C).1 Women with dense breasts have both an increased risk for developing breast cancer and reduced mammographic sensitivity for breast cancer detection compared with women who have nondense breasts.2
These 2 observations have led the majority of states to pass legislation requiring that women with dense breasts be informed of their breast density, and most require that providers discuss these results with their patients. Thoughtful clinicians who review the available literature, however, will find sparse evidence on which to counsel patients as to next steps.
Now, a recent trial adds to our knowledge about supplemental magnetic resonance imaging (MRI) breast screening in women with extremely dense breasts.
DENSE trial offers high-quality data
Bakker and colleagues studied women aged 50 to 74 who were participating in a Netherlands population-based biennial mammography screening program.3 They enrolled average-risk women with extremely dense breasts who had a negative screening digital mammogram into the Dense Tissue and Early Breast Neoplasm Screening (DENSE) multicenter trial. The women were randomly assigned to receive either continued biennial digital mammography or supplemental breast MRI.
The primary outcome was the between-group difference in the development of interval breast cancers—that is, breast cancers detected by women or their providers between rounds of screening mammography. Interval breast cancers were chosen as the primary outcome for 2 reasons:
- interval cancers appear to be more aggressive tumors than those cancers detected by screening mammography
- interval cancers can be identified over a shorter time interval, making them easier to study than outcomes such as breast cancer mortality, which typically require more than a decade to identify.
The DENSE trial’s secondary outcomes included recall rates from MRI, cancer detection rates on MRI, positive predictive value of MRIs requiring biopsy, and breast cancer characteristics (size, stage) diagnosed in the different groups.
Between-group difference in incidence of interval cancers
A total of 40,373 women with extremely dense breasts were screened; 8,061 of these were randomly assigned to receive breast MRI and 32,312 to continued mammography only (1:4 cluster randomization) across 12 mammography centers in the Netherlands. Among the women assigned to the MRI group, 59% actually underwent MRI (4,783 of the 8,061).
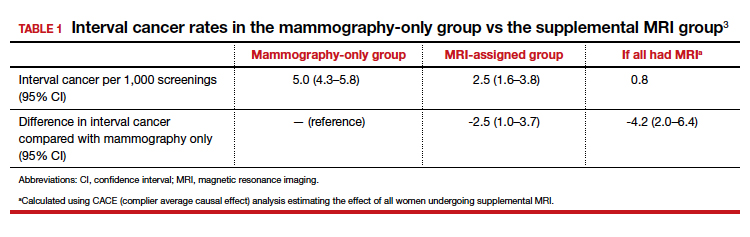
The interval cancer rate in the mammography-only group was 5.0 per 1,000 screenings (95% confidence interval [CI], 4.3–5.8), while the interval cancer rate in the MRI-assigned group was 2.5 per 1,000 screenings (95% CI, 1.6–3.8) (TABLE 1).3
Key secondary outcomes
Of the women who underwent supplemental MRI, 9.49% were recalled for additional imaging, follow-up, or biopsy. Of the 4,783 women who had an MRI, 300 (6.3%) underwent a breast biopsy, and 79 breast cancers (1.65%) were detected. Sixty-four of these cancers were invasive, and 15 were ductal carcinoma in situ (DCIS). Among women who underwent a biopsy for an MRI-detected abnormality, the positive predictive value was 26.3%.
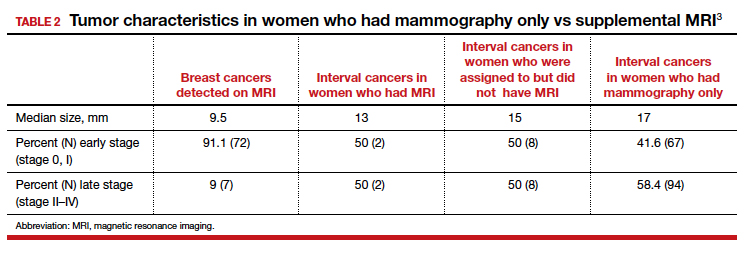
Tumor characteristics. For women who developed breast cancer during the study, both tumor size at diagnosis and tumor stage (early vs late) were described. TABLE 2 shows these results in the women who had their breast cancer detected on MRI, those in the MRI-assigned group who developed interval cancer, and those in the mammography-only group who had interval cancers.3 Overall, tumor size was smaller in the interval group who underwent MRI compared with those who underwent mammography only.
Continue to: Study contributes valuable data, but we need more on long-term outcomes...
Study contributes valuable data, but we need more on long-term outcomes
The trial by Bakker and colleagues employed a solid study design as women were randomly assigned to supplemental MRI screening or ongoing biennial mammography, and nearly all cancers were identified in the short-term of follow-up. In addition, very few women were lost to follow-up, and secondary outcomes, including false-positive rates, were collected to help providers and patients better understand some of the potential downsides of supplemental screening.
The substantial reduction in interval cancers (50% in the intent-to-screen analysis and 84% in the women who actually underwent supplemental MRI) was highly statistically significant (P<.001). While there were substantially fewer interval cancers in the MRI-assigned group, the interval cancers that did occur were of similar stage as those in the women assigned to the mammography-only group (TABLE 2).
Data demonstrate that interval cancers appear to be more aggressive than screen-detected cancers.4 While reducing interval cancers should be a good thing overall, it remains unproven that using supplemental MRI in all women with dense breasts would reduce breast cancer specific mortality, all-cause mortality, or the risk of more invasive treatments (for example, the need for chemotherapy or requirement for mastectomy).
On the other hand, using routine supplemental breast MRI in women with extremely dense breasts would result in very substantial use of resources, including cost, radiologist time, provider time, and machine time. In the United States, approximately 49 million women are aged 50 to 74.5 Breast MRI charges commonly range from $1,000 to $4,000. If the 4.9 million women with extremely dense breasts underwent supplemental MRI this year, the approximate cost would be somewhere between $4.9 and $19.5 billion for imaging alone. This does not include callbacks, biopsies, or provider time for ordering, interpreting, and arranging for follow-up.
While the reduction in interval cancers seen in this study is promising, more assurance of improvement in important outcomes—such as reduced mortality or reduced need for more invasive breast cancer treatments—should precede any routine change in practice.
Unanswered questions
This study did not address a number of other important questions, including:
Should MRI be done with every round of breast cancer screening given the possibility of prevalence bias? Prevalence bias can be defined as more cancers detected in the first round of MRI screening with possible reduced benefit in future rounds of screening. The study authors indicated that they will continue to analyze the study results to see what occurs in the next round of screening.
Is there a similar impact on decreased interval cancers in women undergoing annual mammography or in women screened between ages 40 and 49? This study was conducted in women aged 50 to 74 undergoing mammography every 2 years. In the United States, annual mammography in women aged 40 to 49 is frequently recommended.
What effect does supplemental MRI screening have in women with heterogeneously dense breasts, which represents 40% of the population? The US Food and Drug Administration recommends that all women with dense breasts be counseled regarding options for management.6
Do these results translate to the more racially and ethnically diverse populations of the United States? In the Netherlands, where this study was conducted, 85% to 90% of women are either Dutch or of western European origin. Women of different racial and ancestral backgrounds have biologically different breast cancers and cancer risk (for example, higher rates of triple-negative breast cancers in African American women; 10-fold higher rates of BRCA pathogenic variants in Ashkenazi Jewish women).
Continue to: Use validated tools to assess risk comprehensively...
Use validated tools to assess risk comprehensively
Women aged 50 to 74 with extremely dense breasts have reduced interval cancers following a normal biennial mammogram if supplemental MRI is offered, but the long-term benefit of identifying these cancers earlier is unclear. Until more data are available on important long-term outcomes (such as breast cancer mortality and need for more invasive treatments), providers should consider breast density in the context of a more comprehensive assessment of breast cancer risk using a validated breast cancer risk assessment tool.
I prefer the modified version of the International Breast Cancer Intervention Study (IBIS) tool, which is readily available online (https://ibis.ikonopedia.com/).7 This tool incorporates several breast cancer risk factors, including reproductive risk factors, body mass index, BRCA gene status, breast density, and family history. The tool takes 1 to 2 minutes to complete and provides an estimate of a woman’s 10-year risk and lifetime risk of breast cancer.
If the lifetime risk exceeds 20%, I offer the patient supplemental MRI screening, consistent with current recommendations of the National Comprehensive Cancer Network and the American Cancer Society.8,9 I generally recommend starting breast imaging screening 7 to 10 years prior to the youngest breast cancer occurrence in the family, with mammography starting no earlier than age 30 and MRI no earlier than age 25. Other validated tools also can be used.10-13
Incorporating breast density and other important risk factors allows a more comprehensive analysis upon which to counsel women about the value (benefits and harms) of breast imaging.8
- Sprague BL, Gagnon RE, Burt V, et al. Prevalence of mammographically dense breasts in the United States. J Natl Cancer Inst. 2014;106:dju255. doi: 10.1093/jcni/dju255.
- Boyd NF, Guo H, Martin LJ, et al. Mammographic density and the risk and detection of breast cancer. N Engl J Med. 2007;356:227-236.
- Bakker MF, de Lange SV, Pijnappel RM, et al; for the DENSE Trial Study Group. Supplemental MRI screening for women with extremely dense breast tissue. N Engl J Med. 2019;381:2091-2102.
- Drukker CA, Schmidt MK, Rutgers EJT, et al. Mammographic screening detects low-risk tumor biology breast cancers. Breast Cancer Res Treat. 2014;144:103-111.
- Statista website. Resident population of the United States by sex and age as of July 1, 2018. https://www.statista.com/statistics/241488/population-of-the-us-by-sex-and-age. Accessed January 6, 2020.
- US Food and Drug Administration website. Mammography: what you need to know. https://www.fda.gov/consumers/consumer-updates/mammography-what-you-need-know. Accessed January 13, 2020.
- IBIS (International Breast Cancer Intervention Study) website. Online Tyrer-Cuzick Model Breast Cancer Risk Evaluation Tool. ibis.ikonopedia.com. Accessed January 13, 2020.
- Bevers TB, Anderson BO, Bonaccio E, et al; National Comprehensive Cancer Network. Breast cancer screening and diagnosis: NCCN practice guidelines in oncology. JNCCN. 2009;7:1060-1096.
- Saslow D, Boetes C, Burke W, et al. American Cancer Society guidelines for breast screening with MRI as an adjunct to mammography. CA Cancer J Clin. 2007;57:75-89.
- Antoniou AC, Cunningham AP, Peto J, et al. The BOADICEA model of genetic susceptibility to breast and ovarian cancers: updates and extensions. Br J Cancer. 2008;98:1457-1466.
- Claus EB, Risch N, Thompson WD. Autosomal dominant inheritance of early-onset breast cancer: implications for risk prediction. Cancer. 1994;73:643-651.
- Parmigiani G, Berry D, Aguilar O. Determining carrier probabilities for breast cancer-susceptibility genes BRCA1 and BRCA2. Am J Hum Genet. 1998;62:145-158.
- Tyrer J, Duffy SW, Cuzick J. A breast cancer prediction model incorporating familial and personal risk factors. Stat Med. 2004;23:1111-1130.
Mark D. Pearlman, MD

Director, Cancer Genetics and Breast Health
S. Jan Behrman Professor, Department of Obstetrics and Gynecology
University of Michigan Medical School
Ann Arbor, Michigan
Committee Member, National Comprehensive Cancer Network
Writing Group for Breast Cancer Screening and Diagnosis
OBG Management Contributing Editor
The author reports no financial relationships relevant to this article.
Mark D. Pearlman, MD
Director, Cancer Genetics and Breast Health
S. Jan Behrman Professor, Department of Obstetrics and Gynecology
University of Michigan Medical School
Ann Arbor, Michigan
Committee Member, National Comprehensive Cancer Network
Writing Group for Breast Cancer Screening and Diagnosis
OBG Management Contributing Editor
The author reports no financial relationships relevant to this article.
While the frequency of dense breasts decreases with age, approximately 10% of women in the United States have extremely dense breasts (Breast Imaging, Reporting, and Data System [BI-RADS] category D), and another 40% have heterogeneously dense breasts (BI-RADS category C).1 Women with dense breasts have both an increased risk for developing breast cancer and reduced mammographic sensitivity for breast cancer detection compared with women who have nondense breasts.2
These 2 observations have led the majority of states to pass legislation requiring that women with dense breasts be informed of their breast density, and most require that providers discuss these results with their patients. Thoughtful clinicians who review the available literature, however, will find sparse evidence on which to counsel patients as to next steps.
Now, a recent trial adds to our knowledge about supplemental magnetic resonance imaging (MRI) breast screening in women with extremely dense breasts.
DENSE trial offers high-quality data
Bakker and colleagues studied women aged 50 to 74 who were participating in a Netherlands population-based biennial mammography screening program.3 They enrolled average-risk women with extremely dense breasts who had a negative screening digital mammogram into the Dense Tissue and Early Breast Neoplasm Screening (DENSE) multicenter trial. The women were randomly assigned to receive either continued biennial digital mammography or supplemental breast MRI.
The primary outcome was the between-group difference in the development of interval breast cancers—that is, breast cancers detected by women or their providers between rounds of screening mammography. Interval breast cancers were chosen as the primary outcome for 2 reasons:
- interval cancers appear to be more aggressive tumors than those cancers detected by screening mammography
- interval cancers can be identified over a shorter time interval, making them easier to study than outcomes such as breast cancer mortality, which typically require more than a decade to identify.
The DENSE trial’s secondary outcomes included recall rates from MRI, cancer detection rates on MRI, positive predictive value of MRIs requiring biopsy, and breast cancer characteristics (size, stage) diagnosed in the different groups.
Between-group difference in incidence of interval cancers
A total of 40,373 women with extremely dense breasts were screened; 8,061 of these were randomly assigned to receive breast MRI and 32,312 to continued mammography only (1:4 cluster randomization) across 12 mammography centers in the Netherlands. Among the women assigned to the MRI group, 59% actually underwent MRI (4,783 of the 8,061).
The interval cancer rate in the mammography-only group was 5.0 per 1,000 screenings (95% confidence interval [CI], 4.3–5.8), while the interval cancer rate in the MRI-assigned group was 2.5 per 1,000 screenings (95% CI, 1.6–3.8) (TABLE 1).3
Key secondary outcomes
Of the women who underwent supplemental MRI, 9.49% were recalled for additional imaging, follow-up, or biopsy. Of the 4,783 women who had an MRI, 300 (6.3%) underwent a breast biopsy, and 79 breast cancers (1.65%) were detected. Sixty-four of these cancers were invasive, and 15 were ductal carcinoma in situ (DCIS). Among women who underwent a biopsy for an MRI-detected abnormality, the positive predictive value was 26.3%.
Tumor characteristics. For women who developed breast cancer during the study, both tumor size at diagnosis and tumor stage (early vs late) were described. TABLE 2 shows these results in the women who had their breast cancer detected on MRI, those in the MRI-assigned group who developed interval cancer, and those in the mammography-only group who had interval cancers.3 Overall, tumor size was smaller in the interval group who underwent MRI compared with those who underwent mammography only.
Continue to: Study contributes valuable data, but we need more on long-term outcomes...
Study contributes valuable data, but we need more on long-term outcomes
The trial by Bakker and colleagues employed a solid study design as women were randomly assigned to supplemental MRI screening or ongoing biennial mammography, and nearly all cancers were identified in the short-term of follow-up. In addition, very few women were lost to follow-up, and secondary outcomes, including false-positive rates, were collected to help providers and patients better understand some of the potential downsides of supplemental screening.
The substantial reduction in interval cancers (50% in the intent-to-screen analysis and 84% in the women who actually underwent supplemental MRI) was highly statistically significant (P<.001). While there were substantially fewer interval cancers in the MRI-assigned group, the interval cancers that did occur were of similar stage as those in the women assigned to the mammography-only group (TABLE 2).
Data demonstrate that interval cancers appear to be more aggressive than screen-detected cancers.4 While reducing interval cancers should be a good thing overall, it remains unproven that using supplemental MRI in all women with dense breasts would reduce breast cancer specific mortality, all-cause mortality, or the risk of more invasive treatments (for example, the need for chemotherapy or requirement for mastectomy).
On the other hand, using routine supplemental breast MRI in women with extremely dense breasts would result in very substantial use of resources, including cost, radiologist time, provider time, and machine time. In the United States, approximately 49 million women are aged 50 to 74.5 Breast MRI charges commonly range from $1,000 to $4,000. If the 4.9 million women with extremely dense breasts underwent supplemental MRI this year, the approximate cost would be somewhere between $4.9 and $19.5 billion for imaging alone. This does not include callbacks, biopsies, or provider time for ordering, interpreting, and arranging for follow-up.
While the reduction in interval cancers seen in this study is promising, more assurance of improvement in important outcomes—such as reduced mortality or reduced need for more invasive breast cancer treatments—should precede any routine change in practice.
Unanswered questions
This study did not address a number of other important questions, including:
Should MRI be done with every round of breast cancer screening given the possibility of prevalence bias? Prevalence bias can be defined as more cancers detected in the first round of MRI screening with possible reduced benefit in future rounds of screening. The study authors indicated that they will continue to analyze the study results to see what occurs in the next round of screening.
Is there a similar impact on decreased interval cancers in women undergoing annual mammography or in women screened between ages 40 and 49? This study was conducted in women aged 50 to 74 undergoing mammography every 2 years. In the United States, annual mammography in women aged 40 to 49 is frequently recommended.
What effect does supplemental MRI screening have in women with heterogeneously dense breasts, which represents 40% of the population? The US Food and Drug Administration recommends that all women with dense breasts be counseled regarding options for management.6
Do these results translate to the more racially and ethnically diverse populations of the United States? In the Netherlands, where this study was conducted, 85% to 90% of women are either Dutch or of western European origin. Women of different racial and ancestral backgrounds have biologically different breast cancers and cancer risk (for example, higher rates of triple-negative breast cancers in African American women; 10-fold higher rates of BRCA pathogenic variants in Ashkenazi Jewish women).
Continue to: Use validated tools to assess risk comprehensively...
Use validated tools to assess risk comprehensively
Women aged 50 to 74 with extremely dense breasts have reduced interval cancers following a normal biennial mammogram if supplemental MRI is offered, but the long-term benefit of identifying these cancers earlier is unclear. Until more data are available on important long-term outcomes (such as breast cancer mortality and need for more invasive treatments), providers should consider breast density in the context of a more comprehensive assessment of breast cancer risk using a validated breast cancer risk assessment tool.
I prefer the modified version of the International Breast Cancer Intervention Study (IBIS) tool, which is readily available online (https://ibis.ikonopedia.com/).7 This tool incorporates several breast cancer risk factors, including reproductive risk factors, body mass index, BRCA gene status, breast density, and family history. The tool takes 1 to 2 minutes to complete and provides an estimate of a woman’s 10-year risk and lifetime risk of breast cancer.
If the lifetime risk exceeds 20%, I offer the patient supplemental MRI screening, consistent with current recommendations of the National Comprehensive Cancer Network and the American Cancer Society.8,9 I generally recommend starting breast imaging screening 7 to 10 years prior to the youngest breast cancer occurrence in the family, with mammography starting no earlier than age 30 and MRI no earlier than age 25. Other validated tools also can be used.10-13
Incorporating breast density and other important risk factors allows a more comprehensive analysis upon which to counsel women about the value (benefits and harms) of breast imaging.8
- Sprague BL, Gagnon RE, Burt V, et al. Prevalence of mammographically dense breasts in the United States. J Natl Cancer Inst. 2014;106:dju255. doi: 10.1093/jcni/dju255.
- Boyd NF, Guo H, Martin LJ, et al. Mammographic density and the risk and detection of breast cancer. N Engl J Med. 2007;356:227-236.
- Bakker MF, de Lange SV, Pijnappel RM, et al; for the DENSE Trial Study Group. Supplemental MRI screening for women with extremely dense breast tissue. N Engl J Med. 2019;381:2091-2102.
- Drukker CA, Schmidt MK, Rutgers EJT, et al. Mammographic screening detects low-risk tumor biology breast cancers. Breast Cancer Res Treat. 2014;144:103-111.
- Statista website. Resident population of the United States by sex and age as of July 1, 2018. https://www.statista.com/statistics/241488/population-of-the-us-by-sex-and-age. Accessed January 6, 2020.
- US Food and Drug Administration website. Mammography: what you need to know. https://www.fda.gov/consumers/consumer-updates/mammography-what-you-need-know. Accessed January 13, 2020.
- IBIS (International Breast Cancer Intervention Study) website. Online Tyrer-Cuzick Model Breast Cancer Risk Evaluation Tool. ibis.ikonopedia.com. Accessed January 13, 2020.
- Bevers TB, Anderson BO, Bonaccio E, et al; National Comprehensive Cancer Network. Breast cancer screening and diagnosis: NCCN practice guidelines in oncology. JNCCN. 2009;7:1060-1096.
- Saslow D, Boetes C, Burke W, et al. American Cancer Society guidelines for breast screening with MRI as an adjunct to mammography. CA Cancer J Clin. 2007;57:75-89.
- Antoniou AC, Cunningham AP, Peto J, et al. The BOADICEA model of genetic susceptibility to breast and ovarian cancers: updates and extensions. Br J Cancer. 2008;98:1457-1466.
- Claus EB, Risch N, Thompson WD. Autosomal dominant inheritance of early-onset breast cancer: implications for risk prediction. Cancer. 1994;73:643-651.
- Parmigiani G, Berry D, Aguilar O. Determining carrier probabilities for breast cancer-susceptibility genes BRCA1 and BRCA2. Am J Hum Genet. 1998;62:145-158.
- Tyrer J, Duffy SW, Cuzick J. A breast cancer prediction model incorporating familial and personal risk factors. Stat Med. 2004;23:1111-1130.
Delaying flu vaccine didn’t drop fever rate for childhood immunizations
according to a randomized trial.

An increased risk for febrile seizures had been seen when the three vaccines were administered together, wrote Emmanuel B. Walter, MD, MPH, and coauthors, so they constructed a trial that compared a simultaneous administration strategy that delayed inactivated influenza vaccine (IIV) administration by about 2 weeks.
In all, 221 children aged 12-16 months were enrolled in the randomized study. A total of 110 children received quadrivalent IIV (IIV4), DTaP, and 13-valent pneumococcal conjugate vaccine (PCV13) simultaneously and returned for a dental health education visit 2 weeks later. For 111 children, DTaP and PCV13 were administered at study visit 1, and IIV4 was given along with dental health education 2 weeks later. Most children in both groups also received at least one nonstudy vaccine at the first study visit. Eleven children in the simultaneous group and four in the sequential group didn’t complete the study.
There was no difference between study groups in the combined rates of fever on the first 2 days after study visits 1 and 2 taken together: 8% of children in the simultaneous group and 9% of those in the sequential group had fever of 38° C or higher (adjusted relative risk, 0.87; 95% confidence interval, 0.36-2.10).
However, children in the simultaneous group were more likely to receive antipyretic medication in the first 2 days after visit 1 (37% versus 22%; P = .020), reported Dr. Walter, professor of pediatrics at Duke University, Durham, N.C., and coauthors. Because it’s rare for febrile seizures to occur after immunization, the authors didn’t make the occurrence of febrile seizure a primary or secondary endpoint of the study; no seizures occurred in study participants. They did hypothesize that the total proportion of children having fever would be higher in the simultaneous than in the sequential group – a hypothesis not supported by the study findings.
Children were excluded, or their study vaccinations were delayed, if they had received antipyretic medication within the 72 hours preceding the visit or at the study visit, or if they had a temperature of 38° C or more.
Parents monitored participants’ temperatures for 8 days after visits by using a study-provided temporal thermometer once daily at about the same time, and also by checking the temperature if their child felt feverish. Parents also recorded any antipyretic use, medical care, other symptoms, and febrile seizures.
The study was stopped earlier than anticipated because unexpectedly high levels of influenza activity made it unethical to delay influenza immunization, explained Dr. Walter and coauthors.
Participants were a median 15 months old; most were non-Hispanic white and had private insurance. Most participants didn’t attend day care.
“Nearly all fever episodes and days of fever on days 1-2 after the study visits occurred after visit 1,” reported Dr. Walter and coinvestigators. They saw no difference between groups in the proportion of children who had a fever of 38.6° C on days 1-2 after either study visit.
The mean peak temperature – about 38.5° C – on combined study visits 1 and 2 didn’t differ between groups. Similarly, for those participants who had a fever, the mean postvisit fever duration of 1.3 days was identical between groups.
Parents also were asked about their perceptions of the vaccination schedule their children received. Over half of parents overall (56%) reported that they disliked having to bring their child in for two separate clinic visits, with more parents in the sequential group than the simultaneous group reporting this (65% versus 48%).
Generalizability of the findings and comparison with previous studies are limited, noted Dr. Walter and coinvestigators, because the composition of influenza vaccine varies from year to year. No signal for seizures was seen in the Vaccine Safety Datalink after IIV during the 2017-2018 influenza season, wrote the investigators. The 2010-2011 influenza season’s IIV formulation was associated with increased febrile seizure risk, indicating that the IIV formulation for that year may have been more pyrogenic than the 2017-2018 formulation.
Also, children deemed at higher risk of febrile seizure were excluded from the study, so findings may have limited applicability to these children. The lack of parental blinding also may have influenced antipyretic administration or other symptom reporting, although objective temperature measurement should not have been affected by the lack of blinding, wrote Dr. Walker and collaborators.
The study was funded by the Centers for Disease Control and Prevention. One coauthor reported potential conflicts of interest from financial support received from GlaxoSmithKline, Sanofi Pasteur, Pfizer, Merck, Protein Science, Dynavax, and Medimmune. The remaining authors have no relevant financial disclosures.
SOURCE: Walter EB et al. Pediatrics. 2020;145(3):e20191909.
according to a randomized trial.
An increased risk for febrile seizures had been seen when the three vaccines were administered together, wrote Emmanuel B. Walter, MD, MPH, and coauthors, so they constructed a trial that compared a simultaneous administration strategy that delayed inactivated influenza vaccine (IIV) administration by about 2 weeks.
In all, 221 children aged 12-16 months were enrolled in the randomized study. A total of 110 children received quadrivalent IIV (IIV4), DTaP, and 13-valent pneumococcal conjugate vaccine (PCV13) simultaneously and returned for a dental health education visit 2 weeks later. For 111 children, DTaP and PCV13 were administered at study visit 1, and IIV4 was given along with dental health education 2 weeks later. Most children in both groups also received at least one nonstudy vaccine at the first study visit. Eleven children in the simultaneous group and four in the sequential group didn’t complete the study.
There was no difference between study groups in the combined rates of fever on the first 2 days after study visits 1 and 2 taken together: 8% of children in the simultaneous group and 9% of those in the sequential group had fever of 38° C or higher (adjusted relative risk, 0.87; 95% confidence interval, 0.36-2.10).
However, children in the simultaneous group were more likely to receive antipyretic medication in the first 2 days after visit 1 (37% versus 22%; P = .020), reported Dr. Walter, professor of pediatrics at Duke University, Durham, N.C., and coauthors. Because it’s rare for febrile seizures to occur after immunization, the authors didn’t make the occurrence of febrile seizure a primary or secondary endpoint of the study; no seizures occurred in study participants. They did hypothesize that the total proportion of children having fever would be higher in the simultaneous than in the sequential group – a hypothesis not supported by the study findings.
Children were excluded, or their study vaccinations were delayed, if they had received antipyretic medication within the 72 hours preceding the visit or at the study visit, or if they had a temperature of 38° C or more.
Parents monitored participants’ temperatures for 8 days after visits by using a study-provided temporal thermometer once daily at about the same time, and also by checking the temperature if their child felt feverish. Parents also recorded any antipyretic use, medical care, other symptoms, and febrile seizures.
The study was stopped earlier than anticipated because unexpectedly high levels of influenza activity made it unethical to delay influenza immunization, explained Dr. Walter and coauthors.
Participants were a median 15 months old; most were non-Hispanic white and had private insurance. Most participants didn’t attend day care.
“Nearly all fever episodes and days of fever on days 1-2 after the study visits occurred after visit 1,” reported Dr. Walter and coinvestigators. They saw no difference between groups in the proportion of children who had a fever of 38.6° C on days 1-2 after either study visit.
The mean peak temperature – about 38.5° C – on combined study visits 1 and 2 didn’t differ between groups. Similarly, for those participants who had a fever, the mean postvisit fever duration of 1.3 days was identical between groups.
Parents also were asked about their perceptions of the vaccination schedule their children received. Over half of parents overall (56%) reported that they disliked having to bring their child in for two separate clinic visits, with more parents in the sequential group than the simultaneous group reporting this (65% versus 48%).
Generalizability of the findings and comparison with previous studies are limited, noted Dr. Walter and coinvestigators, because the composition of influenza vaccine varies from year to year. No signal for seizures was seen in the Vaccine Safety Datalink after IIV during the 2017-2018 influenza season, wrote the investigators. The 2010-2011 influenza season’s IIV formulation was associated with increased febrile seizure risk, indicating that the IIV formulation for that year may have been more pyrogenic than the 2017-2018 formulation.
Also, children deemed at higher risk of febrile seizure were excluded from the study, so findings may have limited applicability to these children. The lack of parental blinding also may have influenced antipyretic administration or other symptom reporting, although objective temperature measurement should not have been affected by the lack of blinding, wrote Dr. Walker and collaborators.
The study was funded by the Centers for Disease Control and Prevention. One coauthor reported potential conflicts of interest from financial support received from GlaxoSmithKline, Sanofi Pasteur, Pfizer, Merck, Protein Science, Dynavax, and Medimmune. The remaining authors have no relevant financial disclosures.
SOURCE: Walter EB et al. Pediatrics. 2020;145(3):e20191909.
FROM PEDIATRICS
Key clinical point: Fevers were no less common when influenza vaccine was delayed for children receiving DTaP and pneumococcal vaccinations.
Major finding: There was no difference between study groups in the combined rates of fever on the first 2 days after study visits 1 and 2 taken together: 8% of children in the simultaneous group and 9% of those in the sequential group had fever of 38° C or higher (adjusted relative risk, 0.87).
Study details: Randomized, nonblinded trial of 221 children aged 12-16 months receiving scheduled vaccinations.
Disclosures: The study was funded by the Centers for Disease Control and Prevention. One coauthor reported financial support received from GlaxoSmithKline, Sanofi Pasteur, Pfizer, Merck, Protein Science, Dynavax, and Medimmune.
Source: Walter EB et al. Pediatrics. 2020;145(3):e20191909.
The Zzzzzuper Bowl, and 4D needles
HDL 35, LDL 220, hike!

Super Bowl Sunday is, for all intents and purposes, an American national holiday. And if there’s one thing we Americans love to do on our national holidays, it’s eat. And eat. Oh, and also eat.
According to research from LetsGetChecked, about 70% of Americans who watch the Super Bowl overindulge on game day. Actually, the term “overindulge” may not be entirely adequate: On Super Bowl Sunday, the average football fan ate nearly 11,000 calories and 180 g of saturated fat. That’s more than four times the recommended daily calorie intake, and seven times the recommended saturated fat intake.
Naturally, the chief medical officer for LetsGetChecked termed this level of food consumption as potentially dangerous if it becomes a regular occurrence and asked that people “question if they need to be eating quite so much.” Yeah, we think he’s being a party pooper, too.
So, just what did Joe Schmoe eat this past Sunday that has the experts all worried?
LetsGetChecked thoughtfully asked, and the list is something to be proud of: wings, pizza, fries, burgers, hot dogs, ribs, nachos, sausage, ice cream, chocolate, cake. The average fan ate all these, and more. Our personal favorite: the 2.3 portions of salad. Wouldn’t want to be too unhealthy now. Gotta have that salad to balance everything else out.
Strangely, the survey didn’t seem to ask about the presumably prodigious quantities of alcohol the average Super Bowl fan consumed. So, if anything, that 11,000 calories is an underestimation. And it really doesn’t get more American than that.
Zzzzzuper Bowl

Hardly, according to the buzzzzzz-kills [Ed. note: Why so many Zs? Author note: Wait for it ...] at the American Academy of Sleep Medicine. In a report with the sleep-inducing title “AASM Sleep Prioritization Survey Monday after the Super Bowl,” the academy pulls the sheets back on America’s somnolent post–Super Bowl secret: We’re sleep deprived.
More than one-third of the 2,003 adults alert enough to answer the AASM survey said they were more tired than usual the day after the Super Bowl. And 12% of respondents admitted that they were “extremely tired.”
Millennials were the generation most likely to meet Monday morning in an extreme stupor, followed by the few Gen X’ers who could even be bothered to cynically answer such an utterly pointless collection of survey questions. Baby boomers had already gone to bed before the academy could poll them.
AASM noted that Cleveland fans were stumped by the survey’s questions about the Super Bowl, given that the Browns are always well rested on the Monday morning after the game.
The gift that keeps on grabbing

Rutgers, you had us at “morph into new shapes.”
We read a lot of press releases here at LOTME world headquarters, but when we saw New Jersey’s state university announcing that a new 4D-printed microneedle array could “morph into new shapes,” we were hooked, so to speak.
Right now, though, you’re probably wondering what 4D printing is. We wondered that, too. It’s like 3D printing, but “with smart materials that are programmed to change shape after printing. Time is the fourth dimension that allows materials to morph into new shapes,” as senior investigator Howon Lee, PhD, and associates explained it.
Microneedles are becoming increasing popular as a replacement for hypodermics, but their “weak adhesion to tissues is a major challenge for controlled drug delivery over the long run,” the investigators noted. To try and solve the adhesion problem, they turned to – that’s right, you guessed it – insects and parasites.
When you think about it, it does make sense. What’s better at holding onto tissue than the barbed stinger of a honeybee or the microhooks of a tapeworm?
The microneedle array that Dr. Lee and his team have come up has backward-facing barbs that interlock with tissue when it is inserted, which improves adhesion. It was those barbs that required the whole 4D-printing approach, they explained in Advanced Functional Materials.
That’s sounds great, you’re probably thinking now – but we need to show you the money, right? Okay.
During testing on chicken muscle tissue, adhesion with the new microneedle was “18 times stronger than with a barbless microneedle,” they reported.
The 4D microneedle’s next stop? Its own commercial during next year’s Super Bowl, according to its new agent.
HDL 35, LDL 220, hike!
Super Bowl Sunday is, for all intents and purposes, an American national holiday. And if there’s one thing we Americans love to do on our national holidays, it’s eat. And eat. Oh, and also eat.
According to research from LetsGetChecked, about 70% of Americans who watch the Super Bowl overindulge on game day. Actually, the term “overindulge” may not be entirely adequate: On Super Bowl Sunday, the average football fan ate nearly 11,000 calories and 180 g of saturated fat. That’s more than four times the recommended daily calorie intake, and seven times the recommended saturated fat intake.
Naturally, the chief medical officer for LetsGetChecked termed this level of food consumption as potentially dangerous if it becomes a regular occurrence and asked that people “question if they need to be eating quite so much.” Yeah, we think he’s being a party pooper, too.
So, just what did Joe Schmoe eat this past Sunday that has the experts all worried?
LetsGetChecked thoughtfully asked, and the list is something to be proud of: wings, pizza, fries, burgers, hot dogs, ribs, nachos, sausage, ice cream, chocolate, cake. The average fan ate all these, and more. Our personal favorite: the 2.3 portions of salad. Wouldn’t want to be too unhealthy now. Gotta have that salad to balance everything else out.
Strangely, the survey didn’t seem to ask about the presumably prodigious quantities of alcohol the average Super Bowl fan consumed. So, if anything, that 11,000 calories is an underestimation. And it really doesn’t get more American than that.
Zzzzzuper Bowl
Hardly, according to the buzzzzzz-kills [Ed. note: Why so many Zs? Author note: Wait for it ...] at the American Academy of Sleep Medicine. In a report with the sleep-inducing title “AASM Sleep Prioritization Survey Monday after the Super Bowl,” the academy pulls the sheets back on America’s somnolent post–Super Bowl secret: We’re sleep deprived.
More than one-third of the 2,003 adults alert enough to answer the AASM survey said they were more tired than usual the day after the Super Bowl. And 12% of respondents admitted that they were “extremely tired.”
Millennials were the generation most likely to meet Monday morning in an extreme stupor, followed by the few Gen X’ers who could even be bothered to cynically answer such an utterly pointless collection of survey questions. Baby boomers had already gone to bed before the academy could poll them.
AASM noted that Cleveland fans were stumped by the survey’s questions about the Super Bowl, given that the Browns are always well rested on the Monday morning after the game.
The gift that keeps on grabbing
Rutgers, you had us at “morph into new shapes.”
We read a lot of press releases here at LOTME world headquarters, but when we saw New Jersey’s state university announcing that a new 4D-printed microneedle array could “morph into new shapes,” we were hooked, so to speak.
Right now, though, you’re probably wondering what 4D printing is. We wondered that, too. It’s like 3D printing, but “with smart materials that are programmed to change shape after printing. Time is the fourth dimension that allows materials to morph into new shapes,” as senior investigator Howon Lee, PhD, and associates explained it.
Microneedles are becoming increasing popular as a replacement for hypodermics, but their “weak adhesion to tissues is a major challenge for controlled drug delivery over the long run,” the investigators noted. To try and solve the adhesion problem, they turned to – that’s right, you guessed it – insects and parasites.
When you think about it, it does make sense. What’s better at holding onto tissue than the barbed stinger of a honeybee or the microhooks of a tapeworm?
The microneedle array that Dr. Lee and his team have come up has backward-facing barbs that interlock with tissue when it is inserted, which improves adhesion. It was those barbs that required the whole 4D-printing approach, they explained in Advanced Functional Materials.
That’s sounds great, you’re probably thinking now – but we need to show you the money, right? Okay.
During testing on chicken muscle tissue, adhesion with the new microneedle was “18 times stronger than with a barbless microneedle,” they reported.
The 4D microneedle’s next stop? Its own commercial during next year’s Super Bowl, according to its new agent.
Cardiac arrest: Targeted temperature management a game changer
SNOWMASS, COLO. – Targeted temperature management maintained at 32-36 degrees Celsius is now a strong class I recommendation for all comatose patients who experience return of spontaneous circulation after out-of-hospital cardiac arrest, including those with nonshockable rhythms, Erin A. Bohula, MD, PhD, said at the annual Cardiovascular Conference at Snowmass sponsored by the American College of Cardiology.

“Our practice is that ,” said Dr. Bohula, a cardiologist and critical care specialist at Brigham and Women’s Hospital and Harvard Medical School, Boston.
The current ACC/AHA guidelines declare: “There are essentially no patients for whom temperature control somewhere in the range between 32 degrees C [89.6 F) and 36 degrees C [96.8 F] is contraindicated.” The writing committee cited “recent clinical trial data enrolling patients with all rhythms, the rarity of adverse effects in trials, the high neurologic morbidity and mortality without any specific interventions, and the preponderance of data suggesting that temperature is an important variable for neurologic recovery” (Circulation. 2015 Nov 3;132[18 Suppl 2]:S465-82).
“That’s a pretty strong statement,” Dr. Bohula observed.
The current guidelines, which date back to 2015, give a class I, level of evidence B recommendation for targeted temperature management (TTM) in patients who are comatose with return of spontaneous circulation (ROSC) after out-of-hospital cardiac arrest involving ventricular fibrillation or pulseless ventricular fibrillation. The bedside definition of comatose is lack of meaningful response to verbal commands to squeeze hands, blink, or move toes.
The current recommendation for TTM in patients resuscitated from out-of-hospital cardiac arrest with a nonshockable rhythm is class I, level of evidence C, meaning it’s based on expert consensus. However, that recommendation is now out of date and due for a level-of-evidence upgrade in light of the recent results of the French HYPERION trial, an open-label randomized trial of 584 patients resuscitated from cardiac arrest with a nonshockable rhythm. Although 90-day mortality was similarly high in the TTM and targeted normothermia groups, the rate of favorable neurologic outcome as assessed by a Cerebral Performance Category scale score of 1 or 2 was 10.2% in the TTM group, significantly better than the 5.7% rate in controls (N Engl J Med. 2019 Dec 12;381[24]:2327-37).
The 2010, ACC/AHA guidelines recommended a TTM range of 32-34 degrees C, but on the basis of subsequent persuasive randomized trial data, that range was broadened to 32-36 degrees C in the 2015 guidelines, with a class IB recommendation. Maintenance of TTM for at least 24 hours has a IIa, level of evidence C recommendation in the current guidelines.
The guidelines emphasize that specific features may favor selection of one temperature for TTM over another. For example, patients with seizures or cerebral edema might be better off with TTM at a lower temperature, while a higher temperature may be best for those with bleeding or severe bradycardia. At Brigham and Women’s Hospital, the default temperature is 33 degrees C. However, TTM with a goal of 36 degrees C is seriously considered in patients with recent head trauma, major surgery within the past 2 weeks, refractory hypotension, severe sepsis, pregnancy, or high bleeding risk. Rewarming is done at a rate of 0.25 degrees C per hour, with sedation maintained until the patient has been returned to 98.6 degrees F, according to Dr. Bohula.
Based on several negative studies of TTM using rapid infusion of chilled fluids in the ambulance en route to the hospital, the guidelines rate that practice class IIIA, meaning don’t do it. Avoidance of a systolic blood pressure below 90 mm Hg and a mean arterial pressure of less than 65 mm Hg gets a class IIb level of evidence C recommendation to lessen the risk of cerebral hypoxia.
TTM a major breakthrough
Prior to the introduction of TTM, comatose patients with ROSC after out-of-hospital cardiac arrest had a dreadful prognosis, with survival rates of 1%-10% in registry studies. In contrast, the survival rate in the landmark TTM clinical trials was 50%-60%. And while that’s a dramatic improvement, ROSC after cardiac arrest remains a high-mortality condition. Dr. Bohula was first author of a report by the Critical Care Cardiology Trials Network, composed of 16 tertiary cardiac intensive care units in the United States and Canada. Cardiac arrest was the primary indication for 8.7% of 3,049 consecutive admissions, and its 38% mortality rate was the highest of all cardiac critical care indications (JAMA Cardiol. 2019 Jul 24;4[9]:928-35).
TTM was developed in response to a recognition that two-thirds of deaths in patients who make it to the hospital after out-of-hospital cardiac arrest are neurologic – the result of brain anoxia – rather than being due to the myocardial ischemia that may have initially brought them to medical attention.
“Time is brain cells, the same way we think of time as cardiac muscle,” Dr. Bohula observed.
The main idea behind therapeutic hypothermia is that it lowers the cerebral metabolic rate of oxygen to reduce the consequences of ongoing anoxia. The brain doesn’t require as much perfusion when cooled.
TTM has other beneficial neurologic effects as well: It reduces cerebral blood volume via autoregulation, decreases intracranial pressure, and blunts the inflammatory response involved in the postcardiac arrest syndrome. In addition, TTM has anticonvulsant properties, an important effect because seizures and/or myoclonus occur in up to 15% of adults who achieve ROSC after cardiac arrest – and in even more of those who are comatose after doing so. And seizures increase the brain’s metabolic rate threefold, resulting in more cerebral ischemic injury, she explained.
Seizure activity can be difficult to distinguish from shivering in a patient on TTM. For this reason Dr. Bohula recommends putting patients on continuous EEG monitoring from the time of admission, as is the routine practice at the Brigham.
She reported serving as a consultant to Daiichi Sankyo, Servier, Lexicon, Kowa, Merck, Novartis, Novo Nordisk, and the National Institutes of Health. In addition, she generates institutional research grants provided by a half-dozen pharmaceutical companies.
SNOWMASS, COLO. – Targeted temperature management maintained at 32-36 degrees Celsius is now a strong class I recommendation for all comatose patients who experience return of spontaneous circulation after out-of-hospital cardiac arrest, including those with nonshockable rhythms, Erin A. Bohula, MD, PhD, said at the annual Cardiovascular Conference at Snowmass sponsored by the American College of Cardiology.
“Our practice is that ,” said Dr. Bohula, a cardiologist and critical care specialist at Brigham and Women’s Hospital and Harvard Medical School, Boston.
The current ACC/AHA guidelines declare: “There are essentially no patients for whom temperature control somewhere in the range between 32 degrees C [89.6 F) and 36 degrees C [96.8 F] is contraindicated.” The writing committee cited “recent clinical trial data enrolling patients with all rhythms, the rarity of adverse effects in trials, the high neurologic morbidity and mortality without any specific interventions, and the preponderance of data suggesting that temperature is an important variable for neurologic recovery” (Circulation. 2015 Nov 3;132[18 Suppl 2]:S465-82).
“That’s a pretty strong statement,” Dr. Bohula observed.
The current guidelines, which date back to 2015, give a class I, level of evidence B recommendation for targeted temperature management (TTM) in patients who are comatose with return of spontaneous circulation (ROSC) after out-of-hospital cardiac arrest involving ventricular fibrillation or pulseless ventricular fibrillation. The bedside definition of comatose is lack of meaningful response to verbal commands to squeeze hands, blink, or move toes.
The current recommendation for TTM in patients resuscitated from out-of-hospital cardiac arrest with a nonshockable rhythm is class I, level of evidence C, meaning it’s based on expert consensus. However, that recommendation is now out of date and due for a level-of-evidence upgrade in light of the recent results of the French HYPERION trial, an open-label randomized trial of 584 patients resuscitated from cardiac arrest with a nonshockable rhythm. Although 90-day mortality was similarly high in the TTM and targeted normothermia groups, the rate of favorable neurologic outcome as assessed by a Cerebral Performance Category scale score of 1 or 2 was 10.2% in the TTM group, significantly better than the 5.7% rate in controls (N Engl J Med. 2019 Dec 12;381[24]:2327-37).
The 2010, ACC/AHA guidelines recommended a TTM range of 32-34 degrees C, but on the basis of subsequent persuasive randomized trial data, that range was broadened to 32-36 degrees C in the 2015 guidelines, with a class IB recommendation. Maintenance of TTM for at least 24 hours has a IIa, level of evidence C recommendation in the current guidelines.
The guidelines emphasize that specific features may favor selection of one temperature for TTM over another. For example, patients with seizures or cerebral edema might be better off with TTM at a lower temperature, while a higher temperature may be best for those with bleeding or severe bradycardia. At Brigham and Women’s Hospital, the default temperature is 33 degrees C. However, TTM with a goal of 36 degrees C is seriously considered in patients with recent head trauma, major surgery within the past 2 weeks, refractory hypotension, severe sepsis, pregnancy, or high bleeding risk. Rewarming is done at a rate of 0.25 degrees C per hour, with sedation maintained until the patient has been returned to 98.6 degrees F, according to Dr. Bohula.
Based on several negative studies of TTM using rapid infusion of chilled fluids in the ambulance en route to the hospital, the guidelines rate that practice class IIIA, meaning don’t do it. Avoidance of a systolic blood pressure below 90 mm Hg and a mean arterial pressure of less than 65 mm Hg gets a class IIb level of evidence C recommendation to lessen the risk of cerebral hypoxia.
TTM a major breakthrough
Prior to the introduction of TTM, comatose patients with ROSC after out-of-hospital cardiac arrest had a dreadful prognosis, with survival rates of 1%-10% in registry studies. In contrast, the survival rate in the landmark TTM clinical trials was 50%-60%. And while that’s a dramatic improvement, ROSC after cardiac arrest remains a high-mortality condition. Dr. Bohula was first author of a report by the Critical Care Cardiology Trials Network, composed of 16 tertiary cardiac intensive care units in the United States and Canada. Cardiac arrest was the primary indication for 8.7% of 3,049 consecutive admissions, and its 38% mortality rate was the highest of all cardiac critical care indications (JAMA Cardiol. 2019 Jul 24;4[9]:928-35).
TTM was developed in response to a recognition that two-thirds of deaths in patients who make it to the hospital after out-of-hospital cardiac arrest are neurologic – the result of brain anoxia – rather than being due to the myocardial ischemia that may have initially brought them to medical attention.
“Time is brain cells, the same way we think of time as cardiac muscle,” Dr. Bohula observed.
The main idea behind therapeutic hypothermia is that it lowers the cerebral metabolic rate of oxygen to reduce the consequences of ongoing anoxia. The brain doesn’t require as much perfusion when cooled.
TTM has other beneficial neurologic effects as well: It reduces cerebral blood volume via autoregulation, decreases intracranial pressure, and blunts the inflammatory response involved in the postcardiac arrest syndrome. In addition, TTM has anticonvulsant properties, an important effect because seizures and/or myoclonus occur in up to 15% of adults who achieve ROSC after cardiac arrest – and in even more of those who are comatose after doing so. And seizures increase the brain’s metabolic rate threefold, resulting in more cerebral ischemic injury, she explained.
Seizure activity can be difficult to distinguish from shivering in a patient on TTM. For this reason Dr. Bohula recommends putting patients on continuous EEG monitoring from the time of admission, as is the routine practice at the Brigham.
She reported serving as a consultant to Daiichi Sankyo, Servier, Lexicon, Kowa, Merck, Novartis, Novo Nordisk, and the National Institutes of Health. In addition, she generates institutional research grants provided by a half-dozen pharmaceutical companies.
EXPERT ANALYSIS FROM ACC SNOWMASS 2020
CDC begins coronavirus diagnostic test kit distribution; new case confirmed in Wisconsin
The Centers for Disease Control and Prevention and the Wisconsin Department of Health Services confirmed a new case of the 2019 Novel Coronavirus (2019-nCoV) on Feb. 5, 2020, bringing the total number of cases in the United States to 12.*
Earlier in the day, Nancy Messonnier, MD, director of the CDC National Center for Immunization and Respiratory Diseases, told reporters that 206 individuals under investigation had tested negative for infection with the novel virus and that tests were pending on another 76 individuals.
The agency also announced during a press briefing call that diagnostic test kits will begin shipping on Feb. 5, less than 24 hours after receiving an emergency use authorization from the Food and Drug Administration. Full information is available in an article published in the Morbidity and Mortality Weekly Report.
The emergency use authorization will allow for broader use of the CDC’s 2019-nCoV Real Time RT-PCR Diagnostic Panel, which to date has been limited for use at CDC laboratories. Under the emergency use authorization, the diagnostic kit is authorized for patients who meed the CDC criteria for 2019-nCoV testing. The diagnostic test is a reverse transcriptase polymerase chain reaction test that provides presumptive detection of 2019-nCoV from respiratory secretions, such as nasal or oral swabs. A positive test indicates likely infection, although a negative test does not preclude infection and should not be the sole determination for patient management decisions.
“Today, the test kits will start shipping to over 100 U.S. public health labs,” she said. “Each of these labs is required to perform international verification for [Clinical Laboratory Improvement Amendments] compliance prior to reporting out. This process is expected to take a few days.”
Dr. Messonnier said that 200 test kits will be distributed to domestic labs and another 200 test kits will go to select international labs. Each kit can perform diagnostics on 700-800 patient samples.
“What that means is that, by the start of next week, we expect there to be much enhanced capacity for laboratory testing closer to our patients,” she said, adding that additional test kits are being produced and will be available for ordering in the future. Each laboratory that places an order will receive one test kit.
“Distribution of these tests will improve the global capacity to detect and respond to this new virus,” Dr. Messonnier said. “Availability of this test is a starting place for greater commercial availability of diagnostic testing for nCoV.”
The CDC also said that the next batch of passengers arriving from Wuhan, China, will be arriving in one of four locations: Travis Air Force Base, Fairfield, Calif.; Marine Corps Air Station Miramar, San Diego; Lackland Air Force Base, San Antonio; and Eppley Airfield, Omaha, Neb. Passengers will be quarantined for up to 14 days from the day the flight left Wuhan and medical care will be provided if needed.
“We do not believe these people pose a threat to the communities where they are being housed as we are taking measures to minimize any contact,” she said, adding that confirmed infections are expected among these and other returning travelers.
Dr. Messonnier warned that the quarantine measures “may not catch every single returning traveler returning with novel coronavirus, given the nature of this virus and how it is spreading. But if we can catch the majority of them, that will slow the entry of this virus into the United States.”
*This story was updated on 02/05/2020.
Global project reveals cancer’s genomic playbook
A massive collaborative project spanning four continents and 744 research centers has revealed driver mutations in both protein-coding and noncoding regions of 38 cancer types.

The Pan-Cancer Analysis of Whole Genomes (PCAWG) is an integrative analysis of the whole-genome sequences from 2,658 donors across 38 common tumor types. The findings are expected to add exponentially to what’s currently known about the complex genetics of cancer, and they point to possible strategies for improving cancer prevention, diagnosis, and care.
Six articles summarizing the findings are presented in a series of papers in Nature, and 16 more appear in affiliated publications.
“It’s humbling that it was only 14 years ago that the genomics community sequenced its very first cancer exome, and it was able to identify mutations within the roughly 20,000 protein-coding genes in the human cell,” investigator Lincoln Stein, MD, PhD, of the Ontario Institute for Cancer Research in Toronto, said in a telephone briefing.
Exome sequencing, however, covers only protein-coding genomic regions, which constitute only about 1% of the entire genome, “so assembling an accurate portrait of the cancer genome using just the exome data is like trying to put together a 100,000-piece jigsaw puzzle when you’re missing 99% of the pieces and there’s no puzzle box with a completed picture to guide you,” Dr. Stein said.
Members of the PCAWG from centers in North America, Europe, Asia, and Australia screened 2,658 whole-cancer genomes and matched samples of noncancerous tissues from the same individuals, along with 1,188 transcriptomes cataloging the sequences and expression of RNA transcripts in a given tumor. The 6-year project netted more than 800 terabytes of genomic data, roughly equivalent to the digital holdings of the U.S. Library of Congress multiplied by 11.
The findings are summarized in papers focusing on cancer drivers, noncoding changes, mutational signatures, structural variants, cancer evolution over time, and RNA alterations.
Driver mutations
Investigators found that the average cancer genome contains four or five driver mutations located in both coding and noncoding regions. They also found, however, that in approximately 5% of cases no driver mutations could be identified.
A substantial proportion of tumors displayed “hallmarks of genomic catastrophes.” About 22% of tumors exhibited chromothripsis, a mutational process marked by hundreds or even thousands of clustered chromosomal rearrangements. About 18% showed chromoplexy, which is characterized by scattering and rearrangement of multiple strands of DNA from one or more chromosomes.
Analyzing driver point mutations and structural variants in noncoding regions, the investigators found the usual suspects – previously reported culprits – as well as novel candidates.
For example, they identified point mutations in the five prime region of the tumor suppressor gene TP53 and the three prime untranslated regions of NFKBIZ (a nuclear factor kappa B inhibitor) and TOB1 (an antiproliferative protein), focal deletion in BRD4 (a transcriptional and epigenetic regulator), and rearrangements in chromosomal loci in members of the AKR1C family of enzymes thought to play a role in disease progression.
In addition, investigators identified mutations in noncoding regions of TERT, a telomerase gene. These mutations result in ramped-up expression of telomerase, which in turn promotes uncontrollable division of tumor cells.
Mutational signatures
In a related line of research, PCAWG investigators identified new DNA mutational signatures ranging from single nucleotide polymorphisms to insertions and deletions, as well as to structural variants – rearrangements of large sections of the genome.
“The substantial size of our dataset, compared with previous analyses, enabled the discovery of new signatures, the separation of overlapping signatures, and the decomposition of signatures into components that may represent associated – but distinct – DNA damage, repair, and/or replication mechanisms. By estimating the contribution of each signature to the mutational catalogs of individual cancer genomes, we revealed associations of signatures to exogenous or endogenous exposures, as well as to defective DNA maintenance processes,” the investigators wrote.
They also acknowledged, however, that “many signatures are of unknown cause.”
Cancer evolution
One of the six main studies focused on the evolution of cancer over time. Instead of providing a “snapshot” of the genome as captured by sequencing tissue from a single biopsy, consortium investigators created full-length features of the “life history and evolution of mutational processes and driver mutation sequences.”
They found that early cancer development was marked by relatively few mutations in driver genes and by identifiable copy-number gains, including trisomy 7 in glioblastoma, and an abnormal mirroring of the arms (isochromosome) of chromosome 17 in medulloblastoma.
In 40% of the samples, however, there were significant changes in the mutational spectrum as the cancers grew, leading to a near quadrupling of driver genes and increased genomic instability in later-stage tumors.
“Copy-number alterations often occur in mitotic crises and lead to simultaneous gains of chromosomal segments,” the investigators wrote. “Timing analyses suggest that driver mutations often precede diagnosis by many years, if not decades. Together, these results determine the evolutionary trajectories of cancer and highlight opportunities for early cancer detection.”
Implications for cancer care
“When I used to treat patients with cancer, I was always completely amazed and puzzled by how two patients could have what looked like the same tumor. It would look the same under the microscope, have the same size, and the two patients would receive exactly the same treatment, but the two patients would have completely opposite outcomes; one would survive, and one would die. What this analysis … has done is really laid bare the reasons for that unpredictability in clinical outcomes,” Peter Campbell, MD, PhD, of the Wellcome Sanger Institute in Hinxton, England, said during the telebriefing.
“The most striking finding out of all of the suite of papers is just how different one person’s cancer genome is from another person’s. We see thousands of different combinations of mutations that can cause the cancer, and more than 80 different underlying processes generating the mutations in a cancer, and that leads to very different shapes and patterns in the genome that result,” he added.
On a positive note, the research shows that one or more driver mutations can be identified in about 95% of all cancer patients, and it elucidates the sequence of events leading to oncogenesis and tumor evolution, providing opportunities for earlier identification and potential interventions to prevent cancer, Dr. Campbell said.
The PCAWG was a collaborative multinational effort with multiple funding sources and many investigators.
SOURCE: Nature. 2020 Feb 5. https://www.nature.com/collections/pcawg/
A massive collaborative project spanning four continents and 744 research centers has revealed driver mutations in both protein-coding and noncoding regions of 38 cancer types.
The Pan-Cancer Analysis of Whole Genomes (PCAWG) is an integrative analysis of the whole-genome sequences from 2,658 donors across 38 common tumor types. The findings are expected to add exponentially to what’s currently known about the complex genetics of cancer, and they point to possible strategies for improving cancer prevention, diagnosis, and care.
Six articles summarizing the findings are presented in a series of papers in Nature, and 16 more appear in affiliated publications.
“It’s humbling that it was only 14 years ago that the genomics community sequenced its very first cancer exome, and it was able to identify mutations within the roughly 20,000 protein-coding genes in the human cell,” investigator Lincoln Stein, MD, PhD, of the Ontario Institute for Cancer Research in Toronto, said in a telephone briefing.
Exome sequencing, however, covers only protein-coding genomic regions, which constitute only about 1% of the entire genome, “so assembling an accurate portrait of the cancer genome using just the exome data is like trying to put together a 100,000-piece jigsaw puzzle when you’re missing 99% of the pieces and there’s no puzzle box with a completed picture to guide you,” Dr. Stein said.
Members of the PCAWG from centers in North America, Europe, Asia, and Australia screened 2,658 whole-cancer genomes and matched samples of noncancerous tissues from the same individuals, along with 1,188 transcriptomes cataloging the sequences and expression of RNA transcripts in a given tumor. The 6-year project netted more than 800 terabytes of genomic data, roughly equivalent to the digital holdings of the U.S. Library of Congress multiplied by 11.
The findings are summarized in papers focusing on cancer drivers, noncoding changes, mutational signatures, structural variants, cancer evolution over time, and RNA alterations.
Driver mutations
Investigators found that the average cancer genome contains four or five driver mutations located in both coding and noncoding regions. They also found, however, that in approximately 5% of cases no driver mutations could be identified.
A substantial proportion of tumors displayed “hallmarks of genomic catastrophes.” About 22% of tumors exhibited chromothripsis, a mutational process marked by hundreds or even thousands of clustered chromosomal rearrangements. About 18% showed chromoplexy, which is characterized by scattering and rearrangement of multiple strands of DNA from one or more chromosomes.
Analyzing driver point mutations and structural variants in noncoding regions, the investigators found the usual suspects – previously reported culprits – as well as novel candidates.
For example, they identified point mutations in the five prime region of the tumor suppressor gene TP53 and the three prime untranslated regions of NFKBIZ (a nuclear factor kappa B inhibitor) and TOB1 (an antiproliferative protein), focal deletion in BRD4 (a transcriptional and epigenetic regulator), and rearrangements in chromosomal loci in members of the AKR1C family of enzymes thought to play a role in disease progression.
In addition, investigators identified mutations in noncoding regions of TERT, a telomerase gene. These mutations result in ramped-up expression of telomerase, which in turn promotes uncontrollable division of tumor cells.
Mutational signatures
In a related line of research, PCAWG investigators identified new DNA mutational signatures ranging from single nucleotide polymorphisms to insertions and deletions, as well as to structural variants – rearrangements of large sections of the genome.
“The substantial size of our dataset, compared with previous analyses, enabled the discovery of new signatures, the separation of overlapping signatures, and the decomposition of signatures into components that may represent associated – but distinct – DNA damage, repair, and/or replication mechanisms. By estimating the contribution of each signature to the mutational catalogs of individual cancer genomes, we revealed associations of signatures to exogenous or endogenous exposures, as well as to defective DNA maintenance processes,” the investigators wrote.
They also acknowledged, however, that “many signatures are of unknown cause.”
Cancer evolution
One of the six main studies focused on the evolution of cancer over time. Instead of providing a “snapshot” of the genome as captured by sequencing tissue from a single biopsy, consortium investigators created full-length features of the “life history and evolution of mutational processes and driver mutation sequences.”
They found that early cancer development was marked by relatively few mutations in driver genes and by identifiable copy-number gains, including trisomy 7 in glioblastoma, and an abnormal mirroring of the arms (isochromosome) of chromosome 17 in medulloblastoma.
In 40% of the samples, however, there were significant changes in the mutational spectrum as the cancers grew, leading to a near quadrupling of driver genes and increased genomic instability in later-stage tumors.
“Copy-number alterations often occur in mitotic crises and lead to simultaneous gains of chromosomal segments,” the investigators wrote. “Timing analyses suggest that driver mutations often precede diagnosis by many years, if not decades. Together, these results determine the evolutionary trajectories of cancer and highlight opportunities for early cancer detection.”
Implications for cancer care
“When I used to treat patients with cancer, I was always completely amazed and puzzled by how two patients could have what looked like the same tumor. It would look the same under the microscope, have the same size, and the two patients would receive exactly the same treatment, but the two patients would have completely opposite outcomes; one would survive, and one would die. What this analysis … has done is really laid bare the reasons for that unpredictability in clinical outcomes,” Peter Campbell, MD, PhD, of the Wellcome Sanger Institute in Hinxton, England, said during the telebriefing.
“The most striking finding out of all of the suite of papers is just how different one person’s cancer genome is from another person’s. We see thousands of different combinations of mutations that can cause the cancer, and more than 80 different underlying processes generating the mutations in a cancer, and that leads to very different shapes and patterns in the genome that result,” he added.
On a positive note, the research shows that one or more driver mutations can be identified in about 95% of all cancer patients, and it elucidates the sequence of events leading to oncogenesis and tumor evolution, providing opportunities for earlier identification and potential interventions to prevent cancer, Dr. Campbell said.
The PCAWG was a collaborative multinational effort with multiple funding sources and many investigators.
SOURCE: Nature. 2020 Feb 5. https://www.nature.com/collections/pcawg/
FROM NATURE
FDA issues public health warning recommending against cesium salt usage
The Food and Drug Administration has issued a public health alert warning consumers to avoid the use of dietary supplements that contain cesium chloride or any other cesium salt because of significant safety risks.

Cesium salts are sometimes advertised as an alternative treatment for cancer, the FDA said in the announcement, but these salts have never proved to be safe or effective at treating cancer or any other disease. Clinical case reports and nonclinical trials have shown that cesium salts are associated with a variety of adverse events, including cardiac arrhythmias, hypokalemia, seizures, syncope, and death.
The FDA warned health care providers that cesium salts presented a significant safety risk in compounding drugs in July 2018.
Health care providers should not recommend dietary supplements containing cesium salts to their patients, the FDA said, and if a patient experiences an adverse event while taking a supplement containing cesium salt, the event should be reported to the agency.
While there are few dietary supplements on the market that contain cesium salt, consumers should be aware of the risks and avoid these products. The FDA noted that “if claims sound too good to be true, they probably are.”
The Food and Drug Administration has issued a public health alert warning consumers to avoid the use of dietary supplements that contain cesium chloride or any other cesium salt because of significant safety risks.
Cesium salts are sometimes advertised as an alternative treatment for cancer, the FDA said in the announcement, but these salts have never proved to be safe or effective at treating cancer or any other disease. Clinical case reports and nonclinical trials have shown that cesium salts are associated with a variety of adverse events, including cardiac arrhythmias, hypokalemia, seizures, syncope, and death.
The FDA warned health care providers that cesium salts presented a significant safety risk in compounding drugs in July 2018.
Health care providers should not recommend dietary supplements containing cesium salts to their patients, the FDA said, and if a patient experiences an adverse event while taking a supplement containing cesium salt, the event should be reported to the agency.
While there are few dietary supplements on the market that contain cesium salt, consumers should be aware of the risks and avoid these products. The FDA noted that “if claims sound too good to be true, they probably are.”
Abdominal rash
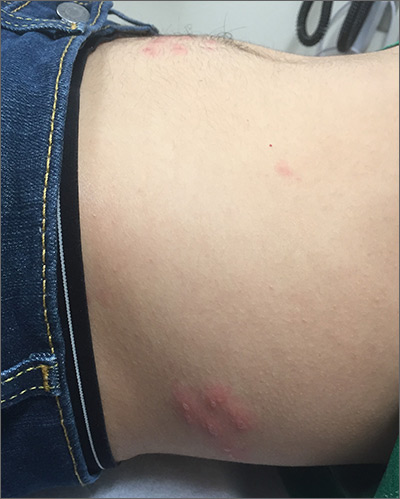
The pruritic prodrome, which evolved into painful vesicles, on an erythematous base in a dermatomal distribution was a classic presentation of herpes zoster.
Although herpes zoster is usually thought of as a disease that strikes older individuals, a study by Kawai et al found that of 8000 patients experiencing an outbreak, 43% were < 50 years of age. Additionally, this study found that the rate of herpes zoster infection had increased 4-fold in the past 60 years, and the rise had not been affected by the introduction of varicella vaccination. In Kawai’s series, 6.6% of the cases were in immunocompromised individuals.
In this case, the patient began antiviral therapy (Valacyclovir 1g tid for 7 days) to treat the active lesions. In further discussion with the patient, he indicated that he was concerned he might have an underlying undiagnosed autoimmune condition or human immunodeficiency virus (HIV) infection. His provider completed routine health care maintenance recommendations including an HIV screen, which was negative. Since he was otherwise asymptomatic, with no history of recurrent infections, no additional testing was warranted. However, since the patient worked with immunocompromised patients at a local hospital, he was placed on medical leave (per the facility’s protocol) until the lesions had crusted over. By Day 10, his lesions had crusted over and he returned to work.
Text courtesy of Brent Gillespie, PAC, University of New Mexico. Photo and editing courtesy of Daniel Stulberg, MD, FAAFP, Department of Family and Community Medicine, University of New Mexico School of Medicine, Albuquerque.
Kawai K, Yawn BP, Wollan P, et al. Increasing incidence of herpes zoster over a 60-year period from a population-based study. Clin Infect Dis. 2016;63:221-226.
The pruritic prodrome, which evolved into painful vesicles, on an erythematous base in a dermatomal distribution was a classic presentation of herpes zoster.
Although herpes zoster is usually thought of as a disease that strikes older individuals, a study by Kawai et al found that of 8000 patients experiencing an outbreak, 43% were < 50 years of age. Additionally, this study found that the rate of herpes zoster infection had increased 4-fold in the past 60 years, and the rise had not been affected by the introduction of varicella vaccination. In Kawai’s series, 6.6% of the cases were in immunocompromised individuals.
In this case, the patient began antiviral therapy (Valacyclovir 1g tid for 7 days) to treat the active lesions. In further discussion with the patient, he indicated that he was concerned he might have an underlying undiagnosed autoimmune condition or human immunodeficiency virus (HIV) infection. His provider completed routine health care maintenance recommendations including an HIV screen, which was negative. Since he was otherwise asymptomatic, with no history of recurrent infections, no additional testing was warranted. However, since the patient worked with immunocompromised patients at a local hospital, he was placed on medical leave (per the facility’s protocol) until the lesions had crusted over. By Day 10, his lesions had crusted over and he returned to work.
Text courtesy of Brent Gillespie, PAC, University of New Mexico. Photo and editing courtesy of Daniel Stulberg, MD, FAAFP, Department of Family and Community Medicine, University of New Mexico School of Medicine, Albuquerque.
Kawai K, Yawn BP, Wollan P, et al. Increasing incidence of herpes zoster over a 60-year period from a population-based study. Clin Infect Dis. 2016;63:221-226.
Kawai K, Yawn BP, Wollan P, et al. Increasing incidence of herpes zoster over a 60-year period from a population-based study. Clin Infect Dis. 2016;63:221-226.
Circulating tumor cells at baseline predict recurrence in stage III melanoma
Patients with stage III melanoma who have circulating tumor cells (CTCs) at baseline may benefit from adjuvant therapy, according to investigators.
A prospective study showed that patients with at least one CTC upon first presentation had increased risks of both short-term and long-term recurrence, reported lead author Anthony Lucci, MD, of the University of Texas MD Anderson Cancer Center, Houston, and colleagues.
While previous studies have suggested that CTCs hold prognostic value for melanoma patients, no trials had evaluated the CellSearch CTC Test – a standardized technique approved by the Food and Drug Administration – in patients with stage III disease, the investigators wrote. Their report is in Clinical Cancer Research.
In the present study, the investigators tested the CellSearch system in 243 patients with stage III cutaneous melanoma who were treated at MD Anderson Cancer Center. Patients with uveal or mucosal melanoma, or distant metastatic disease, were excluded.
Baseline blood samples were drawn within 3 months of regional lymph node metastasis, determined by either lymphadenectomy or sentinel lymph node biopsy. CTC assay positivity required that at least one CTC was detected within a single 7.5 mL tube of blood.
Out of 243 patients, 90 (37%) had a positive test. Of these 90 patients, almost one-quarter (23%) relapsed within 6 months, compared with 8% of patients who had a negative CTC assay. Within the full follow-up period, which was as long as 64 months, 48% of patients with CTCs at baseline relapsed, compared with 37% of patients without CTCs.
Multivariable regression analysis, which was adjusted for age, sex, pathological nodal stage, Breslow thickness, ulceration, and lymphovascular invasion, showed that baseline CTC positivity was an independent risk factor for melanoma recurrence, both in the short term and the long term. Compared with patients who lacked CTCs, those who tested positive were three times as likely to have disease recurrence within 6 months (hazard ratio, 3.13; P = .018). For relapse-free survival within 54 months, this hazard ratio decreased to 2.25 (P = .006).
Although a Cochran-Armitage test suggested that recurrence risks increased with CTC count, the investigators noted that a minority of patients (17%) had two or more CTCs, and just 5% had three or more CTCs.
According to the investigators, CTCs at baseline could become the first reliable blood-based biomarker for this patient population.
“[CTCs] clearly identified a group of stage III patients at high risk for relapse,” the investigators wrote. “This would be clinically very significant as an independent risk factor to help identify the stage III patients who would benefit most from adjuvant systemic therapy.”
This study was funded by the Kiefer family, Sheila Prenowitz, the Simon and Linda Eyles Foundation, the Sam and Janna Moore family, and the Wintermann Foundation. The investigators reported no conflicts of interest.
SOURCE: Lucci et al. Clin Cancer Res. doi: 10.1158/1078-0432.CCR-19-2670.
FROM CLINICAL CANCER RESEARCH