User login
Prevalence and Postdischarge Outcomes Associated with Frailty in Medical Inpatients: Impact of Different Frailty Definitions
Frailty is associated with adverse outcomes in hospitalized patients, including longer length of stay, increased risk of institutionalization at discharge, and higher rates of readmissions or death postdischarge.1-4 Multiple tools have been developed to evaluate frailty and in an earlier study,4 we compared the three most common of these and demonstrated that the Clinical Frailty Scale (CFS)5 was the most useful tool clinically as it was most strongly associated with adverse events in the first 30 days after discharge. However, it must be collected prospectively and requires contact with patients or proxies for the evaluator to assign the patient into one of nine categories depending on their disease state, mobility, cognition, and ability to perform instrumental and functional activities of daily living. Recently, a new score has been described which is based on an administrative data algorithm that assigns points to patients having any of 109 ICD-10 codes listed for their index hospitalization and all hospitalizations in the prior two years and can be generated retrospectively without trained observers.6 Although higher Hospital Frailty Risk Scores (HFRS) were associated with greater risk of postdischarge adverse events, the kappa when compared with the CFS was only 0.30 (95% CI 0.22-0.38) in that study.6 However, as the HFRS was developed and validated in patients aged ≥75 years within the UK National Health Service, the authors themselves recommended that it be evaluated in other healthcare systems, other populations, and with comparison to prospectively collected frailty data from cumulative deficit models such as the CFS.
The aim of this study was to compare frailty assessments using the CFS and the HFRS in a population of adult patients hospitalized on general medical wards in North America to determine the impact on prevalence estimates and prediction of outcomes within the first 30 days after hospital discharge (a timeframe highlighted in the Affordable Care Act and used by Centers for Medicare & Medicaid Services as an important hospital quality indicator).
METHODS
As described previously,7 we performed a prospective cohort study of adults without cognitive impairment or life expectancy less than three months being discharged back to the community (not to long-term care facilities) from general medical wards in two teaching hospitals in Edmonton, Alberta, between October 2013 and November 2014. All patients provided signed consent, and the University of Alberta Health Research Ethics board (project ID Pro00036880) approved the study.
Trained observers assessed each patient’s frailty status within 24 hours of discharge based on the patient’s best status in the week prior to becoming ill with the reason for the index hospitalization. The research assistant classified patients into one of the following nine CFS categories: very fit, well, managing well, vulnerable, mildly frail (need help with at least one instrumental activities of daily living such as shopping, finances, meal preparation, or housework), moderately frail (need help with one or two activities of daily living such as bathing and dressing), severely frail (dependent for personal care), very severely frail (bedbound), and terminally ill. According to the CFS validation studies, the last five categories were defined as frail for the purposes of our analyses.
Independent of the trained observer’s assessments, we calculated the HFRS for each participant in our cohort by linking to Alberta administrative data holdings within the Alberta Health Services Data Integration and Measurement Reporting unit and examining all diagnostic codes for the index hospitalization and any other hospitalizations in the prior two years for the 109 ICD-10 codes listed in the original HFRS paper and used the same score cutpoints as they reported (HFRS <5 being low risk, 5-15 defined as intermediate risk, and >15 as high risk for frailty; scores ≥5 were defined as frail).6
All patients were followed after discharge by research personnel blinded to the patient’s frailty assessment. We used patient/caregiver self-report and the provincial electronic health record to collect information on all-cause readmissions or mortality within 30 days.
We have previously reported4,7 the association between frailty defined by the CFS and unplanned readmissions or death within 30 days of discharge but in this study, we examined the correlation between CFS-defined frailty and the HFRS score (classifying those with intermediate or high scores as frail) using chance-corrected kappa coefficients. We also compared the prognostic accuracy of both models for predicting death and/or unplanned readmissions within 30 days using the C statistic and the integrated discrimination improvement index and examined patients aged >65 years as a subgroup.8 We used SAS version 9.4 (SAS Institute, Cary, North Carolina) for analyses, with P values of <.05 considered as statistically significant.
RESULTS
Of the 499 patients in our original cohort,7 we could not link 10 to the administrative data to calculate HFRS, and thus this study sample is only 489 patients (mean age 64 years, 50% women, 52% older than 65 years, a mean of 4.9 comorbidities, and median length of stay five days).
Overall, 276 (56%) patients were deemed frail according to at least one assessment (214 [44%] on the HFRS [35% intermediate risk and 9% high risk] and 161 [33%] on the CFS), and 99 (20%) met both frailty definitions (Appendix Figure). Among the 252 patients aged >65 years, 66 (26%) met both frailty definitions and 166 (66%) were frail according to at least one assessment. Agreement between HFRS and the CFS (kappa 0.24, 95% CI 0.16-0.33) was poor. The CFS definition of frailty was 46% sensitive and 77% specific in classifying frail patients compared with HFRS-defined frailty.
As we reported earlier,4 patients deemed frail were generally similar across scales in that they were older, had more comorbidities, more prescriptions, longer lengths of stay, and poorer quality of life than nonfrail patients (all P < .01, Table 1). However, patients classified as frail on the HFRS only but not meeting the CFS definition were younger, had higher quality of life, and despite a similar Charlson Score and number of comorbidities were much more likely to have been living independently prior to admission than those classified as frail on the CFS.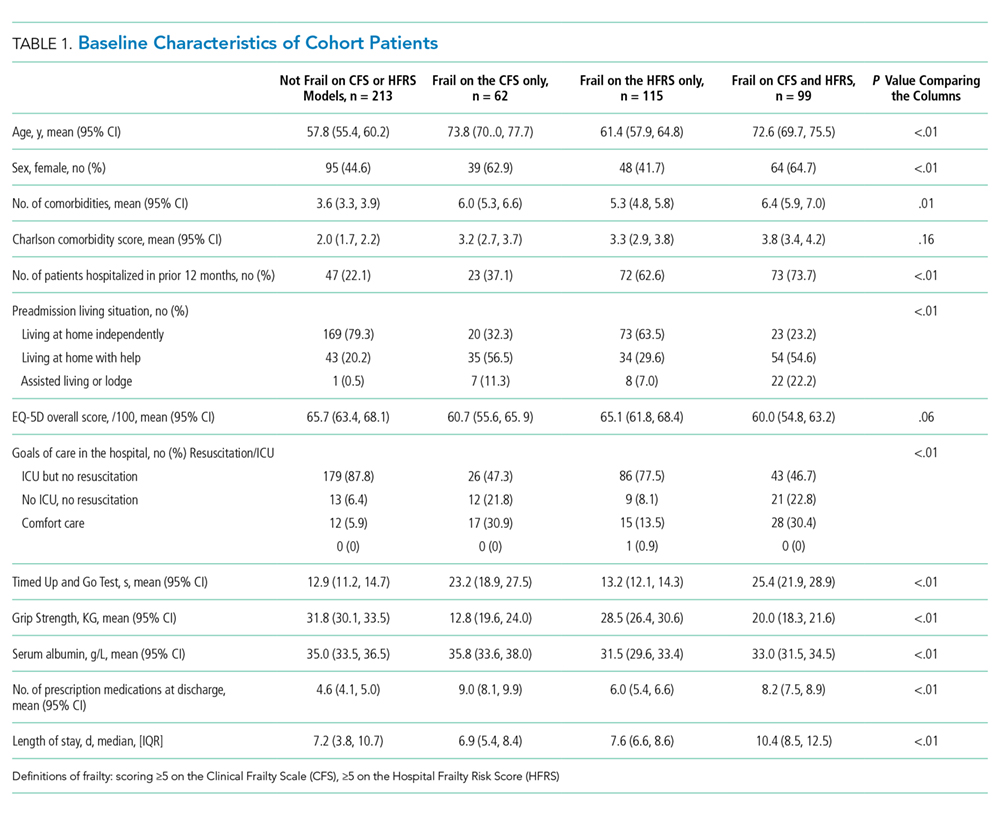
Death or unplanned readmission within 30 days occurred in 13.3% (65 patients), with most events being readmissions (62, 12.7%). HFRS-defined frail patients exhibited higher 30-day death/readmission rates (16% vs 11% for not frail, P = .08; 14% vs 11% in the elderly, P = .5), which was not statistically significantly different from the nonfrail patients even after adjusting for age and sex (aOR [adjusted odds ratio] 1.62, 95% CI 0.95-2.75 for all adults; aOR 1.24, 95% CI 0.58-2.63 for the elderly). CFS-defined frail patients had significantly higher 30-day readmission/death rates (19% vs 10% for not frail, aOR 2.53, 95% CI 1.40-4.57 for all adults and 21% vs 6% in the elderly, aOR 4.31, 95% CI 1.80-10.31).
Adding the HFRS results to the CFS-based predictive models added little new information, with an integrated discrimination improvement of only 0.009 that was not statistically significant (P = .09, Table 2). In fact, the HFRS was not an independent predictor of postdischarge outcomes after adjusting for age and sex. Although predictive models incorporating the CFS demonstrated the best C statistics, none of the models had high C statistics (ranging between 0.54 and 0.64 for all adults and between 0.55 and 0.68 for those aged >65 years). Even when the frailty definitions were examined as continuous variables, the C statistics were similar as for the dichotomized analyses (0.64 for CFS and 0.58 for HFRS) and the correlation between the two remained weak (Spearman’s correlation coefficient 0.34).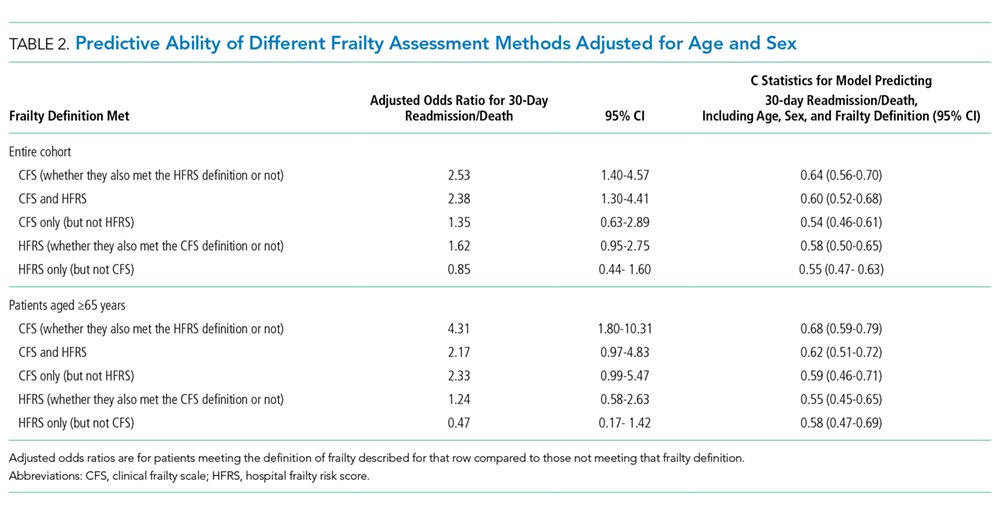
DISCUSSION
We have demonstrated that the prevalence of frailty in patients being discharged from medical wards was high, with the HFRS (44%) being higher than the CFS (33%), and that only 46% of patients deemed frail on the HFRS were also deemed frail on the CFS. We confirm the report by the developers of the HFRS that there was poor correlation between the CFS cumulative deficit model and the administrative-data-based HFRS model in our cohort, even among those older than 65 years.
Previous studies have reported marked heterogeneity in prevalence estimates between different frailty instruments.2,9 For example, Aguayo et al. found that the prevalence of frailty in the English Longitudinal Study of Aging varied between 0.9% and 68% depending on which of the 35 frailty scales they tested were used, although the prevalence with comprehensive geriatric assessments (the gold standard) was 14.9% (and 15.3% on the CFS).9 Although frail patients are at higher risk for death and/or readmission after discharge, other investigators have also reported similar findings to ours that frailty-based risk models are surprisingly modest at predicting postdischarge readmission or death, with the C statistics ranging between 0.52 and 0.57, although the CFS appears to correlate best with the gold standard of comprehensive geriatric assessment.10-14 This is not surprising since the CFS is multidimensional and as a cumulative deficit model, it incorporates assessment of the patient’s underlying diseases, cognition, function, mobility, and mood in the assignment of their CFS level. Regardless, others15 have pointed out the need for studies such as ours to compare the validity of published frailty scales.
Despite our prospective cohort design and blinded endpoint ascertainment, there are some potential limitations to our study. First, we excluded long-term care residents and patients with foreshortened life expectancy – the frailest of the frail – from our analysis of 30-day outcomes, thereby potentially reducing the magnitude of the association between frailty and adverse outcomes. However, we were interested only in situations where clinicians were faced with equipoise about patient prognosis. Second, we assessed only 30-day readmissions or deaths and cannot comment on the impact of frailty definitions on other postdischarge outcomes (such as discharge locale or need for home care services) or other timeframes. Finally, although the association between the HFRS definition of frailty and the 30-day mortality/readmission was not statistically significant, the 95% confidence intervals were wide and thus we cannot definitively rule out a positive association.
In conclusion, considering that it had the strongest association with postdischarge outcomes and is the fastest and easiest to perform, the most useful of the frailty assessment tools for clinicians at the bedside still appears to be the CFS (both overall and in those patients who are elderly). However, for researchers who are analyzing data retrospectively or policy planners looking at health services data where the CFS was not collected, the HFRS holds promise for risk adjustment in population-level studies comparing processes and outcomes between hospitals.
Acknowledgments
The authors would like to acknowledge Miriam Fradette, Debbie Boyko, Sara Belga, Darren Lau, Jenelle Pederson, and Sharry Kahlon for their important contributions in data acquisition in our original cohort study, as well as all the physicians rotating through the general internal medicine wards at the University of Alberta Hospital for their help in identifying the patients. We also thank Dr. Simon Conroy, MB ChB PhD, University of Leicester, UK, for his helpful comments on an earlier draft of this manuscript.
Disclosures
The authors declare no conflicts of interest. All authors had access to the data and played a role in writing and revising this manuscript.
Funding
Funding for this study was provided by an operating grant from Alberta Innovates - Health Solutions. F.A.M. holds the Chair in Cardiovascular Outcomes Research at the Mazankowski Heart Institute, University of Alberta. The authors have no affiliations or financial interests with any organization or entity with a financial interest in the contents of this manuscript.
1. Clegg A, Young J, Iliffe S, Rikkert MO, Rockwood K. Frailty in elderly people. Lancet. 2013;381(9868):752-762. doi: 10.1016/S0140-6736(12)62167-9. PubMed
2. Collard RM, Boter H, Schoevers RA, Oude Voshaar RC. Prevalence of frailty in community-dwelling older persons: a systematic review. J Am Geriatr Soc. 2012;60(8):1487-1492. doi: 10.1111/j.1532-5415.2012.04054.x. PubMed
3. de Vries NM, Staal JB, van Ravensberg CD, Hobbelen JS, Olde Rikkert MG, Nijhuis-van der Sanden MW. Outcome instruments to measure frailty: a systematic review. Ageing Res Rev. 2011;10(1):104-114. doi: 10.1016/j.arr.2010.09.001. PubMed
4. Belga S, Majumdar SR, Kahlon S, et al. Comparing three different measures of frailty in medical inpatients: multicenter prospective cohort study examining 30-day risk of readmission or death. J Hosp Med. 2016;11(8):556-562. doi: 10.1002/jhm.2607. PubMed
5. Rockwood K, Andrew M, Mintnitski A. A comparison of two approaches to measuring frailty in elerly people. J Gerontol. 2007;62(7):738-743. doi: 10.1093/gerona/62.7.738. PubMed
6. Gilbert T, Neuburger J, Kraindler J, et al. Development and validation of a Hospital Frailty Risk Score focusing on older people in acute care settings using electronic hospital records: an observational study. Lancet. 2018;391(10132):1775-1782. doi: 10.1016/S0140-6736(18)30668-8Get. PubMed
7. Kahlon S, Pederson J, Majumdar SR, et al. Association between frailty and 30-day outcomes after discharge from hospital. CMAJ. 2015;187(11):799-804. doi: 10.1503/cmaj.150100. PubMed
8. Pencina MJ, D’ Agostino RB, Vasan RS. Evaluating the added predictive ability of a new marker: from area under the roc curve to reclassification and beyond. Stat Med. 2008;27(2):157-172. doi: 10.1002/sim.2929.
9. Aguayo GA, Donneau A-F, Vaillant MT, et al. Agreement between 35 published frailty scores in the general population. Am J Epidemiol. 2017;186(4):420-434. doi: 10.1093/aje/kwx061. PubMed
10. Ritt M, Bollheimer LC, Siever CC, Gaßmann KG. Prediction of one-year mortality by five different frailty instruments: a comparative study in hospitalized geriatric patients. Arch Gerontol Geriatr. 2016;66:66-72. doi: 10.1016/j.archger.2016.05.004. PubMed
11. Forti P, Rietti E, Pisacane N, Olivelli V, Maltoni B, Ravaglia G. A comparison of frailty indexes for prediction of adverse health outcomes in a elderly cohort. Arch Gerontol Geriatr. 2012;54(1):16-20. doi: 10.1016/j.archger.2011.01.007. PubMed
12. Wou F, Gladman JR, Bradshaw L, Franklin M, Edmans J, Conroy SP. The predictive properties of frailty-rating scales in the acute medical unit. Age Ageing. 2013;42(6):776-781. doi: 10.1093/ageing/aft055. PubMed
13. Wallis SJ, Wall J, Biram RW, Romero-Ortuno R. Association of the clinical frailty scale with hospital outcomes. QJM. 2015;108(12):943-949. doi: 10.1093/qjmed/hcv066. PubMed
14. Harmand MGC, Meillon C, Bergua V, et al. Comparing the predictive value of three definitions of frailty: results from the Three-City Study. Arch Gerontol Geriatr. 2017;72:153-163. doi: 10.1016/j.archger.2017.06.005. PubMed
15. Bouillon K, Kivimaki M, Hamer M, et al. Measures of frailty in population-based studies: an overview. BMC Geriatrics. 2013;13(1):64. doi: 10.1186/1471-2318-13-64. PubMed
Frailty is associated with adverse outcomes in hospitalized patients, including longer length of stay, increased risk of institutionalization at discharge, and higher rates of readmissions or death postdischarge.1-4 Multiple tools have been developed to evaluate frailty and in an earlier study,4 we compared the three most common of these and demonstrated that the Clinical Frailty Scale (CFS)5 was the most useful tool clinically as it was most strongly associated with adverse events in the first 30 days after discharge. However, it must be collected prospectively and requires contact with patients or proxies for the evaluator to assign the patient into one of nine categories depending on their disease state, mobility, cognition, and ability to perform instrumental and functional activities of daily living. Recently, a new score has been described which is based on an administrative data algorithm that assigns points to patients having any of 109 ICD-10 codes listed for their index hospitalization and all hospitalizations in the prior two years and can be generated retrospectively without trained observers.6 Although higher Hospital Frailty Risk Scores (HFRS) were associated with greater risk of postdischarge adverse events, the kappa when compared with the CFS was only 0.30 (95% CI 0.22-0.38) in that study.6 However, as the HFRS was developed and validated in patients aged ≥75 years within the UK National Health Service, the authors themselves recommended that it be evaluated in other healthcare systems, other populations, and with comparison to prospectively collected frailty data from cumulative deficit models such as the CFS.
The aim of this study was to compare frailty assessments using the CFS and the HFRS in a population of adult patients hospitalized on general medical wards in North America to determine the impact on prevalence estimates and prediction of outcomes within the first 30 days after hospital discharge (a timeframe highlighted in the Affordable Care Act and used by Centers for Medicare & Medicaid Services as an important hospital quality indicator).
METHODS
As described previously,7 we performed a prospective cohort study of adults without cognitive impairment or life expectancy less than three months being discharged back to the community (not to long-term care facilities) from general medical wards in two teaching hospitals in Edmonton, Alberta, between October 2013 and November 2014. All patients provided signed consent, and the University of Alberta Health Research Ethics board (project ID Pro00036880) approved the study.
Trained observers assessed each patient’s frailty status within 24 hours of discharge based on the patient’s best status in the week prior to becoming ill with the reason for the index hospitalization. The research assistant classified patients into one of the following nine CFS categories: very fit, well, managing well, vulnerable, mildly frail (need help with at least one instrumental activities of daily living such as shopping, finances, meal preparation, or housework), moderately frail (need help with one or two activities of daily living such as bathing and dressing), severely frail (dependent for personal care), very severely frail (bedbound), and terminally ill. According to the CFS validation studies, the last five categories were defined as frail for the purposes of our analyses.
Independent of the trained observer’s assessments, we calculated the HFRS for each participant in our cohort by linking to Alberta administrative data holdings within the Alberta Health Services Data Integration and Measurement Reporting unit and examining all diagnostic codes for the index hospitalization and any other hospitalizations in the prior two years for the 109 ICD-10 codes listed in the original HFRS paper and used the same score cutpoints as they reported (HFRS <5 being low risk, 5-15 defined as intermediate risk, and >15 as high risk for frailty; scores ≥5 were defined as frail).6
All patients were followed after discharge by research personnel blinded to the patient’s frailty assessment. We used patient/caregiver self-report and the provincial electronic health record to collect information on all-cause readmissions or mortality within 30 days.
We have previously reported4,7 the association between frailty defined by the CFS and unplanned readmissions or death within 30 days of discharge but in this study, we examined the correlation between CFS-defined frailty and the HFRS score (classifying those with intermediate or high scores as frail) using chance-corrected kappa coefficients. We also compared the prognostic accuracy of both models for predicting death and/or unplanned readmissions within 30 days using the C statistic and the integrated discrimination improvement index and examined patients aged >65 years as a subgroup.8 We used SAS version 9.4 (SAS Institute, Cary, North Carolina) for analyses, with P values of <.05 considered as statistically significant.
RESULTS
Of the 499 patients in our original cohort,7 we could not link 10 to the administrative data to calculate HFRS, and thus this study sample is only 489 patients (mean age 64 years, 50% women, 52% older than 65 years, a mean of 4.9 comorbidities, and median length of stay five days).
Overall, 276 (56%) patients were deemed frail according to at least one assessment (214 [44%] on the HFRS [35% intermediate risk and 9% high risk] and 161 [33%] on the CFS), and 99 (20%) met both frailty definitions (Appendix Figure). Among the 252 patients aged >65 years, 66 (26%) met both frailty definitions and 166 (66%) were frail according to at least one assessment. Agreement between HFRS and the CFS (kappa 0.24, 95% CI 0.16-0.33) was poor. The CFS definition of frailty was 46% sensitive and 77% specific in classifying frail patients compared with HFRS-defined frailty.
As we reported earlier,4 patients deemed frail were generally similar across scales in that they were older, had more comorbidities, more prescriptions, longer lengths of stay, and poorer quality of life than nonfrail patients (all P < .01, Table 1). However, patients classified as frail on the HFRS only but not meeting the CFS definition were younger, had higher quality of life, and despite a similar Charlson Score and number of comorbidities were much more likely to have been living independently prior to admission than those classified as frail on the CFS.
Death or unplanned readmission within 30 days occurred in 13.3% (65 patients), with most events being readmissions (62, 12.7%). HFRS-defined frail patients exhibited higher 30-day death/readmission rates (16% vs 11% for not frail, P = .08; 14% vs 11% in the elderly, P = .5), which was not statistically significantly different from the nonfrail patients even after adjusting for age and sex (aOR [adjusted odds ratio] 1.62, 95% CI 0.95-2.75 for all adults; aOR 1.24, 95% CI 0.58-2.63 for the elderly). CFS-defined frail patients had significantly higher 30-day readmission/death rates (19% vs 10% for not frail, aOR 2.53, 95% CI 1.40-4.57 for all adults and 21% vs 6% in the elderly, aOR 4.31, 95% CI 1.80-10.31).
Adding the HFRS results to the CFS-based predictive models added little new information, with an integrated discrimination improvement of only 0.009 that was not statistically significant (P = .09, Table 2). In fact, the HFRS was not an independent predictor of postdischarge outcomes after adjusting for age and sex. Although predictive models incorporating the CFS demonstrated the best C statistics, none of the models had high C statistics (ranging between 0.54 and 0.64 for all adults and between 0.55 and 0.68 for those aged >65 years). Even when the frailty definitions were examined as continuous variables, the C statistics were similar as for the dichotomized analyses (0.64 for CFS and 0.58 for HFRS) and the correlation between the two remained weak (Spearman’s correlation coefficient 0.34).
DISCUSSION
We have demonstrated that the prevalence of frailty in patients being discharged from medical wards was high, with the HFRS (44%) being higher than the CFS (33%), and that only 46% of patients deemed frail on the HFRS were also deemed frail on the CFS. We confirm the report by the developers of the HFRS that there was poor correlation between the CFS cumulative deficit model and the administrative-data-based HFRS model in our cohort, even among those older than 65 years.
Previous studies have reported marked heterogeneity in prevalence estimates between different frailty instruments.2,9 For example, Aguayo et al. found that the prevalence of frailty in the English Longitudinal Study of Aging varied between 0.9% and 68% depending on which of the 35 frailty scales they tested were used, although the prevalence with comprehensive geriatric assessments (the gold standard) was 14.9% (and 15.3% on the CFS).9 Although frail patients are at higher risk for death and/or readmission after discharge, other investigators have also reported similar findings to ours that frailty-based risk models are surprisingly modest at predicting postdischarge readmission or death, with the C statistics ranging between 0.52 and 0.57, although the CFS appears to correlate best with the gold standard of comprehensive geriatric assessment.10-14 This is not surprising since the CFS is multidimensional and as a cumulative deficit model, it incorporates assessment of the patient’s underlying diseases, cognition, function, mobility, and mood in the assignment of their CFS level. Regardless, others15 have pointed out the need for studies such as ours to compare the validity of published frailty scales.
Despite our prospective cohort design and blinded endpoint ascertainment, there are some potential limitations to our study. First, we excluded long-term care residents and patients with foreshortened life expectancy – the frailest of the frail – from our analysis of 30-day outcomes, thereby potentially reducing the magnitude of the association between frailty and adverse outcomes. However, we were interested only in situations where clinicians were faced with equipoise about patient prognosis. Second, we assessed only 30-day readmissions or deaths and cannot comment on the impact of frailty definitions on other postdischarge outcomes (such as discharge locale or need for home care services) or other timeframes. Finally, although the association between the HFRS definition of frailty and the 30-day mortality/readmission was not statistically significant, the 95% confidence intervals were wide and thus we cannot definitively rule out a positive association.
In conclusion, considering that it had the strongest association with postdischarge outcomes and is the fastest and easiest to perform, the most useful of the frailty assessment tools for clinicians at the bedside still appears to be the CFS (both overall and in those patients who are elderly). However, for researchers who are analyzing data retrospectively or policy planners looking at health services data where the CFS was not collected, the HFRS holds promise for risk adjustment in population-level studies comparing processes and outcomes between hospitals.
Acknowledgments
The authors would like to acknowledge Miriam Fradette, Debbie Boyko, Sara Belga, Darren Lau, Jenelle Pederson, and Sharry Kahlon for their important contributions in data acquisition in our original cohort study, as well as all the physicians rotating through the general internal medicine wards at the University of Alberta Hospital for their help in identifying the patients. We also thank Dr. Simon Conroy, MB ChB PhD, University of Leicester, UK, for his helpful comments on an earlier draft of this manuscript.
Disclosures
The authors declare no conflicts of interest. All authors had access to the data and played a role in writing and revising this manuscript.
Funding
Funding for this study was provided by an operating grant from Alberta Innovates - Health Solutions. F.A.M. holds the Chair in Cardiovascular Outcomes Research at the Mazankowski Heart Institute, University of Alberta. The authors have no affiliations or financial interests with any organization or entity with a financial interest in the contents of this manuscript.
1. Clegg A, Young J, Iliffe S, Rikkert MO, Rockwood K. Frailty in elderly people. Lancet. 2013;381(9868):752-762. doi: 10.1016/S0140-6736(12)62167-9. PubMed
2. Collard RM, Boter H, Schoevers RA, Oude Voshaar RC. Prevalence of frailty in community-dwelling older persons: a systematic review. J Am Geriatr Soc. 2012;60(8):1487-1492. doi: 10.1111/j.1532-5415.2012.04054.x. PubMed
3. de Vries NM, Staal JB, van Ravensberg CD, Hobbelen JS, Olde Rikkert MG, Nijhuis-van der Sanden MW. Outcome instruments to measure frailty: a systematic review. Ageing Res Rev. 2011;10(1):104-114. doi: 10.1016/j.arr.2010.09.001. PubMed
4. Belga S, Majumdar SR, Kahlon S, et al. Comparing three different measures of frailty in medical inpatients: multicenter prospective cohort study examining 30-day risk of readmission or death. J Hosp Med. 2016;11(8):556-562. doi: 10.1002/jhm.2607. PubMed
5. Rockwood K, Andrew M, Mintnitski A. A comparison of two approaches to measuring frailty in elerly people. J Gerontol. 2007;62(7):738-743. doi: 10.1093/gerona/62.7.738. PubMed
6. Gilbert T, Neuburger J, Kraindler J, et al. Development and validation of a Hospital Frailty Risk Score focusing on older people in acute care settings using electronic hospital records: an observational study. Lancet. 2018;391(10132):1775-1782. doi: 10.1016/S0140-6736(18)30668-8Get. PubMed
7. Kahlon S, Pederson J, Majumdar SR, et al. Association between frailty and 30-day outcomes after discharge from hospital. CMAJ. 2015;187(11):799-804. doi: 10.1503/cmaj.150100. PubMed
8. Pencina MJ, D’ Agostino RB, Vasan RS. Evaluating the added predictive ability of a new marker: from area under the roc curve to reclassification and beyond. Stat Med. 2008;27(2):157-172. doi: 10.1002/sim.2929.
9. Aguayo GA, Donneau A-F, Vaillant MT, et al. Agreement between 35 published frailty scores in the general population. Am J Epidemiol. 2017;186(4):420-434. doi: 10.1093/aje/kwx061. PubMed
10. Ritt M, Bollheimer LC, Siever CC, Gaßmann KG. Prediction of one-year mortality by five different frailty instruments: a comparative study in hospitalized geriatric patients. Arch Gerontol Geriatr. 2016;66:66-72. doi: 10.1016/j.archger.2016.05.004. PubMed
11. Forti P, Rietti E, Pisacane N, Olivelli V, Maltoni B, Ravaglia G. A comparison of frailty indexes for prediction of adverse health outcomes in a elderly cohort. Arch Gerontol Geriatr. 2012;54(1):16-20. doi: 10.1016/j.archger.2011.01.007. PubMed
12. Wou F, Gladman JR, Bradshaw L, Franklin M, Edmans J, Conroy SP. The predictive properties of frailty-rating scales in the acute medical unit. Age Ageing. 2013;42(6):776-781. doi: 10.1093/ageing/aft055. PubMed
13. Wallis SJ, Wall J, Biram RW, Romero-Ortuno R. Association of the clinical frailty scale with hospital outcomes. QJM. 2015;108(12):943-949. doi: 10.1093/qjmed/hcv066. PubMed
14. Harmand MGC, Meillon C, Bergua V, et al. Comparing the predictive value of three definitions of frailty: results from the Three-City Study. Arch Gerontol Geriatr. 2017;72:153-163. doi: 10.1016/j.archger.2017.06.005. PubMed
15. Bouillon K, Kivimaki M, Hamer M, et al. Measures of frailty in population-based studies: an overview. BMC Geriatrics. 2013;13(1):64. doi: 10.1186/1471-2318-13-64. PubMed
© 2019 Society of Hospital Medicine
Things We Do For No Reason: Failing to Question a Penicillin Allergy History
Inspired by the ABIM Foundation’s Choosing Wisely® campaign, the “Things We Do for No Reason” (TWDFNR) series reviews practices that have become common parts of hospital care but may provide little value to our patients. Practices reviewed in the TWDFNR series do not represent “black and white” conclusions or clinical practice standards but are meant as a starting place for research and active discussions among hospitalists and patients. We invite you to be part of that discussion.

CLINICAL SCENARIO
An 80-year-old male—with a past medical history significant for hypertension, atrial fibrillation, and type II diabetes mellitus—presented to the hospital with fevers, confusion, and urinary outflow tract difficulties. On exam, he was noted to have mild suprapubic tenderness with flank tenderness. Blood and urine cultures grew Enterococcus faecalis sensitive to ampicillin. Because of the patient’s listed penicillin (PCN) allergy, he was started on aztreonam and vancomycin instead of ampicillin.
WHY YOU MIGHT SIMPLY ACCEPT A PCN ALLERGY HISTORY
Ten percent of the population in the United States reports an allergy to penicillin and derivatives—one of the most commonly reported drug allergies.1 Allergic reactions to drugs are distinct immune reactions mediated by drug-specific immunoglobulin E (IgE) that are potentially life-threatening. Specifically these allergic reactions are called IgE-mediated, type 1 hypersensitivity reactions which are characterized by hives; itching; flushing; tissue swelling, especially in areas of the face and neck; bronchospasm; and gastrointestinal (GI) symptoms, including cramping and diarrhea. Head and neck swelling can quickly result in airway compromise. Profound fluid extravasation and release of mediators from mast cells and basophils can rapidly drop blood pressure. Anaphylaxis requires rapid intervention to prevent severe complications and death. Given the life-threatening consequences of anaphylaxis, a cautious approach before administering PCN to PCN-allergic patients is mandatory.
WHY YOU SHOULD QUESTION A REPORTED PCN ALLERGY
While 10% of the adult population and 15% of hospitalized adults report PCN allergy, clinical studies suggest that 90% of all patients reporting a PCN allergy can tolerate PCN antibiotics.1-3 There are several reasons patients initially labeled as PCN allergic may later be able to tolerate this drug. First, patients can lose sensitivity to specific PCN IgE antibodies over time if PCN is avoided.4 Second, non-IgE-mediated immune reactions of skin or GI tract are often wrongly attributed to an IgE-mediated process from a concurrent medication (Table). For example, viral infections can cause exanthems or hives which may be mistaken for an antibiotic-associated IgE-meditated allergic reaction.6 These non-IgE skin reactions include severe manifestations including Stevens-Johnson syndrome (SJS) and toxic epidermal necrolysis or benign adverse reactions such as GI upset, dizziness, or diarrhea which are often misclassified as an allergy, and this error is perpetuated in the medical record. Third, patients may report a PCN allergy for themselves when a family member is possibly allergic.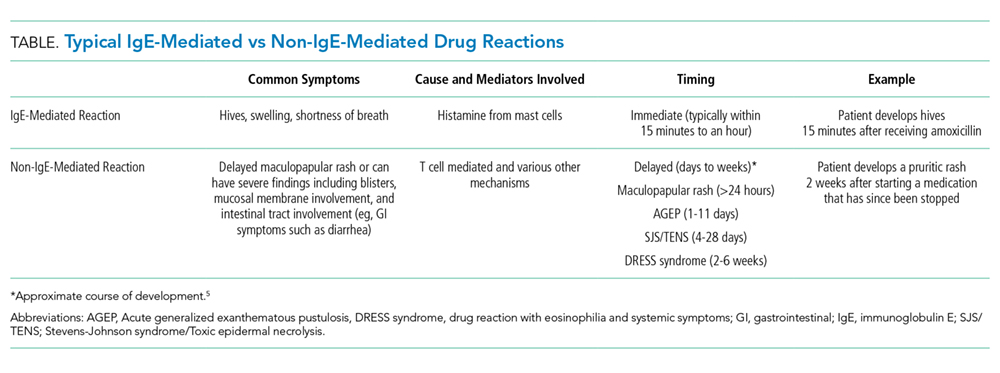
PCN allergy has risen to the level of a public health issue as PCN-allergic patients are often relegated to second-line broad-spectrum antibiotics.7 This public health issue is exacerbated when patients with faux or resolved PCN allergy receive the same treatment. Patients labeled as PCN allergic—whether correctly or incorrectly—have poorer outcomes as noted by increased rates of serious infections and tend to have longer hospital stays.8-10 Treatment-related secondary infections from the use of broad-spectrum antibiotics, such as Clostridiiodes difficile and vancomycin-resistant Enterococcus, are identified more frequently in PCN-allergic patients.7 Additionally, pregnant women with PCN allergy, with or without group B streptococcus infections, have higher rates of cesarean sections and longer hospitalizations.11 The misuse and overuse of antibiotics, especially broad-spectrum medications, has led to resistant bacteria that are increasingly difficult to treat.7 Treating with the most narrow-spectrum antibiotic whenever possible is critical. Overall, failure to address and assess PCN allergy can result in treatment failures and unnecessary broad-spectrum antibiotic use.
WHEN YOU SHOULD BELIEVE A REPORTED PCN AND BETA-LACTAMS ALLERGY HISTORY
Avoid beta-lactams for patients with a reported allergy who are medically frail (eg, critically ill intensive care unit patients and those unable to communicate) or have a documented allergic reaction to a beta-lactam within five years. An estimated 50% of patients who had a documented true IgE-mediated allergic reaction within five years of a documented true allergic reaction remain allergic to PCN and are at risk for an allergic reaction with reexposure.1 PCN allergy evaluation with PCN skin testing (PST) and oral challenge in patients who had a reaction within five years have a higher risk of a fatal outcome with an oral challenge despite negative skin testing. PCN allergy evaluation is best handled on a case by case basis in this population.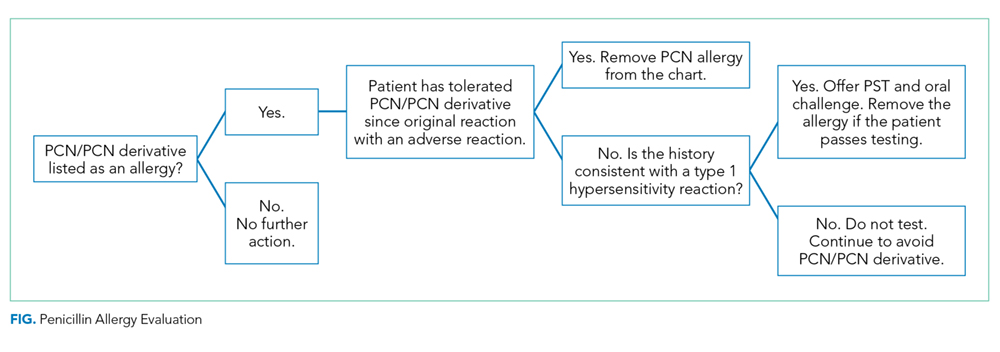
WHAT YOU SHOULD DO INSTEAD
Obtain a thorough drug allergy history. If the history is not consistent with a personal history of an IgE-mediated reaction to PCN ever or if there is documentation that PCN was administered and tolerated since the reaction (eg, a dental prescription), a PCN or beta-lactam can be given. An exception to this rule are patients with a history of an allergic reaction to both a cephalosporin and a PCN—approach this as two separate allergies. Remove the PCN allergy if it is not consistent with the history of IgE-mediated reaction or the patient subsequently had tolerated a PCN/PCN derivative. Regarding the cephalosporin issue, patients are often allergic to a side chain of the cephalosporin and not to the beta-lactam ring. Patients should avoid the specific cephalosporin unless the history is also not consistent with an IgE-mediated reaction or the patient had subsequently tolerated this medication. An allergy evaluation can be useful to discern next steps for cephalosporin allergy. Once the antibiotic is administered and tolerated, the medical record should be updated as well to prevent future mislabeling.
If the symptoms associated with a reported history of a PCN allergy are unknown or consistent with an IgE-mediated reaction, or the patient has not been exposed to PCN since the allergic reaction, the patient should undergo PST followed by a supervised oral test dose to determine whether the allergy exists or persists. PCN allergy evaluation is a simple two-step process of PST followed by an oral challenge of amoxicillin. The use of PCN allergy testing as described is validated and safe.12 A negative skin prick and intradermal test have a negative predictive value that approaches 100%.12,13 Completing the final step—the oral challenge—eliminates concerns for false-negative testing results and patient fears. Additionally, once a patient has had negative skin testing and passed an oral challenge, he/she is not at increased risk of resensitization after PCN/PCN derivative use.14
Although the test takes one and a half hours on average, the benefits that follow are lifelong. Improving future management by disproving a reported allergy affects an individual patient’s clinical course globally, results in cost savings, and increases the use of narrow-spectrum antimicrobials. It is particularly important to test PCN-allergic patients preemptively who are at high risk of requiring PCN/PCN derivative antibiotics. High-risk patients include, but are not limited to, surgery, transplant, hematology/oncology, and immunosuppressed patients. Inpatients with PCN allergy have higher antibiotic costs—both for medications used during their hospitalization and also for discharge medications.15 A study by Macy and Contreras compared the cost of skin testing to money saved by shortening hospitalization days for 51,582 patients with PCN allergy.7 The cost for testing was $131.37 each (total of $6.7 million). The testing contributed to a $64 million savings for the three-year study period—savings that is 9.5 times larger than the cost of the evaluation.8 A smaller study that looked at cost-effectiveness of PST for 50 patients found an overall cost savings of $11,005 due to the antimicrobial choice alone ($297 per patient switched to a beta-lactam antibiotic).16
RECOMMENDATIONS
- Obtain a thorough drug allergy history as many “allergic reactions” can be removed by history alone. Update the medical record if you can confirm a patient has since tolerated PCN or a PCN derivative to which they were previously allergic. Offer a supervised oral challenge if the patient has any concerns.
- Perform PST if a patient has a PCN allergy listed in their chart and the allergy history is unclear. A negative skin test should be followed by a supervised oral challenge to PCN/PCN derivative if skin testing is negative.
- Test PCN-allergic patients preemptively who are at high risk of requiring PCN/PCN derivative antibiotics. High-risk patients include surgery, transplant, hematology/oncology, and immunosuppressed patients.
- Implement published protocols from allergists for healthcare systems that lack access to allergy physicians.
- Do not perform PST on patients with a history that is suggestive of a non-IgE-mediated allergic reaction. For these cases, patients are advised to avoid the medication. A supervised graded oral challenge can be considered on a case by case basis if the reaction was not a severe cutaneous adverse reaction syndrome, like SJS, and the benefit of using the medication outweighs the potential harm.
CONCLUSION
The patient, in this case, reported an allergic reaction to PCN over 50 years before this presentation. The reported reaction immediately after receiving IV PCN was a rash—a symptom concerning for an IgE-mediated reaction. Since the patient is well over 10 years from his allergic reaction and would benefit from a PCN derivative, PST testing should be pursued.
The patient passed his skin testing and an oral challenge dose of amoxicillin. With the PCN allergy removed from his chart, his medical team transitioned him from aztreonam and vancomycin to ampicillin. He was then discharged home on amoxicillin and informed that he might be safely treated with PCN/PCN derivatives in the future.
Given the rise in antimicrobial resistance and both the clinical implications and increased costs associated with PCN allergy, it is crucial to offer an allergy evaluation to patients identified as PCN allergic. Hospitalists play a crucial role in obtaining the initial history, determining if the patient has tolerated the antibiotic since the initial reaction, and identifying patients who may benefit from further evaluation for PCN allergy. In hospitals with PST available for inpatients, testing can be performed during the admission. Additionally, it is essential that allergists work with hospitalists and primary care physicians to provide seamless access to outpatient drug allergy evaluations (PST followed by oral challenge) to address the issue of PCN allergy before an acute need for a PCN/PCN derivative antibiotic in the hospital.
Do you think this is a low-value practice? Is this truly a “Thing We Do for No Reason?” Share what you do in your practice and join in the conversation online by retweeting it on Twitter (#TWDFNR) and liking it on Facebook. We invite you to propose ideas for other “Things We Do for No Reason” topics by e-mailing TWDFNR@hospitalmedicine.org.
Disclosures
The authors have no conflicts of interest.
Funding
This work is supported by the following NIH Grant: T-32 AI007062-39.
1. American Academy of Allergy, Asthma and Immunology, the American College of Allergy, Asthma and Immunology, and the Joint Council of Allergy, Asthma and Immunology. Drug allergy: an updated practice parameter. Ann Allergy Asthma Immunol. 2010;105(4):259-273. https://doi.org/10.1016/j.anai.2010.08.002.
2. American Academy of Allergy AI. Ten things physicians and patients should question Choosing Wisely, ABIM Foundation 2014. http://www.choosingwisely.org/clinician-lists/american-academy-allergy-asthma-immunlogy-non-beta-lactam-antibiotics-penicillin-allergy/. Accessed October 23, 2017.
3. Blumenthal KG, Wickner PG, Hurwitz S, et al. Tackling inpatient penicillin allergies: Assessing tools for antimicrobial stewardship. J Allergy Clin Immunol. 2017;140(1):154-161. https://doi.org/10.1016/j.jaci.2017.02.005.
4. Blanca M, Torres MJ, Garcia JJ, et al. Natural evolution of skin test sensitivity in patients allergic to beta-lactam antibiotics. J Allergy Clin Immunol. 1999;103(5):918-924. https://doi.org/10.1016/S0091-6749(99)70439-2.
5. Duong TA Valeyrie-Allanore L, Wolkenstein P, Chosidow O. Severe cutaneous adverse reactions to drugs. Lancet. 2017;390(10106:1996-2011. doi:10.1016/S0140-6736(16)30378-6.
6. Gonzalez-Estrada A, Radojicic C. Penicillin allergy: a practical guide for clinicians. Cleve Clin J Med. 2015;82(5):295-300. https://doi.org/10.3949/ccjm.82a.14111.
7. Solensky R. Penicillin allergy as a public health measure. J Allergy Clin Immunol. 2014;133(3):797-798. https://doi.org/10.1016/j.jaci.2013.10.032.
8. Macy E, Contreras R. Health care use and serious infection prevalence associated with penicillin “allergy” in hospitalized patients: a cohort study. J Allergy Clin Immunol. 2014;133(3):790-796. https://doi.org/10.1016/j.jaci.2013.09.021.
9. Chen JR, Khan DA. Evaluation of penicillin allergy in the hospitalized patient: opportunities for antimicrobial stewardship. Curr Allergy Asthma Rep. 2017;17(6):40. https://doi.org/10.1007/s11882-017-0706-1.
10. Blumenthal KG, Wickner PG, Hurwitz S, et al. Tackling inpatient penicillin allergies: Assessing tools for antimicrobial stewardship. J Allergy Clin Immunol. 2017;140(1):154-161. https://doi.org/10.1016/j.jaci.2017.02.005.
11. Desai SH, Kaplan MS, Chen Q, Macy EM. Morbidity in pregnant women associated with unverified penicillin allergies, antibiotic use, and group B Streptococcus infections. Perm J. 2017;21. https://doi.org/10.7812/TPP/16-080.
12. Macy E, Ngor EW. Safely diagnosing clinically significant penicillin allergy using only penicilloyl-poly-lysine, penicillin, and oral amoxicillin. J Allergy Clin Immunol Pract. 2013;1(3):258-263. https://doi.org/10.1016/j.jaip.2013.02.002.
13. Solensky R. The time for penicillin skin testing is here. J Allergy Clin Immunol Pract. 2013;1(3):264-265. https://doi.org/10.1016/j.jaip.2013.03.010.
14. Solensky R, Earl HS, Gruchalla RS. Lack of penicillin resensitization in patients with a history of penicillin allergy after receiving repeated penicillin courses. Arch Intern Med. 2002;162(7):822-826.
15. Sade K, Holtzer I, Levo Y, Kivity S. The economic burden of antibiotic treatment of penicillin-allergic patients in internal medicine wards of a general tertiary care hospital. Clin Exp Allergy. 2003;33(4):501-506. https://doi.org/10.1046/j.1365-2222.2003.01638.x.
16. King EA, Challa S, Curtin P, Bielory L. Penicillin skin testing in hospitalized patients with beta-lactam allergies: effect on antibiotic selection and cost. Ann Allergy Asthma Immunol. 2016;117(1):67-71. https://doi.org/10.1016/j.anai.2016.04.021.
Inspired by the ABIM Foundation’s Choosing Wisely® campaign, the “Things We Do for No Reason” (TWDFNR) series reviews practices that have become common parts of hospital care but may provide little value to our patients. Practices reviewed in the TWDFNR series do not represent “black and white” conclusions or clinical practice standards but are meant as a starting place for research and active discussions among hospitalists and patients. We invite you to be part of that discussion.
CLINICAL SCENARIO
An 80-year-old male—with a past medical history significant for hypertension, atrial fibrillation, and type II diabetes mellitus—presented to the hospital with fevers, confusion, and urinary outflow tract difficulties. On exam, he was noted to have mild suprapubic tenderness with flank tenderness. Blood and urine cultures grew Enterococcus faecalis sensitive to ampicillin. Because of the patient’s listed penicillin (PCN) allergy, he was started on aztreonam and vancomycin instead of ampicillin.
WHY YOU MIGHT SIMPLY ACCEPT A PCN ALLERGY HISTORY
Ten percent of the population in the United States reports an allergy to penicillin and derivatives—one of the most commonly reported drug allergies.1 Allergic reactions to drugs are distinct immune reactions mediated by drug-specific immunoglobulin E (IgE) that are potentially life-threatening. Specifically these allergic reactions are called IgE-mediated, type 1 hypersensitivity reactions which are characterized by hives; itching; flushing; tissue swelling, especially in areas of the face and neck; bronchospasm; and gastrointestinal (GI) symptoms, including cramping and diarrhea. Head and neck swelling can quickly result in airway compromise. Profound fluid extravasation and release of mediators from mast cells and basophils can rapidly drop blood pressure. Anaphylaxis requires rapid intervention to prevent severe complications and death. Given the life-threatening consequences of anaphylaxis, a cautious approach before administering PCN to PCN-allergic patients is mandatory.
WHY YOU SHOULD QUESTION A REPORTED PCN ALLERGY
While 10% of the adult population and 15% of hospitalized adults report PCN allergy, clinical studies suggest that 90% of all patients reporting a PCN allergy can tolerate PCN antibiotics.1-3 There are several reasons patients initially labeled as PCN allergic may later be able to tolerate this drug. First, patients can lose sensitivity to specific PCN IgE antibodies over time if PCN is avoided.4 Second, non-IgE-mediated immune reactions of skin or GI tract are often wrongly attributed to an IgE-mediated process from a concurrent medication (Table). For example, viral infections can cause exanthems or hives which may be mistaken for an antibiotic-associated IgE-meditated allergic reaction.6 These non-IgE skin reactions include severe manifestations including Stevens-Johnson syndrome (SJS) and toxic epidermal necrolysis or benign adverse reactions such as GI upset, dizziness, or diarrhea which are often misclassified as an allergy, and this error is perpetuated in the medical record. Third, patients may report a PCN allergy for themselves when a family member is possibly allergic.
PCN allergy has risen to the level of a public health issue as PCN-allergic patients are often relegated to second-line broad-spectrum antibiotics.7 This public health issue is exacerbated when patients with faux or resolved PCN allergy receive the same treatment. Patients labeled as PCN allergic—whether correctly or incorrectly—have poorer outcomes as noted by increased rates of serious infections and tend to have longer hospital stays.8-10 Treatment-related secondary infections from the use of broad-spectrum antibiotics, such as Clostridiiodes difficile and vancomycin-resistant Enterococcus, are identified more frequently in PCN-allergic patients.7 Additionally, pregnant women with PCN allergy, with or without group B streptococcus infections, have higher rates of cesarean sections and longer hospitalizations.11 The misuse and overuse of antibiotics, especially broad-spectrum medications, has led to resistant bacteria that are increasingly difficult to treat.7 Treating with the most narrow-spectrum antibiotic whenever possible is critical. Overall, failure to address and assess PCN allergy can result in treatment failures and unnecessary broad-spectrum antibiotic use.
WHEN YOU SHOULD BELIEVE A REPORTED PCN AND BETA-LACTAMS ALLERGY HISTORY
Avoid beta-lactams for patients with a reported allergy who are medically frail (eg, critically ill intensive care unit patients and those unable to communicate) or have a documented allergic reaction to a beta-lactam within five years. An estimated 50% of patients who had a documented true IgE-mediated allergic reaction within five years of a documented true allergic reaction remain allergic to PCN and are at risk for an allergic reaction with reexposure.1 PCN allergy evaluation with PCN skin testing (PST) and oral challenge in patients who had a reaction within five years have a higher risk of a fatal outcome with an oral challenge despite negative skin testing. PCN allergy evaluation is best handled on a case by case basis in this population.
WHAT YOU SHOULD DO INSTEAD
Obtain a thorough drug allergy history. If the history is not consistent with a personal history of an IgE-mediated reaction to PCN ever or if there is documentation that PCN was administered and tolerated since the reaction (eg, a dental prescription), a PCN or beta-lactam can be given. An exception to this rule are patients with a history of an allergic reaction to both a cephalosporin and a PCN—approach this as two separate allergies. Remove the PCN allergy if it is not consistent with the history of IgE-mediated reaction or the patient subsequently had tolerated a PCN/PCN derivative. Regarding the cephalosporin issue, patients are often allergic to a side chain of the cephalosporin and not to the beta-lactam ring. Patients should avoid the specific cephalosporin unless the history is also not consistent with an IgE-mediated reaction or the patient had subsequently tolerated this medication. An allergy evaluation can be useful to discern next steps for cephalosporin allergy. Once the antibiotic is administered and tolerated, the medical record should be updated as well to prevent future mislabeling.
If the symptoms associated with a reported history of a PCN allergy are unknown or consistent with an IgE-mediated reaction, or the patient has not been exposed to PCN since the allergic reaction, the patient should undergo PST followed by a supervised oral test dose to determine whether the allergy exists or persists. PCN allergy evaluation is a simple two-step process of PST followed by an oral challenge of amoxicillin. The use of PCN allergy testing as described is validated and safe.12 A negative skin prick and intradermal test have a negative predictive value that approaches 100%.12,13 Completing the final step—the oral challenge—eliminates concerns for false-negative testing results and patient fears. Additionally, once a patient has had negative skin testing and passed an oral challenge, he/she is not at increased risk of resensitization after PCN/PCN derivative use.14
Although the test takes one and a half hours on average, the benefits that follow are lifelong. Improving future management by disproving a reported allergy affects an individual patient’s clinical course globally, results in cost savings, and increases the use of narrow-spectrum antimicrobials. It is particularly important to test PCN-allergic patients preemptively who are at high risk of requiring PCN/PCN derivative antibiotics. High-risk patients include, but are not limited to, surgery, transplant, hematology/oncology, and immunosuppressed patients. Inpatients with PCN allergy have higher antibiotic costs—both for medications used during their hospitalization and also for discharge medications.15 A study by Macy and Contreras compared the cost of skin testing to money saved by shortening hospitalization days for 51,582 patients with PCN allergy.7 The cost for testing was $131.37 each (total of $6.7 million). The testing contributed to a $64 million savings for the three-year study period—savings that is 9.5 times larger than the cost of the evaluation.8 A smaller study that looked at cost-effectiveness of PST for 50 patients found an overall cost savings of $11,005 due to the antimicrobial choice alone ($297 per patient switched to a beta-lactam antibiotic).16
RECOMMENDATIONS
- Obtain a thorough drug allergy history as many “allergic reactions” can be removed by history alone. Update the medical record if you can confirm a patient has since tolerated PCN or a PCN derivative to which they were previously allergic. Offer a supervised oral challenge if the patient has any concerns.
- Perform PST if a patient has a PCN allergy listed in their chart and the allergy history is unclear. A negative skin test should be followed by a supervised oral challenge to PCN/PCN derivative if skin testing is negative.
- Test PCN-allergic patients preemptively who are at high risk of requiring PCN/PCN derivative antibiotics. High-risk patients include surgery, transplant, hematology/oncology, and immunosuppressed patients.
- Implement published protocols from allergists for healthcare systems that lack access to allergy physicians.
- Do not perform PST on patients with a history that is suggestive of a non-IgE-mediated allergic reaction. For these cases, patients are advised to avoid the medication. A supervised graded oral challenge can be considered on a case by case basis if the reaction was not a severe cutaneous adverse reaction syndrome, like SJS, and the benefit of using the medication outweighs the potential harm.
CONCLUSION
The patient, in this case, reported an allergic reaction to PCN over 50 years before this presentation. The reported reaction immediately after receiving IV PCN was a rash—a symptom concerning for an IgE-mediated reaction. Since the patient is well over 10 years from his allergic reaction and would benefit from a PCN derivative, PST testing should be pursued.
The patient passed his skin testing and an oral challenge dose of amoxicillin. With the PCN allergy removed from his chart, his medical team transitioned him from aztreonam and vancomycin to ampicillin. He was then discharged home on amoxicillin and informed that he might be safely treated with PCN/PCN derivatives in the future.
Given the rise in antimicrobial resistance and both the clinical implications and increased costs associated with PCN allergy, it is crucial to offer an allergy evaluation to patients identified as PCN allergic. Hospitalists play a crucial role in obtaining the initial history, determining if the patient has tolerated the antibiotic since the initial reaction, and identifying patients who may benefit from further evaluation for PCN allergy. In hospitals with PST available for inpatients, testing can be performed during the admission. Additionally, it is essential that allergists work with hospitalists and primary care physicians to provide seamless access to outpatient drug allergy evaluations (PST followed by oral challenge) to address the issue of PCN allergy before an acute need for a PCN/PCN derivative antibiotic in the hospital.
Do you think this is a low-value practice? Is this truly a “Thing We Do for No Reason?” Share what you do in your practice and join in the conversation online by retweeting it on Twitter (#TWDFNR) and liking it on Facebook. We invite you to propose ideas for other “Things We Do for No Reason” topics by e-mailing TWDFNR@hospitalmedicine.org.
Disclosures
The authors have no conflicts of interest.
Funding
This work is supported by the following NIH Grant: T-32 AI007062-39.
1. American Academy of Allergy, Asthma and Immunology, the American College of Allergy, Asthma and Immunology, and the Joint Council of Allergy, Asthma and Immunology. Drug allergy: an updated practice parameter. Ann Allergy Asthma Immunol. 2010;105(4):259-273. https://doi.org/10.1016/j.anai.2010.08.002.
2. American Academy of Allergy AI. Ten things physicians and patients should question Choosing Wisely, ABIM Foundation 2014. http://www.choosingwisely.org/clinician-lists/american-academy-allergy-asthma-immunlogy-non-beta-lactam-antibiotics-penicillin-allergy/. Accessed October 23, 2017.
3. Blumenthal KG, Wickner PG, Hurwitz S, et al. Tackling inpatient penicillin allergies: Assessing tools for antimicrobial stewardship. J Allergy Clin Immunol. 2017;140(1):154-161. https://doi.org/10.1016/j.jaci.2017.02.005.
4. Blanca M, Torres MJ, Garcia JJ, et al. Natural evolution of skin test sensitivity in patients allergic to beta-lactam antibiotics. J Allergy Clin Immunol. 1999;103(5):918-924. https://doi.org/10.1016/S0091-6749(99)70439-2.
5. Duong TA Valeyrie-Allanore L, Wolkenstein P, Chosidow O. Severe cutaneous adverse reactions to drugs. Lancet. 2017;390(10106:1996-2011. doi:10.1016/S0140-6736(16)30378-6.
6. Gonzalez-Estrada A, Radojicic C. Penicillin allergy: a practical guide for clinicians. Cleve Clin J Med. 2015;82(5):295-300. https://doi.org/10.3949/ccjm.82a.14111.
7. Solensky R. Penicillin allergy as a public health measure. J Allergy Clin Immunol. 2014;133(3):797-798. https://doi.org/10.1016/j.jaci.2013.10.032.
8. Macy E, Contreras R. Health care use and serious infection prevalence associated with penicillin “allergy” in hospitalized patients: a cohort study. J Allergy Clin Immunol. 2014;133(3):790-796. https://doi.org/10.1016/j.jaci.2013.09.021.
9. Chen JR, Khan DA. Evaluation of penicillin allergy in the hospitalized patient: opportunities for antimicrobial stewardship. Curr Allergy Asthma Rep. 2017;17(6):40. https://doi.org/10.1007/s11882-017-0706-1.
10. Blumenthal KG, Wickner PG, Hurwitz S, et al. Tackling inpatient penicillin allergies: Assessing tools for antimicrobial stewardship. J Allergy Clin Immunol. 2017;140(1):154-161. https://doi.org/10.1016/j.jaci.2017.02.005.
11. Desai SH, Kaplan MS, Chen Q, Macy EM. Morbidity in pregnant women associated with unverified penicillin allergies, antibiotic use, and group B Streptococcus infections. Perm J. 2017;21. https://doi.org/10.7812/TPP/16-080.
12. Macy E, Ngor EW. Safely diagnosing clinically significant penicillin allergy using only penicilloyl-poly-lysine, penicillin, and oral amoxicillin. J Allergy Clin Immunol Pract. 2013;1(3):258-263. https://doi.org/10.1016/j.jaip.2013.02.002.
13. Solensky R. The time for penicillin skin testing is here. J Allergy Clin Immunol Pract. 2013;1(3):264-265. https://doi.org/10.1016/j.jaip.2013.03.010.
14. Solensky R, Earl HS, Gruchalla RS. Lack of penicillin resensitization in patients with a history of penicillin allergy after receiving repeated penicillin courses. Arch Intern Med. 2002;162(7):822-826.
15. Sade K, Holtzer I, Levo Y, Kivity S. The economic burden of antibiotic treatment of penicillin-allergic patients in internal medicine wards of a general tertiary care hospital. Clin Exp Allergy. 2003;33(4):501-506. https://doi.org/10.1046/j.1365-2222.2003.01638.x.
16. King EA, Challa S, Curtin P, Bielory L. Penicillin skin testing in hospitalized patients with beta-lactam allergies: effect on antibiotic selection and cost. Ann Allergy Asthma Immunol. 2016;117(1):67-71. https://doi.org/10.1016/j.anai.2016.04.021.
©2019 Society of Hospital Medicine
Genetic signature helps ID MS risk
Also today, the CDC has a plan to cut undiagnosed and untreated HIV, which patients who have diabetes benefit the most from long-term metformin, and why amlodopine may be the best choice for lowering blood pressure in black patients.
Amazon Alexa
Apple Podcasts
Google Podcasts
Spotify
Also today, the CDC has a plan to cut undiagnosed and untreated HIV, which patients who have diabetes benefit the most from long-term metformin, and why amlodopine may be the best choice for lowering blood pressure in black patients.
Amazon Alexa
Apple Podcasts
Google Podcasts
Spotify
Also today, the CDC has a plan to cut undiagnosed and untreated HIV, which patients who have diabetes benefit the most from long-term metformin, and why amlodopine may be the best choice for lowering blood pressure in black patients.
Amazon Alexa
Apple Podcasts
Google Podcasts
Spotify

Study Provides Insight Into Alcohol’s Effects on the Brain
The findings could lead the way to understanding the brain’s intake and output of energy in good health and bad and the part that alcohol plays.
In previous studies, the researchers have shown that alcohol significantly affects brain glucose metabolism, a measure of energy use, as well as regional brain activity, assessed through changes in blood oxygenation. But regional differences in glucose metabolism are hard to interpret, they say. In a study with healthy volunteers, they used brain imaging techniques to help quantify “match and mismatch” in energy consumption and expenditure across the brain—what they termed power and cost.
The researchers assessed power by observing to what extent brain regions are active and use energy, and cost by observing how brain regions expended energy. They found that different brain regions that serve distinct functions have “notably different power and different cost.”
Next, they tested a group of light drinkers and heavy drinkers and found both acute and chronic exposure to alcohol affected power and cost. In heavy drinkers, the researchers say, they saw less regional power, for example, in the thalamus, the sensory gateway, and frontal cortex. The researchers interpreted the decreases in power as reflecting the toxic effects of long-term exposure to alcohol on the brain cells.
They also found power dropped in the visual regions during acute alcohol exposure, which was related to disruption of visual processing. Visual regions also had the most significant drops in cost of activity during intoxication. That is consistent with the reliance of those regions on alternative energy sources, such as acetate (a byproduct of alcohol metabolism), the researchers say.
Their approach for characterizing brain energetic patterns related to alcohol use could be useful in other ways, the researchers say. “Studying energetic signatures of brain regions in different neuropsychiatric diseases is an important future direction,” said co-lead investigator Dr. Ehsan Schokri-Kojori. “The measures of power and cost may provide new multimodal biomarkers.”
Sjögren’s syndrome risk increases with infections
Patients with a history of infection have nearly double the risk of developing Sjögren’s syndrome when compared with the general population (odds ratio, 1.9; 95% confidence interval, 1.6-2.3), according to new findings reported online March 20 in the Journal of Internal Medicine (doi: 10.1111/joim.12888).
The risk is almost three times higher among patients with a history of infection plus Ro/SSA and La/SSB antibodies (OR, 2.7; 95% CI, 2.0-3.5). The study included 945 Swedish patients with primary Sjögren’s syndrome and compared their data with those from 9,048 matched controls from the general population.
We previously covered results from this study when they were presented at the International Symposium on Sjögren’s Syndrome in Washington. Read our previous story at the link above.
FROM THE JOURNAL OF INTERNAL MEDICINE
Disease burden in OA worse than RA 6 months post presentation
Patients with osteoarthritis (OA) have RAPID3 scores at their initial visit (16.0) similar to patients with rheumatoid arthritis (RA) and either prior use of disease-modifying antirheumatic drugs (DMARDs) or no exposure to DMARDs (15.6 and 15.5, respectively). After 6 months of treatment, the RAPID3 (Routine Assessment of Patient Index Data 3) score fell by just 1.7 points for patients with OA, compared with 5.7 points in RA patients naive to DMARDs and 4.3 points in those with prior DMARD exposure. These findings were published March 20 in Arthritis & Rheumatology (doi: 10.1002/art.40869).
We reported this story at the 2018 World Congress on Osteoarthritis before it was published in the journal. Read the story at the link above.
FROM ARTHRITIS & RHEUMATOLOGY
Opportunistic salpingectomy appears to reduce risk of ovarian cancer
Women at high risk of ovarian cancer secondary to genetic predisposition (BRCA gene mutation, Lynch syndrome) still are recommended to undergo bilateral salpingo-oophorectomy after completion of child bearing or by age 40-45 years depending on the specific mutation and family history. For a woman not at risk of hereditary-related ovarian cancer, opportunistic salpingectomy would appear to reduce the risk of ovarian cancer.

Unlike bilateral tubal ligation, which has a greater protective risk of endometrioid and clear-cell carcinoma of the ovary, as well. A Swedish population-based cohort study involving over a quarter of a million women undergoing benign surgery noted a statistically significant decrease in ovarian cancer risk with salpingectomy. The degree of risk reduction was greater when bilateral salpingectomy was performed.1 Moreover, a Danish case-control study of over 13,000 women with ovarian cancer demonstrated a 42% decrease in epithelial carcinoma risk following bilateral salpingectomy.2
Bilateral salpingectomy does not appear to decrease ovarian function. A study by Venturella et al. that compared 91 women undergoing bilateral salpingectomy with 95 women with mesosalpinx removal within the tubes during salpingectomy observed no significant difference in change of ovarian reserve.3 Moreover, Kotlyar et al. performed a literature review and noted similar findings.4 Finally, in another study by Venturella et al. no effects were noted 3-5 years following prophylactic bilateral salpingectomy on ovarian reserve in women undergoing total laparoscopic hysterectomy in their late reproductive years, compared with healthy women with intact uterus and adnexa.5
Introduction of opportunistic salpingectomy secondary to potential ovarian cancer reduction has seen increased adoption over the years. A U.S. study of 400,000 hysterectomies performed for benign indications from 1998 to 2011 showed an increased annual rate of bilateral salpingectomy of 8% (1998-2008) and a 24% annual increase (2008-2011).6 A retrospective study of 12,143 hysterectomies performed within a large U.S. health care system reported an increased rate of salpingectomy from 15% in 2011 to 45% in 2012 to 73% in 2014.7
Given the fact that the American College of Obstetricians and Gynecologists and the AAGL recommend vaginal hysterectomy as the approach of choice when feasible, tips and tricks on opportunistic salpingectomy form an important topic.
For this edition of the Master Class in Gynecologic Surgery, I have enlisted the assistance of Rosanne M. Kho, MD. Dr. Kho’s academic and clinical work focuses on advancing vaginal and minimally invasive surgery. Dr. Kho is a strong advocate of the vaginal approach for benign hysterectomy and is recognized for her passion for bringing vaginal surgery back into the armamentarium of the gynecologic surgeon. Dr. Kho is published in the field of gynecologic surgery, having authored many peer-reviewed manuscripts and book chapters. She is currently an associate editor for the Journal of Minimally Invasive Gynecology (JMIG).
It is truly a pleasure to welcome Dr. Kho to this edition of the Master Class in Gynecologic Surgery.
Dr. Miller is a clinical associate professor at the University of Illinois in Chicago and past president of the AAGL. He is a reproductive endocrinologist and minimally invasive gynecologic surgeon in metropolitan Chicago and the director of minimally invasive gynecologic surgery at Advocate Lutheran General Hospital, Park Ridge, Ill. He has no disclosures relevant to this Master Class.
References
1. J Natl Cancer Inst. 2015 Jan 27. doi: 10.1093/jnci/dju410.
2. Acta Obstet Gynecol Scand. 2015 Jan;94(1):86-94.
3. Fertil Steril. 2015 Nov;104(5):1332-9.
4. J Minim Invasive Gynecol. 2017 May-Jun;24(4):563-78.
5. J Minim Invasive Gynecol. 2017 Jan 1;24(1):145-50.
6. Am J Obstet Gynecol. 2015 Nov;213(5):713.e1-13.
7. Obstet Gynecol. 2016 Aug;128(2):277-83.
Women at high risk of ovarian cancer secondary to genetic predisposition (BRCA gene mutation, Lynch syndrome) still are recommended to undergo bilateral salpingo-oophorectomy after completion of child bearing or by age 40-45 years depending on the specific mutation and family history. For a woman not at risk of hereditary-related ovarian cancer, opportunistic salpingectomy would appear to reduce the risk of ovarian cancer.
Unlike bilateral tubal ligation, which has a greater protective risk of endometrioid and clear-cell carcinoma of the ovary, as well. A Swedish population-based cohort study involving over a quarter of a million women undergoing benign surgery noted a statistically significant decrease in ovarian cancer risk with salpingectomy. The degree of risk reduction was greater when bilateral salpingectomy was performed.1 Moreover, a Danish case-control study of over 13,000 women with ovarian cancer demonstrated a 42% decrease in epithelial carcinoma risk following bilateral salpingectomy.2
Bilateral salpingectomy does not appear to decrease ovarian function. A study by Venturella et al. that compared 91 women undergoing bilateral salpingectomy with 95 women with mesosalpinx removal within the tubes during salpingectomy observed no significant difference in change of ovarian reserve.3 Moreover, Kotlyar et al. performed a literature review and noted similar findings.4 Finally, in another study by Venturella et al. no effects were noted 3-5 years following prophylactic bilateral salpingectomy on ovarian reserve in women undergoing total laparoscopic hysterectomy in their late reproductive years, compared with healthy women with intact uterus and adnexa.5
Introduction of opportunistic salpingectomy secondary to potential ovarian cancer reduction has seen increased adoption over the years. A U.S. study of 400,000 hysterectomies performed for benign indications from 1998 to 2011 showed an increased annual rate of bilateral salpingectomy of 8% (1998-2008) and a 24% annual increase (2008-2011).6 A retrospective study of 12,143 hysterectomies performed within a large U.S. health care system reported an increased rate of salpingectomy from 15% in 2011 to 45% in 2012 to 73% in 2014.7
Given the fact that the American College of Obstetricians and Gynecologists and the AAGL recommend vaginal hysterectomy as the approach of choice when feasible, tips and tricks on opportunistic salpingectomy form an important topic.
For this edition of the Master Class in Gynecologic Surgery, I have enlisted the assistance of Rosanne M. Kho, MD. Dr. Kho’s academic and clinical work focuses on advancing vaginal and minimally invasive surgery. Dr. Kho is a strong advocate of the vaginal approach for benign hysterectomy and is recognized for her passion for bringing vaginal surgery back into the armamentarium of the gynecologic surgeon. Dr. Kho is published in the field of gynecologic surgery, having authored many peer-reviewed manuscripts and book chapters. She is currently an associate editor for the Journal of Minimally Invasive Gynecology (JMIG).
It is truly a pleasure to welcome Dr. Kho to this edition of the Master Class in Gynecologic Surgery.
Dr. Miller is a clinical associate professor at the University of Illinois in Chicago and past president of the AAGL. He is a reproductive endocrinologist and minimally invasive gynecologic surgeon in metropolitan Chicago and the director of minimally invasive gynecologic surgery at Advocate Lutheran General Hospital, Park Ridge, Ill. He has no disclosures relevant to this Master Class.
References
1. J Natl Cancer Inst. 2015 Jan 27. doi: 10.1093/jnci/dju410.
2. Acta Obstet Gynecol Scand. 2015 Jan;94(1):86-94.
3. Fertil Steril. 2015 Nov;104(5):1332-9.
4. J Minim Invasive Gynecol. 2017 May-Jun;24(4):563-78.
5. J Minim Invasive Gynecol. 2017 Jan 1;24(1):145-50.
6. Am J Obstet Gynecol. 2015 Nov;213(5):713.e1-13.
7. Obstet Gynecol. 2016 Aug;128(2):277-83.

Can prophylactic salpingectomies be achieved with the vaginal approach?
In the last decade, there has been a major shift in our understanding of the pathogenesis of ovarian cancers. Current literature suggests that many high-grade serous carcinomas develop from the distal aspect of the fallopian tube and that serous tubal intraepithelial carcinoma is likely the precursor. The critical role that the fallopian tubes play as the likely origin of many serous ovarian and pelvic cancers has resulted in a shift from prophylactic salpingo-oophorectomy, which may increase risk for cardiovascular disease, to prophylactic bilateral salpingectomy (PBS) at the time of hysterectomy.

It is important that this shift occur with vaginal hysterectomy (VH) and not only with other surgical approaches. It is known that PBS is performed more commonly during laparoscopic or abdominal hysterectomy, and it’s possible that the need for adnexal surgery may further contribute to the decline in the rate of VH performed in the United States. This is despite evidence that the vaginal approach is preferred for benign hysterectomy even in patients with a nonprolapsed and large fibroid uterus, obesity, or previous pelvic surgery. Current American College of Obstetricians and Gynecologists’ guidelines also state that the need to perform adnexal surgery is not a contraindication to the vaginal approach.
So that more women may attain the benefits and advantages of VH, we need more effective teaching programs for vaginal surgery in residency training programs, hospitals, and community surgical centers. Moreover, we must appreciate that PBS with VH is safe and feasible. There are multiple techniques and tools available to facilitate the successful removal of the tubes, particularly in difficult cases.
The benefit and safety of PBS
Is PBS really effective in decreasing the incidence and mortality of ovarian cancer? A proposed randomized trial in Sweden with a target accrual of 4,400 patients – the Hysterectomy and Opportunistic Salpingectromy Study (HOPPSA, NCT03045965) – will evaluate the risk of ovarian cancer over a 10- to 30-year follow-up period in patients undergoing hysterectomy through all routes. While we wait for these prospective results, an elegant decision-model analysis suggests that routine PBS during VH would eliminate one diagnosis of ovarian cancer for every 225 women undergoing hysterectomy (reducing the risk from 0.956% to 0.511%) and would prevent one death for every 450 women (reducing the risk from 0.478% to 0.256%). The analysis, which drew upon published literature, Medicare reimbursement data, and the National Surgical Quality Improvement Program database, also found that PBS with VH is a less expensive strategy than VH alone because of an increased risk of future adnexal surgery in women retaining their tubes.1

The question of whether PBS places a woman at risk for early menopause is a relevant one. A study following women for 3-5 years after surgery showed that the addition of PBS to total laparoscopic hysterectomy in women of reproductive age does not appear to modify ovarian function.2 However, a recently published retrospective study from the Swedish National Registry showed that women who underwent PBS with abdominal or laparoscopic benign hysterectomy had an increased risk of menopausal symptoms 1 year after surgery.3 Women between the ages of 45-49 years were at highest risk, suggesting increased vulnerability to possible vascular effects of PBS. A longer follow-up period may be necessary to assess younger age groups.
In a multicenter, prospective and observational trial involving 69 patients undergoing VH, PBS was feasible in 75% (a majority of whom [78%] had pelvic organ prolapse) and increased operating time by 11 minutes with no additional complications noted. The surgeons in this study, primarily urogynecologists, utilized a clamp or double-clamp technique to remove the fimbriae.4
The decision-model analysis mentioned above found that PBS would involve slightly more complications than VH alone (7.95% vs. 7.68%),1 and a systematic review that I coauthored of PBS in low-risk women found a small to no increase in operative time and no additional estimated blood loss, hospital stay, or complications for PBS.5
Tools and techniques
Vaginal PBS can be accomplished easily with traditional clamp-cut-tie technique in cases where the fallopian tubes are accessible, such as in patients with uterine prolapse. Generally, most surgeons perform a distal fimbriectomy only for risk-reduction purposes because this is where precursor lesions known as serous tubal intraepithelial cancer (STIC) reside.
To perform a fimbriectomy in cases where the distal portion of the tube is easily accessible, a Kelly clamp is placed across the mesosalpinx, and a fine tie is used for ligature. In more challenging hysterectomy cases, such as in lack of uterine prolapse, large fibroid uterus, morbid obesity, and in patients with previous tubal ligation, the fallopian tubes can be more difficult to access. In these cases, I prefer the use of the vessel-sealing device to seal and divide the mesosalpinx.
Here I describe three specific techniques that can facilitate the removal of the fallopian tubes in more challenging cases. In each technique, the entire fallopian tubes are removed – without leaving behind the proximal stump. The residual stump has the potential of developing into a hydrosalpinx that may necessitate another procedure in the future for the patient.
Separate the fallopian tube before clamping the ‘utero-ovarian ligament’ technique
Before completion of the hysterectomy and clamping of the round ligament/fallopian tube/utero-ovarian ligament (RFUO) complex (commonly referred as the “utero-ovarian ligament”), I recommend first identifying the proximal portion of the fallopian tube. The isthmus is sealed and divided from its attachment to the uterine cornua, and a clamp is placed on the remaining round ligament/utero-ovarian ligament complex. The pedicle is then cut and tied. (Figure 1.) After removal of the uterus, the fallopian tube is ready to be grasped with an Allis clamp or Babcock forceps, and the remaining mesosalpinx is sealed and divided all the way to the distal portion/fimbriae.
Round ligament–mesosalpinx technique
When the uterus is large or lacks prolapse, the fallopian tubes can be difficult to visualize. In such cases, I recommend the use of the round ligament–mesosalpinx technique. After completion of the hysterectomy and ligation of the RFUO complex, a long and moist vaginal pack (I prefer the 4” x 36” cotton vaginal pack by Dukal) is used to push the bowels back and expose the adnexae. The round ligament is identified within the RFUO complex and transected using a monopolar instrument. This step that separates the round ligament from the RFUO complex successfully releases the adnexae from the pelvic sidewall, making it easier to access the fallopian tubes (and the ovaries, when needed). A window is created in the mesosalpinx, and a curved clamp is placed on the ovarian vessels. Using sharp scissors, the proximal portion of the fallopian tube contained within the RFUO complex is separated, and the mesosalpinx is sealed and divided all the way to the distal end using the vessel-sealing device. (Figure 2.)
vNOTES (transvaginal Natural Orifice Translumenal Endoscopic Surgery) salpingectomy technique

When the adnexae is noted to be high in the pelvis or when it is adherent to the pelvic sidewall, I recommend the vNOTES technique. It involves insertion of a mini-gel port into the vaginal opening. (Figure 3.) A 5-mm or 10-mm scope is inserted through this port for visualization. The fallopian tube can be grasped with a laparoscopic grasper and the mesosalpinx sealed and divided using a vessel-sealing device. (Figure 4.) Often, because the bowel is already retracted up with the vaginal pack, insufflation is not necessary with this procedure.

The change in our understanding of the etiology of ovarian cancer calls for salpingectomy during hysterectomy. With such tools, devices, and techniques that facilitate the vaginal removal of the fallopian tubes, the need for prophylactic salpingectomy should not be a deterrent to pursuing a hysterectomy vaginally.
Dr. Kho is head of the section of benign gynecology at the Cleveland Clinic.
References
1. Am J Obstet Gynecol. 2017;217(5):503-4.
2. J Minim Invasive Gynecol. 2017 Jan 1;24(1):145-50.
3. Am J Obstet Gynecol. 2019;220:85.e1-10.
4. Am J Obstet Gynecol. 2017;217:605.e1-5.
5. J Minim Invasive Gynecol. 2017 Feb;24(2):218-29.
In the last decade, there has been a major shift in our understanding of the pathogenesis of ovarian cancers. Current literature suggests that many high-grade serous carcinomas develop from the distal aspect of the fallopian tube and that serous tubal intraepithelial carcinoma is likely the precursor. The critical role that the fallopian tubes play as the likely origin of many serous ovarian and pelvic cancers has resulted in a shift from prophylactic salpingo-oophorectomy, which may increase risk for cardiovascular disease, to prophylactic bilateral salpingectomy (PBS) at the time of hysterectomy.
It is important that this shift occur with vaginal hysterectomy (VH) and not only with other surgical approaches. It is known that PBS is performed more commonly during laparoscopic or abdominal hysterectomy, and it’s possible that the need for adnexal surgery may further contribute to the decline in the rate of VH performed in the United States. This is despite evidence that the vaginal approach is preferred for benign hysterectomy even in patients with a nonprolapsed and large fibroid uterus, obesity, or previous pelvic surgery. Current American College of Obstetricians and Gynecologists’ guidelines also state that the need to perform adnexal surgery is not a contraindication to the vaginal approach.
So that more women may attain the benefits and advantages of VH, we need more effective teaching programs for vaginal surgery in residency training programs, hospitals, and community surgical centers. Moreover, we must appreciate that PBS with VH is safe and feasible. There are multiple techniques and tools available to facilitate the successful removal of the tubes, particularly in difficult cases.
The benefit and safety of PBS
Is PBS really effective in decreasing the incidence and mortality of ovarian cancer? A proposed randomized trial in Sweden with a target accrual of 4,400 patients – the Hysterectomy and Opportunistic Salpingectromy Study (HOPPSA, NCT03045965) – will evaluate the risk of ovarian cancer over a 10- to 30-year follow-up period in patients undergoing hysterectomy through all routes. While we wait for these prospective results, an elegant decision-model analysis suggests that routine PBS during VH would eliminate one diagnosis of ovarian cancer for every 225 women undergoing hysterectomy (reducing the risk from 0.956% to 0.511%) and would prevent one death for every 450 women (reducing the risk from 0.478% to 0.256%). The analysis, which drew upon published literature, Medicare reimbursement data, and the National Surgical Quality Improvement Program database, also found that PBS with VH is a less expensive strategy than VH alone because of an increased risk of future adnexal surgery in women retaining their tubes.1
The question of whether PBS places a woman at risk for early menopause is a relevant one. A study following women for 3-5 years after surgery showed that the addition of PBS to total laparoscopic hysterectomy in women of reproductive age does not appear to modify ovarian function.2 However, a recently published retrospective study from the Swedish National Registry showed that women who underwent PBS with abdominal or laparoscopic benign hysterectomy had an increased risk of menopausal symptoms 1 year after surgery.3 Women between the ages of 45-49 years were at highest risk, suggesting increased vulnerability to possible vascular effects of PBS. A longer follow-up period may be necessary to assess younger age groups.
In a multicenter, prospective and observational trial involving 69 patients undergoing VH, PBS was feasible in 75% (a majority of whom [78%] had pelvic organ prolapse) and increased operating time by 11 minutes with no additional complications noted. The surgeons in this study, primarily urogynecologists, utilized a clamp or double-clamp technique to remove the fimbriae.4
The decision-model analysis mentioned above found that PBS would involve slightly more complications than VH alone (7.95% vs. 7.68%),1 and a systematic review that I coauthored of PBS in low-risk women found a small to no increase in operative time and no additional estimated blood loss, hospital stay, or complications for PBS.5
Tools and techniques
Vaginal PBS can be accomplished easily with traditional clamp-cut-tie technique in cases where the fallopian tubes are accessible, such as in patients with uterine prolapse. Generally, most surgeons perform a distal fimbriectomy only for risk-reduction purposes because this is where precursor lesions known as serous tubal intraepithelial cancer (STIC) reside.
To perform a fimbriectomy in cases where the distal portion of the tube is easily accessible, a Kelly clamp is placed across the mesosalpinx, and a fine tie is used for ligature. In more challenging hysterectomy cases, such as in lack of uterine prolapse, large fibroid uterus, morbid obesity, and in patients with previous tubal ligation, the fallopian tubes can be more difficult to access. In these cases, I prefer the use of the vessel-sealing device to seal and divide the mesosalpinx.
Here I describe three specific techniques that can facilitate the removal of the fallopian tubes in more challenging cases. In each technique, the entire fallopian tubes are removed – without leaving behind the proximal stump. The residual stump has the potential of developing into a hydrosalpinx that may necessitate another procedure in the future for the patient.
Separate the fallopian tube before clamping the ‘utero-ovarian ligament’ technique
Before completion of the hysterectomy and clamping of the round ligament/fallopian tube/utero-ovarian ligament (RFUO) complex (commonly referred as the “utero-ovarian ligament”), I recommend first identifying the proximal portion of the fallopian tube. The isthmus is sealed and divided from its attachment to the uterine cornua, and a clamp is placed on the remaining round ligament/utero-ovarian ligament complex. The pedicle is then cut and tied. (Figure 1.) After removal of the uterus, the fallopian tube is ready to be grasped with an Allis clamp or Babcock forceps, and the remaining mesosalpinx is sealed and divided all the way to the distal portion/fimbriae.
Round ligament–mesosalpinx technique
When the uterus is large or lacks prolapse, the fallopian tubes can be difficult to visualize. In such cases, I recommend the use of the round ligament–mesosalpinx technique. After completion of the hysterectomy and ligation of the RFUO complex, a long and moist vaginal pack (I prefer the 4” x 36” cotton vaginal pack by Dukal) is used to push the bowels back and expose the adnexae. The round ligament is identified within the RFUO complex and transected using a monopolar instrument. This step that separates the round ligament from the RFUO complex successfully releases the adnexae from the pelvic sidewall, making it easier to access the fallopian tubes (and the ovaries, when needed). A window is created in the mesosalpinx, and a curved clamp is placed on the ovarian vessels. Using sharp scissors, the proximal portion of the fallopian tube contained within the RFUO complex is separated, and the mesosalpinx is sealed and divided all the way to the distal end using the vessel-sealing device. (Figure 2.)
vNOTES (transvaginal Natural Orifice Translumenal Endoscopic Surgery) salpingectomy technique
When the adnexae is noted to be high in the pelvis or when it is adherent to the pelvic sidewall, I recommend the vNOTES technique. It involves insertion of a mini-gel port into the vaginal opening. (Figure 3.) A 5-mm or 10-mm scope is inserted through this port for visualization. The fallopian tube can be grasped with a laparoscopic grasper and the mesosalpinx sealed and divided using a vessel-sealing device. (Figure 4.) Often, because the bowel is already retracted up with the vaginal pack, insufflation is not necessary with this procedure.
The change in our understanding of the etiology of ovarian cancer calls for salpingectomy during hysterectomy. With such tools, devices, and techniques that facilitate the vaginal removal of the fallopian tubes, the need for prophylactic salpingectomy should not be a deterrent to pursuing a hysterectomy vaginally.
Dr. Kho is head of the section of benign gynecology at the Cleveland Clinic.
References
1. Am J Obstet Gynecol. 2017;217(5):503-4.
2. J Minim Invasive Gynecol. 2017 Jan 1;24(1):145-50.
3. Am J Obstet Gynecol. 2019;220:85.e1-10.
4. Am J Obstet Gynecol. 2017;217:605.e1-5.
5. J Minim Invasive Gynecol. 2017 Feb;24(2):218-29.
Cannabis use, potency linked to psychotic disorder risk
Daily cannabis use, particularly high-potency cannabis, might be a significant contributor to the incidence of psychotic disorder, results of a multicenter, case-control study suggest.

“We provide the first direct evidence that cannabis use has an effect on variation in the incidence of psychotic disorders,” Marta Di Forti, PhD, and her coauthors wrote in the Lancet.
In the study, Dr. Di Forti and her coauthors looked at cannabis use in 901 patients presenting with a first psychotic episode to one of 11 sites across Europe and Brazil, compared with 1,237 population controls from the same locations. They found that daily cannabis users had more than threefold higher odds of psychotic disorder, compared with individuals who had never used cannabis (odds ratio, 3.2; P less than .0001), even after adjusting for sociodemographic factors and use of tobacco, stimulants, ketamine, and hallucinogenics.
Those who reported using high-potency cannabis (delta 9-tetrahydrocannabinol greater than or equal to 10%) – also showed a significant 60% increase in the odds of psychotic disorder, compared with never-users, which decreased slightly to 50% after controlling for daily use.
“The large sample size and the different types of cannabis available across Europe have allowed us to report that the dose-response relationship characterizing the association between cannabis use and psychosis reflects not only the use of high-potency cannabis but also the daily use of types with an amount of THC consistent with more traditional varieties,” wrote Dr. Di Forti, of the Social, Genetic, and Developmental Psychiatry Centre at King’s College London, and her coauthors.
When the authors looked at the population-attributable fractions, they calculated that 12.2% of cases of first-episode psychosis would be avoided if high-potency cannabis were not available.
(P = .0122), while those who started using high-potency cannabis at that age had more than a doubling of risk (OR, 2.3).
Similarly, those who used high-potency cannabis on a daily basis had nearly fivefold higher odds of psychotic disorder, compared with never-users, while daily users of low-potency had a 2.2-fold increase in risk.
Researchers also examined patterns of cannabis use and psychotic disorder across the 11 sites, which included Amsterdam, London; Cambridge, England; Madrid; Palermo, Italy; Paris; and Ribeirão Preto, Brazil.
They noted that there were significant variations in the incidence of psychotic disorder across the study sites, and that those variations correlated with the prevalence of daily cannabis use.
London and Amsterdam, where daily use was the most common, had the highest adjusted incidence rates of psychotic disorder (45.7 cases per 100,000 person-years in London and 37.9 per 100,000 person-years in Amsterdam). In contrast, the incidence in Bologna, Italy – where daily use was less frequent – was half that of London.
They estimated that 43% of new cases of psychotic disorder in Amsterdam were attributable to daily use of cannabis, and 50.3% were attributable to high-potency cannabis, compared with 1.2% and 2.3% of cases in Puy de Dôme in France.
“Use of high-potency cannabis was a strong predictor of psychotic disorder in Amsterdam, London, and Paris, where high-potency cannabis was widely available, by contrast with sites such as Palermo where this type was not yet available,” the authors wrote. “Our results show that, in areas where daily use and use of high-potency cannabis are more prevalent in the general population, there is an excess of cases of psychotic disorder.”
The authors did point out that the study relied on self-reported cannabis use, rather than biological sampling measures. But previous studies have shown self-reported use to be a reliable measure, they said.
“Education is needed to inform the public about the mental health hazards of regular use of high-potency cannabis, which is becoming increasingly available worldwide,” they wrote.
The study was supported by the Medical Research Council, the European Community’s Seventh Framework Program, the São Paulo Research Foundation, the National Institute for Health Research Biomedical Research Centre, and the Wellcome Trust. Five authors declared personal fees and grants from the pharmaceutical industry. No other conflicts of interest were declared.
SOURCE: Di Forti M et al. Lancet. 2019 Mar 19. doi: 10.1016/S2215-0366(19)30048-3.
Epidemiologic and experimental studies generally have established a link between heavy cannabis use and psychosis. However, a long-running issue has been that, while cannabis use has increased in some populations, the rates of psychosis have not necessarily done the same. The results of this study go against that, suggesting that differing rates and intensity of cannabis use across Europe appear to correlate with differing rates of psychosis.
This does not necessarily imply causality. For example, genetic studies suggest that individuals predisposed to psychosis also may have a predisposition to use cannabis. Another possibility is that subclinical mental health issues existed in those participants before the start of cannabis use. The challenge, therefore, remains to identify which individuals are most at risk from psychosis related to cannabis use, and to develop strategies aimed at mitigating this risk.
Suzanne H. Gage, PhD, is affiliated with the department of psychological sciences at the University of Liverpool in England. These comments are adapted from an accompanying editorial (Lancet. 2019 Mar 19. doi: 10.1016/ S2215-0366[19]30086-0). No conflicts of interest were declared.
Daily cannabis use, particularly high-potency cannabis, might be a significant contributor to the incidence of psychotic disorder, results of a multicenter, case-control study suggest.
“We provide the first direct evidence that cannabis use has an effect on variation in the incidence of psychotic disorders,” Marta Di Forti, PhD, and her coauthors wrote in the Lancet.
In the study, Dr. Di Forti and her coauthors looked at cannabis use in 901 patients presenting with a first psychotic episode to one of 11 sites across Europe and Brazil, compared with 1,237 population controls from the same locations. They found that daily cannabis users had more than threefold higher odds of psychotic disorder, compared with individuals who had never used cannabis (odds ratio, 3.2; P less than .0001), even after adjusting for sociodemographic factors and use of tobacco, stimulants, ketamine, and hallucinogenics.
Those who reported using high-potency cannabis (delta 9-tetrahydrocannabinol greater than or equal to 10%) – also showed a significant 60% increase in the odds of psychotic disorder, compared with never-users, which decreased slightly to 50% after controlling for daily use.
“The large sample size and the different types of cannabis available across Europe have allowed us to report that the dose-response relationship characterizing the association between cannabis use and psychosis reflects not only the use of high-potency cannabis but also the daily use of types with an amount of THC consistent with more traditional varieties,” wrote Dr. Di Forti, of the Social, Genetic, and Developmental Psychiatry Centre at King’s College London, and her coauthors.
When the authors looked at the population-attributable fractions, they calculated that 12.2% of cases of first-episode psychosis would be avoided if high-potency cannabis were not available.
(P = .0122), while those who started using high-potency cannabis at that age had more than a doubling of risk (OR, 2.3).
Similarly, those who used high-potency cannabis on a daily basis had nearly fivefold higher odds of psychotic disorder, compared with never-users, while daily users of low-potency had a 2.2-fold increase in risk.
Researchers also examined patterns of cannabis use and psychotic disorder across the 11 sites, which included Amsterdam, London; Cambridge, England; Madrid; Palermo, Italy; Paris; and Ribeirão Preto, Brazil.
They noted that there were significant variations in the incidence of psychotic disorder across the study sites, and that those variations correlated with the prevalence of daily cannabis use.
London and Amsterdam, where daily use was the most common, had the highest adjusted incidence rates of psychotic disorder (45.7 cases per 100,000 person-years in London and 37.9 per 100,000 person-years in Amsterdam). In contrast, the incidence in Bologna, Italy – where daily use was less frequent – was half that of London.
They estimated that 43% of new cases of psychotic disorder in Amsterdam were attributable to daily use of cannabis, and 50.3% were attributable to high-potency cannabis, compared with 1.2% and 2.3% of cases in Puy de Dôme in France.
“Use of high-potency cannabis was a strong predictor of psychotic disorder in Amsterdam, London, and Paris, where high-potency cannabis was widely available, by contrast with sites such as Palermo where this type was not yet available,” the authors wrote. “Our results show that, in areas where daily use and use of high-potency cannabis are more prevalent in the general population, there is an excess of cases of psychotic disorder.”
The authors did point out that the study relied on self-reported cannabis use, rather than biological sampling measures. But previous studies have shown self-reported use to be a reliable measure, they said.
“Education is needed to inform the public about the mental health hazards of regular use of high-potency cannabis, which is becoming increasingly available worldwide,” they wrote.
The study was supported by the Medical Research Council, the European Community’s Seventh Framework Program, the São Paulo Research Foundation, the National Institute for Health Research Biomedical Research Centre, and the Wellcome Trust. Five authors declared personal fees and grants from the pharmaceutical industry. No other conflicts of interest were declared.
SOURCE: Di Forti M et al. Lancet. 2019 Mar 19. doi: 10.1016/S2215-0366(19)30048-3.
FROM THE LANCET
FDA approves brexanolone for postpartum depression
The Food and Drug Administration on March 19 approved the first medication specifically for the treatment of postpartum depression.

The drug, brexanolone (Zulresso), is to be administered as a single continuous 60-hour infusion for each episode of postpartum depression. . By binding to GABA A receptors, brexanolone increases receptor functionality. The recommended maximum dose of brexanolone is 90 µg/kg/h, and the infusion includes three dosing phases.
Brexanolone provides “an important new treatment option,” said Tiffany Farchione, MD, acting director of the division of psychiatry products in the FDA’s Center for Drug Evaluation and Research, in a press release. “Because of concerns about serious risks, including excessive sedation or sudden loss of consciousness during administration, Zulresso has been approved with a Risk Evaluation and Mitigation Strategy (REMS) and is only available to patients through a restricted distribution program at certified health care facilities where the health care provider can carefully monitor the patient.”
The approval was based on results of three phase 3 trials, which were double-blind, randomized, and placebo-controlled studies in which the primary efficacy endpoint was a change in baseline 60 hours after the start of the infusion on the Hamilton Depression Rating Scale (HAM-D). In all two of the trials, known as Hummingbird 202B and 202C, brexanolone’s impact on the patients’ HAM-D scores was greater than that of placebo, the FDA reported in briefing document released late last year. In addition, the impact of brexanolone on postpartum depression proved both rapid and durable.
Side effects observed in about 3% of the brexanolone patients included dizziness, dry mouth, fatigue, headache, infusion site pain, somnolence, and loss of consciousness. The FDA’s concern about loss of consciousness led the agency to recommend a REMS protocol before a hearing of its Psychopharmacologic Drugs Advisory and Drug Safety and Risk Management Advisory panels late last year. The Zulresso REMS Program will require that the drug be administered by a clinician in a health care facility that is certified. Patients will have to be monitored for excessive sedation and “sudden loss of consciousness and have continuous pulse oximetry monitoring (monitors oxygen levels in the blood),” the FDA said. Another requirement is that patients who receive the infusion will have to be accompanied while interacting with their children. Patients will be advised not to drive, operate machinery or engage in other dangerous activities until they feel totally alert. Those requirements will be addressed in a boxed warning.
The drug should be either adjusted or discontinued for patients whose postpartum depression becomes worse or for those experience suicidal thoughts and behaviors after taking brexanolone, the agency said.
Some physicians use antidepressants to treat postpartum depression, but their effectiveness is limited, according to the FDA. Interventions such as electroconvulsive therapy and psychotherapy also are used, but getting results can several weeks.
The symptoms of postpartum depression are indistinguishable from major depressive disorder, but “the timing of its onset has led to its recognition as potentially unique illness,” the FDA said. Postpartum depression in the United States affects up to 12% of births. In the developed world, suicide is the most common cause of maternal death after childbirth. This suicide risk makes postpartum depression a condition that is life-threatening. In addition, the condition has “profound negative effects on the maternal-infant bond and later infant development,” the FDA said.
SAGE Therapeutics, developer of brexanolone, secured the approval through the FDA’s breakthrough therapy designation process.
Heidi Splete contributed to this article.
The Food and Drug Administration on March 19 approved the first medication specifically for the treatment of postpartum depression.
The drug, brexanolone (Zulresso), is to be administered as a single continuous 60-hour infusion for each episode of postpartum depression. . By binding to GABA A receptors, brexanolone increases receptor functionality. The recommended maximum dose of brexanolone is 90 µg/kg/h, and the infusion includes three dosing phases.
Brexanolone provides “an important new treatment option,” said Tiffany Farchione, MD, acting director of the division of psychiatry products in the FDA’s Center for Drug Evaluation and Research, in a press release. “Because of concerns about serious risks, including excessive sedation or sudden loss of consciousness during administration, Zulresso has been approved with a Risk Evaluation and Mitigation Strategy (REMS) and is only available to patients through a restricted distribution program at certified health care facilities where the health care provider can carefully monitor the patient.”
The approval was based on results of three phase 3 trials, which were double-blind, randomized, and placebo-controlled studies in which the primary efficacy endpoint was a change in baseline 60 hours after the start of the infusion on the Hamilton Depression Rating Scale (HAM-D). In all two of the trials, known as Hummingbird 202B and 202C, brexanolone’s impact on the patients’ HAM-D scores was greater than that of placebo, the FDA reported in briefing document released late last year. In addition, the impact of brexanolone on postpartum depression proved both rapid and durable.
Side effects observed in about 3% of the brexanolone patients included dizziness, dry mouth, fatigue, headache, infusion site pain, somnolence, and loss of consciousness. The FDA’s concern about loss of consciousness led the agency to recommend a REMS protocol before a hearing of its Psychopharmacologic Drugs Advisory and Drug Safety and Risk Management Advisory panels late last year. The Zulresso REMS Program will require that the drug be administered by a clinician in a health care facility that is certified. Patients will have to be monitored for excessive sedation and “sudden loss of consciousness and have continuous pulse oximetry monitoring (monitors oxygen levels in the blood),” the FDA said. Another requirement is that patients who receive the infusion will have to be accompanied while interacting with their children. Patients will be advised not to drive, operate machinery or engage in other dangerous activities until they feel totally alert. Those requirements will be addressed in a boxed warning.
The drug should be either adjusted or discontinued for patients whose postpartum depression becomes worse or for those experience suicidal thoughts and behaviors after taking brexanolone, the agency said.
Some physicians use antidepressants to treat postpartum depression, but their effectiveness is limited, according to the FDA. Interventions such as electroconvulsive therapy and psychotherapy also are used, but getting results can several weeks.
The symptoms of postpartum depression are indistinguishable from major depressive disorder, but “the timing of its onset has led to its recognition as potentially unique illness,” the FDA said. Postpartum depression in the United States affects up to 12% of births. In the developed world, suicide is the most common cause of maternal death after childbirth. This suicide risk makes postpartum depression a condition that is life-threatening. In addition, the condition has “profound negative effects on the maternal-infant bond and later infant development,” the FDA said.
SAGE Therapeutics, developer of brexanolone, secured the approval through the FDA’s breakthrough therapy designation process.
Heidi Splete contributed to this article.