User login
Quitting smoking during pregnancy cuts SUID risk
Odds of sudden unexpected infant death (SUID) more than doubled with maternal prenatal smoking and increased linearly with each additional cigarette mothers smoked during pregnancy, but quitting smoking during pregnancy cut SUID risk, according to a new study in Pediatrics.

“As prevalence of prone sleeping has declined, the relative contribution of prenatal maternal smoking to the risk of sudden infant death has increased,” Tatiana M. Anderson, PhD, of the Seattle Children’s Research Institute and her associates reported. When the researchers considered causality, they estimated that approximately 800 infants (22% of all SUID cases) per year in the United States could be attributed to maternal smoking during pregnancy.
The researchers analyzed 19,127 SUID cases among 20,685,463 births included in the Centers for Disease Control and Prevention Birth Cohort Linked Birth/Infant Death Data Set for 2007-2011. A SUID diagnosis included sudden infant death syndrome, infant death from ill-defined or unknown cause, and accidental suffocation or strangulation in bed for any infants under 1 year old.
When the authors calculated odds related to prenatal maternal smoking and SUID, they adjusted for infant sex and birth weight, gestational length of pregnancy, delivery method (vaginal or cesarean), total prenatal visits, live birth order, maternal marital status and education, and maternal and paternal age and race/ethnicity.
Any maternal smoking at all during pregnancy was associated with more than twice the odds of SUID (adjusted odds ratio, 2.44). Odds of SUID also doubled for smoking one cigarette daily during pregnancy versus smoking none. For each additional cigarette smoked daily during pregnancy, odds of SUID increased by 0.07 up until 20 cigarettes, when the risk evened out, which suggests “that smoking cessation efforts may have greater impact on decreasing SUID rates when directed toward those who smoke fewer than 1 pack per day versus the more traditionally targeted heavy ([more than] 20 cigarettes per day) smokers,” the authors wrote.
Odds of SUID dropped 12% when mothers cut down on smoking during pregnancy and dropped 23% when they quit altogether (aORs, 0.88 and 0.77, respectively). “However, there may be some selection bias because the group who reduced smoking started at a higher average number of cigarettes in the first trimester, whereas those who successfully quit smoked fewer cigarettes in the first trimester,” the authors noted.
Among the 11.6% of mothers who said in 2011 that they smoked in the 3 months leading up to pregnancy, only a quarter quit while pregnant, the authors wrote. Quitting after having smoked before pregnancy was linked to a 47% increased risk of SUID, although the researchers noted that second- and third-hand smoke may have played a role since mothers who smoke may begin smoking again post partum and/or often have a partner who smokes.
“This group may have also included women who stopped smoking as soon as they knew they were pregnant and thus reported that they were nonsmokers in the first trimester, but the fetus had been exposed to maternal smoking during the period before pregnancy was diagnosed,” the authors wrote. They also acknowledged the possibility of residual confounding, particularly from socioeconomic factors or alcohol consumption during pregnancy.
The research was funded by the National Institutes of Health, Microsoft, and the Aaron Matthew Sudden Infant Death Syndrome Research Guild. One author has testified as a paid expert in a SUID case. No other authors reported conflicts of interest.
SOURCE: Anderson TM et al. Pediatrics. 2019 March 11. doi: 10.1542/peds.2018-3325.
Odds of sudden unexpected infant death (SUID) more than doubled with maternal prenatal smoking and increased linearly with each additional cigarette mothers smoked during pregnancy, but quitting smoking during pregnancy cut SUID risk, according to a new study in Pediatrics.
“As prevalence of prone sleeping has declined, the relative contribution of prenatal maternal smoking to the risk of sudden infant death has increased,” Tatiana M. Anderson, PhD, of the Seattle Children’s Research Institute and her associates reported. When the researchers considered causality, they estimated that approximately 800 infants (22% of all SUID cases) per year in the United States could be attributed to maternal smoking during pregnancy.
The researchers analyzed 19,127 SUID cases among 20,685,463 births included in the Centers for Disease Control and Prevention Birth Cohort Linked Birth/Infant Death Data Set for 2007-2011. A SUID diagnosis included sudden infant death syndrome, infant death from ill-defined or unknown cause, and accidental suffocation or strangulation in bed for any infants under 1 year old.
When the authors calculated odds related to prenatal maternal smoking and SUID, they adjusted for infant sex and birth weight, gestational length of pregnancy, delivery method (vaginal or cesarean), total prenatal visits, live birth order, maternal marital status and education, and maternal and paternal age and race/ethnicity.
Any maternal smoking at all during pregnancy was associated with more than twice the odds of SUID (adjusted odds ratio, 2.44). Odds of SUID also doubled for smoking one cigarette daily during pregnancy versus smoking none. For each additional cigarette smoked daily during pregnancy, odds of SUID increased by 0.07 up until 20 cigarettes, when the risk evened out, which suggests “that smoking cessation efforts may have greater impact on decreasing SUID rates when directed toward those who smoke fewer than 1 pack per day versus the more traditionally targeted heavy ([more than] 20 cigarettes per day) smokers,” the authors wrote.
Odds of SUID dropped 12% when mothers cut down on smoking during pregnancy and dropped 23% when they quit altogether (aORs, 0.88 and 0.77, respectively). “However, there may be some selection bias because the group who reduced smoking started at a higher average number of cigarettes in the first trimester, whereas those who successfully quit smoked fewer cigarettes in the first trimester,” the authors noted.
Among the 11.6% of mothers who said in 2011 that they smoked in the 3 months leading up to pregnancy, only a quarter quit while pregnant, the authors wrote. Quitting after having smoked before pregnancy was linked to a 47% increased risk of SUID, although the researchers noted that second- and third-hand smoke may have played a role since mothers who smoke may begin smoking again post partum and/or often have a partner who smokes.
“This group may have also included women who stopped smoking as soon as they knew they were pregnant and thus reported that they were nonsmokers in the first trimester, but the fetus had been exposed to maternal smoking during the period before pregnancy was diagnosed,” the authors wrote. They also acknowledged the possibility of residual confounding, particularly from socioeconomic factors or alcohol consumption during pregnancy.
The research was funded by the National Institutes of Health, Microsoft, and the Aaron Matthew Sudden Infant Death Syndrome Research Guild. One author has testified as a paid expert in a SUID case. No other authors reported conflicts of interest.
SOURCE: Anderson TM et al. Pediatrics. 2019 March 11. doi: 10.1542/peds.2018-3325.
FROM PEDIATRICS
To avoid Hep B reactivation, screen before immunosuppression
CASE A 53-year-old woman you are seeing for the first time has been taking 10 mg of prednisone daily for a month, prescribed by another practitioner for polymyalgia rheumatica. Testing is negative for hepatitis B surface antigen but is positive for hepatitis B core antibody total, indicating a resolved hepatitis B infection. The absence of hepatitis B DNA is confirmed.
How would you proceed with this patient?
Patients with resolved hepatitis B virus (HBV) or chronic hepatitis B (CHB) infections are at risk for HBV reactivation (HBVr) if they undergo immunosuppressive therapy for a condition such as cancer. HBVr can in turn lead to delays in treatment and increased morbidity and mortality.
HBVr is a well-documented adverse outcome in patients treated with rituximab and in those undergoing stem cell transplantation. Current oncology guidelines recommend screening for HBV prior to initiating these treatments.1,2 More recent evidence shows that many other immunosuppressive therapies can also lead to HBVr.3 Such treatments are now used across a multitude of specialties and conditions. For many of these conditions, there are no consistent guidelines regarding HBV screening.
In 2013, the US Food and Drug Administration (FDA) announced the requirement of a Boxed Warning for the immunosuppressive drugs ofatumumab and rituximab. In 2016, the FDA announced the same requirement for certain direct-acting antiviral medicines for hepatitis C virus.
Among patients who are positive for hepatitis-B surface antigen (HBsAg) and who are treated with immunosuppression, the frequency of HBVr has ranged from 0% to 39%.4,5
As the list of immunosuppressive therapies that can cause HBVr grows, specialty guidelines are evolving to address the risk that HBVr poses.
Continue to: An underrecognized problem
An underrecognized problem. CHB affects an estimated 350 million people worldwide6 but remains underrecognized and underdiagnosed. An estimated 1.4 million Americans6 have CHB, but only a minority of them are aware of their positive status and are followed by a hepatologist or receive medical care for their disease.7 Compared with the natural-born US population, a higher prevalence of CHB exists among immigrants to this country from the Asian Pacific and Eastern Mediterranean regions, sub-Saharan Africa, and certain parts of South America.8-10 In 2008, the Centers for Disease Control and Prevention (CDC) updated its recommendations on screening for HBV to include immigrants to the United States from intermediate and high endemic areas.6 Unfortunately, data published on physicians’ adherence to the CDC guidelines for screening show that only 60% correctly screened at-risk patients.11
Individuals with CHB are at risk and rely on a robust immune system to keep their disease from becoming active. During infection, the virus gains entry into the hepatocytes and the double-stranded viral genome is imported into the nucleus of the cell, where it is repaired into covalently closed circular DNA (cccDNA). Research has demonstrated the stability of cccDNA and its persistence as a latent reservoir for HBV reactivation, even decades after recovery from infection.12
Also at risk are individuals who have unrecovered from HBV infection and are HBsAg negative and anti-HBc positive. To avert reverse seroconversion, they also rely on a robust immune system.13 Reverse seroconversion is defined as a reappearance of HBV DNA and HBsAg positivity in individuals who were previously negative.13 In these individuals, HBV DNA may not be quantifiable in circulation, but trace amounts of viral DNA found in the liver are enough to pose a reactivation risk in the setting of immune suppression.14
Moreover, often overlooked is the fact that reactivation or reverse seroconversion can necessitate disruptions and delays in immunosuppressive treatment for other life-threatening disease processes.14,15
Universal screening reduces risk for HBVr. Patients with CHB are at risk for reactivation, as are patients with resolved HBV infection. Many patients, however, do not know their status. By screening all patients before beginning immunosuppressive therapy, physicians can provide effective prophylaxis, which has been shown to significantly reduce the risk for HBVr.8.15
Continue to: Recognizing the onset of HBVr
Recognizing the onset of HBVr
In patients with CHB, HBVr is defined as at least a 3-fold increase in aspart aminotransferase (AST) and alanine aminotransferase (ALT) and at least a 10-fold increase from baseline in HBV DNA. In patients with resolved HBV infection, there may be reverse seroconversion from HbsAg-negative to HBsAg-positive status (TABLE 113,16).

Not all elevations in AST/ALT in patients undergoing chemotherapy or immunosuppressive therapy indicate HBVr. Very often, derangements in AST/ALT may be related to the toxic effects of therapy or to the underlying disease process. However, as immunosuppressive therapy is now used for a wide array of medical conditions, consider HBVr as a potential cause of abnormal liver function in all patients receiving such therapy
A patient is at risk for HBVr when starting immunosuppression and up to a year following the completion of therapy. With suppression of the immune system, HBV replication increases and serum AST/ALT concentrations may rise. HBVr may also present with the appearance of HBV DNA in patients with previously undetectable levels.12,17
Most patients remain asymptomatic, and abnormal AST/ALT levels eventually resolve after completion of immunosuppression. However, some patients' liver enzymes may rise, indicating a more severe hepatic flare. These patients may present with right upper-quadrant tenderness, jaundice, or fatigue. In these cases, recognizing HBVr and starting antivirals may reduce hepatitis flare.
Unfortunately, despite early recognition of HBVr and initiation of appropriate therapy, some patients can progress to hepatic decompensation and even fulminant hepatic failure that may have been prevented with prophylaxis.
Continue to: The justification for universal screening
The justification for universal screening
Although nongastroenterology societies differ in their recommendations on screening for HBV, universal screening before implementing prolonged immunosuppressive treatment is recommended by the CDC,6 the American Association for the Study of Liver Diseases,18 the Asian Pacific Association for the Study of the Liver,19 the European Association for the Study of the Liver,20 and the American Gastroenterological Association (AGA).21
Older guidelines recommended screening only high-risk populations. But such screening has downfalls. It requires that patients or their physicians recognize that they are at high risk. In one study, nearly 65% of an infected Asian-American population was unaware of their positive HBV status.22 Risk-based screening also requires that physicians ask the appropriate questions and that patients admit to high-risk behavior. Screening patients based only on risk factors may easily overlook patients who need prophylaxis against HBVr.
Common arguments against universal screening include the cost of testing, the possibility of false-positive results, and the implications of a new diagnosis of hepatitis B. However, the potential benefits of screening are significant, and HBV screening in the general population has been shown to be cost effective when the prevalence of HBV is 0.3%.21 In the United States, conservative estimates are a prevalence of HBsAg positivity of 0.4% and past infection of 3%, making screening a cost-effective recommendation.16 It is therefore prudent to screen all patients before starting immunosuppressive therapy.
How to screen
All guidelines agree on how to test for HBV. Measuring levels of HBsAg and hepatitis B core antibody (anti-HBc total) allows the clinician to ascertain whether the patient’s HBV infection status is acute, chronic, or resolved (TABLE 223) and to perform HBVr risk stratification (discussed later).

Patients with acute infections should be referred to a hepatologist. With chronic or resolved HBV, stratify patients into a prophylaxis group or monitoring group (FIGURE14). Stratification involves identifying HBV status (chronic or resolved) and selecting a type of immunosuppressive therapy. Whether the patient falls into prophylaxis or monitoring, obtain a baseline level of viral DNA, as this has proven to be the best predictor of HBV reactivation.16

Continue to: In screening, be sure the appropriate...
In screening, be sure the appropriate anti-HBc testing is covered. Common usage of the term anti-HBc may refer to immunoglobulin G (IgG) or immunoglobulin M (IgM)or total core antibody, containing both IgG and IgM. But in this context, accurate screening requires either total core antibody or anti-HBc IgG. Anti-IgM alone is inadequate. Many commercial laboratories offer acute hepatitis panels or hepatitis profiles (TABLE 324,25), and it is important to confirm that such order sets contain the tests necessary to allow for risk stratification.

Testing for hepatitis B surface antibody (anti-HBs) is not useful in screening. Although it was hypothesized that the presence of this antibody lowered risk, recent studies have proven no change in risk based on this value.21
How to assess HBVr risk
Assessing risk for HBVr takes into account both the patient’s serology and intended treatment. Reddy et al delineated patient groups into high, moderate, and low risk (TABLES 4 and 5).21 The high-risk group was defined by anticipated incidence of HBVr in > 10% of cases; the moderate-risk group had an anticipated incidence of 1% to 10%; and the low-risk group had an anticipated incidence of <1%.21 Evidence was strongest in the high-risk group.

Patients with CHB (HBsAg positive and anti-HBc positive) are considered high risk for reactivation with a wide variety of immunosuppressive therapies. Such patients are 5 to 8 times more likely to develop HBVr than patients with an HBsAg-negative status signifying a resolved infection.16

Immunosuppressive agents and associated risks. The AGA guidelines consider treatment with B-cell-depleting agents, such as rituximab and ofatumumab, to be high risk, regardless of a patient’s surface antigen status. Additionally, for patients who are HBsAg positive, high-risk treatments include anthracycline derivatives, such as doxorubicin and epirubicin, or high- or moderate-dose steroids. These treatments are considered moderate risk when used in patients who have resolved HBV infection (HBsAg negative/anti-HBc positive). Moderate-risk modalities also include tumor necrosis factor inhibitors and tyrosine kinase inhibitors, regardless of surface antigen status; and low-dose steroids or cytokine or integrin inhibitors in HbsAg-positive individuals.21
Continue to: Other immunosuppression modalities...
Other immunosuppression modalities considered to be moderate risk independent of HBV serology include proteasome inhibitors, such as bortezomib, used for multiple myeloma treatment, and histone deacetylase inhibitors, such as romidepsin, used to treat T-cell lymphoma.13 Low-dose steroids or cytokine or integrin inhibitors are considered to be low risk in surface antigen-negative individuals; azathioprine, mercaptopurine, or methotrexate are low risk regardless of HBsAg status.21 Intra-articular steroid injections are considered extremely low risk in HbsAg-positive individuals, and are unclassified for HbsAg-negative individuals.13
More recent evidence has implicated other medication classes in triggering HBVr — (eg, direct-acting antivirals.)26
Prophylaxis options: High to moderate risk vs low risk
The consensus of major guideline issuers is to offer prophylaxis to high-risk patients and to monitor low-risk patients. The AGA additionally recommends prophylaxis for patients at moderate risk.
Controversy surrounding the moderate-risk group. Some authors argue that monitoring HBV DNA in the moderate-risk group is preferable to committing patients to long periods of prophylaxis, and that rescue treatment could be initiated as needed. However, the ideal monitoring period has not been determined, and the effectiveness of prophylaxis over monitoring is so significant that monitoring is losing favor.
Perrillo et al performed a meta-analysis of 5 randomized controlled trials evaluating antiviral agents vs no prophylaxis.16 The analysis included 139 patients receiving prophylaxis and 137 controls. The pooled results demonstrated an 87% relative risk reduction with prophylaxis, supporting the trend toward treating patients with moderate risk.16
Continue to: Prophylactic treatment options are safe...
Prophylactic treatment options are safe and well tolerated. For this reason, committing a high- or moderate-risk patient to a course of treatment should be less of a concern than the risk for HBVr.
In the early randomized controlled trials for HBVr prophylaxis, lamivudine, although effective, unfortunately led to a high incidence of viral resistance after prolonged use, thus diminishing its desirability.18 Newer agents, such as entecavir and tenofovir, have proven just as effective as lamivudine and are largely unaffected by viral resistance.27
In retrospective and prospective studies on HBVr prophylaxis, patients treated with entecavir had less HBV-related hepatitis, less delay in chemotherapy, and a lower rate of HBVr when compared with lamivudine.28,29 Tenofovir is recommended, however, if patients were previously treated with lamivudine.30
A recent meta-analysis demonstrated that tenofovir and entecavir are preferable to lamivudine in preventing HBVr.31
Looking ahead
Screening for HBsAg and anti-HBc total before starting immunosuppressive therapy can reduce morbidity and mortality in patients undergoing such treatment. The AGA recommends screening all patients about to begin high- or moderate-risk therapy or patients in populations with a prevalence of CHB ≥2%, per the CDC.6,21
Continue to: Classes of medications...
Classes of medications other than immunosuppressants may also trigger HBVr. The FDA has issued a warning regarding direct-acting antivirals, but optimal management of these patients is still evolving.
Once HBV status is established, a patient’s risk for HBVr can be specified as high, moderate, or low using their HBV status and the type of therapy being initiated. The AGA recommends prophylactic treatment with well-tolerated and effective agents for patients classified as high or moderate risk. If a patient’s risk is low, regular monitoring of HBV DNA and AST and ALT levels is sufficient. Recommendations of monitoring intervals span from monthly to every 3 months.13,14
CASE Given the patient’s status of resolved HBV infection and her current moderate-dose regimen of prednisone, her risk for HBV reactivation is moderate. She could either receive antiviral prophylaxis or undergo regular monitoring. Following a discussion of the options, she opts for referral to a hepatologist to discuss possible prophylactic treatment.
Increased awareness of HBVr risk associated with immunosuppressive therapy, coupled with a planned approach to appropriate screening and risk stratification, can help health care providers prevent the reactivation of HBV or initiate early intervention for CHB.
CORRESPONDENCE
Ronan Farrell, MD, Rhode Island Hospital, 593 Eddy Street, Providence, RI 02903; ronan_farrell@brown.edu.
1. Artz AS, Somerfield MR, Feld JJ, et al. American Society of Clinical Oncology provisional clinical opinion: chronic hepatitis B virus infection screening in patients receiving cytotoxic chemotherapy for treatment of malignant diseases. J Clin Oncol. 2010;28:3199-3202.
2. Day FL, Link E, Thursky K, et al. Current hepatitis B screening practices and clinical experience of reactivation in patients undergoing chemotherapy for solid tumors: a nationwide survey of medical oncologists. J Oncol Pract. 2011;7:141-147.
3. Paul S, Saxena A, Terrin N, et al. Hepatitis B virus reactivation and prophylaxis during solid tumor chemotherapy: a systematic review and meta-analysis. Ann Internal Med. 2016;164:30-40.
4. Kim MK, Ahn JH, Kim SB, et al. Hepatitis B reactivation during adjuvant anthracycline-based chemotherapy in patients with breast cancer: a single institution’s experience. Korean J Intern Med. 2007;22:237-243.
5. Esteve M, Saro C, González-Huix F, et al. Chronic hepatitis B reactivation following infliximab therapy in Crohn’s disease patients: need for primary prophylaxis. Gut. 2004;53:1363-1365.
6. Weinbaum CM, Williams I, Mast EE, et al. Recommendations for identification and public health management of persons with chronic hepatitis B virus infection. MMWR Recomm Rep. 2008;57:1-20.
7. Liang TJ, Block TM, McMahon BJ, et al. Present and future therapies of hepatitis B: from discovery to cure. Hepatology. 2015;62:1893-1908.
8, , , A mathematical model to estimate global hepatitis B disease burden and vaccination impact. Int J Epidemiol. 2005;34:1329-1339.
9. WHO. Hepatitis B. www.who.int/en/news-room/fact-sheets/detail/hepatitis-b. Accessed February 28, 2019.
10. Kowdley KV, Wang CC, Welch S, et al. Prevalence of chronic hepatitis B among foreign-born persons living in the United States by country of origin. Hepatology. 2012;56:422-433.
11. Foster T, Hon H, Kanwal F, et al. Screening high risk individuals for hepatitis B: physician knowledge, attitudes, and beliefs. Dig Dis Sci. 2011;56:3471-3487.
12. Rehermann B, Ferrari C, Pasquinelli C, et al. The hepatitis B virus persists for decades after patients’ recovery from acute viral hepatitis despite active maintenance of a cytotoxic T-lymphocyte response. Nat Med. 1996;2:1104-1108.
13. Loomba R, Liang TJ. Hepatitis B reactivation associated with immune suppressive and biological modifier therapies: current concepts, management strategies, and future directions. Gastroenterology. 2017;152:1297-1309.
14. Di Bisceglie AM, Lok AS, Martin P, et al. Recent US Food and Drug Administration warnings on hepatitis B reactivation with immune-suppressing and anticancer drugs: just the tip of the iceberg? Hepatology. 2015;61:703-711.
15. Lok AS, Ward JW, Perrillo RP, et al. Reactivation of hepatitis B during immunosuppressive therapy: potentially fatal yet preventable. Ann Intern Med. 2012;156:743-745.
16. Perrillo RP, Gish R, Falck-Ytter YT. American Gastroenterological Association Institute technical review on prevention and treatment of hepatitis B virus reactivation during immunosuppressive drug therapy. Gastroenterology. 2015;148:221-244.
17. Hwang JP, Lok AS. Management of patients with hepatitis B who require immunosuppressive therapy. Nat Rev Gastroenterol Hepatol. 2014;11:209-219.
18. Lok AS, McMahon BJ. Chronic hepatitis B: update 2009. Hepatology. 2009;50:661-662.
19. Asian-Pacific consensus statement on the management of chronic hepatitis B: a 2012 update. Hepatol Int. 2012;6:531-561.
20. EASL clinical practice guidelines: management of chronic hepatitis B virus infection. J Hepatol. 2012;57:167-185.
21. Reddy KR, Beavers KL, Hammond SP, et al. American Gastroenterological Association Institute guideline on the prevention and treatment of hepatitis B virus reactivation during immunosuppressive drug therapy. Gastroenterology. 2015;148:215-219.
, , . Why we should routinely screen Asian American adults for hepatitis B: a cross-sectional study of Asians in California. Hepatology. 2007;46:1034-1040.
23. Hwang JP, Artz AS, Somerfield MR. Hepatitis B virus screening for patients with cancer before therapy: American Society of Clinical Oncology Provisional Clinical Opinion Update. J Oncol Pract. 2015;11:e487-489.
24. LabCorp. Hepatitis B core antibody, IgG, IgM, differentiation. www.labcorp.com/test-menu/27196/hepatitis-b-core-antibody-igg-igm-differentiation. Accessed February 28, 2019.
25. Quest diagnostics. Hepatitis B Core Antibody, Total. www.questdiagnostics.com/testcenter/TestDetail.action?ntc=501.Accessed November 5, 2018.
26. The Food and Drug Administration Adverse Event Reporting System (FAERS). www.fda.gov/Drugs/DrugSafety/ucm522932.htm. Accessed February 28, 2019.
27. Lim YS. Management of antiviral resistance in chronic hepatitis B. Gut Liver. 2017;11:189-195.
28. Huang H, Li X, Zhu J, et al. Entecavir vs lamivudine for prevention of hepatitis B virus reactivation among patients with untreated diffuse large B-cell lymphoma receiving R-CHOP chemotherapy: a randomized clinical trial. JAMA. 2014;312:2521-2530.
29. Chen WC, Cheng JS, Chiang PH, et al. A comparison of entecavir and lamivudine for the prophylaxis of hepatitis B virus reactivation in solid tumor patients undergoing systemic cytotoxic chemotherapy. PLoS One. 2015;10:e0131545.
30. Tenney DJ, Rose RE, Baldick CJ, et al. Long-term monitoring shows hepatitis B virus resistance to entecavir in nucleoside-naïve patients is rare through 5 years of therapy. Hepatology. 2009;49:1503-1514.
31. Zhang MY, Zhu GQ, Shi KQ, et al. Systematic review with network meta-analysis: comparative efficacy of oral nucleos(t)ide analogues for the prevention of chemotherapy-induced hepatitis B virus reactivation. Oncotarget. 2016;7:30642-30658.
CASE A 53-year-old woman you are seeing for the first time has been taking 10 mg of prednisone daily for a month, prescribed by another practitioner for polymyalgia rheumatica. Testing is negative for hepatitis B surface antigen but is positive for hepatitis B core antibody total, indicating a resolved hepatitis B infection. The absence of hepatitis B DNA is confirmed.
How would you proceed with this patient?
Patients with resolved hepatitis B virus (HBV) or chronic hepatitis B (CHB) infections are at risk for HBV reactivation (HBVr) if they undergo immunosuppressive therapy for a condition such as cancer. HBVr can in turn lead to delays in treatment and increased morbidity and mortality.
HBVr is a well-documented adverse outcome in patients treated with rituximab and in those undergoing stem cell transplantation. Current oncology guidelines recommend screening for HBV prior to initiating these treatments.1,2 More recent evidence shows that many other immunosuppressive therapies can also lead to HBVr.3 Such treatments are now used across a multitude of specialties and conditions. For many of these conditions, there are no consistent guidelines regarding HBV screening.
In 2013, the US Food and Drug Administration (FDA) announced the requirement of a Boxed Warning for the immunosuppressive drugs ofatumumab and rituximab. In 2016, the FDA announced the same requirement for certain direct-acting antiviral medicines for hepatitis C virus.
Among patients who are positive for hepatitis-B surface antigen (HBsAg) and who are treated with immunosuppression, the frequency of HBVr has ranged from 0% to 39%.4,5
As the list of immunosuppressive therapies that can cause HBVr grows, specialty guidelines are evolving to address the risk that HBVr poses.
Continue to: An underrecognized problem
An underrecognized problem. CHB affects an estimated 350 million people worldwide6 but remains underrecognized and underdiagnosed. An estimated 1.4 million Americans6 have CHB, but only a minority of them are aware of their positive status and are followed by a hepatologist or receive medical care for their disease.7 Compared with the natural-born US population, a higher prevalence of CHB exists among immigrants to this country from the Asian Pacific and Eastern Mediterranean regions, sub-Saharan Africa, and certain parts of South America.8-10 In 2008, the Centers for Disease Control and Prevention (CDC) updated its recommendations on screening for HBV to include immigrants to the United States from intermediate and high endemic areas.6 Unfortunately, data published on physicians’ adherence to the CDC guidelines for screening show that only 60% correctly screened at-risk patients.11
Individuals with CHB are at risk and rely on a robust immune system to keep their disease from becoming active. During infection, the virus gains entry into the hepatocytes and the double-stranded viral genome is imported into the nucleus of the cell, where it is repaired into covalently closed circular DNA (cccDNA). Research has demonstrated the stability of cccDNA and its persistence as a latent reservoir for HBV reactivation, even decades after recovery from infection.12
Also at risk are individuals who have unrecovered from HBV infection and are HBsAg negative and anti-HBc positive. To avert reverse seroconversion, they also rely on a robust immune system.13 Reverse seroconversion is defined as a reappearance of HBV DNA and HBsAg positivity in individuals who were previously negative.13 In these individuals, HBV DNA may not be quantifiable in circulation, but trace amounts of viral DNA found in the liver are enough to pose a reactivation risk in the setting of immune suppression.14
Moreover, often overlooked is the fact that reactivation or reverse seroconversion can necessitate disruptions and delays in immunosuppressive treatment for other life-threatening disease processes.14,15
Universal screening reduces risk for HBVr. Patients with CHB are at risk for reactivation, as are patients with resolved HBV infection. Many patients, however, do not know their status. By screening all patients before beginning immunosuppressive therapy, physicians can provide effective prophylaxis, which has been shown to significantly reduce the risk for HBVr.8.15
Continue to: Recognizing the onset of HBVr
Recognizing the onset of HBVr
In patients with CHB, HBVr is defined as at least a 3-fold increase in aspart aminotransferase (AST) and alanine aminotransferase (ALT) and at least a 10-fold increase from baseline in HBV DNA. In patients with resolved HBV infection, there may be reverse seroconversion from HbsAg-negative to HBsAg-positive status (TABLE 113,16).
Not all elevations in AST/ALT in patients undergoing chemotherapy or immunosuppressive therapy indicate HBVr. Very often, derangements in AST/ALT may be related to the toxic effects of therapy or to the underlying disease process. However, as immunosuppressive therapy is now used for a wide array of medical conditions, consider HBVr as a potential cause of abnormal liver function in all patients receiving such therapy
A patient is at risk for HBVr when starting immunosuppression and up to a year following the completion of therapy. With suppression of the immune system, HBV replication increases and serum AST/ALT concentrations may rise. HBVr may also present with the appearance of HBV DNA in patients with previously undetectable levels.12,17
Most patients remain asymptomatic, and abnormal AST/ALT levels eventually resolve after completion of immunosuppression. However, some patients' liver enzymes may rise, indicating a more severe hepatic flare. These patients may present with right upper-quadrant tenderness, jaundice, or fatigue. In these cases, recognizing HBVr and starting antivirals may reduce hepatitis flare.
Unfortunately, despite early recognition of HBVr and initiation of appropriate therapy, some patients can progress to hepatic decompensation and even fulminant hepatic failure that may have been prevented with prophylaxis.
Continue to: The justification for universal screening
The justification for universal screening
Although nongastroenterology societies differ in their recommendations on screening for HBV, universal screening before implementing prolonged immunosuppressive treatment is recommended by the CDC,6 the American Association for the Study of Liver Diseases,18 the Asian Pacific Association for the Study of the Liver,19 the European Association for the Study of the Liver,20 and the American Gastroenterological Association (AGA).21
Older guidelines recommended screening only high-risk populations. But such screening has downfalls. It requires that patients or their physicians recognize that they are at high risk. In one study, nearly 65% of an infected Asian-American population was unaware of their positive HBV status.22 Risk-based screening also requires that physicians ask the appropriate questions and that patients admit to high-risk behavior. Screening patients based only on risk factors may easily overlook patients who need prophylaxis against HBVr.
Common arguments against universal screening include the cost of testing, the possibility of false-positive results, and the implications of a new diagnosis of hepatitis B. However, the potential benefits of screening are significant, and HBV screening in the general population has been shown to be cost effective when the prevalence of HBV is 0.3%.21 In the United States, conservative estimates are a prevalence of HBsAg positivity of 0.4% and past infection of 3%, making screening a cost-effective recommendation.16 It is therefore prudent to screen all patients before starting immunosuppressive therapy.
How to screen
All guidelines agree on how to test for HBV. Measuring levels of HBsAg and hepatitis B core antibody (anti-HBc total) allows the clinician to ascertain whether the patient’s HBV infection status is acute, chronic, or resolved (TABLE 223) and to perform HBVr risk stratification (discussed later).
Patients with acute infections should be referred to a hepatologist. With chronic or resolved HBV, stratify patients into a prophylaxis group or monitoring group (FIGURE14). Stratification involves identifying HBV status (chronic or resolved) and selecting a type of immunosuppressive therapy. Whether the patient falls into prophylaxis or monitoring, obtain a baseline level of viral DNA, as this has proven to be the best predictor of HBV reactivation.16
Continue to: In screening, be sure the appropriate...
In screening, be sure the appropriate anti-HBc testing is covered. Common usage of the term anti-HBc may refer to immunoglobulin G (IgG) or immunoglobulin M (IgM)or total core antibody, containing both IgG and IgM. But in this context, accurate screening requires either total core antibody or anti-HBc IgG. Anti-IgM alone is inadequate. Many commercial laboratories offer acute hepatitis panels or hepatitis profiles (TABLE 324,25), and it is important to confirm that such order sets contain the tests necessary to allow for risk stratification.
Testing for hepatitis B surface antibody (anti-HBs) is not useful in screening. Although it was hypothesized that the presence of this antibody lowered risk, recent studies have proven no change in risk based on this value.21
How to assess HBVr risk
Assessing risk for HBVr takes into account both the patient’s serology and intended treatment. Reddy et al delineated patient groups into high, moderate, and low risk (TABLES 4 and 5).21 The high-risk group was defined by anticipated incidence of HBVr in > 10% of cases; the moderate-risk group had an anticipated incidence of 1% to 10%; and the low-risk group had an anticipated incidence of <1%.21 Evidence was strongest in the high-risk group.
Patients with CHB (HBsAg positive and anti-HBc positive) are considered high risk for reactivation with a wide variety of immunosuppressive therapies. Such patients are 5 to 8 times more likely to develop HBVr than patients with an HBsAg-negative status signifying a resolved infection.16
Immunosuppressive agents and associated risks. The AGA guidelines consider treatment with B-cell-depleting agents, such as rituximab and ofatumumab, to be high risk, regardless of a patient’s surface antigen status. Additionally, for patients who are HBsAg positive, high-risk treatments include anthracycline derivatives, such as doxorubicin and epirubicin, or high- or moderate-dose steroids. These treatments are considered moderate risk when used in patients who have resolved HBV infection (HBsAg negative/anti-HBc positive). Moderate-risk modalities also include tumor necrosis factor inhibitors and tyrosine kinase inhibitors, regardless of surface antigen status; and low-dose steroids or cytokine or integrin inhibitors in HbsAg-positive individuals.21
Continue to: Other immunosuppression modalities...
Other immunosuppression modalities considered to be moderate risk independent of HBV serology include proteasome inhibitors, such as bortezomib, used for multiple myeloma treatment, and histone deacetylase inhibitors, such as romidepsin, used to treat T-cell lymphoma.13 Low-dose steroids or cytokine or integrin inhibitors are considered to be low risk in surface antigen-negative individuals; azathioprine, mercaptopurine, or methotrexate are low risk regardless of HBsAg status.21 Intra-articular steroid injections are considered extremely low risk in HbsAg-positive individuals, and are unclassified for HbsAg-negative individuals.13
More recent evidence has implicated other medication classes in triggering HBVr — (eg, direct-acting antivirals.)26
Prophylaxis options: High to moderate risk vs low risk
The consensus of major guideline issuers is to offer prophylaxis to high-risk patients and to monitor low-risk patients. The AGA additionally recommends prophylaxis for patients at moderate risk.
Controversy surrounding the moderate-risk group. Some authors argue that monitoring HBV DNA in the moderate-risk group is preferable to committing patients to long periods of prophylaxis, and that rescue treatment could be initiated as needed. However, the ideal monitoring period has not been determined, and the effectiveness of prophylaxis over monitoring is so significant that monitoring is losing favor.
Perrillo et al performed a meta-analysis of 5 randomized controlled trials evaluating antiviral agents vs no prophylaxis.16 The analysis included 139 patients receiving prophylaxis and 137 controls. The pooled results demonstrated an 87% relative risk reduction with prophylaxis, supporting the trend toward treating patients with moderate risk.16
Continue to: Prophylactic treatment options are safe...
Prophylactic treatment options are safe and well tolerated. For this reason, committing a high- or moderate-risk patient to a course of treatment should be less of a concern than the risk for HBVr.
In the early randomized controlled trials for HBVr prophylaxis, lamivudine, although effective, unfortunately led to a high incidence of viral resistance after prolonged use, thus diminishing its desirability.18 Newer agents, such as entecavir and tenofovir, have proven just as effective as lamivudine and are largely unaffected by viral resistance.27
In retrospective and prospective studies on HBVr prophylaxis, patients treated with entecavir had less HBV-related hepatitis, less delay in chemotherapy, and a lower rate of HBVr when compared with lamivudine.28,29 Tenofovir is recommended, however, if patients were previously treated with lamivudine.30
A recent meta-analysis demonstrated that tenofovir and entecavir are preferable to lamivudine in preventing HBVr.31
Looking ahead
Screening for HBsAg and anti-HBc total before starting immunosuppressive therapy can reduce morbidity and mortality in patients undergoing such treatment. The AGA recommends screening all patients about to begin high- or moderate-risk therapy or patients in populations with a prevalence of CHB ≥2%, per the CDC.6,21
Continue to: Classes of medications...
Classes of medications other than immunosuppressants may also trigger HBVr. The FDA has issued a warning regarding direct-acting antivirals, but optimal management of these patients is still evolving.
Once HBV status is established, a patient’s risk for HBVr can be specified as high, moderate, or low using their HBV status and the type of therapy being initiated. The AGA recommends prophylactic treatment with well-tolerated and effective agents for patients classified as high or moderate risk. If a patient’s risk is low, regular monitoring of HBV DNA and AST and ALT levels is sufficient. Recommendations of monitoring intervals span from monthly to every 3 months.13,14
CASE Given the patient’s status of resolved HBV infection and her current moderate-dose regimen of prednisone, her risk for HBV reactivation is moderate. She could either receive antiviral prophylaxis or undergo regular monitoring. Following a discussion of the options, she opts for referral to a hepatologist to discuss possible prophylactic treatment.
Increased awareness of HBVr risk associated with immunosuppressive therapy, coupled with a planned approach to appropriate screening and risk stratification, can help health care providers prevent the reactivation of HBV or initiate early intervention for CHB.
CORRESPONDENCE
Ronan Farrell, MD, Rhode Island Hospital, 593 Eddy Street, Providence, RI 02903; ronan_farrell@brown.edu.
1. Artz AS, Somerfield MR, Feld JJ, et al. American Society of Clinical Oncology provisional clinical opinion: chronic hepatitis B virus infection screening in patients receiving cytotoxic chemotherapy for treatment of malignant diseases. J Clin Oncol. 2010;28:3199-3202.
2. Day FL, Link E, Thursky K, et al. Current hepatitis B screening practices and clinical experience of reactivation in patients undergoing chemotherapy for solid tumors: a nationwide survey of medical oncologists. J Oncol Pract. 2011;7:141-147.
3. Paul S, Saxena A, Terrin N, et al. Hepatitis B virus reactivation and prophylaxis during solid tumor chemotherapy: a systematic review and meta-analysis. Ann Internal Med. 2016;164:30-40.
4. Kim MK, Ahn JH, Kim SB, et al. Hepatitis B reactivation during adjuvant anthracycline-based chemotherapy in patients with breast cancer: a single institution’s experience. Korean J Intern Med. 2007;22:237-243.
5. Esteve M, Saro C, González-Huix F, et al. Chronic hepatitis B reactivation following infliximab therapy in Crohn’s disease patients: need for primary prophylaxis. Gut. 2004;53:1363-1365.
6. Weinbaum CM, Williams I, Mast EE, et al. Recommendations for identification and public health management of persons with chronic hepatitis B virus infection. MMWR Recomm Rep. 2008;57:1-20.
7. Liang TJ, Block TM, McMahon BJ, et al. Present and future therapies of hepatitis B: from discovery to cure. Hepatology. 2015;62:1893-1908.
8, , , A mathematical model to estimate global hepatitis B disease burden and vaccination impact. Int J Epidemiol. 2005;34:1329-1339.
9. WHO. Hepatitis B. www.who.int/en/news-room/fact-sheets/detail/hepatitis-b. Accessed February 28, 2019.
10. Kowdley KV, Wang CC, Welch S, et al. Prevalence of chronic hepatitis B among foreign-born persons living in the United States by country of origin. Hepatology. 2012;56:422-433.
11. Foster T, Hon H, Kanwal F, et al. Screening high risk individuals for hepatitis B: physician knowledge, attitudes, and beliefs. Dig Dis Sci. 2011;56:3471-3487.
12. Rehermann B, Ferrari C, Pasquinelli C, et al. The hepatitis B virus persists for decades after patients’ recovery from acute viral hepatitis despite active maintenance of a cytotoxic T-lymphocyte response. Nat Med. 1996;2:1104-1108.
13. Loomba R, Liang TJ. Hepatitis B reactivation associated with immune suppressive and biological modifier therapies: current concepts, management strategies, and future directions. Gastroenterology. 2017;152:1297-1309.
14. Di Bisceglie AM, Lok AS, Martin P, et al. Recent US Food and Drug Administration warnings on hepatitis B reactivation with immune-suppressing and anticancer drugs: just the tip of the iceberg? Hepatology. 2015;61:703-711.
15. Lok AS, Ward JW, Perrillo RP, et al. Reactivation of hepatitis B during immunosuppressive therapy: potentially fatal yet preventable. Ann Intern Med. 2012;156:743-745.
16. Perrillo RP, Gish R, Falck-Ytter YT. American Gastroenterological Association Institute technical review on prevention and treatment of hepatitis B virus reactivation during immunosuppressive drug therapy. Gastroenterology. 2015;148:221-244.
17. Hwang JP, Lok AS. Management of patients with hepatitis B who require immunosuppressive therapy. Nat Rev Gastroenterol Hepatol. 2014;11:209-219.
18. Lok AS, McMahon BJ. Chronic hepatitis B: update 2009. Hepatology. 2009;50:661-662.
19. Asian-Pacific consensus statement on the management of chronic hepatitis B: a 2012 update. Hepatol Int. 2012;6:531-561.
20. EASL clinical practice guidelines: management of chronic hepatitis B virus infection. J Hepatol. 2012;57:167-185.
21. Reddy KR, Beavers KL, Hammond SP, et al. American Gastroenterological Association Institute guideline on the prevention and treatment of hepatitis B virus reactivation during immunosuppressive drug therapy. Gastroenterology. 2015;148:215-219.
, , . Why we should routinely screen Asian American adults for hepatitis B: a cross-sectional study of Asians in California. Hepatology. 2007;46:1034-1040.
23. Hwang JP, Artz AS, Somerfield MR. Hepatitis B virus screening for patients with cancer before therapy: American Society of Clinical Oncology Provisional Clinical Opinion Update. J Oncol Pract. 2015;11:e487-489.
24. LabCorp. Hepatitis B core antibody, IgG, IgM, differentiation. www.labcorp.com/test-menu/27196/hepatitis-b-core-antibody-igg-igm-differentiation. Accessed February 28, 2019.
25. Quest diagnostics. Hepatitis B Core Antibody, Total. www.questdiagnostics.com/testcenter/TestDetail.action?ntc=501.Accessed November 5, 2018.
26. The Food and Drug Administration Adverse Event Reporting System (FAERS). www.fda.gov/Drugs/DrugSafety/ucm522932.htm. Accessed February 28, 2019.
27. Lim YS. Management of antiviral resistance in chronic hepatitis B. Gut Liver. 2017;11:189-195.
28. Huang H, Li X, Zhu J, et al. Entecavir vs lamivudine for prevention of hepatitis B virus reactivation among patients with untreated diffuse large B-cell lymphoma receiving R-CHOP chemotherapy: a randomized clinical trial. JAMA. 2014;312:2521-2530.
29. Chen WC, Cheng JS, Chiang PH, et al. A comparison of entecavir and lamivudine for the prophylaxis of hepatitis B virus reactivation in solid tumor patients undergoing systemic cytotoxic chemotherapy. PLoS One. 2015;10:e0131545.
30. Tenney DJ, Rose RE, Baldick CJ, et al. Long-term monitoring shows hepatitis B virus resistance to entecavir in nucleoside-naïve patients is rare through 5 years of therapy. Hepatology. 2009;49:1503-1514.
31. Zhang MY, Zhu GQ, Shi KQ, et al. Systematic review with network meta-analysis: comparative efficacy of oral nucleos(t)ide analogues for the prevention of chemotherapy-induced hepatitis B virus reactivation. Oncotarget. 2016;7:30642-30658.
PRACTICE RECOMMENDATIONS
› Measure levels of hepatitis B surface antigen and core antibody total. Although testing for IgG alone can be acceptable, testing for IgM alone is unacceptable. C
› Use both a patient’s serologic findings and the recognized risk associated with intended therapy to determine the threat of hepatitis B virus (HBV) reactivation. C
› Offer antiviral prophylaxis when risk for HBV reactivation is high. Consider prophylaxis or monitoring for those at moderate risk. C
Strength of recommendation (SOR)
A Good-quality patient-oriented evidence
B Inconsistent or limited-quality patient-oriented evidence
C Consensus, usual practice, opinion, disease-oriented evidence, case series

Letters: National Suicide Strategy
To the Editor: Even one death by suicide is too many. Suicide is complex and a serious national public health issue that affects people from all walks of life—not just veterans—for a variety of reasons. While there is still a lot we can learn about suicide, we know that suicide is preventable, treatment works, and there is hope.
At the US Department of Veterans Affairs (VA), our suicide prevention efforts are guided by the National Strategy for Preventing Veteran Suicide.1 Published in 2018, this long-term strategy expands beyond crisis intervention and provides a framework for identifying priorities, organizing efforts, and focusing national attention and community resources to prevent suicide among veterans through a broad public health approach with an emphasis on comprehensive, community-based engagement.
This approach is grounded in 4 key areas: Primary prevention focuses on preventing suicidal behavior before it occurs; whole health considers factors beyond mental health, such as physical health, alcohol or substance misuse, and life events; application of data and research emphasizes evidence-based approaches that can be tailored to the needs of veterans in local communities; and collaboration educates and empowers diverse communities to participate in suicide prevention efforts through coordination.
A recent article by Russell Lemle, PhD, noted that the National Strategy does not emphasize the work of the VA, and he is correct.2 Rather than perpetuate the myth that VA can address suicide alone, the strategy was intended to guide veteran suicide prevention efforts across the entire nation, not just within VA’s walls. It is a plan for how we can ALL work together to prevent veteran suicide. The National Strategy does not minimize VA’s role in suicide prevention. It enhances VA’s ability and expectation to engage in collaborative efforts across the nation.
Every year, about 6,000 veterans die by suicide, the majority of whom have not received recent VA care. We are mindful that some veterans may not receive any or all of their health care services from the VA, for various reasons, and want to be respectful and cognizant of those choices. To save lives, VA needs the support of partners across sectors. We need to ensure that multiple systems are working in a coordinated way to reach veterans where they live, work, and thrive.
Our philosophy is that there is no wrong door to care. That is why we focused on universal, non-VA community interventions. Preventing suicide among all of the nation’s 20 million veterans cannot be the sole responsibility of VA—it requires a nationwide effort. As there is no single cause of suicide, no single organization can tackle suicide prevention alone. Put simply, VA must ensure suicide prevention is a part of every aspect of veterans’ lives, not just their VA interactions. At VA, we know that the care and support that veterans need often comes before a mental health crisis occurs, and communities and families may be better equipped to provide these types of supports.
Activities or special interest groups can boost protective factors against suicide and combat risk factors. Communities can foster an environment where veterans can find connection and camaraderie, achieve a sense of purpose, bolster their coping skills, and live healthily. And partners like the National Shooting Sports Foundation help VA to address sensitive issues, such as lethal means safety, while correcting misconceptions about how VA handles gun ownership.
Data also are an integral piece of our public health approach, driving how VA defines the problem, targets its programs, and delivers and implements interventions. VA was one of the first institutions to implement comprehensive suicide analysis and predictive analytics, and VA has continuously improved data surveillance related to veteran suicide.
We began comprehensive suicide monitoring for the entire VA patient population in 2006, and in 2012, VA released its first report of suicide surveillance among all veterans in select partnering states. Though we are able to share data, we acknowledge the limitations Dr. Lemle highlighted in implementing predictive analytics program outside the VA. However, VA continues to improve reporting and surveillance efforts, especially to better understand the 20 veterans and service members who die by suicide each day.
As Lemle noted, little was previously known about the 14 of 20 veterans who die by suicide every day who weren’t recent users of VA health services. Since the September 2018 release of the National Strategy, VA has obtained additional data. In addition to sharing data, VA will focus on helping non-VA entities understand the problem so that they can help reach veterans who may never go to VA for care. Efforts are underway to better understand specific groups that are at elevated risk, such as veterans aged 18 to 34 years, women veterans, never federally activated guardsmen and reservists, recently separated veterans, and former service members with Other Than Honorable discharges.
To end veteran suicide, VA is relentlessly working to make improvements to existing suicide prevention programs, develop VA-specific plans to advance the National Strategy, find innovative ways to get people into care, and educate veterans and family members about VA care. Through Executive Order 13822, for example, VA has partnered with the Departments of Defense and Homeland Security, which allows us to educate service members about VA offerings before they become veterans. We also are making it easier for them to quickly find information online about VA mental health services.
We acknowledge VA is not a perfect organization, and a negative image can turn away veterans. VA is actively working with the media to get more good news stories published. We have many exciting things to talk about, such as a newly implemented Comprehensive Suicide Risk Assessment, and it is important for people to know that VA is providing the gold standard of care. Sometimes, those stories are better messaged and amplified by partners and non-VA entities, and this is a key part of our approach.
Lemle also raised a concern around funding this new public health initiative. While we recognize the challenges in advancing this new public health approach without additional funding, we are hopeful we can energize communities to work with us to find a solution.
The National Strategy is not the end of the conversation. It is a starting point. We are thankful for Lemle’s thoughtful questions and are actively pursuing and investigating solutions regarding veteran suicide studies, peer support, and community care guidelines for partners as we seek to improve our services. We also are putting pen to paper on a plan to strengthen family involvement and integrate suicide prevention within VA’s whole health and social services strategies.
The National Strategy is a call to action to every organization, system, and institution interested in preventing veteran suicide to help do this work where we cannot. For our part, VA will continue to energize communities to increase local involvement to reach all veterans, and we will continue to empower and equip ALL veterans with the resources and care they need to thrive.
To learn about the resources available for veterans and how you can #BeThere as a VA employee, family member, friend, community partner, or clinician, visit www.mentalhealth.va.gov/suicide_prevention/resources.asp. If you or someone you know is having thoughts of suicide, contact the Veterans Crisis Line to receive free, confidential support and crisis intervention available 24 hours a day, 7 days a week, 365 days a year. Call 800-273-8255 and press 1, text to 838255, or chat online at VeteransCrisisLine.net/Chat.
- Keita Franklin, LCSD, PhD
Author affiliations: Executive Director, Suicide Prevention VA Office of Mental Health and Suicide Prevention.
Author disclosures: Keita Franklin participated in the development of the National Strategy for Preventing Veteran Suicide .
Disclaimer: The opinions expressed herein are those of the author and do not necessarily reflect those of Federal Practitioner , Frontline Medical Communications Inc., the US Government, or any of its agencies.
Author Response: Keita Franklin, PhD, offers a valuable response to my December critique of the VA National Strategy to Prevent Veteran Suicide. Dr. Franklin thoughtfully articulates why public health approaches to prevent suicide must be a core component of a multifaceted strategy. She is right about that.
While I see considerable overlap between our statements, there are 2 important points where we diverge: (1) Unless Congress appropriates sufficient funds for extensive public health outreach, there is a danger that funds to implement it would be diverted from VA’s extant effective VA suicide prevention programs. (2) A prospective suicide prevention plan requires 3 prongs of universal, group, and individually focused strategies, because suicide cannot be prevented by any single strategy. The VA National Strategy as well as the March 2019 Executive Order on a National Roadmap to Empower Veterans and End Suicide, focus predominantly on universal strategies, and I believe its overall approach would be improved by also explicitly supporting VA’s targeted programs for at-risk veterans.
- Russell B. Lemle, PhD
Author affiliations: Policy Analyst at the Veterans Healthcare Policy Institute in Oakland, California.
1. US Department of Veterans Affairs. National strategy for preventing veteran suicide 2018–2028. https://www.mentalhealth.va.gov/suicide_prevention/docs/Office-of-Mental-Health-and-Suicide-Prevention-National-Strategy-for-Preventing-Veterans-Suicide.pdf. Published September 2018. Accessed February 19, 2019.
2. Lemle R. Communities emphasis could undercut VA successes in National Strategy for Preventing Veteran Suicide. Fed Pract. 2018;35(12):16-17.
To the Editor: Even one death by suicide is too many. Suicide is complex and a serious national public health issue that affects people from all walks of life—not just veterans—for a variety of reasons. While there is still a lot we can learn about suicide, we know that suicide is preventable, treatment works, and there is hope.
At the US Department of Veterans Affairs (VA), our suicide prevention efforts are guided by the National Strategy for Preventing Veteran Suicide.1 Published in 2018, this long-term strategy expands beyond crisis intervention and provides a framework for identifying priorities, organizing efforts, and focusing national attention and community resources to prevent suicide among veterans through a broad public health approach with an emphasis on comprehensive, community-based engagement.
This approach is grounded in 4 key areas: Primary prevention focuses on preventing suicidal behavior before it occurs; whole health considers factors beyond mental health, such as physical health, alcohol or substance misuse, and life events; application of data and research emphasizes evidence-based approaches that can be tailored to the needs of veterans in local communities; and collaboration educates and empowers diverse communities to participate in suicide prevention efforts through coordination.
A recent article by Russell Lemle, PhD, noted that the National Strategy does not emphasize the work of the VA, and he is correct.2 Rather than perpetuate the myth that VA can address suicide alone, the strategy was intended to guide veteran suicide prevention efforts across the entire nation, not just within VA’s walls. It is a plan for how we can ALL work together to prevent veteran suicide. The National Strategy does not minimize VA’s role in suicide prevention. It enhances VA’s ability and expectation to engage in collaborative efforts across the nation.
Every year, about 6,000 veterans die by suicide, the majority of whom have not received recent VA care. We are mindful that some veterans may not receive any or all of their health care services from the VA, for various reasons, and want to be respectful and cognizant of those choices. To save lives, VA needs the support of partners across sectors. We need to ensure that multiple systems are working in a coordinated way to reach veterans where they live, work, and thrive.
Our philosophy is that there is no wrong door to care. That is why we focused on universal, non-VA community interventions. Preventing suicide among all of the nation’s 20 million veterans cannot be the sole responsibility of VA—it requires a nationwide effort. As there is no single cause of suicide, no single organization can tackle suicide prevention alone. Put simply, VA must ensure suicide prevention is a part of every aspect of veterans’ lives, not just their VA interactions. At VA, we know that the care and support that veterans need often comes before a mental health crisis occurs, and communities and families may be better equipped to provide these types of supports.
Activities or special interest groups can boost protective factors against suicide and combat risk factors. Communities can foster an environment where veterans can find connection and camaraderie, achieve a sense of purpose, bolster their coping skills, and live healthily. And partners like the National Shooting Sports Foundation help VA to address sensitive issues, such as lethal means safety, while correcting misconceptions about how VA handles gun ownership.
Data also are an integral piece of our public health approach, driving how VA defines the problem, targets its programs, and delivers and implements interventions. VA was one of the first institutions to implement comprehensive suicide analysis and predictive analytics, and VA has continuously improved data surveillance related to veteran suicide.
We began comprehensive suicide monitoring for the entire VA patient population in 2006, and in 2012, VA released its first report of suicide surveillance among all veterans in select partnering states. Though we are able to share data, we acknowledge the limitations Dr. Lemle highlighted in implementing predictive analytics program outside the VA. However, VA continues to improve reporting and surveillance efforts, especially to better understand the 20 veterans and service members who die by suicide each day.
As Lemle noted, little was previously known about the 14 of 20 veterans who die by suicide every day who weren’t recent users of VA health services. Since the September 2018 release of the National Strategy, VA has obtained additional data. In addition to sharing data, VA will focus on helping non-VA entities understand the problem so that they can help reach veterans who may never go to VA for care. Efforts are underway to better understand specific groups that are at elevated risk, such as veterans aged 18 to 34 years, women veterans, never federally activated guardsmen and reservists, recently separated veterans, and former service members with Other Than Honorable discharges.
To end veteran suicide, VA is relentlessly working to make improvements to existing suicide prevention programs, develop VA-specific plans to advance the National Strategy, find innovative ways to get people into care, and educate veterans and family members about VA care. Through Executive Order 13822, for example, VA has partnered with the Departments of Defense and Homeland Security, which allows us to educate service members about VA offerings before they become veterans. We also are making it easier for them to quickly find information online about VA mental health services.
We acknowledge VA is not a perfect organization, and a negative image can turn away veterans. VA is actively working with the media to get more good news stories published. We have many exciting things to talk about, such as a newly implemented Comprehensive Suicide Risk Assessment, and it is important for people to know that VA is providing the gold standard of care. Sometimes, those stories are better messaged and amplified by partners and non-VA entities, and this is a key part of our approach.
Lemle also raised a concern around funding this new public health initiative. While we recognize the challenges in advancing this new public health approach without additional funding, we are hopeful we can energize communities to work with us to find a solution.
The National Strategy is not the end of the conversation. It is a starting point. We are thankful for Lemle’s thoughtful questions and are actively pursuing and investigating solutions regarding veteran suicide studies, peer support, and community care guidelines for partners as we seek to improve our services. We also are putting pen to paper on a plan to strengthen family involvement and integrate suicide prevention within VA’s whole health and social services strategies.
The National Strategy is a call to action to every organization, system, and institution interested in preventing veteran suicide to help do this work where we cannot. For our part, VA will continue to energize communities to increase local involvement to reach all veterans, and we will continue to empower and equip ALL veterans with the resources and care they need to thrive.
To learn about the resources available for veterans and how you can #BeThere as a VA employee, family member, friend, community partner, or clinician, visit www.mentalhealth.va.gov/suicide_prevention/resources.asp. If you or someone you know is having thoughts of suicide, contact the Veterans Crisis Line to receive free, confidential support and crisis intervention available 24 hours a day, 7 days a week, 365 days a year. Call 800-273-8255 and press 1, text to 838255, or chat online at VeteransCrisisLine.net/Chat.
- Keita Franklin, LCSD, PhD
Author affiliations: Executive Director, Suicide Prevention VA Office of Mental Health and Suicide Prevention.
Author disclosures: Keita Franklin participated in the development of the National Strategy for Preventing Veteran Suicide .
Disclaimer: The opinions expressed herein are those of the author and do not necessarily reflect those of Federal Practitioner , Frontline Medical Communications Inc., the US Government, or any of its agencies.
Author Response: Keita Franklin, PhD, offers a valuable response to my December critique of the VA National Strategy to Prevent Veteran Suicide. Dr. Franklin thoughtfully articulates why public health approaches to prevent suicide must be a core component of a multifaceted strategy. She is right about that.
While I see considerable overlap between our statements, there are 2 important points where we diverge: (1) Unless Congress appropriates sufficient funds for extensive public health outreach, there is a danger that funds to implement it would be diverted from VA’s extant effective VA suicide prevention programs. (2) A prospective suicide prevention plan requires 3 prongs of universal, group, and individually focused strategies, because suicide cannot be prevented by any single strategy. The VA National Strategy as well as the March 2019 Executive Order on a National Roadmap to Empower Veterans and End Suicide, focus predominantly on universal strategies, and I believe its overall approach would be improved by also explicitly supporting VA’s targeted programs for at-risk veterans.
- Russell B. Lemle, PhD
Author affiliations: Policy Analyst at the Veterans Healthcare Policy Institute in Oakland, California.
1. US Department of Veterans Affairs. National strategy for preventing veteran suicide 2018–2028. https://www.mentalhealth.va.gov/suicide_prevention/docs/Office-of-Mental-Health-and-Suicide-Prevention-National-Strategy-for-Preventing-Veterans-Suicide.pdf. Published September 2018. Accessed February 19, 2019.
2. Lemle R. Communities emphasis could undercut VA successes in National Strategy for Preventing Veteran Suicide. Fed Pract. 2018;35(12):16-17.
Necrotizing Infection of the Upper Extremity: A Veterans Affairs Medical Center Experience (2008-2017)
Necrotizing infection of the extremity is a rare but potentially lethal diagnosis with a mortality rate in the range of 17% to 35%.1-4 The plastic surgery service at the Malcom Randall Veterans Affairs Medical Center (MRVAMC) treats all hand emergencies, including upper extremity infection, in the North Florida/South Georgia Veterans Heath System. There has been a well-coordinated emergency hand care system in place for several years that includes specialty templates on the electronic health record, pre-existing urgent clinic appointments, and single service surgical specialty care.5 This facilitates a fluid line of communication between primary care, emergency department (ED) providers, and surgical specialties. The objective of the study was to evaluate our identification, treatment, and outcome of these serious infections.
Methods
The MRVAMC Institutional Review Board approved a retrospective review of necrotizing infection of the upper extremity treated at the facility by the plastic surgery service. Surgical cases over a 9-year period (June 5, 2008-June 5, 2017) were identified by CPT (current procedural technology) codes for amputation and/or debridement of the upper extremity. The charts were reviewed for evidence of necrotizing infection by clinical description or pathology report. The patients’ age, sex, etiology, comorbidities from their problem list, vitals, and laboratory results were recorded upon arrival at the hospital. Time from presentation to surgery, treatment, and outcomes were recorded.
Results
Ten patients were treated for necrotizing infection of the upper extremity over a 9-year period; all were men with an average age of 64 years. Etiologies included nail biting, “bug bites,” crush injuries, burns, suspected IV drug use, and unknown. Nine of 10 patients had diabetes mellitus (DM). Most did not show evidence of hemodynamic instability on hospital arrival (Table). One patient was hypotensive with a mean arterial blood pressure < 65 mm Hg, 2 had heart rates > 100 beats/min, 1 patient had a temperature > 38° C, and 7 had elevated white blood cell (WBC) counts ranging from 11 to 24 k/cmm. Two undiagnosed patients with DM (patients 1 and 8) expressed no complaints of pain and presented with blood glucose > 450 mg/dL with hemoglobin A1c levels > 12%.
Infectious disease and critical care services were involved in the treatment of several cases when requested. A computed tomography (CT) scan was used in 2 of the patients (patients 1 and 4) to assist in the diagnosis (Figure 1). 
Seven patients out of 10 were treated with surgery within 24 hours on hospital arrival. The severity of the pathology was not initially recognized in 2 of the patients earlier in the review. A third patient resisted surgical treatment until the second hospital day. Four patients had from 1 to 3 digital amputations, 2 patients had wrist disarticulations, and 1 had a distal forearm amputation. 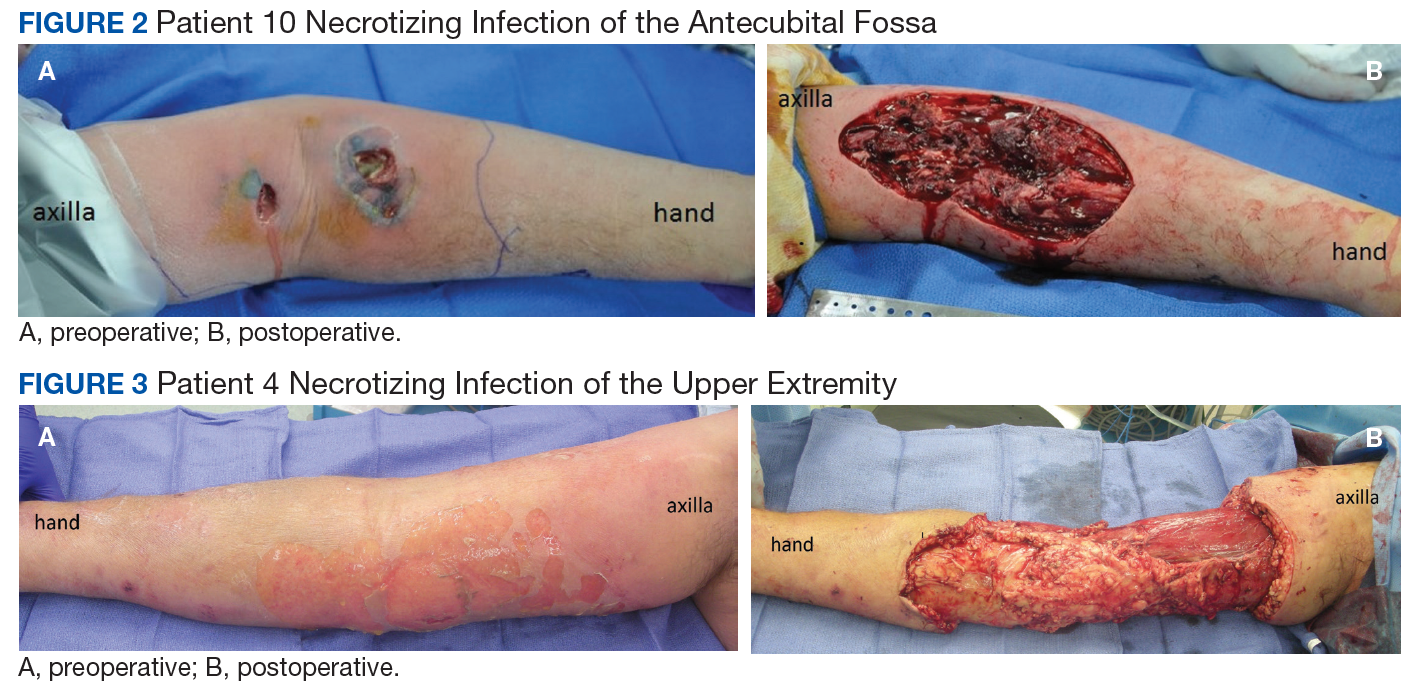
Antibiotics were managed by critical care, hospitalist, or infectious disease services and adjusted once final cultures were returned (Table). 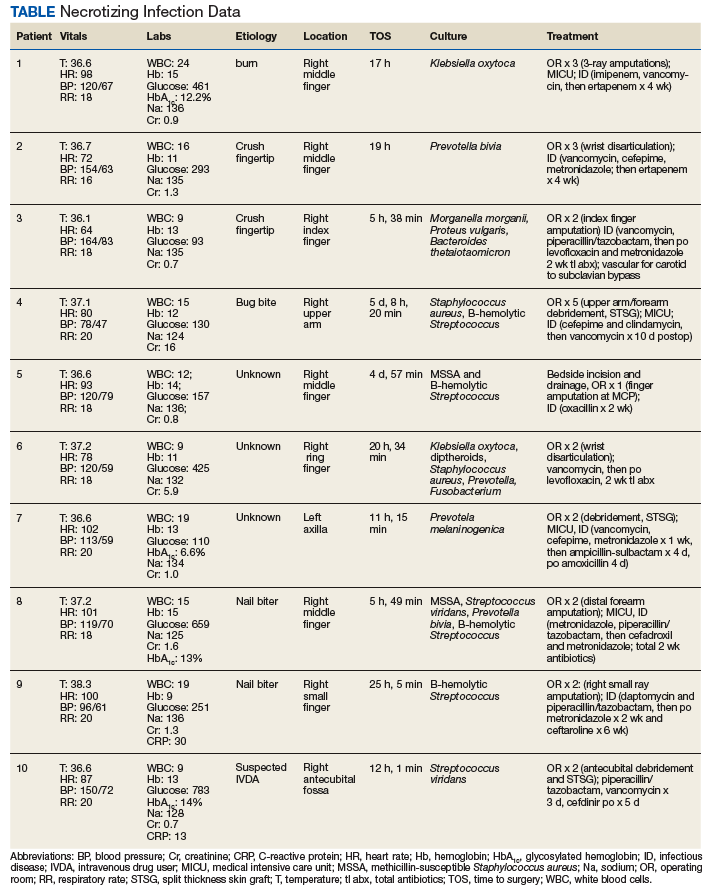
Discussion
Necrotizing infection of the upper extremity is a rare pathology with a substantial risk of amputation and mortality that requires a high index of suspicion and expeditious referral to a hand surgeon. It is well accepted that the key to survival is prompt surgical debridement of all necrotic tissue, ideally within 24 hours of hospital arrival.2-4,6 Death is usually secondary to sepsis.3 The classic presentation of pain out of proportion to exam, hypotension, erythema, skin necrosis, elevated WBC count, and fever may not be present and can delay diagnosis.1-4,6
DM is the most common comorbidity, and reviews have found the disease occurs more often in males, both which are consistent with our study.1-3 Diabetic infections have been found to be more likely to present as necrotizing infection than are nondiabetic infections and be at a higher risk for amputation.7 The patients with the wrist disarticulations and forearm amputation had DM. A minor trauma can be a portal for infection, which can be monomicrobial or polymicrobial.1,4 Once the diagnosis is suspected, prompt resuscitation, surgical debridement, IV antibiotics, and early intensive care are lifesaving. Hyperbaric oxygen is not available at MRVAMC and was not pursued as a transfer request due to its controversial benefit.6
There were no perioperative 30-day mortalities over a 9-year period in patients identified as having necrotizing infection of the upper extremity. This is attributed to an aggressive and well-coordinated, multisystem approach involving emergency, surgical, anesthesia, intensive care, and infectious disease services.
The hand trauma triage system in place at MRVAMC was started in 2008 and presented at the 38th Annual VA Surgeons Meeting in New Haven, Connecticut. The process starts at the level of the ED, urgent care or primary care provider and facilitates rapid access to subspecialty care by reducing unnecessary phone calls and appointment wait times.
All hand emergencies are covered by the plastic surgery service rather than the traditional split coverage between orthopedics and plastic surgery. This provides consistency and continuity for the patients and staff. The electronic health record consult template gives specific instructions to contact the on-call plastic surgeon. The resident/fellow gets called if patient is in-house, and faculty is called if the patient is outside the main hospital. The requesting provider gets instructions on treatment and follow-up. Clinic profiles have appointments reserved for urgent consults during the first hour so that patients can be sent to pre-anesthesia clinic or hand therapy, depending on the diagnosis. This triage system increased our hand trauma volume by a multiple of 6 between 2008 and 2012 but cut the appointment wait time > 1 week by half, as a percentage of consults, and did not significantly increase after-hour use of the operating room. The number of faculty and trainees stayed the same.
We did find that speed to diagnosis for necrotizing infection is an area that can be improved on with a higher clinical suspicion. There is a learning curve to the diagnosis and treatment, which can be prolonged when the index cases do not present themselves often and the patients do not appear in distress. This argues for consistency in hand-specific trauma coverage. The patients were most often initially seen by the resident and examined by a faculty member within hours. There were 4 different plastic surgery faculty involved in these cases, and they all included resident participation before, during, and after surgery. Debridement consists of wide local excision to bleeding tissue. Author review of the operative notes found the numbers of trips to the operating room for debridement can be reduced as the surgeon becomes more confident in the diagnosis and management, resulting in less “whittling” and a more definitive debridement, resulting in a faster recovery.
The LRINEC (Laboratory Risk Indicator for Necrotizing Fasciitis) is a tool that helps to distinguish necrotizing infection from other forms of soft tissue infection by using a point system for laboratory values that include C-reactive protein (CRP), white blood count, hemoglobin, sodium, creatinine, and glucose values.8 We do not routinely request CRP results, but 1 of the 2 patients (patient 9) who had the full complement of laboratory tests would have met high-risk criteria. The diagnostic accuracy of this tool has been questioned9; however, the authors welcome any method that can rapidly and noninvasively assist in getting the patient proper attention.
The patients were not seen for long-term follow-up, but some did return to the main hospital or clinic for other pathology and were pleased to show off their grip strength after a 3-ray amputation (patient 1) and aesthetics after upper arm and forearm debridement and skin graft reconstruction (patient 4, Figure 4). 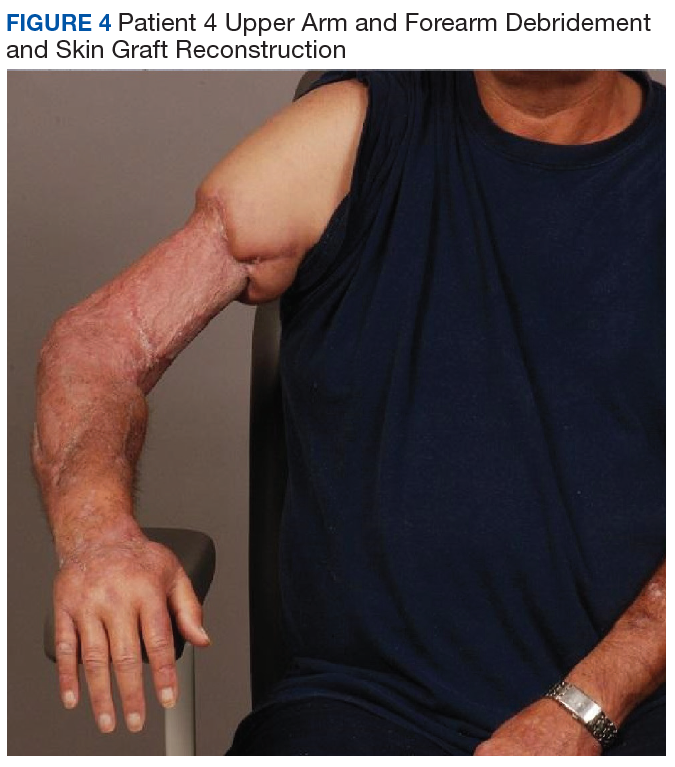
A single-ray amputation can be expected to result in a loss of grip and pinch strength, about 43.3% and 33.6%, respectively; however, given the alternative of further loss of life or limb, this was considered a reasonable trade-off.10 One wrist disarticulation and the forearm amputation were seen by amputee clinic for prosthetic fitting many months after the amputations once the wounds were healed and edema had subsided.
Conclusion
A well-coordinated multidisciplinary effort was the key to successful identification and treatment of this serious life- and limb-threatening infection at our institution. We did identify room for improvement in making an earlier diagnosis and performing a more aggressive first debridement.
Acknowledgments
This project is the result of work supported with resources and use of facilities at the Malcom Randall VA Medical Center in Gainesville, Florida.
1. Angoules AG, Kontakis G, Drakoulakis E, Vrentzos G, Granick MS, Giannoudis PV. Necrotizing fasciitis of upper and lower limb: a systemic review. Injury. 2007;38(suppl 5):S19-S26.
2. Chauhan A, Wigton MD, Palmer BA. Necrotizing fasciitis. J Hand Surg Am. 2014;39(8):1598-1601.
3. Cheng NC, SU YM, Kuo YS, Tai HC, Tang YB. Factors affecting the mortality of necrotizing fasciitis involving the upper extremities. Surg Today. 2008;38(12):1108-1113.
4. Sunderland IR, Friedrich JB. Predictors of mortality and limb loss in necrotizing soft tissue infections of the upper extremity. J Hand Surg Am. 2009;34(10):1900-1901.
5. Coady-Fariborzian L, McGreane A. Comparison of hand emergency triage before and after specialty templates (2007 vs 2012). Hand (N Y). 2015;10(2):215-220.
6. Stevens D, Bryant A. Necrotizing soft-tissue infections. N Engl J Med. 2017;377(23):2253-2265.
7. Sharma K, Pan D, Friedman J, Yu JL, Mull A, Moore AM. Quantifying the effect of diabetes on surgical hand and forearm infections. J Hand Surg Am. 2018;43(2):105-114.
8. Wong CH, Khin LW, Heng KS, Tan KC, Low CO. The LRINEC (Laboratory Risk Indicator for Necrotizing Fasciitis) score: a tool for distinguishing necrotizing fasciitis from other soft tissue infections. Crit Care Med. 2004;32(7):1535-1541.
9. Fernando SM, Tran A, Cheng W, et al. Necrotizing soft tissue infection: diagnostic accuracy of physical examination, imaging, and LRINEC score: a systematic review and meta-analysis. Ann Surg. 2019;269(1):58-65. 10. Bhat AK, Acharya AM, Narayanakurup JK, Kumar B, Nagpal PS, Kamath A. Functional and cosmetic outcome of single-digit ray amputation in hand. Musculoskelet Surg. 2017;101(3):275-281.
Necrotizing infection of the extremity is a rare but potentially lethal diagnosis with a mortality rate in the range of 17% to 35%.1-4 The plastic surgery service at the Malcom Randall Veterans Affairs Medical Center (MRVAMC) treats all hand emergencies, including upper extremity infection, in the North Florida/South Georgia Veterans Heath System. There has been a well-coordinated emergency hand care system in place for several years that includes specialty templates on the electronic health record, pre-existing urgent clinic appointments, and single service surgical specialty care.5 This facilitates a fluid line of communication between primary care, emergency department (ED) providers, and surgical specialties. The objective of the study was to evaluate our identification, treatment, and outcome of these serious infections.
Methods
The MRVAMC Institutional Review Board approved a retrospective review of necrotizing infection of the upper extremity treated at the facility by the plastic surgery service. Surgical cases over a 9-year period (June 5, 2008-June 5, 2017) were identified by CPT (current procedural technology) codes for amputation and/or debridement of the upper extremity. The charts were reviewed for evidence of necrotizing infection by clinical description or pathology report. The patients’ age, sex, etiology, comorbidities from their problem list, vitals, and laboratory results were recorded upon arrival at the hospital. Time from presentation to surgery, treatment, and outcomes were recorded.
Results
Ten patients were treated for necrotizing infection of the upper extremity over a 9-year period; all were men with an average age of 64 years. Etiologies included nail biting, “bug bites,” crush injuries, burns, suspected IV drug use, and unknown. Nine of 10 patients had diabetes mellitus (DM). Most did not show evidence of hemodynamic instability on hospital arrival (Table). One patient was hypotensive with a mean arterial blood pressure < 65 mm Hg, 2 had heart rates > 100 beats/min, 1 patient had a temperature > 38° C, and 7 had elevated white blood cell (WBC) counts ranging from 11 to 24 k/cmm. Two undiagnosed patients with DM (patients 1 and 8) expressed no complaints of pain and presented with blood glucose > 450 mg/dL with hemoglobin A1c levels > 12%.
Infectious disease and critical care services were involved in the treatment of several cases when requested. A computed tomography (CT) scan was used in 2 of the patients (patients 1 and 4) to assist in the diagnosis (Figure 1).
Seven patients out of 10 were treated with surgery within 24 hours on hospital arrival. The severity of the pathology was not initially recognized in 2 of the patients earlier in the review. A third patient resisted surgical treatment until the second hospital day. Four patients had from 1 to 3 digital amputations, 2 patients had wrist disarticulations, and 1 had a distal forearm amputation.
Antibiotics were managed by critical care, hospitalist, or infectious disease services and adjusted once final cultures were returned (Table).
Discussion
Necrotizing infection of the upper extremity is a rare pathology with a substantial risk of amputation and mortality that requires a high index of suspicion and expeditious referral to a hand surgeon. It is well accepted that the key to survival is prompt surgical debridement of all necrotic tissue, ideally within 24 hours of hospital arrival.2-4,6 Death is usually secondary to sepsis.3 The classic presentation of pain out of proportion to exam, hypotension, erythema, skin necrosis, elevated WBC count, and fever may not be present and can delay diagnosis.1-4,6
DM is the most common comorbidity, and reviews have found the disease occurs more often in males, both which are consistent with our study.1-3 Diabetic infections have been found to be more likely to present as necrotizing infection than are nondiabetic infections and be at a higher risk for amputation.7 The patients with the wrist disarticulations and forearm amputation had DM. A minor trauma can be a portal for infection, which can be monomicrobial or polymicrobial.1,4 Once the diagnosis is suspected, prompt resuscitation, surgical debridement, IV antibiotics, and early intensive care are lifesaving. Hyperbaric oxygen is not available at MRVAMC and was not pursued as a transfer request due to its controversial benefit.6
There were no perioperative 30-day mortalities over a 9-year period in patients identified as having necrotizing infection of the upper extremity. This is attributed to an aggressive and well-coordinated, multisystem approach involving emergency, surgical, anesthesia, intensive care, and infectious disease services.
The hand trauma triage system in place at MRVAMC was started in 2008 and presented at the 38th Annual VA Surgeons Meeting in New Haven, Connecticut. The process starts at the level of the ED, urgent care or primary care provider and facilitates rapid access to subspecialty care by reducing unnecessary phone calls and appointment wait times.
All hand emergencies are covered by the plastic surgery service rather than the traditional split coverage between orthopedics and plastic surgery. This provides consistency and continuity for the patients and staff. The electronic health record consult template gives specific instructions to contact the on-call plastic surgeon. The resident/fellow gets called if patient is in-house, and faculty is called if the patient is outside the main hospital. The requesting provider gets instructions on treatment and follow-up. Clinic profiles have appointments reserved for urgent consults during the first hour so that patients can be sent to pre-anesthesia clinic or hand therapy, depending on the diagnosis. This triage system increased our hand trauma volume by a multiple of 6 between 2008 and 2012 but cut the appointment wait time > 1 week by half, as a percentage of consults, and did not significantly increase after-hour use of the operating room. The number of faculty and trainees stayed the same.
We did find that speed to diagnosis for necrotizing infection is an area that can be improved on with a higher clinical suspicion. There is a learning curve to the diagnosis and treatment, which can be prolonged when the index cases do not present themselves often and the patients do not appear in distress. This argues for consistency in hand-specific trauma coverage. The patients were most often initially seen by the resident and examined by a faculty member within hours. There were 4 different plastic surgery faculty involved in these cases, and they all included resident participation before, during, and after surgery. Debridement consists of wide local excision to bleeding tissue. Author review of the operative notes found the numbers of trips to the operating room for debridement can be reduced as the surgeon becomes more confident in the diagnosis and management, resulting in less “whittling” and a more definitive debridement, resulting in a faster recovery.
The LRINEC (Laboratory Risk Indicator for Necrotizing Fasciitis) is a tool that helps to distinguish necrotizing infection from other forms of soft tissue infection by using a point system for laboratory values that include C-reactive protein (CRP), white blood count, hemoglobin, sodium, creatinine, and glucose values.8 We do not routinely request CRP results, but 1 of the 2 patients (patient 9) who had the full complement of laboratory tests would have met high-risk criteria. The diagnostic accuracy of this tool has been questioned9; however, the authors welcome any method that can rapidly and noninvasively assist in getting the patient proper attention.
The patients were not seen for long-term follow-up, but some did return to the main hospital or clinic for other pathology and were pleased to show off their grip strength after a 3-ray amputation (patient 1) and aesthetics after upper arm and forearm debridement and skin graft reconstruction (patient 4, Figure 4).
A single-ray amputation can be expected to result in a loss of grip and pinch strength, about 43.3% and 33.6%, respectively; however, given the alternative of further loss of life or limb, this was considered a reasonable trade-off.10 One wrist disarticulation and the forearm amputation were seen by amputee clinic for prosthetic fitting many months after the amputations once the wounds were healed and edema had subsided.
Conclusion
A well-coordinated multidisciplinary effort was the key to successful identification and treatment of this serious life- and limb-threatening infection at our institution. We did identify room for improvement in making an earlier diagnosis and performing a more aggressive first debridement.
Acknowledgments
This project is the result of work supported with resources and use of facilities at the Malcom Randall VA Medical Center in Gainesville, Florida.
1. Angoules AG, Kontakis G, Drakoulakis E, Vrentzos G, Granick MS, Giannoudis PV. Necrotizing fasciitis of upper and lower limb: a systemic review. Injury. 2007;38(suppl 5):S19-S26.
2. Chauhan A, Wigton MD, Palmer BA. Necrotizing fasciitis. J Hand Surg Am. 2014;39(8):1598-1601.
3. Cheng NC, SU YM, Kuo YS, Tai HC, Tang YB. Factors affecting the mortality of necrotizing fasciitis involving the upper extremities. Surg Today. 2008;38(12):1108-1113.
4. Sunderland IR, Friedrich JB. Predictors of mortality and limb loss in necrotizing soft tissue infections of the upper extremity. J Hand Surg Am. 2009;34(10):1900-1901.
5. Coady-Fariborzian L, McGreane A. Comparison of hand emergency triage before and after specialty templates (2007 vs 2012). Hand (N Y). 2015;10(2):215-220.
6. Stevens D, Bryant A. Necrotizing soft-tissue infections. N Engl J Med. 2017;377(23):2253-2265.
7. Sharma K, Pan D, Friedman J, Yu JL, Mull A, Moore AM. Quantifying the effect of diabetes on surgical hand and forearm infections. J Hand Surg Am. 2018;43(2):105-114.
8. Wong CH, Khin LW, Heng KS, Tan KC, Low CO. The LRINEC (Laboratory Risk Indicator for Necrotizing Fasciitis) score: a tool for distinguishing necrotizing fasciitis from other soft tissue infections. Crit Care Med. 2004;32(7):1535-1541.
9. Fernando SM, Tran A, Cheng W, et al. Necrotizing soft tissue infection: diagnostic accuracy of physical examination, imaging, and LRINEC score: a systematic review and meta-analysis. Ann Surg. 2019;269(1):58-65. 10. Bhat AK, Acharya AM, Narayanakurup JK, Kumar B, Nagpal PS, Kamath A. Functional and cosmetic outcome of single-digit ray amputation in hand. Musculoskelet Surg. 2017;101(3):275-281.
Effects of Insomnia and Depression on CPAP Adherence in a Military Population
Continuous positive airway pressure therapy (CPAP) is the first-line treatment for obstructive sleep apnea (OSA) recommended by the American College of Physicians and the American Academy of Sleep Medicine.1,2 CPAP reduces the apnea hypopnea index (AHI), improves oxyhemoglobin desaturation, and reduces cortical arousals associated with apneic/hypopneic events.3 Despite being an effective treatment for OSA, a significant limitation of CPAP is treatment adherence. Factors associated with CPAP adherence include disease and patient characteristics, perceived self-efficacy, treatment titration procedure, device technology factors, adverse effects, and psychosocial factors.4
Recent studies suggest that insomnia and depression may be associated with OSA. According to a review by Luyster and colleagues, insomnia is present in 39% to 58% of patients with OSA.5 Since OSA may disturb sleep by the number of nightly awakenings, OSA may cause or worsen insomnia. Furthermore, insomnia may exacerbate sleep apnea thus impeding the effectiveness of sleep apnea treatment.
In some studies, the presence of insomnia symptoms prior to initiating CPAP treatment has been found to be associated with reduced CPAP adherence. For example, in 2010, Wickwire and colleagues found that there was a negative association with the average nightly minutes of CPAP use for those patients with OSA that reported symptoms of sleep maintenance insomnia.6 This was not found for those patients with OSA who reported symptoms of sleep onset insomnia or reported no insomnia at all. In another study by Pieh and colleagues, self-reported insomnia symptoms were predictive of CPAP adherence (defined as < 4 hours use/night) at a 6-month follow-up.7 However, results from a separate study indicated that insomnia was not associated with 6-month CPAP adherence.8
Depressive symptoms are commonly reported by patients with OSA, and higher rates of depressive symptomatology in patients with OSA have been observed in a number of prevalence studies when compared with the general population.9,10 Between 15% and 56% of patients with OSA are diagnosed with a depressive disorder compared with 6.6% of the general population.11 OSA may be causally related with depression or coexist as a separate disorder. Apnea severity has been shown to exacerbate depressive symptoms, and treatment with CPAP can improve depressive symptoms.12,13 Unfortunately, depression has been found to reduce CPAP adherence. For example, Law and colleagues found that depression was independently associated with poorer adherence during home-based auto-PAP titration.14 Furthermore, in a study by Gurlanick and colleagues, depressive symptoms were independently associated with reduced CPAP adherence in surgical patients with OSA.15
To the best of our knowledge, the combined impact of both insomnia and depression on CPAP adherence has not been investigated. In military populations this may be especially important as CPAP adherence has been reported to be worse in military patients with posttraumatic stress disorder (PTSD) and other psychiatric disorders, and there are increasing rates of insomnia and OSA in the military.16,17 We hypothesize that active-duty and retired military patients with self-reported insomnia and depression will have reduced short and long-term CPAP adherence.
Methods
This is a retrospective cohort study that reviewed charts of active-duty and retired military members diagnosed with OSA by the Sleep Medicine Clinic at Naval Medical Center San Diego in California using a home sleep test (HST). The HSTs were interpreted by board-certified physicians in sleep medicine. Prior to the HST, all patients completed a sleep questionnaire that included self-reports of daytime sleepiness, using the Epworth Sleepiness Scale (ESS), depression using the Center for Epidemiologic Studies Depression Scale (CES-D) and insomnia using the Insomnia Severity Index (ISI).
The study population included active-duty and veteran patients diagnosed with OSA who chose treatment with a CPAP and attended the sleep clinic’s OSA educational class, which discussed the diagnosis and treatment of OSA. Inclusion criteria were patients aged > 18 years and diagnosed with OSA at the Naval Medical Center San Diego sleep lab between June 2014 and June 2015.
The study population was stratified into 4 groups: (1) those with OSA but no self-reported depression or insomnia; (2) those with OSA and self-reported depression but no insomnia; (3) those with OSA and insomnia but no depression; and (4) those with OSA and self-reported depression and insomnia. Charts were excluded from the review if there were incomplete data or if the patient selected an alternative treatment for OSA, such as an oral appliance. A total of 120 charts were included in the final review. This study was approved by the Naval Medical Center San Diego Institutional Review Board.
Data Collection
Data collected included the individual’s age, sex, minimum oxygen saturation during sleep, body mass index (BMI), height, weight, ESS score at time of diagnosis, date of HST, and date of attendance at the clinic’s OSA group treatment class. Diagnosis of OSA was based on the patient’s ≥ 5 AHI. OSA severity was divided into mild (AHI 5-14), moderate (AHI 15-29), or severe (AHI ≥ 30). A patient with a CES-D score > 14 was considered to have clinically significant depression, and a patient with an ISI score of > 14 was considered to have clinically significant insomnia. ISI is a reliable and valid instrument to quantify perceived insomnia severity.18 The CES-D was used only as an indicator of symptoms relating to depression, not to clinically diagnose depression. It also has been used extensively to investigate levels of depression without a psychiatric diagnosis.19
Follow-up CPAP adherence was collected at 3- and 12-month intervals after the date of the patient’s OSA treatment group class and included AHI, median pressure setting, median days used, average time used per night, and percentage of days used for more than 4 hours for the previous 30 days. Data were obtained through Sleep Data and ResMed websites, which receive patient adherence data directly from the patient’s CPAP device. Patients were considered to be adherent with CPAP usage based on the Medicare definition: Use of the CPAP device > 4 hours per night for at least 70% of nights during a 30-day period). The 3-month time frame was used as a short interval because that is when patients are seen in the pulmonary clinic for their initial follow-up appointment. Patients are seen again at 12 months because durable medical equipment supplies must be reordered after 12 months, which requires a patient visit.
Statistical Analysis
Linear regression methods were used to characterize any potential relationships between the predictor variables and the target outcome variables associated with CPAP adherence at 3 and 12 months. Scatterplots were produced to assess whether linear structure was sufficient to characterize any detectable relationships, or whether there existed more complex, nonlinear relationships. The best-fitting linear regression line was examined in relation to the confidence bands of the corresponding LOESS line to determine whether a more complicated model structure was needed to capture the relationship.
Standard tests of assumptions required for these methods were also carried out: QQ plots of residuals to test for normality, the Durbin-Watson test for independence of residuals, and the nonconstant variance score test for heteroskedasticity (ie, Breusch-Pagan test). The results of these assumptions tests are reported only in cases in which the assumptions were revealed to be untenable. In cases in which suspicious outlying observations may have biased analyses, robust versions of the corresponding models were constructed. In no cases did the resulting conclusions change; only the results of the original analysis are reported. All analyses were carried out in R (R Foundation, r-project.org). Statistical significance was defined as P < .05.
Results
Our study population was predominately male (90%) with a median age of 41 years (range 22-65) and BMI of 29.8 (range 7.7-57.2)(Table 1). 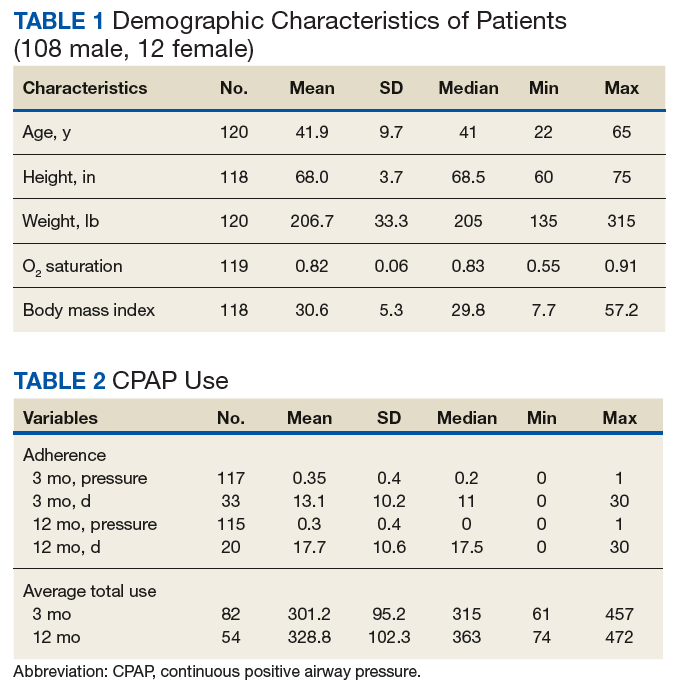
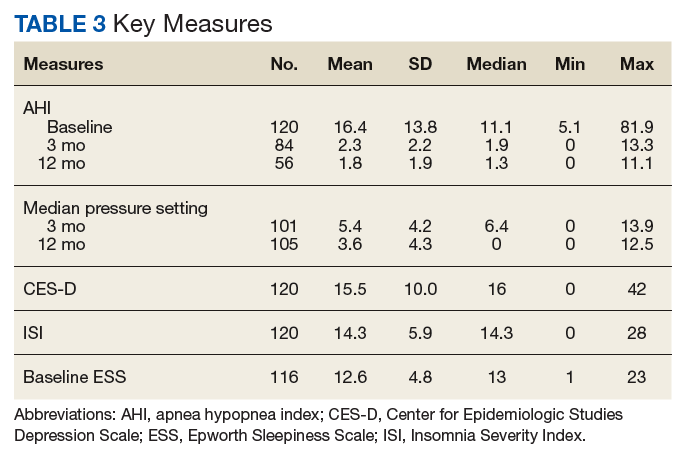
Predictors of CPAP Adherence
OSA severity, as measured by the AHI, was the only promising predictor of CPAP use at 3 months (b, 2.128; t80, 2.854; P = .005; adjusted R2, 0.081). The severity of self-reported daytime sleepiness prior to a diagnosis of OSA, as measured by the ESS, did not predict 3-month CPAP adherence (b, 0.688; t77, 0.300; P = .765; adjusted R2, -0.012). Self-reported depression as measured by the CES-D also did not predict CPAP use at 3 months (b, -0.078; t80, -0.014; P = .941; adjusted R2, -0.012). Similarly, self-reported insomnia, as measured by the ISI, did not predict 3-month CPAP adherence (b, 1.765; t80, 0.939; P = .350; adjusted R2, -0.001). Furthermore, a model that incorporated both depression and insomnia proved no better at accounting for variation in 3-month CPAP use (R2, -0.012). Demographic variables, such as age, sex, or BMI did not predict 3-month CPAP adherence (all Ps > .20). Finally, median CPAP pressure approached statistical significance as a predictor of 3-month CPAP adherence (b, 9.493; t66, 1.881; P = .064; adjusted R2, 0.037) (Figure 1). 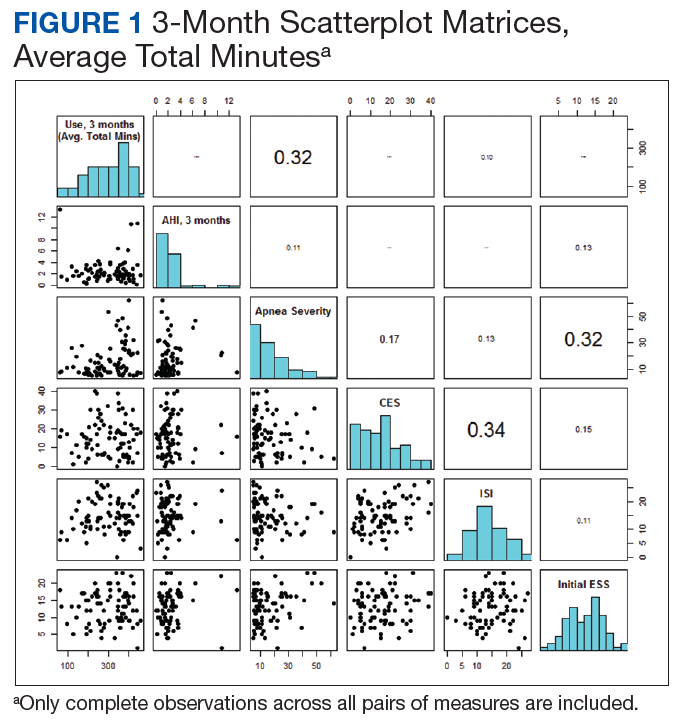
CPAP Use at 12 months
The results for CPAP use at 12 months mirrored the results for 3 months with one main exception: OSA severity, as measured by the AHI, did not predict CPAP use at 12 months (b, 1.158; t52, 1.245; P = .219; adjusted R2, 0.010). Neither adding a quadratic predictor nor log transforming the AHI values produced a better model (R2, -0.0007 vs R2, 0.0089, respectively). The severity of self-reported daytime sleepiness, as measured by the ESS, did not predict 12-month CPAP adherence (b, -2.201; t50, -0.752; P = .456; adjusted R2 = -0.0086). Self-reported depression as measured by the CES-D also did not predict CPAP use at 12 months (b, 0.034, t52, 0.022; P = .983; adjusted R2, -0.092). Self-reported insomnia, as measured by the ISI, also did not predict 12-month CPAP adherence (b, 1.765; t80, 0.939; P = .350; adjusted R2 = -0.001). Furthermore, a model that incorporated both depression and insomnia proved no better at accounting for variation in 12-month CPAP use, (R2, -0.0298). 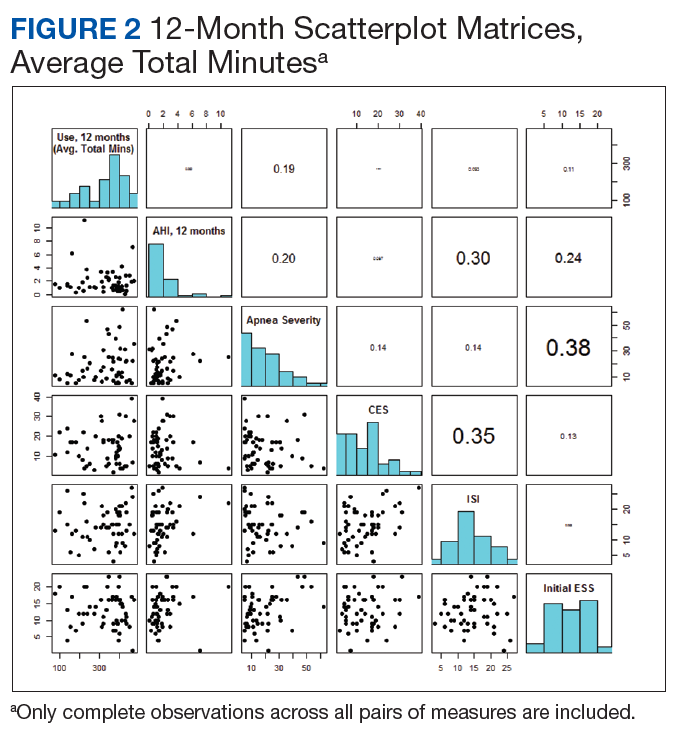
Discussion
Our study did not provide evidence that self-reported depressive and insomnia symptoms, as measured by the CES-D and ISI, can serve as useful predictors of short and long-term CPAP adherence in a sample of active-duty and retired military. OSA severity, as measured by the AHI, was the only promising predictor of CPAP adherence at 3 months.
Insomnia has been shown to improve with the use of CPAP. In a pilot study, Krakow and colleagues investigated the use of CPAP, oral appliances, or bilateral turbinectomy on patients with OSA and chronic insomnia.20 Objective measures of insomnia improved with 1 night of CPAP titration. Björnsdóttir and colleagues evaluated the long-term effects of positive airway pressure (PAP) treatment on 705 adults with middle insomnia.21 They found after 2 years of PAP treatment combined with cognitive behavioral therapy for insomnia, patients had reduced symptoms of middle insomnia. It is possible that persistent insomnia is associated with more severe OSA which was not studied in our population.22
As reported in other studies, it is possible that patients with depressive symptoms can improve with CPAP use, suggesting that depression and CPAP use are not totally unrelated. Edwards and colleagues studied the impact of CPAP on depressive symptoms in men and woman. They found that depressive symptoms are common in OSA and markedly improve with CPAP.23 Bopparaju and colleagues found a high prevalence of anxiety and depression in patients with OSA but did not influence CPAP adherence.24
The results of this study differ from some previous findings where depression was found to predict CPAP adherence.10 This may be due in part to differences in the type of instrument used to assess depression. Wells and colleagues found that baseline depressive symptoms did not correlate with CPAP adherence and that patients with greater CPAP adherence had improvement in OSA and depressive symptoms.25 Furthermore, patients with residual OSA symptoms using CPAP had more depressive symptoms, suggesting that it is the improvement in OSA symptoms that may be correlated with the improvement in depressive symptoms. Although soldiers with PTSD may have reduced CPAP adherence, use of CPAP is associated with improvement in PTSD symptoms.11,26
Limitations
This study had several limitations, including a small sample size. Study patients were also from a single institution, and the majority of patients had mild-to-moderate OSA. A multicenter prospective study with a larger sample size that included more severe patients with OSA may have shown different results. The participants in this study were limited to members from the active-duty and retired military population. The findings in this population may not be transferrable to the general public. Another study limitation was that the ISI and the CES-D were only administered prior to the initiation of CPAP. If the CES-D and ISI were administered at the 3- and 12-month follow-up visits, we could determine whether short and long-term CPAP improved these symptoms or whether there was no association between CPAP adherence with insomnia and depressive symptoms. Another limitation is that we did not have access to information about potential PTSD symptomatology, which has been associated with reduced CPAP adherence and is more common in a military and veteran population.11
Conclusion
This study found little evidence that symptoms of depression and insomnia are useful predictors of CPAP adherence, in either short- or long-term use, in an active-duty and retired military sample. Although these were not found to be predictors of CPAP adherence, further research will be necessary to determine whether CPAP adherence improves symptoms of depression and insomnia in military and veteran populations. Apnea severity did predict CPAP adherence in the short term, but not for any length of time beyond 3 months. More research is needed to explore strategies to improve CPAP adherence in military populations.
1. Qaseem A, Holty JE, Owens DK, Dallas P, Starkey M, Shekelle P; Clinical Guidelines Committee of the American College of Physicians. Management of obstructive sleep apnea in adults: a clinical practice guideline from the American College of Physicians. Ann Intern Med. 2013;159(7):471-483.
2. Epstein LJ, Kristo D, Strollo PJ, et al; Adult Obstructive Sleep Apnea Task Force of the American Academy of Sleep Medicine. Clinical guideline for the evaluation, management and long-term care of obstructive sleep apnea in adults. J Clin Sleep Med. 2009;5(3):263-276.
3. Gay P, Weaver T, Loube D, Iber C; Positive Airway Pressure Task Force; Standards of Practice Committee; American Academy of Sleep Medicine. Evaluation of positive airway pressure treatment for sleep-related breathing disorders in adults. Sleep. 2006;29(3):381-401.
4. Sawyer AM, Gooneratne NS, Marcus CL, Ofer D, Richards KC, Weaver T. A systematic review of CPAP adherence across age groups: clinical and empiric insights for developing CPAP adherence interventions. Sleep Med Rev. 2011;15(6):343-356.
5. Luyster FS; Buysse DJ; Strollo PJ. Comorbid insomnia and obstructive sleep apnea: challenges for clinical practice and research. J Clin Sleep Med. 2010;6(2):196-204.
6. Wickwire EM, Smith MT, Birnbaum S, Collop NA. Sleep maintenance insomnia complaints predict poor CPAP adherence: a clinical case series. Sleep Med. 2010;11(8):772-776
7. Pieh C, Bach M, Popp R, et al. Insomnia symptoms influence CPAP compliance. Sleep Breath. 2013;17(1):99-104.
8. Nguyên XL, Chaskalovic J, Rakotonanahary D, Fleury B. Insomnia symptoms and CPAP compliance in OSAS patients: a descriptive study using data mining methods. Sleep Med. 2010;11(8):777-784.
9. Yilmaz E, Sedky K, Bennett DS. The relationship between depressive symptoms and obstructive sleep apnea in pediatric populations: a meta-analysis. J Clin Sleep Med. 2013;9(11):1213-1220.
10. Chen YH, Keller JK, Kang JH, Hsieh HJ, Lin HC. Obstructive sleep apnea and the subsequent risk of depressive disorder: a population-based follow-up study. J Clin Sleep Med. 2013;9(5):417-423.
11. Kessler RC, Berglund P, Demler O, et al; National Comorbidity Survey Replication. The epidemiology of major depressive disorder: results from the National Comorbidity Survey Replication (NCS-R). JAMA. 2003:289(23):3095-3105
12. Harris M, Glozier N, Ratnavadivel R, Grunstein RR. Obstructive sleep apnea and depression. Sleep Med Rev. 2009;13(6):437-444.
13. Schwartz D, Kohler W, Karatinos G. Symptoms of depression in individuals with obstructive sleep apnea may be amendable to treatment with continuous positive airway pressure. Chest. 2005;128(3):1304-1309
14. Law M, Naughton M, Ho S, Roebuck T, Dabscheck E. Depression may reduce adherence during CPAP titration trial. J Clin Sleep Med. 2014;10(2):163-169.
15. Guralnick AS, Pant M, Minhaj M, Sweitzer BJ, Mokhlesi B. CPAP adherence in patients with newly diagnosed obstructive sleep apnea prior to elective surgery. J Clin Sleep Med. 2012;8(5):501-506
16. Collen JF, Lettieri CJ, Hoffman M. The impact of posttraumatic stress disorder on CPAP adherence in patients with obstructive sleep apnea. J Clin Sleep Med. 2012;8(6):667-672.
17. Caldwell A, Knapik JJ, Lieberman HR. Trends and factors associated with insomnia and sleep apnea in all United States military service members from 2005 to 2014. J Sleep Res. 2017;26(5):665-670.
18. Bastien CH, Vallières A, Morin CM. Validation of the Insomnia Severity Index as an outcome measure for insomnia research. Sleep Med. 2001;2(4):297-307.
19. Radloff LS. The CES-D scale: a self-report depression scale for research in the general population. Appl Psychological Measurement. 1977;1(3):385-401.
20. Krakow B, Melendrez D, Lee SA, Warner TD, Clark JO, Sklar D. Refractory insomnia and sleep-disordered breathing: a pilot study. Sleep Breath. 2004;8(1):15-29.
21. Björnsdóttir E, Janson C, Sigurdsson JF, et al. Symptoms of insomnia among patients with obstructive sleep apnea before and after two years of positive airway pressure treatment. Sleep. 2013;36(12):1901-1909.
22. Glidewell RN, Renn BN, Roby E, Orr WC. Predictors and patterns of insomnia symptoms in OSA before and after PAP therapy. Sleep Med. 2014;15(8):899-905.
23. Edwards C, Mukherjee S, Simpson L, Palmer LJ, Almeida OP, Hillman DR. Depressive symptoms before and after treatment of obstructive sleep apnea in men and women. J Clin Sleep Med. 2015;11(9):1029-1038.
24. Bopparaju S, Casturi L, Guntupalli B, Surani S, Subramanian S. Anxiety and depression in obstructive sleep apnea: Effect of CPAP therapy and influence on CPAP compliance. Presented at: American College of Chest Physicians Annual Meeting, October 31-November 05, 2009; San Diego, CA. Chest. 2009;136(4, meeting abstracts):71S.
25. Wells RD, Freedland KE, Carney RM, Duntley SP, Stepanski EJ. Adherence, reports of benefits, and depression among patients treated with continuous positive airway pressure. Psychosom Med. 2007;69(5):449-454.
26. Orr JE, Smales C, Alexander TH, et al. Treatment of OSA with CPAP is associated with improvement in PTSD symptoms among veterans. J Clin Sleep Med. 2017;13(1):57-63.
Continuous positive airway pressure therapy (CPAP) is the first-line treatment for obstructive sleep apnea (OSA) recommended by the American College of Physicians and the American Academy of Sleep Medicine.1,2 CPAP reduces the apnea hypopnea index (AHI), improves oxyhemoglobin desaturation, and reduces cortical arousals associated with apneic/hypopneic events.3 Despite being an effective treatment for OSA, a significant limitation of CPAP is treatment adherence. Factors associated with CPAP adherence include disease and patient characteristics, perceived self-efficacy, treatment titration procedure, device technology factors, adverse effects, and psychosocial factors.4
Recent studies suggest that insomnia and depression may be associated with OSA. According to a review by Luyster and colleagues, insomnia is present in 39% to 58% of patients with OSA.5 Since OSA may disturb sleep by the number of nightly awakenings, OSA may cause or worsen insomnia. Furthermore, insomnia may exacerbate sleep apnea thus impeding the effectiveness of sleep apnea treatment.
In some studies, the presence of insomnia symptoms prior to initiating CPAP treatment has been found to be associated with reduced CPAP adherence. For example, in 2010, Wickwire and colleagues found that there was a negative association with the average nightly minutes of CPAP use for those patients with OSA that reported symptoms of sleep maintenance insomnia.6 This was not found for those patients with OSA who reported symptoms of sleep onset insomnia or reported no insomnia at all. In another study by Pieh and colleagues, self-reported insomnia symptoms were predictive of CPAP adherence (defined as < 4 hours use/night) at a 6-month follow-up.7 However, results from a separate study indicated that insomnia was not associated with 6-month CPAP adherence.8
Depressive symptoms are commonly reported by patients with OSA, and higher rates of depressive symptomatology in patients with OSA have been observed in a number of prevalence studies when compared with the general population.9,10 Between 15% and 56% of patients with OSA are diagnosed with a depressive disorder compared with 6.6% of the general population.11 OSA may be causally related with depression or coexist as a separate disorder. Apnea severity has been shown to exacerbate depressive symptoms, and treatment with CPAP can improve depressive symptoms.12,13 Unfortunately, depression has been found to reduce CPAP adherence. For example, Law and colleagues found that depression was independently associated with poorer adherence during home-based auto-PAP titration.14 Furthermore, in a study by Gurlanick and colleagues, depressive symptoms were independently associated with reduced CPAP adherence in surgical patients with OSA.15
To the best of our knowledge, the combined impact of both insomnia and depression on CPAP adherence has not been investigated. In military populations this may be especially important as CPAP adherence has been reported to be worse in military patients with posttraumatic stress disorder (PTSD) and other psychiatric disorders, and there are increasing rates of insomnia and OSA in the military.16,17 We hypothesize that active-duty and retired military patients with self-reported insomnia and depression will have reduced short and long-term CPAP adherence.
Methods
This is a retrospective cohort study that reviewed charts of active-duty and retired military members diagnosed with OSA by the Sleep Medicine Clinic at Naval Medical Center San Diego in California using a home sleep test (HST). The HSTs were interpreted by board-certified physicians in sleep medicine. Prior to the HST, all patients completed a sleep questionnaire that included self-reports of daytime sleepiness, using the Epworth Sleepiness Scale (ESS), depression using the Center for Epidemiologic Studies Depression Scale (CES-D) and insomnia using the Insomnia Severity Index (ISI).
The study population included active-duty and veteran patients diagnosed with OSA who chose treatment with a CPAP and attended the sleep clinic’s OSA educational class, which discussed the diagnosis and treatment of OSA. Inclusion criteria were patients aged > 18 years and diagnosed with OSA at the Naval Medical Center San Diego sleep lab between June 2014 and June 2015.
The study population was stratified into 4 groups: (1) those with OSA but no self-reported depression or insomnia; (2) those with OSA and self-reported depression but no insomnia; (3) those with OSA and insomnia but no depression; and (4) those with OSA and self-reported depression and insomnia. Charts were excluded from the review if there were incomplete data or if the patient selected an alternative treatment for OSA, such as an oral appliance. A total of 120 charts were included in the final review. This study was approved by the Naval Medical Center San Diego Institutional Review Board.
Data Collection
Data collected included the individual’s age, sex, minimum oxygen saturation during sleep, body mass index (BMI), height, weight, ESS score at time of diagnosis, date of HST, and date of attendance at the clinic’s OSA group treatment class. Diagnosis of OSA was based on the patient’s ≥ 5 AHI. OSA severity was divided into mild (AHI 5-14), moderate (AHI 15-29), or severe (AHI ≥ 30). A patient with a CES-D score > 14 was considered to have clinically significant depression, and a patient with an ISI score of > 14 was considered to have clinically significant insomnia. ISI is a reliable and valid instrument to quantify perceived insomnia severity.18 The CES-D was used only as an indicator of symptoms relating to depression, not to clinically diagnose depression. It also has been used extensively to investigate levels of depression without a psychiatric diagnosis.19
Follow-up CPAP adherence was collected at 3- and 12-month intervals after the date of the patient’s OSA treatment group class and included AHI, median pressure setting, median days used, average time used per night, and percentage of days used for more than 4 hours for the previous 30 days. Data were obtained through Sleep Data and ResMed websites, which receive patient adherence data directly from the patient’s CPAP device. Patients were considered to be adherent with CPAP usage based on the Medicare definition: Use of the CPAP device > 4 hours per night for at least 70% of nights during a 30-day period). The 3-month time frame was used as a short interval because that is when patients are seen in the pulmonary clinic for their initial follow-up appointment. Patients are seen again at 12 months because durable medical equipment supplies must be reordered after 12 months, which requires a patient visit.
Statistical Analysis
Linear regression methods were used to characterize any potential relationships between the predictor variables and the target outcome variables associated with CPAP adherence at 3 and 12 months. Scatterplots were produced to assess whether linear structure was sufficient to characterize any detectable relationships, or whether there existed more complex, nonlinear relationships. The best-fitting linear regression line was examined in relation to the confidence bands of the corresponding LOESS line to determine whether a more complicated model structure was needed to capture the relationship.
Standard tests of assumptions required for these methods were also carried out: QQ plots of residuals to test for normality, the Durbin-Watson test for independence of residuals, and the nonconstant variance score test for heteroskedasticity (ie, Breusch-Pagan test). The results of these assumptions tests are reported only in cases in which the assumptions were revealed to be untenable. In cases in which suspicious outlying observations may have biased analyses, robust versions of the corresponding models were constructed. In no cases did the resulting conclusions change; only the results of the original analysis are reported. All analyses were carried out in R (R Foundation, r-project.org). Statistical significance was defined as P < .05.
Results
Our study population was predominately male (90%) with a median age of 41 years (range 22-65) and BMI of 29.8 (range 7.7-57.2)(Table 1).
Predictors of CPAP Adherence
OSA severity, as measured by the AHI, was the only promising predictor of CPAP use at 3 months (b, 2.128; t80, 2.854; P = .005; adjusted R2, 0.081). The severity of self-reported daytime sleepiness prior to a diagnosis of OSA, as measured by the ESS, did not predict 3-month CPAP adherence (b, 0.688; t77, 0.300; P = .765; adjusted R2, -0.012). Self-reported depression as measured by the CES-D also did not predict CPAP use at 3 months (b, -0.078; t80, -0.014; P = .941; adjusted R2, -0.012). Similarly, self-reported insomnia, as measured by the ISI, did not predict 3-month CPAP adherence (b, 1.765; t80, 0.939; P = .350; adjusted R2, -0.001). Furthermore, a model that incorporated both depression and insomnia proved no better at accounting for variation in 3-month CPAP use (R2, -0.012). Demographic variables, such as age, sex, or BMI did not predict 3-month CPAP adherence (all Ps > .20). Finally, median CPAP pressure approached statistical significance as a predictor of 3-month CPAP adherence (b, 9.493; t66, 1.881; P = .064; adjusted R2, 0.037) (Figure 1).
CPAP Use at 12 months
The results for CPAP use at 12 months mirrored the results for 3 months with one main exception: OSA severity, as measured by the AHI, did not predict CPAP use at 12 months (b, 1.158; t52, 1.245; P = .219; adjusted R2, 0.010). Neither adding a quadratic predictor nor log transforming the AHI values produced a better model (R2, -0.0007 vs R2, 0.0089, respectively). The severity of self-reported daytime sleepiness, as measured by the ESS, did not predict 12-month CPAP adherence (b, -2.201; t50, -0.752; P = .456; adjusted R2 = -0.0086). Self-reported depression as measured by the CES-D also did not predict CPAP use at 12 months (b, 0.034, t52, 0.022; P = .983; adjusted R2, -0.092). Self-reported insomnia, as measured by the ISI, also did not predict 12-month CPAP adherence (b, 1.765; t80, 0.939; P = .350; adjusted R2 = -0.001). Furthermore, a model that incorporated both depression and insomnia proved no better at accounting for variation in 12-month CPAP use, (R2, -0.0298).
Discussion
Our study did not provide evidence that self-reported depressive and insomnia symptoms, as measured by the CES-D and ISI, can serve as useful predictors of short and long-term CPAP adherence in a sample of active-duty and retired military. OSA severity, as measured by the AHI, was the only promising predictor of CPAP adherence at 3 months.
Insomnia has been shown to improve with the use of CPAP. In a pilot study, Krakow and colleagues investigated the use of CPAP, oral appliances, or bilateral turbinectomy on patients with OSA and chronic insomnia.20 Objective measures of insomnia improved with 1 night of CPAP titration. Björnsdóttir and colleagues evaluated the long-term effects of positive airway pressure (PAP) treatment on 705 adults with middle insomnia.21 They found after 2 years of PAP treatment combined with cognitive behavioral therapy for insomnia, patients had reduced symptoms of middle insomnia. It is possible that persistent insomnia is associated with more severe OSA which was not studied in our population.22
As reported in other studies, it is possible that patients with depressive symptoms can improve with CPAP use, suggesting that depression and CPAP use are not totally unrelated. Edwards and colleagues studied the impact of CPAP on depressive symptoms in men and woman. They found that depressive symptoms are common in OSA and markedly improve with CPAP.23 Bopparaju and colleagues found a high prevalence of anxiety and depression in patients with OSA but did not influence CPAP adherence.24
The results of this study differ from some previous findings where depression was found to predict CPAP adherence.10 This may be due in part to differences in the type of instrument used to assess depression. Wells and colleagues found that baseline depressive symptoms did not correlate with CPAP adherence and that patients with greater CPAP adherence had improvement in OSA and depressive symptoms.25 Furthermore, patients with residual OSA symptoms using CPAP had more depressive symptoms, suggesting that it is the improvement in OSA symptoms that may be correlated with the improvement in depressive symptoms. Although soldiers with PTSD may have reduced CPAP adherence, use of CPAP is associated with improvement in PTSD symptoms.11,26
Limitations
This study had several limitations, including a small sample size. Study patients were also from a single institution, and the majority of patients had mild-to-moderate OSA. A multicenter prospective study with a larger sample size that included more severe patients with OSA may have shown different results. The participants in this study were limited to members from the active-duty and retired military population. The findings in this population may not be transferrable to the general public. Another study limitation was that the ISI and the CES-D were only administered prior to the initiation of CPAP. If the CES-D and ISI were administered at the 3- and 12-month follow-up visits, we could determine whether short and long-term CPAP improved these symptoms or whether there was no association between CPAP adherence with insomnia and depressive symptoms. Another limitation is that we did not have access to information about potential PTSD symptomatology, which has been associated with reduced CPAP adherence and is more common in a military and veteran population.11
Conclusion
This study found little evidence that symptoms of depression and insomnia are useful predictors of CPAP adherence, in either short- or long-term use, in an active-duty and retired military sample. Although these were not found to be predictors of CPAP adherence, further research will be necessary to determine whether CPAP adherence improves symptoms of depression and insomnia in military and veteran populations. Apnea severity did predict CPAP adherence in the short term, but not for any length of time beyond 3 months. More research is needed to explore strategies to improve CPAP adherence in military populations.
1. Qaseem A, Holty JE, Owens DK, Dallas P, Starkey M, Shekelle P; Clinical Guidelines Committee of the American College of Physicians. Management of obstructive sleep apnea in adults: a clinical practice guideline from the American College of Physicians. Ann Intern Med. 2013;159(7):471-483.
2. Epstein LJ, Kristo D, Strollo PJ, et al; Adult Obstructive Sleep Apnea Task Force of the American Academy of Sleep Medicine. Clinical guideline for the evaluation, management and long-term care of obstructive sleep apnea in adults. J Clin Sleep Med. 2009;5(3):263-276.
3. Gay P, Weaver T, Loube D, Iber C; Positive Airway Pressure Task Force; Standards of Practice Committee; American Academy of Sleep Medicine. Evaluation of positive airway pressure treatment for sleep-related breathing disorders in adults. Sleep. 2006;29(3):381-401.
4. Sawyer AM, Gooneratne NS, Marcus CL, Ofer D, Richards KC, Weaver T. A systematic review of CPAP adherence across age groups: clinical and empiric insights for developing CPAP adherence interventions. Sleep Med Rev. 2011;15(6):343-356.
5. Luyster FS; Buysse DJ; Strollo PJ. Comorbid insomnia and obstructive sleep apnea: challenges for clinical practice and research. J Clin Sleep Med. 2010;6(2):196-204.
6. Wickwire EM, Smith MT, Birnbaum S, Collop NA. Sleep maintenance insomnia complaints predict poor CPAP adherence: a clinical case series. Sleep Med. 2010;11(8):772-776
7. Pieh C, Bach M, Popp R, et al. Insomnia symptoms influence CPAP compliance. Sleep Breath. 2013;17(1):99-104.
8. Nguyên XL, Chaskalovic J, Rakotonanahary D, Fleury B. Insomnia symptoms and CPAP compliance in OSAS patients: a descriptive study using data mining methods. Sleep Med. 2010;11(8):777-784.
9. Yilmaz E, Sedky K, Bennett DS. The relationship between depressive symptoms and obstructive sleep apnea in pediatric populations: a meta-analysis. J Clin Sleep Med. 2013;9(11):1213-1220.
10. Chen YH, Keller JK, Kang JH, Hsieh HJ, Lin HC. Obstructive sleep apnea and the subsequent risk of depressive disorder: a population-based follow-up study. J Clin Sleep Med. 2013;9(5):417-423.
11. Kessler RC, Berglund P, Demler O, et al; National Comorbidity Survey Replication. The epidemiology of major depressive disorder: results from the National Comorbidity Survey Replication (NCS-R). JAMA. 2003:289(23):3095-3105
12. Harris M, Glozier N, Ratnavadivel R, Grunstein RR. Obstructive sleep apnea and depression. Sleep Med Rev. 2009;13(6):437-444.
13. Schwartz D, Kohler W, Karatinos G. Symptoms of depression in individuals with obstructive sleep apnea may be amendable to treatment with continuous positive airway pressure. Chest. 2005;128(3):1304-1309
14. Law M, Naughton M, Ho S, Roebuck T, Dabscheck E. Depression may reduce adherence during CPAP titration trial. J Clin Sleep Med. 2014;10(2):163-169.
15. Guralnick AS, Pant M, Minhaj M, Sweitzer BJ, Mokhlesi B. CPAP adherence in patients with newly diagnosed obstructive sleep apnea prior to elective surgery. J Clin Sleep Med. 2012;8(5):501-506
16. Collen JF, Lettieri CJ, Hoffman M. The impact of posttraumatic stress disorder on CPAP adherence in patients with obstructive sleep apnea. J Clin Sleep Med. 2012;8(6):667-672.
17. Caldwell A, Knapik JJ, Lieberman HR. Trends and factors associated with insomnia and sleep apnea in all United States military service members from 2005 to 2014. J Sleep Res. 2017;26(5):665-670.
18. Bastien CH, Vallières A, Morin CM. Validation of the Insomnia Severity Index as an outcome measure for insomnia research. Sleep Med. 2001;2(4):297-307.
19. Radloff LS. The CES-D scale: a self-report depression scale for research in the general population. Appl Psychological Measurement. 1977;1(3):385-401.
20. Krakow B, Melendrez D, Lee SA, Warner TD, Clark JO, Sklar D. Refractory insomnia and sleep-disordered breathing: a pilot study. Sleep Breath. 2004;8(1):15-29.
21. Björnsdóttir E, Janson C, Sigurdsson JF, et al. Symptoms of insomnia among patients with obstructive sleep apnea before and after two years of positive airway pressure treatment. Sleep. 2013;36(12):1901-1909.
22. Glidewell RN, Renn BN, Roby E, Orr WC. Predictors and patterns of insomnia symptoms in OSA before and after PAP therapy. Sleep Med. 2014;15(8):899-905.
23. Edwards C, Mukherjee S, Simpson L, Palmer LJ, Almeida OP, Hillman DR. Depressive symptoms before and after treatment of obstructive sleep apnea in men and women. J Clin Sleep Med. 2015;11(9):1029-1038.
24. Bopparaju S, Casturi L, Guntupalli B, Surani S, Subramanian S. Anxiety and depression in obstructive sleep apnea: Effect of CPAP therapy and influence on CPAP compliance. Presented at: American College of Chest Physicians Annual Meeting, October 31-November 05, 2009; San Diego, CA. Chest. 2009;136(4, meeting abstracts):71S.
25. Wells RD, Freedland KE, Carney RM, Duntley SP, Stepanski EJ. Adherence, reports of benefits, and depression among patients treated with continuous positive airway pressure. Psychosom Med. 2007;69(5):449-454.
26. Orr JE, Smales C, Alexander TH, et al. Treatment of OSA with CPAP is associated with improvement in PTSD symptoms among veterans. J Clin Sleep Med. 2017;13(1):57-63.
Abdominal Wall Schwannoma
Schwannomas are benign tumors exclusively composed of Schwann cells that arise from the peripheral nerve sheath; these tumors theoretically can present anywhere in the body where nerves reside. They tend to occur in the head and neck region (classically an acoustic neuroma) but also occur in other locations, including the retroperitoneal space and the extremities, particularly flexural surfaces. Patients with cutaneous schwannomas are most likely to present to their primary care provider’s office reporting skin findings or localized pain, and providers should be aware of schwannomas on the differential for painful nodular growths.
Case Presentation
A 70-year-old man with type 2 diabetes mellitus presented to the primary care clinic for intermittent, sharp, localized left lower quadrant abdominal wall pain that was gradually progressive over the previous few months. The patient noticed the development of a small nodule 7 to 8 months prior to the visit, at which time the pain was less frequent and less severe. He reported no postprandial association of the pain, nausea, vomiting, diarrhea, constipation, or other gastrointestinal symptoms.
Ten months prior to the presentation, he was involved in a low-impact motor vehicle collision as a pedestrian in which he fell face-first onto the hood of an oncoming car. At that time, he did not note any abdominal trauma or pain. Evaluation at a local emergency department did not reveal any major injuries. In the interim, he had self-administered insulin in his abdominal region, as he had without incident for the previous 2 years. He reported that he was not injecting near the site of the nodule since it had formed. He could not recall whether the location was a previous insulin administration site.
On examination, the patient’s vital signs were normal as were the cardiac and respiratory examinations. An abdominal exam revealed normal bowel sounds and no overlying skin changes or discoloration. Palpation revealed a 1.5 x 1 cm rubbery-to-firm, well-circumscribed subcutaneous nodule along his mid-left abdomen, about 7 cm lateral to the umbilicus. The nodule was sensitive to both light touch and deep pressure. It was firmer than expected for an abdominal wall lipoma. There was no central puncta or pore to suggest an epidermal inclusion cyst. There was no surrounding erythema or induration to suggest an abscess. 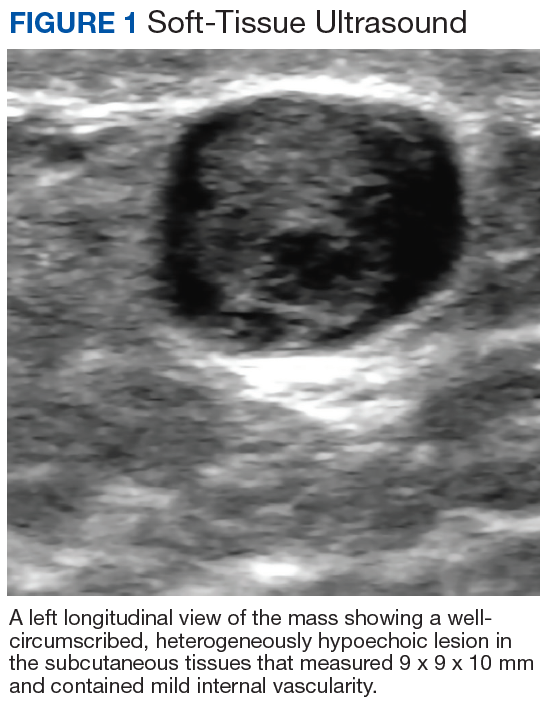
The patient was referred for surgery and underwent excisional biopsy of the mass. Pathology revealed a well-circumscribed vascular/spindle-cell lesion consistent with a schwannoma. His postoperative course was uncomplicated. At 4-week follow-up the incision had healed completely and the patient was pain free.
Discussion
Soft-tissue nodules are common—about two-thirds of soft-tissue tumors are classified into 7 diagnostic categories: lipoma and lipoma variants (16%), fibrous histiocytoma (13%), nodular fasciitis (11%), hemangioma (8%), fibromatosis (7%), neurofibroma (5%), and schwannoma (5%).1 Peripheral nerve tumors (schwannomas, neurofibromas) can be associated with pain or paresthesias, and less commonly, neurologic deficits, such as motor weakness. Peripheral nerve tumors have several classifications, such as nonneoplastic vs neoplastic, benign vs malignant, and sheath vs nonsheath origins. Schwannomas are considered part of the neoplastic subset due to their growth; otherwise, they are benign with a sheath origin. In contrast to neurofibromas, benign schwannomas have a slower rate of progression, lower association with pain, and fewer neurologic symptoms.2
The neural sheath is made up of 3 types of cells: the fibroblast, the Schwann cell, and the perineural cell, which lacks a basement membrane. It is the Schwann cell that can give rise to the 3 main types of cutaneous nerve tumors: neuromas, neurofibromas, and schwannomas.3 A nerve that is both entering and exiting a mass is a classic presentation for a peripheral nerve sheath tumor. If the nerve is eccentric to the lesion, then it is consistent with a schwannoma (not a neurofibroma).4 Schwannomas are made exclusively of Schwann cells that arise from the nerve sheath, whereas neurofibromas are made up of all the different cell types that constitute a nerve. Bilateral vestibular schwannomas (acoustic neuromas) are virtually pathognomonic of neurofibromatosis 2 (NF-2), which can manifest as hearing loss, tinnitus, and equilibrium problems. In contrast, neurofibromatosis 1 (NF-1) is more common, characterized by multiple café au lait spots, freckling in the axillary and groin regions, increased risk of cancers overall, and development of pedunculated skin growths, brain, or organ-based neurofibromas.
Diagnosis
A workup generally includes a thorough history and examination as well as imaging. In cases of superficial subcutaneous lesions, an ultrasound is often the imaging modality of choice. However, magnetic resonance imaging (MRI) and computed tomography (CT) scans are frequently used for more deep-seated lesions. There can be significant differences between malignant and benign neural lesions on MRI and CT in terms of contrast-uptake and heterogeneity of tissue, but the visual features are not consistent. Best estimates for MRI suggest 61% sensitivity and 90% specificity for the diagnosis of high-grade malignant peripheral nerve sheath tumors based on imaging alone.5
Definitive diagnosis requires surgical excision. Fine-needle aspiration can be used to diagnose subcutaneous nodules, but there is a possibility that degenerative changes and nuclear atypia seen on a smaller sample may be confused with a more aggressive sarcoma. For example, long-standing schwannomas are often called ancient, meaning that they break down over time, and the atypia they display is a regressive phenomenon.6 Therefore, a small or limited tissue sampling may not be representative of the entire lesion.7 As such, patients will likely need referral for surgical removal to determine the exact nature of the growth.
Although schwannomas are uncommon overall, the highest incidence is in the fourth decade of life with a slight predominance in females. They are often incidentally found as a palpable mass but can be symptomatic with paresthesias, pain, or neurologic changes—particularly when identified in the retroperitoneum or along joints. Schwannomas are most commonly found in the retroperitoneum (32%), mediastinum (23%), head and neck (18%), and extremities (16%).8 The majority of cases (about 90%) are sporadic; whereas 2% are related to NF-2.9 The abdominal wall schwannoma is rare. Our review of English-language literature in PubMed and EMBASE found only 5 other case reports (Table 1). 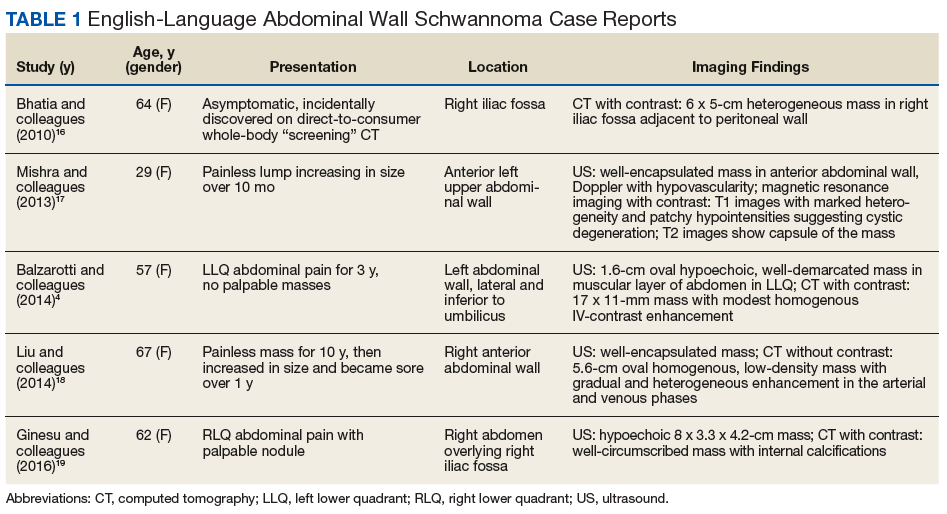
On physical examination, superficial lesions are freely movable except for a single point of attachment, which is generally along the long axis of the nerve. 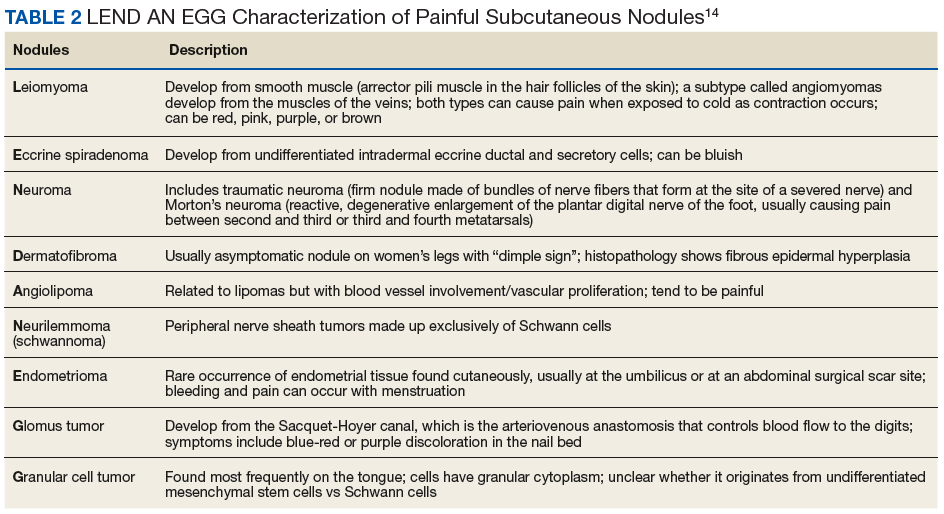
Pathology
On gross pathology examination, schwannomas have a well-circumscribed smooth external surface. On microscopy, schwannomas are truly encapsulated, uninodular, spindle-cell proliferations arranged in a streaming pattern within a background of thick, hyalinized blood vessels. Classic schwannomas typically exhibit a biphasic pattern of alternating areas of high and low cellularity and are named for Swedish neurologist Nils Antoni. The more cellular regions are referred to as Antoni A areas and consist of streaming fascicles of compact spindle cells that often palisade around acellular eosinophilic areas of fibrillary processes known as Verocay bodies.
In contrast, the lower cellularity regions (Antoni B areas) consist of multipolar, loosely textured cells with abundant cytoplasm, haphazardly arranged processes, and an overall myxoid appearance.11 Schwannomas are known to have widely variable proportions of Antoni A and Antoni B areas; in this case, the excised specimen was noted to have predominately Antoni A areas without well-defined Verocay bodies and only scattered foci showing some suggestion of the hypocellular Antoni B architecture (Figure 2).9,12 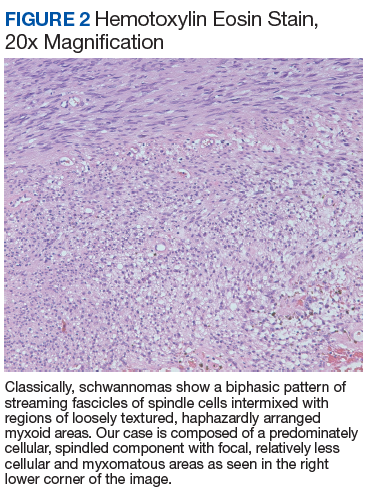
Immunohistochemical stains for S100 and SOX10 (used to identify cells derived from a neural crest lineage) were strongly positive, which is characteristic of schwannomas.13 Although there have only been rare reports of extracranial schwannomas undergoing malignant transformation, it is critical to rule out the possibility of a de novo malignant peripheral nerve sheath tumor (MPNST).13 In general, MPNSTs tend to be more cellular, have brisk mitotic activity, areas of necrosis, hyperchromatic nuclei, and conspicuous pleomorphism. Mitotic figures, which can be concerning for malignant potential if present in high number, were noted occasionally in our patient; however, occasional mitosis may be seen in classic schwannomas. Clinically, MPNSTs have a poor prognosis. Based on case reports, disease-specific survival at 10 years is 31.6% for localized disease and only 7.5% for metastatic disease.14 In this case, there was no evidence of any of the high-grade features of a malignant peripheral nerve sheath tumor, thus supporting the diagnosis of schwannoma (neurilemmoma).
Treatment
Schwannomas are exclusively treated by excision. Prognosis is good with low recurrence rates. It is unknown what the recurrence rates are for completely resected abdominal wall schwannomas since there are so few reports in the literature. For other well-known entities, such as vestibular schwannoma (acoustic neuromas), the recurrence rates are generally 2% to 3%.15 Transformation of schwannomas into MPNSTs are so unusual that they are only described in single case reports.
Conclusion
Soft-tissue masses are a common complaint. Most are benign and do not require excision unless it interferes with the quality of life of the patient or if the diagnosis is uncertain. It is important to be aware of schwannomas in the differential diagnosis of soft-tissue masses. Diagnosis may be achieved through the combination of imaging and biopsy, but the definitive diagnosis is made on complete excision of the mass.
Acknowledgments
Contributors: Michael Lewis, MD, Department of Pathology, VA Greater Los Angeles Healthcare System. Written permission also was obtained from the patient.
1. Kransdorf MJ. Benign soft-tissue tumors in a large referral population: distribution of specific diagnoses by age, sex, and location. AJR Am J Roentgenol. 1995;164(2):395-402.
2. Valeyrie-Allanore L, Ismaili N, Bastuji-Garin S, et al. Symptoms associated with malignancy of peripheral nerve sheath tumors: a retrospective study of 69 patients with neurofibromatosis 1. Br J Dermatol. 2005;153(1):79-82.
3. Patterson JW. Neural and neuroendocrine tumors. In: Weedon’s Skin Pathology. 4th ed. Elsevier; 2016:1042-1049.
4. Balzarotti R, Rondelli F, Barizzi J, Cartolari R. Symptomatic schwannoma of the abdominal wall: a case report and review of the literature. Oncol Lett. 2015;9(3):1095-1098.
5. Wasa J, Nishida Y, Tsukushi S, et al. MRI features in the differentiation of malignant peripheral nerve sheath tumors and neurofibromas. AJR Am J Roentgenol. 2010;194(6):1568-1574.
6. Dodd LG, Marom EM, Dash RC, Matthews MR, McLendon RE. Fine-needle aspiration cytology of “ancient” schwannoma. Diagn Cytopathol. 1999;20(5):307-311.
7. Powers CN, Berardo MD, Frable WJ. Fine-needle aspiration biopsy: pitfalls in the diagnosis of spindle-cell lesions. Diagn Cytopathol. 1994;10(3):232-240; discussion 241.
8. White W, Shiu MH, Rosenblum MK, Erlandson RA, Woodruff JM. Cellular schwannoma: a clinicopathologic study of 57 patients and 58 tumors. Cancer. 1990;66(6):1266-1275.
9. Goldblum JR, Weiss SW, Folpe AL. Benign tumors of peripheral nerves. In: Enzinger and Weiss’s Soft Tissue Tumors. 6th ed. Philadelphia, PA: Elsevier; 2014:813-828.
10. Naversen DN, Trask DM, Watson FH, Burket JM. Painful tumors of the skin: “LEND AN EGG.” J Am Acad Deramatol. 1993;28(2, pt 2):298-300.
11. Burger PC, Scheithauer BW. Diagnostic Pathology: Neuropathology. 1st ed. Salt Lake City, UT: Amirsys; 2012.
12. Louis DN, Ohgaki H, Wiestler OD, Cavenee WK, eds. World Health Organization Histological Classification of Tumours of the Central Nervous System. Vol. 1. Paris, France: International Agency for Research on Cancer; 2016.
13. Woodruff JM, Selig AM, Crowley K, Allen PW. Schwannoma (neurilemoma) with malignant transformation. A rare, distinctive peripheral nerve tumor. Am J Surg Pathol. 1994;18(9)82-895.
14. Zou C, Smith KD, Liu J, et al. Clinical, pathological, and molecular variables predictive of malignant peripheral nerve sheath tumor outcome. Ann Surg. 2009;249(6):1014-1022.
15. Ahmad RA, Sivalingam S, Topsakal V, Russo A, Taibah A, Sanna M. Rate of recurrent vestibular schwannoma after total removal via different surgical approaches. Ann Otol Rhinol Laryngol. 2012;121(3):156-161.
16. Bhatia RK, Banerjea A, Ram M, Lovett BE. Benign ancient schwannoma of the abdominal wall: an unwanted birthday present. BMC Surg. 2010;10:1-5.
17. Mishra A, Hamadto M, Azzabi M, Elfagieh M. Abdominal wall schwannoma: case report and review of the literature. Case Rep Radiol. 2013;2013:456863.
18. Liu Y, Chen X, Wang T, Wang Z. Imaging observations of a schwannoma of low malignant potential in the anterior abdominal wall: a case report. Oncol Lett. 2014;8(3):1159-1162.
19. Ginesu GC, Puledda M, Feo CF et al. Abdominal wall schwannoma. J Gastrointest Surg. 2016;20(10):1781-1783.
Schwannomas are benign tumors exclusively composed of Schwann cells that arise from the peripheral nerve sheath; these tumors theoretically can present anywhere in the body where nerves reside. They tend to occur in the head and neck region (classically an acoustic neuroma) but also occur in other locations, including the retroperitoneal space and the extremities, particularly flexural surfaces. Patients with cutaneous schwannomas are most likely to present to their primary care provider’s office reporting skin findings or localized pain, and providers should be aware of schwannomas on the differential for painful nodular growths.
Case Presentation
A 70-year-old man with type 2 diabetes mellitus presented to the primary care clinic for intermittent, sharp, localized left lower quadrant abdominal wall pain that was gradually progressive over the previous few months. The patient noticed the development of a small nodule 7 to 8 months prior to the visit, at which time the pain was less frequent and less severe. He reported no postprandial association of the pain, nausea, vomiting, diarrhea, constipation, or other gastrointestinal symptoms.
Ten months prior to the presentation, he was involved in a low-impact motor vehicle collision as a pedestrian in which he fell face-first onto the hood of an oncoming car. At that time, he did not note any abdominal trauma or pain. Evaluation at a local emergency department did not reveal any major injuries. In the interim, he had self-administered insulin in his abdominal region, as he had without incident for the previous 2 years. He reported that he was not injecting near the site of the nodule since it had formed. He could not recall whether the location was a previous insulin administration site.
On examination, the patient’s vital signs were normal as were the cardiac and respiratory examinations. An abdominal exam revealed normal bowel sounds and no overlying skin changes or discoloration. Palpation revealed a 1.5 x 1 cm rubbery-to-firm, well-circumscribed subcutaneous nodule along his mid-left abdomen, about 7 cm lateral to the umbilicus. The nodule was sensitive to both light touch and deep pressure. It was firmer than expected for an abdominal wall lipoma. There was no central puncta or pore to suggest an epidermal inclusion cyst. There was no surrounding erythema or induration to suggest an abscess.
The patient was referred for surgery and underwent excisional biopsy of the mass. Pathology revealed a well-circumscribed vascular/spindle-cell lesion consistent with a schwannoma. His postoperative course was uncomplicated. At 4-week follow-up the incision had healed completely and the patient was pain free.
Discussion
Soft-tissue nodules are common—about two-thirds of soft-tissue tumors are classified into 7 diagnostic categories: lipoma and lipoma variants (16%), fibrous histiocytoma (13%), nodular fasciitis (11%), hemangioma (8%), fibromatosis (7%), neurofibroma (5%), and schwannoma (5%).1 Peripheral nerve tumors (schwannomas, neurofibromas) can be associated with pain or paresthesias, and less commonly, neurologic deficits, such as motor weakness. Peripheral nerve tumors have several classifications, such as nonneoplastic vs neoplastic, benign vs malignant, and sheath vs nonsheath origins. Schwannomas are considered part of the neoplastic subset due to their growth; otherwise, they are benign with a sheath origin. In contrast to neurofibromas, benign schwannomas have a slower rate of progression, lower association with pain, and fewer neurologic symptoms.2
The neural sheath is made up of 3 types of cells: the fibroblast, the Schwann cell, and the perineural cell, which lacks a basement membrane. It is the Schwann cell that can give rise to the 3 main types of cutaneous nerve tumors: neuromas, neurofibromas, and schwannomas.3 A nerve that is both entering and exiting a mass is a classic presentation for a peripheral nerve sheath tumor. If the nerve is eccentric to the lesion, then it is consistent with a schwannoma (not a neurofibroma).4 Schwannomas are made exclusively of Schwann cells that arise from the nerve sheath, whereas neurofibromas are made up of all the different cell types that constitute a nerve. Bilateral vestibular schwannomas (acoustic neuromas) are virtually pathognomonic of neurofibromatosis 2 (NF-2), which can manifest as hearing loss, tinnitus, and equilibrium problems. In contrast, neurofibromatosis 1 (NF-1) is more common, characterized by multiple café au lait spots, freckling in the axillary and groin regions, increased risk of cancers overall, and development of pedunculated skin growths, brain, or organ-based neurofibromas.
Diagnosis
A workup generally includes a thorough history and examination as well as imaging. In cases of superficial subcutaneous lesions, an ultrasound is often the imaging modality of choice. However, magnetic resonance imaging (MRI) and computed tomography (CT) scans are frequently used for more deep-seated lesions. There can be significant differences between malignant and benign neural lesions on MRI and CT in terms of contrast-uptake and heterogeneity of tissue, but the visual features are not consistent. Best estimates for MRI suggest 61% sensitivity and 90% specificity for the diagnosis of high-grade malignant peripheral nerve sheath tumors based on imaging alone.5
Definitive diagnosis requires surgical excision. Fine-needle aspiration can be used to diagnose subcutaneous nodules, but there is a possibility that degenerative changes and nuclear atypia seen on a smaller sample may be confused with a more aggressive sarcoma. For example, long-standing schwannomas are often called ancient, meaning that they break down over time, and the atypia they display is a regressive phenomenon.6 Therefore, a small or limited tissue sampling may not be representative of the entire lesion.7 As such, patients will likely need referral for surgical removal to determine the exact nature of the growth.
Although schwannomas are uncommon overall, the highest incidence is in the fourth decade of life with a slight predominance in females. They are often incidentally found as a palpable mass but can be symptomatic with paresthesias, pain, or neurologic changes—particularly when identified in the retroperitoneum or along joints. Schwannomas are most commonly found in the retroperitoneum (32%), mediastinum (23%), head and neck (18%), and extremities (16%).8 The majority of cases (about 90%) are sporadic; whereas 2% are related to NF-2.9 The abdominal wall schwannoma is rare. Our review of English-language literature in PubMed and EMBASE found only 5 other case reports (Table 1).
On physical examination, superficial lesions are freely movable except for a single point of attachment, which is generally along the long axis of the nerve.
Pathology
On gross pathology examination, schwannomas have a well-circumscribed smooth external surface. On microscopy, schwannomas are truly encapsulated, uninodular, spindle-cell proliferations arranged in a streaming pattern within a background of thick, hyalinized blood vessels. Classic schwannomas typically exhibit a biphasic pattern of alternating areas of high and low cellularity and are named for Swedish neurologist Nils Antoni. The more cellular regions are referred to as Antoni A areas and consist of streaming fascicles of compact spindle cells that often palisade around acellular eosinophilic areas of fibrillary processes known as Verocay bodies.
In contrast, the lower cellularity regions (Antoni B areas) consist of multipolar, loosely textured cells with abundant cytoplasm, haphazardly arranged processes, and an overall myxoid appearance.11 Schwannomas are known to have widely variable proportions of Antoni A and Antoni B areas; in this case, the excised specimen was noted to have predominately Antoni A areas without well-defined Verocay bodies and only scattered foci showing some suggestion of the hypocellular Antoni B architecture (Figure 2).9,12
Immunohistochemical stains for S100 and SOX10 (used to identify cells derived from a neural crest lineage) were strongly positive, which is characteristic of schwannomas.13 Although there have only been rare reports of extracranial schwannomas undergoing malignant transformation, it is critical to rule out the possibility of a de novo malignant peripheral nerve sheath tumor (MPNST).13 In general, MPNSTs tend to be more cellular, have brisk mitotic activity, areas of necrosis, hyperchromatic nuclei, and conspicuous pleomorphism. Mitotic figures, which can be concerning for malignant potential if present in high number, were noted occasionally in our patient; however, occasional mitosis may be seen in classic schwannomas. Clinically, MPNSTs have a poor prognosis. Based on case reports, disease-specific survival at 10 years is 31.6% for localized disease and only 7.5% for metastatic disease.14 In this case, there was no evidence of any of the high-grade features of a malignant peripheral nerve sheath tumor, thus supporting the diagnosis of schwannoma (neurilemmoma).
Treatment
Schwannomas are exclusively treated by excision. Prognosis is good with low recurrence rates. It is unknown what the recurrence rates are for completely resected abdominal wall schwannomas since there are so few reports in the literature. For other well-known entities, such as vestibular schwannoma (acoustic neuromas), the recurrence rates are generally 2% to 3%.15 Transformation of schwannomas into MPNSTs are so unusual that they are only described in single case reports.
Conclusion
Soft-tissue masses are a common complaint. Most are benign and do not require excision unless it interferes with the quality of life of the patient or if the diagnosis is uncertain. It is important to be aware of schwannomas in the differential diagnosis of soft-tissue masses. Diagnosis may be achieved through the combination of imaging and biopsy, but the definitive diagnosis is made on complete excision of the mass.
Acknowledgments
Contributors: Michael Lewis, MD, Department of Pathology, VA Greater Los Angeles Healthcare System. Written permission also was obtained from the patient.
1. Kransdorf MJ. Benign soft-tissue tumors in a large referral population: distribution of specific diagnoses by age, sex, and location. AJR Am J Roentgenol. 1995;164(2):395-402.
2. Valeyrie-Allanore L, Ismaili N, Bastuji-Garin S, et al. Symptoms associated with malignancy of peripheral nerve sheath tumors: a retrospective study of 69 patients with neurofibromatosis 1. Br J Dermatol. 2005;153(1):79-82.
3. Patterson JW. Neural and neuroendocrine tumors. In: Weedon’s Skin Pathology. 4th ed. Elsevier; 2016:1042-1049.
4. Balzarotti R, Rondelli F, Barizzi J, Cartolari R. Symptomatic schwannoma of the abdominal wall: a case report and review of the literature. Oncol Lett. 2015;9(3):1095-1098.
5. Wasa J, Nishida Y, Tsukushi S, et al. MRI features in the differentiation of malignant peripheral nerve sheath tumors and neurofibromas. AJR Am J Roentgenol. 2010;194(6):1568-1574.
6. Dodd LG, Marom EM, Dash RC, Matthews MR, McLendon RE. Fine-needle aspiration cytology of “ancient” schwannoma. Diagn Cytopathol. 1999;20(5):307-311.
7. Powers CN, Berardo MD, Frable WJ. Fine-needle aspiration biopsy: pitfalls in the diagnosis of spindle-cell lesions. Diagn Cytopathol. 1994;10(3):232-240; discussion 241.
8. White W, Shiu MH, Rosenblum MK, Erlandson RA, Woodruff JM. Cellular schwannoma: a clinicopathologic study of 57 patients and 58 tumors. Cancer. 1990;66(6):1266-1275.
9. Goldblum JR, Weiss SW, Folpe AL. Benign tumors of peripheral nerves. In: Enzinger and Weiss’s Soft Tissue Tumors. 6th ed. Philadelphia, PA: Elsevier; 2014:813-828.
10. Naversen DN, Trask DM, Watson FH, Burket JM. Painful tumors of the skin: “LEND AN EGG.” J Am Acad Deramatol. 1993;28(2, pt 2):298-300.
11. Burger PC, Scheithauer BW. Diagnostic Pathology: Neuropathology. 1st ed. Salt Lake City, UT: Amirsys; 2012.
12. Louis DN, Ohgaki H, Wiestler OD, Cavenee WK, eds. World Health Organization Histological Classification of Tumours of the Central Nervous System. Vol. 1. Paris, France: International Agency for Research on Cancer; 2016.
13. Woodruff JM, Selig AM, Crowley K, Allen PW. Schwannoma (neurilemoma) with malignant transformation. A rare, distinctive peripheral nerve tumor. Am J Surg Pathol. 1994;18(9)82-895.
14. Zou C, Smith KD, Liu J, et al. Clinical, pathological, and molecular variables predictive of malignant peripheral nerve sheath tumor outcome. Ann Surg. 2009;249(6):1014-1022.
15. Ahmad RA, Sivalingam S, Topsakal V, Russo A, Taibah A, Sanna M. Rate of recurrent vestibular schwannoma after total removal via different surgical approaches. Ann Otol Rhinol Laryngol. 2012;121(3):156-161.
16. Bhatia RK, Banerjea A, Ram M, Lovett BE. Benign ancient schwannoma of the abdominal wall: an unwanted birthday present. BMC Surg. 2010;10:1-5.
17. Mishra A, Hamadto M, Azzabi M, Elfagieh M. Abdominal wall schwannoma: case report and review of the literature. Case Rep Radiol. 2013;2013:456863.
18. Liu Y, Chen X, Wang T, Wang Z. Imaging observations of a schwannoma of low malignant potential in the anterior abdominal wall: a case report. Oncol Lett. 2014;8(3):1159-1162.
19. Ginesu GC, Puledda M, Feo CF et al. Abdominal wall schwannoma. J Gastrointest Surg. 2016;20(10):1781-1783.
Trends in VA Telerehabilitation Patients and Encounters Over Time and by Rurality
Historically, the Veterans Health Administration (VHA) has excelled at improving veterans’ access to health care and enhancing foundational services, such as prosthetics and other veteran-centric services, and this continues to be the VHA’s top priority.1 Travel distance and time are often barriers to accessing health care for many veterans.2-11 For veterans with disabilities who must overcome additional physical, cognitive, and emotional obstacles to access vital rehabilitation services, these geographic obstacles are magnified. Further compounding the challenge is that rehabilitation therapies frequently require multiple encounters. Telerehabilitation is a promising solution for veterans in need of rehabilitation to regain optimal functioning. This alternative mode of service delivery can help veterans overcome geographic access barriers by delivering health care directly to veterans in their homes or nearby community-based outpatient clinics.12,13
A growing body of evidence supports telerehabilitation. In a 2017 systematic review and meta-analysis, Cottrell and colleagues reviewed and analyzed data from 13 studies that met their inclusion criteria; specifically, their meta-analytic sample comprised adults aged ≥ 18 years presenting with any diagnosed primary musculoskeletal condition; treatment interventions via a real-time telerehabilitation medium, trials that had a comparison group with the same condition; provided clinical outcomes data, and included published randomized and nonrandomized controlled trials.14 Based on their aggregated results, they concluded that real-time telerehabilitation was effective in improving physical function (standardized mean difference [SMD], 0.63; 95% CI, 0.92-2.33; I2, 93%), and reducing pain (SMD, 0.66; 95% CI, −0.27- .60; I2, 96%) in patients with any diagnosed primary musculoskeletal condition.14
Two other systematic reviews conducted by Pietrzak and colleagues and Agostini and colleagues also demonstrated the clinical effectiveness of telerehabilitation.15,16 Clinical effectiveness was defined as changes in health, functional status, and satisfaction with the telerehabilitation services delivered. The studies examined in the review included those that provided online self-management and education in addition to exercise via teleconferencing in real time.
Pietrzak and colleagues found that Internet-based osteoarthritis self-management interventions significantly improved 4 of 6 health status measures reviewed (ie, pain, fatigue, activity limitation, health distress, disability, and self‐reported global health).15 User acceptance and satisfaction were high (≥ 70% satisfied) in all studies meeting the inclusion criteria.
Agostini and colleagues found that telerehabilitation was more effective than other modes of delivering rehabilitation to regain motor function in cardiac (SMD, 0.24; 95% CI, 0.04-0.43) and total knee arthroplasty (Timed Up and Go test: SMD, −5.17; 95% CI, −9.79- −0.55) patients.16 Some evidence from VHA and non-VHA studies also support the use of telerehabilitation to reduce health care costs,17-19 improve treatment adherence,12,20 and enhance patient physical, cognitive and mobility function, as well as patient satisfaction and health-related quality of life.13,21-24
Since the first recorded use of telehealth in 1959, the application of technology to deliver health care, including rehabilitation services, has increased exponentially.14 In fiscal year (FY) 2017 alone, the VA provided > 2 million episodes of care for > 700,000 veterans using telehealth services.2
Although the process for accessing telerehabilitation may vary throughout the VA, typically a few common factors make a veteran eligible for this mode of rehabilitation care delivery: Veterans must meet criteria for a specific program (eg, amputation, occupational therapy, and physical therapy) and receive VA care from a VA medical facility or clinic that offers telehealth services. Care providers must believe that the veteran would benefit from telerehabilitation (eg, limited mobility and long-distance travel to the facility) and that they would be able to receive an appropriate consult. The veteran must meet the following requirements: (1) willingness to consent to a visit via telehealth; (2) access to required equipment/e-mail; and (3) a caregiver to assist if they are unable to complete a visit independently.
In this article, we provide an overview of the growth of telerehabilitation in the VHA. Data are presented for specific telerehabilitation programs over time and by rurality.
Methods
The VHA Support Service Center works with VHA program offices and field users to provide field-focused business, clinical, and special topic reports. An online portal provides access to these customizable reports organized as data cubes, which represent data dimensions (ie, clinic type) and measures (ie, number of unique patients). For this study, we used the Connected Care, Telehealth, Call Centers Clinical Video Telehealth/Store and Forward Telehealth data cube clinical stop codes to identify the numbers of telerehabilitation veteran users and encounters across time. The following telerehabilitation clinic-stop codes were selected: 197 (polytrauma/traumatic brain injury [TBI]–individuals), 201 (Physical Medicine and Rehabilitation [PM&R] Service), 205 (physical therapy), 206 (occupational therapy), 211 (PM&R amputation clinic), 418 (amputation clinic), 214 (kinesiotherapy), and 240 (PM&R assistive technology clinic). Data for total unique patients served and the total number of encounters were extracted at the national level and by rurality from FY 2012 to FY 2017, providing the past 5 years of VHA telerehabilitation data.
It is important to note that in FY 2015, the VHA changed its definition of rurality to a rural-urban commuting areas (RUCA)-based system (www.ruralhealth.va.gov/rural-definition.asp). Prior to FY 2015, the VHA used the US Census Bureau (CB) urbanized area definitions. According to CB, an urbanized area contains a central city and surrounding area that totals > 50,000 in population. It also includes places outside of urbanized areas with populations > 2,500. Rural areas are defined as all other areas. VHA added a third category, highly rural, which is defined as areas that had < 7 people per square mile. In the RUCA system, each census tract defined by the CB is given a score. The VHA definitions are as follows:
- Urban (U)—census tracts with RUCA scores of 1.0 or 1.1. These tracts are determined by the CB as being in an urban core and having the majority of their workers commute within that same core (1.0). If 30% to 49% commute to an even larger urban core, then the code is 1.1;
- Rural (R)—all tracts not receiving scores in the urban or highly rural tiers; and
- Highly rural (H)—tracts with a RUCA score of 10.0. These are the most remote occupied land areas. Less than 10% of workers travel to CB-defined urbanized areas or urban clusters.
In addition, VHA recently added an “I” category to complement “U,” “R,” and “H.” The “I” value is assigned to veterans living on the US insular islands (ie, territories): Guam, American Samoa, Northern Marianas, and US Virgin Islands. For the analysis by rurality in this study, we excluded veterans living in the insular islands and those of unknown rurality (< 1.0% of patients and encounters). Further, because the numbers of highly rural veterans were relatively small (< 2% of patients and encounters), the rural and highly rural categories were combined and compared with urban-dwelling veterans.
Results
Overall, the workload for telerehabilitation nearly quadrupled over the 5-year period (Table 1 and Figure 1). 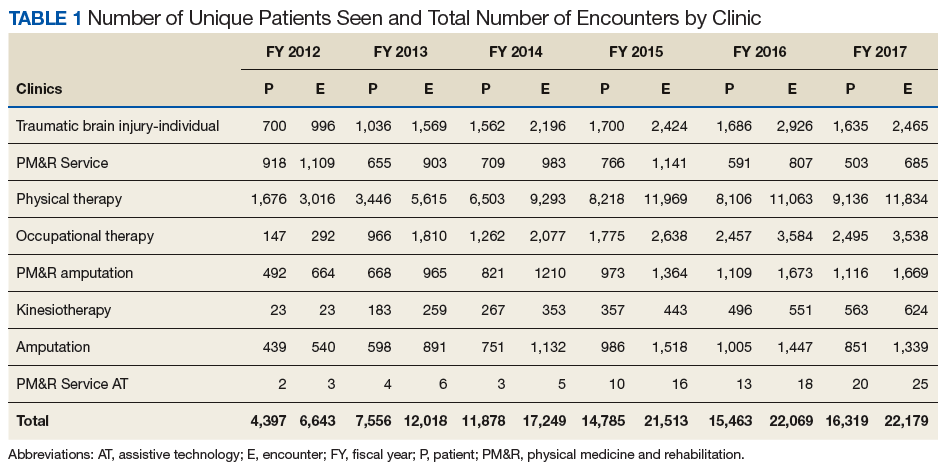
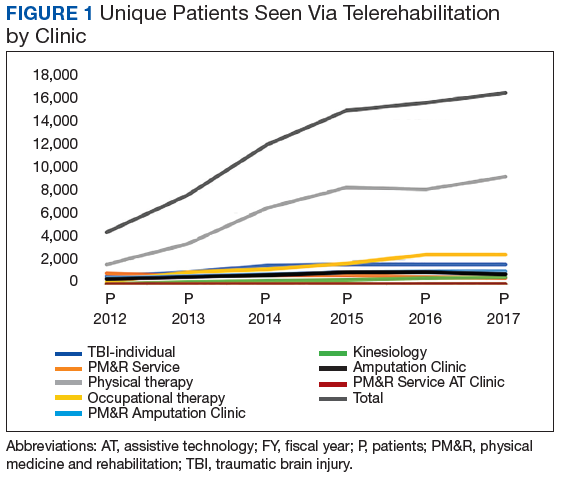
Interesting trends were seen by clinic type. Some clinics increased substantially, whereas others showed only moderate increases, and in 1 case (PM&R Service), a decrease. For example, there is significant growth in the number of patients and encounters involving physical therapy through telerehabilitation. This telerehabilitation clinic increased its workload from 1,676 patients with 3,016 encounters in FY 2012 to 9,136 patients with 11,834 encounters in FY 2017, accounting for 62.6% of total growth in patients and 56.8% of total growth in encounters.
Other clinics showing substantial growth over time included occupational therapy and polytrauma/TBI-individual secondary evaluation. Kinesiotherapy telerehabilitation was almost nonexistent in the VHA during FY 2012, with only 23 patients having 23 encounters. By FY 2017, there were 563 patients with 624 kinesiotherapy telerehabilitation encounters, equating to staggering increases in 5 years: 2,348% for patients and 2,613% for encounters. Similarly, the Physical Medicine and Rehabilitation Assistive Technology clinics had very low numbers in FY 2012 (patients, 2; encounters, 3) and increased over time; albeit, at a slow rate.
Trends by Rurality
Trends by rural location of patients and encounters must be interpreted with caution because of the changing rural definition between FY 2014 and FY 2015 (Tables 2 and 3; Figures 3 and 4). 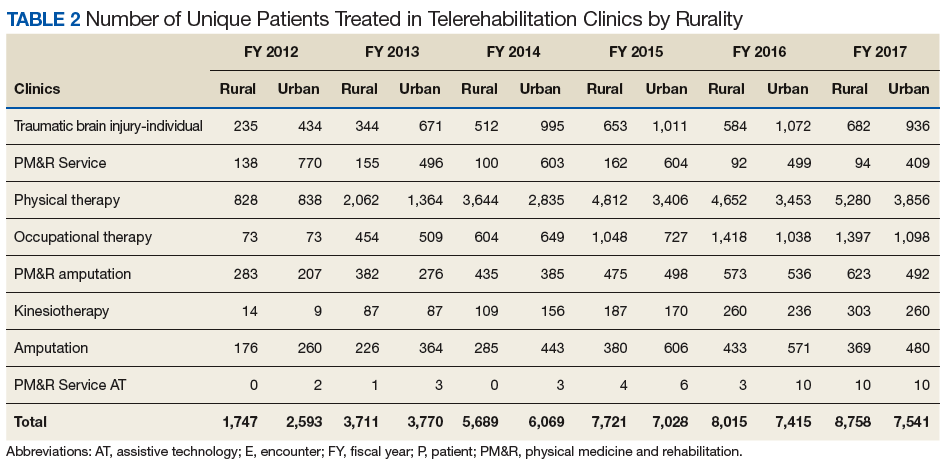
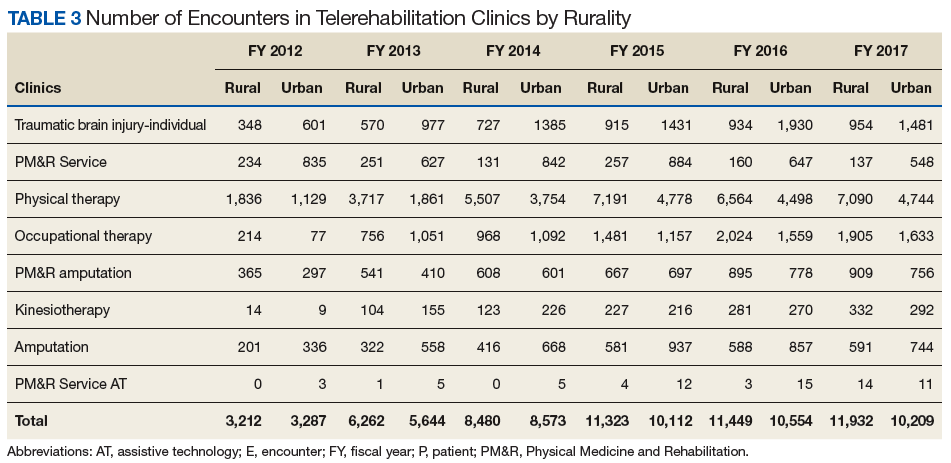
The increased total number of patients seen between FY 2012 and FY 2014 (old definition) was 225% for rural veterans vs 134% for urban veterans. Between FY 2015 and FY 2017 (new definition), the increase was lower for both groups (rural, 13.4%; urban, 7.3%), but rural veterans still increased at a higher rate than did urban dwellers. 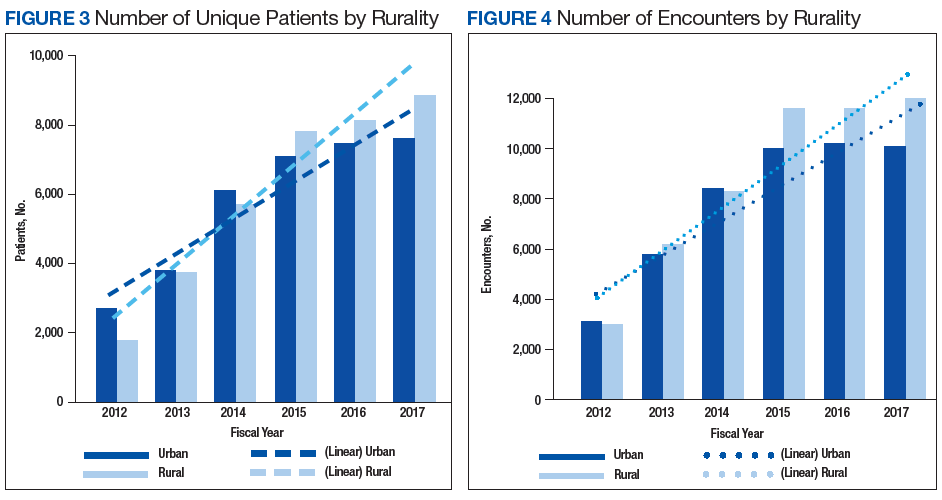
Discussion
Our primary aim was to provide data on the growth of telerehabilitation in the VHA over the past 5 years. Our secondary aim was to examine growth in the use of telerehabilitation by rurality. Specifically, we provided an overview of telerehabilitation growth in terms of unique patients and overall encounters in the VHA by rurality from FY 2012 to FY 2014 and FY 2015 to FY 2017 using the following programs: Polytrauma/TBI, PM&R Service, physical therapy, occupational therapy, PM&R amputation clinic, amputation clinic, kinesiotherapy, and PM&R assistive technology clinic. Our findings demonstrated a noteworthy increase in telerehabilitation encounters and unique patients over time for these programs. These findings were consistent with the overall trend of continued growth and expansion of telehealth within the VHA.
Our findings reveal an upward trend in the total number of rural encounters and rural unique patients despite the change in the VA’s definition of rurality in FY 2015. To our knowledge, urban and rural use of telerehabilitation has not been examined previously. Under both definitions of rurality, encounters and unique patients show an important increase over time, and by year-end 2017, more than half of all patients and encounters were attributed to rural patients (53.7% and 53.9%, respectively). Indeed, the upward trend may have been more pronounced if the rural definition had not changed in FY 2015. Our early VHA stroke patients study on the difference between rural-urban patients and taxonomies showed that the RUCA definition was more likely to reduce the number of rural patients by 8.5% than the early definition used by the VHA.26
It is notable that although the use of tele-delivery of rehabilitation has continually increased, the rate of this increase was steeper from FY 2012 to FY 2014 than FY 2015 to FY 2017. For the programs under consideration in this study, the total number of rural patients/encounters increased throughout the observed periods. However, urban patients and encounters increased through FY 2016 and experienced a slight decrease in FY 2017.
The appearance of a slower rate of increase may be due to a rapid initial rate of increase through early adopters and “crossing the diffusion chasm,” a well-documented process of slower diffusion between the time of invention to penetration that often characterizes the spread of successful telehealth innovations
With an emphasis on increasing access to rehabilitation services, the VHA can expect to see a continuing increase in both the number and the percentage of telerehabilitation rural patients and encounters. The VHA has several telerehabilitation initiatives underway through the VHA’s Physical Medicine and Rehabilitation Telerehabilitation Enterprise Wide Initiative (TREWI) and Rural Veterans Telerehabilitation Initiative. These projects demonstrate the feasibility of this delivery approach and facilitate integration of this modality in clinical workflows. However, to sustain these efforts, facilities will need more infrastructure and personnel resources dedicated to the delivery of services.
In an ongoing evaluation of the TREWI, several factors seem to influence the uptake of the VHA Office of Rural Health TREWI programs. These factors are the presence or absence of a local site champion; the quality of hospital leadership support; the quality of past relationships between telerehabilitation sending sites and receiving sites; barriers to getting a telehealth service agreement in place; the availability of space; administrative know-how on setting up clinics appropriately; time involved to bring on staff; contracting issues; equipment availability and installation; cultural issues in embracing technologic innovation; training burden; hassle factors; and limited funds. Although early adopters may be able to negotiate and push through many of the barriers associated with the diffusion of telerehabilitation, the numerous barriers may slow its larger systemwide diffusion.
Telerehabilitation is a promising mode to deliver care to rural veterans who otherwise may not have access to this type of specialty care. Therefore, the identification of elements that foster telerehabilitation growth in future investigations can assist policy makers and key stakeholders in optimally leveraging program resources for maximal productivity. Future studies investigating the drivers of increases in telerehabilitation growth by rurality are warranted. Furthermore, more research is needed to examine telerehabilitation growth quality of care outcomes (eg, patient and provider satisfaction) to ensure that care is not only timely and accessible, but of high quality.
Conclusion
Disparities between rural and urban veterans compel a mode of expanding delivery of care. The VHA has embraced the use of telehealth modalities to extend its reach of rehabilitation services to veterans with disability and rehabilitation needs. Growth in telerehabilitation rural patient encounters increases access to rehabilitative care, reduces patient and caregiver travel burden, and helps ensure treatment adherence. Telerehabilitation utilization (unique patients and total encounters) is growing more rapidly for rural veterans than for their urban counterparts. Overall, telerehabilitation is filling a gap for rural veterans, as well as veterans in general with challenges in accessibility to health care. In order to make full use of the telerehabilitation services across its health care system, VA health care facilities may need to expand their effort in telerehabilitation dissemination and education among providers and veterans, particularly among providers who are less familiar with telerehabilitation services and among veterans who live in rural or highly rural areas and need special rehabilitation care.
1. Shane L. What’s in the VA secretary’s 10-point plan to reform his department? https://rebootcamp.militarytimes.com/news/pentagon-congress/2017/02/28/what-s-in-the-va-secretary-s-10-point-plan-to-reform-his-department. Published February 28, 2017. Accessed November 21, 2018.
2. Burgess JF, DeFiore DA. The effect of distance to a VA facility on the choice and level of utilization of VA outpatient services. Soc Science Med. 1994;39(1):95-104.
3. LaVela SL, Smith B, Weaver FM, Miskevics SA. Geographical proximity and health care utilization in veterans with SCI&D in the USA. Soc Science Med. 2004;59:2387-2399.
4. Piette JD, Moos RH. The influence of distance on ambulatory care use, death, and readmission following a myocardial infarction. Health Serv Res. 1996;31(5):573-591.
5. Schmitt SK, Phibbs CS, Piette JD. The influence of distance on utilization of outpatient mental health aftercare following inpatient substance abuse treatment. Addictive Behav. 2003;28(6):1183-1192.
6. Fortney JC, Booth BM, Blow FC, Bunn JY. The effects of travel barriers and age on the utilization of alcoholism treatment aftercare. Am J Drug Alcohol Abuse. 1995;21(3):391-406.
7. McCarthy JF, Blow FC, Valenstein M, et al. Veterans Affairs Health System and mental health treatment retention among patients with serious mental illness: evaluating accessibility and availability barriers. Health Serv Res. 2007;42(3):1042-1060.
8. Mooney C, Zwanziger J, Phibbs CS, Schmitt S. Is travel distance a barrier to veterans’ use of VA hospitals for medical surgical care? Soc Sci Med. 2000;50(12):1743-1755.
9. Friedman SA, Frayne SM, Berg E, et al. Travel time and attrition from VHA care among women veterans: how far is too far? Med Care. 2015;53(4)(suppl 1):S15-S22.
10. Buzza C, Ono SS, Turvey C, et al. Distance is relative: unpacking a principal barrier in rural healthcare. J Gen Intern Med. 2011;26(suppl 2):648-654.
11. Goins RT, Williams KA, Carter MW, Spencer SM, Solovieva T. Perceived barriers to health care access among rural older adults: a qualitative study. J Rural Health. 2005;21(3):206-213.
12. Kairy D, Lehoux P, Vincent C, Visintin M. A systematic review of clinical outcomes, clinical process, healthcare utilization and costs associated with telerehabilitation. Disabil Rehabil. 2009;31(6):427-447.
13. McCue M, Fairman A, Pramuka M. Enhancing quality of life through telerehabilitation. Phys Med Rehabil Clin N Am. 2010;21(1):195-205.
14. Cottrell MA, Galea OA, O’Leary SP, Hill AJ, Russell TG. Real-time telerehabilitation for the treatment of musculoskeletal conditions is effective and comparable to standard practice: a systematic review and meta-analysis. Clin Rehabil. 2017;31(5):625-638.
15. Pietrzak E, Cotea C, Pullman S, Nasveld P. Self-management and rehabilitation in osteoarthritis: is there a place for internet-based interventions? Telemed J E Health. 2013;19(10):800-805.
16. Agostini M, Moja L, Banzi R, et al. Telerehabilitation and recovery of motor function: a systematic review and meta-analysis. J Telemed Telecare. 2015;21(4):202-213.
17. Kortke H, Stromeyer H, Zittermann A, et al. New East-Westfalian Postoperative Therapy Concept: A telemedicine guide for the study of ambulatory rehabilitation of patients after cardiac surgery. Telemed J E-Health. 2006;12(4):475-483.
18. Tousignant M, Boissy P, Corriveau H, Moffet H. In home telerehabilitation for older adults after discharge from an acute hospital or rehabilitation unit: A proof-of- concept study and costs estimation. Disabil Rehabil Assist Technol. 2006;1(4):209-216.
19. Sanford JA, Griffiths PC, Richardson P, et al. The effects of in-home rehabilitation on task self-efficacy in mobility-impaired adults: a randomized clinical trial. J Am Geriatr Soc. 2006;54(11):1641-1648.
20. Nakamura K, Takano T, Akao C. The effectiveness of videophones in home healthcare for the elderly. Med Care. 1999;37(2):117-125.
21. Levy CE, Silverman E, Jia H, Geiss M, Omura D. Effects of physical therapy delivery via home video telerehabilitation on functional and health-related quality of life outcomes. J Rehabil Res Dev. 2015;52(3):361-370.
22. Guilfoyle C, Wootton R, Hassall S, et al. User satisfaction with allied health services delivered to residential facilities via videoconferencing. J Telemed Telecare. 2003;9(1):S52-S54.23. Mair F, Whitten P. Systematic review of studies of patient satisfaction with telemedicine. BMJ. 2000;320(7248):1517-1520.
24. Williams T L, May C R, Esmail A. Limitations of patient satisfaction studies in telehealthcare: a systematic review of the literature. Telemed J E-Health. 2001;7(4):293-316.
25. US Department of Veterans Affairs, Office of Telehealth Services. http://vaww.telehealth.va.gov/quality/data/index.asp. Accessed June 1, 2018. [Nonpublic document; source not verified.]
26. Jia H, Cowper D, Tang Y, et al. Post-acute stroke rehabilitation utilization: Are there difference between rural-urban patients and taxonomies? J Rural Health. 2012;28(3):242-247.
27. Cho S, Mathiassen L, Gallivan M. Crossing the chasm: from adoption to diffusion of a telehealth innovation. In: León G, Bernardos AM, Casar JR, Kautz K, De Gross JI, eds. Open IT-Based Innovation: Moving Towards Cooperative IT Transfer and Knowledge Diffusion. Boston, MA: Springer; 2008.
28. Broderick A, Lindeman D. Scaling telehealth programs: lessons from early adopters. https://www.commonwealthfund.org/publications/case-study/2013/jan/scaling-telehealth-programs-lessons-early-adopters. Published January 2013. Accessed June 1, 2018.
Historically, the Veterans Health Administration (VHA) has excelled at improving veterans’ access to health care and enhancing foundational services, such as prosthetics and other veteran-centric services, and this continues to be the VHA’s top priority.1 Travel distance and time are often barriers to accessing health care for many veterans.2-11 For veterans with disabilities who must overcome additional physical, cognitive, and emotional obstacles to access vital rehabilitation services, these geographic obstacles are magnified. Further compounding the challenge is that rehabilitation therapies frequently require multiple encounters. Telerehabilitation is a promising solution for veterans in need of rehabilitation to regain optimal functioning. This alternative mode of service delivery can help veterans overcome geographic access barriers by delivering health care directly to veterans in their homes or nearby community-based outpatient clinics.12,13
A growing body of evidence supports telerehabilitation. In a 2017 systematic review and meta-analysis, Cottrell and colleagues reviewed and analyzed data from 13 studies that met their inclusion criteria; specifically, their meta-analytic sample comprised adults aged ≥ 18 years presenting with any diagnosed primary musculoskeletal condition; treatment interventions via a real-time telerehabilitation medium, trials that had a comparison group with the same condition; provided clinical outcomes data, and included published randomized and nonrandomized controlled trials.14 Based on their aggregated results, they concluded that real-time telerehabilitation was effective in improving physical function (standardized mean difference [SMD], 0.63; 95% CI, 0.92-2.33; I2, 93%), and reducing pain (SMD, 0.66; 95% CI, −0.27- .60; I2, 96%) in patients with any diagnosed primary musculoskeletal condition.14
Two other systematic reviews conducted by Pietrzak and colleagues and Agostini and colleagues also demonstrated the clinical effectiveness of telerehabilitation.15,16 Clinical effectiveness was defined as changes in health, functional status, and satisfaction with the telerehabilitation services delivered. The studies examined in the review included those that provided online self-management and education in addition to exercise via teleconferencing in real time.
Pietrzak and colleagues found that Internet-based osteoarthritis self-management interventions significantly improved 4 of 6 health status measures reviewed (ie, pain, fatigue, activity limitation, health distress, disability, and self‐reported global health).15 User acceptance and satisfaction were high (≥ 70% satisfied) in all studies meeting the inclusion criteria.
Agostini and colleagues found that telerehabilitation was more effective than other modes of delivering rehabilitation to regain motor function in cardiac (SMD, 0.24; 95% CI, 0.04-0.43) and total knee arthroplasty (Timed Up and Go test: SMD, −5.17; 95% CI, −9.79- −0.55) patients.16 Some evidence from VHA and non-VHA studies also support the use of telerehabilitation to reduce health care costs,17-19 improve treatment adherence,12,20 and enhance patient physical, cognitive and mobility function, as well as patient satisfaction and health-related quality of life.13,21-24
Since the first recorded use of telehealth in 1959, the application of technology to deliver health care, including rehabilitation services, has increased exponentially.14 In fiscal year (FY) 2017 alone, the VA provided > 2 million episodes of care for > 700,000 veterans using telehealth services.2
Although the process for accessing telerehabilitation may vary throughout the VA, typically a few common factors make a veteran eligible for this mode of rehabilitation care delivery: Veterans must meet criteria for a specific program (eg, amputation, occupational therapy, and physical therapy) and receive VA care from a VA medical facility or clinic that offers telehealth services. Care providers must believe that the veteran would benefit from telerehabilitation (eg, limited mobility and long-distance travel to the facility) and that they would be able to receive an appropriate consult. The veteran must meet the following requirements: (1) willingness to consent to a visit via telehealth; (2) access to required equipment/e-mail; and (3) a caregiver to assist if they are unable to complete a visit independently.
In this article, we provide an overview of the growth of telerehabilitation in the VHA. Data are presented for specific telerehabilitation programs over time and by rurality.
Methods
The VHA Support Service Center works with VHA program offices and field users to provide field-focused business, clinical, and special topic reports. An online portal provides access to these customizable reports organized as data cubes, which represent data dimensions (ie, clinic type) and measures (ie, number of unique patients). For this study, we used the Connected Care, Telehealth, Call Centers Clinical Video Telehealth/Store and Forward Telehealth data cube clinical stop codes to identify the numbers of telerehabilitation veteran users and encounters across time. The following telerehabilitation clinic-stop codes were selected: 197 (polytrauma/traumatic brain injury [TBI]–individuals), 201 (Physical Medicine and Rehabilitation [PM&R] Service), 205 (physical therapy), 206 (occupational therapy), 211 (PM&R amputation clinic), 418 (amputation clinic), 214 (kinesiotherapy), and 240 (PM&R assistive technology clinic). Data for total unique patients served and the total number of encounters were extracted at the national level and by rurality from FY 2012 to FY 2017, providing the past 5 years of VHA telerehabilitation data.
It is important to note that in FY 2015, the VHA changed its definition of rurality to a rural-urban commuting areas (RUCA)-based system (www.ruralhealth.va.gov/rural-definition.asp). Prior to FY 2015, the VHA used the US Census Bureau (CB) urbanized area definitions. According to CB, an urbanized area contains a central city and surrounding area that totals > 50,000 in population. It also includes places outside of urbanized areas with populations > 2,500. Rural areas are defined as all other areas. VHA added a third category, highly rural, which is defined as areas that had < 7 people per square mile. In the RUCA system, each census tract defined by the CB is given a score. The VHA definitions are as follows:
- Urban (U)—census tracts with RUCA scores of 1.0 or 1.1. These tracts are determined by the CB as being in an urban core and having the majority of their workers commute within that same core (1.0). If 30% to 49% commute to an even larger urban core, then the code is 1.1;
- Rural (R)—all tracts not receiving scores in the urban or highly rural tiers; and
- Highly rural (H)—tracts with a RUCA score of 10.0. These are the most remote occupied land areas. Less than 10% of workers travel to CB-defined urbanized areas or urban clusters.
In addition, VHA recently added an “I” category to complement “U,” “R,” and “H.” The “I” value is assigned to veterans living on the US insular islands (ie, territories): Guam, American Samoa, Northern Marianas, and US Virgin Islands. For the analysis by rurality in this study, we excluded veterans living in the insular islands and those of unknown rurality (< 1.0% of patients and encounters). Further, because the numbers of highly rural veterans were relatively small (< 2% of patients and encounters), the rural and highly rural categories were combined and compared with urban-dwelling veterans.
Results
Overall, the workload for telerehabilitation nearly quadrupled over the 5-year period (Table 1 and Figure 1).
Interesting trends were seen by clinic type. Some clinics increased substantially, whereas others showed only moderate increases, and in 1 case (PM&R Service), a decrease. For example, there is significant growth in the number of patients and encounters involving physical therapy through telerehabilitation. This telerehabilitation clinic increased its workload from 1,676 patients with 3,016 encounters in FY 2012 to 9,136 patients with 11,834 encounters in FY 2017, accounting for 62.6% of total growth in patients and 56.8% of total growth in encounters.
Other clinics showing substantial growth over time included occupational therapy and polytrauma/TBI-individual secondary evaluation. Kinesiotherapy telerehabilitation was almost nonexistent in the VHA during FY 2012, with only 23 patients having 23 encounters. By FY 2017, there were 563 patients with 624 kinesiotherapy telerehabilitation encounters, equating to staggering increases in 5 years: 2,348% for patients and 2,613% for encounters. Similarly, the Physical Medicine and Rehabilitation Assistive Technology clinics had very low numbers in FY 2012 (patients, 2; encounters, 3) and increased over time; albeit, at a slow rate.
Trends by Rurality
Trends by rural location of patients and encounters must be interpreted with caution because of the changing rural definition between FY 2014 and FY 2015 (Tables 2 and 3; Figures 3 and 4).
The increased total number of patients seen between FY 2012 and FY 2014 (old definition) was 225% for rural veterans vs 134% for urban veterans. Between FY 2015 and FY 2017 (new definition), the increase was lower for both groups (rural, 13.4%; urban, 7.3%), but rural veterans still increased at a higher rate than did urban dwellers.
Discussion
Our primary aim was to provide data on the growth of telerehabilitation in the VHA over the past 5 years. Our secondary aim was to examine growth in the use of telerehabilitation by rurality. Specifically, we provided an overview of telerehabilitation growth in terms of unique patients and overall encounters in the VHA by rurality from FY 2012 to FY 2014 and FY 2015 to FY 2017 using the following programs: Polytrauma/TBI, PM&R Service, physical therapy, occupational therapy, PM&R amputation clinic, amputation clinic, kinesiotherapy, and PM&R assistive technology clinic. Our findings demonstrated a noteworthy increase in telerehabilitation encounters and unique patients over time for these programs. These findings were consistent with the overall trend of continued growth and expansion of telehealth within the VHA.
Our findings reveal an upward trend in the total number of rural encounters and rural unique patients despite the change in the VA’s definition of rurality in FY 2015. To our knowledge, urban and rural use of telerehabilitation has not been examined previously. Under both definitions of rurality, encounters and unique patients show an important increase over time, and by year-end 2017, more than half of all patients and encounters were attributed to rural patients (53.7% and 53.9%, respectively). Indeed, the upward trend may have been more pronounced if the rural definition had not changed in FY 2015. Our early VHA stroke patients study on the difference between rural-urban patients and taxonomies showed that the RUCA definition was more likely to reduce the number of rural patients by 8.5% than the early definition used by the VHA.26
It is notable that although the use of tele-delivery of rehabilitation has continually increased, the rate of this increase was steeper from FY 2012 to FY 2014 than FY 2015 to FY 2017. For the programs under consideration in this study, the total number of rural patients/encounters increased throughout the observed periods. However, urban patients and encounters increased through FY 2016 and experienced a slight decrease in FY 2017.
The appearance of a slower rate of increase may be due to a rapid initial rate of increase through early adopters and “crossing the diffusion chasm,” a well-documented process of slower diffusion between the time of invention to penetration that often characterizes the spread of successful telehealth innovations
With an emphasis on increasing access to rehabilitation services, the VHA can expect to see a continuing increase in both the number and the percentage of telerehabilitation rural patients and encounters. The VHA has several telerehabilitation initiatives underway through the VHA’s Physical Medicine and Rehabilitation Telerehabilitation Enterprise Wide Initiative (TREWI) and Rural Veterans Telerehabilitation Initiative. These projects demonstrate the feasibility of this delivery approach and facilitate integration of this modality in clinical workflows. However, to sustain these efforts, facilities will need more infrastructure and personnel resources dedicated to the delivery of services.
In an ongoing evaluation of the TREWI, several factors seem to influence the uptake of the VHA Office of Rural Health TREWI programs. These factors are the presence or absence of a local site champion; the quality of hospital leadership support; the quality of past relationships between telerehabilitation sending sites and receiving sites; barriers to getting a telehealth service agreement in place; the availability of space; administrative know-how on setting up clinics appropriately; time involved to bring on staff; contracting issues; equipment availability and installation; cultural issues in embracing technologic innovation; training burden; hassle factors; and limited funds. Although early adopters may be able to negotiate and push through many of the barriers associated with the diffusion of telerehabilitation, the numerous barriers may slow its larger systemwide diffusion.
Telerehabilitation is a promising mode to deliver care to rural veterans who otherwise may not have access to this type of specialty care. Therefore, the identification of elements that foster telerehabilitation growth in future investigations can assist policy makers and key stakeholders in optimally leveraging program resources for maximal productivity. Future studies investigating the drivers of increases in telerehabilitation growth by rurality are warranted. Furthermore, more research is needed to examine telerehabilitation growth quality of care outcomes (eg, patient and provider satisfaction) to ensure that care is not only timely and accessible, but of high quality.
Conclusion
Disparities between rural and urban veterans compel a mode of expanding delivery of care. The VHA has embraced the use of telehealth modalities to extend its reach of rehabilitation services to veterans with disability and rehabilitation needs. Growth in telerehabilitation rural patient encounters increases access to rehabilitative care, reduces patient and caregiver travel burden, and helps ensure treatment adherence. Telerehabilitation utilization (unique patients and total encounters) is growing more rapidly for rural veterans than for their urban counterparts. Overall, telerehabilitation is filling a gap for rural veterans, as well as veterans in general with challenges in accessibility to health care. In order to make full use of the telerehabilitation services across its health care system, VA health care facilities may need to expand their effort in telerehabilitation dissemination and education among providers and veterans, particularly among providers who are less familiar with telerehabilitation services and among veterans who live in rural or highly rural areas and need special rehabilitation care.
1. Shane L. What’s in the VA secretary’s 10-point plan to reform his department? https://rebootcamp.militarytimes.com/news/pentagon-congress/2017/02/28/what-s-in-the-va-secretary-s-10-point-plan-to-reform-his-department. Published February 28, 2017. Accessed November 21, 2018.
2. Burgess JF, DeFiore DA. The effect of distance to a VA facility on the choice and level of utilization of VA outpatient services. Soc Science Med. 1994;39(1):95-104.
3. LaVela SL, Smith B, Weaver FM, Miskevics SA. Geographical proximity and health care utilization in veterans with SCI&D in the USA. Soc Science Med. 2004;59:2387-2399.
4. Piette JD, Moos RH. The influence of distance on ambulatory care use, death, and readmission following a myocardial infarction. Health Serv Res. 1996;31(5):573-591.
5. Schmitt SK, Phibbs CS, Piette JD. The influence of distance on utilization of outpatient mental health aftercare following inpatient substance abuse treatment. Addictive Behav. 2003;28(6):1183-1192.
6. Fortney JC, Booth BM, Blow FC, Bunn JY. The effects of travel barriers and age on the utilization of alcoholism treatment aftercare. Am J Drug Alcohol Abuse. 1995;21(3):391-406.
7. McCarthy JF, Blow FC, Valenstein M, et al. Veterans Affairs Health System and mental health treatment retention among patients with serious mental illness: evaluating accessibility and availability barriers. Health Serv Res. 2007;42(3):1042-1060.
8. Mooney C, Zwanziger J, Phibbs CS, Schmitt S. Is travel distance a barrier to veterans’ use of VA hospitals for medical surgical care? Soc Sci Med. 2000;50(12):1743-1755.
9. Friedman SA, Frayne SM, Berg E, et al. Travel time and attrition from VHA care among women veterans: how far is too far? Med Care. 2015;53(4)(suppl 1):S15-S22.
10. Buzza C, Ono SS, Turvey C, et al. Distance is relative: unpacking a principal barrier in rural healthcare. J Gen Intern Med. 2011;26(suppl 2):648-654.
11. Goins RT, Williams KA, Carter MW, Spencer SM, Solovieva T. Perceived barriers to health care access among rural older adults: a qualitative study. J Rural Health. 2005;21(3):206-213.
12. Kairy D, Lehoux P, Vincent C, Visintin M. A systematic review of clinical outcomes, clinical process, healthcare utilization and costs associated with telerehabilitation. Disabil Rehabil. 2009;31(6):427-447.
13. McCue M, Fairman A, Pramuka M. Enhancing quality of life through telerehabilitation. Phys Med Rehabil Clin N Am. 2010;21(1):195-205.
14. Cottrell MA, Galea OA, O’Leary SP, Hill AJ, Russell TG. Real-time telerehabilitation for the treatment of musculoskeletal conditions is effective and comparable to standard practice: a systematic review and meta-analysis. Clin Rehabil. 2017;31(5):625-638.
15. Pietrzak E, Cotea C, Pullman S, Nasveld P. Self-management and rehabilitation in osteoarthritis: is there a place for internet-based interventions? Telemed J E Health. 2013;19(10):800-805.
16. Agostini M, Moja L, Banzi R, et al. Telerehabilitation and recovery of motor function: a systematic review and meta-analysis. J Telemed Telecare. 2015;21(4):202-213.
17. Kortke H, Stromeyer H, Zittermann A, et al. New East-Westfalian Postoperative Therapy Concept: A telemedicine guide for the study of ambulatory rehabilitation of patients after cardiac surgery. Telemed J E-Health. 2006;12(4):475-483.
18. Tousignant M, Boissy P, Corriveau H, Moffet H. In home telerehabilitation for older adults after discharge from an acute hospital or rehabilitation unit: A proof-of- concept study and costs estimation. Disabil Rehabil Assist Technol. 2006;1(4):209-216.
19. Sanford JA, Griffiths PC, Richardson P, et al. The effects of in-home rehabilitation on task self-efficacy in mobility-impaired adults: a randomized clinical trial. J Am Geriatr Soc. 2006;54(11):1641-1648.
20. Nakamura K, Takano T, Akao C. The effectiveness of videophones in home healthcare for the elderly. Med Care. 1999;37(2):117-125.
21. Levy CE, Silverman E, Jia H, Geiss M, Omura D. Effects of physical therapy delivery via home video telerehabilitation on functional and health-related quality of life outcomes. J Rehabil Res Dev. 2015;52(3):361-370.
22. Guilfoyle C, Wootton R, Hassall S, et al. User satisfaction with allied health services delivered to residential facilities via videoconferencing. J Telemed Telecare. 2003;9(1):S52-S54.23. Mair F, Whitten P. Systematic review of studies of patient satisfaction with telemedicine. BMJ. 2000;320(7248):1517-1520.
24. Williams T L, May C R, Esmail A. Limitations of patient satisfaction studies in telehealthcare: a systematic review of the literature. Telemed J E-Health. 2001;7(4):293-316.
25. US Department of Veterans Affairs, Office of Telehealth Services. http://vaww.telehealth.va.gov/quality/data/index.asp. Accessed June 1, 2018. [Nonpublic document; source not verified.]
26. Jia H, Cowper D, Tang Y, et al. Post-acute stroke rehabilitation utilization: Are there difference between rural-urban patients and taxonomies? J Rural Health. 2012;28(3):242-247.
27. Cho S, Mathiassen L, Gallivan M. Crossing the chasm: from adoption to diffusion of a telehealth innovation. In: León G, Bernardos AM, Casar JR, Kautz K, De Gross JI, eds. Open IT-Based Innovation: Moving Towards Cooperative IT Transfer and Knowledge Diffusion. Boston, MA: Springer; 2008.
28. Broderick A, Lindeman D. Scaling telehealth programs: lessons from early adopters. https://www.commonwealthfund.org/publications/case-study/2013/jan/scaling-telehealth-programs-lessons-early-adopters. Published January 2013. Accessed June 1, 2018.
Evaluation of the American Academy of Orthopaedic Surgeons Appropriate Use Criteria for the Nonarthroplasty Treatment of Knee Osteoarthritis in Veterans
Knee osteoarthritis (OA) affects almost 9.3 million adults in the US and accounts for $27 billion in annual health care expenses.1,2 Due to the increasing cost of health care and an aging population, there has been renewed interest in establishing criteria for nonarthroplasty treatment of knee OA.
In 2013, using the RAND/UCLA Appropriateness method, the American Academy of Orthopaedic Surgeons (AAOS) developed an appropriate use criteria (AUC) for nonarthroplasty management of primary OA of the knee, based on orthopaedic literature and expert opinion.3 Interventions such as activity modification, weight loss, prescribed physical therapy, nonsteroidal anti-inflammatory drugs, tramadol, prescribed oral or transcutaneous opioids, acetaminophen, intra-articular corticosteroids, hinged or unloading knee braces, arthroscopic partial menisectomy or loose body removal, and realignment osteotomy were assessed. An algorithm was developed for 576 patients scenarios that incorporated patient-specific, prognostic/predictor variables to assign designations of “appropriate,” “may be appropriate,” or “rarely appropriate,” to treatment interventions.4,5 An online version of the algorithm (orthoguidelines.org) is available for physicians and surgeons to judge appropriateness of nonarthroplasty treatments; however, it is not intended to mandate candidacy for treatment or intervention.
Clinical evaluation of the AAOS AUC is necessary to determine how treatment recommendations correlate with current practice. A recent examination of the AAOS Appropriateness System for Surgical Management of Knee OA found that prognostic/predictor variables, such as patient age, OA severity, and pattern of knee OA involvement were more heavily weighted when determining arthroplasty appropriateness than was pain severity or functional loss.6 Furthermore, non-AAOS AUC prognostic/predictor variables, such as race and gender, have been linked to disparities in utilization of knee OA interventions.7-9 Such disparities can be costly not just from a patient perceptive, but also employer and societal perspectives.10
The Department of Veterans Affairs (VA) health care system represents a model of equal-access-to care system in the US that is ideal for examination of issues about health care utilization and any disparities within the AAOS AUC model and has previously been used to assess utilization of total knee arthroplasty.9 The aim of this study was to characterize utilization of the AAOS AUC for nonarthroplasty treatment of knee OA in a VA patient population. We asked the following questions: (1) What variables are predictive of receiving a greater number of AAOS AUC evaluated nonarthroplasty treatments? (2) What variables are predictive of receiving “rarely appropriate” AAOS AUC evaluated nonarthroplasty treatment? (3) What factors are predictive of duration of nonarthroplasty care until total knee arthroplasty (TKA)?
Methods
The institutional review board at the Louis Stokes Cleveland VA Medical Center in Ohio approved a retrospective chart review of nonarthroplasty treatments utilized by patients presenting to its orthopaedic section who subsequently underwent knee arthroplasty between 2013 and 2016. Eligibility criteria included patients aged ≥ 30 years with a diagnosis of unilateral or bilateral primary knee OA. Patients with posttraumatic OA, inflammatory arthritis, and a history of infectious arthritis or Charcot arthropathy of the knee were excluded. Patients with a body mass index (BMI) > 40 or a hemoglobin A1c > 8.0 at presentation were excluded as nonarthroplasty care was the recommended course of treatment above these thresholds.
Data collected included race, gender, duration of nonarthroplasty treatment, BMI, and Kellgren-Lawrence classification of knee OA at time of presentation for symptomatic knee OA.11 All AAOS AUC-evaluated nonarthroplasty treatments utilized prior to arthroplasty intervention also were recorded (Table 1). 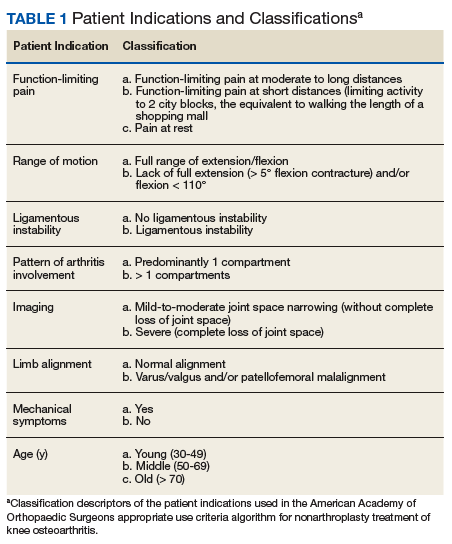
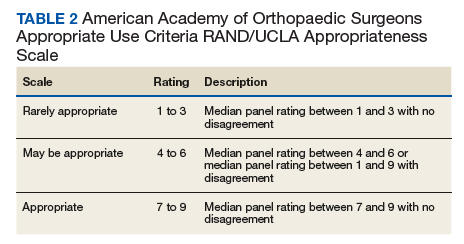
Statistical Analysis
Statistical analysis was completed with GraphPad Software Prism 7.0a (La Jolla, CA) and Mathworks MatLab R2016b software (Natick, MA). Univariate analysis with Student t tests with Welch corrections in the setting of unequal variance, Mann-Whitney nonparametric tests, and Fisher exact test were generated in the appropriate setting. Multivariable analyses also were conducted. For continuous outcomes, stepwise multiple linear regression was used to generate predictive models; for binary outcomes, binomial logistic regression was used.
Factors analyzed in regression modeling for the total number of AAOS AUC evaluated nonarthroplasty treatments utilized and the likelihood of receiving a rarely appropriate treatment included gender, race, function-limiting pain, range of motion (ROM), ligamentous instability, arthritis pattern, limb alignment, mechanical symptoms, BMI, age, and Kellgren-Lawrence grade. Factors analyzed in timing of TKA included the above variables plus the total number of AUC interventions, whether the patient received an inappropriate intervention, and average appropriateness of the interventions received. Residual analysis with Cook’s distance was used to identify outliers in regression. Observations with Cook’s distance > 3 times the mean Cook’s distance were identified as potential outliers, and models were adjusted accordingly. All statistical analyses were 2-tailed. Statistical significance was set to P ≤ .05 for all outputs.
Results
In the study, 97.8% of participants identified as male, and the mean age was 62.8 years (Table 3). 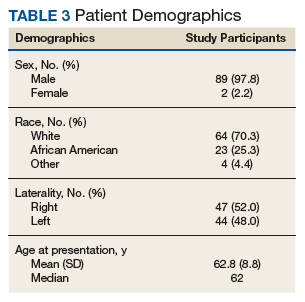
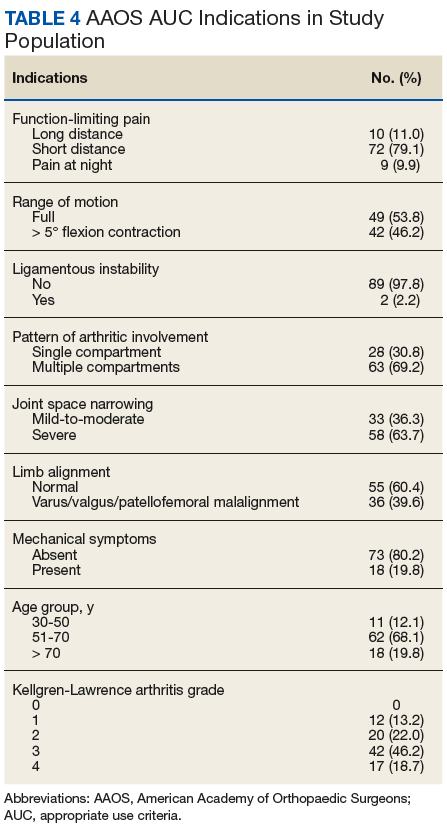
Appropriate Use Criteria Interventions
Patients received a mean of 5.2 AAOS AUC evaluated interventions before undergoing arthroplasty management at a mean of 32.3 months (range 2-181 months) from initial presentation. The majority of these interventions were classified as either appropriate or may be appropriate, according to the AUC definitions (95.1%). Self-management and physical therapy programs were widely utilized (100% and 90.1%, respectively), with all use of these interventions classified as appropriate.
Hinged or unloader knee braces were utilized in about half the study patients; this intervention was classified as rarely appropriate in 4.4% of these patients. Medical therapy was also widely used, with all use of NSAIDs, acetaminophen, and tramadol classified as appropriate or may be appropriate. Oral or transcutaneous opioid medications were prescribed in 14.3% of patients, with 92.3% of this use classified as rarely appropriate. Although the opioid medication prescribing provider was not specifically evaluated, there were no instances in which the orthopaedic service provided an oral or transcutaneous opioid prescriptions. Procedural interventions, with the exception of corticosteroid injections, were uncommon; no patient received realignment osteotomy, and only 12.1% of patients underwent arthroscopy. The use of arthroscopy was deemed rarely appropriate in 72.7% of these cases.
Factors Associated With AAOS AUC Intervention Use
There was no difference in the number of AAOS AUC evaluated interventions received based on BMI (mean [SD] BMI < 35, 5.2 [1.0] vs BMI ≥ 35, 5.3 [1.1], P = .49), age (mean [SD] aged < 60 years, 5.4 [1.0] vs aged ≥ 60 years, 5.1 [1.2], P = .23), or Kellgren-Lawrence arthritic grade (mean [SD] grade ≤ 2, 5.5 [1.0] vs grade > 2, 5.1 [1.1], P = .06). These variables also were not associated with receiving a rarely appropriate intervention (mean [SD] BMI < 35, 0.27 [0.5] vs BMI > 35, 0.2 [0.4], P = .81; aged > 60 years, 0.3 [0.5] vs aged < 60 years, 0.2 [0.4], P = .26; Kellgren-Lawrence grade < 2, 0.4 [0.6] vs grade > 2, 0.2 [0.4], P = .1).
Regression modeling to predict total number of AAOS AUC evaluated interventions received produced a significant model (R2 = 0.111, P = .006). The presence of ligamentous instability (β coefficient, -1.61) and the absence of mechanical symptoms (β coefficient, -0.67) were negative predictors of number of AUC interventions received. Variance inflation factors were 1.014 and 1.012, respectively. Likewise, regression modeling to identify factors predictive of receiving a rarely appropriate intervention also produced a significant model (pseudo R2= 0.06, P = .025), with lower Kellgren-Lawrence grade the only significant predictor of receiving a rarely appropriate intervention (odds ratio [OR] 0.54; 95% CI, 0.42 -0.72, per unit increase).
Timing from presentation to arthroplasty intervention was also evaluated. Age was a negative predictor (β coefficient -1.61), while positive predictors were reduced ROM (β coefficient 15.72) and having more AUC interventions (β coefficient 7.31) (model R2= 0.29, P = < .001). Age was the most significant predictor. Variance inflations factors were 1.02, 1.01, and 1.03, respectively. Receiving a rarely appropriate intervention was not associated with TKA timing.
Discussion
This single-center retrospective study examined the utilization of AAOS AUC-evaluated nonarthroplasty interventions for symptomatic knee OA prior to TKA. The aims of this study were to validate the AAOS AUC in a clinical setting and identify predictors of AAOS AUC utilization. In particular, this study focused on the number of interventions utilized prior to knee arthroplasty, whether interventions receiving a designation of rarely appropriate were used, and the duration of nonarthroplasty treatment.
Patients with knee instability used fewer total AAOS AUC evaluated interventions prior to TKA. Subjective instability has been reported as high as 27% in patients with OA and has been associated with fear of falling, poor balance confidence, activity limitations, and lower Western Ontario and McMaster Universities Osteoarthritis Index (WOMAC) physical function scores.12 However, it has not been found to correlate with knee laxity.13 Nevertheless, significant functional impairment with the risk of falling may reduce the number of nonarthroplasty interventions attempted. On the other hand, the presence of mechanical symptoms resulted in greater utilization of nonarthroplasty interventions. This is likely due to the greater utilization of arthroscopic partial menisectomy or loose body removal in this group of patients. Despite its inclusion as an AAOS AUC evaluated intervention, arthroscopy remains a contentious treatment for symptomatic knee pain in the setting of OA.14,15
For every unit decrease in Kellgren-Lawrence OA grade, patients were 54% more likely to receive a rarely appropriate intervention prior to knee arthroplasty. This is supported by the recent literature examining the AAOS AUC for surgical management of knee OA. Riddle and colleagues developed a classification tree to determine the contributions of various prognostic variables in final classifications of the 864 clinical vignettes used to develop the appropriateness algorithm and found that OA severity was strongly favored, with only 4 of the 432 vignettes with severe knee OA judged as rarely appropriate for surgical intervention.6
Our findings, too, may be explained by an AAOS AUC system that too heavily weighs radiographic severity of knee OA, resulting in more frequent rarely appropriate interventions in patients with less severe arthritis, including nonarthroplasty treatments. It is likely that rarely appropriate interventions were attempted in this subset of our study cohort based on patient’s subjective symptoms and functional status, both of which have been shown to be discordant with radiographic severity of knee OA.16
Oral or transcutaneous prescribed opioid medications were the most frequent intervention that received a rarely appropriate designation. Patients with preoperative opioid use undergoing TKA have been shown to have a greater risk for postoperative complications and longer hospital stay, particularly those patients aged < 75 years. Younger age, use of more interventions, and decreased knee ROM at presentation were predictive of longer duration of nonarthroplasty treatment. The use of more AAOS AUC evaluated interventions in these patients suggests that the AAOS AUC model may effectively be used to manage symptomatic OA, increasing the time from presentation to knee arthroplasty.
Interestingly, the use of rarely appropriate interventions did not affect TKA timing, as would be expected in a clinically effective nonarthroplasty treatment model. The reasons for rarely appropriate nonsurgical interventions are complex and require further investigation. One possible explanation is that decreased ROM was a marker for mechanical symptoms that necessitated additional intervention in the form of knee arthroscopy, delaying time to TKA.
Limitations
There are several limitations of this study. First, the small sample size (N = 90) requires acknowledgment; however, this limitation reflects the difficulty in following patients for years prior to an operative intervention. Second, the study population consists of veterans using the VA system and may not be reflective of the general population, differing with respect to gender, racial, and socioeconomic factors. Nevertheless, studies examining TKA utilization found, aside from racial and ethnic variability, patient gender and age do not affect arthroplasty utilization rate in the VA system.17
Additional limitations stem from the retrospective nature of this study. While the Computerized Patient Record System and centralized care of the VA system allows for review of all physical therapy consultations, orthotic consultations, and medications within the VA system, any treatments and intervention delivered by non-VA providers were not captured. Furthermore, the ability to assess for confounding variables limiting the prescription of certain medications, such as chronic kidney disease with NSAIDs or liver disease with acetaminophen, was limited by our study design.
Although our study suffers from selection bias with respect to examination of nonarthroplasty treatment in patients who have ultimately undergone TKA, we feel that this subset of patients with symptomatic knee OA represents the majority of patients evaluated for knee OA by orthopaedic surgeons in the clinic setting. It should be noted that although realignment osteotomies were sometimes indicated as appropriate by AAOS AUC model in our study population, this intervention was never performed due to patient and surgeon preference. Additionally, although it is not an AAOS AUC evaluated intervention, viscosupplementation was sporadically used during the study period; however, it is now off formulary at the investigation institution.
Conclusion
Our study suggests that patients without knee instability use more nonarthroplasty treatments over a longer period before TKA, and those patients with less severe knee OA are at risk of receiving an intervention judged to be rarely appropriate by the AAOS AUC. Such interventions do not affect timing of TKA. Nonarthroplasty care should be individualized to patients’ needs, and the decision to proceed with arthroplasty should be considered only after exhausting appropriate conservative measures. We recommend that providers use the AAOS AUC, especially when treating younger patients with less severe knee OA, particularly if considering opiate therapy or knee arthroscopy.
Acknowledgments
The authors would like to acknowledge Patrick Getty, MD, for his surgical care of some of the study patients. This material is the result of work supported with resources and the use of facilities at the Louis Stokes Cleveland VA Medical Center in Ohio.
1. Cross M, Smith E, Hoy D, et al. The global burden of hip and knee osteoarthritis: estimates from the Global Burden of Disease 2010 study. Ann Rheum Dis. 2014;73(7):1323-1330.
2. Losina E, Walensky RP, Kessler CL, et al. Cost-effectiveness of total knee arthroplasty in the United States: patient risk and hospital volume. Arch Intern Med. 2009;169(12):1113-1121; discussion 1121-1122.
3. Members of the Writing, Review, and Voting Panels of the AUC on the Non-Arthroplasty Treatment of Osteoarthritis of the Knee, Sanders JO, Heggeness MH, Murray J, Pezold R, Donnelly P. The American Academy of Orthopaedic Surgeons Appropriate Use Criteria on the Non-Arthroplasty Treatment of Osteoarthritis of the Knee. J Bone Joint Surg Am. 2014;96(14):1220-1221.
4. Sanders JO, Murray J, Gross L. Non-arthroplasty treatment of osteoarthritis of the knee. J Am Acad Orthop Surg. 2014;22(4):256-260.
5. Yates AJ Jr, McGrory BJ, Starz TW, Vincent KR, McCardel B, Golightly YM. AAOS appropriate use criteria: optimizing the non-arthroplasty management of osteoarthritis of the knee. J Am Acad Orthop Surg. 2014;22(4):261-267.
6. Riddle DL, Perera RA. Appropriateness and total knee arthroplasty: an examination of the American Academy of Orthopaedic Surgeons appropriateness rating system. Osteoarthritis Cartilage. 2017;25(12):1994-1998.
7. Morgan RC Jr, Slover J. Breakout session: ethnic and racial disparities in joint arthroplasty. Clin Orthop Relat Res. 2011;469(7):1886-1890.
8. O’Connor MI, Hooten EG. Breakout session: gender disparities in knee osteoarthritis and TKA. Clin Orthop Relat Res. 2011;469(7):1883-1885.
9. Ibrahim SA. Racial and ethnic disparities in hip and knee joint replacement: a review of research in the Veterans Affairs Health Care System. J Am Acad Orthop Surg. 2007;15(suppl 1):S87-S94.
10. Karmarkar TD, Maurer A, Parks ML, et al. A fresh perspective on a familiar problem: examining disparities in knee osteoarthritis using a Markov model. Med Care. 2017;55(12):993-1000.
11. Kohn MD, Sassoon AA, Fernando ND. Classifications in brief: Kellgren-Lawrence Classification of Osteoarthritis. Clin Orthop Relat Res. 2016;474(8):1886-1893.
12. Nguyen U, Felson DT, Niu J, et al. The impact of knee instability with and without buckling on balance confidence, fear of falling and physical function: the Multicenter Osteoarthritis Study. Osteoarthritis Cartilage. 2014;22(4):527-534.
13. Schmitt LC, Fitzgerald GK, Reisman AS, Rudolph KS. Instability, laxity, and physical function in patients with medial knee osteoarthritis. Phys Ther. 2008;88(12):1506-1516.
14. Laupattarakasem W, Laopaiboon M, Laupattarakasem P, Sumananont C. Arthroscopic debridement for knee osteoarthritis. Cochrane Database Syst Rev. 2008;(1):CD005118.
15. Lamplot JD, Brophy RH. The role for arthroscopic partial meniscectomy in knees with degenerative changes: a systematic review. Bone Joint J. 2016;98-B(7):934-938.
16. Whittle R, Jordan KP, Thomas E, Peat G. Average symptom trajectories following incident radiographic knee osteoarthritis: data from the Osteoarthritis Initiative. RMD Open. 2016;2(2):e000281.
17. Jones A, Kwoh CK, Kelley ME, Ibrahim SA. Racial disparity in knee arthroplasty utilization in the Veterans Health Administration. Arthritis Rheum. 2005;53(6):979-981.
Knee osteoarthritis (OA) affects almost 9.3 million adults in the US and accounts for $27 billion in annual health care expenses.1,2 Due to the increasing cost of health care and an aging population, there has been renewed interest in establishing criteria for nonarthroplasty treatment of knee OA.
In 2013, using the RAND/UCLA Appropriateness method, the American Academy of Orthopaedic Surgeons (AAOS) developed an appropriate use criteria (AUC) for nonarthroplasty management of primary OA of the knee, based on orthopaedic literature and expert opinion.3 Interventions such as activity modification, weight loss, prescribed physical therapy, nonsteroidal anti-inflammatory drugs, tramadol, prescribed oral or transcutaneous opioids, acetaminophen, intra-articular corticosteroids, hinged or unloading knee braces, arthroscopic partial menisectomy or loose body removal, and realignment osteotomy were assessed. An algorithm was developed for 576 patients scenarios that incorporated patient-specific, prognostic/predictor variables to assign designations of “appropriate,” “may be appropriate,” or “rarely appropriate,” to treatment interventions.4,5 An online version of the algorithm (orthoguidelines.org) is available for physicians and surgeons to judge appropriateness of nonarthroplasty treatments; however, it is not intended to mandate candidacy for treatment or intervention.
Clinical evaluation of the AAOS AUC is necessary to determine how treatment recommendations correlate with current practice. A recent examination of the AAOS Appropriateness System for Surgical Management of Knee OA found that prognostic/predictor variables, such as patient age, OA severity, and pattern of knee OA involvement were more heavily weighted when determining arthroplasty appropriateness than was pain severity or functional loss.6 Furthermore, non-AAOS AUC prognostic/predictor variables, such as race and gender, have been linked to disparities in utilization of knee OA interventions.7-9 Such disparities can be costly not just from a patient perceptive, but also employer and societal perspectives.10
The Department of Veterans Affairs (VA) health care system represents a model of equal-access-to care system in the US that is ideal for examination of issues about health care utilization and any disparities within the AAOS AUC model and has previously been used to assess utilization of total knee arthroplasty.9 The aim of this study was to characterize utilization of the AAOS AUC for nonarthroplasty treatment of knee OA in a VA patient population. We asked the following questions: (1) What variables are predictive of receiving a greater number of AAOS AUC evaluated nonarthroplasty treatments? (2) What variables are predictive of receiving “rarely appropriate” AAOS AUC evaluated nonarthroplasty treatment? (3) What factors are predictive of duration of nonarthroplasty care until total knee arthroplasty (TKA)?
Methods
The institutional review board at the Louis Stokes Cleveland VA Medical Center in Ohio approved a retrospective chart review of nonarthroplasty treatments utilized by patients presenting to its orthopaedic section who subsequently underwent knee arthroplasty between 2013 and 2016. Eligibility criteria included patients aged ≥ 30 years with a diagnosis of unilateral or bilateral primary knee OA. Patients with posttraumatic OA, inflammatory arthritis, and a history of infectious arthritis or Charcot arthropathy of the knee were excluded. Patients with a body mass index (BMI) > 40 or a hemoglobin A1c > 8.0 at presentation were excluded as nonarthroplasty care was the recommended course of treatment above these thresholds.
Data collected included race, gender, duration of nonarthroplasty treatment, BMI, and Kellgren-Lawrence classification of knee OA at time of presentation for symptomatic knee OA.11 All AAOS AUC-evaluated nonarthroplasty treatments utilized prior to arthroplasty intervention also were recorded (Table 1).
Statistical Analysis
Statistical analysis was completed with GraphPad Software Prism 7.0a (La Jolla, CA) and Mathworks MatLab R2016b software (Natick, MA). Univariate analysis with Student t tests with Welch corrections in the setting of unequal variance, Mann-Whitney nonparametric tests, and Fisher exact test were generated in the appropriate setting. Multivariable analyses also were conducted. For continuous outcomes, stepwise multiple linear regression was used to generate predictive models; for binary outcomes, binomial logistic regression was used.
Factors analyzed in regression modeling for the total number of AAOS AUC evaluated nonarthroplasty treatments utilized and the likelihood of receiving a rarely appropriate treatment included gender, race, function-limiting pain, range of motion (ROM), ligamentous instability, arthritis pattern, limb alignment, mechanical symptoms, BMI, age, and Kellgren-Lawrence grade. Factors analyzed in timing of TKA included the above variables plus the total number of AUC interventions, whether the patient received an inappropriate intervention, and average appropriateness of the interventions received. Residual analysis with Cook’s distance was used to identify outliers in regression. Observations with Cook’s distance > 3 times the mean Cook’s distance were identified as potential outliers, and models were adjusted accordingly. All statistical analyses were 2-tailed. Statistical significance was set to P ≤ .05 for all outputs.
Results
In the study, 97.8% of participants identified as male, and the mean age was 62.8 years (Table 3).
Appropriate Use Criteria Interventions
Patients received a mean of 5.2 AAOS AUC evaluated interventions before undergoing arthroplasty management at a mean of 32.3 months (range 2-181 months) from initial presentation. The majority of these interventions were classified as either appropriate or may be appropriate, according to the AUC definitions (95.1%). Self-management and physical therapy programs were widely utilized (100% and 90.1%, respectively), with all use of these interventions classified as appropriate.
Hinged or unloader knee braces were utilized in about half the study patients; this intervention was classified as rarely appropriate in 4.4% of these patients. Medical therapy was also widely used, with all use of NSAIDs, acetaminophen, and tramadol classified as appropriate or may be appropriate. Oral or transcutaneous opioid medications were prescribed in 14.3% of patients, with 92.3% of this use classified as rarely appropriate. Although the opioid medication prescribing provider was not specifically evaluated, there were no instances in which the orthopaedic service provided an oral or transcutaneous opioid prescriptions. Procedural interventions, with the exception of corticosteroid injections, were uncommon; no patient received realignment osteotomy, and only 12.1% of patients underwent arthroscopy. The use of arthroscopy was deemed rarely appropriate in 72.7% of these cases.
Factors Associated With AAOS AUC Intervention Use
There was no difference in the number of AAOS AUC evaluated interventions received based on BMI (mean [SD] BMI < 35, 5.2 [1.0] vs BMI ≥ 35, 5.3 [1.1], P = .49), age (mean [SD] aged < 60 years, 5.4 [1.0] vs aged ≥ 60 years, 5.1 [1.2], P = .23), or Kellgren-Lawrence arthritic grade (mean [SD] grade ≤ 2, 5.5 [1.0] vs grade > 2, 5.1 [1.1], P = .06). These variables also were not associated with receiving a rarely appropriate intervention (mean [SD] BMI < 35, 0.27 [0.5] vs BMI > 35, 0.2 [0.4], P = .81; aged > 60 years, 0.3 [0.5] vs aged < 60 years, 0.2 [0.4], P = .26; Kellgren-Lawrence grade < 2, 0.4 [0.6] vs grade > 2, 0.2 [0.4], P = .1).
Regression modeling to predict total number of AAOS AUC evaluated interventions received produced a significant model (R2 = 0.111, P = .006). The presence of ligamentous instability (β coefficient, -1.61) and the absence of mechanical symptoms (β coefficient, -0.67) were negative predictors of number of AUC interventions received. Variance inflation factors were 1.014 and 1.012, respectively. Likewise, regression modeling to identify factors predictive of receiving a rarely appropriate intervention also produced a significant model (pseudo R2= 0.06, P = .025), with lower Kellgren-Lawrence grade the only significant predictor of receiving a rarely appropriate intervention (odds ratio [OR] 0.54; 95% CI, 0.42 -0.72, per unit increase).
Timing from presentation to arthroplasty intervention was also evaluated. Age was a negative predictor (β coefficient -1.61), while positive predictors were reduced ROM (β coefficient 15.72) and having more AUC interventions (β coefficient 7.31) (model R2= 0.29, P = < .001). Age was the most significant predictor. Variance inflations factors were 1.02, 1.01, and 1.03, respectively. Receiving a rarely appropriate intervention was not associated with TKA timing.
Discussion
This single-center retrospective study examined the utilization of AAOS AUC-evaluated nonarthroplasty interventions for symptomatic knee OA prior to TKA. The aims of this study were to validate the AAOS AUC in a clinical setting and identify predictors of AAOS AUC utilization. In particular, this study focused on the number of interventions utilized prior to knee arthroplasty, whether interventions receiving a designation of rarely appropriate were used, and the duration of nonarthroplasty treatment.
Patients with knee instability used fewer total AAOS AUC evaluated interventions prior to TKA. Subjective instability has been reported as high as 27% in patients with OA and has been associated with fear of falling, poor balance confidence, activity limitations, and lower Western Ontario and McMaster Universities Osteoarthritis Index (WOMAC) physical function scores.12 However, it has not been found to correlate with knee laxity.13 Nevertheless, significant functional impairment with the risk of falling may reduce the number of nonarthroplasty interventions attempted. On the other hand, the presence of mechanical symptoms resulted in greater utilization of nonarthroplasty interventions. This is likely due to the greater utilization of arthroscopic partial menisectomy or loose body removal in this group of patients. Despite its inclusion as an AAOS AUC evaluated intervention, arthroscopy remains a contentious treatment for symptomatic knee pain in the setting of OA.14,15
For every unit decrease in Kellgren-Lawrence OA grade, patients were 54% more likely to receive a rarely appropriate intervention prior to knee arthroplasty. This is supported by the recent literature examining the AAOS AUC for surgical management of knee OA. Riddle and colleagues developed a classification tree to determine the contributions of various prognostic variables in final classifications of the 864 clinical vignettes used to develop the appropriateness algorithm and found that OA severity was strongly favored, with only 4 of the 432 vignettes with severe knee OA judged as rarely appropriate for surgical intervention.6
Our findings, too, may be explained by an AAOS AUC system that too heavily weighs radiographic severity of knee OA, resulting in more frequent rarely appropriate interventions in patients with less severe arthritis, including nonarthroplasty treatments. It is likely that rarely appropriate interventions were attempted in this subset of our study cohort based on patient’s subjective symptoms and functional status, both of which have been shown to be discordant with radiographic severity of knee OA.16
Oral or transcutaneous prescribed opioid medications were the most frequent intervention that received a rarely appropriate designation. Patients with preoperative opioid use undergoing TKA have been shown to have a greater risk for postoperative complications and longer hospital stay, particularly those patients aged < 75 years. Younger age, use of more interventions, and decreased knee ROM at presentation were predictive of longer duration of nonarthroplasty treatment. The use of more AAOS AUC evaluated interventions in these patients suggests that the AAOS AUC model may effectively be used to manage symptomatic OA, increasing the time from presentation to knee arthroplasty.
Interestingly, the use of rarely appropriate interventions did not affect TKA timing, as would be expected in a clinically effective nonarthroplasty treatment model. The reasons for rarely appropriate nonsurgical interventions are complex and require further investigation. One possible explanation is that decreased ROM was a marker for mechanical symptoms that necessitated additional intervention in the form of knee arthroscopy, delaying time to TKA.
Limitations
There are several limitations of this study. First, the small sample size (N = 90) requires acknowledgment; however, this limitation reflects the difficulty in following patients for years prior to an operative intervention. Second, the study population consists of veterans using the VA system and may not be reflective of the general population, differing with respect to gender, racial, and socioeconomic factors. Nevertheless, studies examining TKA utilization found, aside from racial and ethnic variability, patient gender and age do not affect arthroplasty utilization rate in the VA system.17
Additional limitations stem from the retrospective nature of this study. While the Computerized Patient Record System and centralized care of the VA system allows for review of all physical therapy consultations, orthotic consultations, and medications within the VA system, any treatments and intervention delivered by non-VA providers were not captured. Furthermore, the ability to assess for confounding variables limiting the prescription of certain medications, such as chronic kidney disease with NSAIDs or liver disease with acetaminophen, was limited by our study design.
Although our study suffers from selection bias with respect to examination of nonarthroplasty treatment in patients who have ultimately undergone TKA, we feel that this subset of patients with symptomatic knee OA represents the majority of patients evaluated for knee OA by orthopaedic surgeons in the clinic setting. It should be noted that although realignment osteotomies were sometimes indicated as appropriate by AAOS AUC model in our study population, this intervention was never performed due to patient and surgeon preference. Additionally, although it is not an AAOS AUC evaluated intervention, viscosupplementation was sporadically used during the study period; however, it is now off formulary at the investigation institution.
Conclusion
Our study suggests that patients without knee instability use more nonarthroplasty treatments over a longer period before TKA, and those patients with less severe knee OA are at risk of receiving an intervention judged to be rarely appropriate by the AAOS AUC. Such interventions do not affect timing of TKA. Nonarthroplasty care should be individualized to patients’ needs, and the decision to proceed with arthroplasty should be considered only after exhausting appropriate conservative measures. We recommend that providers use the AAOS AUC, especially when treating younger patients with less severe knee OA, particularly if considering opiate therapy or knee arthroscopy.
Acknowledgments
The authors would like to acknowledge Patrick Getty, MD, for his surgical care of some of the study patients. This material is the result of work supported with resources and the use of facilities at the Louis Stokes Cleveland VA Medical Center in Ohio.
1. Cross M, Smith E, Hoy D, et al. The global burden of hip and knee osteoarthritis: estimates from the Global Burden of Disease 2010 study. Ann Rheum Dis. 2014;73(7):1323-1330.
2. Losina E, Walensky RP, Kessler CL, et al. Cost-effectiveness of total knee arthroplasty in the United States: patient risk and hospital volume. Arch Intern Med. 2009;169(12):1113-1121; discussion 1121-1122.
3. Members of the Writing, Review, and Voting Panels of the AUC on the Non-Arthroplasty Treatment of Osteoarthritis of the Knee, Sanders JO, Heggeness MH, Murray J, Pezold R, Donnelly P. The American Academy of Orthopaedic Surgeons Appropriate Use Criteria on the Non-Arthroplasty Treatment of Osteoarthritis of the Knee. J Bone Joint Surg Am. 2014;96(14):1220-1221.
4. Sanders JO, Murray J, Gross L. Non-arthroplasty treatment of osteoarthritis of the knee. J Am Acad Orthop Surg. 2014;22(4):256-260.
5. Yates AJ Jr, McGrory BJ, Starz TW, Vincent KR, McCardel B, Golightly YM. AAOS appropriate use criteria: optimizing the non-arthroplasty management of osteoarthritis of the knee. J Am Acad Orthop Surg. 2014;22(4):261-267.
6. Riddle DL, Perera RA. Appropriateness and total knee arthroplasty: an examination of the American Academy of Orthopaedic Surgeons appropriateness rating system. Osteoarthritis Cartilage. 2017;25(12):1994-1998.
7. Morgan RC Jr, Slover J. Breakout session: ethnic and racial disparities in joint arthroplasty. Clin Orthop Relat Res. 2011;469(7):1886-1890.
8. O’Connor MI, Hooten EG. Breakout session: gender disparities in knee osteoarthritis and TKA. Clin Orthop Relat Res. 2011;469(7):1883-1885.
9. Ibrahim SA. Racial and ethnic disparities in hip and knee joint replacement: a review of research in the Veterans Affairs Health Care System. J Am Acad Orthop Surg. 2007;15(suppl 1):S87-S94.
10. Karmarkar TD, Maurer A, Parks ML, et al. A fresh perspective on a familiar problem: examining disparities in knee osteoarthritis using a Markov model. Med Care. 2017;55(12):993-1000.
11. Kohn MD, Sassoon AA, Fernando ND. Classifications in brief: Kellgren-Lawrence Classification of Osteoarthritis. Clin Orthop Relat Res. 2016;474(8):1886-1893.
12. Nguyen U, Felson DT, Niu J, et al. The impact of knee instability with and without buckling on balance confidence, fear of falling and physical function: the Multicenter Osteoarthritis Study. Osteoarthritis Cartilage. 2014;22(4):527-534.
13. Schmitt LC, Fitzgerald GK, Reisman AS, Rudolph KS. Instability, laxity, and physical function in patients with medial knee osteoarthritis. Phys Ther. 2008;88(12):1506-1516.
14. Laupattarakasem W, Laopaiboon M, Laupattarakasem P, Sumananont C. Arthroscopic debridement for knee osteoarthritis. Cochrane Database Syst Rev. 2008;(1):CD005118.
15. Lamplot JD, Brophy RH. The role for arthroscopic partial meniscectomy in knees with degenerative changes: a systematic review. Bone Joint J. 2016;98-B(7):934-938.
16. Whittle R, Jordan KP, Thomas E, Peat G. Average symptom trajectories following incident radiographic knee osteoarthritis: data from the Osteoarthritis Initiative. RMD Open. 2016;2(2):e000281.
17. Jones A, Kwoh CK, Kelley ME, Ibrahim SA. Racial disparity in knee arthroplasty utilization in the Veterans Health Administration. Arthritis Rheum. 2005;53(6):979-981.
Boosting Alzheimer’s trial participation via Medicare Advantage ‘memory fitness programs’
Clinical trials represent future hope for patients seeking better care, and there is no disease more in need of better care than Alzheimer’s disease. While death rates among most cancers, as well as heart disease, HIV-related illness, and other categories, have declined in the past decade, there has been no progress for Alzheimer’s disease. Better health and wellness overall may be having a beneficial effect that has produced a reduction in age-adjusted dementia rates, but with the aging of the population there are a greater absolute number of dementia cases than ever before, and that number is expected to continue rising. Finding a disease-modifying therapy seems to be the best hope for changing this dim outlook. Clinical trials intend to do just that but are hampered by patient enrollment rates that remain low. Far fewer eligible patients enroll than are needed, causing studies to take longer to complete, driving up their costs and essentially slowing progress. There is a need to increase patient enrollment, and there has been a variety of efforts intended to address this, not the least of which has been an explosion of media coverage of Alzheimer’s disease.

The Global Alzheimer’s Platform (GAP) Foundation, a nonprofit, self-described patient-centric entity dedicated to reducing the time and cost of Alzheimer’s disease clinical trials, recently announced an initiative to increase participation in Alzheimer’s clinical trials by supporting and collaborating with “memory fitness programs” through select Medicare Advantage plans. At worst, this seems a harmless way to increase attention and hopefully interest in clinical trial participation. At best, this may be a cost-effective way to increase enrollment and even improve dementia care. Dementia is notoriously underdiagnosed, especially by overworked, busy primary care providers who simply lack the time to perform the time-consuming testing that is typically required to diagnose and follow such patients.
There are some caveats to consider. First, memory fitness programs are of dubious benefit. They generally fit the description of being harmless, but there is little compelling evidence that they preserve or improve memory.
Second, enrollment in a clinical trial, for a patient, is not always a winning proposition. To date, there has been little success and in the absence of benefit, any downside – even if simply an inconvenience – is a net negative. Recently at the 2018 Clinical Trials on Alzheimer’s Disease meeting, Merck reported that patients with mild cognitive impairment receiving active treatment in the BACE1 inhibitor verubecestat trial actually declined at a more rapid rate than did those on placebo. While the absolute difference was small, and one could argue whether it was clinically significant or simply a random occurrence, it was a reminder that intervention with an experimental agent is not necessarily benign.
Third, Medicare Advantage plans, while popular in some circles, are not considered advantageous to providers so that the proliferation of inadequate reimbursement will potentially fuel the accelerating number of providers who opt out of insurance plans altogether. This is not necessarily an issue for the GAP Foundation specifically but is nonetheless an issue for anything that promotes MA plans).
Finally, it remains important to help patients and families maintain a positive outlook, especially when we have nothing better to offer. Alzheimer’s disease is not a death sentence for every patient affected. While many have difficult and heartbreaking courses, some have slowly progressive courses with relatively little impairment for an extended period of time. There are also the dementia-phobic, cognitively unimpaired individuals (or who simply have normal age-associated cognitive changes) in whom the continued drumbeat of dementia awareness and memory testing raises their paranoia ever higher. We treat deficits (or try to), but we have to live based on our preserved skills. The challenge clinicians must face with patients and families is how to maximize function while compensating for deficits and making sure that patients and families maintain their hope.
Dr. Caselli is professor of neurology at the Mayo Clinic Arizona in Scottsdale and associate director and clinical core director of the Arizona Alzheimer’s Disease Center.
Clinical trials represent future hope for patients seeking better care, and there is no disease more in need of better care than Alzheimer’s disease. While death rates among most cancers, as well as heart disease, HIV-related illness, and other categories, have declined in the past decade, there has been no progress for Alzheimer’s disease. Better health and wellness overall may be having a beneficial effect that has produced a reduction in age-adjusted dementia rates, but with the aging of the population there are a greater absolute number of dementia cases than ever before, and that number is expected to continue rising. Finding a disease-modifying therapy seems to be the best hope for changing this dim outlook. Clinical trials intend to do just that but are hampered by patient enrollment rates that remain low. Far fewer eligible patients enroll than are needed, causing studies to take longer to complete, driving up their costs and essentially slowing progress. There is a need to increase patient enrollment, and there has been a variety of efforts intended to address this, not the least of which has been an explosion of media coverage of Alzheimer’s disease.
The Global Alzheimer’s Platform (GAP) Foundation, a nonprofit, self-described patient-centric entity dedicated to reducing the time and cost of Alzheimer’s disease clinical trials, recently announced an initiative to increase participation in Alzheimer’s clinical trials by supporting and collaborating with “memory fitness programs” through select Medicare Advantage plans. At worst, this seems a harmless way to increase attention and hopefully interest in clinical trial participation. At best, this may be a cost-effective way to increase enrollment and even improve dementia care. Dementia is notoriously underdiagnosed, especially by overworked, busy primary care providers who simply lack the time to perform the time-consuming testing that is typically required to diagnose and follow such patients.
There are some caveats to consider. First, memory fitness programs are of dubious benefit. They generally fit the description of being harmless, but there is little compelling evidence that they preserve or improve memory.
Second, enrollment in a clinical trial, for a patient, is not always a winning proposition. To date, there has been little success and in the absence of benefit, any downside – even if simply an inconvenience – is a net negative. Recently at the 2018 Clinical Trials on Alzheimer’s Disease meeting, Merck reported that patients with mild cognitive impairment receiving active treatment in the BACE1 inhibitor verubecestat trial actually declined at a more rapid rate than did those on placebo. While the absolute difference was small, and one could argue whether it was clinically significant or simply a random occurrence, it was a reminder that intervention with an experimental agent is not necessarily benign.
Third, Medicare Advantage plans, while popular in some circles, are not considered advantageous to providers so that the proliferation of inadequate reimbursement will potentially fuel the accelerating number of providers who opt out of insurance plans altogether. This is not necessarily an issue for the GAP Foundation specifically but is nonetheless an issue for anything that promotes MA plans).
Finally, it remains important to help patients and families maintain a positive outlook, especially when we have nothing better to offer. Alzheimer’s disease is not a death sentence for every patient affected. While many have difficult and heartbreaking courses, some have slowly progressive courses with relatively little impairment for an extended period of time. There are also the dementia-phobic, cognitively unimpaired individuals (or who simply have normal age-associated cognitive changes) in whom the continued drumbeat of dementia awareness and memory testing raises their paranoia ever higher. We treat deficits (or try to), but we have to live based on our preserved skills. The challenge clinicians must face with patients and families is how to maximize function while compensating for deficits and making sure that patients and families maintain their hope.
Dr. Caselli is professor of neurology at the Mayo Clinic Arizona in Scottsdale and associate director and clinical core director of the Arizona Alzheimer’s Disease Center.
Is intra-articular platelet-rich plasma injection an effective treatment for knee OA?
EVIDENCE SUMMARY
PRP vs placebo. Three RCTs compared PRP with saline placebo injections and 2 found that PRP improved the Western Ontario and McMaster Universities Arthritis Index (WOMAC, a standardized scale assessing knee pain, function, and stiffness) by 40% to 70%; the third found 24% to 32% improvements in the EuroQol visual analog scale (EQ-VAS) scores at 6 months1-3 (TABLE1-12).

The first 2 studies enrolled patients (mean age early 60s, approximately 50% women) with clinically and radiographically evaluated knee OA of mostly moderate severity (baseline WOMAC scores about 50).1,2 Investigators in the first RCT injected PRP once in one subgroup and twice in another subgroup, compared with a single injection of saline in a third subgroup.1 They gave 3 weekly injections of PRP or saline in the second RCT.2
The third study enrolled mainly patients with early osteoarthritis (mean age early 50s, slightly more women). Investigators injected PRP 3 times in one subgroup and once (plus 2 saline injections) in another, compared with 3 saline injections, and evaluated patients at baseline and 6 months.3
PRP vs HA. Nine RCTs compared PRP with HA injections. Six studies (673 patients) found no significant difference; 3 studies (376 patients) found that PRP improved standardized knee assessment scores by 35% to 40% at 24-48 weeks.7,8,10 All studies enrolled patients (mean age early 60s, approximately 50% women) with clinically and radiographically evaluated knee OA of mostly moderate severity. In 7 RCTs, 4-6,9-12 investigators injected PRP or HA weekly for 3 weeks, in one RCT8 they gave 4 weekly injections, and in one7they gave 2 PRP injections separated by 4 weeks.
Three RCTs used the International Knee Documentation Committee (IKDC) score, considered the most reliable standardized scoring system, which quantifies subjective symptoms (pain, stiffness, swelling, giving way), activity (climbing stairs, rising from a chair, squatting, jumping), and function pre- and postintervention.5,9,12 All 3 studies using the IKDC found no difference between PRP and HA injections. Most RCTs used the WOMAC standardized scale, scoring 5 items for pain, 2 for stiffness, and 17 for function.1,2,4,6-8.10
Risk for bias
A systematic review13 that evaluated methodologic quality of the 3 studies comparing PRP with placebo rated 21,3 at high risk of bias and one2 at moderate risk. Another meta-analysis14 performed a quality assessment including 4 of the 9 RCTs,8-10,12 comparing PRP with HA and concluded that 3 had a high risk of bias; the fourth RCT had a moderate risk. No independent quality assessments of the other RCTs were available.4-7,11
RECOMMENDATIONS
The American Academy of Orthopaedic Surgeons doesn’t recommend for or against PRP injections because of insufficient evidence and strongly recommends against HA injections based on multiple RCTs of moderate quality that found no difference between HA and placebo.15
1. Patel S, Dhillon MS, Aggarwal S, et al. Treatment with platelet-rich plasma is more effective than placebo for knee osteoarthritis: a prospective, double-blind, randomized trial. Am J Sports Med. 2013;41:356-364.
2. Smith PA. Intra-articular autologous conditioned plasma injections provide safe and efficacious treatment for knee arthritis: an FDA-sanctioned, randomized, double-blind, placebo-controlled clinical trial. Am J Sports Med. 2016;44:884-891.
3. Gorelli G, Gormelli CA, Ataoglu B, et al. Multiple PRP injections are more effective than single injections and hyaluronic acid in knees with early osteoarthritis: a randomized, double-blind, placebo-controlled trial. Knee Surg Sports Traumatol Arthrosc. 2015;25:958-965.
4. Cole BJ, Karas V, Hussey K, et al. Hyaluronic acid versus platelet-rich plasma: a prospective double-blind randomized controlled trial comparing clinical outcomes and effects on intra-articular biology for the treatment of knee osteoarthritis. Am J Sports Med. 2016;45:339-346.
5. Filardo G, Di Matteo B, Di Martino A, et al. Platelet-rich intra-articular knee injections show no superiority versus viscosupplementation: a randomized controlled trial. Am J Sports Med. 2015;43:1575-1582.
6. Sanchez M, Fiz N, Azofra J, et al. A randomized clinical trial evaluating plasma rich in growth factors (PGRF-endoret) versus hyaluronic acid in the short-term treatment of symptomatic knee osteoarthritis. Arthroscopy: J Arth and Related Surg. 2012;28:1070-1078.
7. Raeissadat SA, Rayegani SM, Hassanabadi H, et al. Knee osteoarthritis injection choices: platelet-rich plasma (PRP) versus hyaluronic acid (a one-year randomized clinical trial). Clin Med Insights: Arth Musc Dis. 2015;8:1-8.
8. Cerza F, Carni S, Carcangiu A, et al. Comparison between hyaluronic acid and platelet-rich plasma, intra-articular infiltration in the treatment of gonarthrosis. Am J Sports Med. 2012;40:2822-2827.
9. Filardo G, Kon E, Di Martino B, et al. Platelet-rich plasma vs hyaluronic acid to treat knee degenerative pathology: study design and preliminary results of a randomized controlled trial. BMC Musculoskeletal Disorders. 2012;13:229-236.
10. Vaquerizo V, Plasencia MA, Arribas I, et al. Comparison of intra-articular injections of plasma rich in growth factors (PGRF-endoret) versus durolane hyaluronic acid in the treatment of patients with symptomatic osteoarthritis: a randomized controlled trial. Arthroscopy: J Arth and Related Surg. 2013;29:1635-1643.
11. Montanez-Heredia E, Irizar S, Huertas PJ, et al. Intra-articular injections of platelet-rich plasma versus hyaluronic acid in the treatment of osteoarthritis knee pain: a randomized clinical trial in the context of the Spanish national health care system. Intl J Molec Sci. 2016;17:1064-1077.
12. Li M, Zhang C, Ai Z, et al. Therapeutic effectiveness of intra-knee articular injections of platelet-rich plasma on knee articular cartilage degeneration. Zhongguo Xiu Fu Chong Jian Wai Ke Za Zhi. 2011 25:1192-11966. (Article published in Chinese with abstract in English.)
13. Shen L, Yuan T, Chen S, et al. The temporal effect of platelet-rich plasma on pain and physical function in the treatment of knee osteoarthritis: systematic review and meta-analysis of randomized controlled trials. J Ortho Surg Res. 2017;12:16.
14. Laudy ABM, Bakker EWP, Rekers M, et al. Efficacy of platelet-rich plasma injections in osteoarthritis of the knee: a systematic review and meta-analysis. Br J Sports Med. 2015;49:657-672.
15. American Academy of Orthopaedic Surgeons. Clinical practice guideline on the treatment of osteoarthritis of the knee, 2nd ed. www.aaos.org/cc_files/aaosorg/research/guidelines/treatmentofosteoarthritisofthekneeguideline.pdf. Published May 2013. Accessed February 22, 2019.
EVIDENCE SUMMARY
PRP vs placebo. Three RCTs compared PRP with saline placebo injections and 2 found that PRP improved the Western Ontario and McMaster Universities Arthritis Index (WOMAC, a standardized scale assessing knee pain, function, and stiffness) by 40% to 70%; the third found 24% to 32% improvements in the EuroQol visual analog scale (EQ-VAS) scores at 6 months1-3 (TABLE1-12).
The first 2 studies enrolled patients (mean age early 60s, approximately 50% women) with clinically and radiographically evaluated knee OA of mostly moderate severity (baseline WOMAC scores about 50).1,2 Investigators in the first RCT injected PRP once in one subgroup and twice in another subgroup, compared with a single injection of saline in a third subgroup.1 They gave 3 weekly injections of PRP or saline in the second RCT.2
The third study enrolled mainly patients with early osteoarthritis (mean age early 50s, slightly more women). Investigators injected PRP 3 times in one subgroup and once (plus 2 saline injections) in another, compared with 3 saline injections, and evaluated patients at baseline and 6 months.3
PRP vs HA. Nine RCTs compared PRP with HA injections. Six studies (673 patients) found no significant difference; 3 studies (376 patients) found that PRP improved standardized knee assessment scores by 35% to 40% at 24-48 weeks.7,8,10 All studies enrolled patients (mean age early 60s, approximately 50% women) with clinically and radiographically evaluated knee OA of mostly moderate severity. In 7 RCTs, 4-6,9-12 investigators injected PRP or HA weekly for 3 weeks, in one RCT8 they gave 4 weekly injections, and in one7they gave 2 PRP injections separated by 4 weeks.
Three RCTs used the International Knee Documentation Committee (IKDC) score, considered the most reliable standardized scoring system, which quantifies subjective symptoms (pain, stiffness, swelling, giving way), activity (climbing stairs, rising from a chair, squatting, jumping), and function pre- and postintervention.5,9,12 All 3 studies using the IKDC found no difference between PRP and HA injections. Most RCTs used the WOMAC standardized scale, scoring 5 items for pain, 2 for stiffness, and 17 for function.1,2,4,6-8.10
Risk for bias
A systematic review13 that evaluated methodologic quality of the 3 studies comparing PRP with placebo rated 21,3 at high risk of bias and one2 at moderate risk. Another meta-analysis14 performed a quality assessment including 4 of the 9 RCTs,8-10,12 comparing PRP with HA and concluded that 3 had a high risk of bias; the fourth RCT had a moderate risk. No independent quality assessments of the other RCTs were available.4-7,11
RECOMMENDATIONS
The American Academy of Orthopaedic Surgeons doesn’t recommend for or against PRP injections because of insufficient evidence and strongly recommends against HA injections based on multiple RCTs of moderate quality that found no difference between HA and placebo.15
1. Patel S, Dhillon MS, Aggarwal S, et al. Treatment with platelet-rich plasma is more effective than placebo for knee osteoarthritis: a prospective, double-blind, randomized trial. Am J Sports Med. 2013;41:356-364.
2. Smith PA. Intra-articular autologous conditioned plasma injections provide safe and efficacious treatment for knee arthritis: an FDA-sanctioned, randomized, double-blind, placebo-controlled clinical trial. Am J Sports Med. 2016;44:884-891.
3. Gorelli G, Gormelli CA, Ataoglu B, et al. Multiple PRP injections are more effective than single injections and hyaluronic acid in knees with early osteoarthritis: a randomized, double-blind, placebo-controlled trial. Knee Surg Sports Traumatol Arthrosc. 2015;25:958-965.
4. Cole BJ, Karas V, Hussey K, et al. Hyaluronic acid versus platelet-rich plasma: a prospective double-blind randomized controlled trial comparing clinical outcomes and effects on intra-articular biology for the treatment of knee osteoarthritis. Am J Sports Med. 2016;45:339-346.
5. Filardo G, Di Matteo B, Di Martino A, et al. Platelet-rich intra-articular knee injections show no superiority versus viscosupplementation: a randomized controlled trial. Am J Sports Med. 2015;43:1575-1582.
6. Sanchez M, Fiz N, Azofra J, et al. A randomized clinical trial evaluating plasma rich in growth factors (PGRF-endoret) versus hyaluronic acid in the short-term treatment of symptomatic knee osteoarthritis. Arthroscopy: J Arth and Related Surg. 2012;28:1070-1078.
7. Raeissadat SA, Rayegani SM, Hassanabadi H, et al. Knee osteoarthritis injection choices: platelet-rich plasma (PRP) versus hyaluronic acid (a one-year randomized clinical trial). Clin Med Insights: Arth Musc Dis. 2015;8:1-8.
8. Cerza F, Carni S, Carcangiu A, et al. Comparison between hyaluronic acid and platelet-rich plasma, intra-articular infiltration in the treatment of gonarthrosis. Am J Sports Med. 2012;40:2822-2827.
9. Filardo G, Kon E, Di Martino B, et al. Platelet-rich plasma vs hyaluronic acid to treat knee degenerative pathology: study design and preliminary results of a randomized controlled trial. BMC Musculoskeletal Disorders. 2012;13:229-236.
10. Vaquerizo V, Plasencia MA, Arribas I, et al. Comparison of intra-articular injections of plasma rich in growth factors (PGRF-endoret) versus durolane hyaluronic acid in the treatment of patients with symptomatic osteoarthritis: a randomized controlled trial. Arthroscopy: J Arth and Related Surg. 2013;29:1635-1643.
11. Montanez-Heredia E, Irizar S, Huertas PJ, et al. Intra-articular injections of platelet-rich plasma versus hyaluronic acid in the treatment of osteoarthritis knee pain: a randomized clinical trial in the context of the Spanish national health care system. Intl J Molec Sci. 2016;17:1064-1077.
12. Li M, Zhang C, Ai Z, et al. Therapeutic effectiveness of intra-knee articular injections of platelet-rich plasma on knee articular cartilage degeneration. Zhongguo Xiu Fu Chong Jian Wai Ke Za Zhi. 2011 25:1192-11966. (Article published in Chinese with abstract in English.)
13. Shen L, Yuan T, Chen S, et al. The temporal effect of platelet-rich plasma on pain and physical function in the treatment of knee osteoarthritis: systematic review and meta-analysis of randomized controlled trials. J Ortho Surg Res. 2017;12:16.
14. Laudy ABM, Bakker EWP, Rekers M, et al. Efficacy of platelet-rich plasma injections in osteoarthritis of the knee: a systematic review and meta-analysis. Br J Sports Med. 2015;49:657-672.
15. American Academy of Orthopaedic Surgeons. Clinical practice guideline on the treatment of osteoarthritis of the knee, 2nd ed. www.aaos.org/cc_files/aaosorg/research/guidelines/treatmentofosteoarthritisofthekneeguideline.pdf. Published May 2013. Accessed February 22, 2019.
EVIDENCE-BASED ANSWER:
Probably not, based on the balance of evidence. While low-quality evidence may suggest potential benefit, the balance of evidence suggests it is no better than placebo.
Compared with saline placebo, platelet-rich plasma (PRP) injections may improve standardized scores for knee osteoarthritis (OA) pain, function, and stiffness by 24% to 70% for periods of 6 to 52 weeks in patients with early to moderate OA (strength of recommendation [SOR]: B, small randomized controlled trials [RCTs] with methodologic flaws).
Compared with hyaluronic acid (HA), PRP probably improves scores by a similar amount for periods of 8 to 52 weeks (SOR: B, multiple RCTs with conflicting results favoring no difference). However, since HA alone likely doesn’t improve scores more than placebo (SOR: B, RCTs of moderate quality), if both HA and PRP are about the same, then both are not better than placebo.
