User login
In reply: Metformin for type 2 diabetes
In Reply: We thank Dr. Moskowitz for his kind comments. We agree about the need for assessing vitamin B12 levels during chronic metformin use.
Secondary analysis of patients in the Diabetes Prevention Program Outcomes Study showed a higher incidence of combined low and low-normal vitamin B12 deficiency in users assigned to the metformin group compared with those assigned to the placebo group at the 5-year and 13-year marks after randomization.1 Post hoc analysis of patients in the Hyperinsulinemia: the Outcome of Its Metabolic Effects trial also showed lower levels of vitamin B12 and higher levels of methylmalonic acid associated with significant worsening of a validated neuropathy score in metformin users.2
The mechanism behind the development of vitamin B12 deficiency is not completely understood but could possibly be alterations in intestinal mobility, bacterial overgrowth, or calcium-dependent uptake by ileal cells of the vitamin B12-intrinsic factor complex.3
Our electronic medical record has a built-in tool that suggests checking vitamin B12 whenever a patient requests metformin refills. There are no current guidelines on the need for baseline testing of the vitamin B12 level. The American Diabetes Association recommends periodic measurement of vitamin B12 levels, possibly yearly, in metformin users and more often if there are symptoms indicative of deficiency.4
- Aroda VR, Edelstein SL, Goldberg RB, et al; Diabetes Prevention Program Research Group. Long-term metformin use and vitamin B12 deficiency in the Diabetes Prevention Program Outcomes Study. J Clin Endocrinol Metab 2019; 101(4):1754–1761. doi:10.1210/jc.2015-3754
- Out M, Kooy A, Lehert P, Schalkwijk CA, Stehouwer CDA. Long-term treatment with metformin in type 2 diabetes and methylmalonic acid: post hoc analysis of a randomized controlled 4.3 year trial. J Diabetes Complications 2018; 32(2):171–178. doi:10.1016/j.jdiacomp.2017.11.001
- Liu KW, Dai LK, Jean W. Metformin-related vitamin B12 deficiency. Age Ageing 2006; 35(2):200–201. doi:10.1093/ageing/afj042
- American Diabetes Association. 9. Pharmacologic approaches to glycemic treatment: Standards of Medical Care in Diabetes—2019. Diabetes Care 2019; 42(suppl 1):S90–S102. doi:10.2337/dc19-S009
In Reply: We thank Dr. Moskowitz for his kind comments. We agree about the need for assessing vitamin B12 levels during chronic metformin use.
Secondary analysis of patients in the Diabetes Prevention Program Outcomes Study showed a higher incidence of combined low and low-normal vitamin B12 deficiency in users assigned to the metformin group compared with those assigned to the placebo group at the 5-year and 13-year marks after randomization.1 Post hoc analysis of patients in the Hyperinsulinemia: the Outcome of Its Metabolic Effects trial also showed lower levels of vitamin B12 and higher levels of methylmalonic acid associated with significant worsening of a validated neuropathy score in metformin users.2
The mechanism behind the development of vitamin B12 deficiency is not completely understood but could possibly be alterations in intestinal mobility, bacterial overgrowth, or calcium-dependent uptake by ileal cells of the vitamin B12-intrinsic factor complex.3
Our electronic medical record has a built-in tool that suggests checking vitamin B12 whenever a patient requests metformin refills. There are no current guidelines on the need for baseline testing of the vitamin B12 level. The American Diabetes Association recommends periodic measurement of vitamin B12 levels, possibly yearly, in metformin users and more often if there are symptoms indicative of deficiency.4
- Aroda VR, Edelstein SL, Goldberg RB, et al; Diabetes Prevention Program Research Group. Long-term metformin use and vitamin B12 deficiency in the Diabetes Prevention Program Outcomes Study. J Clin Endocrinol Metab 2019; 101(4):1754–1761. doi:10.1210/jc.2015-3754
- Out M, Kooy A, Lehert P, Schalkwijk CA, Stehouwer CDA. Long-term treatment with metformin in type 2 diabetes and methylmalonic acid: post hoc analysis of a randomized controlled 4.3 year trial. J Diabetes Complications 2018; 32(2):171–178. doi:10.1016/j.jdiacomp.2017.11.001
- Liu KW, Dai LK, Jean W. Metformin-related vitamin B12 deficiency. Age Ageing 2006; 35(2):200–201. doi:10.1093/ageing/afj042
- American Diabetes Association. 9. Pharmacologic approaches to glycemic treatment: Standards of Medical Care in Diabetes—2019. Diabetes Care 2019; 42(suppl 1):S90–S102. doi:10.2337/dc19-S009

Click for Credit: Suicide in Medicaid youth; persistent back pain; more
Here are 5 articles from the April issue of Clinician Reviews (individual articles are valid for one year from date of publication—expiration dates below):
1. Back pain persists in one in five patients
To take the posttest, go to: https://bit.ly/2Uiod8N
Expires January 14, 2019
2. COPD linked to higher in-hospital death rates in patients with PAD
To take the posttest, go to: https://bit.ly/2TFCeJC
Expires January 22, 2019
3. Medicaid youth suicides include more females, younger kids, hanging deaths
To take the posttest, go to: https://bit.ly/2Uleyyp
Expires January 17, 2019
4. Potential antidepressant overprescribing found in 24% of elderly cohort
To take the posttest, go to: https://bit.ly/2HWwcSq
Expires January 24, 2019
5. Perceptions of liver transplantation for ALD are evolving
To take the posttest, go to: https://bit.ly/2OCANuA
Expires January 22, 2019

More chest compression–only CPR leads to increased survival rates
according to a Swedish study of out-of-hospital cardiac arrests and subsequent CPR.

“These findings support continuous endorsement of chest compression–only CPR as an option in future CPR guidelines because it is associated with higher CPR rates and survival in out-of-hospital cardiac arrests,” wrote Gabriel Riva, MD, of the Karolinska Institutet, Stockholm, and his coauthors. The study was published in Circulation.
To determine changes in the rate and type of CPR performed before emergency medical services (EMS) arrival, the researchers compared all bystander-witnessed out-of-hospital cardiac arrests (OHCAs) reported in Sweden between 2000 and 2017. In all, 30,445 patients were included; the time periods compared were 2000-2005, 2006-2010, and 2011-2017. Patients were categorized as receiving either no CPR (NO-CPR), standard CPR (S-CPR), or chest compression–only CPR (CO-CPR). In 2005, CO-CPR was introduced in national CPR guidelines as an option for bystanders; in 2010, it was recommended for anyone untrained in CPR.
The proportion of patients who received CPR in general increased from 41% in 2000-2005 to 59% in 2006-2010 to 68% in 2011-2017. S-CPR changed from 35% to 45% to 38% over the three periods, while CO-CPR increased from 5% to 14% to 30%. In regard to 30-day survival rates, the S-CPR group saw an increase from 9% to 13% to 16% and the CO-CPR group increased from 8% to 12% to 14%, compared with 4% to 6% to 7% for the NO-CPR group.
The authors noted the limitations of their study, including the results being based on register data and therefore subject to misclassification and missing data. In addition, missing data negated any reporting on the neurological function of survivors; analyzing witnessed OHCAs only also meant the findings could not be validated for nonwitnessed OHCA.
The Swedish Heart and Lung Foundation funded the study. The authors made no disclosures.
SOURCE: Riva G et al. Circulation. 2019 Apr 1. doi: 10.1161/CIRCULATIONAHA.118.038179.
according to a Swedish study of out-of-hospital cardiac arrests and subsequent CPR.
“These findings support continuous endorsement of chest compression–only CPR as an option in future CPR guidelines because it is associated with higher CPR rates and survival in out-of-hospital cardiac arrests,” wrote Gabriel Riva, MD, of the Karolinska Institutet, Stockholm, and his coauthors. The study was published in Circulation.
To determine changes in the rate and type of CPR performed before emergency medical services (EMS) arrival, the researchers compared all bystander-witnessed out-of-hospital cardiac arrests (OHCAs) reported in Sweden between 2000 and 2017. In all, 30,445 patients were included; the time periods compared were 2000-2005, 2006-2010, and 2011-2017. Patients were categorized as receiving either no CPR (NO-CPR), standard CPR (S-CPR), or chest compression–only CPR (CO-CPR). In 2005, CO-CPR was introduced in national CPR guidelines as an option for bystanders; in 2010, it was recommended for anyone untrained in CPR.
The proportion of patients who received CPR in general increased from 41% in 2000-2005 to 59% in 2006-2010 to 68% in 2011-2017. S-CPR changed from 35% to 45% to 38% over the three periods, while CO-CPR increased from 5% to 14% to 30%. In regard to 30-day survival rates, the S-CPR group saw an increase from 9% to 13% to 16% and the CO-CPR group increased from 8% to 12% to 14%, compared with 4% to 6% to 7% for the NO-CPR group.
The authors noted the limitations of their study, including the results being based on register data and therefore subject to misclassification and missing data. In addition, missing data negated any reporting on the neurological function of survivors; analyzing witnessed OHCAs only also meant the findings could not be validated for nonwitnessed OHCA.
The Swedish Heart and Lung Foundation funded the study. The authors made no disclosures.
SOURCE: Riva G et al. Circulation. 2019 Apr 1. doi: 10.1161/CIRCULATIONAHA.118.038179.
FROM CIRCULATION
Key clinical point: Since chest compression-only CPR was introduced and recommended as an alternative for bystanders witnessing a cardiac arrest, CPR rates and survival rates have increased.
Major finding: From 2001-2005 to 2011-2017, 30-day survival rates increased from 9% to 16% for the standard CPR group and from 8% to 14% for the chest compression–only group, compared with 4%-7% for the no CPR group.
Study details: An observational nationwide cohort study of 30,445 Swedish patients who suffered out-of-hospital cardiac arrest.
Disclosures: The Swedish Heart and Lung Foundation funded the study. The authors made no disclosures.
Source: Riva G et al. Circulation. 2019 Apr 1. doi: 10.1161/CIRCULATIONAHA.118.038179.
Association between Inpatient Delirium and Hospital Readmission in Patients ≥ 65 Years of Age: A Retrospective Cohort Study
Delirium is an acute change in mental status, affecting more than seven million hospitalized patients in the United States annually.1 Several factors increase the risk of developing delirium, including advanced age,2 cognitive dysfunction,3 hearing and vision impairment,4-6 and severe illness or major surgery.7 Delirium may be precipitated during hospitalization by common inpatient interventions, such as the use of physical restraints, polypharmacy, or bladder catheters.4,8 In-hospital delirium impacts an estimated 10%-15% of the general medical admissions and as many as 81% of patients in the intensive care unit (ICU).9-11 Despite the relative frequency with which delirium is encountered in the hospital, subsequent emergency department (ED) presentations or hospital readmissions for these patients are poorly characterized.
The development of delirium is associated with several negative outcomes during the hospital stay. Delirium is an independent predictor of prolonged hospital stay,7,9,12,13 prolonged mechanical ventilation,14 and mortality during admission.14,15 Inpatient delirium is associated with functional decline at discharge, leading to a new nursing home placement.16-19 Preexisting dementia is exacerbated by inpatient delirium, and a new diagnosis of cognitive impairment20 or dementia becomes more common after an episode of delirium.21
These data suggest that people diagnosed with delirium may be particularly vulnerable in the posthospitalization period. Hospitals with high rates of unplanned readmissions face penalties from the Centers for Medicare and Medicaid Services.22,23 However, few investigations have focused on postdischarge healthcare utilization, such as readmission rates and ED visits. Studies that address this topic are limited to postoperative patient populations.24
Using a cohort of hospitalized patients, we examined whether those diagnosed with delirium experienced worse outcomes compared with patients with no such condition. We hypothesized that the patients diagnosed with delirium during hospitalization would experience more readmissions and ED visits within 30 days of discharge compared with those without delirium.
METHODS
Study Design
This single-center retrospective cohort study took place at the Kaiser Permanente San Rafael Medical Center (KP-SRF), a 116-bed general community medical and surgical hospital located in Northern California, from September 6, 2010 to March 31, 2015. The Kaiser Permanente Northern California institutional review board, in accordance with the provisions of the Declaration of the Helsinki and International Conference on Harmonization Guidelines for Good Clinical Practice (CN-15-2491-H), approved this study.
Participants and Eligibility Criteria
This study included Kaiser Permanente members at least 65 years old who were hospitalized at KP-SRF from September 2010 to March 2015. Patient data were obtained from the electronic medical records. Patients with delirium were identified from a delirium registry; all other patients served as controls.
Starting on September 6, 2010, a hospital-wide program was initiated to screen hospitalized medical and surgical patients using the Confusion Assessment Method (CAM).25 As part of this program, nurses completed a four-hour training on delirium; the program included delirium identification and CAM administration. Patients deemed at risk for delirium by their nurse or displaying symptoms of delirium (fluctuation in attention or awareness, disorientation, restlessness, agitation, and psychomotor slowing) were screened by nurses one to two times within a 24-hour period. Physicians were notified by the nurse if their patient screened positive. Nurses were prohibited from performing CAMs in languages that they were not fluent in, thus resulting in screening of primarily English-speaking patients. Psychiatry was consulted at the discretion of the primary team physician to assist with diagnosis and management of delirium. As psychiatry consultation was left up to the discretion of the primary team physician, not all CAM-positive patients were evaluated. The psychiatrists conducted no routine evaluation on the CAM-negative patients unless requested by the primary team physician. The psychiatrist confirmed the delirium diagnosis with a clinical interview and assessment. The patients confirmed with delirium at any point during their hospitalization were prospectively added to a delirium registry. The patients assessed by the psychiatrist as not delirious were excluded from the registry. Only those patients added to the delirium registry during the study period were classified as delirious for this study. All other patients were included as controls. The presence of the nursing screening program using the CAM enriched the cohort, but a positive CAM was unnecessary nor was it sufficient for inclusion in the delirium group (Table 1).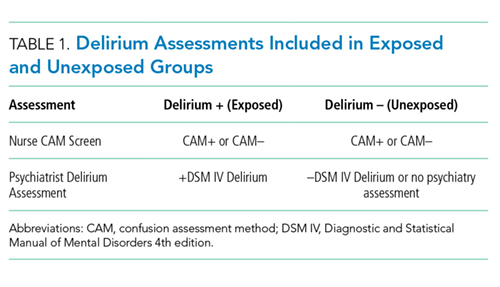
To eliminate the influence of previous delirium episodes on readmission, the subjects were excluded if they reported a prior diagnosis of delirium in 2006 or later, which was the year the electronic medical record was initiated. This diagnosis was determined retrospectively using the following ICD-9 codes: 290.11, 290.3, 290.41, 292.0, 292.81, 292.89, 293.0, 293.0E, 293.0F, 293.1, 293.89, 294.10, 294.21, 304.00, 304.90, 305.50, 331.0, 437.0, 780.09, V11.8, and V15.89.26 Subjects were also excluded if they were ever diagnosed with alcohol-related delirium, as defined by ICD-9 codes 291, 303.9, and 305. Subjects were excluded from the primary analysis if Kaiser Permanente membership lapsed to any degree within 30 days of discharge. Patients who died in the hospital were not excluded; however, the analyses of postdischarge outcomes were conducted on the subpopulation of study subjects who were discharged alive.
For subjects with multiple entries in the delirium registry, the earliest hospitalization during the study period in which a delirium diagnosis was recorded was selected. For eligible patients without a diagnosis of delirium, a single hospitalization was selected randomly from the individual patients during the time period. The analysis database included only one hospitalization for each subject. The flowchart of patient selection is outlined in the Figure.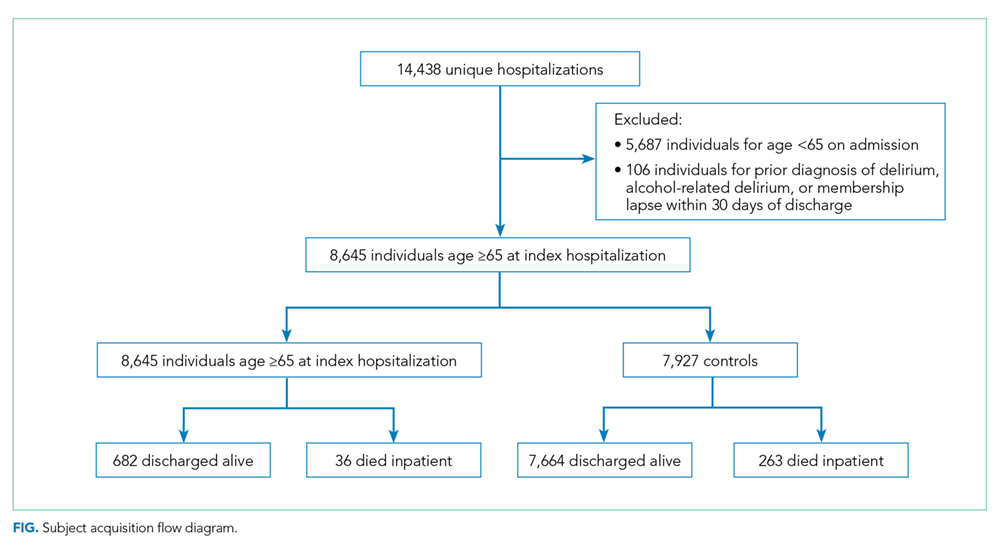
Patient Characteristics
Patient demographics and clinical data were obtained from the electronic medical records. We used several scores to characterize illness severity, including the Charlson comorbidity index,27 Laboratory-Based Acute Physiology, version 2 (LAPS2) score28—an externally validated score for acute severity of illness—and disease categories as defined by the Healthcare Cost and Utilization Project (HCUP).29
Outcomes
The primary outcome was the rate of readmission to the hospital within 30 days of discharge from the hospitalization in which delirium was first diagnosed. Readmissions and ED visits to any Kaiser Permanente hospital and to hospitals outside of the Kaiser Permanente network with Kaiser Permanente insurance were captured. To avoid incorrectly coding patients transferred from the index hospital to another hospital as readmissions, we excluded readmissions that occurred on the day of discharge or the following calendar day. This action was expected to lower the absolute number of readmissions but restrict the analysis to true readmissions. The models of postdischarge outcomes are based on the subset of patients discharged alive. The secondary outcome measures included discharge from the index hospitalization to a skilled nursing facility or hospice rather than to home and emergency room visits within 30 days of discharge. We also quantified rates of mortality during hospitalization and at 30 days postdischarge.
Statistical Analysis
Comparisons between patients with delirium and those without were performed using Pearson’s X2 test for categorical variables and student t-test for continuous variables. The estimated odds of our outcome measures for delirious and nondelirious subjects were calculated from multivariable logistic regression models, which controlled for predictors of delirium and additional information obtained during the hospitalization. For inpatient outcomes (in-hospital mortality and discharge to skilled nursing facility or hospice), we adjusted only for admission characteristics: age, race/ethnicity, admission to ICU, Charlson comorbidity index, HCUP category, and admission category. To limit the number of variables in our model, we consolidated the initial 30 HCUP categories (Appendix Table 1) by illness type into 13 categories (Appendix Table 2). For postdischarge outcomes, we adjusted for all the variables, including disposition (Table 2). The average estimated odds were calculated based on the observed marginal distribution of the control variables. The P value indicates how likely the odds on each outcome for delirious subjects differed significantly from those for other subjects. All statistical analyses were performed using SAS 9.3 (SAS Institute Inc., Cary, North Carolina).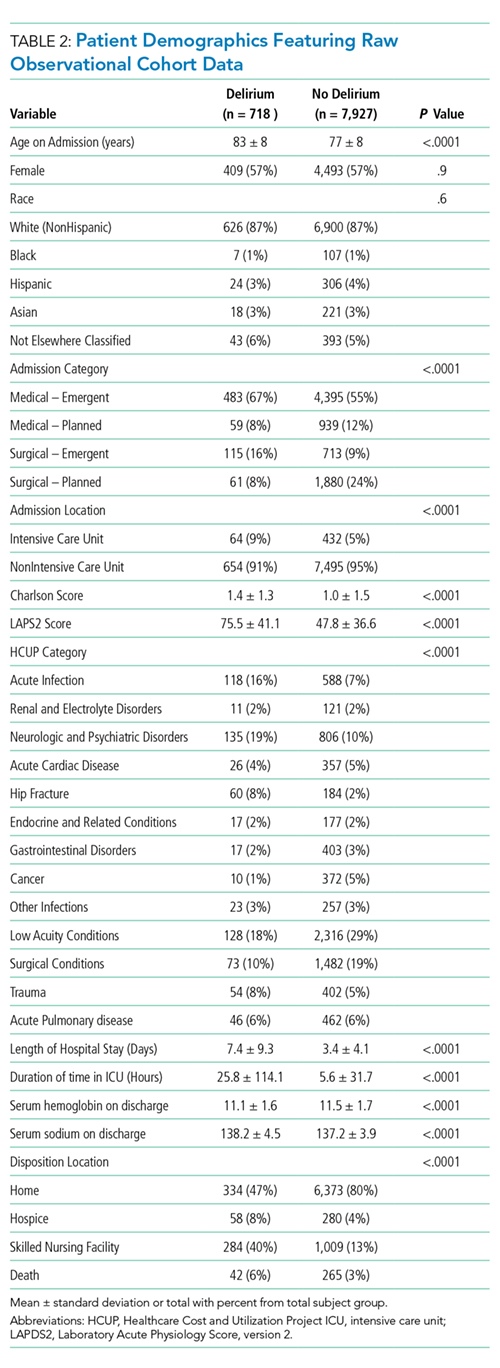
RESULTS
Demographics and Clinical Characteristics
A total of 718 patients with delirium and 7,927 patients without delirium were included in this study. The related demographic information is outlined in Table 2. On average, the patients with delirium were older (83 ± 8 years versus 77 ± 8 years, P < .0001) but no difference in gender distribution was observed between groups. A similar racial breakdown was noted between groups, with white patients accounting for 87% of both patients with delirium and those without. The majority of admissions were unplanned medical admissions. The delirium cohort included more emergent surgical admissions compared with patients who did not develop delirium. Patients who developed delirium exhibited higher levels of illness severity on admission, as measured by the Charlson and LAPS2 scores, and were more often admitted to the ICU. Significant differences were also observed between admission illness categories between patients with delirium and those without.
Primary Outcome
Delirium during admission was significantly associated with hospital readmission within 30 days of discharge (adjusted odds ratio [aOR] = 2.60, 95% CI: 1.96–3.44; P < .0001; Table 3).
Secondary Outcomes
Delirium during admission was significantly (P < .0001; Table 3) associated with an ED visit within 30 days of discharge (OR: 2.18; 95% CI: 1.77–2.69) and discharge to a skilled nursing facility or hospice rather than home (OR: 2.52; 95% CI: 2.09–3.01). Delirium was not associated (P > .1) with death during hospitalization nor death 30 days following discharge.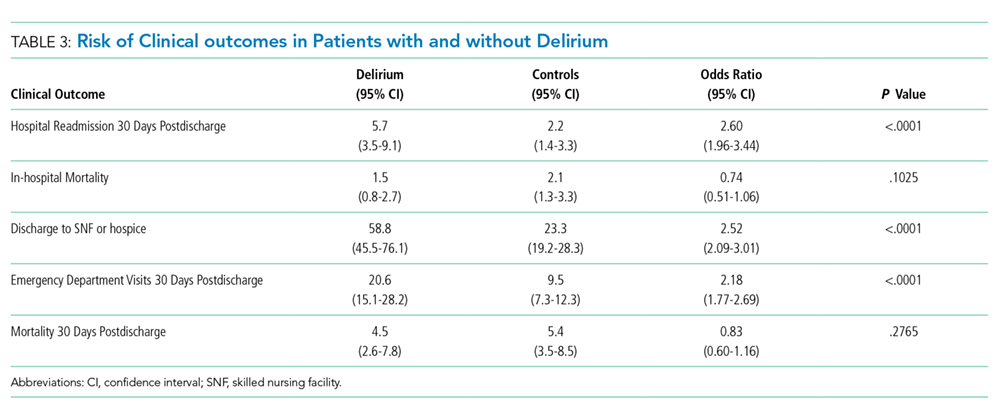
As the delirious patients were much more likely to be discharged to a skilled nursing facility than nondelirious patients, we tested whether discharge disposition influenced readmission rates and ED visits between delirious and nondelirious patients in an unadjusted univariate analysis. The association between delirium and readmission and ED utilization was present regardless of disposition. Among patients discharged to skilled nursing, readmission rates were 4.76% and 13.38% (P < .001), and ED visit rates were 12.29% and 23.24% (P < .001) for nondelirious and delirious patients, respectively. Among patients discharged home, readmission rates were 4.96% and 14.37% (P < .001), and ED visit rates were 11.93% and 29.04% (P < .001) for nondelirious and delirious patients, respectively.
DISCUSSION
In this study of patients in a community hospital in Northern California, we observed a significant association between inpatient delirium and risk of hospital readmission within 30 days of discharge. We also demonstrated increased skilled nursing facility placement and ED utilization after discharge among hospitalized patients with delirium compared with those without. Patients with delirium in this study were diagnosed by a psychiatrist—a gold standard30—and the study was conducted in a health system database with near comprehensive ascertainment of readmissions. These results suggest that patients with delirium are particularly vulnerable in the posthospitalization period and are a key group to focusing on reducing readmission rates and postdischarge healthcare utilization.
Identifying the risk factors for hospital readmission is important for the benefit of both the patient and the hospital. In an analysis of Medicare claims data from 2003 to 2004, 19.6% of beneficiaries were readmitted within 30 days of discharge.31 There is a national effort to reduce unplanned hospital readmissions for both patient safety as hospitals with high readmission rates face penalties from the Centers for Medicare and Medicaid Services.22,23 Why delirium is associated with readmission remains unclear. Delirium may precipitate aspiration events, reduce oral intake which complicates medication administration and nutrition, or reduced mobility, leading to pulmonary emboli and skin breakdown, any of which could lead to readmission.32 Delirium may also accelerate the progression of cognitive decline and overall loss of functional independence.20 Delirious patients can be difficult to care for at home, and persistent delirium may lead to returns to the ED and readmission. Strategies to reduce readmissions associated with delirium may need to focus on both prevention of hospital-acquired delirium and targeted caregiver and patient support after discharge.
Hospital readmission and ED visits are not mutually exclusive experiences. In the United States, the majority of patients admitted to the hospital are admitted through the ED.33 Thus, most of the readmissions in this cohort were also likely counted as 30-day ED visits. However, as ED utilization occurs regardless of whether a patient is discharged or admitted from the ED, we reported all ED visits in this analysis, similar to other studies.34 More delirium patients returned to the ED 30 days postdischarge than were ultimately readmitted to the hospital, and delirious patients were more likely to visit the ED or be readmitted than nondelirious patients. These observations point toward the first 30 days after discharge as a crucial period for these patients.
Our study features several strengths. To our knowledge, this study is one of the largest investigations of inpatients with delirium. One distinguishing feature was that all cases of delirium in this study were diagnosed by a psychiatrist, which is considered a gold standard. Many studies rely solely on brief nursing-administered surveys for delirium diagnosis. Using Kaiser Permanente data allowed for more complete follow-up of patients, including vital status. Kaiser Permanente is both a medical system and an insurer, resulting in acquisition of detailed health information from all hospitalizations where Kaiser Permanente insurance was used for each patient. Therefore, patients were only lost to follow-up following discharge in the event of a membership lapse; these patients were excluded from analysis. The obtained data are also more generalizable than those of other studies examining readmission rates in delirious patients as the hospital where these data were collected is a 116-bed general community medical and surgical hospital. Thus, the patients enrolled in this study covered multiple hospital services with a variety of admission diagnoses. This condition contrasts with much of the existing literature on inpatient delirium; these studies mostly center on specific medical conditions or surgeries and are often conducted at academic medical centers. At the same time, Kaiser Permanente is a unique health maintenance organization focused on preventive care, and readmission rates are possibly lower than elsewhere given the universal access to primary care for Kaiser Permanente members. Our results may not generalize to patients hospitalized in other health systems.
The diagnosis of delirium is a clinical diagnosis without biomarkers or radiographic markers and is also underdiagnosed and poorly coded.32 For these reasons, delirium can be challenging to study in large administrative databases or data derived from electronic medical records. We addressed this limitation by classifying the delirium patients only when they had been diagnosed by a staff psychiatrist. However, not all patients who screened positive with the CAM were evaluated by the staff psychiatrist during the study period. Thus, several CAM-positive patients who were not evaluated by psychiatry were included in the control population. This situation may cause bias toward identification of more severe cases of delirium. Although the physicians were encouraged to consult the psychiatry department for any patients who screened positive for delirium with the CAM, the psychiatrist may not have been involved if patients were managed without consultation. These patients may have exhibited less severe delirium or hypoactive delirium. In addition, the CAM fails to detect all delirious patients; interrater variability may occur with CAM administration, and non-English speaking patients are more likely to be excluded.35 These situations are another possible way for our control population to include some delirious patients and those patients with less severe or hypoactive subtypes. While this might bias toward the null hypothesis, it is also possible our results only indicate an association between more clinically apparent delirium and readmission. A major limitation of this study is that we were unable to quantify the number of cohort patients screened with the CAM or the results of screening, thus limiting our ability to quantify the impact of potential biases introduced by the screening program.
This study may have underestimated readmission rates. We defined readmissions as all hospitalizations at any Kaiser Permanente facility, or to an alternate facility where Kaiser Permanente insurance was used, within 30 days of discharge. We excluded the day of discharge or the following calendar day to avoid mischaracterizing transfers from the index hospital to another Kaiser Permanente facility as readmissions. This step was conducted to avoid biasing our comparison, as delirious patients are less frequently discharged home than nondelirious patients. Therefore, while the relative odds of readmission between delirious and nondelirious patients reported in this study should be generalizable to other community hospitals, the absolute readmission rates reported here may not be comparable to those reported in other studies.
Delirium may represent a marker of more severe illness or medical complications accrued during the hospitalization, which could lead to the associations observed in this study due to confounding.32 Patients with delirium are more likely to be admitted emergently, admitted to the ICU, and feature higher acuity conditions than patients without delirium. We attempted to mitigate this possibility by using a multivariable model to control for variables related to illness severity, including the Charlson comorbidity index, HCUP diagnostic categories, and ICU admission. Despite including HCUP diagnostic categories in our model, we were unable to capture the contribution of certain diseases with finer granularity, such as preexistent dementia, which may also affect clinical outcomes.36 Similarly, although we incorporated markers of illness severity into our model, we were unable to adjust for baseline functional status or frailty, which were not reliably recorded in the electronic medical record but are potential confounders when investigating clinical outcomes including hospital readmission.
We also lacked information regarding the duration of delirium in our cohort. Therefore, we were unable to test whether longer episodes of delirium were more predictive of readmission than shorter episodes.
CONCLUSION
In-hospital delirium is associated with several negative patient outcomes. Our study demonstrates that delirium predicts 30-day readmission and emergency department utilization after hospital discharge. Bearing in mind that a third of hospital-acquired delirium cases may be preventable,32 hospitals should prioritize interventions to reduce postdischarge healthcare utilization and complications in this particularly vulnerable group.
Acknowledgments
The authors would like to acknowledge Dr. Andrew L. Avins for his guidance with the initial development of this project and Julie Fourie for contributing data to the overall study.
Disclosures
Dr. Liu receives funding from NIH K23GM112018 and
Funding
This study was funded by Kaiser Permanente Graduate Medical Education, who approved the design, conduct, and reporting of this study.
1. Bidwell J. Interventions for preventing delirium in hospitalized non-ICU patients: A Cochrane review summary. Int J Nurs Stud. 2017;70:142-143. PubMed
2. Ryan DJ, O’Regan NA, Caoimh RÓ, et al. Delirium in an adult acute hospital population: predictors, prevalence and detection. BMJ Open. 2013;3(1):e001772. PubMed
3. McNicoll L, Pisani MA, Zhang Y, et al. Delirium in the intensive care unit: occurrence and clinical course in older patients. J Am Geriatr Soc. 2003;51(5):591-598. PubMed
4. Inouye SK. Predisposing and precipitating factors for delirium in hospitalized older patients. Dement Geriatr Cogn Disord. 1999;10(5):393-400. PubMed
5. Inouye SK, Zhang Y, Jones RN, et al. Risk factors for delirium at discharge: development and validation of a predictive model. Arch Intern Med. 2007;167(13):1406-1413. PubMed
6. LaHue SC, Liu VX. Loud and clear: sensory impairment, delirium, and functional recovery in critical illness. Am J Respir Crit Care Med. 2016;194(3):252-253. PubMed
7. Salluh JI, Soares M, Teles JM, et al. Delirium epidemiology in critical care (DECCA): an international study. Crit Care. 2010;14(6):R210. PubMed
8. Inouye SK, Charpentier PA. Precipitating factors for delirium in hospitalized elderly persons. Predictive model and interrelationship with baseline vulnerability. JAMA. 1996;275(11):852-857. PubMed
9. Ely EW, Shintani A, Truman B, et al. Delirium as a predictor of mortality in mechanically ventilated patients in the intensive care unit. JAMA. 2004;291(14):1753-1762. PubMed
10. Inouye SK, Westendorp RG, Saczynski JS. Delirium in elderly people. Lancet. 2014;383(9920):911-922. PubMed
11. Brown EG, Douglas VC. Moving beyond metabolic encephalopathy: an update on delirium prevention, workup, and management. Semin Neurol. 2015;35(6):646-655. PubMed
12. Francis J, Martin D, Kapoor WN. A prospective study of delirium in hospitalized elderly. JAMA. 1990;263(8):1097-1101. PubMed
13. McCusker J, Cole MG, Dendukuri N, Belzile E. Does delirium increase hospital stay? J Am Geriatr Soc. 2003;51(11):1539-1546. PubMed
14. Salluh JI, Wang H, Schneider EB, et al. Outcome of delirium in critically ill patients: systematic review and meta-analysis. BMJ. 2015;350:h2538. PubMed
15. Abelha FJ, Luís C, Veiga D, et al. Outcome and quality of life in patients with postoperative delirium during an ICU stay following major surgery. Crit Care. 2013;17(5):R257. PubMed
16. Siddiqi N, House AO, Holmes JD. Occurrence and outcome of delirium in medical in-patients: a systematic literature review. Age Ageing. 2006;35(4):350-364. PubMed
17. Witlox J, Eurelings LS, de Jonghe JF, et al. Delirium in elderly patients and the risk of postdischarge mortality, institutionalization, and dementia: a meta-analysis. JAMA. 2010;304(4):443-451. PubMed
18. Inouye SK, Rushing JT, Foreman MD, Palmer RM, Pompei P. Does delirium contribute to poor hospital outcomes? A three-site epidemiologic study. J Gen Intern Med. 1998;13(4):234-242. PubMed
19. Freter S, Koller K, Dunbar M, MacKnight C, Rockwood K. Translating delirium prevention strategies for elderly adults with hip fracture into routine clinical care: A pragmatic clinical trial. J Am Geriatr Soc. 2017;65(3):567-573. PubMed
20. Fong TG, Jones RN, Shi P, et al. Delirium accelerates cognitive decline in Alzheimer disease. Neurology. 2009;72(18):1570-1575. PubMed
21. Girard TD, Jackson JC, Pandharipande PP, et al. Delirium as a predictor of long-term cognitive impairment in survivors of critical illness. Crit Care Med. 2010;38(7):1513-1520. PubMed
22. Berenson RA, Paulus RA, Kalman NS. Medicare’s readmissions-reduction program—a positive alternative. N Engl J Med. 2012;366(15):1364-1366. PubMed
23. Desai NR, Ross JS, Kwon JY, et al. Association between hospital penalty status under the hospital readmission reduction program and readmission rates for target and nontarget conditions. JAMA. 2016;316(24):2647-2656. PubMed
24. Elsamadicy AA, Wang TY, Back AG, et al. Post-operative delirium is an independent predictor of 30-day hospital readmission after spine surgery in the elderly (≥65years old): a study of 453 consecutive elderly spine surgery patients. J Clin Neurosci. 2017;41:128-131. PubMed
25. Inouye SK, van Dyck CH, Alessi CA, et al. Clarifying confusion: the confusion assessment method. A new method for detection of delirium. Ann Intern Med. 1990;113(12):941-948. PubMed
26. Inouye SK, Leo-Summers L, Zhang Y, et al. A chart-based method for identification of delirium: validation compared with interviewer ratings using the confusion assessment method. J Am Geriatr Soc. 2005;53(2):312-318. PubMed
27. Charlson M, Szatrowski TP, Peterson J, Gold J. Validation of a combined comorbidity index. J Clin Epidemiol. 1994;47(11):1245-1251. PubMed
28. Escobar GJ, Gardner MN, Greene JD, Draper D, Kipnis P. Risk-adjusting hospital mortality using a comprehensive electronic record in an integrated health care delivery system. Med Care. 2013;51(5):446-453. PubMed
29. Steiner C, Elixhauser A, Schnaier J. The healthcare cost and utilization project: an overview. Eff Clin Pract. 2002;5(3):143-151. PubMed
30. Lawlor PG, Bush SH. Delirium diagnosis, screening and management. Curr Opin Support Palliat Care. 2014;8(3):286-295. PubMed
31. Jencks SF, Williams MV, Coleman EA. Rehospitalizations among patients in the Medicare fee-for-service program. N Engl J Med. 2009;360(14):1418-1428. PubMed
32. Fong TG, Tulebaev SR, Inouye SK. Delirium in elderly adults: diagnosis, prevention and treatment. Nat Rev Neurol. 2009;5(4):210-220. PubMed
33. Leyenaar JK, Lagu T, Lindenauer PK. Direct admission to the hospital: an alternative approach to hospitalization. J Hosp Med. 2016;11(4):303-305. PubMed
34. Wang CL, Ding ST, Hsieh MJ, et al. Factors associated with emergency department visit within 30 days after discharge. BMC Health Serv Res. 2016;16:190. PubMed
35. Shi Q, Warren L, Saposnik G, Macdermid JC. Confusion assessment method: a systematic review and meta-analysis of diagnostic accuracy. Neuropsychiatr Dis Treat. 2013;9:1359-1370. PubMed
36. Fick DM, Agostini JV, Inouye SK. Delirium superimposed on dementia: a systematic review. J Am Geriatr Soc. 2002;50(10):1723-1732. PubMed
Delirium is an acute change in mental status, affecting more than seven million hospitalized patients in the United States annually.1 Several factors increase the risk of developing delirium, including advanced age,2 cognitive dysfunction,3 hearing and vision impairment,4-6 and severe illness or major surgery.7 Delirium may be precipitated during hospitalization by common inpatient interventions, such as the use of physical restraints, polypharmacy, or bladder catheters.4,8 In-hospital delirium impacts an estimated 10%-15% of the general medical admissions and as many as 81% of patients in the intensive care unit (ICU).9-11 Despite the relative frequency with which delirium is encountered in the hospital, subsequent emergency department (ED) presentations or hospital readmissions for these patients are poorly characterized.
The development of delirium is associated with several negative outcomes during the hospital stay. Delirium is an independent predictor of prolonged hospital stay,7,9,12,13 prolonged mechanical ventilation,14 and mortality during admission.14,15 Inpatient delirium is associated with functional decline at discharge, leading to a new nursing home placement.16-19 Preexisting dementia is exacerbated by inpatient delirium, and a new diagnosis of cognitive impairment20 or dementia becomes more common after an episode of delirium.21
These data suggest that people diagnosed with delirium may be particularly vulnerable in the posthospitalization period. Hospitals with high rates of unplanned readmissions face penalties from the Centers for Medicare and Medicaid Services.22,23 However, few investigations have focused on postdischarge healthcare utilization, such as readmission rates and ED visits. Studies that address this topic are limited to postoperative patient populations.24
Using a cohort of hospitalized patients, we examined whether those diagnosed with delirium experienced worse outcomes compared with patients with no such condition. We hypothesized that the patients diagnosed with delirium during hospitalization would experience more readmissions and ED visits within 30 days of discharge compared with those without delirium.
METHODS
Study Design
This single-center retrospective cohort study took place at the Kaiser Permanente San Rafael Medical Center (KP-SRF), a 116-bed general community medical and surgical hospital located in Northern California, from September 6, 2010 to March 31, 2015. The Kaiser Permanente Northern California institutional review board, in accordance with the provisions of the Declaration of the Helsinki and International Conference on Harmonization Guidelines for Good Clinical Practice (CN-15-2491-H), approved this study.
Participants and Eligibility Criteria
This study included Kaiser Permanente members at least 65 years old who were hospitalized at KP-SRF from September 2010 to March 2015. Patient data were obtained from the electronic medical records. Patients with delirium were identified from a delirium registry; all other patients served as controls.
Starting on September 6, 2010, a hospital-wide program was initiated to screen hospitalized medical and surgical patients using the Confusion Assessment Method (CAM).25 As part of this program, nurses completed a four-hour training on delirium; the program included delirium identification and CAM administration. Patients deemed at risk for delirium by their nurse or displaying symptoms of delirium (fluctuation in attention or awareness, disorientation, restlessness, agitation, and psychomotor slowing) were screened by nurses one to two times within a 24-hour period. Physicians were notified by the nurse if their patient screened positive. Nurses were prohibited from performing CAMs in languages that they were not fluent in, thus resulting in screening of primarily English-speaking patients. Psychiatry was consulted at the discretion of the primary team physician to assist with diagnosis and management of delirium. As psychiatry consultation was left up to the discretion of the primary team physician, not all CAM-positive patients were evaluated. The psychiatrists conducted no routine evaluation on the CAM-negative patients unless requested by the primary team physician. The psychiatrist confirmed the delirium diagnosis with a clinical interview and assessment. The patients confirmed with delirium at any point during their hospitalization were prospectively added to a delirium registry. The patients assessed by the psychiatrist as not delirious were excluded from the registry. Only those patients added to the delirium registry during the study period were classified as delirious for this study. All other patients were included as controls. The presence of the nursing screening program using the CAM enriched the cohort, but a positive CAM was unnecessary nor was it sufficient for inclusion in the delirium group (Table 1).
To eliminate the influence of previous delirium episodes on readmission, the subjects were excluded if they reported a prior diagnosis of delirium in 2006 or later, which was the year the electronic medical record was initiated. This diagnosis was determined retrospectively using the following ICD-9 codes: 290.11, 290.3, 290.41, 292.0, 292.81, 292.89, 293.0, 293.0E, 293.0F, 293.1, 293.89, 294.10, 294.21, 304.00, 304.90, 305.50, 331.0, 437.0, 780.09, V11.8, and V15.89.26 Subjects were also excluded if they were ever diagnosed with alcohol-related delirium, as defined by ICD-9 codes 291, 303.9, and 305. Subjects were excluded from the primary analysis if Kaiser Permanente membership lapsed to any degree within 30 days of discharge. Patients who died in the hospital were not excluded; however, the analyses of postdischarge outcomes were conducted on the subpopulation of study subjects who were discharged alive.
For subjects with multiple entries in the delirium registry, the earliest hospitalization during the study period in which a delirium diagnosis was recorded was selected. For eligible patients without a diagnosis of delirium, a single hospitalization was selected randomly from the individual patients during the time period. The analysis database included only one hospitalization for each subject. The flowchart of patient selection is outlined in the Figure.
Patient Characteristics
Patient demographics and clinical data were obtained from the electronic medical records. We used several scores to characterize illness severity, including the Charlson comorbidity index,27 Laboratory-Based Acute Physiology, version 2 (LAPS2) score28—an externally validated score for acute severity of illness—and disease categories as defined by the Healthcare Cost and Utilization Project (HCUP).29
Outcomes
The primary outcome was the rate of readmission to the hospital within 30 days of discharge from the hospitalization in which delirium was first diagnosed. Readmissions and ED visits to any Kaiser Permanente hospital and to hospitals outside of the Kaiser Permanente network with Kaiser Permanente insurance were captured. To avoid incorrectly coding patients transferred from the index hospital to another hospital as readmissions, we excluded readmissions that occurred on the day of discharge or the following calendar day. This action was expected to lower the absolute number of readmissions but restrict the analysis to true readmissions. The models of postdischarge outcomes are based on the subset of patients discharged alive. The secondary outcome measures included discharge from the index hospitalization to a skilled nursing facility or hospice rather than to home and emergency room visits within 30 days of discharge. We also quantified rates of mortality during hospitalization and at 30 days postdischarge.
Statistical Analysis
Comparisons between patients with delirium and those without were performed using Pearson’s X2 test for categorical variables and student t-test for continuous variables. The estimated odds of our outcome measures for delirious and nondelirious subjects were calculated from multivariable logistic regression models, which controlled for predictors of delirium and additional information obtained during the hospitalization. For inpatient outcomes (in-hospital mortality and discharge to skilled nursing facility or hospice), we adjusted only for admission characteristics: age, race/ethnicity, admission to ICU, Charlson comorbidity index, HCUP category, and admission category. To limit the number of variables in our model, we consolidated the initial 30 HCUP categories (Appendix Table 1) by illness type into 13 categories (Appendix Table 2). For postdischarge outcomes, we adjusted for all the variables, including disposition (Table 2). The average estimated odds were calculated based on the observed marginal distribution of the control variables. The P value indicates how likely the odds on each outcome for delirious subjects differed significantly from those for other subjects. All statistical analyses were performed using SAS 9.3 (SAS Institute Inc., Cary, North Carolina).
RESULTS
Demographics and Clinical Characteristics
A total of 718 patients with delirium and 7,927 patients without delirium were included in this study. The related demographic information is outlined in Table 2. On average, the patients with delirium were older (83 ± 8 years versus 77 ± 8 years, P < .0001) but no difference in gender distribution was observed between groups. A similar racial breakdown was noted between groups, with white patients accounting for 87% of both patients with delirium and those without. The majority of admissions were unplanned medical admissions. The delirium cohort included more emergent surgical admissions compared with patients who did not develop delirium. Patients who developed delirium exhibited higher levels of illness severity on admission, as measured by the Charlson and LAPS2 scores, and were more often admitted to the ICU. Significant differences were also observed between admission illness categories between patients with delirium and those without.
Primary Outcome
Delirium during admission was significantly associated with hospital readmission within 30 days of discharge (adjusted odds ratio [aOR] = 2.60, 95% CI: 1.96–3.44; P < .0001; Table 3).
Secondary Outcomes
Delirium during admission was significantly (P < .0001; Table 3) associated with an ED visit within 30 days of discharge (OR: 2.18; 95% CI: 1.77–2.69) and discharge to a skilled nursing facility or hospice rather than home (OR: 2.52; 95% CI: 2.09–3.01). Delirium was not associated (P > .1) with death during hospitalization nor death 30 days following discharge.
As the delirious patients were much more likely to be discharged to a skilled nursing facility than nondelirious patients, we tested whether discharge disposition influenced readmission rates and ED visits between delirious and nondelirious patients in an unadjusted univariate analysis. The association between delirium and readmission and ED utilization was present regardless of disposition. Among patients discharged to skilled nursing, readmission rates were 4.76% and 13.38% (P < .001), and ED visit rates were 12.29% and 23.24% (P < .001) for nondelirious and delirious patients, respectively. Among patients discharged home, readmission rates were 4.96% and 14.37% (P < .001), and ED visit rates were 11.93% and 29.04% (P < .001) for nondelirious and delirious patients, respectively.
DISCUSSION
In this study of patients in a community hospital in Northern California, we observed a significant association between inpatient delirium and risk of hospital readmission within 30 days of discharge. We also demonstrated increased skilled nursing facility placement and ED utilization after discharge among hospitalized patients with delirium compared with those without. Patients with delirium in this study were diagnosed by a psychiatrist—a gold standard30—and the study was conducted in a health system database with near comprehensive ascertainment of readmissions. These results suggest that patients with delirium are particularly vulnerable in the posthospitalization period and are a key group to focusing on reducing readmission rates and postdischarge healthcare utilization.
Identifying the risk factors for hospital readmission is important for the benefit of both the patient and the hospital. In an analysis of Medicare claims data from 2003 to 2004, 19.6% of beneficiaries were readmitted within 30 days of discharge.31 There is a national effort to reduce unplanned hospital readmissions for both patient safety as hospitals with high readmission rates face penalties from the Centers for Medicare and Medicaid Services.22,23 Why delirium is associated with readmission remains unclear. Delirium may precipitate aspiration events, reduce oral intake which complicates medication administration and nutrition, or reduced mobility, leading to pulmonary emboli and skin breakdown, any of which could lead to readmission.32 Delirium may also accelerate the progression of cognitive decline and overall loss of functional independence.20 Delirious patients can be difficult to care for at home, and persistent delirium may lead to returns to the ED and readmission. Strategies to reduce readmissions associated with delirium may need to focus on both prevention of hospital-acquired delirium and targeted caregiver and patient support after discharge.
Hospital readmission and ED visits are not mutually exclusive experiences. In the United States, the majority of patients admitted to the hospital are admitted through the ED.33 Thus, most of the readmissions in this cohort were also likely counted as 30-day ED visits. However, as ED utilization occurs regardless of whether a patient is discharged or admitted from the ED, we reported all ED visits in this analysis, similar to other studies.34 More delirium patients returned to the ED 30 days postdischarge than were ultimately readmitted to the hospital, and delirious patients were more likely to visit the ED or be readmitted than nondelirious patients. These observations point toward the first 30 days after discharge as a crucial period for these patients.
Our study features several strengths. To our knowledge, this study is one of the largest investigations of inpatients with delirium. One distinguishing feature was that all cases of delirium in this study were diagnosed by a psychiatrist, which is considered a gold standard. Many studies rely solely on brief nursing-administered surveys for delirium diagnosis. Using Kaiser Permanente data allowed for more complete follow-up of patients, including vital status. Kaiser Permanente is both a medical system and an insurer, resulting in acquisition of detailed health information from all hospitalizations where Kaiser Permanente insurance was used for each patient. Therefore, patients were only lost to follow-up following discharge in the event of a membership lapse; these patients were excluded from analysis. The obtained data are also more generalizable than those of other studies examining readmission rates in delirious patients as the hospital where these data were collected is a 116-bed general community medical and surgical hospital. Thus, the patients enrolled in this study covered multiple hospital services with a variety of admission diagnoses. This condition contrasts with much of the existing literature on inpatient delirium; these studies mostly center on specific medical conditions or surgeries and are often conducted at academic medical centers. At the same time, Kaiser Permanente is a unique health maintenance organization focused on preventive care, and readmission rates are possibly lower than elsewhere given the universal access to primary care for Kaiser Permanente members. Our results may not generalize to patients hospitalized in other health systems.
The diagnosis of delirium is a clinical diagnosis without biomarkers or radiographic markers and is also underdiagnosed and poorly coded.32 For these reasons, delirium can be challenging to study in large administrative databases or data derived from electronic medical records. We addressed this limitation by classifying the delirium patients only when they had been diagnosed by a staff psychiatrist. However, not all patients who screened positive with the CAM were evaluated by the staff psychiatrist during the study period. Thus, several CAM-positive patients who were not evaluated by psychiatry were included in the control population. This situation may cause bias toward identification of more severe cases of delirium. Although the physicians were encouraged to consult the psychiatry department for any patients who screened positive for delirium with the CAM, the psychiatrist may not have been involved if patients were managed without consultation. These patients may have exhibited less severe delirium or hypoactive delirium. In addition, the CAM fails to detect all delirious patients; interrater variability may occur with CAM administration, and non-English speaking patients are more likely to be excluded.35 These situations are another possible way for our control population to include some delirious patients and those patients with less severe or hypoactive subtypes. While this might bias toward the null hypothesis, it is also possible our results only indicate an association between more clinically apparent delirium and readmission. A major limitation of this study is that we were unable to quantify the number of cohort patients screened with the CAM or the results of screening, thus limiting our ability to quantify the impact of potential biases introduced by the screening program.
This study may have underestimated readmission rates. We defined readmissions as all hospitalizations at any Kaiser Permanente facility, or to an alternate facility where Kaiser Permanente insurance was used, within 30 days of discharge. We excluded the day of discharge or the following calendar day to avoid mischaracterizing transfers from the index hospital to another Kaiser Permanente facility as readmissions. This step was conducted to avoid biasing our comparison, as delirious patients are less frequently discharged home than nondelirious patients. Therefore, while the relative odds of readmission between delirious and nondelirious patients reported in this study should be generalizable to other community hospitals, the absolute readmission rates reported here may not be comparable to those reported in other studies.
Delirium may represent a marker of more severe illness or medical complications accrued during the hospitalization, which could lead to the associations observed in this study due to confounding.32 Patients with delirium are more likely to be admitted emergently, admitted to the ICU, and feature higher acuity conditions than patients without delirium. We attempted to mitigate this possibility by using a multivariable model to control for variables related to illness severity, including the Charlson comorbidity index, HCUP diagnostic categories, and ICU admission. Despite including HCUP diagnostic categories in our model, we were unable to capture the contribution of certain diseases with finer granularity, such as preexistent dementia, which may also affect clinical outcomes.36 Similarly, although we incorporated markers of illness severity into our model, we were unable to adjust for baseline functional status or frailty, which were not reliably recorded in the electronic medical record but are potential confounders when investigating clinical outcomes including hospital readmission.
We also lacked information regarding the duration of delirium in our cohort. Therefore, we were unable to test whether longer episodes of delirium were more predictive of readmission than shorter episodes.
CONCLUSION
In-hospital delirium is associated with several negative patient outcomes. Our study demonstrates that delirium predicts 30-day readmission and emergency department utilization after hospital discharge. Bearing in mind that a third of hospital-acquired delirium cases may be preventable,32 hospitals should prioritize interventions to reduce postdischarge healthcare utilization and complications in this particularly vulnerable group.
Acknowledgments
The authors would like to acknowledge Dr. Andrew L. Avins for his guidance with the initial development of this project and Julie Fourie for contributing data to the overall study.
Disclosures
Dr. Liu receives funding from NIH K23GM112018 and
Funding
This study was funded by Kaiser Permanente Graduate Medical Education, who approved the design, conduct, and reporting of this study.
1. Bidwell J. Interventions for preventing delirium in hospitalized non-ICU patients: A Cochrane review summary. Int J Nurs Stud. 2017;70:142-143. PubMed
2. Ryan DJ, O’Regan NA, Caoimh RÓ, et al. Delirium in an adult acute hospital population: predictors, prevalence and detection. BMJ Open. 2013;3(1):e001772. PubMed
3. McNicoll L, Pisani MA, Zhang Y, et al. Delirium in the intensive care unit: occurrence and clinical course in older patients. J Am Geriatr Soc. 2003;51(5):591-598. PubMed
4. Inouye SK. Predisposing and precipitating factors for delirium in hospitalized older patients. Dement Geriatr Cogn Disord. 1999;10(5):393-400. PubMed
5. Inouye SK, Zhang Y, Jones RN, et al. Risk factors for delirium at discharge: development and validation of a predictive model. Arch Intern Med. 2007;167(13):1406-1413. PubMed
6. LaHue SC, Liu VX. Loud and clear: sensory impairment, delirium, and functional recovery in critical illness. Am J Respir Crit Care Med. 2016;194(3):252-253. PubMed
7. Salluh JI, Soares M, Teles JM, et al. Delirium epidemiology in critical care (DECCA): an international study. Crit Care. 2010;14(6):R210. PubMed
8. Inouye SK, Charpentier PA. Precipitating factors for delirium in hospitalized elderly persons. Predictive model and interrelationship with baseline vulnerability. JAMA. 1996;275(11):852-857. PubMed
9. Ely EW, Shintani A, Truman B, et al. Delirium as a predictor of mortality in mechanically ventilated patients in the intensive care unit. JAMA. 2004;291(14):1753-1762. PubMed
10. Inouye SK, Westendorp RG, Saczynski JS. Delirium in elderly people. Lancet. 2014;383(9920):911-922. PubMed
11. Brown EG, Douglas VC. Moving beyond metabolic encephalopathy: an update on delirium prevention, workup, and management. Semin Neurol. 2015;35(6):646-655. PubMed
12. Francis J, Martin D, Kapoor WN. A prospective study of delirium in hospitalized elderly. JAMA. 1990;263(8):1097-1101. PubMed
13. McCusker J, Cole MG, Dendukuri N, Belzile E. Does delirium increase hospital stay? J Am Geriatr Soc. 2003;51(11):1539-1546. PubMed
14. Salluh JI, Wang H, Schneider EB, et al. Outcome of delirium in critically ill patients: systematic review and meta-analysis. BMJ. 2015;350:h2538. PubMed
15. Abelha FJ, Luís C, Veiga D, et al. Outcome and quality of life in patients with postoperative delirium during an ICU stay following major surgery. Crit Care. 2013;17(5):R257. PubMed
16. Siddiqi N, House AO, Holmes JD. Occurrence and outcome of delirium in medical in-patients: a systematic literature review. Age Ageing. 2006;35(4):350-364. PubMed
17. Witlox J, Eurelings LS, de Jonghe JF, et al. Delirium in elderly patients and the risk of postdischarge mortality, institutionalization, and dementia: a meta-analysis. JAMA. 2010;304(4):443-451. PubMed
18. Inouye SK, Rushing JT, Foreman MD, Palmer RM, Pompei P. Does delirium contribute to poor hospital outcomes? A three-site epidemiologic study. J Gen Intern Med. 1998;13(4):234-242. PubMed
19. Freter S, Koller K, Dunbar M, MacKnight C, Rockwood K. Translating delirium prevention strategies for elderly adults with hip fracture into routine clinical care: A pragmatic clinical trial. J Am Geriatr Soc. 2017;65(3):567-573. PubMed
20. Fong TG, Jones RN, Shi P, et al. Delirium accelerates cognitive decline in Alzheimer disease. Neurology. 2009;72(18):1570-1575. PubMed
21. Girard TD, Jackson JC, Pandharipande PP, et al. Delirium as a predictor of long-term cognitive impairment in survivors of critical illness. Crit Care Med. 2010;38(7):1513-1520. PubMed
22. Berenson RA, Paulus RA, Kalman NS. Medicare’s readmissions-reduction program—a positive alternative. N Engl J Med. 2012;366(15):1364-1366. PubMed
23. Desai NR, Ross JS, Kwon JY, et al. Association between hospital penalty status under the hospital readmission reduction program and readmission rates for target and nontarget conditions. JAMA. 2016;316(24):2647-2656. PubMed
24. Elsamadicy AA, Wang TY, Back AG, et al. Post-operative delirium is an independent predictor of 30-day hospital readmission after spine surgery in the elderly (≥65years old): a study of 453 consecutive elderly spine surgery patients. J Clin Neurosci. 2017;41:128-131. PubMed
25. Inouye SK, van Dyck CH, Alessi CA, et al. Clarifying confusion: the confusion assessment method. A new method for detection of delirium. Ann Intern Med. 1990;113(12):941-948. PubMed
26. Inouye SK, Leo-Summers L, Zhang Y, et al. A chart-based method for identification of delirium: validation compared with interviewer ratings using the confusion assessment method. J Am Geriatr Soc. 2005;53(2):312-318. PubMed
27. Charlson M, Szatrowski TP, Peterson J, Gold J. Validation of a combined comorbidity index. J Clin Epidemiol. 1994;47(11):1245-1251. PubMed
28. Escobar GJ, Gardner MN, Greene JD, Draper D, Kipnis P. Risk-adjusting hospital mortality using a comprehensive electronic record in an integrated health care delivery system. Med Care. 2013;51(5):446-453. PubMed
29. Steiner C, Elixhauser A, Schnaier J. The healthcare cost and utilization project: an overview. Eff Clin Pract. 2002;5(3):143-151. PubMed
30. Lawlor PG, Bush SH. Delirium diagnosis, screening and management. Curr Opin Support Palliat Care. 2014;8(3):286-295. PubMed
31. Jencks SF, Williams MV, Coleman EA. Rehospitalizations among patients in the Medicare fee-for-service program. N Engl J Med. 2009;360(14):1418-1428. PubMed
32. Fong TG, Tulebaev SR, Inouye SK. Delirium in elderly adults: diagnosis, prevention and treatment. Nat Rev Neurol. 2009;5(4):210-220. PubMed
33. Leyenaar JK, Lagu T, Lindenauer PK. Direct admission to the hospital: an alternative approach to hospitalization. J Hosp Med. 2016;11(4):303-305. PubMed
34. Wang CL, Ding ST, Hsieh MJ, et al. Factors associated with emergency department visit within 30 days after discharge. BMC Health Serv Res. 2016;16:190. PubMed
35. Shi Q, Warren L, Saposnik G, Macdermid JC. Confusion assessment method: a systematic review and meta-analysis of diagnostic accuracy. Neuropsychiatr Dis Treat. 2013;9:1359-1370. PubMed
36. Fick DM, Agostini JV, Inouye SK. Delirium superimposed on dementia: a systematic review. J Am Geriatr Soc. 2002;50(10):1723-1732. PubMed
© 2019 Society of Hospital Medicine
State of Research in Adult Hospital Medicine: Results of a National Survey
Almost all specialties in internal medicine have a sound scientific research base through which clinical practice is informed.1 For the field of Hospital Medicine (HM), this evidence has largely comprised research generated from fields outside of the specialty. The need to develop, invest, and grow investigators in hospital-based medicine remains unmet as HM and its footprint in hospital systems continue to grow.2,3
Despite this fact, little is known about the current state of research in HM. A 2014 survey of the members of the Society of Hospital Medicine (SHM) found that research output across the field of HM, as measured on the basis of peer-reviewed publications, was growing.4 Since then, however, the numbers of individuals engaged in research activities, their background and training, publication output, or funding sources have not been quantified. Similarly, little is known about which institutions support the development of junior investigators (ie, HM research fellowships), how these programs are funded, and whether or not matriculants enter the field as investigators. These gaps must be measured, evaluated, and ideally addressed through strategic policy and funding initiatives to advance the state of science within HM.
Members of the SHM Research Committee developed, designed, and deployed a survey to improve the understanding of the state of research in HM. In this study, we aimed to establish the baseline of research in HM to enable the measurement of progress through periodic waves of data collection. Specifically, we sought to quantify and describe the characteristics of existing research programs, the sources and types of funding, the number and background of faculty, and the availability of resources for training researchers in HM.
METHODS
Study Setting and Participants
Given that no defined list, database, or external resource that identifies research programs and contacts in HM exists, we began by creating a strategy to identify and sample adult
Survey Development
A workgroup within the SHM Research Committee was tasked to create a survey that would achieve four distinct goals: (1) identify institutions currently engaging in hospital-based research; (2) define the characteristics, including sources of research funding, training opportunities, criteria for promotion, and grant support, of research programs within institutions; (3) understand the prevalence of research fellowship programs, including size, training curricula, and funding sources; and (4) evaluate the productivity and funding sources of HM investigators at each site.
Survey questions that target each of these domains were drafted by the workgroup. Questions were pretested with colleagues outside the workgroup focused on this project (ie, from the main research committee). The instrument was refined and edited to improve the readability and clarity of questions on the basis of the feedback obtained through the iterative process. The revised instrument was then programmed into an online survey administration tool (SurveyMonkey®) to facilitate electronic dissemination. Finally, the members of the workgroup tested the online survey to ensure functionality. No identifiable information was collected from respondents, and no monetary incentive was offered for the completion of the survey. An invitation to participate in the survey was sent via e-mail to each of the program contacts identified.
Statistical Analysis
Descriptive statistics, including proportions, means, and percentages, were used to tabulate results. All analyses were conducted using Stata 13 MP/SE (StataCorp, College Station, Texas).
Ethical and Regulatory Considerations
The study was reviewed and deemed exempt from regulation by the University of Michigan Institutional Review Board (HUM000138628).
RESULTS
General Characteristics of Research Programs and Faculty
Out of 100 program contacts, 28 (representing 1,586 faculty members) responded and were included in the survey (program response rate = 28%). When comparing programs that did respond with those that did not, a greater proportion of programs in university settings were noted among respondents (79% vs 21%). Respondents represented programs from all regions of the United States, with most representing university-based (79%), university-affiliated (14%) or Veterans Health Administration (VHA; 11%) programs. Most respondents were in leadership roles, including division chiefs (32%), research directors/leads (21%), section chiefs (18%), and related titles, such as program director. Respondents indicated that the total number of faculty members in their programs (including nonclinicians and advance practice providers) varied from eight to 152 (mean [SD] = 57 [36]) members, with physicians representing the majority of faculty members (Table 1).
Among the 1,586 faculty members within the 28 programs, respondents identified 192 faculty members (12%) as currently receiving extra- or intramural support for research activities. Of these faculty, over half (58%) received <25% of effort from intra or extramural sources, and 28 (15%) and 52 (27%) faculty members received 25%-50% or >50% of support for their effort, respectively. The number of investigators who received funding across programs ranged from 0 to 28 faculty members. Compared with the 192 funded investigators, respondents indicated that a larger number of faculty in their programs (n = 656 or 41%) were involved in local quality improvement (QI) efforts. Of the 656 faculty members involved in QI efforts, 241 individuals (37%) were internally funded and received protected time/effort for their work.
Key Attributes of Research Programs
In the evaluation of the amount of total grant funding, respondents from 17 programs indicated that they received $500,000 in annual extra and intramural funding, and those from three programs stated that they received $500,000 to $999,999 in funding. Five respondents indicated that their programs currently received $1 million to $5 million in grant funding, and three reported >$5 million in research support. The sources of research funding included several divisions within the National Institute of Health (NIH, 12 programs), Agency for Healthcare Research and Quality (AHRQ, four programs), foundations (four programs), and internal grants (six programs). Additionally, six programs indicated “other” sources of funding that included the VHA, Patient-Centered Outcomes Research Institute (PCORI), Centers for Medicare and Medicaid Services, Centers for Disease Control (CDC), and industry sources.
A range of grants, including career development awards (11 programs); small grants, such as R21 and R03s (eight programs); R-level grants, including VA merit awards (five programs); program series grants, such as P and U grants (five programs), and foundation grants (eight programs), were reported as types of awards. Respondents from 16 programs indicated that they provided internal pilot grants. Amounts for such grants ranged from <$50,000 (14 programs) to $50,000-$100,000 (two programs).
Research Fellowship Programs/Training Programs
Only five of the 28 surveyed programs indicated that they currently had a research training or fellowship program for developing hospitalist investigators. The age of these programs varied from <1 year to 10 years. Three of the five programs stated that they had two fellows per year, and two stated they had spots for one trainee annually. All respondents indicated that fellows received training on study design, research methods, quantitative (eg, large database and secondary analyses) and qualitative data analysis. In addition, two programs included training in systematic review and meta-analyses, and three included focused courses on healthcare policy. Four of the five programs included training in QI tools, such as LEAN and Six Sigma. Funding for four of the five fellowship programs came from internal sources (eg, department and CTSA). However, two programs added they received some support from extramural funding and philanthropy. Following training, respondents from programs indicated that the majority of their graduates (60%) went on to hybrid research/QI roles (50/50 research/clinical effort), whereas 40% obtained dedicated research investigator (80/20) positions (Table 2).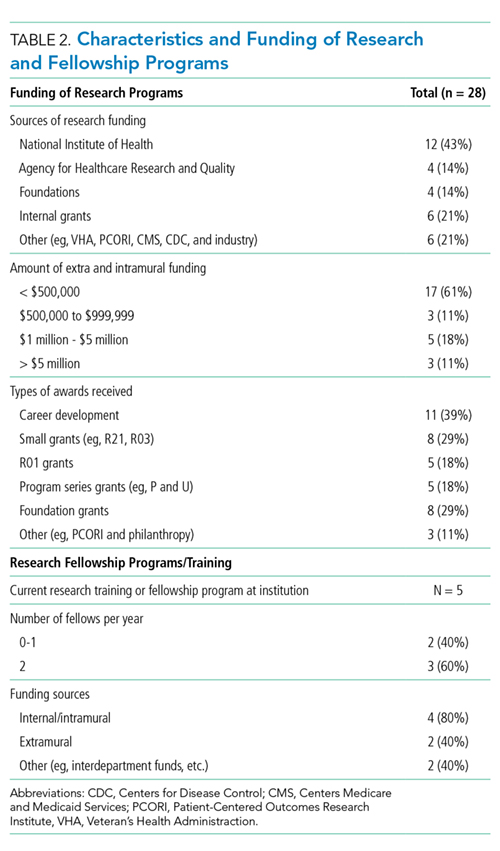
The 23 institutions without research training programs cited that the most important barrier for establishing such programs was lack of funding (12 programs) and the lack of a pipeline of hospitalists seeking such training (six programs). However, 15 programs indicated that opportunities for hospitalists to gain research training in the form of courses were available internally (eg, courses in the department or medical school) or externally (eg, School of Public Health). Seven programs indicated that they were planning to start a HM research fellowship within the next five years.
Research Faculty
Among the 28 respondents, 15 stated that they have faculty members who conduct research as their main professional activity (ie, >50% effort). The number of faculty members in each program in such roles varied from one to 10. Respondents indicated that faculty members in this category were most often midcareer assistant or associate professors with few full professors. All programs indicated that scholarship in the form of peer-reviewed publications was required for the promotion of faculty. Faculty members who performed research as their main activity had all received formal fellowship training and consequently had dual degrees (MD with MPH or MD, with MSc being the two most common combinations). With respect to clinical activities, most respondents indicated that research faculty spent 10% to 49% of their effort on clinical work. However, five respondents indicated that research faculty had <10% effort on clinical duties (Table 3).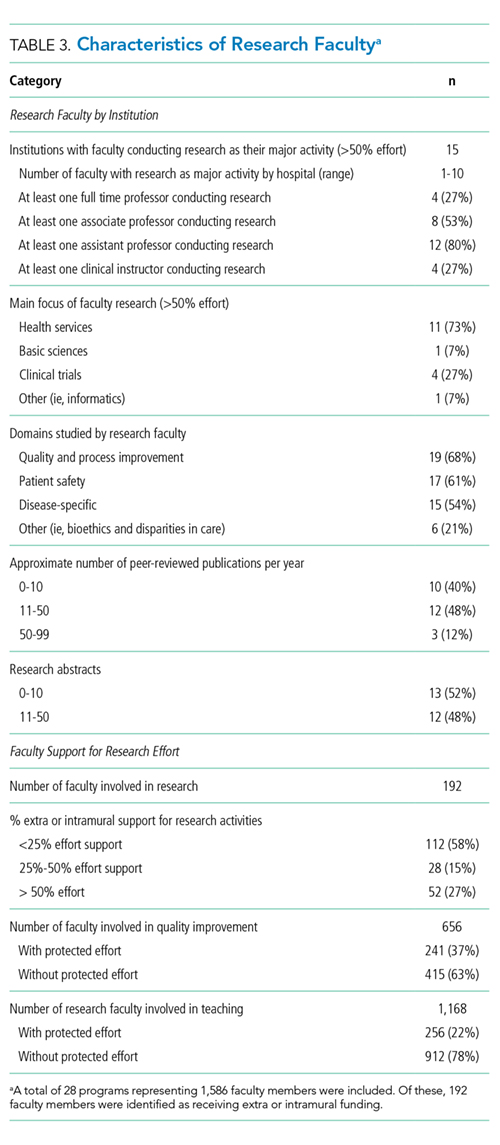
Eleven respondents (39%) identified the main focus of faculty as health service research, where four (14%) identified their main focus as clinical trials. Regardless of funding status, all respondents stated that their faculty were interested in studying quality and process improvement efforts (eg, transitions or readmissions, n = 19), patient safety initiatives (eg, hospital-acquired complications, n = 17), and disease-specific areas (eg, thrombosis, n = 15).
In terms of research output, 12 respondents stated that their research/QI faculty collectively published 11-50 peer-reviewed papers during the academic year, and 10 programs indicated that their faculty published 0-10 papers per year. Only three programs reported that their faculty collectively published 50-99 peer-reviewed papers per year. With respect to abstract presentations at national conferences, 13 programs indicated that they presented 0-10 abstracts, and 12 indicated that they presented 11-50.
DISCUSSION
In this first survey quantifying research activities in HM, respondents from 28 programs shared important insights into research activities at their institutions. Although our sample size was small, substantial variation in the size, composition, and structure of research programs in HM among respondents was observed. For example, few respondents indicated the availability of training programs for research in HM at their institutions. Similarly, among faculty who focused mainly on research, variation in funding streams and effort protection was observed. A preponderance of midcareer faculty with a range of funding sources, including NIH, AHRQ, VHA, CMS, and CDC was reported. Collectively, these data not only provide a unique glimpse into the state of research in HM but also help establish a baseline of the status of the field at large.
Some findings of our study are intuitive given our sampling strategy and the types of programs that responded. For example, the fact that most respondents for research programs represented university-based or affiliated institutions is expected given the tripartite academic mission. However, even within our sample of highly motivated programs, some findings are surprising and merit further exploration. For example, the observation that some respondents identified HM investigators within their program with <25% in intra- or extramural funding was unexpected. On the other extreme, we were surprised to find that three programs reported >$5 million in research funding. Understanding whether specific factors, such as the availability of experienced mentors within and outside departments or assistance from support staff (eg, statisticians and project managers), are associated with success and funding within these programs are important questions to answer. By focusing on these issues, we will be well poised as a field to understand what works, what does not work, and why.
Likewise, the finding that few programs within our sample offer formal training in the form of fellowships to research investigators represents an improvement opportunity. A pipeline for growing investigators is critical for the specialty that is HM. Notably, this call is not new; rather, previous investigators have highlighted the importance of developing academically oriented hospitalists for the future of the field.5 The implementation of faculty scholarship development programs has improved the scholarly output, mentoring activities, and succession planning of academics within HM.6,7 Conversely, lack of adequate mentorship and support for academic activities remains a challenge and as a factor associated with the failure to produce academic work.8 Without a cadre of investigators asking critical questions related to care delivery, the legitimacy of our field may be threatened.
While extrapolating to the field is difficult given the small number of our respondents, highlighting the progress that has been made is important. For example, while misalignment between funding and clinical and research mission persists, our survey found that several programs have been successful in securing extramural funding for their investigators. Additionally, internal funding for QI work appears to be increasing, with hospitalists receiving dedicated effort for much of this work. Innovation in how best to support and develop these types of efforts have also emerged. For example, the University of Michigan Specialist Hospitalist Allied Research Program offers dedicated effort and funding for hospitalists tackling projects germane to HM (eg, ordering of blood cultures for febrile inpatients) that overlap with subspecialists (eg, infectious diseases).9 Thus, hospitalists are linked with other specialties in the development of research agendas and academic products. Similarly, the launch of the HOMERUN network, a coalition of investigators who bridge health systems to study problems central to HM, has helped usher in a new era of research opportunities in the specialty.10 Fundamentally, the culture of HM has begun to place an emphasis on academic and scholarly productivity in addition to clinical prowess.11-13 Increased support and funding for training programs geared toward innovation and research in HM is needed to continue this mission. The Society for General Internal Medicine, American College of Physicians, and SHM have important roles to play as the largest professional organizations for generalists in this respect. Support for research, QI, and investigators in HM remains an urgent and largely unmet need.
Our study has limitations. First, our response rate was low at 28% but is consistent with the response rates of other surveys of physician groups.14 Caution in making inferences to the field at large is necessary given the potential for selection and nonresponse bias. However, we expect that respondents are likely biased toward programs actively conducting research and engaged in QI, thus better reflecting the state of these activities in HM. Second, given that we did not ask for any identifying information, we have no way of establishing the accuracy of the data provided by respondents. However, we have no reason to believe that responses would be altered in a systematic fashion. Future studies that link our findings to publicly available data (eg, databases of active grants and funding) might be useful. Third, while our survey instrument was created and internally validated by hospitalist researchers, its lack of external validation could limit findings. Finally, our results vary on the basis of how respondents answered questions related to effort and time allocation given that these measures differ across programs.
In summary, the findings from this study highlight substantial variations in the number, training, and funding of research faculty across HM programs. Understanding the factors behind the success of some programs and the failures of others appears important in informing and growing the research in the field. Future studies that aim to expand survey participation, raise the awareness of the state of research in HM, and identify barriers and facilitators to academic success in HM are needed.
Disclosures
Dr. Chopra discloses grant funding from the Agency for Healthcare Research and Quality (AHRQ), VA Health Services and Research Department, and Centers for Disease Control. Dr. Jones discloses grant funding from AHRQ. All other authors disclose no conflicts of interest.
1. International Working Party to Promote and Revitalise Academic Medicine. Academic medicine: the evidence base. BMJ. 2004;329(7469):789-792. PubMed
2. Flanders SA, Saint S, McMahon LF, Howell JD. Where should hospitalists sit within the academic medical center? J Gen Intern Med. 2008;23(8):1269-1272. PubMed
3. Flanders SA, Centor B, Weber V, McGinn T, Desalvo K, Auerbach A. Challenges and opportunities in academic hospital medicine: report from the academic hospital medicine summit. J Gen Intern Med. 2009;24(5):636-641. PubMed
4. Dang Do AN, Munchhof AM, Terry C, Emmett T, Kara A. Research and publication trends in hospital medicine. J Hosp Med. 2014;9(3):148-154. PubMed
5. Harrison R, Hunter AJ, Sharpe B, Auerbach AD. Survey of US academic hospitalist leaders about mentorship and academic activities in hospitalist groups. J Hosp Med. 2011;6(1):5-9. PubMed
6. Sehgal NL, Sharpe BA, Auerbach AA, Wachter RM. Investing in the future: building an academic hospitalist faculty development program. J Hosp Med. 2011;6(3):161-166. PubMed
7. Nagarur A, O’Neill RM, Lawton D, Greenwald JL. Supporting faculty development in hospital medicine: design and implementation of a personalized structured mentoring program. J Hosp Med. 2018;13(2):96-99. PubMed
8. Reid MB, Misky GJ, Harrison RA, Sharpe B, Auerbach A, Glasheen JJ. Mentorship, productivity, and promotion among academic hospitalists. J Gen Intern Med. 2012;27(1):23-27. PubMed
9. Flanders SA, Kaufman SR, Nallamothu BK, Saint S. The University of Michigan Specialist-Hospitalist Allied Research Program: jumpstarting hospital medicine research. J Hosp Med. 2008;3(4):308-313. PubMed
10. Auerbach AD, Patel MS, Metlay JP, et al. The Hospital Medicine Reengineering Network (HOMERuN): a learning organization focused on improving hospital care. Acad Med. 2014;89(3):415-420. PubMed
11. Souba WW. Academic medicine’s core values: what do they mean? J Surg Res. 2003;115(2):171-173. PubMed
12. Bonsall J, Chopra V. Building an academic pipeline: a combined society of hospital medicine committee initiative. J Hosp Med. 2016;11(10):735-736. PubMed
13. Sweigart JR, Tad YD, Kneeland P, Williams MV, Glasheen JJ. Hospital medicine resident training tracks: developing the hospital medicine pipeline. J Hosp Med. 2017;12(3):173-176. PubMed
14. Cunningham CT, Quan H, Hemmelgarn B, et al. Exploring physician specialist response rates to web-based surveys. BMC Med Res Methodol. 2015;15(1):32. PubMed
Almost all specialties in internal medicine have a sound scientific research base through which clinical practice is informed.1 For the field of Hospital Medicine (HM), this evidence has largely comprised research generated from fields outside of the specialty. The need to develop, invest, and grow investigators in hospital-based medicine remains unmet as HM and its footprint in hospital systems continue to grow.2,3
Despite this fact, little is known about the current state of research in HM. A 2014 survey of the members of the Society of Hospital Medicine (SHM) found that research output across the field of HM, as measured on the basis of peer-reviewed publications, was growing.4 Since then, however, the numbers of individuals engaged in research activities, their background and training, publication output, or funding sources have not been quantified. Similarly, little is known about which institutions support the development of junior investigators (ie, HM research fellowships), how these programs are funded, and whether or not matriculants enter the field as investigators. These gaps must be measured, evaluated, and ideally addressed through strategic policy and funding initiatives to advance the state of science within HM.
Members of the SHM Research Committee developed, designed, and deployed a survey to improve the understanding of the state of research in HM. In this study, we aimed to establish the baseline of research in HM to enable the measurement of progress through periodic waves of data collection. Specifically, we sought to quantify and describe the characteristics of existing research programs, the sources and types of funding, the number and background of faculty, and the availability of resources for training researchers in HM.
METHODS
Study Setting and Participants
Given that no defined list, database, or external resource that identifies research programs and contacts in HM exists, we began by creating a strategy to identify and sample adult
Survey Development
A workgroup within the SHM Research Committee was tasked to create a survey that would achieve four distinct goals: (1) identify institutions currently engaging in hospital-based research; (2) define the characteristics, including sources of research funding, training opportunities, criteria for promotion, and grant support, of research programs within institutions; (3) understand the prevalence of research fellowship programs, including size, training curricula, and funding sources; and (4) evaluate the productivity and funding sources of HM investigators at each site.
Survey questions that target each of these domains were drafted by the workgroup. Questions were pretested with colleagues outside the workgroup focused on this project (ie, from the main research committee). The instrument was refined and edited to improve the readability and clarity of questions on the basis of the feedback obtained through the iterative process. The revised instrument was then programmed into an online survey administration tool (SurveyMonkey®) to facilitate electronic dissemination. Finally, the members of the workgroup tested the online survey to ensure functionality. No identifiable information was collected from respondents, and no monetary incentive was offered for the completion of the survey. An invitation to participate in the survey was sent via e-mail to each of the program contacts identified.
Statistical Analysis
Descriptive statistics, including proportions, means, and percentages, were used to tabulate results. All analyses were conducted using Stata 13 MP/SE (StataCorp, College Station, Texas).
Ethical and Regulatory Considerations
The study was reviewed and deemed exempt from regulation by the University of Michigan Institutional Review Board (HUM000138628).
RESULTS
General Characteristics of Research Programs and Faculty
Out of 100 program contacts, 28 (representing 1,586 faculty members) responded and were included in the survey (program response rate = 28%). When comparing programs that did respond with those that did not, a greater proportion of programs in university settings were noted among respondents (79% vs 21%). Respondents represented programs from all regions of the United States, with most representing university-based (79%), university-affiliated (14%) or Veterans Health Administration (VHA; 11%) programs. Most respondents were in leadership roles, including division chiefs (32%), research directors/leads (21%), section chiefs (18%), and related titles, such as program director. Respondents indicated that the total number of faculty members in their programs (including nonclinicians and advance practice providers) varied from eight to 152 (mean [SD] = 57 [36]) members, with physicians representing the majority of faculty members (Table 1).
Among the 1,586 faculty members within the 28 programs, respondents identified 192 faculty members (12%) as currently receiving extra- or intramural support for research activities. Of these faculty, over half (58%) received <25% of effort from intra or extramural sources, and 28 (15%) and 52 (27%) faculty members received 25%-50% or >50% of support for their effort, respectively. The number of investigators who received funding across programs ranged from 0 to 28 faculty members. Compared with the 192 funded investigators, respondents indicated that a larger number of faculty in their programs (n = 656 or 41%) were involved in local quality improvement (QI) efforts. Of the 656 faculty members involved in QI efforts, 241 individuals (37%) were internally funded and received protected time/effort for their work.
Key Attributes of Research Programs
In the evaluation of the amount of total grant funding, respondents from 17 programs indicated that they received $500,000 in annual extra and intramural funding, and those from three programs stated that they received $500,000 to $999,999 in funding. Five respondents indicated that their programs currently received $1 million to $5 million in grant funding, and three reported >$5 million in research support. The sources of research funding included several divisions within the National Institute of Health (NIH, 12 programs), Agency for Healthcare Research and Quality (AHRQ, four programs), foundations (four programs), and internal grants (six programs). Additionally, six programs indicated “other” sources of funding that included the VHA, Patient-Centered Outcomes Research Institute (PCORI), Centers for Medicare and Medicaid Services, Centers for Disease Control (CDC), and industry sources.
A range of grants, including career development awards (11 programs); small grants, such as R21 and R03s (eight programs); R-level grants, including VA merit awards (five programs); program series grants, such as P and U grants (five programs), and foundation grants (eight programs), were reported as types of awards. Respondents from 16 programs indicated that they provided internal pilot grants. Amounts for such grants ranged from <$50,000 (14 programs) to $50,000-$100,000 (two programs).
Research Fellowship Programs/Training Programs
Only five of the 28 surveyed programs indicated that they currently had a research training or fellowship program for developing hospitalist investigators. The age of these programs varied from <1 year to 10 years. Three of the five programs stated that they had two fellows per year, and two stated they had spots for one trainee annually. All respondents indicated that fellows received training on study design, research methods, quantitative (eg, large database and secondary analyses) and qualitative data analysis. In addition, two programs included training in systematic review and meta-analyses, and three included focused courses on healthcare policy. Four of the five programs included training in QI tools, such as LEAN and Six Sigma. Funding for four of the five fellowship programs came from internal sources (eg, department and CTSA). However, two programs added they received some support from extramural funding and philanthropy. Following training, respondents from programs indicated that the majority of their graduates (60%) went on to hybrid research/QI roles (50/50 research/clinical effort), whereas 40% obtained dedicated research investigator (80/20) positions (Table 2).
The 23 institutions without research training programs cited that the most important barrier for establishing such programs was lack of funding (12 programs) and the lack of a pipeline of hospitalists seeking such training (six programs). However, 15 programs indicated that opportunities for hospitalists to gain research training in the form of courses were available internally (eg, courses in the department or medical school) or externally (eg, School of Public Health). Seven programs indicated that they were planning to start a HM research fellowship within the next five years.
Research Faculty
Among the 28 respondents, 15 stated that they have faculty members who conduct research as their main professional activity (ie, >50% effort). The number of faculty members in each program in such roles varied from one to 10. Respondents indicated that faculty members in this category were most often midcareer assistant or associate professors with few full professors. All programs indicated that scholarship in the form of peer-reviewed publications was required for the promotion of faculty. Faculty members who performed research as their main activity had all received formal fellowship training and consequently had dual degrees (MD with MPH or MD, with MSc being the two most common combinations). With respect to clinical activities, most respondents indicated that research faculty spent 10% to 49% of their effort on clinical work. However, five respondents indicated that research faculty had <10% effort on clinical duties (Table 3).
Eleven respondents (39%) identified the main focus of faculty as health service research, where four (14%) identified their main focus as clinical trials. Regardless of funding status, all respondents stated that their faculty were interested in studying quality and process improvement efforts (eg, transitions or readmissions, n = 19), patient safety initiatives (eg, hospital-acquired complications, n = 17), and disease-specific areas (eg, thrombosis, n = 15).
In terms of research output, 12 respondents stated that their research/QI faculty collectively published 11-50 peer-reviewed papers during the academic year, and 10 programs indicated that their faculty published 0-10 papers per year. Only three programs reported that their faculty collectively published 50-99 peer-reviewed papers per year. With respect to abstract presentations at national conferences, 13 programs indicated that they presented 0-10 abstracts, and 12 indicated that they presented 11-50.
DISCUSSION
In this first survey quantifying research activities in HM, respondents from 28 programs shared important insights into research activities at their institutions. Although our sample size was small, substantial variation in the size, composition, and structure of research programs in HM among respondents was observed. For example, few respondents indicated the availability of training programs for research in HM at their institutions. Similarly, among faculty who focused mainly on research, variation in funding streams and effort protection was observed. A preponderance of midcareer faculty with a range of funding sources, including NIH, AHRQ, VHA, CMS, and CDC was reported. Collectively, these data not only provide a unique glimpse into the state of research in HM but also help establish a baseline of the status of the field at large.
Some findings of our study are intuitive given our sampling strategy and the types of programs that responded. For example, the fact that most respondents for research programs represented university-based or affiliated institutions is expected given the tripartite academic mission. However, even within our sample of highly motivated programs, some findings are surprising and merit further exploration. For example, the observation that some respondents identified HM investigators within their program with <25% in intra- or extramural funding was unexpected. On the other extreme, we were surprised to find that three programs reported >$5 million in research funding. Understanding whether specific factors, such as the availability of experienced mentors within and outside departments or assistance from support staff (eg, statisticians and project managers), are associated with success and funding within these programs are important questions to answer. By focusing on these issues, we will be well poised as a field to understand what works, what does not work, and why.
Likewise, the finding that few programs within our sample offer formal training in the form of fellowships to research investigators represents an improvement opportunity. A pipeline for growing investigators is critical for the specialty that is HM. Notably, this call is not new; rather, previous investigators have highlighted the importance of developing academically oriented hospitalists for the future of the field.5 The implementation of faculty scholarship development programs has improved the scholarly output, mentoring activities, and succession planning of academics within HM.6,7 Conversely, lack of adequate mentorship and support for academic activities remains a challenge and as a factor associated with the failure to produce academic work.8 Without a cadre of investigators asking critical questions related to care delivery, the legitimacy of our field may be threatened.
While extrapolating to the field is difficult given the small number of our respondents, highlighting the progress that has been made is important. For example, while misalignment between funding and clinical and research mission persists, our survey found that several programs have been successful in securing extramural funding for their investigators. Additionally, internal funding for QI work appears to be increasing, with hospitalists receiving dedicated effort for much of this work. Innovation in how best to support and develop these types of efforts have also emerged. For example, the University of Michigan Specialist Hospitalist Allied Research Program offers dedicated effort and funding for hospitalists tackling projects germane to HM (eg, ordering of blood cultures for febrile inpatients) that overlap with subspecialists (eg, infectious diseases).9 Thus, hospitalists are linked with other specialties in the development of research agendas and academic products. Similarly, the launch of the HOMERUN network, a coalition of investigators who bridge health systems to study problems central to HM, has helped usher in a new era of research opportunities in the specialty.10 Fundamentally, the culture of HM has begun to place an emphasis on academic and scholarly productivity in addition to clinical prowess.11-13 Increased support and funding for training programs geared toward innovation and research in HM is needed to continue this mission. The Society for General Internal Medicine, American College of Physicians, and SHM have important roles to play as the largest professional organizations for generalists in this respect. Support for research, QI, and investigators in HM remains an urgent and largely unmet need.
Our study has limitations. First, our response rate was low at 28% but is consistent with the response rates of other surveys of physician groups.14 Caution in making inferences to the field at large is necessary given the potential for selection and nonresponse bias. However, we expect that respondents are likely biased toward programs actively conducting research and engaged in QI, thus better reflecting the state of these activities in HM. Second, given that we did not ask for any identifying information, we have no way of establishing the accuracy of the data provided by respondents. However, we have no reason to believe that responses would be altered in a systematic fashion. Future studies that link our findings to publicly available data (eg, databases of active grants and funding) might be useful. Third, while our survey instrument was created and internally validated by hospitalist researchers, its lack of external validation could limit findings. Finally, our results vary on the basis of how respondents answered questions related to effort and time allocation given that these measures differ across programs.
In summary, the findings from this study highlight substantial variations in the number, training, and funding of research faculty across HM programs. Understanding the factors behind the success of some programs and the failures of others appears important in informing and growing the research in the field. Future studies that aim to expand survey participation, raise the awareness of the state of research in HM, and identify barriers and facilitators to academic success in HM are needed.
Disclosures
Dr. Chopra discloses grant funding from the Agency for Healthcare Research and Quality (AHRQ), VA Health Services and Research Department, and Centers for Disease Control. Dr. Jones discloses grant funding from AHRQ. All other authors disclose no conflicts of interest.
1. International Working Party to Promote and Revitalise Academic Medicine. Academic medicine: the evidence base. BMJ. 2004;329(7469):789-792. PubMed
2. Flanders SA, Saint S, McMahon LF, Howell JD. Where should hospitalists sit within the academic medical center? J Gen Intern Med. 2008;23(8):1269-1272. PubMed
3. Flanders SA, Centor B, Weber V, McGinn T, Desalvo K, Auerbach A. Challenges and opportunities in academic hospital medicine: report from the academic hospital medicine summit. J Gen Intern Med. 2009;24(5):636-641. PubMed
4. Dang Do AN, Munchhof AM, Terry C, Emmett T, Kara A. Research and publication trends in hospital medicine. J Hosp Med. 2014;9(3):148-154. PubMed
5. Harrison R, Hunter AJ, Sharpe B, Auerbach AD. Survey of US academic hospitalist leaders about mentorship and academic activities in hospitalist groups. J Hosp Med. 2011;6(1):5-9. PubMed
6. Sehgal NL, Sharpe BA, Auerbach AA, Wachter RM. Investing in the future: building an academic hospitalist faculty development program. J Hosp Med. 2011;6(3):161-166. PubMed
7. Nagarur A, O’Neill RM, Lawton D, Greenwald JL. Supporting faculty development in hospital medicine: design and implementation of a personalized structured mentoring program. J Hosp Med. 2018;13(2):96-99. PubMed
8. Reid MB, Misky GJ, Harrison RA, Sharpe B, Auerbach A, Glasheen JJ. Mentorship, productivity, and promotion among academic hospitalists. J Gen Intern Med. 2012;27(1):23-27. PubMed
9. Flanders SA, Kaufman SR, Nallamothu BK, Saint S. The University of Michigan Specialist-Hospitalist Allied Research Program: jumpstarting hospital medicine research. J Hosp Med. 2008;3(4):308-313. PubMed
10. Auerbach AD, Patel MS, Metlay JP, et al. The Hospital Medicine Reengineering Network (HOMERuN): a learning organization focused on improving hospital care. Acad Med. 2014;89(3):415-420. PubMed
11. Souba WW. Academic medicine’s core values: what do they mean? J Surg Res. 2003;115(2):171-173. PubMed
12. Bonsall J, Chopra V. Building an academic pipeline: a combined society of hospital medicine committee initiative. J Hosp Med. 2016;11(10):735-736. PubMed
13. Sweigart JR, Tad YD, Kneeland P, Williams MV, Glasheen JJ. Hospital medicine resident training tracks: developing the hospital medicine pipeline. J Hosp Med. 2017;12(3):173-176. PubMed
14. Cunningham CT, Quan H, Hemmelgarn B, et al. Exploring physician specialist response rates to web-based surveys. BMC Med Res Methodol. 2015;15(1):32. PubMed
© 2019 Society of Hospital Medicine
Home Smoke Exposure and Health-Related Quality of Life in Children with Acute Respiratory Illness
Acute respiratory illnesses (ARIs), including acute exacerbations of asthma, croup, pneumonia, and bronchiolitis, are among the most common illnesses in childhood.1 Although most ARIs can be managed in the outpatient setting,
Exposure to secondhand smoke (SHS) is a preventable risk factor for ARI in children, particularly when there is regular exposure in the home.2 Chronic exposure to SHS impacts systemic inflammation by suppressing serum interferon-gamma,3 which can lead to increased susceptibility to viral and bacterial infections,4 and increasing Th2 (atopic) cytokine expression, which is associated with asthma.5 SHS exposure in children has also been linked to diminished lung function.6 As a result, SHS exposure is associated with increased ARI susceptibility and severity in children.7-10
Much research has focused on the clinical impact of SHS exposure on respiratory health in children, but little is known about the impact on patient-reported outcomes, such as health-related quality of life (HRQOL). Patient-reported outcomes help provide a comprehensive evaluation of the effectiveness of healthcare delivery systems. These outcomes are increasingly used by health service researchers to better understand patient and caregiver perspectives.11 Given the known associations between SHS exposure and ARI morbidity, we postulated that regular SHS exposure would also impact HRQOL in children. In this study, we assessed the relationship between SHS exposure and HRQOL within a large, multicenter, prospective cohort of children presenting to the emergency department (ED) and/or hospital with ARI.
METHODS
Study Population
This study was nested within the Pediatric Respiratory Illness Measurement System (PRIMES) study, a prospective cohort study of children with ARI in the ED and inpatient settings at five tertiary care children’s hospitals within the Pediatric Research in Inpatient Settings Network in Colorado, Pennsylvania, Tennessee, Texas, and Washington. Eligible children were two weeks to 16 years of age hospitalized after presenting to the ED with a primary diagnosis of asthma, croup, bronchiolitis, or pneumonia between July 1, 2014 and June 30, 2016. Because of an anticipated low frequency of croup hospitalizations, we also included children presenting to the ED and then discharged to home with this diagnosis. Children were assigned to a PRIMES diagnosis group based on their final discharge diagnosis. If there was a discrepancy between admission and discharge diagnoses, the discharge diagnosis was used. If a child had more than one discharge diagnosis for a PRIMES condition (eg, acute asthma and pneumonia), we chose the PRIMES condition with the lowest total enrollments overall. If the final discharge diagnosis was not a PRIMES condition, the case was excluded from further analysis. Patients with immunodeficiency, cystic fibrosis, a history of prematurity <32 weeks, chronic neuromuscular disease, cardiovascular disease, pulmonary diseases (other than asthma), and moderate to severe developmental delay were also excluded. Children admitted to intensive care were eligible only if they were transferred to an acute care ward <72 hours following admission. A survey was administered at the time of enrollment that collected information on SHS exposure, HRQOL, healthcare utilization, and demographics. All study procedures were reviewed and approved by the institutional review boards at each of the participating hospitals.
SECONDHAND SMOKE EXPOSURE
To ascertain SHS exposure, we asked caregivers, “How many persons living in the child’s home smoke?” Responses were dichotomized into non-SHS exposed (0 smokers) and SHS exposed (≥1 smokers). Children with missing data on home SHS exposure were excluded.
Health-Related Quality of Life Outcomes
We estimated HRQOL using the Pediatric Quality of Life (PedsQLTM) 4.0 Generic Core and Infant Scales. The PedsQL instruments are validated, population HRQOL measures that evaluate the physical, mental, emotional, and social functioning of children two to 18 years old based on self- or caregiver-proxy report.12-15 These instruments have also shown responsiveness as well as construct and predictive validity in hospitalized children.11 For this study, we focused on the PedsQL physical functioning subscale, which assesses for problems with physical activities (eg, sports activity or exercise, low energy, and hurts or aches) on a five-point Likert scale (never to almost always a problem). Scores range from 0 to 100 with higher scores indicating a better HRQOL. The reported minimal clinically important difference (MCID), defined as the smallest difference in which individuals would perceive a benefit or would necessitate a change in management, for this scale is 4.5 points.16,17
Children >8 years old were invited to complete the self-report version of the PedsQL. For children <8 years old, and for older children who were unable to complete them, surveys were completed by a parent or legal guardian. Respondents were asked to assess perceptions of their (or their child’s) HRQOL during periods of baseline health (the child’s usual state of health in the month preceding the current illness) and during the acute illness (the child’s state of health at the time of admission) as SHS exposure may influence perceptions of general health and/or contribute to worse outcomes during periods of acute illness.
Covariates collected at the time of enrollment included sociodemographics (child age, gender, race/ethnicity, and caregiver education), and healthcare utilization (caregiver-reported patient visits to a healthcare provider in the preceding six months). Insurance status and level of medical complexity (using the Pediatric Medical Complexity Algorithm)18 were obtained using the Pediatric Hospital Information System database, an administrative database containing clinical and resource utilization data from >45 children’s hospitals in the United States including all of the PRIMES study hospitals.13
Analysis
Descriptive statistics included frequency (%) and mean (standard deviation). Bivariate comparisons according to SHS exposure status were analyzed using chi-squared tests for categorical variables and analysis of variance for continuous variables. Multivariable linear mixed regression models were used to examine associations between home SHS exposure and HRQOL for baseline health and during admission, overall and stratified by diagnosis. Covariates in each model included age, sex, race/ethnicity, caregiver education, and healthcare visits in the preceding six months. We also included a hospital random effect to account for clustering of patients within hospitals and used robust standard errors for inference.
In a secondary analysis to explore potential dose-response effects of SHS exposure, we examined associations between an ordinal exposure variable (0 smokers, 1 smoker, ≥2 smokers) and HRQOL for baseline health and during admission for the acute illness. Because of sample size limitations, diagnosis-specific analyses examining dose-response effects were not conducted.
RESULTS
Study Population
Of the 2,334 children enrolled in the PRIMES study, 25 (1%) respondents did not report on home SHS exposure and were excluded, yielding a final study population of 2,309 children, of whom 728 (32%) had reported home SHS exposure. The study population included 664 children with asthma (mean age seven years [3.5]; 38% with home SHS exposure), 740 with bronchiolitis (mean age 0.7 years [0.5]; 32% with home SHS exposure), 342 with croup (mean age 1.7 [1.1]; 25% with home SHS exposure), and 563 with pneumonia (mean age 4.4 [3.8]; 27% with home SHS exposure; Table 1). Compared with non-SHS-exposed children, those with home SHS exposure tend to be slightly older (3.9 vs 3.4 years, P = .01), more likely to be non-Hispanic Black (29% vs 19%, P < .001), to have a chronic condition (52% vs 41%, P < .001), to come from a household where caregiver(s) did not graduate from college (45% vs 29%, P < .001), and to have public insurance (73% vs 49%, P < .001).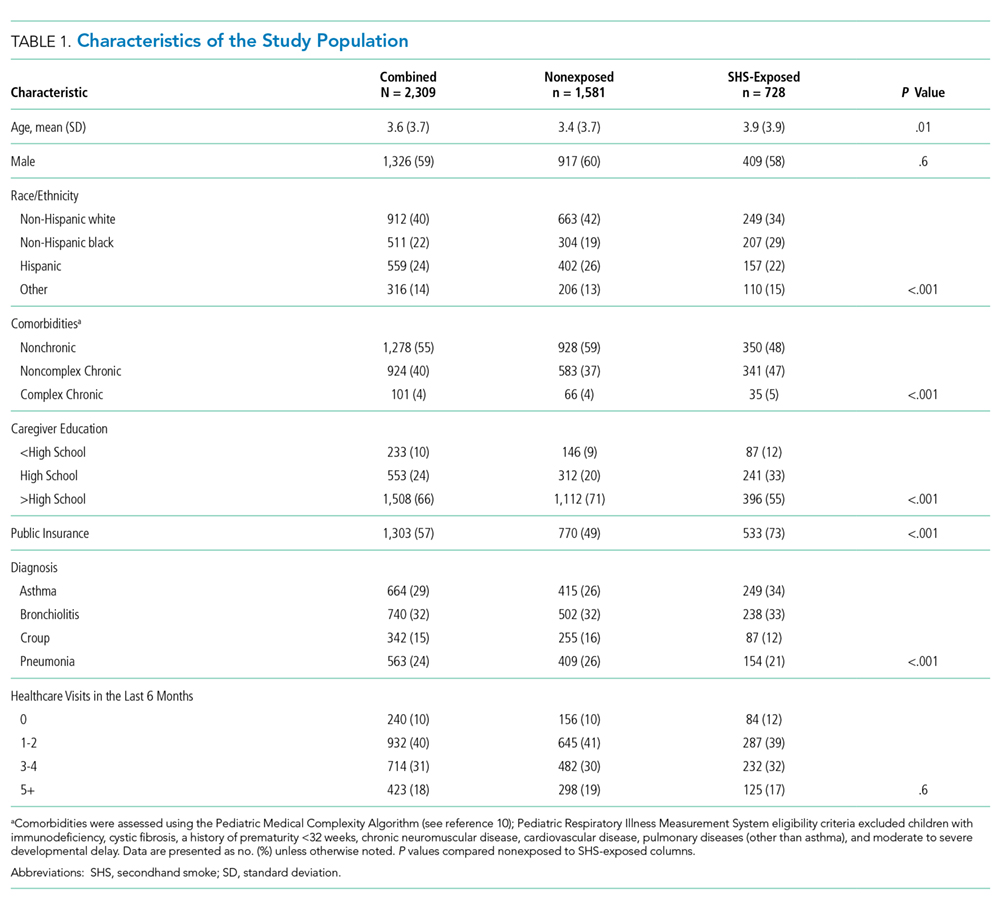
Home SHS Exposure and Health-related Quality of Life
The overall mean HRQOL score for baseline health was 83 (15), with a range across diagnoses of 82 to 87. Compared with non-SHS-exposed children, children with home SHS exposure had a lower mean HRQOL score for baseline health (adjusted mean difference –3.04 [95% CI -4.34, –1.74]). In analyses stratified by diagnosis, baseline health scores were lower for SHS-exposed children for all four conditions, but differences were statistically significant only for bronchiolitis (adjusted mean difference –2.94 [–5.0, –0.89]) and pneumonia (adjusted mean value –4.13 [–6.82, –1.44]; Table 2); none of these differences met the MCID threshold.
The overall mean HRQOL score at the time of admission was 56 (23), with a range across diagnoses of 49 to 61, with lower scores noted among SHS-exposed children compared with non-SHS-exposed children (adjusted mean difference –2.16 [–4.22, –0.10]). Similar to scores representing baseline health, admission scores were lower across all four conditions for SHS-exposed children. Only children with croup, however, had significantly lower admission scores that also met the MCID threshold (adjusted mean difference –5.71 [–10.67, –0.75]; Table 2).
To assess for potential dose-response effects of SHS exposure on HRQOL, we stratified SHS-exposed children into those with one smoker in the home (n = 513) and those with ≥2 smokers in the home (n = 215). Compared with non-SHS-exposed children, both HRQOL scores (baseline health and admission) were lower for SHS-exposed children. Consistent with a dose-response association, scores were lowest for children with ≥2 smokers in the home, both at baseline health (adjusted mean difference –3.92 [–6.03, –1.81]) and on admission (adjusted mean difference –3.67 [–6.98, –0.36]; Table 3).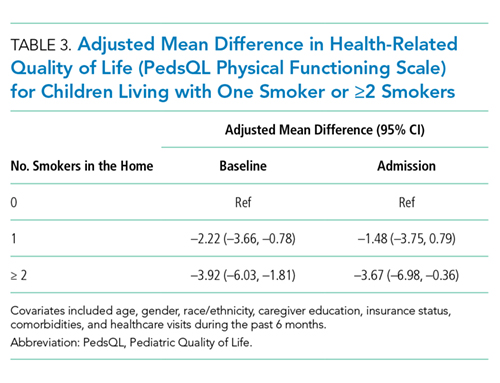
DISCUSSION
Within a multicenter cohort of 2,309 children hospitalized with ARI, we noted significantly lower HRQOL scores among children exposed to SHS in the home as compared with nonexposed children. Differences were greatest for children living with ≥2 smokers in the home. In analyses stratified by diagnosis, differences in baseline health HRQOL scores were greatest for children with bronchiolitis and pneumonia. Differences in acute illness scores were greatest for children with croup.16
Our study provides evidence for acute and chronic impacts of SHS on HRQOL in children hospitalized with ARI. Although several studies have linked SHS exposure to reduced HRQOL in adults,19,20 few similar studies have been conducted in children. Nonetheless, a wealth of studies have documented the negative impact of SHS exposure on clinical outcomes among children with ARI.8,10,21-23 Our findings that home SHS exposure was associated with reduced HRQOL among our cohort of children with ARI are therefore consistent with related findings in adults and children. The observation that the effects of SHS exposure on HRQOL were greatest among children living with ≥2 smokers provides further evidence of a potential causal link between regular SHS exposure and HRQOL.
Although the magnitude and significance of associations between SHS exposure and HRQOL varied for each of the four diagnoses for baseline health and the acute illness, it is important to note that the point estimates for the adjusted mean differences were uniformly lower for the SHS-exposed children in each subgroup. Even so, only acute illness scores for croup exceeded the MCID threshold.16 Croup is the only included condition of the upper airway and is characterized by laryngotracheal inflammation leading to the typical cough and, in moderate to severe cases, stridor. Given that chronic SHS exposure induces a proinflammatory state,3 it is possible that SHS-exposed children with croup had more severe illness compared with nonexposed children with croup resulting in lower HRQOL scores on admission. Further, perceived differences in illness severity and HRQOL may be more readily apparent in children with croup (eg, stridor at rest vs intermittent or no stridor) as compared with children with lower respiratory tract diseases.
Of the four included diagnoses, the link between SHS exposure and asthma outcomes has been most studied. Prior work has demonstrated more frequent and severe acute exacerbations, as well as worse long-term lung function among SHS-exposed children as compared with nonexposed children.22-24 It was, therefore, surprising that our study failed to demonstrate associations between SHS exposure and HRQOL among children with asthma. Reasons for this finding are unclear. One hypothesis is that caregivers of SHS-exposed children with asthma may be more aware of the impacts of SHS exposure on respiratory health (through prior education) and, thus, more likely to modify their smoking behaviors, or for their children to be on daily asthma controller therapy. Alternatively, caregivers of children with asthma may be more likely to underreport home SHS exposure. Thirty-eight percent of children with asthma, however, were classified as SHS-exposed. This percentage was greater than the other three conditions studied (25%-32%), suggesting that differential bias in underreporting was minimal. Given that children with asthma were older, on average, than children with the other three conditions, it may also be that these children spent more time in smoke-free environments (eg, school).
Nearly one-third of children in our study were exposed to SHS in the home. This is similar to the prevalence of exposure in other studies conducted among hospitalized children8,10,21,25 but higher than the national prevalence of home SHS exposure among children in the United States.26 Thus, hospitalized children represent a particularly vulnerable population and an important target for interventions aiming to reduce exposure to SHS. Although longitudinal interventions are likely necessary to affect long-term success, hospitalization for ARI may serve as a powerful teachable moment to begin cessation efforts. Hospitalization also offers time beyond a typical primary care outpatient encounter to focus on cessation counseling and may be the only opportunity to engage in counseling activities for some families with limited time or access. Further, prior studies have demonstrated both the feasibility and the effectiveness of smoking cessation interventions in hospitalized children.27-30 Unfortunately, however, SHS exposure is often not documented at the time of hospitalization, and many opportunities to intervene are missed.25,31 Thus, there is a need for improved strategies to reliably identify and intervene on SHS-exposed children in the hospital setting.
These findings should be considered in the context of several limitations. The observational nature of our study raises the potential for confounding, specifically with regard to socioeconomic status, as this is associated with both SHS exposure and lower HRQOL. Our modeling approach attempted to control for several factors associated with socioeconomic status, including caregiver education and insurance coverage, but there is potential for residual confounding. No single question is sufficient to fully assess SHS exposure as the intensity of home SHS exposure likely varies widely, and some children may be exposed to SHS outside of the home environment.32 The home, however, is often the most likely source of regular SHS exposure,33,34 especially among young children (our cohort’s mean age was 3.6 years). Misclassification of SHS exposure is also possible due to underreporting of smoking.35,36 As a result, some children regularly exposed to SHS may have been misclassified as nonexposed, and the observed associations between SHS exposure and HRQOL may be underestimated. Confirming our study’s findings using objective assessments of SHS exposure, such as cotinine, are warranted. Given the young age of our cohort, the PedsQL surveys were completed by the parent or legal guardian only in >90% of the enrolled subjects, and caregiver perceptions may not accurately reflect the child’s perceptions. Prior work, however, has demonstrated the validity of parent-proxy reporting of the PedsQL, including correlation with child self-report.37 In our study, correlation between child and caregiver reporting (when available) was also very good (r = 0.72, 95% CI 0.64, 0.77). It is also possible that the timing of the HRQOL assessments (on admission) may have biased perceptions of baseline HRQOL, although we anticipate any bias would likely be nondifferential between SHS-exposed and nonexposed children and across diagnoses.
Nearly one-third of children in our study were exposed to SHS exposure in the home, and SHS exposure was associated with lower HRQOL for baseline health and during acute illness, providing further evidence of the dangers of SHS. Much work is needed in order to eliminate the impact of SHS on child health and families of children hospitalized for respiratory illness should be considered a priority population for smoking cessation efforts.
Acknowledgment
The authors wish to acknowledge the efforts of PRIS-PRIMES study team. The authors also wish to thank the children and families who consented to be a part of the PRIMES study.
Disclosures
The authors have no conflicts of interest relevant to this article to disclose.
Funding
This study was supported by NIH-NHLBI 1R01HL121067 to RMS.
1. Witt WP, Weiss AJ, Elixhauser A. Overview of Hospital Stays for Children in the United States, 2012: Statistical Brief #187. Healthcare Cost and Utilization Project (HCUP) Statistical Briefs. Rockville (MD)2006. PubMed
2. Burke H, Leonardi-Bee J, Hashim A, et al. Prenatal and passive smoke exposure and incidence of asthma and wheeze: systematic review and meta-analysis. Pediatrics. 2012;129(4):735-744. PubMed
3. Jinot J, Bayard S. Respiratory health effects of exposure to environmental tobacco smoke. Rev Environ Health. 1996;11(3):89-100. PubMed
4. Wilson KM, Wesgate SC, Pier J, et al. Secondhand smoke exposure and serum cytokine levels in healthy children. Cytokine. 2012;60(1):34-37. PubMed
5. Feleszko W, Zawadzka-Krajewska A, Matysiak K, et al. Parental tobacco smoking is associated with augmented IL-13 secretion in children with allergic asthma. J Allergy Clin Immunol. 2006;117(1):97-102. PubMed
6. Cook DG, Strachan DP. Health effects of passive smoking-10: Summary of effects of parental smoking on the respiratory health of children and implications for research. Thorax. 1999;54(4):357-366. PubMed
7. Merianos AL, Dixon CA, Mahabee-Gittens EM. Secondhand smoke exposure, illness severity, and resource utilization in pediatric emergency department patients with respiratory illnesses. J Asthma. 2017;54(8):798-806. PubMed
8. Ahn A, Edwards KM, Grijalva CG, et al. Secondhand Smoke Exposure and Illness Severity among Children Hospitalized with Pneumonia. J Pediatr. 2015;167(4):869-874 e861. PubMed
9. Cheraghi M, Salvi S. Environmental tobacco smoke (ETS) and respiratory health in children. Eur J Pediatr. 2009;168(8):897-905. PubMed
10. Bradley JP, Bacharier LB, Bonfiglio J, et al. Severity of respiratory syncytial virus bronchiolitis is affected by cigarette smoke exposure and atopy. Pediatrics. 2005;115(1):e7-e14. PubMed
11. Desai AD, Zhou C, Stanford S, Haaland W, Varni JW, Mangione-Smith RM. Validity and responsiveness of the pediatric quality of life inventory (PedsQL) 4.0 generic core scales in the pediatric inpatient setting. JAMA Pediatr. 2014;168(12):1114-1121. PubMed
12. Varni JW, Seid M, Kurtin PS. PedsQL 4.0: reliability and validity of the Pediatric Quality of Life Inventory version 4.0 generic core scales in healthy and patient populations. Med Care. 2001;39(8):800-812. PubMed
13. Varni JW, Limbers CA, Neighbors K, et al. The PedsQL Infant Scales: feasibility, internal consistency reliability, and validity in healthy and ill infants. Qual Life Res. 2011;20(1):45-55.
14. Hullmann SE, Ryan JL, Ramsey RR, Chaney JM, Mullins LL. Measures of general pediatric quality of life: Child Health Questionnaire (CHQ), DISABKIDS Chronic Generic Measure (DCGM), KINDL-R, Pediatric Quality of Life Inventory (PedsQL) 4.0 Generic Core Scales, and Quality of My Life Questionnaire (QoML). Arthritis Care Res (Hoboken). 2011;63(11):S420-S430. PubMed
15. Varni JW, Seid M, Rode CA. The PedsQL: measurement model for the pediatric quality of life inventory. Med Care. 1999;37(2):126-139. PubMed
16. Varni JW, Burwinkle TM, Seid M, Skarr D. The PedsQL 4.0 as a pediatric population health measure: feasibility, reliability, and validity. Ambul Pediatr. 2003;3(6):329-341. PubMed
17. Varni JW, Burwinkle TM, Seid M. The PedsQL 4.0 as a school population health measure: feasibility, reliability, and validity. Qual Life Res. 2006;15(2):203-215. PubMed
18. Simon TD, Cawthon ML, Stanford S, et al. Pediatric medical complexity algorithm: a new method to stratify children by medical complexity. Pediatrics. 2014;133(6):e1647-e1654. PubMed
19. Chen J, Wang MP, Wang X, Viswanath K, Lam TH, Chan SS. Secondhand smoke exposure (SHS) and health-related quality of life (HRQoL) in Chinese never smokers in Hong Kong. BMJ Open. 2015;5(9):e007694. PubMed
20. Bridevaux PO, Cornuz J, Gaspoz JM, et al. Secondhand smoke and health-related quality of life in never smokers: results from the SAPALDIA cohort study 2. Arch Intern Med. 2007;167(22):2516-2523. PubMed
21. Wilson KM, Pier JC, Wesgate SC, Cohen JM, Blumkin AK. Secondhand tobacco smoke exposure and severity of influenza in hospitalized children. J Pediatr. 2013;162(1):16-21. PubMed
22. LeSon S, Gershwin ME. Risk factors for asthmatic patients requiring intubation. I. Observations in children. J Asthma. 1995;32(4):285-294. PubMed
23. Chilmonczyk BA, Salmun LM, Megathlin KN, et al. Association between exposure to environmental tobacco smoke and exacerbations of asthma in children. N Engl J Med. 1993;328(23):1665-1669. PubMed
24. Evans D, Levison MJ, Feldman CH, et al. The impact of passive smoking on emergency room visits of urban children with asthma. Am Rev Respir Dis. 1987;135(3):567-572. PubMed
25. Wilson KM, Wesgate SC, Best D, Blumkin AK, Klein JD. Admission screening for secondhand tobacco smoke exposure. Hosp Pediatr. 2012;2(1):26-33. PubMed
26. Marano C, Schober SE, Brody DJ, Zhang C. Secondhand tobacco smoke exposure among children and adolescents: United States, 2003-2006. Pediatrics. 2009;124(5):1299-1305. PubMed
27. Ralston S, Roohi M. A randomized, controlled trial of smoking cessation counseling provided during child hospitalization for respiratory illness. Pediatr Pulmonol. 2008;43(6):561-566. PubMed
28. Winickoff JP, Hillis VJ, Palfrey JS, Perrin JM, Rigotti NA. A smoking cessation intervention for parents of children who are hospitalized for respiratory illness: the stop tobacco outreach program. Pediatrics. 2003;111(1):140-145. PubMed
29. Torok MR, Lowary M, Ziniel SI, et al. Perceptions of parental tobacco dependence treatment among a children’s hospital staff. Hosp Pediatr. 2018;8(11):724-728. PubMed
30. Jenssen BP, Shelov ED, Bonafide CP, Bernstein SL, Fiks AG, Bryant-Stephens T. Clinical decision support tool for parental tobacco treatment in hospitalized children. Appl Clin Inform. 2016;7(2):399-411. PubMed
31. Lustre BL, Dixon CA, Merianos AL, Gordon JS, Zhang B, Mahabee-Gittens EM. Assessment of tobacco smoke exposure in the pediatric emergency department. Prev Med. 2016;85:42-46. PubMed
32. Groner JA, Rule AM, McGrath-Morrow SA, et al. Assessing pediatric tobacco exposure using parent report: comparison with hair nicotine. J Expo Sci Environ Epidemiol. 2018;28(6):530-537. PubMed
33. Gergen PJ. Environmental tobacco smoke as a risk factor for respiratory disease in children. Respir Physiol. 2001;128(1):39-46. PubMed
34. Klepeis NE, Nelson WC, Ott WR, et al. The National Human Activity Pattern Survey (NHAPS): a resource for assessing exposure to environmental pollutants. J Expo Anal Environ Epidemiol. 2001;11(3):231-252. PubMed
35. Couluris M, Schnapf BM, Casey A, Xu P, Gross-King M, Krischer J. How to measure secondhand smoke exposure in a pediatric clinic setting. Arch Pediatr Adolesc Med. 2011;165(7):670-671. PubMed
36. Boyaci H, Etiler N, Duman C, Basyigit I, Pala A. Environmental tobacco smoke exposure in school children: parent report and urine cotinine measures. Pediatr Int. 2006;48(4):382-389. PubMed
37. Varni JW, Limbers CA, Burwinkle TM. Parent proxy-report of their children’s health-related quality of life: an analysis of 13,878 parents’ reliability and validity across age subgroups using the PedsQL 4.0 Generic Core Scales. Health Qual Life Outcomes. 2007;5(1):2. PubMed
Acute respiratory illnesses (ARIs), including acute exacerbations of asthma, croup, pneumonia, and bronchiolitis, are among the most common illnesses in childhood.1 Although most ARIs can be managed in the outpatient setting,
Exposure to secondhand smoke (SHS) is a preventable risk factor for ARI in children, particularly when there is regular exposure in the home.2 Chronic exposure to SHS impacts systemic inflammation by suppressing serum interferon-gamma,3 which can lead to increased susceptibility to viral and bacterial infections,4 and increasing Th2 (atopic) cytokine expression, which is associated with asthma.5 SHS exposure in children has also been linked to diminished lung function.6 As a result, SHS exposure is associated with increased ARI susceptibility and severity in children.7-10
Much research has focused on the clinical impact of SHS exposure on respiratory health in children, but little is known about the impact on patient-reported outcomes, such as health-related quality of life (HRQOL). Patient-reported outcomes help provide a comprehensive evaluation of the effectiveness of healthcare delivery systems. These outcomes are increasingly used by health service researchers to better understand patient and caregiver perspectives.11 Given the known associations between SHS exposure and ARI morbidity, we postulated that regular SHS exposure would also impact HRQOL in children. In this study, we assessed the relationship between SHS exposure and HRQOL within a large, multicenter, prospective cohort of children presenting to the emergency department (ED) and/or hospital with ARI.
METHODS
Study Population
This study was nested within the Pediatric Respiratory Illness Measurement System (PRIMES) study, a prospective cohort study of children with ARI in the ED and inpatient settings at five tertiary care children’s hospitals within the Pediatric Research in Inpatient Settings Network in Colorado, Pennsylvania, Tennessee, Texas, and Washington. Eligible children were two weeks to 16 years of age hospitalized after presenting to the ED with a primary diagnosis of asthma, croup, bronchiolitis, or pneumonia between July 1, 2014 and June 30, 2016. Because of an anticipated low frequency of croup hospitalizations, we also included children presenting to the ED and then discharged to home with this diagnosis. Children were assigned to a PRIMES diagnosis group based on their final discharge diagnosis. If there was a discrepancy between admission and discharge diagnoses, the discharge diagnosis was used. If a child had more than one discharge diagnosis for a PRIMES condition (eg, acute asthma and pneumonia), we chose the PRIMES condition with the lowest total enrollments overall. If the final discharge diagnosis was not a PRIMES condition, the case was excluded from further analysis. Patients with immunodeficiency, cystic fibrosis, a history of prematurity <32 weeks, chronic neuromuscular disease, cardiovascular disease, pulmonary diseases (other than asthma), and moderate to severe developmental delay were also excluded. Children admitted to intensive care were eligible only if they were transferred to an acute care ward <72 hours following admission. A survey was administered at the time of enrollment that collected information on SHS exposure, HRQOL, healthcare utilization, and demographics. All study procedures were reviewed and approved by the institutional review boards at each of the participating hospitals.
SECONDHAND SMOKE EXPOSURE
To ascertain SHS exposure, we asked caregivers, “How many persons living in the child’s home smoke?” Responses were dichotomized into non-SHS exposed (0 smokers) and SHS exposed (≥1 smokers). Children with missing data on home SHS exposure were excluded.
Health-Related Quality of Life Outcomes
We estimated HRQOL using the Pediatric Quality of Life (PedsQLTM) 4.0 Generic Core and Infant Scales. The PedsQL instruments are validated, population HRQOL measures that evaluate the physical, mental, emotional, and social functioning of children two to 18 years old based on self- or caregiver-proxy report.12-15 These instruments have also shown responsiveness as well as construct and predictive validity in hospitalized children.11 For this study, we focused on the PedsQL physical functioning subscale, which assesses for problems with physical activities (eg, sports activity or exercise, low energy, and hurts or aches) on a five-point Likert scale (never to almost always a problem). Scores range from 0 to 100 with higher scores indicating a better HRQOL. The reported minimal clinically important difference (MCID), defined as the smallest difference in which individuals would perceive a benefit or would necessitate a change in management, for this scale is 4.5 points.16,17
Children >8 years old were invited to complete the self-report version of the PedsQL. For children <8 years old, and for older children who were unable to complete them, surveys were completed by a parent or legal guardian. Respondents were asked to assess perceptions of their (or their child’s) HRQOL during periods of baseline health (the child’s usual state of health in the month preceding the current illness) and during the acute illness (the child’s state of health at the time of admission) as SHS exposure may influence perceptions of general health and/or contribute to worse outcomes during periods of acute illness.
Covariates collected at the time of enrollment included sociodemographics (child age, gender, race/ethnicity, and caregiver education), and healthcare utilization (caregiver-reported patient visits to a healthcare provider in the preceding six months). Insurance status and level of medical complexity (using the Pediatric Medical Complexity Algorithm)18 were obtained using the Pediatric Hospital Information System database, an administrative database containing clinical and resource utilization data from >45 children’s hospitals in the United States including all of the PRIMES study hospitals.13
Analysis
Descriptive statistics included frequency (%) and mean (standard deviation). Bivariate comparisons according to SHS exposure status were analyzed using chi-squared tests for categorical variables and analysis of variance for continuous variables. Multivariable linear mixed regression models were used to examine associations between home SHS exposure and HRQOL for baseline health and during admission, overall and stratified by diagnosis. Covariates in each model included age, sex, race/ethnicity, caregiver education, and healthcare visits in the preceding six months. We also included a hospital random effect to account for clustering of patients within hospitals and used robust standard errors for inference.
In a secondary analysis to explore potential dose-response effects of SHS exposure, we examined associations between an ordinal exposure variable (0 smokers, 1 smoker, ≥2 smokers) and HRQOL for baseline health and during admission for the acute illness. Because of sample size limitations, diagnosis-specific analyses examining dose-response effects were not conducted.
RESULTS
Study Population
Of the 2,334 children enrolled in the PRIMES study, 25 (1%) respondents did not report on home SHS exposure and were excluded, yielding a final study population of 2,309 children, of whom 728 (32%) had reported home SHS exposure. The study population included 664 children with asthma (mean age seven years [3.5]; 38% with home SHS exposure), 740 with bronchiolitis (mean age 0.7 years [0.5]; 32% with home SHS exposure), 342 with croup (mean age 1.7 [1.1]; 25% with home SHS exposure), and 563 with pneumonia (mean age 4.4 [3.8]; 27% with home SHS exposure; Table 1). Compared with non-SHS-exposed children, those with home SHS exposure tend to be slightly older (3.9 vs 3.4 years, P = .01), more likely to be non-Hispanic Black (29% vs 19%, P < .001), to have a chronic condition (52% vs 41%, P < .001), to come from a household where caregiver(s) did not graduate from college (45% vs 29%, P < .001), and to have public insurance (73% vs 49%, P < .001).
Home SHS Exposure and Health-related Quality of Life
The overall mean HRQOL score for baseline health was 83 (15), with a range across diagnoses of 82 to 87. Compared with non-SHS-exposed children, children with home SHS exposure had a lower mean HRQOL score for baseline health (adjusted mean difference –3.04 [95% CI -4.34, –1.74]). In analyses stratified by diagnosis, baseline health scores were lower for SHS-exposed children for all four conditions, but differences were statistically significant only for bronchiolitis (adjusted mean difference –2.94 [–5.0, –0.89]) and pneumonia (adjusted mean value –4.13 [–6.82, –1.44]; Table 2); none of these differences met the MCID threshold.
The overall mean HRQOL score at the time of admission was 56 (23), with a range across diagnoses of 49 to 61, with lower scores noted among SHS-exposed children compared with non-SHS-exposed children (adjusted mean difference –2.16 [–4.22, –0.10]). Similar to scores representing baseline health, admission scores were lower across all four conditions for SHS-exposed children. Only children with croup, however, had significantly lower admission scores that also met the MCID threshold (adjusted mean difference –5.71 [–10.67, –0.75]; Table 2).
To assess for potential dose-response effects of SHS exposure on HRQOL, we stratified SHS-exposed children into those with one smoker in the home (n = 513) and those with ≥2 smokers in the home (n = 215). Compared with non-SHS-exposed children, both HRQOL scores (baseline health and admission) were lower for SHS-exposed children. Consistent with a dose-response association, scores were lowest for children with ≥2 smokers in the home, both at baseline health (adjusted mean difference –3.92 [–6.03, –1.81]) and on admission (adjusted mean difference –3.67 [–6.98, –0.36]; Table 3).
DISCUSSION
Within a multicenter cohort of 2,309 children hospitalized with ARI, we noted significantly lower HRQOL scores among children exposed to SHS in the home as compared with nonexposed children. Differences were greatest for children living with ≥2 smokers in the home. In analyses stratified by diagnosis, differences in baseline health HRQOL scores were greatest for children with bronchiolitis and pneumonia. Differences in acute illness scores were greatest for children with croup.16
Our study provides evidence for acute and chronic impacts of SHS on HRQOL in children hospitalized with ARI. Although several studies have linked SHS exposure to reduced HRQOL in adults,19,20 few similar studies have been conducted in children. Nonetheless, a wealth of studies have documented the negative impact of SHS exposure on clinical outcomes among children with ARI.8,10,21-23 Our findings that home SHS exposure was associated with reduced HRQOL among our cohort of children with ARI are therefore consistent with related findings in adults and children. The observation that the effects of SHS exposure on HRQOL were greatest among children living with ≥2 smokers provides further evidence of a potential causal link between regular SHS exposure and HRQOL.
Although the magnitude and significance of associations between SHS exposure and HRQOL varied for each of the four diagnoses for baseline health and the acute illness, it is important to note that the point estimates for the adjusted mean differences were uniformly lower for the SHS-exposed children in each subgroup. Even so, only acute illness scores for croup exceeded the MCID threshold.16 Croup is the only included condition of the upper airway and is characterized by laryngotracheal inflammation leading to the typical cough and, in moderate to severe cases, stridor. Given that chronic SHS exposure induces a proinflammatory state,3 it is possible that SHS-exposed children with croup had more severe illness compared with nonexposed children with croup resulting in lower HRQOL scores on admission. Further, perceived differences in illness severity and HRQOL may be more readily apparent in children with croup (eg, stridor at rest vs intermittent or no stridor) as compared with children with lower respiratory tract diseases.
Of the four included diagnoses, the link between SHS exposure and asthma outcomes has been most studied. Prior work has demonstrated more frequent and severe acute exacerbations, as well as worse long-term lung function among SHS-exposed children as compared with nonexposed children.22-24 It was, therefore, surprising that our study failed to demonstrate associations between SHS exposure and HRQOL among children with asthma. Reasons for this finding are unclear. One hypothesis is that caregivers of SHS-exposed children with asthma may be more aware of the impacts of SHS exposure on respiratory health (through prior education) and, thus, more likely to modify their smoking behaviors, or for their children to be on daily asthma controller therapy. Alternatively, caregivers of children with asthma may be more likely to underreport home SHS exposure. Thirty-eight percent of children with asthma, however, were classified as SHS-exposed. This percentage was greater than the other three conditions studied (25%-32%), suggesting that differential bias in underreporting was minimal. Given that children with asthma were older, on average, than children with the other three conditions, it may also be that these children spent more time in smoke-free environments (eg, school).
Nearly one-third of children in our study were exposed to SHS in the home. This is similar to the prevalence of exposure in other studies conducted among hospitalized children8,10,21,25 but higher than the national prevalence of home SHS exposure among children in the United States.26 Thus, hospitalized children represent a particularly vulnerable population and an important target for interventions aiming to reduce exposure to SHS. Although longitudinal interventions are likely necessary to affect long-term success, hospitalization for ARI may serve as a powerful teachable moment to begin cessation efforts. Hospitalization also offers time beyond a typical primary care outpatient encounter to focus on cessation counseling and may be the only opportunity to engage in counseling activities for some families with limited time or access. Further, prior studies have demonstrated both the feasibility and the effectiveness of smoking cessation interventions in hospitalized children.27-30 Unfortunately, however, SHS exposure is often not documented at the time of hospitalization, and many opportunities to intervene are missed.25,31 Thus, there is a need for improved strategies to reliably identify and intervene on SHS-exposed children in the hospital setting.
These findings should be considered in the context of several limitations. The observational nature of our study raises the potential for confounding, specifically with regard to socioeconomic status, as this is associated with both SHS exposure and lower HRQOL. Our modeling approach attempted to control for several factors associated with socioeconomic status, including caregiver education and insurance coverage, but there is potential for residual confounding. No single question is sufficient to fully assess SHS exposure as the intensity of home SHS exposure likely varies widely, and some children may be exposed to SHS outside of the home environment.32 The home, however, is often the most likely source of regular SHS exposure,33,34 especially among young children (our cohort’s mean age was 3.6 years). Misclassification of SHS exposure is also possible due to underreporting of smoking.35,36 As a result, some children regularly exposed to SHS may have been misclassified as nonexposed, and the observed associations between SHS exposure and HRQOL may be underestimated. Confirming our study’s findings using objective assessments of SHS exposure, such as cotinine, are warranted. Given the young age of our cohort, the PedsQL surveys were completed by the parent or legal guardian only in >90% of the enrolled subjects, and caregiver perceptions may not accurately reflect the child’s perceptions. Prior work, however, has demonstrated the validity of parent-proxy reporting of the PedsQL, including correlation with child self-report.37 In our study, correlation between child and caregiver reporting (when available) was also very good (r = 0.72, 95% CI 0.64, 0.77). It is also possible that the timing of the HRQOL assessments (on admission) may have biased perceptions of baseline HRQOL, although we anticipate any bias would likely be nondifferential between SHS-exposed and nonexposed children and across diagnoses.
Nearly one-third of children in our study were exposed to SHS exposure in the home, and SHS exposure was associated with lower HRQOL for baseline health and during acute illness, providing further evidence of the dangers of SHS. Much work is needed in order to eliminate the impact of SHS on child health and families of children hospitalized for respiratory illness should be considered a priority population for smoking cessation efforts.
Acknowledgment
The authors wish to acknowledge the efforts of PRIS-PRIMES study team. The authors also wish to thank the children and families who consented to be a part of the PRIMES study.
Disclosures
The authors have no conflicts of interest relevant to this article to disclose.
Funding
This study was supported by NIH-NHLBI 1R01HL121067 to RMS.
1. Witt WP, Weiss AJ, Elixhauser A. Overview of Hospital Stays for Children in the United States, 2012: Statistical Brief #187. Healthcare Cost and Utilization Project (HCUP) Statistical Briefs. Rockville (MD)2006. PubMed
2. Burke H, Leonardi-Bee J, Hashim A, et al. Prenatal and passive smoke exposure and incidence of asthma and wheeze: systematic review and meta-analysis. Pediatrics. 2012;129(4):735-744. PubMed
3. Jinot J, Bayard S. Respiratory health effects of exposure to environmental tobacco smoke. Rev Environ Health. 1996;11(3):89-100. PubMed
4. Wilson KM, Wesgate SC, Pier J, et al. Secondhand smoke exposure and serum cytokine levels in healthy children. Cytokine. 2012;60(1):34-37. PubMed
5. Feleszko W, Zawadzka-Krajewska A, Matysiak K, et al. Parental tobacco smoking is associated with augmented IL-13 secretion in children with allergic asthma. J Allergy Clin Immunol. 2006;117(1):97-102. PubMed
6. Cook DG, Strachan DP. Health effects of passive smoking-10: Summary of effects of parental smoking on the respiratory health of children and implications for research. Thorax. 1999;54(4):357-366. PubMed
7. Merianos AL, Dixon CA, Mahabee-Gittens EM. Secondhand smoke exposure, illness severity, and resource utilization in pediatric emergency department patients with respiratory illnesses. J Asthma. 2017;54(8):798-806. PubMed
8. Ahn A, Edwards KM, Grijalva CG, et al. Secondhand Smoke Exposure and Illness Severity among Children Hospitalized with Pneumonia. J Pediatr. 2015;167(4):869-874 e861. PubMed
9. Cheraghi M, Salvi S. Environmental tobacco smoke (ETS) and respiratory health in children. Eur J Pediatr. 2009;168(8):897-905. PubMed
10. Bradley JP, Bacharier LB, Bonfiglio J, et al. Severity of respiratory syncytial virus bronchiolitis is affected by cigarette smoke exposure and atopy. Pediatrics. 2005;115(1):e7-e14. PubMed
11. Desai AD, Zhou C, Stanford S, Haaland W, Varni JW, Mangione-Smith RM. Validity and responsiveness of the pediatric quality of life inventory (PedsQL) 4.0 generic core scales in the pediatric inpatient setting. JAMA Pediatr. 2014;168(12):1114-1121. PubMed
12. Varni JW, Seid M, Kurtin PS. PedsQL 4.0: reliability and validity of the Pediatric Quality of Life Inventory version 4.0 generic core scales in healthy and patient populations. Med Care. 2001;39(8):800-812. PubMed
13. Varni JW, Limbers CA, Neighbors K, et al. The PedsQL Infant Scales: feasibility, internal consistency reliability, and validity in healthy and ill infants. Qual Life Res. 2011;20(1):45-55.
14. Hullmann SE, Ryan JL, Ramsey RR, Chaney JM, Mullins LL. Measures of general pediatric quality of life: Child Health Questionnaire (CHQ), DISABKIDS Chronic Generic Measure (DCGM), KINDL-R, Pediatric Quality of Life Inventory (PedsQL) 4.0 Generic Core Scales, and Quality of My Life Questionnaire (QoML). Arthritis Care Res (Hoboken). 2011;63(11):S420-S430. PubMed
15. Varni JW, Seid M, Rode CA. The PedsQL: measurement model for the pediatric quality of life inventory. Med Care. 1999;37(2):126-139. PubMed
16. Varni JW, Burwinkle TM, Seid M, Skarr D. The PedsQL 4.0 as a pediatric population health measure: feasibility, reliability, and validity. Ambul Pediatr. 2003;3(6):329-341. PubMed
17. Varni JW, Burwinkle TM, Seid M. The PedsQL 4.0 as a school population health measure: feasibility, reliability, and validity. Qual Life Res. 2006;15(2):203-215. PubMed
18. Simon TD, Cawthon ML, Stanford S, et al. Pediatric medical complexity algorithm: a new method to stratify children by medical complexity. Pediatrics. 2014;133(6):e1647-e1654. PubMed
19. Chen J, Wang MP, Wang X, Viswanath K, Lam TH, Chan SS. Secondhand smoke exposure (SHS) and health-related quality of life (HRQoL) in Chinese never smokers in Hong Kong. BMJ Open. 2015;5(9):e007694. PubMed
20. Bridevaux PO, Cornuz J, Gaspoz JM, et al. Secondhand smoke and health-related quality of life in never smokers: results from the SAPALDIA cohort study 2. Arch Intern Med. 2007;167(22):2516-2523. PubMed
21. Wilson KM, Pier JC, Wesgate SC, Cohen JM, Blumkin AK. Secondhand tobacco smoke exposure and severity of influenza in hospitalized children. J Pediatr. 2013;162(1):16-21. PubMed
22. LeSon S, Gershwin ME. Risk factors for asthmatic patients requiring intubation. I. Observations in children. J Asthma. 1995;32(4):285-294. PubMed
23. Chilmonczyk BA, Salmun LM, Megathlin KN, et al. Association between exposure to environmental tobacco smoke and exacerbations of asthma in children. N Engl J Med. 1993;328(23):1665-1669. PubMed
24. Evans D, Levison MJ, Feldman CH, et al. The impact of passive smoking on emergency room visits of urban children with asthma. Am Rev Respir Dis. 1987;135(3):567-572. PubMed
25. Wilson KM, Wesgate SC, Best D, Blumkin AK, Klein JD. Admission screening for secondhand tobacco smoke exposure. Hosp Pediatr. 2012;2(1):26-33. PubMed
26. Marano C, Schober SE, Brody DJ, Zhang C. Secondhand tobacco smoke exposure among children and adolescents: United States, 2003-2006. Pediatrics. 2009;124(5):1299-1305. PubMed
27. Ralston S, Roohi M. A randomized, controlled trial of smoking cessation counseling provided during child hospitalization for respiratory illness. Pediatr Pulmonol. 2008;43(6):561-566. PubMed
28. Winickoff JP, Hillis VJ, Palfrey JS, Perrin JM, Rigotti NA. A smoking cessation intervention for parents of children who are hospitalized for respiratory illness: the stop tobacco outreach program. Pediatrics. 2003;111(1):140-145. PubMed
29. Torok MR, Lowary M, Ziniel SI, et al. Perceptions of parental tobacco dependence treatment among a children’s hospital staff. Hosp Pediatr. 2018;8(11):724-728. PubMed
30. Jenssen BP, Shelov ED, Bonafide CP, Bernstein SL, Fiks AG, Bryant-Stephens T. Clinical decision support tool for parental tobacco treatment in hospitalized children. Appl Clin Inform. 2016;7(2):399-411. PubMed
31. Lustre BL, Dixon CA, Merianos AL, Gordon JS, Zhang B, Mahabee-Gittens EM. Assessment of tobacco smoke exposure in the pediatric emergency department. Prev Med. 2016;85:42-46. PubMed
32. Groner JA, Rule AM, McGrath-Morrow SA, et al. Assessing pediatric tobacco exposure using parent report: comparison with hair nicotine. J Expo Sci Environ Epidemiol. 2018;28(6):530-537. PubMed
33. Gergen PJ. Environmental tobacco smoke as a risk factor for respiratory disease in children. Respir Physiol. 2001;128(1):39-46. PubMed
34. Klepeis NE, Nelson WC, Ott WR, et al. The National Human Activity Pattern Survey (NHAPS): a resource for assessing exposure to environmental pollutants. J Expo Anal Environ Epidemiol. 2001;11(3):231-252. PubMed
35. Couluris M, Schnapf BM, Casey A, Xu P, Gross-King M, Krischer J. How to measure secondhand smoke exposure in a pediatric clinic setting. Arch Pediatr Adolesc Med. 2011;165(7):670-671. PubMed
36. Boyaci H, Etiler N, Duman C, Basyigit I, Pala A. Environmental tobacco smoke exposure in school children: parent report and urine cotinine measures. Pediatr Int. 2006;48(4):382-389. PubMed
37. Varni JW, Limbers CA, Burwinkle TM. Parent proxy-report of their children’s health-related quality of life: an analysis of 13,878 parents’ reliability and validity across age subgroups using the PedsQL 4.0 Generic Core Scales. Health Qual Life Outcomes. 2007;5(1):2. PubMed
© 2019 Society of Hospital Medicine
Internal Medicine Residents’ Exposure to and Confidence in Managing Hospital Acute Clinical Events
Internal Medicine (IM) residency graduates are expected to manage a wide range of acute clinical events.1 Urgent and emergent inpatient situations require a broad knowledge base for rapid bedside diagnosis, yet the essential clinical skills required to manage acute clinical events pose a unique training challenge given the rarity and high-stakes nature of several such emergencies. For example, in three years of residency, a trainee may never have the opportunity to manage anaphylaxis, yet IM graduates must be able to recognize and quickly initiate proper lifesaving treatment for this relatively rare event2 when it does occur.
In an era of work-hour limitations and heightened trainee supervision, residents perceive diminished familiarity with several clinical situations3-5 and may feel unprepared to handle crisis events such as cardiac arrest.6 Given the sporadic nature of clinical medicine, many residents may not be exposed to certain acute inpatient clinical scenarios by the end of their training, a potentially critical education gap. To our knowledge, IM residents’ level of exposure to acute clinical events has not previously been studied. The aims of this study were to develop an instrument aimed at assessing IM residents’ exposure to hospital acute clinical events at a large academic medical center and to investigate the relationship between exposure and confidence in managing these events.
METHODS
Survey Development
We reviewed the Massachusetts General Hospital (MGH) IM residency program curriculum (including simulation, conferences, and other didactics), the American Board of Internal Medicine certification requirements (primarily related to Advanced Cardiac Life Support [ACLS]), and the MGH inpatient rapid response events and gained input from the IM program leadership to develop a list of 50 acute clinical events that a graduating resident may be expected to manage independently (Box 1, Supplementary Appendix).7-9 We then developed a survey assessing residents’ exposure to and confidence in managing such events. To classify the level of exposure, residents were asked to distinguish whether they had managed these events during a simulation session, inpatient as a part of a team, or inpatient independently. At our institution, IM postgraduate year 1 (PGY-1) interns manage a floor of patients overnight under a senior resident’s supervision, PGY-2 residents manage a team of several interns often without attending presence on ward rounds,10 and senior PGY-3 or -4 residents are expected to lead the hospital’s rapid response and code team and triage decompensating patients to the intensive care unit. Therefore, there are ample opportunities for IM residents to manage conditions independently (ie, in a direct leadership role) with attending supervision. House officers’ role in medical management, including calling appropriate subspecialty consultation, depends on the clinical condition; for example, a graduating senior resident would be expected to evaluate comprehensively a hypotensive patient and diagnose tension pneumothorax (while calling interventional pulmonary support for needle decompression and chest tube placement) and independently run an ACLS algorithm in the case of an unstable arrhythmia or cardiac arrest.
Residents were also asked to rate their perceived confidence in managing each condition independently on a five-point scale (ranging from “definitely cannot manage this condition independently” to “definitely can manage this condition independently”). We refined the survey instrument through a collaborative, iterative review process, including cognitive interviews and piloting with IM subspecialty fellows.
Participants and Data Collection
All IM residents at the Massachusetts General Hospital were invited to participate in the study. The study was conducted in May 2015 to reflect training throughout the prior academic year(s) and allow us to evaluate graduating residents’ exposures across all prior years of training. The instrument was administered anonymously via a web-based survey tool, Qualtrics (Provo, Utah). The study was approved as exempt by the Partners Institutional Review Board.
Data Analysis
Residents’ self-reported exposure to hospital acute events was classified into the following six ordinal categories: (1) never seen (have never seen the condition under any circumstances); (2) simulation alone (have managed the condition only during a mannequin-simulated patient case); (3) team alone (have managed the condition inpatient as a part of a team of providers, not in a primary leadership role); (4) team plus simulation; (5) independently (have managed the condition inpatient alone or in a primary leadership role); and (6) independently plus simulation. Residents’ self-reported exposure was examined for each postgraduate year (PGY) class both in aggregate and for each individual acute event. We sought to identify events that the majority of residents had managed independently (85% of residents or greater) and less common events that at least 15% of residents had never experienced.
We also examined residents’ self-reported confidence for each PGY class in aggregate and for each clinical acute scenario. Confidence was investigated in a dichotomized manner with a “definitely can” rating indicating “Confident” and with “probably can,” “neutral,” “probably cannot,” or “definitely cannot” ratings indicating “Not Confident” to manage the condition independently. Dichotomization thus allowed us to set a high bar for confidence, reflecting the self-perceived ability of the residents to manage the conditions as future independent physicians.
We used logistic regression models with the generalized estimating equations (GEE) approach to take into account the repeated measures of 50 clinical acute clinical events assessed for each resident. We compared the distribution of self-reported exposure and confidence among different PGY classes and examined the relationship between confidence and self-reported exposure stratified by level of training. We also assessed the independent effect of exposure on confidence controlling for level of training in a multivariable logistic regression model.
RESULTS
A total of 140 of 170 IM residents completed the survey (82% overall response rate: 72% of all PGY-1 residents, 86% of PGY-2 residents, and 89% of PGY-3/4 residents). In total, 41 PGY-1 residents (29% of respondents), 50 PGY-2 residents (36%), and 49 PGY-3 or PGY-4 residents (35%) participated. The majority of residents were in the Categorical IM training track (106 residents, 76% of respondents), whereas the remainder of respondents were in various subspecialty training tracks within our IM residency program, including Primary Care (14 residents, 10%), and four-year tracks, including Global Health (six residents, 4%), and Medicine-Pediatrics (14 residents, 10%).
Assessment of Exposure
Residents reported increasingly independent exposures as they progressed through residency training. PGY-1 residents on average had never seen 16.3% of the 50 acute events, whereas PGY-3/4 residents had never seen only 4.0% of the events (P < .0001). PGY-1 residents had managed 31.3% of events independently (or both independently and in simulation) as opposed to 71.7% of events for PGY-3/4 residents (P < .0001). Simulation alone accounted for a substantial proportion of exposures (16.4%) for PGY-1 residents, but this was significantly lower for PGY-2 or PGY-3/4 residents (P < .0001), who reported a greater percentage of exposures in nonsimulation clinical scenarios either independently or as a part of an inpatient team. There were no outlier residents who reported lower exposure compared with their PGY peers.
There was a wide spectrum of resident-reported exposures when individual acute events were examined (Table, full data in Supplementary Appendix Table 1). Events with the highest levels of exposure, which >85% of PGY-1 residents had managed independently, included alcohol withdrawal, chronic obstructive pulmonary disease exacerbation, rapid atrial fibrillation, agitated delirium, hypertensive urgency, and hyperkalemia. Events with the lowest levels of exposure, which at least 15% of graduating residents had never encountered in the hospital, included the following eight of 50 events (16%): torsades de pointes (51% of PGY-3/4 residents), acute mechanical valve failure (49%), tension pneumothorax (38.8%), use of emergency transcutaneous pacing (38.8%), elevated intracranial pressure (ICP)/herniation (24.5%), aortic dissection (22.4%), cord compression (16.3%), and use of emergency cardioversion (16.3%). Several PGY-3/4 residents had managed several of these events only in mannequin simulations, including torsades de pointes (41%), transcutaneous pacing (33%), and tension pneumothorax (24%).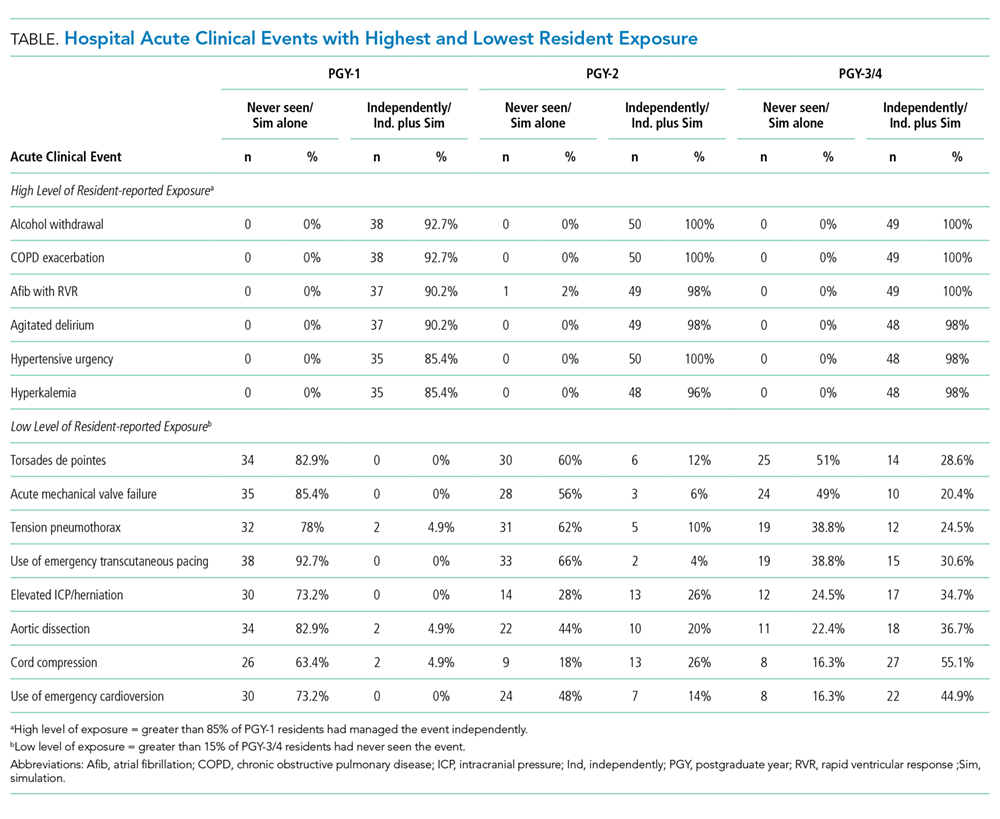
Assessment of Confidence
Both levels of training and exposure to acute events were associated with increased confidence in managing such events. PGY-1 residents felt confident in managing 24.9% of acute events independently, compared to 48.4% of events for PGY-2 residents and 72.5% of events for PGY-3/4 residents (P < .0001). There was considerable variation in confidence among the individual acute events (Supplementary Appendix Table 2). A majority of graduating PGY-3/4 residents did not feel confident in managing the following 10 of the 50 events (20%): use of emergency cardioversion, aortic dissection, thrombotic thrombocytopenic purpura/hemolytic uremic syndrome (TTP/HUS), torsades de pointes, posterior reversible encephalopathy syndrome (PRES), intracranial hemorrhage, use of emergency transcutaneous pacing, tension pneumothorax, elevated ICP/herniation, and acute mechanical valve failure.
Residents’ self-reported confidence also correlated with level of exposure. There was a significant increase in resident confidence with increasingly independent exposure stratified by level of training (Figure; all with P < .0001). In the multivariable logistic regression model, increasing exposure correlated with increased resident confidence (P < .0001) while controlling for PGY year (P = .001).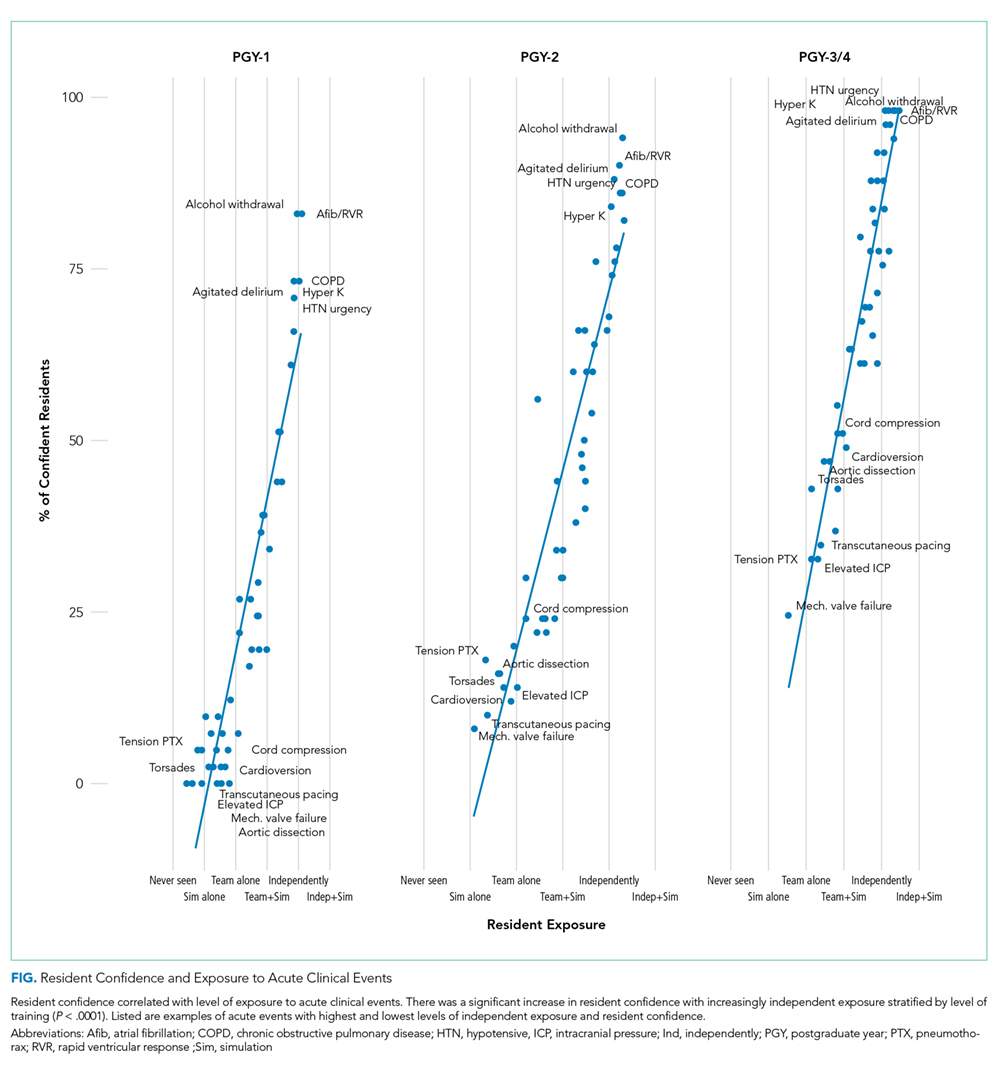
DISCUSSION
We developed an instrument to assess resident exposure to and confidence in managing 50 inpatient acute clinical events. Both exposure and level of training were associated with increasing resident confidence. We identified specific events with low levels of exposure and confidence that could be targeted for educational interventions.
To our knowledge, this is the first study to examine IM residents’ exposure to and confidence in managing a wide range of inpatient acute clinical events. A primary goal of residency is to provide physicians-in-training graduated responsibility to prepare them for eventual independent practice. Although our survey confirmed that IM residents’ exposure and confidence significantly increased as they advanced through training (a not unexpected finding), our data also show that even after controlling for year in training, independent exposures significantly correlated with increased confidence. This speaks to the importance of preserving opportunities for residents to manage critical events in a supported manner, an admittedly challenging prospect given the oft-competing calls for supervision of and mentored feedback for trainees.11
Despite identifying independent exposure as an important factor that impacts resident confidence, we found that there was still a substantial proportion of events (28.3%) that senior medical residents near the end of their training had not managed independently in a primary leadership role. Although our study was not designed to determine the reasons for this varied resident exposure, possible explanations may include the relative rarity of certain acute clinical events compared with others, or less likely the effect of duty hour limitations, attending supervision of trainees, or programmatic changes in resident leadership responsibilities. Whatever the cause, this finding uniquely identifies an area for improvement to prevent new attending physicians from feeling unprepared to manage potentially critical emergencies.
An important goal of our study was to develop an instrument that would enable training programs to identify their learning needs. Both program-wide and individual assessments of resident case exposure and confidence are essential for identifying such learning needs and areas for curricular development. Program-wide assessments can spur an important debate about program goals and requirements with respect to what scenarios residents must be able to manage competently by graduation.12 In addition, such assessments can help individualize learning exposures based on a specific learner’s needs and career goals. The administration of our survey instrument required minimal resources, and the high response rate in our study suggests that other programs can implement our instrument to accomplish these goals.
Alternative methods, such as electronic learning portfolios (efolios), can be utilized to assess resident case exposure. In comparison to our survey instrument, efolios limit recall bias by utilizing case logs and have additional capabilities such as compiling evaluations and enabling trainees to set learning goals. However, there are considerable barriers to the effective use of efolios, including software cost, learner attitudes, and time constraints.13 Tools such as our end-of-year assessment offer an alternative method that limits these barriers.
Once educational growth opportunities have been identified through survey-based or other methods, residency programs must determine how to optimize curricula for the needs and career goals of their trainees. We found considerable overlap among conditions that graduating residents had both limited exposure to and low confidence in managing (eg, torsades de pointes, tension pneumothorax, and emergency cardioversion), which are logical topics for future curriculum development. We also identified a few conditions (including PRES, TTP/HUS, and intracranial hemorrhage) that graduating residents did not feel confident in managing despite a relatively higher reported level of exposure. Whether to focus specific educational interventions on the most rare or most commonly encountered acute clinical events is likely to be a topic of debate among individual training programs, but the results of our survey indicate that there is likely to be educational benefit to both strategies.
Residency programs can employ a variety of modalities to enhance learner exposure and confidence in managing clinical scenarios that are deemed important by the program, including didactics, simulation, and changes in program structure. There is a substantial literature on the use of dedicated curricula for crisis management and the use of simulation as a training tool for responding to acute clinical events in multiple specialties14-24 and in nonmedical domains such as aviation.25-27 Simulation has been shown to improve residents’ clinical skills and comfort level with some acute events28-30 and may even be superior to traditional clinical medical education.31 In addition, programs can utilize targeted clinical experiences such as intensive care unit and subspecialty rotations32,33 in an effort to customize educational interventions to fill identified gaps in learner exposure or confidence.
Our study has several limitations. First, we investigated a single large IM residency program at a quaternary academic medical center, and therefore, our findings may not be externally generalizable to all IM residencies or other medical specialties. Our unique peer-led simulation curriculum, including 16 PGY-1 and 8 PGY-2 cases chosen based on clinical rotations at Massachusetts General Hospital,7 likely impacted residents’ exposure to simulation that is specific to our institution. However, although specific inpatient acute events may vary among other institutions, our finding that graduating residents still reported gaps in their clinical experience is likely generalizable to other programs given the varied and unpredictable nature of ward medicine training. In addition, our survey tool was simple to administer and could be tailored to reflect the acute events and training needs relevant to other residency programs, specialties, and institutions. Second, the retrospective nature of our study may be subject to participants’ recall bias. We did not restrict our survey questions to urgent conditions managed only on IM hospital wards and some may have been experienced in the emergency room or intensive care units; however, these exposures are still relevant as key components of IM training. Third, our list of 50 acute clinical events was intentionally broad and included several conditions that require multidisciplinary subspecialist consultation, which could have impacted residents’ self-report of “independent” exposures. However, these scenarios are ones that hospitalists may independently recognize and stabilize, engaging appropriate specialists. Fourth, we were not able to validate residents’ self-reported exposures against other measures of the frequency of housestaff management of acute events (such as billing data or patient logs) as this information is not routinely collected. We also did not attempt to identify the reasons underlying the variation seen in resident exposure and confidence for individual acute events, but as a needs assessment, this was beyond the scope of our study. Finally, our assessment of resident confidence was subjective and we were not able to assess competence, with prior studies demonstrating conflicting results regarding the relationship between self-reported proficiency and observed competence.34-36 Future studies are needed to investigate whether case exposure assessment leads to changes in residency curricula and whether such curricula increase resident confidence and competence in managing hospital acute clinical events.
CONCLUSION
We developed an easy-to-administer tool to assess IM residents’ exposure to and confidence in managing inpatient acute events. We found that both significantly increased as residents advanced through training, and self-reported confidence additionally correlated with level of exposure independent of PGY class. We identified several specific inpatient acute clinical events with low levels of resident exposure and confidence that can serve as targets for future IM residency curriculum development. Future studies assessing the impact of such curricula on resident confidence and competence are needed.
Disclosures
The authors declare no conflict of interest.
1. ACGME. The Internal Medicine Milestone Project. A joint initiative of the Accreditation Council for Graduate Medical Education and the American Board of Internal Medicine. http://www.acgme.org/Portals/0/PDFs/Milestones/InternalMedicineMilestones.pdf. Accessed July 14, 2018.
2. Neugut AI, Ghatak AT, Miller RL. Anaphylaxis in the United States: an investigation into its epidemiology. Arch Intern Med. 2001;161(1):15-21. PubMed
3. Lin GA, Beck DC, Stewart AL, Garbutt JM. Resident perceptions of the impact of work hour limitations. J Gen Intern Med. 2007;22(7):969-975. PubMed
4. Bolster L, Rourke L. The effect of restricting residents’ duty hours on patient safety, resident well-being, and resident education: an updated systematic review. J Grad Med Educ. 2015;7(3):349-363. PubMed
5. Wayne DB, Hauer KE. Counting quality, not hours: understanding the impact of duty hour reform on internal medicine residency education. J Gen Intern Med. 2012;27(11):1400-1401. PubMed
6. Hayes CW, Rhee A, Detsky ME, Leblanc VR, Wax RS. Residents feel unprepared and unsupervised as leaders of cardiac arrest teams in teaching hospitals: a survey of internal medicine residents. Crit Care Med. 2007;35(7):1668-1672. PubMed
7. Mathai SK, Miloslavsky EM, Contreras-Valdes FM, et al. How we implemented a resident-led medical simulation curriculum in a large internal medicine residency program. Med Teach. 2014;36(4):279-283. PubMed
8. The American Board of Internal Medicine. Internal Medicine Policies. http://www.abim.org/certification/policies/internal-medicine-subspecialty-policies/internal-medicine.aspx. Accessed January 24, 2018.
9. Sinz E, Navarro K, Soderberg ES. Advanced Cardiovascular Life Support. Dallas, TX: American Heart Association; 2011:1-183.
10. Finn KM, Metlay JP, Chang Y, et al. Effect of increased inpatient attending physician supervision on medical errors, patient safety, and resident education: a randomized clinical trial. JAMA Intern Med. 2018;178(7):952-959. PubMed
11. Happel JP, Ritter JB, Neubauer BE. Optimizing the balance between supervision and autonomy in training. JAMA Intern Med. 2018;178(7):959-960. PubMed
12. Fitzgibbons JP, Bordley DR, Berkowitz LR, Miller BW, Henderson MC. Redesigning residency education in internal medicine: a position paper from the association of program directors in internal medicine. Ann Intern Med. 2006;144(12):920. PubMed
13. Dekker H, Driessen E, Braak Ter E, et al. Mentoring portfolio use in undergraduate and postgraduate medical education. Med Teach. 2009;31(10):903-909. PubMed
14. Sica GT, Barron DM, Blum R, Frenna TH, Raemer DB. Computerized realistic simulation: a teaching module for crisis management in radiology. AJR Am J Roentgenol. 1999;172(2):301-304. PubMed
15. DeAnda A, Gaba DM. Role of experience in the response to simulated critical incidents. Anesth Analg. 1991;72(3):308-315. PubMed
16. Gaba DM, Maxwell M, DeAnda A. Anesthetic mishaps. Anesthesiology. 1987;66(5):670-676. PubMed
17. Arora S, Hull L, Fitzpatrick M, Sevdalis N, Birnbach DJ. Crisis management on surgical wards. Ann Surg. 2015;261(5):888-893. PubMed
18. Zirkle M, Blum R, Raemer DB, Healy G, Roberson DW. Teaching emergency airway management using medical simulation: a pilot program. Laryngoscope. 2005;115(3):495-500. PubMed
19. Volk MS, Ward J, Irias N, Navedo A, Pollart J, Weinstock PH. Using medical simulation to teach crisis resource management and decision-making skills to otolaryngology housestaff. Otolaryngol Head Neck Surg. 2011;145(1):35-42. PubMed
20. Bank I, Snell L, Bhanji F. Pediatric crisis resource management training improves emergency medicine trainees’ perceived ability to manage emergencies and ability to identify teamwork errors. Pediatr Emerg Care. 2014;30(12):879-883. PubMed
21. Blackwood J, Duff JP, Nettel-Aguirre A, Djogovic D, Joynt C. Does teaching crisis resource management skills improve resuscitation performance in pediatric residents?. Pediatr Crit Care Med. 2014;15(4):e168-e174. PubMed
22. Daniels K, Lipman S, Harney K, Arafeh J, Druzin M. Use of simulation based team training for obstetric crises in resident education. Simul Healthc. 2008;3(3):154-160. PubMed
23. Isaak RS, Stiegler MP. Review of crisis resource management (CRM) principles in the setting of intraoperative malignant hyperthermia. J Anesth. 2016;30(2):298-306. PubMed
24. Gaba D, DeAnda A. The response of anesthesia trainees to simulated critical incidents. Surv Anesth. 1989;33(6):349. PubMed
25. Ornato JP, Peberdy MA. Applying lessons from commercial aviation safety and operations to resuscitation. Resuscitation. 2014;85(2):173-176. PubMed
26. Hamman WR. Commentary: will simulation fly in medicine as it has in aviation? BMJ Qual Saf. 2004;13(5):397-399. PubMed
27. Littlepage GE, Hein MB, Richard G Moffett I, Craig PA, Georgiou AM. Team training for dynamic cross-functional teams in aviation: behavioral, cognitive, and performance outcomes. Hum Factors. 2016;58(8):1275-1288. PubMed
28. Wayne DB, Butter J, Siddall VJ, et al. Mastery learning of advanced cardiac life support skills by internal medicine residents using simulation technology and deliberate practice. J Gen Intern Med. 2006;21(3):251-256. PubMed
29. Heal
30. Kory PD, Eisen LA, Adachi M, Ribaudo VA, Rosenthal ME, Mayo PH. Initial airway management skills of senior residents. Chest. 2015;132(6):1927-1931. PubMed
31. McGaghie WC, Issenberg SB, Cohen ER, Barsuk JH, Wayne DB. Does simulation-based medical education with deliberate practice yield better results than traditional clinical education? A meta-analytic comparative review of the evidence. Acad Med. 2011;86(6):706-711. PubMed
32. Almoosa KF, Goldenhar LM, Puchalski J, Ying J, Panos RJ. Critical care education during internal medicine residency: a national survey. J Grad Med Educ. 2010;2(4):555-561. PubMed
33. Katz SJ, Oswald AE. How confident are internal medicine residents in rheumatology versus other common internal medicine clinical skills: an issue of training time or exposure? Clin Rheumatol. 2011;30(8):1081-1093. PubMed
34. Barnsley L, Lyon PM, Ralston SJ, et al. Clinical skills in junior medical officers: a comparison of self-reported confidence and observed competence. Med Educ. 2004;38(4):358-367. PubMed
35. Dehmer JJ, Amos KD, Farrell TM, Meyer AA, Newton WP, Meyers MO. Competence and confidence with basic procedural skills: the experience and opinions of fourth-year medical students at a single institution. Acad Med. 2013;88(5):682-687. PubMed
36. Wu EH, Elnicki DM, Alper EJ, et al. Procedural and interpretive skills of medical students: experiences and attitudes of fourth-year students. Acad Med. 2008;83(10):S63-S67. PubMed
Internal Medicine (IM) residency graduates are expected to manage a wide range of acute clinical events.1 Urgent and emergent inpatient situations require a broad knowledge base for rapid bedside diagnosis, yet the essential clinical skills required to manage acute clinical events pose a unique training challenge given the rarity and high-stakes nature of several such emergencies. For example, in three years of residency, a trainee may never have the opportunity to manage anaphylaxis, yet IM graduates must be able to recognize and quickly initiate proper lifesaving treatment for this relatively rare event2 when it does occur.
In an era of work-hour limitations and heightened trainee supervision, residents perceive diminished familiarity with several clinical situations3-5 and may feel unprepared to handle crisis events such as cardiac arrest.6 Given the sporadic nature of clinical medicine, many residents may not be exposed to certain acute inpatient clinical scenarios by the end of their training, a potentially critical education gap. To our knowledge, IM residents’ level of exposure to acute clinical events has not previously been studied. The aims of this study were to develop an instrument aimed at assessing IM residents’ exposure to hospital acute clinical events at a large academic medical center and to investigate the relationship between exposure and confidence in managing these events.
METHODS
Survey Development
We reviewed the Massachusetts General Hospital (MGH) IM residency program curriculum (including simulation, conferences, and other didactics), the American Board of Internal Medicine certification requirements (primarily related to Advanced Cardiac Life Support [ACLS]), and the MGH inpatient rapid response events and gained input from the IM program leadership to develop a list of 50 acute clinical events that a graduating resident may be expected to manage independently (Box 1, Supplementary Appendix).7-9 We then developed a survey assessing residents’ exposure to and confidence in managing such events. To classify the level of exposure, residents were asked to distinguish whether they had managed these events during a simulation session, inpatient as a part of a team, or inpatient independently. At our institution, IM postgraduate year 1 (PGY-1) interns manage a floor of patients overnight under a senior resident’s supervision, PGY-2 residents manage a team of several interns often without attending presence on ward rounds,10 and senior PGY-3 or -4 residents are expected to lead the hospital’s rapid response and code team and triage decompensating patients to the intensive care unit. Therefore, there are ample opportunities for IM residents to manage conditions independently (ie, in a direct leadership role) with attending supervision. House officers’ role in medical management, including calling appropriate subspecialty consultation, depends on the clinical condition; for example, a graduating senior resident would be expected to evaluate comprehensively a hypotensive patient and diagnose tension pneumothorax (while calling interventional pulmonary support for needle decompression and chest tube placement) and independently run an ACLS algorithm in the case of an unstable arrhythmia or cardiac arrest.
Residents were also asked to rate their perceived confidence in managing each condition independently on a five-point scale (ranging from “definitely cannot manage this condition independently” to “definitely can manage this condition independently”). We refined the survey instrument through a collaborative, iterative review process, including cognitive interviews and piloting with IM subspecialty fellows.
Participants and Data Collection
All IM residents at the Massachusetts General Hospital were invited to participate in the study. The study was conducted in May 2015 to reflect training throughout the prior academic year(s) and allow us to evaluate graduating residents’ exposures across all prior years of training. The instrument was administered anonymously via a web-based survey tool, Qualtrics (Provo, Utah). The study was approved as exempt by the Partners Institutional Review Board.
Data Analysis
Residents’ self-reported exposure to hospital acute events was classified into the following six ordinal categories: (1) never seen (have never seen the condition under any circumstances); (2) simulation alone (have managed the condition only during a mannequin-simulated patient case); (3) team alone (have managed the condition inpatient as a part of a team of providers, not in a primary leadership role); (4) team plus simulation; (5) independently (have managed the condition inpatient alone or in a primary leadership role); and (6) independently plus simulation. Residents’ self-reported exposure was examined for each postgraduate year (PGY) class both in aggregate and for each individual acute event. We sought to identify events that the majority of residents had managed independently (85% of residents or greater) and less common events that at least 15% of residents had never experienced.
We also examined residents’ self-reported confidence for each PGY class in aggregate and for each clinical acute scenario. Confidence was investigated in a dichotomized manner with a “definitely can” rating indicating “Confident” and with “probably can,” “neutral,” “probably cannot,” or “definitely cannot” ratings indicating “Not Confident” to manage the condition independently. Dichotomization thus allowed us to set a high bar for confidence, reflecting the self-perceived ability of the residents to manage the conditions as future independent physicians.
We used logistic regression models with the generalized estimating equations (GEE) approach to take into account the repeated measures of 50 clinical acute clinical events assessed for each resident. We compared the distribution of self-reported exposure and confidence among different PGY classes and examined the relationship between confidence and self-reported exposure stratified by level of training. We also assessed the independent effect of exposure on confidence controlling for level of training in a multivariable logistic regression model.
RESULTS
A total of 140 of 170 IM residents completed the survey (82% overall response rate: 72% of all PGY-1 residents, 86% of PGY-2 residents, and 89% of PGY-3/4 residents). In total, 41 PGY-1 residents (29% of respondents), 50 PGY-2 residents (36%), and 49 PGY-3 or PGY-4 residents (35%) participated. The majority of residents were in the Categorical IM training track (106 residents, 76% of respondents), whereas the remainder of respondents were in various subspecialty training tracks within our IM residency program, including Primary Care (14 residents, 10%), and four-year tracks, including Global Health (six residents, 4%), and Medicine-Pediatrics (14 residents, 10%).
Assessment of Exposure
Residents reported increasingly independent exposures as they progressed through residency training. PGY-1 residents on average had never seen 16.3% of the 50 acute events, whereas PGY-3/4 residents had never seen only 4.0% of the events (P < .0001). PGY-1 residents had managed 31.3% of events independently (or both independently and in simulation) as opposed to 71.7% of events for PGY-3/4 residents (P < .0001). Simulation alone accounted for a substantial proportion of exposures (16.4%) for PGY-1 residents, but this was significantly lower for PGY-2 or PGY-3/4 residents (P < .0001), who reported a greater percentage of exposures in nonsimulation clinical scenarios either independently or as a part of an inpatient team. There were no outlier residents who reported lower exposure compared with their PGY peers.
There was a wide spectrum of resident-reported exposures when individual acute events were examined (Table, full data in Supplementary Appendix Table 1). Events with the highest levels of exposure, which >85% of PGY-1 residents had managed independently, included alcohol withdrawal, chronic obstructive pulmonary disease exacerbation, rapid atrial fibrillation, agitated delirium, hypertensive urgency, and hyperkalemia. Events with the lowest levels of exposure, which at least 15% of graduating residents had never encountered in the hospital, included the following eight of 50 events (16%): torsades de pointes (51% of PGY-3/4 residents), acute mechanical valve failure (49%), tension pneumothorax (38.8%), use of emergency transcutaneous pacing (38.8%), elevated intracranial pressure (ICP)/herniation (24.5%), aortic dissection (22.4%), cord compression (16.3%), and use of emergency cardioversion (16.3%). Several PGY-3/4 residents had managed several of these events only in mannequin simulations, including torsades de pointes (41%), transcutaneous pacing (33%), and tension pneumothorax (24%).
Assessment of Confidence
Both levels of training and exposure to acute events were associated with increased confidence in managing such events. PGY-1 residents felt confident in managing 24.9% of acute events independently, compared to 48.4% of events for PGY-2 residents and 72.5% of events for PGY-3/4 residents (P < .0001). There was considerable variation in confidence among the individual acute events (Supplementary Appendix Table 2). A majority of graduating PGY-3/4 residents did not feel confident in managing the following 10 of the 50 events (20%): use of emergency cardioversion, aortic dissection, thrombotic thrombocytopenic purpura/hemolytic uremic syndrome (TTP/HUS), torsades de pointes, posterior reversible encephalopathy syndrome (PRES), intracranial hemorrhage, use of emergency transcutaneous pacing, tension pneumothorax, elevated ICP/herniation, and acute mechanical valve failure.
Residents’ self-reported confidence also correlated with level of exposure. There was a significant increase in resident confidence with increasingly independent exposure stratified by level of training (Figure; all with P < .0001). In the multivariable logistic regression model, increasing exposure correlated with increased resident confidence (P < .0001) while controlling for PGY year (P = .001).
DISCUSSION
We developed an instrument to assess resident exposure to and confidence in managing 50 inpatient acute clinical events. Both exposure and level of training were associated with increasing resident confidence. We identified specific events with low levels of exposure and confidence that could be targeted for educational interventions.
To our knowledge, this is the first study to examine IM residents’ exposure to and confidence in managing a wide range of inpatient acute clinical events. A primary goal of residency is to provide physicians-in-training graduated responsibility to prepare them for eventual independent practice. Although our survey confirmed that IM residents’ exposure and confidence significantly increased as they advanced through training (a not unexpected finding), our data also show that even after controlling for year in training, independent exposures significantly correlated with increased confidence. This speaks to the importance of preserving opportunities for residents to manage critical events in a supported manner, an admittedly challenging prospect given the oft-competing calls for supervision of and mentored feedback for trainees.11
Despite identifying independent exposure as an important factor that impacts resident confidence, we found that there was still a substantial proportion of events (28.3%) that senior medical residents near the end of their training had not managed independently in a primary leadership role. Although our study was not designed to determine the reasons for this varied resident exposure, possible explanations may include the relative rarity of certain acute clinical events compared with others, or less likely the effect of duty hour limitations, attending supervision of trainees, or programmatic changes in resident leadership responsibilities. Whatever the cause, this finding uniquely identifies an area for improvement to prevent new attending physicians from feeling unprepared to manage potentially critical emergencies.
An important goal of our study was to develop an instrument that would enable training programs to identify their learning needs. Both program-wide and individual assessments of resident case exposure and confidence are essential for identifying such learning needs and areas for curricular development. Program-wide assessments can spur an important debate about program goals and requirements with respect to what scenarios residents must be able to manage competently by graduation.12 In addition, such assessments can help individualize learning exposures based on a specific learner’s needs and career goals. The administration of our survey instrument required minimal resources, and the high response rate in our study suggests that other programs can implement our instrument to accomplish these goals.
Alternative methods, such as electronic learning portfolios (efolios), can be utilized to assess resident case exposure. In comparison to our survey instrument, efolios limit recall bias by utilizing case logs and have additional capabilities such as compiling evaluations and enabling trainees to set learning goals. However, there are considerable barriers to the effective use of efolios, including software cost, learner attitudes, and time constraints.13 Tools such as our end-of-year assessment offer an alternative method that limits these barriers.
Once educational growth opportunities have been identified through survey-based or other methods, residency programs must determine how to optimize curricula for the needs and career goals of their trainees. We found considerable overlap among conditions that graduating residents had both limited exposure to and low confidence in managing (eg, torsades de pointes, tension pneumothorax, and emergency cardioversion), which are logical topics for future curriculum development. We also identified a few conditions (including PRES, TTP/HUS, and intracranial hemorrhage) that graduating residents did not feel confident in managing despite a relatively higher reported level of exposure. Whether to focus specific educational interventions on the most rare or most commonly encountered acute clinical events is likely to be a topic of debate among individual training programs, but the results of our survey indicate that there is likely to be educational benefit to both strategies.
Residency programs can employ a variety of modalities to enhance learner exposure and confidence in managing clinical scenarios that are deemed important by the program, including didactics, simulation, and changes in program structure. There is a substantial literature on the use of dedicated curricula for crisis management and the use of simulation as a training tool for responding to acute clinical events in multiple specialties14-24 and in nonmedical domains such as aviation.25-27 Simulation has been shown to improve residents’ clinical skills and comfort level with some acute events28-30 and may even be superior to traditional clinical medical education.31 In addition, programs can utilize targeted clinical experiences such as intensive care unit and subspecialty rotations32,33 in an effort to customize educational interventions to fill identified gaps in learner exposure or confidence.
Our study has several limitations. First, we investigated a single large IM residency program at a quaternary academic medical center, and therefore, our findings may not be externally generalizable to all IM residencies or other medical specialties. Our unique peer-led simulation curriculum, including 16 PGY-1 and 8 PGY-2 cases chosen based on clinical rotations at Massachusetts General Hospital,7 likely impacted residents’ exposure to simulation that is specific to our institution. However, although specific inpatient acute events may vary among other institutions, our finding that graduating residents still reported gaps in their clinical experience is likely generalizable to other programs given the varied and unpredictable nature of ward medicine training. In addition, our survey tool was simple to administer and could be tailored to reflect the acute events and training needs relevant to other residency programs, specialties, and institutions. Second, the retrospective nature of our study may be subject to participants’ recall bias. We did not restrict our survey questions to urgent conditions managed only on IM hospital wards and some may have been experienced in the emergency room or intensive care units; however, these exposures are still relevant as key components of IM training. Third, our list of 50 acute clinical events was intentionally broad and included several conditions that require multidisciplinary subspecialist consultation, which could have impacted residents’ self-report of “independent” exposures. However, these scenarios are ones that hospitalists may independently recognize and stabilize, engaging appropriate specialists. Fourth, we were not able to validate residents’ self-reported exposures against other measures of the frequency of housestaff management of acute events (such as billing data or patient logs) as this information is not routinely collected. We also did not attempt to identify the reasons underlying the variation seen in resident exposure and confidence for individual acute events, but as a needs assessment, this was beyond the scope of our study. Finally, our assessment of resident confidence was subjective and we were not able to assess competence, with prior studies demonstrating conflicting results regarding the relationship between self-reported proficiency and observed competence.34-36 Future studies are needed to investigate whether case exposure assessment leads to changes in residency curricula and whether such curricula increase resident confidence and competence in managing hospital acute clinical events.
CONCLUSION
We developed an easy-to-administer tool to assess IM residents’ exposure to and confidence in managing inpatient acute events. We found that both significantly increased as residents advanced through training, and self-reported confidence additionally correlated with level of exposure independent of PGY class. We identified several specific inpatient acute clinical events with low levels of resident exposure and confidence that can serve as targets for future IM residency curriculum development. Future studies assessing the impact of such curricula on resident confidence and competence are needed.
Disclosures
The authors declare no conflict of interest.
1. ACGME. The Internal Medicine Milestone Project. A joint initiative of the Accreditation Council for Graduate Medical Education and the American Board of Internal Medicine. http://www.acgme.org/Portals/0/PDFs/Milestones/InternalMedicineMilestones.pdf. Accessed July 14, 2018.
2. Neugut AI, Ghatak AT, Miller RL. Anaphylaxis in the United States: an investigation into its epidemiology. Arch Intern Med. 2001;161(1):15-21. PubMed
3. Lin GA, Beck DC, Stewart AL, Garbutt JM. Resident perceptions of the impact of work hour limitations. J Gen Intern Med. 2007;22(7):969-975. PubMed
4. Bolster L, Rourke L. The effect of restricting residents’ duty hours on patient safety, resident well-being, and resident education: an updated systematic review. J Grad Med Educ. 2015;7(3):349-363. PubMed
5. Wayne DB, Hauer KE. Counting quality, not hours: understanding the impact of duty hour reform on internal medicine residency education. J Gen Intern Med. 2012;27(11):1400-1401. PubMed
6. Hayes CW, Rhee A, Detsky ME, Leblanc VR, Wax RS. Residents feel unprepared and unsupervised as leaders of cardiac arrest teams in teaching hospitals: a survey of internal medicine residents. Crit Care Med. 2007;35(7):1668-1672. PubMed
7. Mathai SK, Miloslavsky EM, Contreras-Valdes FM, et al. How we implemented a resident-led medical simulation curriculum in a large internal medicine residency program. Med Teach. 2014;36(4):279-283. PubMed
8. The American Board of Internal Medicine. Internal Medicine Policies. http://www.abim.org/certification/policies/internal-medicine-subspecialty-policies/internal-medicine.aspx. Accessed January 24, 2018.
9. Sinz E, Navarro K, Soderberg ES. Advanced Cardiovascular Life Support. Dallas, TX: American Heart Association; 2011:1-183.
10. Finn KM, Metlay JP, Chang Y, et al. Effect of increased inpatient attending physician supervision on medical errors, patient safety, and resident education: a randomized clinical trial. JAMA Intern Med. 2018;178(7):952-959. PubMed
11. Happel JP, Ritter JB, Neubauer BE. Optimizing the balance between supervision and autonomy in training. JAMA Intern Med. 2018;178(7):959-960. PubMed
12. Fitzgibbons JP, Bordley DR, Berkowitz LR, Miller BW, Henderson MC. Redesigning residency education in internal medicine: a position paper from the association of program directors in internal medicine. Ann Intern Med. 2006;144(12):920. PubMed
13. Dekker H, Driessen E, Braak Ter E, et al. Mentoring portfolio use in undergraduate and postgraduate medical education. Med Teach. 2009;31(10):903-909. PubMed
14. Sica GT, Barron DM, Blum R, Frenna TH, Raemer DB. Computerized realistic simulation: a teaching module for crisis management in radiology. AJR Am J Roentgenol. 1999;172(2):301-304. PubMed
15. DeAnda A, Gaba DM. Role of experience in the response to simulated critical incidents. Anesth Analg. 1991;72(3):308-315. PubMed
16. Gaba DM, Maxwell M, DeAnda A. Anesthetic mishaps. Anesthesiology. 1987;66(5):670-676. PubMed
17. Arora S, Hull L, Fitzpatrick M, Sevdalis N, Birnbach DJ. Crisis management on surgical wards. Ann Surg. 2015;261(5):888-893. PubMed
18. Zirkle M, Blum R, Raemer DB, Healy G, Roberson DW. Teaching emergency airway management using medical simulation: a pilot program. Laryngoscope. 2005;115(3):495-500. PubMed
19. Volk MS, Ward J, Irias N, Navedo A, Pollart J, Weinstock PH. Using medical simulation to teach crisis resource management and decision-making skills to otolaryngology housestaff. Otolaryngol Head Neck Surg. 2011;145(1):35-42. PubMed
20. Bank I, Snell L, Bhanji F. Pediatric crisis resource management training improves emergency medicine trainees’ perceived ability to manage emergencies and ability to identify teamwork errors. Pediatr Emerg Care. 2014;30(12):879-883. PubMed
21. Blackwood J, Duff JP, Nettel-Aguirre A, Djogovic D, Joynt C. Does teaching crisis resource management skills improve resuscitation performance in pediatric residents?. Pediatr Crit Care Med. 2014;15(4):e168-e174. PubMed
22. Daniels K, Lipman S, Harney K, Arafeh J, Druzin M. Use of simulation based team training for obstetric crises in resident education. Simul Healthc. 2008;3(3):154-160. PubMed
23. Isaak RS, Stiegler MP. Review of crisis resource management (CRM) principles in the setting of intraoperative malignant hyperthermia. J Anesth. 2016;30(2):298-306. PubMed
24. Gaba D, DeAnda A. The response of anesthesia trainees to simulated critical incidents. Surv Anesth. 1989;33(6):349. PubMed
25. Ornato JP, Peberdy MA. Applying lessons from commercial aviation safety and operations to resuscitation. Resuscitation. 2014;85(2):173-176. PubMed
26. Hamman WR. Commentary: will simulation fly in medicine as it has in aviation? BMJ Qual Saf. 2004;13(5):397-399. PubMed
27. Littlepage GE, Hein MB, Richard G Moffett I, Craig PA, Georgiou AM. Team training for dynamic cross-functional teams in aviation: behavioral, cognitive, and performance outcomes. Hum Factors. 2016;58(8):1275-1288. PubMed
28. Wayne DB, Butter J, Siddall VJ, et al. Mastery learning of advanced cardiac life support skills by internal medicine residents using simulation technology and deliberate practice. J Gen Intern Med. 2006;21(3):251-256. PubMed
29. Heal
30. Kory PD, Eisen LA, Adachi M, Ribaudo VA, Rosenthal ME, Mayo PH. Initial airway management skills of senior residents. Chest. 2015;132(6):1927-1931. PubMed
31. McGaghie WC, Issenberg SB, Cohen ER, Barsuk JH, Wayne DB. Does simulation-based medical education with deliberate practice yield better results than traditional clinical education? A meta-analytic comparative review of the evidence. Acad Med. 2011;86(6):706-711. PubMed
32. Almoosa KF, Goldenhar LM, Puchalski J, Ying J, Panos RJ. Critical care education during internal medicine residency: a national survey. J Grad Med Educ. 2010;2(4):555-561. PubMed
33. Katz SJ, Oswald AE. How confident are internal medicine residents in rheumatology versus other common internal medicine clinical skills: an issue of training time or exposure? Clin Rheumatol. 2011;30(8):1081-1093. PubMed
34. Barnsley L, Lyon PM, Ralston SJ, et al. Clinical skills in junior medical officers: a comparison of self-reported confidence and observed competence. Med Educ. 2004;38(4):358-367. PubMed
35. Dehmer JJ, Amos KD, Farrell TM, Meyer AA, Newton WP, Meyers MO. Competence and confidence with basic procedural skills: the experience and opinions of fourth-year medical students at a single institution. Acad Med. 2013;88(5):682-687. PubMed
36. Wu EH, Elnicki DM, Alper EJ, et al. Procedural and interpretive skills of medical students: experiences and attitudes of fourth-year students. Acad Med. 2008;83(10):S63-S67. PubMed
© 2019 Society of Hospital Medicine
See None, Do None, Teach None? The Idiosyncratic Nature of Graduate Medical Education
Graduate medical education (GME) is heavily reliant on experiential learning. Most of a resident’s time is spent in progressively independent delivery of patient care, which is associated with decreasing supervision. Attainment and demonstration of competence in patient care is the goal and responsibility of GME training programs. What happens, then, if the medicine resident never has the experience necessary to enable experiential learning? What if she never “sees one,” let alone “does one”?
In this month’s Journal of Hospital Medicine, Sclafani et al1 examine how exposure to urgent clinical situations impacts residents’ confidence in managing these ward emergencies. They astutely reveal the idiosyncratic nature of residency training and consequent gaps created when an educational delivery model predicated on experience lacks certain experiences. How can a resident without certain key experiences be ready for independent practice?
The ACGME’s Next Accreditation System is intended to ensure that residents are prepared for independent practice. The educational outcomes that learners must attain are comprised of six core competencies, with milestones intended to operationalize the measurement and reporting of learner progression toward competence.2,3 It is challenging to apply general competencies to assessment of day to day clinical activities. This challenge led to the development of 16 Entrustable Professional Activities (EPAs). These allow the direct observation of concrete clinical activities that could then infer the attainment (or not) of multiple competencies. Ideally, EPAs are paired with and mapped to curricular milestones which describe a learner’s trajectory within the framework of competencies and determine if a resident is prepared for independent practice.4,5
In Sclafani et al.1 the authors characterize resident exposure to, and confidence in, 50 urgent clinical situations. Both level of training and exposure were associated with increased confidence. However, the most important finding of this paper is the wide variation of resident exposures and confidence with respect to specific urgent clinical events. At least 15% of graduating residents had never seen 16% of the 50 emergency events, and a majority of
Several factors account for the idiosyncratic nature of medical training, including the rarity of certain clinical events, seasonal variation in conditions, and other variables (ie, learner elective choices). In addition, the scheduling of most residency programs is based on patient care needs instead of individual trainees’ educational needs. Other areas of medicine have attempted to standardize experience and ensure specific exposure and/or competence using strategies such as surgical case logs and case-based certifying examinations. There are very important recently described projects in undergraduate medical education aimed at using longitudinal assessment of EPAs in multiple contexts to make entrustment decisions.6 However, Internal Medicine residencies do not routinely employ these strategies.
It must be noted that Sclafani et al. surveyed residents from only one site, and examined only self-reported exposure and confidence, not competence. The relationship between confidence and competence is notoriously problematic7 and there is a risk of familiarity creating an illusion of knowledge and/or competence. Ultimately, a competency-based medical system is intended to be dynamic, adaptive, and contextual. Despite the extensive competency-based framework in place to track the development of physicians, data about the contexts in which competency is demonstrated are lacking. There is no reason to think that the key gaps identified in Sclafani et al are unique to their institution.
Given the ultimate goal of developing curricula that prepare residents for independent practice coupled with robust systems of assessment that ensure they are ready to do so, educators must implement strategies to identify and alleviate the idiosyncrasy of the resident experience. The survey tool in the present work could be used as a needs assessment and would require minimal resources, but is limited by recall bias, illusion of knowledge, and lack of data regarding actual competence. Other potential strategies include case logs or e-folios, although these tools are also limited by the understanding that familiarity and exposure do not necessarily engender competence.
One potential strategy suggested by Warm et al. is the addition of the “Observable Practice Activities” (OPA), “a collection of learning objectives/activities that must be observed in daily practice in order to form entrustment decisions.”8 The intention is to more granularly define what residents actually do and then map these activities to the established competency-based framework. Using these observable activities as an assessment unit may allow for identification of individual experience gaps, thereby improving the dynamicity and adaptiveness of GME training. Certainly, there are very real concerns about further complicating an already complex and abstract system and using a reductionist approach to define the activities of a profession. However, the findings of Sclafani et al with respect to the wide range of resident experience elucidates the need for continued study and innovation regarding the manner in which the medical education community determines our trainees are prepared for independent practice.
Disclosures
The authors have nothing to disclose.
1. Sclafani A, Currier P, Chang Y, Eromo E, Raemer D, Miloslavsky E. Internal Medicine Residents’ Exposure to and Confidence in Managing Ward Emergencies. J Hosp Med. 2019;14(4):218-223. PubMed
2. Holmboe ES, Call S, Ficalora RD. Milestones and Competency-Based Medical Education in Internal Medicine. JAMA Intern Med. 2016;176(11):1601. PubMed
3. Hauer KE, Vandergrift J, Lipner RS, Holmboe ES, Hood S, McDonald FS. National Internal Medicine Milestone Ratings. Acad Med. 2018;93(8):1189-1204. PubMed
4. Ten Cate O, Scheele F, Ten Cate TJ. Viewpoint: Competency-based postgraduate training: Can we bridge the gap between theory and clinical practice? Acad Med. 2007;82(6):542-547. PubMed
5. Caverzagie KJ, Cooney TG, Hemmer PA, Berkowitz L. The development of entrustable professional activities for internal medicine residency training: A report from the Education Redesign Committee of the Alliance for Academic Internal Medicine. Acad Med. 2015;90(4):479-484. PubMed
6. Murray KE, Lane JL, Carraccio C, et al. Crossing the Gap. Acad Med. November 2018:1. PubMed
7. Davis DA, Mazmanian PE, Fordis M, Van Harrison R, Thorpe KE, Perrier L. Accuracy of Physician Self-assessment Compared With Observed Measures of Competence. JAMA. 2006;296(9):1094. PubMed
8. Warm EJ, Mathis BR, Held JD, et al. Entrustment and mapping of observable practice activities for resident assessment. J Gen Intern Med. 2014;29(8):1177-1182. PubMed
Graduate medical education (GME) is heavily reliant on experiential learning. Most of a resident’s time is spent in progressively independent delivery of patient care, which is associated with decreasing supervision. Attainment and demonstration of competence in patient care is the goal and responsibility of GME training programs. What happens, then, if the medicine resident never has the experience necessary to enable experiential learning? What if she never “sees one,” let alone “does one”?
In this month’s Journal of Hospital Medicine, Sclafani et al1 examine how exposure to urgent clinical situations impacts residents’ confidence in managing these ward emergencies. They astutely reveal the idiosyncratic nature of residency training and consequent gaps created when an educational delivery model predicated on experience lacks certain experiences. How can a resident without certain key experiences be ready for independent practice?
The ACGME’s Next Accreditation System is intended to ensure that residents are prepared for independent practice. The educational outcomes that learners must attain are comprised of six core competencies, with milestones intended to operationalize the measurement and reporting of learner progression toward competence.2,3 It is challenging to apply general competencies to assessment of day to day clinical activities. This challenge led to the development of 16 Entrustable Professional Activities (EPAs). These allow the direct observation of concrete clinical activities that could then infer the attainment (or not) of multiple competencies. Ideally, EPAs are paired with and mapped to curricular milestones which describe a learner’s trajectory within the framework of competencies and determine if a resident is prepared for independent practice.4,5
In Sclafani et al.1 the authors characterize resident exposure to, and confidence in, 50 urgent clinical situations. Both level of training and exposure were associated with increased confidence. However, the most important finding of this paper is the wide variation of resident exposures and confidence with respect to specific urgent clinical events. At least 15% of graduating residents had never seen 16% of the 50 emergency events, and a majority of
Several factors account for the idiosyncratic nature of medical training, including the rarity of certain clinical events, seasonal variation in conditions, and other variables (ie, learner elective choices). In addition, the scheduling of most residency programs is based on patient care needs instead of individual trainees’ educational needs. Other areas of medicine have attempted to standardize experience and ensure specific exposure and/or competence using strategies such as surgical case logs and case-based certifying examinations. There are very important recently described projects in undergraduate medical education aimed at using longitudinal assessment of EPAs in multiple contexts to make entrustment decisions.6 However, Internal Medicine residencies do not routinely employ these strategies.
It must be noted that Sclafani et al. surveyed residents from only one site, and examined only self-reported exposure and confidence, not competence. The relationship between confidence and competence is notoriously problematic7 and there is a risk of familiarity creating an illusion of knowledge and/or competence. Ultimately, a competency-based medical system is intended to be dynamic, adaptive, and contextual. Despite the extensive competency-based framework in place to track the development of physicians, data about the contexts in which competency is demonstrated are lacking. There is no reason to think that the key gaps identified in Sclafani et al are unique to their institution.
Given the ultimate goal of developing curricula that prepare residents for independent practice coupled with robust systems of assessment that ensure they are ready to do so, educators must implement strategies to identify and alleviate the idiosyncrasy of the resident experience. The survey tool in the present work could be used as a needs assessment and would require minimal resources, but is limited by recall bias, illusion of knowledge, and lack of data regarding actual competence. Other potential strategies include case logs or e-folios, although these tools are also limited by the understanding that familiarity and exposure do not necessarily engender competence.
One potential strategy suggested by Warm et al. is the addition of the “Observable Practice Activities” (OPA), “a collection of learning objectives/activities that must be observed in daily practice in order to form entrustment decisions.”8 The intention is to more granularly define what residents actually do and then map these activities to the established competency-based framework. Using these observable activities as an assessment unit may allow for identification of individual experience gaps, thereby improving the dynamicity and adaptiveness of GME training. Certainly, there are very real concerns about further complicating an already complex and abstract system and using a reductionist approach to define the activities of a profession. However, the findings of Sclafani et al with respect to the wide range of resident experience elucidates the need for continued study and innovation regarding the manner in which the medical education community determines our trainees are prepared for independent practice.
Disclosures
The authors have nothing to disclose.
1. Sclafani A, Currier P, Chang Y, Eromo E, Raemer D, Miloslavsky E. Internal Medicine Residents’ Exposure to and Confidence in Managing Ward Emergencies. J Hosp Med. 2019;14(4):218-223. PubMed
2. Holmboe ES, Call S, Ficalora RD. Milestones and Competency-Based Medical Education in Internal Medicine. JAMA Intern Med. 2016;176(11):1601. PubMed
3. Hauer KE, Vandergrift J, Lipner RS, Holmboe ES, Hood S, McDonald FS. National Internal Medicine Milestone Ratings. Acad Med. 2018;93(8):1189-1204. PubMed
4. Ten Cate O, Scheele F, Ten Cate TJ. Viewpoint: Competency-based postgraduate training: Can we bridge the gap between theory and clinical practice? Acad Med. 2007;82(6):542-547. PubMed
5. Caverzagie KJ, Cooney TG, Hemmer PA, Berkowitz L. The development of entrustable professional activities for internal medicine residency training: A report from the Education Redesign Committee of the Alliance for Academic Internal Medicine. Acad Med. 2015;90(4):479-484. PubMed
6. Murray KE, Lane JL, Carraccio C, et al. Crossing the Gap. Acad Med. November 2018:1. PubMed
7. Davis DA, Mazmanian PE, Fordis M, Van Harrison R, Thorpe KE, Perrier L. Accuracy of Physician Self-assessment Compared With Observed Measures of Competence. JAMA. 2006;296(9):1094. PubMed
8. Warm EJ, Mathis BR, Held JD, et al. Entrustment and mapping of observable practice activities for resident assessment. J Gen Intern Med. 2014;29(8):1177-1182. PubMed
© 2019 Society of Hospital Medicine
Contemporary Rates of Preoperative Cardiac Testing Prior to Inpatient Hip Fracture Surgery
Hip fracture is a common reason for unexpected, urgent inpatient surgery in older patients. In 2005, the incidence of hip fracture was 369.0 and 793.5 per 100,000 in men and women respectively.1 These numbers declined over the preceding decade, potentially as a result of bisphosphonate use. Age- and risk-adjusted 30-day mortality rates for men and women in 2005 were approximately 10% and 5%, respectively.
Evidence suggests that timely surgical repair of hip fractures improves outcomes, although the optimal timing is controversial. Guidelines from the American College of Surgeons Committee on Trauma from 2015 recommend surgical intervention within 48 hours for geriatric hip fracures.2 A 2008 systematic review found that operative delay beyond 48 hours was associated with a 41% increase in 30-day all-cause mortality and a 32% increase in one-year all-cause mortality.3 Recent evidence suggests that the rate of complications begins to increase with delays beyond 24 hours.4
There has been a focus over the past decade on overuse of preoperative testing for low- and intermediate-risk surgeries.5-7 Beginning in 2012, the American Board of Internal Medicine initiated the Choosing Wisely® campaign in which numerous societies issued recommendations on reducing utilization of various diagnostic tests, a number of which have focused on preoperative tests. Two groups—the American Society of Anesthesiologists (ASA) and the American Society of Echocardiography (ASE)— issued specific recommendations on preoperative cardiac testing.8 In February 2013, the ASE recommended avoiding preoperative echocardiograms in patients without a history or symptoms of heart disease. In October 2013, the ASA recommended against transthoracic echocardiogram (TTE), transesophageal echocardiogram (TEE), or stress testing for low- or intermediate-risk noncardiac surgery for patients with stable cardiac disease.
Finally, in 2014, the American College of Cardiology (ACC)/American Heart Association (AHA) issued updated perioperative guidelines for patients undergoing noncardiac surgeries.9 They recommended preoperative stress testing only in a small subset of cases (patients with an elevated perioperative risk of major adverse cardiac event, a poor or unknown functional capacity, or those in whom stress testing would impact perioperative care).
Given the high cost of preoperative cardiac testing, the potential for delays in care that can adversely impact outcomes, and the recent recommendations, we sought to characterize the rates of inpatient preoperative cardiac testing prior to hip fracture surgery in recent years and to see whether recent recommendations to curb use of these tests were temporally associated with changing rates.
METHODS
Overview
We utilized two datasets—the Healthcare Cost and Utilization Project (HCUP) State Inpatient Databases (SID) and the American Hospital Association (AHA) Annual Survey—to characterize preoperative cardiac testing. SID data from Maryland, New Jersey, and Washington State from 2011 through September 2015 were used (the ICD coding system changed from ICD9 to ICD10 on October 1). This was combined with AHA data for these years. We included all hospitalizations with a primary ICD9 procedure code for hip fracture repair—78.55, 78.65, 79.05, 79.15, 79.25, 79.35, 79.45, 79.55, 79.65, 79.75, 79.85, and 79.95. We excluded all observations that involved an interhospital transfer. This study was exempt from institutional review board approval.
Measurement and Outcomes
We summarized demographic data for the hospitalizations that met the inclusion criteria as well as the associated hospitals. The primary outcome was the percentage of patients undergoing TTE, stress test, and cardiac catheterization during a hospitalization with a primary procedure code of hip fracture repair. Random effects logistic regression models for each type of diagnostic test were developed to determine the factors that might impact test utilization. In addition to running each test as a separate model, we also performed an analysis in which the outcome was performance of any of these three cardiac tests. Random effects were used to account for clustering of testing within hospitals. Variables included time (3-month intervals), state, age (continuous variable), gender, length of stay, payer (Medicare/Medicaid/private insurance/self-pay/other), hospital teaching status (major teaching/minor teaching/nonteaching), hospital size according to number of beds (continuous variable), and mortality score. Major teaching hospitals are defined as members of the Council of Teaching Hospitals. Minor teaching hospitals are defined as (1) those with one or more postgraduate training programs recognized by the American Council on Graduate Medical Education, (2) those with a medical school affiliation reported to the American Medical Association, or (3) those with an internship or residency approved by the American Osteopathic Association.
The SID has a specific binary indicator variable for each of the three diagnostic tests we evaluated. The use of the diagnostic test is evaluated through both UB-92 revenue codes and ICD9 procedure codes, with the presence of either leading to the indicator variable being positive.10 Finally, we performed a sensitivity analysis to evaluate the significance of changing utilization trends by interrupted time series analysis. A level of 0.05 was used to determine statistical significance. Analyses were done in STATA 15 (College Station, Texas).
RESULTS
The dataset included 75,144 hospitalizations with a primary procedure code of hip fracture over the study period (Table). The number of hospitalizations per year was fairly consistent over the study period in each state, although there were fewer hospitalizations for 2015 as this included only January through September. The mean age was 72.8 years, and 67% were female. The primary payer was Medicare for 71.7% of hospitalizations. Hospitalizations occurred at 181 hospitals, the plurality of which (42.9%) were minor teaching hospitals. The proportions of hospitalizations that included a TTE, stress test, and cardiac catheterization were 12.6%, 1.1%, and 0.5%, respectively. Overall, 13.5% of patients underwent any cardiac testing.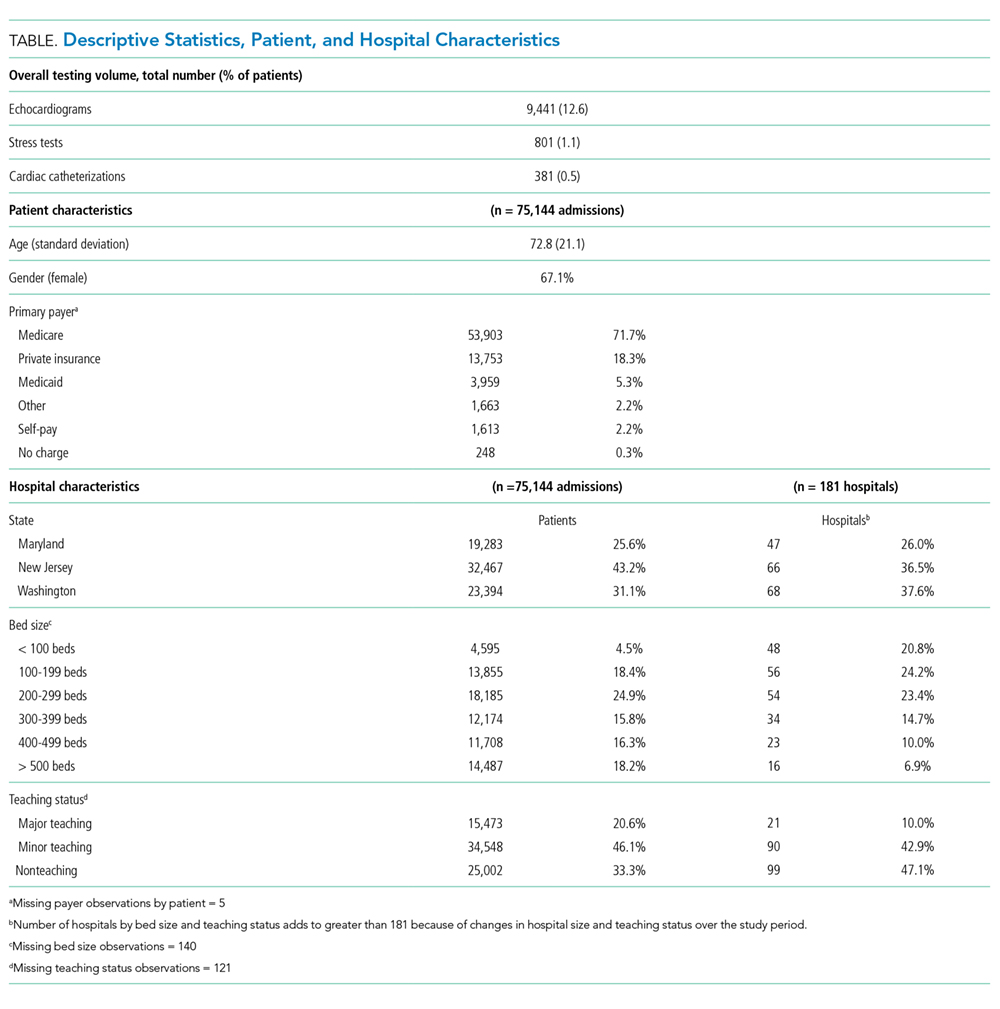
There was a statistically significantly lower rate of stress tests (odds ratio [OR], 0.32; 95% CI, 0.19-0.54) and cardiac catheterizations (OR, 0.46; 95% CI, 0.27-0.79) in Washington than in Maryland and New Jersey. Female gender was associated with significantly lower adjusted ORs for stress tests (OR, 0.74; 95% CI, 0.63-0.86) and cardiac catheterizations (OR, 0.73; 95% CI, 0.59-0.91), and increasing age was associated with higher adjusted ORs for each test (TTE, OR, 1.033; 95% CI, 1.031-1.035; stress tests, OR, 1.007; 95% CI, 1.001-1.013; cardiac catheterizations, OR, 1.011; 95% CI, 1.003-1.019). Private insurance was associated with a lower likelihood of stress tests (OR, 0.65; 95% CI, 0.50-0.85) and cardiac catheterizations (OR, 0.67; 95% CI,0.46-0.98), and self-pay was associated with a lower likelihood of TTE (OR, 0.76; 95% CI, 0.61-0.95) and stress test (OR, 0.43; 95% CI, 0.21-0.90), all compared with Medicare.
Larger hospitals were associated with a greater likelihood of cardiac catheterizations (OR, 1.18; 95% CI, 1.03-1.36) and a lower likelihood of TTE (OR, 0.89; 95% CI, 0.82-0.96). An unweighted average of these tests between 2011 and October 2015 showed a modest increase in TTEs and a modest decrease in stress tests and cardiac catheterizations (Figure). A multivariable random effects regression for use of TTEs revealed a significantly increasing trend from 2011 to 2014 (OR, 1.04, P < .0001), but the decreasing trend for 2015 was not statistically significant when analyzed according to quarters or months (for which data from only New Jersey and Washington are available).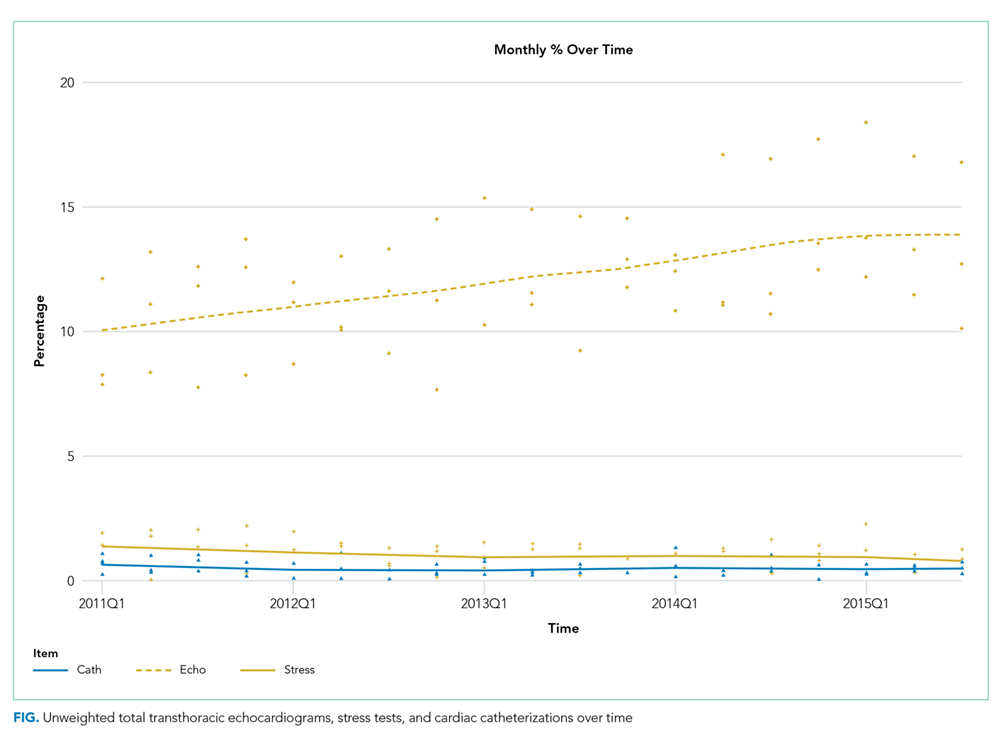
In the combined model with any cardiac testing as the outcome, the likelihood of testing was lower in Washington (OR, 0.56; 95% CI, 0.31-0.995). Primary payer status of self-pay was associated with a lower likelihood of cardiac testing (OR, 0.73; 95% CI, 0.58-0.90). Female gender was associated with a lower likelihood of testing (OR, 0.93; 95% CI, 0.88-0.98), and high mortality score was associated with a higher likelihood of testing (OR, 1.030; 95% CI, 1.027-1.033). TTEs were the major driver of this model as these were the most heavily utilized test.
DISCUSSION
There has been limited research into how often preoperative cardiac testing occurs in the inpatient setting. Our aim was to study its prevalence prior to hip fracture surgery during a time period when multiple recommendations had been issued to limit its use. We found rates of ischemic testing (stress tests and cardiac catheterizations) to be appropriately, and perhaps surprisingly, low. Our results on ischemic testing rates are consistent with previous studies, which have focused on the outpatient setting where much of the preoperative workup for nonurgent surgeries occurs. The rate of TTEs was higher than in previous studies of the outpatient preoperative setting, although it is unclear what an optimal rate of TTEs is.
A recent study examining outpatient preoperative stress tests within the 30 days before cataract surgeries, knee arthroscopies, or shoulder arthroscopies found a rate of 2.1% for Medicare fee-for-service patients in 2009 with little regional variation.11 Another evaluation using 2009 Medicare claims data found rates of preoperative TTEs and stress tests to be 0.8% and 0.7%, respectively.12 They included TTEs and stress tests performed within 30 days of a low- or intermediate-risk surgery. A study analyzing the rate of preoperative TTEs between 2009 and 2014 found that rates varied from 2.0% to 3.4% for commercially insured patients aged 50-64 years and Medicare-advantage patients, respectively, in 2009.13 These rates decreased by 7.0% and 12.6% from 2009 to 2014. These studies, like ours, suggest that preoperative cardiac testing has not been a major source of wasteful spending. One explanation for the higher rate of TTEs we observed in the inpatient setting might be that primary care physicians in the outpatient setting are more likely to have historical cardiac testing results compared with physicians in a hospital.
We found that the rate of stress testing and cardiac catheterization in Washington was significantly lower than that in Maryland and New Jersey. This is consistent with a number of measures of healthcare utilization – total Medicare reimbursement in the last six months of life, mean number of hospital days in the last six months of life, and healthcare intensity index—for all of which Washington was below the national mean and Maryland and New Jersey were above it.14
Finally, we found evidence of a lower rate of preoperative stress tests and cardiac catheterizations for women despite controlling for age and mortality score. Of course, we did not control directly for cardiovascular comorbidities; as a result, there could be residual confounding. However, these results are consistent with previous findings of gender bias in both pharmacologic management of coronary artery disease (CAD)15 and diagnostic testing for suspected CAD.16
We focused on hospitalizations with a primary procedure code to surgically treat hip fracture. We are unable to tell if the cardiac testing of these patients had occurred before or after the procedure. However, we suspect that the vast majority were completed for preoperative evaluation. It is likely that a small subset were done to diagnose and manage cardiac complications that either accompanied the hip fracture or occurred postoperatively. Another limitation is that we cannot determine if a patient had one of these tests recently in the emergency department or as an outpatient.
We also chose to include only patients who actually had hip fracture surgery. It is possible that the testing rate is higher for all patients admitted for hip fracture and that some of these patients did not have surgery because of abnormal cardiac testing. However, we suspect that this is a very small fraction given the high degree of morbidity and mortality associated with untreated hip fracture.
CONCLUSION
We found a low rate of preoperative cardiac testing in patients hospitalized for hip fracture surgery both in the years before and after the issuance of recommendations intended to curb its use. Although it is reassuring that the volume of low-value testing is lower than we expected, these findings highlight the importance of targeting utilization improvement efforts toward low-value tests and procedures that are more heavily used, since further curbing the use of infrequently utilized tests and procedures will have only a modest impact on overall healthcare expenditure. Our findings highlight the necessity that professional organizations ensure that they focus on true areas of inappropriate utilization. These are the areas in which improvements will have a major impact on healthcare spending. Further research should aim to quantify unwarranted cardiac testing for other inpatient surgeries that are less urgent, as the urgency of hip fracture repair may be driving the relatively low utilization of inpatient cardiac testing.
Disclosures
The authors have nothing to disclose.
Funding
This project was supported by the Johns Hopkins Hospitalist Scholars Fund and the Johns Hopkins School of Medicine Biostatistics, Epidemiology and Data Management (BEAD) Core.
1. Brauer CA, Coca-Perraillon M, Cutler DM, Rosen A. Incidence and mortality of hip fractures in the United States. JAMA. 2009;302(14):1573-1579. PubMed
2. ACS TQIP - Best Practices in the Management of Orthopaedic Trauma. https://www.facs.org/~/media/files/quality programs/trauma/tqip/tqip bpgs in the management of orthopaedic traumafinal.ashx. Published 2015. Accessed July 13, 2018.
3. Shiga T, Wajima Z, Ohe Y. Is operative delay associated with increased mortality of hip fracture patients? Systematic review, meta-analysis, and meta-regression. Can J Anesth. 2008;55(3):146-154. PubMed
4. Pincus D, Ravi B, Wasserstein D, et al. Association between wait time and 30-day mortality in adults undergoing hip fracture surgery. JAMA. 2017;318(20):1994. PubMed
5. Clair CM, Shah M, Diver EJ, et al. Adherence to evidence-based guidelines for preoperative testing in women undergoing gynecologic surgery. Obstet Gynecol. 2010;116(3):694-700. PubMed
6. Chen CL, Lin GA, Bardach NS, et al. Preoperative medical testing in Medicare patients undergoing cataract surgery. N Engl J Med. 2015;372(16):1530-1538. PubMed
7. Benarroch-Gampel J, Sheffield KM, Duncan CB, et al. Preoperative laboratory testing in patients undergoing elective, low-risk ambulatory surgery. Ann Surg. 2012; 256(3):518-528. PubMed
8. Choosing Wisely - An Initiative of the ABIM Foundation. http://www.choosingwisely.org/clinician-lists. Accessed July 16, 2018.
9. Fleisher LA, Fleischmann KE, Auerbach AD, et al. 2014 ACC/AHA Guideline on perioperative cardiovascular evaluation and management of patients undergoing noncardiac surgery. JACC. 2014;64(22):e278 LP-e333. PubMed
10. HCUP Methods Series - Development of Utilization Flags for Use with UB-92 Administrative Data; Report # 2006-04. https://www.hcup-us.ahrq.gov/reports/methods/2006_4.pdf.
11. Kerr EA, Chen J, Sussman JB, Klamerus ML, Nallamothu BK. Stress testing before low-risk surgery - so many recommendations, so little overuse. JAMA Intern Med. 2015;175(4):645-647. PubMed
12. Schwartz AL, Landon BE, Elshaug AG, Chernew ME, McWilliams JM. Measuring low-value care in medicare. JAMA Intern Med. 2014;174(7):1067-1076. PubMed
13. Carter EA, Morin PE, Lind KD. Costs and trends in utilization of low-value services among older adults with commercial insurance or Medicare advantage. Med Care. 2017;55(11):931-939. PubMed
14. The Dartmouth Atlas of Health Care. http://www.dartmouthatlas.org. Accessed December 7, 2017.
15. Williams D, Bennett K, Feely J. Evidence for an age and gender bias in the secondary prevention of ischaemic heart disease in primary care. Br J Clin Pharmacol. 2003;55(6):604-608. PubMed
16. Chang AM, Mumma B, Sease KL, Robey JL, Shofer FS, Hollander JE. Gender bias in cardiovascular testing persists after adjustment for presenting characteristics and cardiac risk. Acad Emerg Med. 2007;14(7):599-605. PubMed
Hip fracture is a common reason for unexpected, urgent inpatient surgery in older patients. In 2005, the incidence of hip fracture was 369.0 and 793.5 per 100,000 in men and women respectively.1 These numbers declined over the preceding decade, potentially as a result of bisphosphonate use. Age- and risk-adjusted 30-day mortality rates for men and women in 2005 were approximately 10% and 5%, respectively.
Evidence suggests that timely surgical repair of hip fractures improves outcomes, although the optimal timing is controversial. Guidelines from the American College of Surgeons Committee on Trauma from 2015 recommend surgical intervention within 48 hours for geriatric hip fracures.2 A 2008 systematic review found that operative delay beyond 48 hours was associated with a 41% increase in 30-day all-cause mortality and a 32% increase in one-year all-cause mortality.3 Recent evidence suggests that the rate of complications begins to increase with delays beyond 24 hours.4
There has been a focus over the past decade on overuse of preoperative testing for low- and intermediate-risk surgeries.5-7 Beginning in 2012, the American Board of Internal Medicine initiated the Choosing Wisely® campaign in which numerous societies issued recommendations on reducing utilization of various diagnostic tests, a number of which have focused on preoperative tests. Two groups—the American Society of Anesthesiologists (ASA) and the American Society of Echocardiography (ASE)— issued specific recommendations on preoperative cardiac testing.8 In February 2013, the ASE recommended avoiding preoperative echocardiograms in patients without a history or symptoms of heart disease. In October 2013, the ASA recommended against transthoracic echocardiogram (TTE), transesophageal echocardiogram (TEE), or stress testing for low- or intermediate-risk noncardiac surgery for patients with stable cardiac disease.
Finally, in 2014, the American College of Cardiology (ACC)/American Heart Association (AHA) issued updated perioperative guidelines for patients undergoing noncardiac surgeries.9 They recommended preoperative stress testing only in a small subset of cases (patients with an elevated perioperative risk of major adverse cardiac event, a poor or unknown functional capacity, or those in whom stress testing would impact perioperative care).
Given the high cost of preoperative cardiac testing, the potential for delays in care that can adversely impact outcomes, and the recent recommendations, we sought to characterize the rates of inpatient preoperative cardiac testing prior to hip fracture surgery in recent years and to see whether recent recommendations to curb use of these tests were temporally associated with changing rates.
METHODS
Overview
We utilized two datasets—the Healthcare Cost and Utilization Project (HCUP) State Inpatient Databases (SID) and the American Hospital Association (AHA) Annual Survey—to characterize preoperative cardiac testing. SID data from Maryland, New Jersey, and Washington State from 2011 through September 2015 were used (the ICD coding system changed from ICD9 to ICD10 on October 1). This was combined with AHA data for these years. We included all hospitalizations with a primary ICD9 procedure code for hip fracture repair—78.55, 78.65, 79.05, 79.15, 79.25, 79.35, 79.45, 79.55, 79.65, 79.75, 79.85, and 79.95. We excluded all observations that involved an interhospital transfer. This study was exempt from institutional review board approval.
Measurement and Outcomes
We summarized demographic data for the hospitalizations that met the inclusion criteria as well as the associated hospitals. The primary outcome was the percentage of patients undergoing TTE, stress test, and cardiac catheterization during a hospitalization with a primary procedure code of hip fracture repair. Random effects logistic regression models for each type of diagnostic test were developed to determine the factors that might impact test utilization. In addition to running each test as a separate model, we also performed an analysis in which the outcome was performance of any of these three cardiac tests. Random effects were used to account for clustering of testing within hospitals. Variables included time (3-month intervals), state, age (continuous variable), gender, length of stay, payer (Medicare/Medicaid/private insurance/self-pay/other), hospital teaching status (major teaching/minor teaching/nonteaching), hospital size according to number of beds (continuous variable), and mortality score. Major teaching hospitals are defined as members of the Council of Teaching Hospitals. Minor teaching hospitals are defined as (1) those with one or more postgraduate training programs recognized by the American Council on Graduate Medical Education, (2) those with a medical school affiliation reported to the American Medical Association, or (3) those with an internship or residency approved by the American Osteopathic Association.
The SID has a specific binary indicator variable for each of the three diagnostic tests we evaluated. The use of the diagnostic test is evaluated through both UB-92 revenue codes and ICD9 procedure codes, with the presence of either leading to the indicator variable being positive.10 Finally, we performed a sensitivity analysis to evaluate the significance of changing utilization trends by interrupted time series analysis. A level of 0.05 was used to determine statistical significance. Analyses were done in STATA 15 (College Station, Texas).
RESULTS
The dataset included 75,144 hospitalizations with a primary procedure code of hip fracture over the study period (Table). The number of hospitalizations per year was fairly consistent over the study period in each state, although there were fewer hospitalizations for 2015 as this included only January through September. The mean age was 72.8 years, and 67% were female. The primary payer was Medicare for 71.7% of hospitalizations. Hospitalizations occurred at 181 hospitals, the plurality of which (42.9%) were minor teaching hospitals. The proportions of hospitalizations that included a TTE, stress test, and cardiac catheterization were 12.6%, 1.1%, and 0.5%, respectively. Overall, 13.5% of patients underwent any cardiac testing.
There was a statistically significantly lower rate of stress tests (odds ratio [OR], 0.32; 95% CI, 0.19-0.54) and cardiac catheterizations (OR, 0.46; 95% CI, 0.27-0.79) in Washington than in Maryland and New Jersey. Female gender was associated with significantly lower adjusted ORs for stress tests (OR, 0.74; 95% CI, 0.63-0.86) and cardiac catheterizations (OR, 0.73; 95% CI, 0.59-0.91), and increasing age was associated with higher adjusted ORs for each test (TTE, OR, 1.033; 95% CI, 1.031-1.035; stress tests, OR, 1.007; 95% CI, 1.001-1.013; cardiac catheterizations, OR, 1.011; 95% CI, 1.003-1.019). Private insurance was associated with a lower likelihood of stress tests (OR, 0.65; 95% CI, 0.50-0.85) and cardiac catheterizations (OR, 0.67; 95% CI,0.46-0.98), and self-pay was associated with a lower likelihood of TTE (OR, 0.76; 95% CI, 0.61-0.95) and stress test (OR, 0.43; 95% CI, 0.21-0.90), all compared with Medicare.
Larger hospitals were associated with a greater likelihood of cardiac catheterizations (OR, 1.18; 95% CI, 1.03-1.36) and a lower likelihood of TTE (OR, 0.89; 95% CI, 0.82-0.96). An unweighted average of these tests between 2011 and October 2015 showed a modest increase in TTEs and a modest decrease in stress tests and cardiac catheterizations (Figure). A multivariable random effects regression for use of TTEs revealed a significantly increasing trend from 2011 to 2014 (OR, 1.04, P < .0001), but the decreasing trend for 2015 was not statistically significant when analyzed according to quarters or months (for which data from only New Jersey and Washington are available).
In the combined model with any cardiac testing as the outcome, the likelihood of testing was lower in Washington (OR, 0.56; 95% CI, 0.31-0.995). Primary payer status of self-pay was associated with a lower likelihood of cardiac testing (OR, 0.73; 95% CI, 0.58-0.90). Female gender was associated with a lower likelihood of testing (OR, 0.93; 95% CI, 0.88-0.98), and high mortality score was associated with a higher likelihood of testing (OR, 1.030; 95% CI, 1.027-1.033). TTEs were the major driver of this model as these were the most heavily utilized test.
DISCUSSION
There has been limited research into how often preoperative cardiac testing occurs in the inpatient setting. Our aim was to study its prevalence prior to hip fracture surgery during a time period when multiple recommendations had been issued to limit its use. We found rates of ischemic testing (stress tests and cardiac catheterizations) to be appropriately, and perhaps surprisingly, low. Our results on ischemic testing rates are consistent with previous studies, which have focused on the outpatient setting where much of the preoperative workup for nonurgent surgeries occurs. The rate of TTEs was higher than in previous studies of the outpatient preoperative setting, although it is unclear what an optimal rate of TTEs is.
A recent study examining outpatient preoperative stress tests within the 30 days before cataract surgeries, knee arthroscopies, or shoulder arthroscopies found a rate of 2.1% for Medicare fee-for-service patients in 2009 with little regional variation.11 Another evaluation using 2009 Medicare claims data found rates of preoperative TTEs and stress tests to be 0.8% and 0.7%, respectively.12 They included TTEs and stress tests performed within 30 days of a low- or intermediate-risk surgery. A study analyzing the rate of preoperative TTEs between 2009 and 2014 found that rates varied from 2.0% to 3.4% for commercially insured patients aged 50-64 years and Medicare-advantage patients, respectively, in 2009.13 These rates decreased by 7.0% and 12.6% from 2009 to 2014. These studies, like ours, suggest that preoperative cardiac testing has not been a major source of wasteful spending. One explanation for the higher rate of TTEs we observed in the inpatient setting might be that primary care physicians in the outpatient setting are more likely to have historical cardiac testing results compared with physicians in a hospital.
We found that the rate of stress testing and cardiac catheterization in Washington was significantly lower than that in Maryland and New Jersey. This is consistent with a number of measures of healthcare utilization – total Medicare reimbursement in the last six months of life, mean number of hospital days in the last six months of life, and healthcare intensity index—for all of which Washington was below the national mean and Maryland and New Jersey were above it.14
Finally, we found evidence of a lower rate of preoperative stress tests and cardiac catheterizations for women despite controlling for age and mortality score. Of course, we did not control directly for cardiovascular comorbidities; as a result, there could be residual confounding. However, these results are consistent with previous findings of gender bias in both pharmacologic management of coronary artery disease (CAD)15 and diagnostic testing for suspected CAD.16
We focused on hospitalizations with a primary procedure code to surgically treat hip fracture. We are unable to tell if the cardiac testing of these patients had occurred before or after the procedure. However, we suspect that the vast majority were completed for preoperative evaluation. It is likely that a small subset were done to diagnose and manage cardiac complications that either accompanied the hip fracture or occurred postoperatively. Another limitation is that we cannot determine if a patient had one of these tests recently in the emergency department or as an outpatient.
We also chose to include only patients who actually had hip fracture surgery. It is possible that the testing rate is higher for all patients admitted for hip fracture and that some of these patients did not have surgery because of abnormal cardiac testing. However, we suspect that this is a very small fraction given the high degree of morbidity and mortality associated with untreated hip fracture.
CONCLUSION
We found a low rate of preoperative cardiac testing in patients hospitalized for hip fracture surgery both in the years before and after the issuance of recommendations intended to curb its use. Although it is reassuring that the volume of low-value testing is lower than we expected, these findings highlight the importance of targeting utilization improvement efforts toward low-value tests and procedures that are more heavily used, since further curbing the use of infrequently utilized tests and procedures will have only a modest impact on overall healthcare expenditure. Our findings highlight the necessity that professional organizations ensure that they focus on true areas of inappropriate utilization. These are the areas in which improvements will have a major impact on healthcare spending. Further research should aim to quantify unwarranted cardiac testing for other inpatient surgeries that are less urgent, as the urgency of hip fracture repair may be driving the relatively low utilization of inpatient cardiac testing.
Disclosures
The authors have nothing to disclose.
Funding
This project was supported by the Johns Hopkins Hospitalist Scholars Fund and the Johns Hopkins School of Medicine Biostatistics, Epidemiology and Data Management (BEAD) Core.
1. Brauer CA, Coca-Perraillon M, Cutler DM, Rosen A. Incidence and mortality of hip fractures in the United States. JAMA. 2009;302(14):1573-1579. PubMed
2. ACS TQIP - Best Practices in the Management of Orthopaedic Trauma. https://www.facs.org/~/media/files/quality programs/trauma/tqip/tqip bpgs in the management of orthopaedic traumafinal.ashx. Published 2015. Accessed July 13, 2018.
3. Shiga T, Wajima Z, Ohe Y. Is operative delay associated with increased mortality of hip fracture patients? Systematic review, meta-analysis, and meta-regression. Can J Anesth. 2008;55(3):146-154. PubMed
4. Pincus D, Ravi B, Wasserstein D, et al. Association between wait time and 30-day mortality in adults undergoing hip fracture surgery. JAMA. 2017;318(20):1994. PubMed
5. Clair CM, Shah M, Diver EJ, et al. Adherence to evidence-based guidelines for preoperative testing in women undergoing gynecologic surgery. Obstet Gynecol. 2010;116(3):694-700. PubMed
6. Chen CL, Lin GA, Bardach NS, et al. Preoperative medical testing in Medicare patients undergoing cataract surgery. N Engl J Med. 2015;372(16):1530-1538. PubMed
7. Benarroch-Gampel J, Sheffield KM, Duncan CB, et al. Preoperative laboratory testing in patients undergoing elective, low-risk ambulatory surgery. Ann Surg. 2012; 256(3):518-528. PubMed
8. Choosing Wisely - An Initiative of the ABIM Foundation. http://www.choosingwisely.org/clinician-lists. Accessed July 16, 2018.
9. Fleisher LA, Fleischmann KE, Auerbach AD, et al. 2014 ACC/AHA Guideline on perioperative cardiovascular evaluation and management of patients undergoing noncardiac surgery. JACC. 2014;64(22):e278 LP-e333. PubMed
10. HCUP Methods Series - Development of Utilization Flags for Use with UB-92 Administrative Data; Report # 2006-04. https://www.hcup-us.ahrq.gov/reports/methods/2006_4.pdf.
11. Kerr EA, Chen J, Sussman JB, Klamerus ML, Nallamothu BK. Stress testing before low-risk surgery - so many recommendations, so little overuse. JAMA Intern Med. 2015;175(4):645-647. PubMed
12. Schwartz AL, Landon BE, Elshaug AG, Chernew ME, McWilliams JM. Measuring low-value care in medicare. JAMA Intern Med. 2014;174(7):1067-1076. PubMed
13. Carter EA, Morin PE, Lind KD. Costs and trends in utilization of low-value services among older adults with commercial insurance or Medicare advantage. Med Care. 2017;55(11):931-939. PubMed
14. The Dartmouth Atlas of Health Care. http://www.dartmouthatlas.org. Accessed December 7, 2017.
15. Williams D, Bennett K, Feely J. Evidence for an age and gender bias in the secondary prevention of ischaemic heart disease in primary care. Br J Clin Pharmacol. 2003;55(6):604-608. PubMed
16. Chang AM, Mumma B, Sease KL, Robey JL, Shofer FS, Hollander JE. Gender bias in cardiovascular testing persists after adjustment for presenting characteristics and cardiac risk. Acad Emerg Med. 2007;14(7):599-605. PubMed
© 2019 Society of Hospital Medicine
Use of Advance Care Planning Billing Codes for Hospitalized Older Adults at High Risk of Dying: A National Observational Study
Advance care planning (ACP) is the process wherein patients, in discussions with their healthcare providers, family members, and other loved ones, make individual decisions about their future healthcare or prepare proxies to guide future medical treatment decisions.1,2 In 2016, the Centers for Medicare and Medicaid Services (CMS) began paying providers for ACP by using billing codes 99497 (first 30 min of ACP) and 99498 (additional 30 min of ACP). According to the CMS, during the first year after the billing codes were introduced, 22,864 providers billed for ACP conversations with 574,621 patients.3 While all adults are eligible, common triggers for ACP include advanced age, serious illness, and functional status changes that confer an increased risk of dying. We explored the early uptake of the ACP billing code in a large national physician practice that provided mandatory education in use of the ACP billing code, offered a small financial incentive for ACP documentation, and primed physicians to reflect on the patient’s risk of dying in the next year at the time of hospital admission.
METHODS
We analyzed ACP billing for hospitalized adults aged 65 years or above and who were managed by a large national physician practice that employs acute care providers in hospital medicine, emergency medicine and critical care between January 1, 2017 and March 31, 2017. This practice employs approximately 2,500 hospital-based physicians in 250 community hospitals in 38 states. They collect data through handheld and desktop information technology (IT) tools to facilitate coding, billing, and compliance by hospitalists. Hospitalists receive mandatory web-based training in compliance with CMS ACP billing and templated ACP documentation. Additionally, they receive web-based training in serious illness communication skills during the first two years of employment. The training includes didactic content regarding steps for collaborative decision making, words to use during the encounter, and videos of simulated patient encounters demonstrating best practices. Hospitalists also receive a small financial incentive ($20) for each properly documented ACP conversation that meets CMS criteria for ACP code payment.
Beginning in 2017, hospitalists were required to answer the validated Surprise Question4 (SQ; “Would you be surprised if the patient died in the next year?”) for all admitted patients aged 65 years and older. The SQ is useful because it is intuitive and not burdensome for physicians to answer. Moreover, it is predictive of mortality. The pooled prognostic characteristics of the SQ across multiple populations for predicting the outcome of death at 6 months to 18 months include a sensitivity of 67.0% (95% confidence interval [CI] 55.7%-76.7%), a specificity of 80.2% (95% CI 73.3%-85.6%), a positive likelihood ratio of 3.4 (95% CI 2.8–4.1), a negative likelihood ratio of 0.41 (95% CI 0.32-0.54), a positive predictive value of 37.1% (95% CI 30.2%-44.6%), and a negative predictive value of 93.1% (95% CI 91.0%-94.8%).5 The SQ primed the admitting physician and triggered an “EoL” (end-of-life) icon next to the patient’s name on the hospitalists’ handheld electronic patient census.
We summarized ACP billing rates and used mixed-effects regression to estimate adjusted ACP rates accounting for patient covariates and clustering at the provider and hospital level. Patient covariates included age; answer to the SQ [“yes,” “no,” or “missing”]); and the presence or absence of seven comorbidities: dementia, heart failure, chronic obstructive pulmonary disease, renal failure, liver failure, metastatic cancer, and nonmetastatic cancer. We quantified the magnitude of provider and hospital variation in ACP rates by using the intraclass correlation coefficient (ICC).
RESULTS
In the first quarter of 2017, hospitalists admitted 113,612 patients aged 65 years and older. Hospitalists were prompted to answer the SQ for 73,731 (65%) of the patients. They were not prompted to answer the SQ for 39,881 (35%) of the patients (ie, missing data for the SQ). Reasons for not prompting include delayed implementation at a site and the patient not being admitted to the hospital (eg, managed on observation status). When prompted, hospitalists answered “no” to the SQ for 41,276/73,731 (56%) of admissions.
Only 6,146/113,612 (5.4%) of all admissions involved a billed ACP conversation. Rates were highest among SQ-prompted/answer “no” cases (8.3%) compared with SQ-prompted/answer “yes” cases (4.1%) and non-SQ-prompted cases (3.5%), with all pairwise differences being statistically significant (P values “yes” vs “no” = .0079, “yes” vs not prompted = .0043, “no” vs not prompted < .0001; see Table 1).
In addition to being more likely to have a “no” response to the SQ, those with a billed ACP conversations were older (80 vs 78, P < .001); more likely to be diagnosed with dementia (5.9% vs 3.5%, P < .001), congestive heart failure (12.3% vs 9.9%, P < .001), and cancer (6.1% vs 3.3%, P < .001); more likely to die during the admission (16.5% vs 10.9%, P < .001); and, conditional on survival to discharge, more likely to be discharged with hospice (17% vs 3%, P < .001) than those without (Table 2).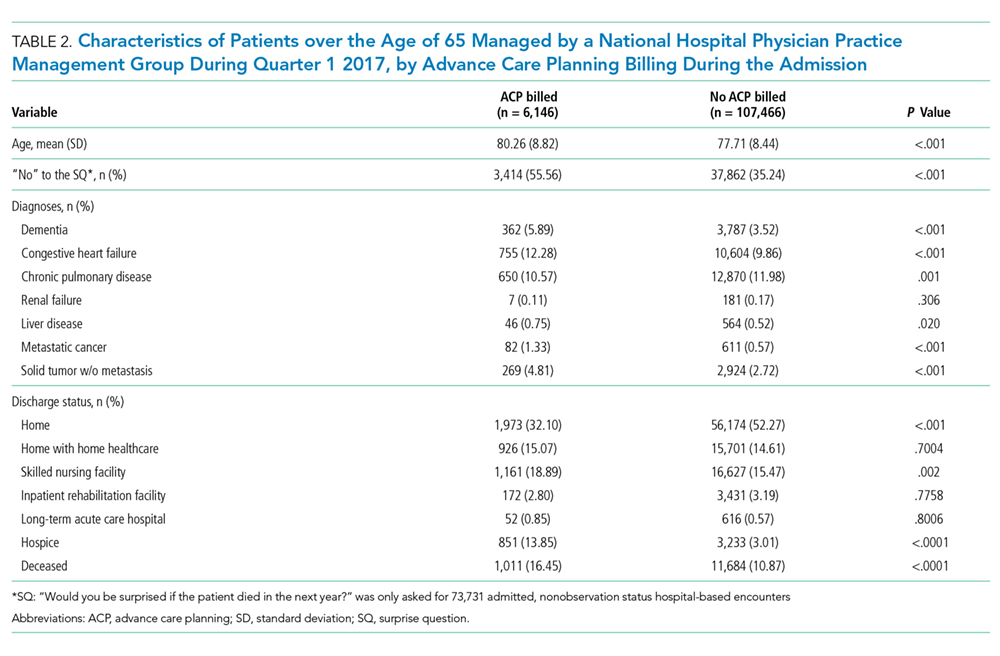
At the hospital level, ACP rates varied from 0% to 35% (mean 5.2%) of all admissions. In analyses restricted to physicians seeing at least 30 patients 65 years of age and older during the quarter, physician-level ACP rates varied from 0% to 93% (mean 5.4%). The majority of all ACP discussions were attributable to one-quarter of physicians. One-third of physicians never billed for ACP.
In a hierarchical logistic regression model accounting for observable patient characteristics and clustering at the physician and hospital level, the adjusted ACP rate for an “average” patient (age 77.85 with the most common clinical conditions) was 13.6% if the hospitalist answered “no” to the SQ, 9.6% if the hospitalist answered “yes,” and 10.1% if the hospitalist was not asked the SQ (P value of difference < .0001). From this model, we also calculated an ICC at the physician level of 0.044 and at the hospital level of 0.079. The physician level ICC corresponds to a 4.5% absolute increase in ACP when one moves from a physician at the mean to a physician 1 SD above the mean (ie, moving 1 SD up the scale of the latent variable underlying the random effect). The hospital level ICC corresponds to a 6.3% absolute increase in ACP when one moves from a hospital at the mean to a hospital 1 SD above the mean. The 4.5% absolute increase in ACP due to physician practice patterns and 6.3% absolute increase in ACP due to hospital practice patterns are both greater than the estimated increase in ACP from the hospitalist answering “no” instead of “yes” to the SQ (3.6%).
DISCUSSION
In this large national hospital-based physician practice group, the rates of ACP among acute care patients 65 years of age and older were very low despite the use of education and IT- and incentive-based strategies to encourage ACP conversations among seriously ill older adults. Priming physicians to reflect on the patient’s risk of dying at the time of admission was associated with the doubling of ACP rates.
Despite some lawmakers’ concerns that the ACP billing code may be overused and therefore become a financial burden to the Medicare program6, we find the very low use of ACP billing in a population for whom having goals of care conversations is critical—seriously ill older adults who the physician would not be surprised if they died in the next year. This gap is significant because these ACP conversations, when they did occur, were associated with a comfort-focused trajectory, including a more than four-fold increase in hospice referral at discharge.
Causal inference is limited because of the observational nature of the study. While we hypothesize that priming the physicians to reflect on prognosis activated them to prioritize ACP, based on a prior scenario-based randomized trial,7 illness severity likely drives ACP conversations. Specifically, patients on observation status (who had missing SQ data) and those for whom the physician answered “yes” to the SQ are less sick than other patients. Additional decision-making heuristics in addition to mortality risk may influence ACP conversations, as suggested by the independent influence of diagnoses, such as dementia or cancer, on ACP. Notably, however, the large amounts of unexplained variation at the physician and the hospital levels exceed the amounts explained by any individual observed patient factor.
Other key limitations of this study include the use of ACP billing as a primary outcome rather than observed and documented ACP conversations and the lack of information on the quality of ACP conversations. These findings reflect the uptake of ACP billing rates soon after the code was introduced. ACP billing rates have likely increased since the first quarter of 2017. Future work should explore diffusion and variation in physician-specific use over time. Finally, despite the nationwide sample, findings may not be generalizable to hospitalists who have not received training and financial incentives for ACP billing.
This study reinforces the possibility that variation in ACP conversations may contribute to variation in end-of-life treatment intensity between providers.8-10 Low ACP rates among even those with high hospitalist-predicted mortality risk and considerable between-provider variation underscore the need for quality improvement interventions to increase hospital-based ACP.
Acknowledgments
The authors thank Jared Wasserman, Maxwell Bessler, Devon Zoller MD, Mark Rudolph MD, Kristi Franz, and Weiping Zhou for their research assistance.
Disclosures
The authors have nothing to disclose.
Funding
National Institute on Aging award P01 AG019783
1. Mullick A, Martin J, Sallnow L. An introduction to advance care planning in practice. BMJ. 2013;347:f6064. PubMed
2. Sudore RL, Lum HD, You JJ, et al. Defining advance care planning for adults: a consensus definition from a multidisciplinary Delphi panel. J Pain Symptom Manage. 2017;53(5):821-832. PubMed
3. Medicare spending and utilization for advance care planning (ACP) services in 2016. Analysis of CMS data posted by the Coalition to Transform Advanced Care https://www.thectac.org/2017/08/use-billing-codes-advance-care-planning-exceeds-projections/. Accessed February 2018.
4. Moss AH, Ganjoo J, Sharma S, et al. Utility of the “surprise” question to identify dialysis patients with high mortality. Clin J Am Soc Nephrol. 2008;3(5):1379-1384. PubMed
5. Downar J, Goldman R, Pinto R, Englesakis M, Adhikari NK. The “surprise question” for predicting death in seriously ill patients: a systematic review and meta-analysis. CMAJ. 2017;189(13):E484-E493. PubMed
6. Aleccia J. Docs bill Medicare for end-of-life advice as ‘death panel’ fears reemerge. Kaiser Health News, February 2017.
7. Turnbull AE, Krall JR, Ruhl AP, et al. A scenario-based, randomized trial of patient values and functional prognosis on intensivist intent to discuss withdrawing life support. Crit Care Med. 2014;42(6):1455-1462. PubMed
8. Barnato AE, Mohan D, Lane RK, et al. Advance care planning norms may contribute to hospital variation in end-of-life ICU use: a simulation study. Med Decis Making. 2014;34(4):473-484. PubMed
9. Barnato AE, Tate JA, Rodriguez KL, Zickmund SL, Arnold RM. Norms of decision making in the ICU: a case study of two academic medical centers at the extremes of end-of-life treatment intensity. Intensive Care Med. 2012;38(11):1886-1896. PubMed
10. Wright AA, Zhang B, Ray A, et al. Associations between end-of-life discussions, patient mental health, medical care near death, and caregiver bereavement adjustment. JAMA. 2008;300(14):1665-1673. PubMed
Advance care planning (ACP) is the process wherein patients, in discussions with their healthcare providers, family members, and other loved ones, make individual decisions about their future healthcare or prepare proxies to guide future medical treatment decisions.1,2 In 2016, the Centers for Medicare and Medicaid Services (CMS) began paying providers for ACP by using billing codes 99497 (first 30 min of ACP) and 99498 (additional 30 min of ACP). According to the CMS, during the first year after the billing codes were introduced, 22,864 providers billed for ACP conversations with 574,621 patients.3 While all adults are eligible, common triggers for ACP include advanced age, serious illness, and functional status changes that confer an increased risk of dying. We explored the early uptake of the ACP billing code in a large national physician practice that provided mandatory education in use of the ACP billing code, offered a small financial incentive for ACP documentation, and primed physicians to reflect on the patient’s risk of dying in the next year at the time of hospital admission.
METHODS
We analyzed ACP billing for hospitalized adults aged 65 years or above and who were managed by a large national physician practice that employs acute care providers in hospital medicine, emergency medicine and critical care between January 1, 2017 and March 31, 2017. This practice employs approximately 2,500 hospital-based physicians in 250 community hospitals in 38 states. They collect data through handheld and desktop information technology (IT) tools to facilitate coding, billing, and compliance by hospitalists. Hospitalists receive mandatory web-based training in compliance with CMS ACP billing and templated ACP documentation. Additionally, they receive web-based training in serious illness communication skills during the first two years of employment. The training includes didactic content regarding steps for collaborative decision making, words to use during the encounter, and videos of simulated patient encounters demonstrating best practices. Hospitalists also receive a small financial incentive ($20) for each properly documented ACP conversation that meets CMS criteria for ACP code payment.
Beginning in 2017, hospitalists were required to answer the validated Surprise Question4 (SQ; “Would you be surprised if the patient died in the next year?”) for all admitted patients aged 65 years and older. The SQ is useful because it is intuitive and not burdensome for physicians to answer. Moreover, it is predictive of mortality. The pooled prognostic characteristics of the SQ across multiple populations for predicting the outcome of death at 6 months to 18 months include a sensitivity of 67.0% (95% confidence interval [CI] 55.7%-76.7%), a specificity of 80.2% (95% CI 73.3%-85.6%), a positive likelihood ratio of 3.4 (95% CI 2.8–4.1), a negative likelihood ratio of 0.41 (95% CI 0.32-0.54), a positive predictive value of 37.1% (95% CI 30.2%-44.6%), and a negative predictive value of 93.1% (95% CI 91.0%-94.8%).5 The SQ primed the admitting physician and triggered an “EoL” (end-of-life) icon next to the patient’s name on the hospitalists’ handheld electronic patient census.
We summarized ACP billing rates and used mixed-effects regression to estimate adjusted ACP rates accounting for patient covariates and clustering at the provider and hospital level. Patient covariates included age; answer to the SQ [“yes,” “no,” or “missing”]); and the presence or absence of seven comorbidities: dementia, heart failure, chronic obstructive pulmonary disease, renal failure, liver failure, metastatic cancer, and nonmetastatic cancer. We quantified the magnitude of provider and hospital variation in ACP rates by using the intraclass correlation coefficient (ICC).
RESULTS
In the first quarter of 2017, hospitalists admitted 113,612 patients aged 65 years and older. Hospitalists were prompted to answer the SQ for 73,731 (65%) of the patients. They were not prompted to answer the SQ for 39,881 (35%) of the patients (ie, missing data for the SQ). Reasons for not prompting include delayed implementation at a site and the patient not being admitted to the hospital (eg, managed on observation status). When prompted, hospitalists answered “no” to the SQ for 41,276/73,731 (56%) of admissions.
Only 6,146/113,612 (5.4%) of all admissions involved a billed ACP conversation. Rates were highest among SQ-prompted/answer “no” cases (8.3%) compared with SQ-prompted/answer “yes” cases (4.1%) and non-SQ-prompted cases (3.5%), with all pairwise differences being statistically significant (P values “yes” vs “no” = .0079, “yes” vs not prompted = .0043, “no” vs not prompted < .0001; see Table 1).
In addition to being more likely to have a “no” response to the SQ, those with a billed ACP conversations were older (80 vs 78, P < .001); more likely to be diagnosed with dementia (5.9% vs 3.5%, P < .001), congestive heart failure (12.3% vs 9.9%, P < .001), and cancer (6.1% vs 3.3%, P < .001); more likely to die during the admission (16.5% vs 10.9%, P < .001); and, conditional on survival to discharge, more likely to be discharged with hospice (17% vs 3%, P < .001) than those without (Table 2).
At the hospital level, ACP rates varied from 0% to 35% (mean 5.2%) of all admissions. In analyses restricted to physicians seeing at least 30 patients 65 years of age and older during the quarter, physician-level ACP rates varied from 0% to 93% (mean 5.4%). The majority of all ACP discussions were attributable to one-quarter of physicians. One-third of physicians never billed for ACP.
In a hierarchical logistic regression model accounting for observable patient characteristics and clustering at the physician and hospital level, the adjusted ACP rate for an “average” patient (age 77.85 with the most common clinical conditions) was 13.6% if the hospitalist answered “no” to the SQ, 9.6% if the hospitalist answered “yes,” and 10.1% if the hospitalist was not asked the SQ (P value of difference < .0001). From this model, we also calculated an ICC at the physician level of 0.044 and at the hospital level of 0.079. The physician level ICC corresponds to a 4.5% absolute increase in ACP when one moves from a physician at the mean to a physician 1 SD above the mean (ie, moving 1 SD up the scale of the latent variable underlying the random effect). The hospital level ICC corresponds to a 6.3% absolute increase in ACP when one moves from a hospital at the mean to a hospital 1 SD above the mean. The 4.5% absolute increase in ACP due to physician practice patterns and 6.3% absolute increase in ACP due to hospital practice patterns are both greater than the estimated increase in ACP from the hospitalist answering “no” instead of “yes” to the SQ (3.6%).
DISCUSSION
In this large national hospital-based physician practice group, the rates of ACP among acute care patients 65 years of age and older were very low despite the use of education and IT- and incentive-based strategies to encourage ACP conversations among seriously ill older adults. Priming physicians to reflect on the patient’s risk of dying at the time of admission was associated with the doubling of ACP rates.
Despite some lawmakers’ concerns that the ACP billing code may be overused and therefore become a financial burden to the Medicare program6, we find the very low use of ACP billing in a population for whom having goals of care conversations is critical—seriously ill older adults who the physician would not be surprised if they died in the next year. This gap is significant because these ACP conversations, when they did occur, were associated with a comfort-focused trajectory, including a more than four-fold increase in hospice referral at discharge.
Causal inference is limited because of the observational nature of the study. While we hypothesize that priming the physicians to reflect on prognosis activated them to prioritize ACP, based on a prior scenario-based randomized trial,7 illness severity likely drives ACP conversations. Specifically, patients on observation status (who had missing SQ data) and those for whom the physician answered “yes” to the SQ are less sick than other patients. Additional decision-making heuristics in addition to mortality risk may influence ACP conversations, as suggested by the independent influence of diagnoses, such as dementia or cancer, on ACP. Notably, however, the large amounts of unexplained variation at the physician and the hospital levels exceed the amounts explained by any individual observed patient factor.
Other key limitations of this study include the use of ACP billing as a primary outcome rather than observed and documented ACP conversations and the lack of information on the quality of ACP conversations. These findings reflect the uptake of ACP billing rates soon after the code was introduced. ACP billing rates have likely increased since the first quarter of 2017. Future work should explore diffusion and variation in physician-specific use over time. Finally, despite the nationwide sample, findings may not be generalizable to hospitalists who have not received training and financial incentives for ACP billing.
This study reinforces the possibility that variation in ACP conversations may contribute to variation in end-of-life treatment intensity between providers.8-10 Low ACP rates among even those with high hospitalist-predicted mortality risk and considerable between-provider variation underscore the need for quality improvement interventions to increase hospital-based ACP.
Acknowledgments
The authors thank Jared Wasserman, Maxwell Bessler, Devon Zoller MD, Mark Rudolph MD, Kristi Franz, and Weiping Zhou for their research assistance.
Disclosures
The authors have nothing to disclose.
Funding
National Institute on Aging award P01 AG019783
1. Mullick A, Martin J, Sallnow L. An introduction to advance care planning in practice. BMJ. 2013;347:f6064. PubMed
2. Sudore RL, Lum HD, You JJ, et al. Defining advance care planning for adults: a consensus definition from a multidisciplinary Delphi panel. J Pain Symptom Manage. 2017;53(5):821-832. PubMed
3. Medicare spending and utilization for advance care planning (ACP) services in 2016. Analysis of CMS data posted by the Coalition to Transform Advanced Care https://www.thectac.org/2017/08/use-billing-codes-advance-care-planning-exceeds-projections/. Accessed February 2018.
4. Moss AH, Ganjoo J, Sharma S, et al. Utility of the “surprise” question to identify dialysis patients with high mortality. Clin J Am Soc Nephrol. 2008;3(5):1379-1384. PubMed
5. Downar J, Goldman R, Pinto R, Englesakis M, Adhikari NK. The “surprise question” for predicting death in seriously ill patients: a systematic review and meta-analysis. CMAJ. 2017;189(13):E484-E493. PubMed
6. Aleccia J. Docs bill Medicare for end-of-life advice as ‘death panel’ fears reemerge. Kaiser Health News, February 2017.
7. Turnbull AE, Krall JR, Ruhl AP, et al. A scenario-based, randomized trial of patient values and functional prognosis on intensivist intent to discuss withdrawing life support. Crit Care Med. 2014;42(6):1455-1462. PubMed
8. Barnato AE, Mohan D, Lane RK, et al. Advance care planning norms may contribute to hospital variation in end-of-life ICU use: a simulation study. Med Decis Making. 2014;34(4):473-484. PubMed
9. Barnato AE, Tate JA, Rodriguez KL, Zickmund SL, Arnold RM. Norms of decision making in the ICU: a case study of two academic medical centers at the extremes of end-of-life treatment intensity. Intensive Care Med. 2012;38(11):1886-1896. PubMed
10. Wright AA, Zhang B, Ray A, et al. Associations between end-of-life discussions, patient mental health, medical care near death, and caregiver bereavement adjustment. JAMA. 2008;300(14):1665-1673. PubMed
© 2019 Society of Hospital Medicine