User login
Team reports long-term effects of blood management
An initiative that reduced red blood cell (RBC) transfusions and increased moderate anemia in hospital did not adversely impact patients long-term, according to an analysis.
Researchers found that an increase in moderate in-hospital anemia did not increase subsequent RBC use, readmission, or mortality over the next 6 months.
However, authors of a related editorial argued that additional factors must be assessed to truly determine the effects of moderate anemia on patient outcomes.
The study and the editorial were published in the Annals of Internal Medicine.
Study: Long-term outcomes
Nareg H. Roubinian, MD, of Kaiser Permanente Northern California in Oakland, and colleagues sought to evaluate the impact of blood management programs—starting in 2010—that included blood-sparing surgical and medical techniques, increased use of hemostatic and cell salvage agents, and treatment of suboptimal iron stores before surgery.
In previous retrospective cohort studies, the researchers had found that blood conservation strategies did not impact in-hospital or 30-day mortality rates, which was consistent with short-term safety data from clinical trials and other observational studies.
Their new report on longer-term outcomes was based on data from Kaiser Permanente Northern California for 445,371 adults who had 801,261 hospitalizations with discharges between 2010 and 2014.
In this cohort, moderate anemia (hemoglobin between 7 g/dL and 10 g/dL) at discharge occurred in 119,489 patients (27%) and 187,440 hospitalizations overall (23%).
Over the 2010-2014 period, RBC transfusions decreased by more than 25% in the inpatient and outpatient settings. In parallel, the prevalence of moderate anemia at hospital discharge increased from 20% to 25%.
However, the risks of subsequent RBC transfusions and rehospitalization after discharge with anemia decreased during the study period, and mortality rates stayed steady or decreased slightly.
Among patients with moderate anemia, the proportion with subsequent RBC transfusions within 6 months decreased from 18.9% in 2010 to 16.8% in 2014 (P<0.001), while the rate of rehospitalization within 6 months decreased from 36.5% to 32.8% over that same time period (P<0.001).
The adjusted 6-month mortality rate likewise decreased from 16.1% to 15.6% (P=0.004) over that time period among patients with moderate anemia.
“These data support the efficacy and safety of practice recommendations to limit red blood cell transfusion in patients with anemia during and after hospitalization,” the researchers wrote.
However, they also said additional studies are needed to guide anemia management, particularly since persistent anemia has impacts on quality of life that are “likely to be substantial” and linked to the severity of that anemia.
This study was supported by a grant from the National Heart, Lung, and Blood Institute. Dr. Roubinian and several coauthors reported grants from the National Institutes of Health.
Editorial: Aim to treat anemia, not tolerate it
Dr. Roubinian and his colleagues’ findings warrant some scrutiny, according to Aryeh Shander, MD, of Englewood Hospital and Medical Center in New Jersey, and Lawrence Tim Goodnough, MD, of Stanford University in California.
“Missing here is a wide spectrum of morbidity outcomes and issues related to diminished quality of life that do not reach the level of severity that would necessitate admission but nonetheless detract from patients’ health and well-being,” Drs. Shander and Goodnough wrote in a related editorial.
They also noted that transfusion rate is not a clinical outcome, adding that readmission and mortality are important outcomes, but they do not accurately or fully reflect patient well-being.
While blood management initiatives may be a safe practice, as the study suggests, proper management of anemia after discharge may actually improve outcomes, given the many consequences of anemia, Drs. Shander and Goodnough wrote.
The pair suggested that, instead of again testing whether restricting transfusions is acceptable because of lack of impact on outcomes, future studies could evaluate a “more sensible” hypothesis that proper anemia management, especially post-discharge, could improve outcomes.
“Let’s increase efforts to prevent and treat anemia properly, rather than requiring patients to tolerate it,” Drs. Shander and Goodnough wrote.
Dr. Shander reported consulting fees from Vifor and AMAG. Dr. Goodnough reported having no relevant financial disclosures.
The role of the skin microbiome in skin disease
The microbiome of the gut and skin can impact one another in health and disease. Numerous dermatologic disorders can be traced to gastrointestinal etiologic origins.1 Incorporating discussion of the latest findings on the cutaneous and gut microbiome expands our understanding of the origin of dermatologic disease. , but the gut microbiome also has effects on the skin microbiome that are just being elucidated. Although we do not yet know enough to give our patients definitive advice about probiotics, the knowledge in this field is rapidly expanding and is an exciting area to watch. Certainly, everything applied to the skin or ingested in the diet plays a role in the skin and gut microbiome. Therefore, the savvy dermatologist understands that personal care products, including cosmeceuticals, will affect the microbiome. At this point, we do not yet know what is beneficial, but we do know that diversity of organisms is important and is the preferred state as compared to having fewer types of organisms on the skin.

Acne
Acne has long been known to have a multifactorial etiologic pathway. It is increasingly thought that understanding the role of the skin (and possibly gut) microbiome in acne pathophysiology may lead to enhanced treatments.2 New gene sequencing technologies, particularly those based on recA and tly loci, are teaching us more about the anaerobic bacterium Propionibacterium acnes (now called Cutibacterium acnes).3
In 2017, Dréno et al. studied the skin microbiota in 26 subjects with mild to moderate acne. The microflora were characterized using a high‐throughput sequencing approach that targets a portion of the bacterial 16S rRNA gene. The samples were obtained before and after 28 days of treatment with erythromycin 4% or a cosmeceutical containing lipohydroxy acid, salicylic acid, linoleic acid, niacinamide, piroctone olamine, a ceramide, and thermal spring water. Upon conclusion of the study, Actinobacteria were reduced in both groups while staphylococci were reduced only in the dermocosmetic group.4 The interesting point of this study was that the cosmeceutical had a greater impact on staphylococci than did topical erythromycin, demonstrating that personal care products can have profound effects on the microbiome.
Early in 2018, Kelhälä et al. compared the impact of the systemic acne treatments isotretinoin and lymecycline on cutaneous microbiota in the cheeks, back, and axillae of mild to moderate acne patients using gene sequencing. They found that acne severity positively correlated with Propionibacterium acnes levels. P. acnes levels were decreased by both treatments, but isotretinoin resulted in a greater decrease. Increased microbiome diversity was seen on the cheek and back in all treated subjects, but diversity was highest in those treated with isotretinoin.5 The authors postulated that the diversity resulted from a decrease in P. acnes levels. To learn more about what to tell your patients about acne and the microbiome, read my blog
Atopic dermatitis
Atopic dermatitis (AD) is associated with dysbiosis of cutaneous microbiota and diminished diversity in microbial communities.6,7 There is also a robust epidemiologic relationship between the cutaneous and gut microbiomes and AD.8 Many studies have looked at the role of the microbiome in AD, including the role of Staphylococcus aureus, because it selectively colonizes the lesional skin of AD patients but is notably lacking on the skin of most healthy people.
In a 2017 literature review, Bjerre et al. found that while the data were not extensive, AD-affected skin was characterized by low bacterial diversity with S. aureus and Staphylococcus epidermidis more abundant. Also that year, Williams and Gallo reported on a prospective clinical trial in children that colonization by S. aureus occurred before the emergence of AD symptoms.9 In 2018, Clausen et al. reported on an observational case-control study of 45 adult healthy controls and 56 adult patients with AD between January and June 2015 to evaluate skin and nasal microbiome diversity and composition and to elucidate the relationship between disease severity and filaggrin gene mutations in AD patients. Next-generation sequencing targeting 16S ribosomal RNA was used to show that microbiome diversity was lower in the lesional skin, nonlesional skin, and nose in AD patients compared with controls. Such diversity was also found to be inversely correlated with disease severity, and microbiome composition in nonlesional AD skin was found to be associated with filaggrin gene mutations. The authors concluded that host genetics and skin microbiome may be connected in AD.10
However, the role of S. aureus in AD and the effect of its presence on microbiome diversity is still unclear. Marrs and Flohr note that the eradication of S. aureus does not appear to account for improvement in AD and increase in bacterial diversity after the use of antimicrobial and anti-inflammatory therapy.11
Rosacea
Rosacea is a chronic inflammatory skin condition long associated with Demodex mites (Demodex folliculorum and Demodex brevis).12 In rosacea-affected skin, Demodex mites are found to occur in greater density than in unaffected skin.13 Other microbiota-linked alterations have been detected on the skin and in the small intestines in cases of rosacea.14 One twin study showed that increased levels of Gordonia correlated with rosacea severity.15 A study in Korean women with rosacea demonstrated a reduction of Peptococcaceae, Methanobrevibacter, Slackia, Coprobacillus, Citrobacter (genus), and Desulfovibrio and an increased amount of Acidaminococcus, Megasphaera, and Lactobacillales in women with rosacea.16
Other studies have shown that treating bacterial overgrowth in the gut can improve rosacea.17 In my favorite recent study,18 complement appeared to affect microbial diversity and richness of the skin and the gut in mice, demonstrating that the immune system plays an important role in rosacea and the skin and gut microbiome. Certainly we have a lot to learn before we can make specific recommendations, but I feel certain that this area of research will unlock some of the mysteries of rosacea. To read more about what to tell your patients about the microbiome and rosacea visit the blog at STSfranchise.com.
Conclusion
In recent years, it has become increasingly clear that the cutaneous microbiome is a factor in various skin disorders. Some authors such as Egert et al. advocate the use of pre- and probiotics, including topical microbiome transplantation therapies, to treat acne, rosacea, and AD.14 I believe that we do not yet have enough data to support this approach or predict which ones may be effective. Stay tuned for more developments.
Dr. Baumann is a private practice dermatologist, researcher, author and entrepreneur who practices in Miami. She founded the Cosmetic Dermatology Center at the University of Miami in 1997. Dr. Baumann wrote two textbooks: “Cosmetic Dermatology: Principles and Practice” (New York: McGraw-Hill, 2002), and “Cosmeceuticals and Cosmetic Ingredients,” (New York: McGraw-Hill, 2014), and a New York Times Best Sellers book for consumers, “The Skin Type Solution” (New York: Bantam Dell, 2006). Dr. Baumann has received funding for advisory boards and/or clinical research trials from Allergan, Evolus, Galderma, and Revance. She is the founder and CEO of Skin Type Solutions Franchise Systems LLC. Write to her at dermnews@mededge.com.
References
1. O’Neill CA et al. Bioessays. 2016 Nov;38(11):1167-76.
2. Rocha MA et al. Arch Dermatol Res. 2018 Apr;310(3):181-5.
3. McDowell A. Microorganisms. 2017 Dec 21. doi: 10.3390/microorganisms6010001.
4. Dréno B et al. Exp Dermatol. 2017 Sep;26(9):798-803.
5. Kelhälä HL et al. Exp Dermatol. 2018 Jan;27(1):30-6.
6. Rodrigues Hoffmann A. Vet Dermatol. 2017 Feb;28(1):60-e15.
7. Bjerre RD et al. Br J Dermatol. 2017 Nov;177(5):1272-8.
8. Knaysi G et al. Curr Allergy Asthma Rep. 2017 Jan;17(1):7.
9. Williams MR et al. J Invest Dermatol. 2017 Dec;137(12):2460-1.
10. Clausen ML et al. JAMA Dermatol. 2018 Mar 1;154(3):293-300.
11. Marrs T et al. Br J Dermatol. 2016 Oct;175 Suppl 2:13-18.
12. Patra V et al. Front Microbiol. 2016 Aug 10. doi: 10.3389/fmicb.2016.01235.
13. Igawa S et al. Transl Res. 2017 Jun;184:68-76.
14. Egert Met al. Clin Pharmacol Ther. 2017;102(1):62-9.
15. Zaidi AK et al. Exp Dermatol. 2018 Mar;27(3):295-8.
16. Nam, JH et al. Exp Dermatol. 2018 Jan;27(1):37-42.
17. Porubsky CF et al. “The Role of Probiotics in Acne and Rosacea,” IntechOpen. 2018 Nov 5. doi: 10.5772/intechopen.79044.
18. Chehoud C et al. Proc Natl Acad Sci U S A. 2013 Sep 10;110(37):15061-6.
The microbiome of the gut and skin can impact one another in health and disease. Numerous dermatologic disorders can be traced to gastrointestinal etiologic origins.1 Incorporating discussion of the latest findings on the cutaneous and gut microbiome expands our understanding of the origin of dermatologic disease. , but the gut microbiome also has effects on the skin microbiome that are just being elucidated. Although we do not yet know enough to give our patients definitive advice about probiotics, the knowledge in this field is rapidly expanding and is an exciting area to watch. Certainly, everything applied to the skin or ingested in the diet plays a role in the skin and gut microbiome. Therefore, the savvy dermatologist understands that personal care products, including cosmeceuticals, will affect the microbiome. At this point, we do not yet know what is beneficial, but we do know that diversity of organisms is important and is the preferred state as compared to having fewer types of organisms on the skin.
Acne
Acne has long been known to have a multifactorial etiologic pathway. It is increasingly thought that understanding the role of the skin (and possibly gut) microbiome in acne pathophysiology may lead to enhanced treatments.2 New gene sequencing technologies, particularly those based on recA and tly loci, are teaching us more about the anaerobic bacterium Propionibacterium acnes (now called Cutibacterium acnes).3
In 2017, Dréno et al. studied the skin microbiota in 26 subjects with mild to moderate acne. The microflora were characterized using a high‐throughput sequencing approach that targets a portion of the bacterial 16S rRNA gene. The samples were obtained before and after 28 days of treatment with erythromycin 4% or a cosmeceutical containing lipohydroxy acid, salicylic acid, linoleic acid, niacinamide, piroctone olamine, a ceramide, and thermal spring water. Upon conclusion of the study, Actinobacteria were reduced in both groups while staphylococci were reduced only in the dermocosmetic group.4 The interesting point of this study was that the cosmeceutical had a greater impact on staphylococci than did topical erythromycin, demonstrating that personal care products can have profound effects on the microbiome.
Early in 2018, Kelhälä et al. compared the impact of the systemic acne treatments isotretinoin and lymecycline on cutaneous microbiota in the cheeks, back, and axillae of mild to moderate acne patients using gene sequencing. They found that acne severity positively correlated with Propionibacterium acnes levels. P. acnes levels were decreased by both treatments, but isotretinoin resulted in a greater decrease. Increased microbiome diversity was seen on the cheek and back in all treated subjects, but diversity was highest in those treated with isotretinoin.5 The authors postulated that the diversity resulted from a decrease in P. acnes levels. To learn more about what to tell your patients about acne and the microbiome, read my blog
Atopic dermatitis
Atopic dermatitis (AD) is associated with dysbiosis of cutaneous microbiota and diminished diversity in microbial communities.6,7 There is also a robust epidemiologic relationship between the cutaneous and gut microbiomes and AD.8 Many studies have looked at the role of the microbiome in AD, including the role of Staphylococcus aureus, because it selectively colonizes the lesional skin of AD patients but is notably lacking on the skin of most healthy people.
In a 2017 literature review, Bjerre et al. found that while the data were not extensive, AD-affected skin was characterized by low bacterial diversity with S. aureus and Staphylococcus epidermidis more abundant. Also that year, Williams and Gallo reported on a prospective clinical trial in children that colonization by S. aureus occurred before the emergence of AD symptoms.9 In 2018, Clausen et al. reported on an observational case-control study of 45 adult healthy controls and 56 adult patients with AD between January and June 2015 to evaluate skin and nasal microbiome diversity and composition and to elucidate the relationship between disease severity and filaggrin gene mutations in AD patients. Next-generation sequencing targeting 16S ribosomal RNA was used to show that microbiome diversity was lower in the lesional skin, nonlesional skin, and nose in AD patients compared with controls. Such diversity was also found to be inversely correlated with disease severity, and microbiome composition in nonlesional AD skin was found to be associated with filaggrin gene mutations. The authors concluded that host genetics and skin microbiome may be connected in AD.10
However, the role of S. aureus in AD and the effect of its presence on microbiome diversity is still unclear. Marrs and Flohr note that the eradication of S. aureus does not appear to account for improvement in AD and increase in bacterial diversity after the use of antimicrobial and anti-inflammatory therapy.11
Rosacea
Rosacea is a chronic inflammatory skin condition long associated with Demodex mites (Demodex folliculorum and Demodex brevis).12 In rosacea-affected skin, Demodex mites are found to occur in greater density than in unaffected skin.13 Other microbiota-linked alterations have been detected on the skin and in the small intestines in cases of rosacea.14 One twin study showed that increased levels of Gordonia correlated with rosacea severity.15 A study in Korean women with rosacea demonstrated a reduction of Peptococcaceae, Methanobrevibacter, Slackia, Coprobacillus, Citrobacter (genus), and Desulfovibrio and an increased amount of Acidaminococcus, Megasphaera, and Lactobacillales in women with rosacea.16
Other studies have shown that treating bacterial overgrowth in the gut can improve rosacea.17 In my favorite recent study,18 complement appeared to affect microbial diversity and richness of the skin and the gut in mice, demonstrating that the immune system plays an important role in rosacea and the skin and gut microbiome. Certainly we have a lot to learn before we can make specific recommendations, but I feel certain that this area of research will unlock some of the mysteries of rosacea. To read more about what to tell your patients about the microbiome and rosacea visit the blog at STSfranchise.com.
Conclusion
In recent years, it has become increasingly clear that the cutaneous microbiome is a factor in various skin disorders. Some authors such as Egert et al. advocate the use of pre- and probiotics, including topical microbiome transplantation therapies, to treat acne, rosacea, and AD.14 I believe that we do not yet have enough data to support this approach or predict which ones may be effective. Stay tuned for more developments.
Dr. Baumann is a private practice dermatologist, researcher, author and entrepreneur who practices in Miami. She founded the Cosmetic Dermatology Center at the University of Miami in 1997. Dr. Baumann wrote two textbooks: “Cosmetic Dermatology: Principles and Practice” (New York: McGraw-Hill, 2002), and “Cosmeceuticals and Cosmetic Ingredients,” (New York: McGraw-Hill, 2014), and a New York Times Best Sellers book for consumers, “The Skin Type Solution” (New York: Bantam Dell, 2006). Dr. Baumann has received funding for advisory boards and/or clinical research trials from Allergan, Evolus, Galderma, and Revance. She is the founder and CEO of Skin Type Solutions Franchise Systems LLC. Write to her at dermnews@mededge.com.
References
1. O’Neill CA et al. Bioessays. 2016 Nov;38(11):1167-76.
2. Rocha MA et al. Arch Dermatol Res. 2018 Apr;310(3):181-5.
3. McDowell A. Microorganisms. 2017 Dec 21. doi: 10.3390/microorganisms6010001.
4. Dréno B et al. Exp Dermatol. 2017 Sep;26(9):798-803.
5. Kelhälä HL et al. Exp Dermatol. 2018 Jan;27(1):30-6.
6. Rodrigues Hoffmann A. Vet Dermatol. 2017 Feb;28(1):60-e15.
7. Bjerre RD et al. Br J Dermatol. 2017 Nov;177(5):1272-8.
8. Knaysi G et al. Curr Allergy Asthma Rep. 2017 Jan;17(1):7.
9. Williams MR et al. J Invest Dermatol. 2017 Dec;137(12):2460-1.
10. Clausen ML et al. JAMA Dermatol. 2018 Mar 1;154(3):293-300.
11. Marrs T et al. Br J Dermatol. 2016 Oct;175 Suppl 2:13-18.
12. Patra V et al. Front Microbiol. 2016 Aug 10. doi: 10.3389/fmicb.2016.01235.
13. Igawa S et al. Transl Res. 2017 Jun;184:68-76.
14. Egert Met al. Clin Pharmacol Ther. 2017;102(1):62-9.
15. Zaidi AK et al. Exp Dermatol. 2018 Mar;27(3):295-8.
16. Nam, JH et al. Exp Dermatol. 2018 Jan;27(1):37-42.
17. Porubsky CF et al. “The Role of Probiotics in Acne and Rosacea,” IntechOpen. 2018 Nov 5. doi: 10.5772/intechopen.79044.
18. Chehoud C et al. Proc Natl Acad Sci U S A. 2013 Sep 10;110(37):15061-6.

Unicondylar Knee Arthroplasty in the U.S. Patient Population: Prevalence and Epidemiology
ABSTRACT
Publications on the prevalence of unicompartmental knee arthroplasty in the United States using a single database may have underestimated the “true” number of cases performed, given that several unicondylar knee arthroplasty (UKA) patients are <65 years and have private insurance. The prevalence of UKA in elderly (≥65 years) and younger (<65 years) populations was evaluated using the 2002 to 2011 5% sample of the Medicare data (Part B) and the 2004 to June 2012 MarketScan Commercial and Medicare Supplemental databases, respectively. The prevalence of UKA was stratified by age, gender, census region, Charlson comorbidity index, Medicare buy-in status, and diagnosis. The annual rate of change in the UKA rate was examined using Poisson regression to evaluate temporal changes considering year as a covariate.
A total of 5235 and 23,310 UKA procedures were identified from the 5% Medicare and MarketScan databases, respectively. The rates of UKA generally increased until 2008, after which there was a decline. In both cohorts, gender and year of operation were found to be significantly associated with UKA rate. Analysis of data obtained over the past few years revealed that males 55 to 64 years, 65 to 69 years, and 70 to 74 years were the only age-gender groups whose UKA rates appeared to be trending upward.
From 2002 to 2011, the rate of UKAs performed in the United States has increased, and a significant proportion of the surgeries were performed in younger (<65 years) patients.
Continue to: Unicondylar knee arthroplasty...
Unicondylar knee arthroplasty (UKA) is an effective surgical treatment for symptomatic degenerative joint disease of a single compartment of the knee, providing improved functional outcomes compared with total knee arthroplasty (TKA).1-3 It has been estimated that the proportion of patients undergoing TKA, who meet the criteria for UKA, varies between 21% and 47%.4,5 However, it has been variably estimated that the usage of UKA ranges from 0% to 50% (mean, 8%) of all primary knee arthroplasties.5-8 It is believed that this discrepancy between the percentage of patients who meet indications for the surgery and those who receive it is associated with various factors, including surgeon training and experiences, diverse indications, economic factors, as well as acknowledgment of the reportedly higher revision rates of UKA than those of TKA in national joint registries.7,9-11
According to their classic article, Kozinn and Scott12 outlined the indications for UKA that, in their experience, led to the most successful outcomes, including age >60 years, weight <82 kg, low physical demand, localized arthritis with no full-thickness chondromalacia elsewhere in the joint, intact anterior cruciate ligament, minimal deformity, and flexion >90°. More recently, indications have been expanded to include younger and more active patients, higher body mass index, and some patterns of patellofemoral chondromalacia, with an increasing number of publications reporting successful clinical outcomes in these cohorts as well.13-17 Taken together, it is clear that the “classic” strict indications for UKA can be safely expanded, which have and will result in an increased number of these procedures being performed above and beyond that which might be predicted based on demographic trends alone.
A growing body of literature has been published on the prevalence and projections of orthopedic procedures in the United States.18-20 Several studies have focused their analysis on 1 of several large administrative databases, including the Nationwide Inpatient Sample, the 5% Medicare Part B database, and the National Hospital Discharge Survey.18,20-23 A concern with limiting an analysis of the prevalence of unicompartmental knee arthroplasty to these particular databases is that it may underestimate the “true” number of cases performed in the United States, given that several UKA patients are <65 years and have private insurance, and therefore, would not be captured statistically by a database that collects data on patients ≥65 years.
The purpose of this study was to quantify the current prevalence and epidemiology of UKA in the U.S. patient population. Our hypothesis was that the number of procedures and the procedural rate of UKA are increasing over time. Furthermore, this increase may be attributed to an increase in select age- or gender-based segments of the population. To test this hypothesis, we analyzed 2 separate large claims databases to capture patients over a spectrum of age and inclusive of both private and public payers, including the 5% Medicare Part B database (2002–2011) for patients ≥65 years and the MarketScan database (2004 to June 2011) for patients <65 years. Understanding the accurate trends in the use of UKA on a national scale is important for legislative bodies, healthcare administrators, and physicians.
MATERIALS AND METHODS
The 2002 to 2011 5% sample of the Medicare data (Part B) and the 2004 to June 2012 MarketScan Commercial and Medicare Supplemental databases were used to evaluate the prevalence of UKA in elderly (≥65 years) and younger (<65 years) populations, respectively. The UKA procedures were identified using the CPT code 27446.
The prevalence of UKA was stratified by age, gender, census region, Charlson Comorbidity Index, Medicare buy-in status, and diagnosis. The buy-in status is a proxy for the socioeconomic status as it reflects the state subsidizing the health insurance premium for the beneficiary. The Charlson Comorbidity Index is a composite score that has been used to assess the comorbidity level of a patient by taking into account the number and the severity of comorbid conditions.24 For the elderly population, the rate of UKA was subsequently evaluated based on the number of beneficiaries for that particular age-gender group and year in both databases. Poisson regression was used to evaluate the annual rate of change in the UKA rate for assessing temporal changes considering year as a covariate. Age and gender, as well as 2-way interaction terms for age, gender, and year, were also considered as covariates.
Continue to: RESULTS...
RESULTS
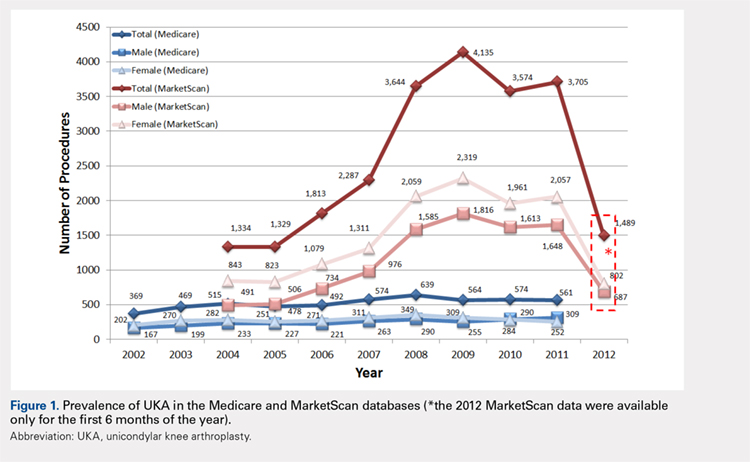
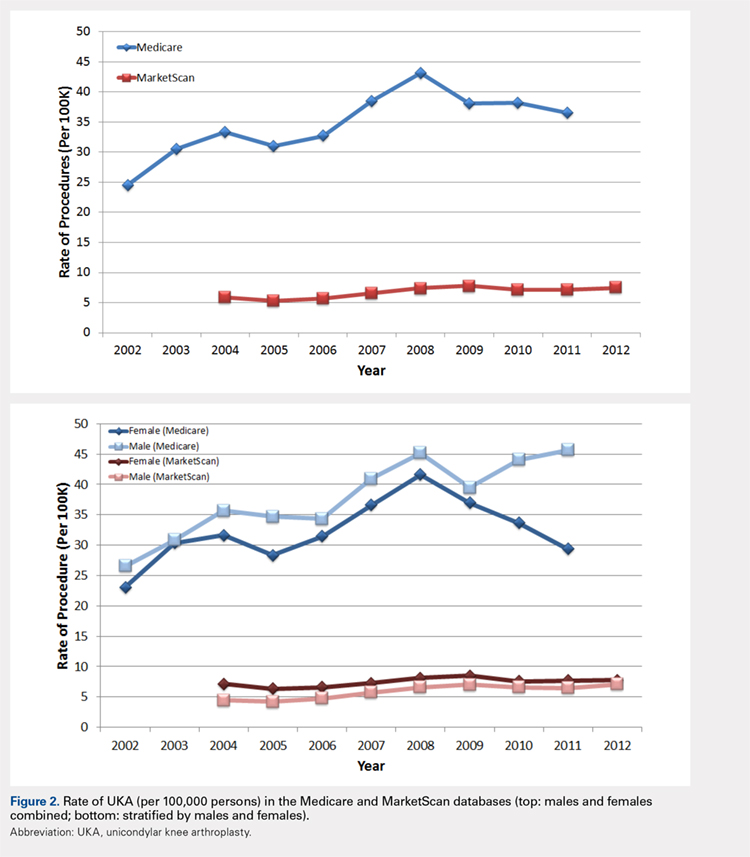
For the time periods analyzed, a total of 5235 and 23,310 UKA procedures were identified from the 5% Medicare and MarketScan databases, respectively. A peak in the prevalence appeared around 2008 for the elderly population and in 2009 for the younger population (Figure 1). When normalized by the size of the population segment, the rate of UKA was found to be approximately 5 times greater in the elderly population, increasing from 369 in 2002 to 639 in 2008, but plateauing to 561 in 2011. Extrapolating to the 100% Medicare population, these numbers increased to 7380, 12,780, and 11,220, respectively. Temporal changes in the UKA rate were significant, increasing from 24.5 UKAs per 100,000 persons in 2002 to 43.1 UKAs in 2008, followed by a decline to 36.5 in 2011 (P < .0001) (Figure 2). The rates of UKA generally increased from 2002 to 2008 for both males and females in the Medicare cohort; however, the rates of UKA in female patients continuously declined from 2008 onward, whereas the UKA rates in male patients decreased in 2009, followed by an increase in 2010 and 2011 (Figure 2). For the younger population, there was a slight increase in the rate of UKA from 2004 to approximately 2009, after which the rates for both males and females remained relatively steady. When put in the context of the prevalence of TKA, the prevalence of UKA fluctuated during the same time period. In the Medicare population, the prevalence of UKA ranged from 4.3% (2005) to 5.9% (2008) of the TKA prevalence between 2002 and 2011. In the younger MarketScan population, the prevalence of UKA ranged from 6.7% (2005) to 8.9% (2008) between 2004 and June 2012.
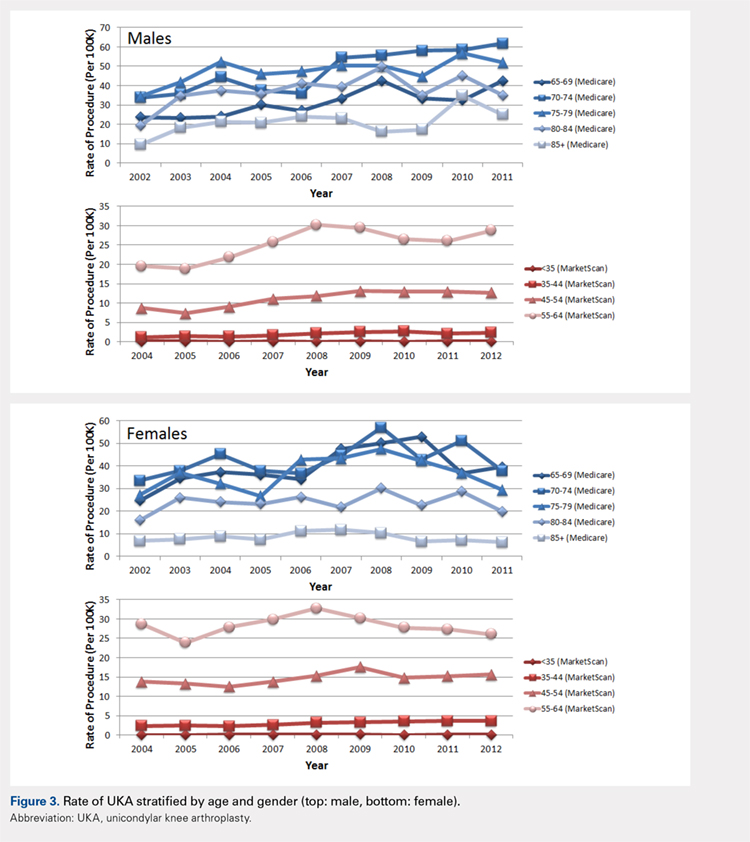
The UKA rate differed significantly according to gender (P = .0209), with higher rates for males. Although there were no age-related differences (P = .3723), age–gender interactions were found to be significant (P < .0001). For males, the largest rate of UKA in the most recent year of data was observed in the 70- to 74-year-old group, followed by the 75- to 79- and the 65- to 69-year-old groups (Figure 3). For females, those in the 65- to 69- and the 70- to 74-year-old groups had the highest rate of UKA. In the younger cohort, there were increases in the UKA rates since 2004. These rates appeared to be relatively stable from the 2008 or 2009 period onward, except for females 55–64 years, which demonstrated a steady decline since 2008. Analysis of data obtained over the past few years showed that males 55–64, 65–69, and 70–74 years were the only age–gender groups whose UKA rates appeared to be trending upward.
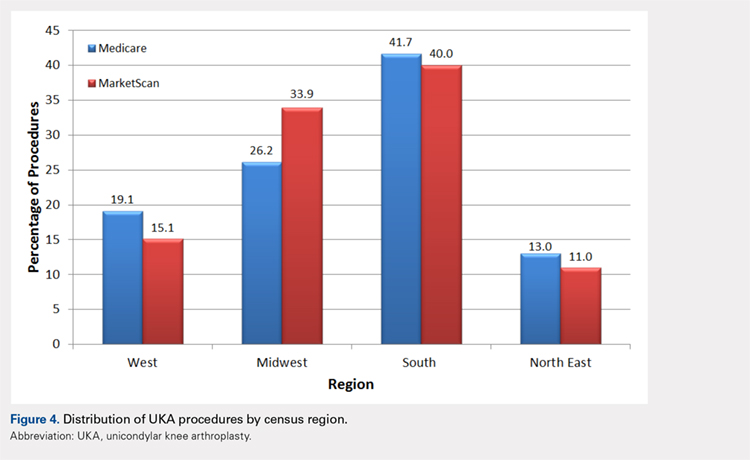
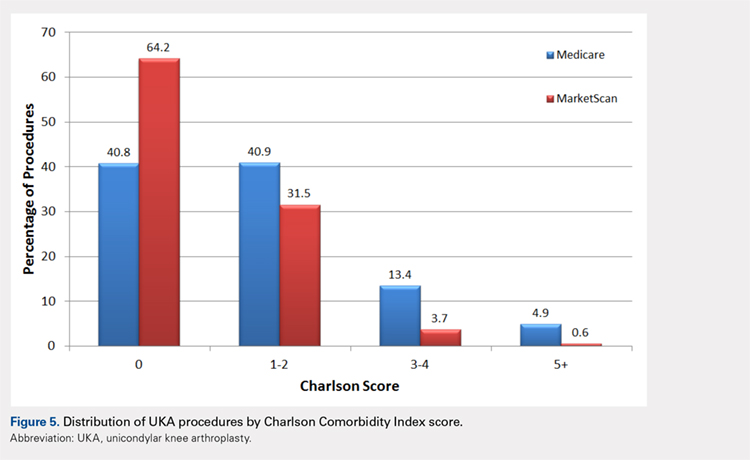
The vast majority of elderly UKA patients were white (95.5%), and when stratified by census region, the highest proportion of UKA procedures was observed in the South and the Midwest (Figure 4). Furthermore, among patients <65 years, 64.2% had a Charlson score of 0 compared to 40.8% in the elderly group (Figure 5). For the Medicare population, based on their receipt of state subsidies for their insurance premiums, 5.1% of patients were of lower socioeconomic status. Osteoarthritis was diagnosed in 99.4% and 97.3% of the MarketScan and Medicare cohorts, respectively.
In the Medicare cohort, gender (P = .0209) and year of operation (P < .0001) were found to be significantly associated with the rate of UKA, along with age-gender (P < .0001) and gender-year (P = .0202) interaction terms. In the MarketScan cohort, age (P = .0173), gender (P = .0017), and year of operation (P = .0002) were found to be significantly associated with UKA rate. Two-way interactions between age-gender (P = .0018), age–year (P = .0207), and gender-year (P = .0017) were also found to be statistically significant factors.
Continue to: DISCUSSION...
DISCUSSION
The results of our study indicate that between 2002 and 2011, a steadily increasing number of UKA procedures was performed in the United States, and a significant proportion of the surgeries was performed on patients <65 years. Without the MarketScan database data, we would have missed more than 23,000 UKA cases performed during this 10-year time period. This finding validates our research methodology that incorporated data on privately insured younger (<65 years) patients, which is something that has not been done when examining the epidemiology of UKA.
To our knowledge, there are only 2 other publications attempting to quantify the incidence of UKA procedures performed in the United States. Bolognesi and colleagues23 used the Medicare 5% sample to assess trends in the use of knee arthroplasty from 2000 to 2009. The authors reported that a total of 68,603 patients underwent unilateral total knee arthroplasty (n = 65,505) or unicompartmental knee arthroplasty (n = 3098) over this 10-year time period. Given that there is substantial overlap of our time periods, it is not surprising that our Medicare numbers are similar (3098 vs 5235). In their study, the use of TKA increased 1.7-fold, whereas the use of UKA increased 6.2-fold23. In our analysis of the Medicare (2011 vs 2002) and MarketScan (2011 vs 2004) databases, there was a 1.3-fold and a 3.4-fold increase in the number of TKAs performed. Concomitantly, the use of UKA increased 1.5-fold and 2.8-fold, respectively, in these databases over the same time periods. The reason for the slight discrepancy in the numbers may be attributable to the peak occurring in 2008. The other publication on the subject by Riddle and colleagues8 focused on the time period 1998 to 2005 and used implant manufacturer’s sales data cross-referenced to a database of 44 hospitals to derive their national estimates. Using their unique methodology, the authors calculated an incidence of UKA, ranging from 6570 implants in 1998 to 44,990 in 2005. They reported that UKA use during the study period increased by 3 times the rate of TKA in the United States, with an average yearly percentage increase in the number of UKA procedures of 32.5% compared to 9.4% for TKA procedures. It is difficult to account for the discrepancy in the number of UKAs performed reported between our current study and that of Riddle and colleagues;8 however, the fact that the authors used implant manufacturer’s individual sales numbers may indicate that a portion of UKA patients was not captured in either the Medicare 5% or the MarketScan database. Nonetheless, in our analysis, the annual increase in the number of UKA procedures performed during the time periods studied averaged 5.8% in the older population and 25.4% in the younger population compared to the increase in the number of TKA procedures, which averaged 3.6% and 33.9% in the older and younger populations, respectively. In addition, in our study, the percentage of UKAs performed relative to the number of TKAs during the time intervals studied varied from a low of 4.3% to a high of 5.9% in the older population and from a low of 6.7% to a high of 8.9% in the younger population.
During the 10-year period of this study, a general upward trend appeared in the total number of unicompartmental knee arthroplasties performed in both the Medicare and the MarketScan databases. The rate at which the procedure was performed increased in the Medicare population from 24.5 to 36.5 (per 100,000 persons) over a 10-year time period and in the MarketScan cohort from 5.9 to 7.4 (per 100,000 persons) over an 8.5-year time period. This indicates both a larger absolute and a relative rate increase in UKA procedures in the elderly population. Around 2008 and 2009, the data showed a slight dip in the rate of UKA in the Medicare population and a plateau in the rate in the MarketScan database. Although this may be a spurious finding in the data that would be smoothed out with a longer time period investigated, it is interesting that this finding coincided with a national economic downturn. Although it might be expected that macroeconomics may affect the utilization of elective surgery such as total joint replacement, Kurtz and colleagues25 investigated this particular question and found that neither the economic downturns of 2001 or those of 2008 and 2009 had a significant impact on the incidence of total joint replacement surgeries.
Incorporation of the MarketScan database data indicated that a significant proportion of patients undergoing UKA were <65 years and that there was a slight but increasing rate of procedures performed on this age cohort over the past decade. A similar finding has been reported in the Finnish Arthroplasty Registry. Leskinen and colleagues26 reported that the incidence of UKAs among individuals 30 to 59 years increased from 0.2 (per 100,000 persons) to 10 (per 100,000 persons) from 1980 to 2006 and that most of the increase occurred among patients 50 to 59 years. The fact that younger age is no longer observed as a relative contraindication to this procedure is supported by several clinical investigations. Cartier and colleagues27 reported 93% survival at 10 years in patients with a mean age of 65 years, but included patients as young as 28 years, claiming that the results for younger patients were no worse than those for older patients in the series. Pandit and colleagues17 compared the results of 245 young patients (<60 years) to those of 755 older patients (>60 years) and found a survival rate of 97% at 10 years, with no significant difference in mean functional outcomes, failure rate, or survival between the groups at >5 years of follow-up. Given that patients <65 years now account for approximately half of the TKAs performed each year, with the greatest increase in volume among patients between 45 and 54, it is clear that investigations on the epidemiology of UKA must take into account this increasingly relevant younger patient cohort.28
Continue to: Our data indicate...
Our data indicate that only approximately 5% of UKA patients were non-white and another 5% were from lower socioeconomic status. These findings have been observed in multiple other studies looking at the epidemiology of total joint replacement in the United States.29 Bolognesi and colleagues23 reported that although “non-white race” patients made up 12% of the general Medicare sample they were analyzing, these patients accounted for only 5% and 3% of the total knee arthroplasty and unicompartmental knee arthroplasty populations, respectively. Although it is beyond the scope of this paper to delve into the reasons for this discrepancy, it may be related to differences in access to care, healthcare literacy, and trust of patients in the healthcare system.30,31
Our study, like all those based on administrative claims, has several notable inherent limitations. Coding inaccuracies as well as the potential for systematic bias (eg, underreporting) may affect the accuracy of our results. Although the MarketScan Commercial Research Database (Truven Health Analytics) includes nationally representative information for >180 million patients covered with private insurance, it is possible that we have missed some patients who underwent UKA during the time period investigated. However, we feel that the number missed is probably small and does not affect our conclusions in any meaningful manner.
CONCLUSION
This novel analysis of 2 separate administrative claims databases, which more accurately captures all patients undergoing UKA, indicates that there has been a steady increase in the rate of the procedure over the past decade and that a significant proportion of the surgeries were performed in younger (<65 years) patients. Understanding the accurate trends in the use of UKA on a national scale is important for legislative bodies, healthcare administrators, as well as physicians. Furthermore, given the increasing rates of UKA in patients <65 years old, and the increased burden on implants for withstanding increased activities and repetitive loads, it remains imperative to strive to optimize materials, implant designs, and surgical techniques to enhance implant durability.
- Hopper GP, Leach WJ. Participation in sporting activities following knee replacement: total versus unicompartmental. Knee Surg Sports Traumatol Arthrosc. 2008;16(10):973-979. doi: 10.1007/s00167-008-0596-9.
- Lygre SH, Espehaug B, Havelin LI, Furnes O, Vollset SE. Pain and function in patients after primary unicompartmental and total knee arthroplasty. J Bone Joint Surg, (Am). 2010;92(18):2890-2897. doi: 10.2106/JBJS.I.00917.
- Liddle AD, Pandit H, Judge A, Murray DW. Patient-reported outcomes after total and unicompartmental knee arthroplasty: a study of 14,076 matched patients from the National Joint Registry for England and Wales. Bone Joint J. 2015;97-B(6):793-801. doi: 10.1302/0301-620X.97B6.35155.
- Arno S, Maffei D, Walker PS, Schwarzkopf R, Desai P, Steiner GC. Retrospective analysis of total knee arthroplasty cases for visual, histological, and clinical eligibility of unicompartmental knee arthroplasties. J Arthroplast. 2011;26(8):1396-1403. doi: 10.1016/j.arth.2010.12.023.
- Willis-Owen CA, Brust K, Alsop H, Miraldo M, Cobb JP. Unicondylar knee arthroplasty in the UK National Health Service: an analysis of candidacy, outcome and cost efficacy. Knee. 2009;16(6):473-478. doi: 10.1016/j.knee.2009.04.006.
- Murray DW, Liddle AD, Dodd CA, Pandit H. Unicompartmental knee arthroplasty: is the glass half full or half empty? Bone Joint J. 2015;97-B(10 Suppl. A):3-8. doi: 10.1302/0301-620X.97B10.36542.
- Liddle AD, Judge A, Pandit H, Murray DW. Adverse outcomes after total and unicompartmental knee replacement in 101,330 matched patients: a study of data from the National Joint Registry for England and Wales. Lancet. 2014;384(9952):1437-1445. doi: 10.1016/S0140-6736(14)60419-0.
- Riddle DL, Jiranek WA, McGlynn FJ. Yearly incidence of unicompartmental knee arthroplasty in the United States. J Arthroplast. 2008;23(3):408-412. doi: 10.1016/j.arth.2007.04.012.
- Argenson JN, Blanc G, Aubaniac JM, Parratte S. Modern unicompartmental knee arthroplasty with cement: a concise follow-up, at a mean of twenty years, of a previous report. J Bone Joint Surg, (Am). 2013;95(10):905-909. doi: 10.2106/JBJS.L.00963.
- Koskinen E, Eskelinen A, Paavolainen P, Pulkkinen P, Remes V. Comparison of survival and cost-effectiveness between unicondylar arthroplasty and total knee arthroplasty in patients with primary osteoarthritis: a follow-up study of 50,493 knee replacements from the Finnish Arthroplasty Register. Acta Orthop. 2008;79(4):499-507. doi: 10.1080/17453670710015490.
- Knutson K, Lewold S, Robertsson O, Lidgren L. The Swedish knee arthroplasty register. A nation-wide study of 30,003 knees 1976-1992. Acta Orthop Scand. 1994;65(4):375-386. doi: 10.3109/17453679408995475.
- Kozinn SC, Scott R. Unicondylar knee arthroplasty. J Bone Joint Surg, (Am). 1989;71(1):145-150. doi: 10.2106/00004623-198971010-00023.
- Pennington DW. Unicompartmental knee arthroplasty in patients sixty years of age or younger. J Bone Joint Surg, (Am). 2003;85-A(10):1968-1973. doi: 10.2106/00004623-200310000-00016.
- Biswas D, Van Thiel GS, Wetters NG, Pack BJ, Berger RA, Della Valle CJ. Medial unicompartmental knee arthroplasty in patients less than 55 years old: minimum of two years of follow-up. J Arthroplast. 2014;29(1):101-105. doi: 10.1016/j.arth.2013.04.046.
- Murray DW, Pandit H, Weston-Simons JS, et al. Does body mass index affect the outcome of unicompartmental knee replacement? Knee. 2013;20(6):461-465. doi: 10.1016/j.knee.2012.09.017.
- Kang SN, Smith TO, Sprenger De Rover WB, Walton NP. Pre-operative patellofemoral degenerative changes do not affect the outcome after medial Oxford unicompartmental knee replacement: a report from an independent centre. J Bone Joint Surg Br. 2011;93(4):476-478. doi: 10.1302/0301-620X.93B4.25562.
- Pandit H, Jenkins C, Gill HS, et al. Unnecessary contraindications for mobile-bearing unicompartmental knee replacement. J Bone Joint Surg Br. 2011;93(5):622-628. doi: 10.1302/0301-620X.93B5.26214.
- Kurtz S, Mowat F, Ong K, Chan N, Lau E, Halpern M. Prevalence of primary and revision total hip and knee arthroplasty in the United States from 1990 through 2002. J Bone Joint Surg Am. 2005;87(7):1487-1497. doi: 10.2106/JBJS.D.02441.
- Kurtz SM, Ong KL, Schmier J, et al. Future clinical and economic impact of revision total hip and knee arthroplasty. J Bone Joint Surg, (Am). 2007;89(Suppl. 3):144-151. doi: 10.2106/JBJS.G.00587.
- Day JS, Lau E, Ong KL, Williams GR, Ramsey ML, Kurtz SM. Prevalence and projections of total shoulder and elbow arthroplasty in the United States to 2015. J Shoulder Elbow Surg. 2010;19(8):1115-1120. doi: 10.1016/j.jse.2010.02.009.
- Kurtz S, Ong K, Lau E, Mowat F, Halpern M. Projections of primary and revision hip and knee arthroplasty in the United States from 2005 to 2030. J Bone Joint Surg, (Am). 2007;89(4):780-785. doi: 10.2106/JBJS.F.00222.
- Kamath AF, Ong KL, Lau E, et al. Quantifying the burden of revision total joint arthroplasty for periprosthetic infection. J Arthroplast. 2015;30(9):1492-1497. doi: 10.1016/j.arth.2015.03.035.
- Bolognesi MP, Greiner MA, Attarian DE, et al. Unicompartmental knee arthroplasty and total knee arthroplasty among Medicare beneficiaries, 2000 to 2009. J Bone Joint Surg, (Am). 2013;95(22):e174. doi: 10.2106/JBJS.L.00652.
- Charlson ME, Pompei P, Ales KL, MacKenzie CR. A new method of classifying prognostic comorbidity in longitudinal studies: development and validation. J Chronic Dis. 1987;40(5):373-383. doi: 10.1016/0021-9681(87)90171-8.
- Kurtz SM, Ong KL, Lau E, Bozic KJ. Impact of the economic downturn on total joint replacement demand in the United States: updated projections to 2021. J Bone Joint Surg, (Am). 2014;96(8):624-630. doi: 10.2106/JBJS.M.00285.
- Leskinen J, Eskelinen A, Huhtala H, Paavolainen P, Remes V. The incidence of knee arthroplasty for primary osteoarthritis grows rapidly among baby boomers: a population-based study in Finland. Arthritis Rheum. 2012;64(2):423-428. doi: 10.1002/art.33367.
- Cartier P, Sanouiller JL, Grelsamer RP. Unicompartmental knee arthroplasty surgery. 10-year minimum follow-up period. J Arthroplast. 1996;11(7):782-788. doi: 10.1016/S0883-5403(96)80177-X.
- Kurtz SM, Lau E, Ong K, Zhao K, Kelly M, Bozic KJ. Future young patient demand for primary and revision joint replacement: national projections from 2010 to 2030. Clin Orthop Relat Res. 2009;467(10):2606-2612. doi: 10.1007/s11999-009-0834-6.
- Singh JA, Lu X, Rosenthal GE, Ibrahim S, Cram P. Racial disparities in knee and hip total joint arthroplasty: an 18-year analysis of national Medicare data. Ann Rheum Dis. 2014;73(12):2107-2115. doi: 10.1136/annrheumdis-2013-203494.
- Pierce TP, Elmallah RK, Lavernia CJ, et al. Racial disparities in lower extremity arthroplasty outcomes and use. Orthopedics. 2015;38(12): e1139-e1146. doi: 10.3928/01477447-20151123-05.
- Irgit K, Nelson CL. Defining racial and ethnic disparities in THA and TKA. Clin Orthop Relat Res. 2011;469(7):1817-1823. doi: 10.1007/s11999-011-1885-z.
ABSTRACT
Publications on the prevalence of unicompartmental knee arthroplasty in the United States using a single database may have underestimated the “true” number of cases performed, given that several unicondylar knee arthroplasty (UKA) patients are <65 years and have private insurance. The prevalence of UKA in elderly (≥65 years) and younger (<65 years) populations was evaluated using the 2002 to 2011 5% sample of the Medicare data (Part B) and the 2004 to June 2012 MarketScan Commercial and Medicare Supplemental databases, respectively. The prevalence of UKA was stratified by age, gender, census region, Charlson comorbidity index, Medicare buy-in status, and diagnosis. The annual rate of change in the UKA rate was examined using Poisson regression to evaluate temporal changes considering year as a covariate.
A total of 5235 and 23,310 UKA procedures were identified from the 5% Medicare and MarketScan databases, respectively. The rates of UKA generally increased until 2008, after which there was a decline. In both cohorts, gender and year of operation were found to be significantly associated with UKA rate. Analysis of data obtained over the past few years revealed that males 55 to 64 years, 65 to 69 years, and 70 to 74 years were the only age-gender groups whose UKA rates appeared to be trending upward.
From 2002 to 2011, the rate of UKAs performed in the United States has increased, and a significant proportion of the surgeries were performed in younger (<65 years) patients.
Continue to: Unicondylar knee arthroplasty...
Unicondylar knee arthroplasty (UKA) is an effective surgical treatment for symptomatic degenerative joint disease of a single compartment of the knee, providing improved functional outcomes compared with total knee arthroplasty (TKA).1-3 It has been estimated that the proportion of patients undergoing TKA, who meet the criteria for UKA, varies between 21% and 47%.4,5 However, it has been variably estimated that the usage of UKA ranges from 0% to 50% (mean, 8%) of all primary knee arthroplasties.5-8 It is believed that this discrepancy between the percentage of patients who meet indications for the surgery and those who receive it is associated with various factors, including surgeon training and experiences, diverse indications, economic factors, as well as acknowledgment of the reportedly higher revision rates of UKA than those of TKA in national joint registries.7,9-11
According to their classic article, Kozinn and Scott12 outlined the indications for UKA that, in their experience, led to the most successful outcomes, including age >60 years, weight <82 kg, low physical demand, localized arthritis with no full-thickness chondromalacia elsewhere in the joint, intact anterior cruciate ligament, minimal deformity, and flexion >90°. More recently, indications have been expanded to include younger and more active patients, higher body mass index, and some patterns of patellofemoral chondromalacia, with an increasing number of publications reporting successful clinical outcomes in these cohorts as well.13-17 Taken together, it is clear that the “classic” strict indications for UKA can be safely expanded, which have and will result in an increased number of these procedures being performed above and beyond that which might be predicted based on demographic trends alone.
A growing body of literature has been published on the prevalence and projections of orthopedic procedures in the United States.18-20 Several studies have focused their analysis on 1 of several large administrative databases, including the Nationwide Inpatient Sample, the 5% Medicare Part B database, and the National Hospital Discharge Survey.18,20-23 A concern with limiting an analysis of the prevalence of unicompartmental knee arthroplasty to these particular databases is that it may underestimate the “true” number of cases performed in the United States, given that several UKA patients are <65 years and have private insurance, and therefore, would not be captured statistically by a database that collects data on patients ≥65 years.
The purpose of this study was to quantify the current prevalence and epidemiology of UKA in the U.S. patient population. Our hypothesis was that the number of procedures and the procedural rate of UKA are increasing over time. Furthermore, this increase may be attributed to an increase in select age- or gender-based segments of the population. To test this hypothesis, we analyzed 2 separate large claims databases to capture patients over a spectrum of age and inclusive of both private and public payers, including the 5% Medicare Part B database (2002–2011) for patients ≥65 years and the MarketScan database (2004 to June 2011) for patients <65 years. Understanding the accurate trends in the use of UKA on a national scale is important for legislative bodies, healthcare administrators, and physicians.
MATERIALS AND METHODS
The 2002 to 2011 5% sample of the Medicare data (Part B) and the 2004 to June 2012 MarketScan Commercial and Medicare Supplemental databases were used to evaluate the prevalence of UKA in elderly (≥65 years) and younger (<65 years) populations, respectively. The UKA procedures were identified using the CPT code 27446.
The prevalence of UKA was stratified by age, gender, census region, Charlson Comorbidity Index, Medicare buy-in status, and diagnosis. The buy-in status is a proxy for the socioeconomic status as it reflects the state subsidizing the health insurance premium for the beneficiary. The Charlson Comorbidity Index is a composite score that has been used to assess the comorbidity level of a patient by taking into account the number and the severity of comorbid conditions.24 For the elderly population, the rate of UKA was subsequently evaluated based on the number of beneficiaries for that particular age-gender group and year in both databases. Poisson regression was used to evaluate the annual rate of change in the UKA rate for assessing temporal changes considering year as a covariate. Age and gender, as well as 2-way interaction terms for age, gender, and year, were also considered as covariates.
Continue to: RESULTS...
RESULTS
For the time periods analyzed, a total of 5235 and 23,310 UKA procedures were identified from the 5% Medicare and MarketScan databases, respectively. A peak in the prevalence appeared around 2008 for the elderly population and in 2009 for the younger population (Figure 1). When normalized by the size of the population segment, the rate of UKA was found to be approximately 5 times greater in the elderly population, increasing from 369 in 2002 to 639 in 2008, but plateauing to 561 in 2011. Extrapolating to the 100% Medicare population, these numbers increased to 7380, 12,780, and 11,220, respectively. Temporal changes in the UKA rate were significant, increasing from 24.5 UKAs per 100,000 persons in 2002 to 43.1 UKAs in 2008, followed by a decline to 36.5 in 2011 (P < .0001) (Figure 2). The rates of UKA generally increased from 2002 to 2008 for both males and females in the Medicare cohort; however, the rates of UKA in female patients continuously declined from 2008 onward, whereas the UKA rates in male patients decreased in 2009, followed by an increase in 2010 and 2011 (Figure 2). For the younger population, there was a slight increase in the rate of UKA from 2004 to approximately 2009, after which the rates for both males and females remained relatively steady. When put in the context of the prevalence of TKA, the prevalence of UKA fluctuated during the same time period. In the Medicare population, the prevalence of UKA ranged from 4.3% (2005) to 5.9% (2008) of the TKA prevalence between 2002 and 2011. In the younger MarketScan population, the prevalence of UKA ranged from 6.7% (2005) to 8.9% (2008) between 2004 and June 2012.
The UKA rate differed significantly according to gender (P = .0209), with higher rates for males. Although there were no age-related differences (P = .3723), age–gender interactions were found to be significant (P < .0001). For males, the largest rate of UKA in the most recent year of data was observed in the 70- to 74-year-old group, followed by the 75- to 79- and the 65- to 69-year-old groups (Figure 3). For females, those in the 65- to 69- and the 70- to 74-year-old groups had the highest rate of UKA. In the younger cohort, there were increases in the UKA rates since 2004. These rates appeared to be relatively stable from the 2008 or 2009 period onward, except for females 55–64 years, which demonstrated a steady decline since 2008. Analysis of data obtained over the past few years showed that males 55–64, 65–69, and 70–74 years were the only age–gender groups whose UKA rates appeared to be trending upward.
The vast majority of elderly UKA patients were white (95.5%), and when stratified by census region, the highest proportion of UKA procedures was observed in the South and the Midwest (Figure 4). Furthermore, among patients <65 years, 64.2% had a Charlson score of 0 compared to 40.8% in the elderly group (Figure 5). For the Medicare population, based on their receipt of state subsidies for their insurance premiums, 5.1% of patients were of lower socioeconomic status. Osteoarthritis was diagnosed in 99.4% and 97.3% of the MarketScan and Medicare cohorts, respectively.
In the Medicare cohort, gender (P = .0209) and year of operation (P < .0001) were found to be significantly associated with the rate of UKA, along with age-gender (P < .0001) and gender-year (P = .0202) interaction terms. In the MarketScan cohort, age (P = .0173), gender (P = .0017), and year of operation (P = .0002) were found to be significantly associated with UKA rate. Two-way interactions between age-gender (P = .0018), age–year (P = .0207), and gender-year (P = .0017) were also found to be statistically significant factors.
Continue to: DISCUSSION...
DISCUSSION
The results of our study indicate that between 2002 and 2011, a steadily increasing number of UKA procedures was performed in the United States, and a significant proportion of the surgeries was performed on patients <65 years. Without the MarketScan database data, we would have missed more than 23,000 UKA cases performed during this 10-year time period. This finding validates our research methodology that incorporated data on privately insured younger (<65 years) patients, which is something that has not been done when examining the epidemiology of UKA.
To our knowledge, there are only 2 other publications attempting to quantify the incidence of UKA procedures performed in the United States. Bolognesi and colleagues23 used the Medicare 5% sample to assess trends in the use of knee arthroplasty from 2000 to 2009. The authors reported that a total of 68,603 patients underwent unilateral total knee arthroplasty (n = 65,505) or unicompartmental knee arthroplasty (n = 3098) over this 10-year time period. Given that there is substantial overlap of our time periods, it is not surprising that our Medicare numbers are similar (3098 vs 5235). In their study, the use of TKA increased 1.7-fold, whereas the use of UKA increased 6.2-fold23. In our analysis of the Medicare (2011 vs 2002) and MarketScan (2011 vs 2004) databases, there was a 1.3-fold and a 3.4-fold increase in the number of TKAs performed. Concomitantly, the use of UKA increased 1.5-fold and 2.8-fold, respectively, in these databases over the same time periods. The reason for the slight discrepancy in the numbers may be attributable to the peak occurring in 2008. The other publication on the subject by Riddle and colleagues8 focused on the time period 1998 to 2005 and used implant manufacturer’s sales data cross-referenced to a database of 44 hospitals to derive their national estimates. Using their unique methodology, the authors calculated an incidence of UKA, ranging from 6570 implants in 1998 to 44,990 in 2005. They reported that UKA use during the study period increased by 3 times the rate of TKA in the United States, with an average yearly percentage increase in the number of UKA procedures of 32.5% compared to 9.4% for TKA procedures. It is difficult to account for the discrepancy in the number of UKAs performed reported between our current study and that of Riddle and colleagues;8 however, the fact that the authors used implant manufacturer’s individual sales numbers may indicate that a portion of UKA patients was not captured in either the Medicare 5% or the MarketScan database. Nonetheless, in our analysis, the annual increase in the number of UKA procedures performed during the time periods studied averaged 5.8% in the older population and 25.4% in the younger population compared to the increase in the number of TKA procedures, which averaged 3.6% and 33.9% in the older and younger populations, respectively. In addition, in our study, the percentage of UKAs performed relative to the number of TKAs during the time intervals studied varied from a low of 4.3% to a high of 5.9% in the older population and from a low of 6.7% to a high of 8.9% in the younger population.
During the 10-year period of this study, a general upward trend appeared in the total number of unicompartmental knee arthroplasties performed in both the Medicare and the MarketScan databases. The rate at which the procedure was performed increased in the Medicare population from 24.5 to 36.5 (per 100,000 persons) over a 10-year time period and in the MarketScan cohort from 5.9 to 7.4 (per 100,000 persons) over an 8.5-year time period. This indicates both a larger absolute and a relative rate increase in UKA procedures in the elderly population. Around 2008 and 2009, the data showed a slight dip in the rate of UKA in the Medicare population and a plateau in the rate in the MarketScan database. Although this may be a spurious finding in the data that would be smoothed out with a longer time period investigated, it is interesting that this finding coincided with a national economic downturn. Although it might be expected that macroeconomics may affect the utilization of elective surgery such as total joint replacement, Kurtz and colleagues25 investigated this particular question and found that neither the economic downturns of 2001 or those of 2008 and 2009 had a significant impact on the incidence of total joint replacement surgeries.
Incorporation of the MarketScan database data indicated that a significant proportion of patients undergoing UKA were <65 years and that there was a slight but increasing rate of procedures performed on this age cohort over the past decade. A similar finding has been reported in the Finnish Arthroplasty Registry. Leskinen and colleagues26 reported that the incidence of UKAs among individuals 30 to 59 years increased from 0.2 (per 100,000 persons) to 10 (per 100,000 persons) from 1980 to 2006 and that most of the increase occurred among patients 50 to 59 years. The fact that younger age is no longer observed as a relative contraindication to this procedure is supported by several clinical investigations. Cartier and colleagues27 reported 93% survival at 10 years in patients with a mean age of 65 years, but included patients as young as 28 years, claiming that the results for younger patients were no worse than those for older patients in the series. Pandit and colleagues17 compared the results of 245 young patients (<60 years) to those of 755 older patients (>60 years) and found a survival rate of 97% at 10 years, with no significant difference in mean functional outcomes, failure rate, or survival between the groups at >5 years of follow-up. Given that patients <65 years now account for approximately half of the TKAs performed each year, with the greatest increase in volume among patients between 45 and 54, it is clear that investigations on the epidemiology of UKA must take into account this increasingly relevant younger patient cohort.28
Continue to: Our data indicate...
Our data indicate that only approximately 5% of UKA patients were non-white and another 5% were from lower socioeconomic status. These findings have been observed in multiple other studies looking at the epidemiology of total joint replacement in the United States.29 Bolognesi and colleagues23 reported that although “non-white race” patients made up 12% of the general Medicare sample they were analyzing, these patients accounted for only 5% and 3% of the total knee arthroplasty and unicompartmental knee arthroplasty populations, respectively. Although it is beyond the scope of this paper to delve into the reasons for this discrepancy, it may be related to differences in access to care, healthcare literacy, and trust of patients in the healthcare system.30,31
Our study, like all those based on administrative claims, has several notable inherent limitations. Coding inaccuracies as well as the potential for systematic bias (eg, underreporting) may affect the accuracy of our results. Although the MarketScan Commercial Research Database (Truven Health Analytics) includes nationally representative information for >180 million patients covered with private insurance, it is possible that we have missed some patients who underwent UKA during the time period investigated. However, we feel that the number missed is probably small and does not affect our conclusions in any meaningful manner.
CONCLUSION
This novel analysis of 2 separate administrative claims databases, which more accurately captures all patients undergoing UKA, indicates that there has been a steady increase in the rate of the procedure over the past decade and that a significant proportion of the surgeries were performed in younger (<65 years) patients. Understanding the accurate trends in the use of UKA on a national scale is important for legislative bodies, healthcare administrators, as well as physicians. Furthermore, given the increasing rates of UKA in patients <65 years old, and the increased burden on implants for withstanding increased activities and repetitive loads, it remains imperative to strive to optimize materials, implant designs, and surgical techniques to enhance implant durability.
- Hopper GP, Leach WJ. Participation in sporting activities following knee replacement: total versus unicompartmental. Knee Surg Sports Traumatol Arthrosc. 2008;16(10):973-979. doi: 10.1007/s00167-008-0596-9.
- Lygre SH, Espehaug B, Havelin LI, Furnes O, Vollset SE. Pain and function in patients after primary unicompartmental and total knee arthroplasty. J Bone Joint Surg, (Am). 2010;92(18):2890-2897. doi: 10.2106/JBJS.I.00917.
- Liddle AD, Pandit H, Judge A, Murray DW. Patient-reported outcomes after total and unicompartmental knee arthroplasty: a study of 14,076 matched patients from the National Joint Registry for England and Wales. Bone Joint J. 2015;97-B(6):793-801. doi: 10.1302/0301-620X.97B6.35155.
- Arno S, Maffei D, Walker PS, Schwarzkopf R, Desai P, Steiner GC. Retrospective analysis of total knee arthroplasty cases for visual, histological, and clinical eligibility of unicompartmental knee arthroplasties. J Arthroplast. 2011;26(8):1396-1403. doi: 10.1016/j.arth.2010.12.023.
- Willis-Owen CA, Brust K, Alsop H, Miraldo M, Cobb JP. Unicondylar knee arthroplasty in the UK National Health Service: an analysis of candidacy, outcome and cost efficacy. Knee. 2009;16(6):473-478. doi: 10.1016/j.knee.2009.04.006.
- Murray DW, Liddle AD, Dodd CA, Pandit H. Unicompartmental knee arthroplasty: is the glass half full or half empty? Bone Joint J. 2015;97-B(10 Suppl. A):3-8. doi: 10.1302/0301-620X.97B10.36542.
- Liddle AD, Judge A, Pandit H, Murray DW. Adverse outcomes after total and unicompartmental knee replacement in 101,330 matched patients: a study of data from the National Joint Registry for England and Wales. Lancet. 2014;384(9952):1437-1445. doi: 10.1016/S0140-6736(14)60419-0.
- Riddle DL, Jiranek WA, McGlynn FJ. Yearly incidence of unicompartmental knee arthroplasty in the United States. J Arthroplast. 2008;23(3):408-412. doi: 10.1016/j.arth.2007.04.012.
- Argenson JN, Blanc G, Aubaniac JM, Parratte S. Modern unicompartmental knee arthroplasty with cement: a concise follow-up, at a mean of twenty years, of a previous report. J Bone Joint Surg, (Am). 2013;95(10):905-909. doi: 10.2106/JBJS.L.00963.
- Koskinen E, Eskelinen A, Paavolainen P, Pulkkinen P, Remes V. Comparison of survival and cost-effectiveness between unicondylar arthroplasty and total knee arthroplasty in patients with primary osteoarthritis: a follow-up study of 50,493 knee replacements from the Finnish Arthroplasty Register. Acta Orthop. 2008;79(4):499-507. doi: 10.1080/17453670710015490.
- Knutson K, Lewold S, Robertsson O, Lidgren L. The Swedish knee arthroplasty register. A nation-wide study of 30,003 knees 1976-1992. Acta Orthop Scand. 1994;65(4):375-386. doi: 10.3109/17453679408995475.
- Kozinn SC, Scott R. Unicondylar knee arthroplasty. J Bone Joint Surg, (Am). 1989;71(1):145-150. doi: 10.2106/00004623-198971010-00023.
- Pennington DW. Unicompartmental knee arthroplasty in patients sixty years of age or younger. J Bone Joint Surg, (Am). 2003;85-A(10):1968-1973. doi: 10.2106/00004623-200310000-00016.
- Biswas D, Van Thiel GS, Wetters NG, Pack BJ, Berger RA, Della Valle CJ. Medial unicompartmental knee arthroplasty in patients less than 55 years old: minimum of two years of follow-up. J Arthroplast. 2014;29(1):101-105. doi: 10.1016/j.arth.2013.04.046.
- Murray DW, Pandit H, Weston-Simons JS, et al. Does body mass index affect the outcome of unicompartmental knee replacement? Knee. 2013;20(6):461-465. doi: 10.1016/j.knee.2012.09.017.
- Kang SN, Smith TO, Sprenger De Rover WB, Walton NP. Pre-operative patellofemoral degenerative changes do not affect the outcome after medial Oxford unicompartmental knee replacement: a report from an independent centre. J Bone Joint Surg Br. 2011;93(4):476-478. doi: 10.1302/0301-620X.93B4.25562.
- Pandit H, Jenkins C, Gill HS, et al. Unnecessary contraindications for mobile-bearing unicompartmental knee replacement. J Bone Joint Surg Br. 2011;93(5):622-628. doi: 10.1302/0301-620X.93B5.26214.
- Kurtz S, Mowat F, Ong K, Chan N, Lau E, Halpern M. Prevalence of primary and revision total hip and knee arthroplasty in the United States from 1990 through 2002. J Bone Joint Surg Am. 2005;87(7):1487-1497. doi: 10.2106/JBJS.D.02441.
- Kurtz SM, Ong KL, Schmier J, et al. Future clinical and economic impact of revision total hip and knee arthroplasty. J Bone Joint Surg, (Am). 2007;89(Suppl. 3):144-151. doi: 10.2106/JBJS.G.00587.
- Day JS, Lau E, Ong KL, Williams GR, Ramsey ML, Kurtz SM. Prevalence and projections of total shoulder and elbow arthroplasty in the United States to 2015. J Shoulder Elbow Surg. 2010;19(8):1115-1120. doi: 10.1016/j.jse.2010.02.009.
- Kurtz S, Ong K, Lau E, Mowat F, Halpern M. Projections of primary and revision hip and knee arthroplasty in the United States from 2005 to 2030. J Bone Joint Surg, (Am). 2007;89(4):780-785. doi: 10.2106/JBJS.F.00222.
- Kamath AF, Ong KL, Lau E, et al. Quantifying the burden of revision total joint arthroplasty for periprosthetic infection. J Arthroplast. 2015;30(9):1492-1497. doi: 10.1016/j.arth.2015.03.035.
- Bolognesi MP, Greiner MA, Attarian DE, et al. Unicompartmental knee arthroplasty and total knee arthroplasty among Medicare beneficiaries, 2000 to 2009. J Bone Joint Surg, (Am). 2013;95(22):e174. doi: 10.2106/JBJS.L.00652.
- Charlson ME, Pompei P, Ales KL, MacKenzie CR. A new method of classifying prognostic comorbidity in longitudinal studies: development and validation. J Chronic Dis. 1987;40(5):373-383. doi: 10.1016/0021-9681(87)90171-8.
- Kurtz SM, Ong KL, Lau E, Bozic KJ. Impact of the economic downturn on total joint replacement demand in the United States: updated projections to 2021. J Bone Joint Surg, (Am). 2014;96(8):624-630. doi: 10.2106/JBJS.M.00285.
- Leskinen J, Eskelinen A, Huhtala H, Paavolainen P, Remes V. The incidence of knee arthroplasty for primary osteoarthritis grows rapidly among baby boomers: a population-based study in Finland. Arthritis Rheum. 2012;64(2):423-428. doi: 10.1002/art.33367.
- Cartier P, Sanouiller JL, Grelsamer RP. Unicompartmental knee arthroplasty surgery. 10-year minimum follow-up period. J Arthroplast. 1996;11(7):782-788. doi: 10.1016/S0883-5403(96)80177-X.
- Kurtz SM, Lau E, Ong K, Zhao K, Kelly M, Bozic KJ. Future young patient demand for primary and revision joint replacement: national projections from 2010 to 2030. Clin Orthop Relat Res. 2009;467(10):2606-2612. doi: 10.1007/s11999-009-0834-6.
- Singh JA, Lu X, Rosenthal GE, Ibrahim S, Cram P. Racial disparities in knee and hip total joint arthroplasty: an 18-year analysis of national Medicare data. Ann Rheum Dis. 2014;73(12):2107-2115. doi: 10.1136/annrheumdis-2013-203494.
- Pierce TP, Elmallah RK, Lavernia CJ, et al. Racial disparities in lower extremity arthroplasty outcomes and use. Orthopedics. 2015;38(12): e1139-e1146. doi: 10.3928/01477447-20151123-05.
- Irgit K, Nelson CL. Defining racial and ethnic disparities in THA and TKA. Clin Orthop Relat Res. 2011;469(7):1817-1823. doi: 10.1007/s11999-011-1885-z.
TAKE-HOME POINTS
- Prior publications on prevalence of unicondylar knee arthroplasty (UKA) in the United States using a single database may have underestimated the “true” number of cases performed.
- For the time periods analyzed, a total of 5,235 and 23,310 UKA procedures were identified from the 5% Medicare and MarketScan databases, respectively.
- Rates of UKA generally increased until 2008, after which there was a decline through 2012.
- Gender and year of operation were found to be significantly associated with UKA rate.
- Males ages 55-64, 65-69, and 70-74 were the only age-gender groups whose UKA rates appear to be trending upward.
CDC: Flu activity ‘high’ in nine states
according to the Centers for Disease Control and Prevention.
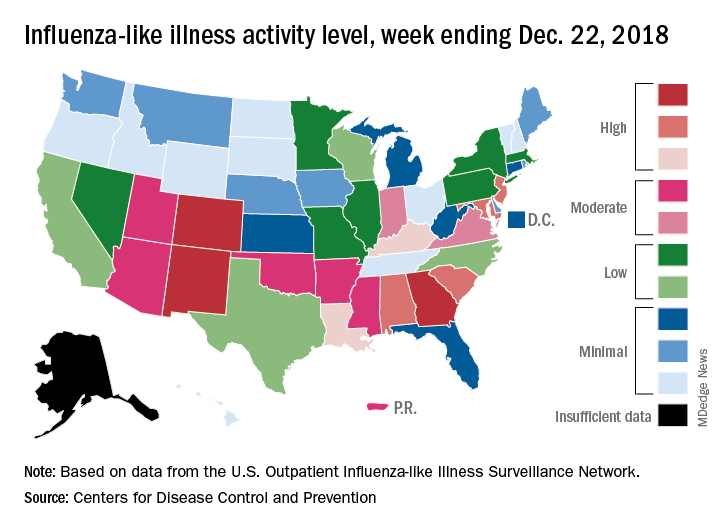
Patients with ILI made up an estimated 3.3% of outpatient visits for the week, which is up from 2.7% the previous week and well above the baseline rate of 2.2%, which the 2018-2019 flu season has now exceeded for the past 3 weeks, the CDC reported Dec. 28. ILI is defined “as fever (temperature of 100°F [37.8°C] or greater) and cough and/or sore throat.”
Three states – Colorado, Georgia, and New Mexico – are now at the highest level of flu activity on the CDC’s 1-10 scale, and nine states are in the “high” range (8-10), compared with two states in high range (both at level 10) for the week ending Dec. 15. Another seven states and Puerto Rico are now in the “moderate” range of 6-7, data from the CDC’s Outpatient ILI Surveillance Network show.
Four flu-related deaths in children were reported during the week ending Dec. 22, two of which occurred in previous weeks, which brings the total to 11 for the 2018-2019 season, the CDC reported.
according to the Centers for Disease Control and Prevention.
Patients with ILI made up an estimated 3.3% of outpatient visits for the week, which is up from 2.7% the previous week and well above the baseline rate of 2.2%, which the 2018-2019 flu season has now exceeded for the past 3 weeks, the CDC reported Dec. 28. ILI is defined “as fever (temperature of 100°F [37.8°C] or greater) and cough and/or sore throat.”
Three states – Colorado, Georgia, and New Mexico – are now at the highest level of flu activity on the CDC’s 1-10 scale, and nine states are in the “high” range (8-10), compared with two states in high range (both at level 10) for the week ending Dec. 15. Another seven states and Puerto Rico are now in the “moderate” range of 6-7, data from the CDC’s Outpatient ILI Surveillance Network show.
Four flu-related deaths in children were reported during the week ending Dec. 22, two of which occurred in previous weeks, which brings the total to 11 for the 2018-2019 season, the CDC reported.
The SVS is working for you on burnout
Following a series of Vascular Specialist pieces highlighting the crisis of surgeon burnout and the unique challenges that face vascular surgeons, the SVS Wellness Task Force was formed in 2017. Recognizing that burnout may compromise recruitment and retention into our specialty, a particular threat at a time when our specialty faces projected increasing physician workforce needs, and that data suggests physician burnout compromises both patient quality of care and overall satisfaction, the task force was charged with proactively addressing vascular surgeon burnout. Our task force, comprising 21 engaged SVS members from across the country, has been working with strong support from leadership and administration to identify potential SVS targets for meaningful change.
The year 2018 was one of information gathering as we attempted clarify the severity of the problem and perceived member needs. We are grateful to our membership that have helped with this effort – for their time, for their insight, and for sharing their stories (some of which have been deeply personal). Two large-scale surveys were circulated to active SVS membership, both created with the assistance of the Mayo Clinic’s Division of Health Policy and Research.
The first survey was designed with a framework of validated wellness tools and well-described risk factors for burnout, then further “personalized” to incorporate unique challenges to the vascular surgeon. About 32% of our membership responded to this survey and alarmingly, when considering nonretired active SVS members, approximately one-third self-described depressive symptoms, 35% met criteria for burnout, and 8% self-reported suicidal thoughts in the last 12 months.
The second survey has only recently closed, focusing on the ergonomic challenges that we face across the spectrum of complex open and endovascular cases. Recognizing existing data that chronic pain and physical disability are associated with burnout, this data will be linked back to the original survey responses for association. Certainly there is more to come.
Concurrent with our survey initiatives, many of you participated in a Wellness Focus Group during VAM 2018. These focus groups intentionally considered the diversity of our membership across age, gender, practice setting, and region, revealing several important themes that threaten our wellness. It was no surprise that the EMR was identified as a clear threat to vascular surgery well-being and that this is not unique to our specialty. Importantly, our membership collectively feels “undervalued” at an institutional level. Specifically given the scope of comprehensive vascular care that we provide patients, a large part of our work includes both unpredictable acute vascular surgical care (such as intraoperative consultations for vascular trauma) and remedial salvage operations to manage vascular complications inflicted during care received from other physicians. This effort leaves us with little control over our time, often without perceived reciprocal clinical support, institutional support, or compensation.
Given this data, the Wellness Task Force is now strategizing efforts for change and supporting ongoing SVS initiatives. Our Task Force is currently:
- Collaborating with key EMR stakeholders with the goal of creating tools that can be shared across the specialty and addressing best practices for system-level support.
- Drafting a “public reply” to the Office of the National Coordinator for Health Information Technology’s “Strategy on Reducing Burden Relating to the Use of Health IT and EHRs” initiative.
- Collaborating with national experts to establish peer support tools and SVS networking opportunities that may help members cope with adverse outcomes and strategize the delivery of complex care.
- Identifying institutional best practices for surgeon wellness for broad dissemination.
- Supporting existing SVS initiatives that include the PAC/APM task force, branding initiatives through the PPO as we work to “own our space” and leverage our specialty and the community practice committee as the Society works proactively to optimize workload, fairness, and reward on a larger scale for membership.
We encourage everyone to stay tuned for periodic Vascular Specialist “Wellness Features” and to attend the Wellness Session at the 2019 VAM for interim progress that will feature the following discussions.
- (Re)Finding a meaningful career in vascular surgery.
- Ergonomic challenges to the vascular surgeon and strategies to mitigate the resulting threat of disability.
- EMR best practices to optimize efficiency.
- The role of peer support in vascular surgery, including the mitigation of second victim syndrome.
Surgeon burnout is a real threat to our workforce and the well-being of our colleagues and friends. Risk factors are multifactorial and will require broad, system-level change. The SVS remains fully committed to enhancing vascular surgeon wellness and this Task Force is grateful for your ongoing engagement and support.
Dr. Coleman is an associate professor of vascular surgery at the University of Michigan, Ann Arbor.
Young women opt for mastectomy even when neoadjuvant chemo works well
SAN ANTONIO – Response to neoadjuvant chemotherapy has little if any influence on the choice of surgery among young women with early-stage breast cancer, suggests a multicenter, prospective cohort study reported at the San Antonio Breast Cancer Symposium.

Randomized, controlled trials have found high levels of mastectomy among patients who are eligible for breast-conserving surgery, according to first author Hee Jeong Kim, MD, PhD, a visiting scholar at the Dana-Farber Cancer Institute, Boston, and an associate professor in the division of breast in the department of surgery at the University of Ulsan, Seoul, South Korea.
“Young women are more likely to present with large tumors and particularly benefit from a neoadjuvant systemic approach,” she noted. “Recent data suggest that response rates, including pathological complete response, are higher in women younger than 40 than in older women, but little is known about how response to neoadjuvant chemotherapy influences surgical decisions in young women.”
The investigators studied 315 women aged 40 years or younger at diagnosis of unilateral stage I-III breast cancer who received neoadjuvant chemotherapy. Results showed that the chemotherapy doubled the proportion who were eligible for breast-conserving surgery, but 41% of all women eligible after neoadjuvant chemotherapy opted to undergo mastectomy, and the value was essentially the same (42%) among the subset who achieved a complete clinical response. The leading reason given in the medical record for this choice was personal preference in the absence of any known high-risk predisposition.
“Surgical decisions among young women with breast cancer appear to be driven by factors beyond the extent of disease and response to neoadjuvant chemotherapy,” she commented. “We should focus our efforts to optimize surgical decisions in these patients.”
The study complements another study undertaken in the same cohort, also reported at the symposium, that assessed longer-term quality of life according to which surgery women chose; this quality-of-life study found poorer measures after mastectomy.
Drivers and explanatory factors
Session moderator Fatima Cardoso, MD, director of the Breast Unit at the Champalimaud Clinical Center in Lisbon, asked, “Do you think this is really the patient preference, or is this more the surgeon’s preference that is passed on to the patient? Because there is now data showing that breast conservation with radiation is better, even in terms of survival, than mastectomy.”
“Patient preference includes a variety of things. Maybe it is a real patient preference [driven by] fear of recurrence or their peace of mind, but another important factor is maybe the doctor, especially the surgeon. That’s why we should be aware of surgical overtreatment, especially in these young early breast cancer patients,” Dr. Kim replied. “But the good news from this study is that neoadjuvant chemotherapy can give options to the patients, they can choose mastectomy. I think that it’s totally different when the patient has no option other than mastectomy versus the patient can choose mastectomy.”
Two main groups of patients in the United States are being given neoadjuvant chemotherapy, noted session attendee Steven E. Vogl, MD, an oncologist at Montefiore Medical Center, New York. One group has large tumors, and the goal is to shrink the tumor; the other group is planning to have unilateral or bilateral mastectomy with some type of reconstruction by a plastic surgeon.
“The medical oncologist, having decided the [latter] patient needs chemotherapy, chooses to give the chemotherapy preoperatively, so it’s not delayed by 3-5 months for the wounds to heal,” he elaborated. “How many of your patients were in the second category?”
The study did not tease out that population, Dr. Kim replied.
Study details
The women studied were participants in the Young Women’s Breast Cancer Study (YWS). Some 67% had a clinical complete response (no palpable tumor in the breast) to their neoadjuvant chemotherapy, and 32% had a pathological complete response (no tumor in the breast, with or without ductal carcinoma in situ [DCIS], and no tumor deposit exceeding 0.2 mm in the lymph nodes).
Before neoadjuvant chemotherapy, 26% of the women overall were eligible for breast-conserving surgery, but after neoadjuvant chemotherapy, 42% were eligible, Dr. Kim reported.
However, in the entire cohort, breast-conserving surgery was the initial surgery in just 25% of women and the final (definitive) surgery in just 23%.
Among patients eligible for breast conservation after neoadjuvant chemotherapy, 41% chose mastectomy instead as their initial surgery. Response to the chemotherapy seemingly did not influence this choice given that 42% of the subset with a clinical complete response still chose mastectomy. Furthermore, among those eligible for breast conservation who underwent mastectomy, 35% had a pathologic complete response to the chemotherapy.
Of all patients eligible for breast-conserving surgery who opted for mastectomy (and usually a bilateral procedure), the most common reason for choosing this more extensive surgery was personal preference, documented in 53% of cases, followed by presence of a BRCA or p53 mutation or a strong family history, documented in 40%. Reasons were similar among the breast conservation–eligible women who had a clinical complete response and/or ultimately a pathological complete response but chose mastectomy.
The study did not analyze disease factors that may have influenced choice of surgery, such as multicentricity or presence of DCIS, acknowledged Dr. Kim, who disclosed that she had no relevant conflicts of interest.
In an exploratory analysis, use of neoadjuvant chemotherapy increased over time among YWS participants, from 23% among those with diagnosis in 2006-2007 to 44% among those with diagnosis in 2014-2015. There were concurrent improvements in the proportions who achieved a clinical complete response (from 64% to 77%) and a pathological complete response (from 23% to 34%). Yet the proportion undergoing breast-conserving surgery as their initial surgery fell slightly, from 21% to 19%, during the same period.
SOURCE: Kim HJ et al. SABCS 2018, Abstract GS6-01,
SAN ANTONIO – Response to neoadjuvant chemotherapy has little if any influence on the choice of surgery among young women with early-stage breast cancer, suggests a multicenter, prospective cohort study reported at the San Antonio Breast Cancer Symposium.
Randomized, controlled trials have found high levels of mastectomy among patients who are eligible for breast-conserving surgery, according to first author Hee Jeong Kim, MD, PhD, a visiting scholar at the Dana-Farber Cancer Institute, Boston, and an associate professor in the division of breast in the department of surgery at the University of Ulsan, Seoul, South Korea.
“Young women are more likely to present with large tumors and particularly benefit from a neoadjuvant systemic approach,” she noted. “Recent data suggest that response rates, including pathological complete response, are higher in women younger than 40 than in older women, but little is known about how response to neoadjuvant chemotherapy influences surgical decisions in young women.”
The investigators studied 315 women aged 40 years or younger at diagnosis of unilateral stage I-III breast cancer who received neoadjuvant chemotherapy. Results showed that the chemotherapy doubled the proportion who were eligible for breast-conserving surgery, but 41% of all women eligible after neoadjuvant chemotherapy opted to undergo mastectomy, and the value was essentially the same (42%) among the subset who achieved a complete clinical response. The leading reason given in the medical record for this choice was personal preference in the absence of any known high-risk predisposition.
“Surgical decisions among young women with breast cancer appear to be driven by factors beyond the extent of disease and response to neoadjuvant chemotherapy,” she commented. “We should focus our efforts to optimize surgical decisions in these patients.”
The study complements another study undertaken in the same cohort, also reported at the symposium, that assessed longer-term quality of life according to which surgery women chose; this quality-of-life study found poorer measures after mastectomy.
Drivers and explanatory factors
Session moderator Fatima Cardoso, MD, director of the Breast Unit at the Champalimaud Clinical Center in Lisbon, asked, “Do you think this is really the patient preference, or is this more the surgeon’s preference that is passed on to the patient? Because there is now data showing that breast conservation with radiation is better, even in terms of survival, than mastectomy.”
“Patient preference includes a variety of things. Maybe it is a real patient preference [driven by] fear of recurrence or their peace of mind, but another important factor is maybe the doctor, especially the surgeon. That’s why we should be aware of surgical overtreatment, especially in these young early breast cancer patients,” Dr. Kim replied. “But the good news from this study is that neoadjuvant chemotherapy can give options to the patients, they can choose mastectomy. I think that it’s totally different when the patient has no option other than mastectomy versus the patient can choose mastectomy.”
Two main groups of patients in the United States are being given neoadjuvant chemotherapy, noted session attendee Steven E. Vogl, MD, an oncologist at Montefiore Medical Center, New York. One group has large tumors, and the goal is to shrink the tumor; the other group is planning to have unilateral or bilateral mastectomy with some type of reconstruction by a plastic surgeon.
“The medical oncologist, having decided the [latter] patient needs chemotherapy, chooses to give the chemotherapy preoperatively, so it’s not delayed by 3-5 months for the wounds to heal,” he elaborated. “How many of your patients were in the second category?”
The study did not tease out that population, Dr. Kim replied.
Study details
The women studied were participants in the Young Women’s Breast Cancer Study (YWS). Some 67% had a clinical complete response (no palpable tumor in the breast) to their neoadjuvant chemotherapy, and 32% had a pathological complete response (no tumor in the breast, with or without ductal carcinoma in situ [DCIS], and no tumor deposit exceeding 0.2 mm in the lymph nodes).
Before neoadjuvant chemotherapy, 26% of the women overall were eligible for breast-conserving surgery, but after neoadjuvant chemotherapy, 42% were eligible, Dr. Kim reported.
However, in the entire cohort, breast-conserving surgery was the initial surgery in just 25% of women and the final (definitive) surgery in just 23%.
Among patients eligible for breast conservation after neoadjuvant chemotherapy, 41% chose mastectomy instead as their initial surgery. Response to the chemotherapy seemingly did not influence this choice given that 42% of the subset with a clinical complete response still chose mastectomy. Furthermore, among those eligible for breast conservation who underwent mastectomy, 35% had a pathologic complete response to the chemotherapy.
Of all patients eligible for breast-conserving surgery who opted for mastectomy (and usually a bilateral procedure), the most common reason for choosing this more extensive surgery was personal preference, documented in 53% of cases, followed by presence of a BRCA or p53 mutation or a strong family history, documented in 40%. Reasons were similar among the breast conservation–eligible women who had a clinical complete response and/or ultimately a pathological complete response but chose mastectomy.
The study did not analyze disease factors that may have influenced choice of surgery, such as multicentricity or presence of DCIS, acknowledged Dr. Kim, who disclosed that she had no relevant conflicts of interest.
In an exploratory analysis, use of neoadjuvant chemotherapy increased over time among YWS participants, from 23% among those with diagnosis in 2006-2007 to 44% among those with diagnosis in 2014-2015. There were concurrent improvements in the proportions who achieved a clinical complete response (from 64% to 77%) and a pathological complete response (from 23% to 34%). Yet the proportion undergoing breast-conserving surgery as their initial surgery fell slightly, from 21% to 19%, during the same period.
SOURCE: Kim HJ et al. SABCS 2018, Abstract GS6-01,
REPORTING FROM SABCS 2018
Key clinical point: Response to neoadjuvant chemotherapy does not alter choice of surgery among young breast cancer patients.
Major finding: Neoadjuvant chemotherapy increased the proportion eligible for breast-conserving surgery from 26% to 42%, but about 40% of those eligible chose mastectomy regardless of chemotherapy response, mainly because of personal preference.
Study details: A multicenter, prospective cohort study of 315 women aged 40 years or younger at diagnosis of early-stage breast cancer who received neoadjuvant chemotherapy (Young Women’s Breast Cancer Study).
Disclosures: Dr. Kim disclosed that she had no relevant conflicts of interest.
Source: Kim HJ et al. SABCS 2018, Abstract GS6-01.
Physician value thyself!
The Merriam-Webster dictionary defines value as “the regard that something is held to deserve; the importance, worth, or usefulness of something” and “relative worth, utility, or importance.” We usually assess our professional worth by how we are treated at work. In social valuing framework, we are given social status based on how others regard us for who we are, what we do, and what we are worth. This is described as “felt worth,” which encapsulates our feelings about how we are regarded by others, in contrast to self-esteem, which is more of an internally held belief.

Our power came from our relationship with our patients and our ability to communicate and influence our patients, peers and administrators. As owners of our practices and small businesses, our currency with hospitals and lawmakers was our ability to bring revenue to hospitals and patient concerns directly to legislators. Practicing in more than one hospital made us more valuable and hospitals battled with each other to provide us and our patients the latest tools and conveniences. In return, we gave our valuable time freely without compensation to hospitals as committee members, task force members, and sounding boards for the betterment of the community. If I were a conspiracy theorist, which I am not, and wanted to devalue physicians I would seek to weaken the physician-patient bond. The way to implement this would be for a single hospital employer to put us on a treadmill chasing work relative value units, give us hard-to-accomplish goals, and keep moving the goalpost. Like I said, I do not believe in conspiracies.
The tsunami of byzantine regulations, Stark laws, and complicated reimbursement formulas has sapped our energy to counter the devaluation. Some are glad to see physicians, particularly surgeons, get their comeuppance because we are perceived as having large egos. This may be true in some instances. Yet, it turns out that the top three job titles with the largest egos are: private household cooks, chief executives, and farm and ranch managers.1
Physicians are also reputed to be possessing dominant leadership styles and seen as bossy and disruptive. Hence, we are made to have frequent training in how to ameliorate our disruptive behavior tendencies. Again, this may be true in a few cases. However, while reports mention how many people witness such unacceptable behavior, there is no valid data about the incidence in practicing physicians. Research also does not support the view that physicians have dominant and aggressive personalities leading to such behavior.
One of the leading interpersonal skills model is Social Styles. We happen to teach this to our faculty at the Ohio State Medical Center’s Faculty Leadership Institute. Turns out that physicians and nurses are almost equally placed into the four quadrants of leadership styles: driving, expressive, amiable, and analytical. I found similar findings in our society members participating in a leadership session I moderated. Indeed, we rank very high on “versatility,” a measure that enables us to adapt our behaviors to fit with our patients and coworkers.
Reported burnout rates of 50% in physicians may or may not be accurate, but burnout is real and so is depression and so are physician suicides. I have witnessed six physician suicides in my career thus far. Teaching resilience, celebrating doctor’s day, and giving out a few awards are all interventions after the fact. Preventive measures like employers and hospitals prioritizing removing daily obstacles eliminating meaningless work, providing more resources to deal with EMRs, and making our lives easier at work, so we can get to our loved ones sooner would help.
Physicians have been largely excluded themselves from participating in the health care debate. We want to see empirical evidence before we sign on to every new proposed care model. Otherwise, we cling on to the status quo and therefore, decision makers tend to leave us out. More important, value-based payment models have not thus far led to reduction in the cost of health care. Despite poor engagement scores at major health systems, physicians are “managed” and sidelined, and mandates are “done to them, not with them.”
In my 40-year career, our devaluation has been a slow and painful process. It started with being called a “provider.” This devalues me. Call me by what I am and do. Physician. Doctor. That is what our patients call us. But, we have been pushed to acquiesce. So, why do physicians undervalue themselves and are unable to be confident of their value to employers and hospital executives?
Some have theorized that physicians have low self-esteem and that denial and rationalization are simply defense mechanisms. The low self-esteem is traced back to medical student days and considered “posttraumatic” disorder. In one study of 189 medical students, 50% reported a decrease in their self-esteem/confidence. The students blamed their residents and attendings for this reaction. Some degree of intimidation may continue into training and employment where it may be part of the culture. We need to change this cycle and treat our students, residents, and mentees with respect as future peers.
Another aspect is related to our own well-being. Most physicians value their patient’s health more than their own. That concept is drilled into us throughout our life. Our spouses complain that we care more about our patients than we do for our families. We often ignore warning signs of serious issues in our own health, always downplaying textbook symptoms of burnout, depression, and even MI. Being too busy is a badge of honor to indicate how successful and wanted we are. This also needs to change.
Sheryl Sandberg in her book “Lean in” discusses the “tiara syndrome,” mainly referring to women. I would suggest that this applies to a lot of physicians, both men and women. Physicians tend to keep their heads down, work hard, and expect someone to come compliment them and place a “tiara” over their head. We may be wary of being called “self-promoters.” Sometimes it is cultural baggage for immigrant physicians who are taught to not brag about their accomplishments. It may behoove us to judiciously make peers and leadership aware of our positive activities in and outside the health system.
Some see physicians not as “pillars of any community,” but as “technicians on an assembly line” or “pawns in a money-making game for hospital administrators.” This degree of pessimism among physicians in surveys is well known but there is good news.
In a 2016 survey based upon responses by 17,236 physicians, 63% were pessimistic or very pessimistic about the medical profession, down from 77% in 2012.2 In another poll, medical doctors were rated as having very high or high ratings of honesty and ethical standards by 65%, higher than all except nurses, military officers, and grade school teachers.3 When the health care debate was at its peak in 2009, a public poll on who they trusted to recommend the right thing for reforming the healthcare system placed physicians at the very top (73%)ahead of health care professors, researchers, hospitals, the President, and politicians. Gallup surveyed 7,000 physicians about engagement in four hierarchical levels: Confidence, Integrity, Pride and Passion. Physicians scored highly on the Pride items in the survey (feel proud to work and being treated with respect).4 In other words, if we are treated well, we feel proud to tell others where we work.
Finally, like many I may consider myself an expert in all sorts of things not relevant to practicing medicine. Yet, I respectfully suggest we stay away from political hot potatoes like nuclear disarmament, gun control, climate change, immigration, and other controversial issues because they distract us from our primary mission. I would hate to see us viewed like Hollywood.
References
1. www.chicagotribune.com/business/ct-payscale-ego-survey-0830-biz-20160829-story.html
2. www.medpagetoday.com/primarycare/generalprimarycare/60446
3. https://nurse.org/articles/gallup-ethical-standards-poll-nurses-rank-highest/
4.https://news.gallup.com/poll/120890/healthcare-americans-trust-physicians-politicians.aspx
Bhagwan Satiani, MD, MBA, is professor of clinical surgery in the division of vascular diseases and surgery at Ohio State University, Columbus. He blogs at www.savvy-medicine.com . Reach him on Twitter @savvycutter.
The Merriam-Webster dictionary defines value as “the regard that something is held to deserve; the importance, worth, or usefulness of something” and “relative worth, utility, or importance.” We usually assess our professional worth by how we are treated at work. In social valuing framework, we are given social status based on how others regard us for who we are, what we do, and what we are worth. This is described as “felt worth,” which encapsulates our feelings about how we are regarded by others, in contrast to self-esteem, which is more of an internally held belief.
Our power came from our relationship with our patients and our ability to communicate and influence our patients, peers and administrators. As owners of our practices and small businesses, our currency with hospitals and lawmakers was our ability to bring revenue to hospitals and patient concerns directly to legislators. Practicing in more than one hospital made us more valuable and hospitals battled with each other to provide us and our patients the latest tools and conveniences. In return, we gave our valuable time freely without compensation to hospitals as committee members, task force members, and sounding boards for the betterment of the community. If I were a conspiracy theorist, which I am not, and wanted to devalue physicians I would seek to weaken the physician-patient bond. The way to implement this would be for a single hospital employer to put us on a treadmill chasing work relative value units, give us hard-to-accomplish goals, and keep moving the goalpost. Like I said, I do not believe in conspiracies.
The tsunami of byzantine regulations, Stark laws, and complicated reimbursement formulas has sapped our energy to counter the devaluation. Some are glad to see physicians, particularly surgeons, get their comeuppance because we are perceived as having large egos. This may be true in some instances. Yet, it turns out that the top three job titles with the largest egos are: private household cooks, chief executives, and farm and ranch managers.1
Physicians are also reputed to be possessing dominant leadership styles and seen as bossy and disruptive. Hence, we are made to have frequent training in how to ameliorate our disruptive behavior tendencies. Again, this may be true in a few cases. However, while reports mention how many people witness such unacceptable behavior, there is no valid data about the incidence in practicing physicians. Research also does not support the view that physicians have dominant and aggressive personalities leading to such behavior.
One of the leading interpersonal skills model is Social Styles. We happen to teach this to our faculty at the Ohio State Medical Center’s Faculty Leadership Institute. Turns out that physicians and nurses are almost equally placed into the four quadrants of leadership styles: driving, expressive, amiable, and analytical. I found similar findings in our society members participating in a leadership session I moderated. Indeed, we rank very high on “versatility,” a measure that enables us to adapt our behaviors to fit with our patients and coworkers.
Reported burnout rates of 50% in physicians may or may not be accurate, but burnout is real and so is depression and so are physician suicides. I have witnessed six physician suicides in my career thus far. Teaching resilience, celebrating doctor’s day, and giving out a few awards are all interventions after the fact. Preventive measures like employers and hospitals prioritizing removing daily obstacles eliminating meaningless work, providing more resources to deal with EMRs, and making our lives easier at work, so we can get to our loved ones sooner would help.
Physicians have been largely excluded themselves from participating in the health care debate. We want to see empirical evidence before we sign on to every new proposed care model. Otherwise, we cling on to the status quo and therefore, decision makers tend to leave us out. More important, value-based payment models have not thus far led to reduction in the cost of health care. Despite poor engagement scores at major health systems, physicians are “managed” and sidelined, and mandates are “done to them, not with them.”
In my 40-year career, our devaluation has been a slow and painful process. It started with being called a “provider.” This devalues me. Call me by what I am and do. Physician. Doctor. That is what our patients call us. But, we have been pushed to acquiesce. So, why do physicians undervalue themselves and are unable to be confident of their value to employers and hospital executives?
Some have theorized that physicians have low self-esteem and that denial and rationalization are simply defense mechanisms. The low self-esteem is traced back to medical student days and considered “posttraumatic” disorder. In one study of 189 medical students, 50% reported a decrease in their self-esteem/confidence. The students blamed their residents and attendings for this reaction. Some degree of intimidation may continue into training and employment where it may be part of the culture. We need to change this cycle and treat our students, residents, and mentees with respect as future peers.
Another aspect is related to our own well-being. Most physicians value their patient’s health more than their own. That concept is drilled into us throughout our life. Our spouses complain that we care more about our patients than we do for our families. We often ignore warning signs of serious issues in our own health, always downplaying textbook symptoms of burnout, depression, and even MI. Being too busy is a badge of honor to indicate how successful and wanted we are. This also needs to change.
Sheryl Sandberg in her book “Lean in” discusses the “tiara syndrome,” mainly referring to women. I would suggest that this applies to a lot of physicians, both men and women. Physicians tend to keep their heads down, work hard, and expect someone to come compliment them and place a “tiara” over their head. We may be wary of being called “self-promoters.” Sometimes it is cultural baggage for immigrant physicians who are taught to not brag about their accomplishments. It may behoove us to judiciously make peers and leadership aware of our positive activities in and outside the health system.
Some see physicians not as “pillars of any community,” but as “technicians on an assembly line” or “pawns in a money-making game for hospital administrators.” This degree of pessimism among physicians in surveys is well known but there is good news.
In a 2016 survey based upon responses by 17,236 physicians, 63% were pessimistic or very pessimistic about the medical profession, down from 77% in 2012.2 In another poll, medical doctors were rated as having very high or high ratings of honesty and ethical standards by 65%, higher than all except nurses, military officers, and grade school teachers.3 When the health care debate was at its peak in 2009, a public poll on who they trusted to recommend the right thing for reforming the healthcare system placed physicians at the very top (73%)ahead of health care professors, researchers, hospitals, the President, and politicians. Gallup surveyed 7,000 physicians about engagement in four hierarchical levels: Confidence, Integrity, Pride and Passion. Physicians scored highly on the Pride items in the survey (feel proud to work and being treated with respect).4 In other words, if we are treated well, we feel proud to tell others where we work.
Finally, like many I may consider myself an expert in all sorts of things not relevant to practicing medicine. Yet, I respectfully suggest we stay away from political hot potatoes like nuclear disarmament, gun control, climate change, immigration, and other controversial issues because they distract us from our primary mission. I would hate to see us viewed like Hollywood.
References
1. www.chicagotribune.com/business/ct-payscale-ego-survey-0830-biz-20160829-story.html
2. www.medpagetoday.com/primarycare/generalprimarycare/60446
3. https://nurse.org/articles/gallup-ethical-standards-poll-nurses-rank-highest/
4.https://news.gallup.com/poll/120890/healthcare-americans-trust-physicians-politicians.aspx
Bhagwan Satiani, MD, MBA, is professor of clinical surgery in the division of vascular diseases and surgery at Ohio State University, Columbus. He blogs at www.savvy-medicine.com . Reach him on Twitter @savvycutter.
January 2019 Question 2
A 54-year-old woman presents for management of moderately severe ileocolonic Crohn’s disease. She has a strong family history of multiple sclerosis and recently noted some tingling in her toes for which she is undergoing neurologic evaluation. She has had two small basal cell carcinomas removed from her cheek in the last year. She received the BCG vaccine as a child and had a positive PPD skin test within the last year. Laboratory evaluation reveals HBsAg negative, anti-HBs positive, and anti-HBc positive; JC virus antibody is positive.
DDSEP quick quiz December question 2
A 54-year-old woman presents for management of moderately severe ileocolonic Crohn’s disease. She has a strong family history of multiple sclerosis and recently noted some tingling in her toes for which she is undergoing neurologic evaluation. She has had two small basal cell carcinomas removed from her cheek in the last year. She received the BCG vaccine as a child and had a positive PPD skin test within the last year. Laboratory evaluation reveals HBsAg negative, anti-HBs positive, and anti-HBc positive; JC virus antibody is positive.
January 2019 Question 1
A 31-year-old man is seen for a 1-week history of epigastric pain and scleral icterus. One month earlier, he developed diarrhea and fatigue, which has continued to persist. He denies any prior medical problems, though he admits he has not seen a doctor in years. He is currently visiting family in the United States, but he resides in South Africa. His laboratory tests are as follows: total bilirubin, 3.5 mg/dL; direct bilirubin, 2.9 mg/dL; alkaline phosphatase, 720 U/L; ALT, 105 U/L; AST, 117 U/L; albumin, 2.1 g/dL; INR, 1.2; HIV viral load 450,000 copies/mL, CD4 count, 25 cells/mm3. An abdominal ultrasound shows intra- and extrahepatic ductal dilation and an ERCP shows strictured intrahepatic ducts with papillary stenosis.