User login
Clear writing, clear thinking and the disappearing art of the problem list
My hospital's electronic medical record helpfully informs me after 1 week on service that there are 524 data available for my attention, a statistic that would be paralyzing without a cognitive framework for organizing and interpreting them in a manner that can be shared among my colleagues. Accurate information flow among clinicians was identified early on as an imperative of hospital medicine. Much attention has been focused on communication during transitions of care, such as that between inpatient and outpatient services and between inpatient teams, taking the form of the discharge summary and the sign‐out, respectively. But communication among physicians, consultants, and allied therapists must and inevitably does occur continuously day by day during even the most uneventful hospital stay. On academic services the need to keep multiple and ever‐rotating team members on the same page, so to speak, is particularly pressing.
The succinct and accurate problem list, formulated at the end of the history and physical examination and propagated through daily progress notes, is a powerful tool for promoting clear diagnostic and therapeutic planning and is ideally suited to meeting the need for continuous information flow among clinicians. Sadly, this inexpensive and potentially elegant device has fallen into disuse and disrepair and is in need of restoration.
In the 1960s, Dr. Lawrence Weed, the inventor of the SOAP note and a pioneer of medical informatics, wrote of the power of the problem list to impose order on the chaos of clinical information and to aid clear diagnostic thinking, in contrast with the simply chronological record popular in earlier years:
It is this multiplicity of problems with which the physician must deal in his daily work.[T]he multiplicity is inevitable but a random approach to the difficulties it creates is not. The instruction of physicians should be based on a system that helps them to define and follow clinical problems one by one and then systematically to relate and resolve them.[T]the basic criterion of the physician is how well he can identify the patient's problems and organize them for solution.1
Weed proposed that the product of our diagnostic thinking and investigations should be a concise list of diagnoses, as precisely as we are able to identify them, or, in their absence, a clear understanding of the specific problems awaiting resolution and a clear appreciation of the interrelationships among these entities:
The list shouldstate the problems at a level of refinement consistent with the physician's understanding, running the gamut from the precise diagnosis to the isolated, unexplained finding. Each item should be classified as one of the following: (1) a diagnosis, e.g., ASHD, followed by the principal manifestation that requires management; (2) a physiological finding, e.g., heart failure, followed by either the phrase etiology unknown or secondary to a diagnosis; (3) a symptom or physical finding, e.g., shortness of breath; or (4) an abnormal laboratory finding, e.g., an abnormal EKG. If a given diagnosis has several major manifestations, each of which requires individual management and separate, carefully delineated progress notes, then the second manifestation is presented as a second problem and designated as secondary to the major diagnosis.1
These principles were widely praised and adopted. An editorial in the New England Journal of Medicine proclaimed that his system is the essence of education itself,3 and it reigned throughout my own formal medical education.
In the decade that has seen our specialty flourish, with the attendant imperatives of clear thinking and communication, in teaching hospitals the problem list seems to have become an endangered species. The general pattern of its decline is that it is often supplanted by a list of organs, or worse, medical subspecialties, each followed by some assessment of its condition, whether diseased or not. The format resembles that used in critical care units for patients with multiple vital functions in jeopardy, on which survival depends from minute to minute, sometimes regardless of the original etiology of their failure. It is not clear how these notes began to spread from the ICU to the medical floor, where puzzles are solved and progress has goals more varied than mere survival. None of the residents I have queried over the years seem to know. The prevalence of this habit is also unknown, but it is widespread at both institutions at which I have been recently affiliated, and from the generation of notes in this format by trainees freshly graduated from medical schools across the land, I infer that it is no mere regional phenomenon. There may be an unspoken assumption that if this format is used for the sickest patients, it must be the superior format to use for all patients. Perhaps it reflects subspecialists teaching inpatient medicine, equipping trainees with vast technical knowledge of specific diseases and placing less emphasis on formulating coherent assessments. I believe its effects are pernicious and far‐reaching, affecting not only the quality of information flow among clinicians, but also the quality and rigor of diagnostic thinking of those in our training programs.
The history and physical examination properly culminate in the formulation of a problem list that establishes the framework for subsequent investigations and therapy. For each problem a narrative thread is initiated that can be followed in progress notes to resolution and succinctly reviewed in the discharge summary. It is now common to see diagnostic formulations arranged not by problem but by organ or subspecialty, for example, Endocrine: DKA. As everyone understands DKA to be an endocrine problem, the organ system preface adds nothing useful and only serves to bury the diagnosis in text. More tortured prose follows attempts to cram into the header all organs or specialties touched by the problem; hence pneumonia is often preceded by pulmonary/ID. A more egregious recent example was an esophageal variceal hemorrhage designated GI/Heme. And efforts to force an undifferentiated problem into an organ group can reach absurdity: Heme: Asymmetric leg swelling raised concern for DVT, but ultrasound was negative.
The organ preface at best merely adds clutter; the difficulty is compounded when the actual diagnosis or problem is omitted entirely in favor of mention of the organs, for example, for pneumonia: Pulm/ID: begin antibiotics. The reader may be left to guess exactly what is being treated, as with CV: begin heparin and beta‐blocker. The assessment and subsequent notes become even more unwieldy when the unifying diagnosis is approached circuitously on paper by way of its component elements, as with a recent patient with typical lobar pneumonia who was assessed by the house officer as having (1) ID: fever probably due to pneumonia; (2) Pulm: Hypoxia, sputum production and infiltrate on CXR consistent with pneumonia; and (3) Heme: leukocytosis likely due to pneumonia as well. Synthesis, the holy grail of the H&P, is thus replaced by analysis. Each tree is closely inspected, but we are lost in the forest. Weed wrote of such notes:
Failure to integrate findings into a valid single entity can almost always be traced to incomplete understanding.If a beginner puts cardiomegaly, edema, hepatomegaly and shortness of breath as four separate problems, it is his way of clearly admitting that he does not recognize cardiac failure when he sees it.2
Often, however, as in the example above, the physician fully understands the unifying diagnosis but nonetheless insists on addressing involved systems separately. Each feature is then apt to be separately followed in isolation through the progress notes, sometimes without any further mention of pneumonia as such. Many progress notes thus omit stating what is actually thought to be wrong with the patient.
The failure to commit to a diagnosis on paper, even when having done so in practice, ultimately can make its way to the discharge summary, propagating confusion to the outpatient department and ricocheting it into future admissions. It also robs us of the satisfaction of declaring a puzzle solved. I was compelled to write this piece in part by the recent case of a young woman who presented with fever and dyspnea. Through an elegant series of imaging studies and serologic tests, a diagnosis of lupus pericarditis was established, and steroid therapy produced dramatic remission of her symptomsa diagnostic triumph by any measure. How disheartening then to read the resident's final diagnosis for posterity in the discharge summary: fever and dyspnea.
The disembodied organ list thus sows confusion and redundant, convoluted prose throughout the medical record. Perhaps even more destructive is its effect on diagnostic thinking when applied to undifferentiated symptoms or problems, the general internist's pice de rsistance. Language shapes thought, and premature assignment of symptoms to a single organ or subspecialty constrains the imagination needed to puzzle things out. Examples are everywhere. Fever of unknown origin may be peremptorily designated ID, by implication excluding inflammatory, neoplastic, and iatrogenic causes from consideration. The asymmetrically swollen legs cited earlier are not hematologic, but they are still swollen. Undiagnosed problems should be labeled as such, with comment as to the differential diagnosis as it stands at the time and the status of the investigation. When a diagnosis is established, it should replace the undifferentiated symptom or abnormal finding in the list, with cardinal manifestations addressed as such when necessary. Thus, for example, fever in an intravenous drug user becomes endocarditis, and anasarca becomes nephrotic syndrome becomes glomerulonephritis as the diagnosis is established and refined. Weed saw the promise of the well‐groomed, problem‐based record in teaching diagnostic thinking:
The education of a physicianshould be based on his clinical experience and should be reflected in the records he maintains on his patients.The educationbecomes defective not when he is given too much or too little training in basic sciencebut rather when he is allowed to ignore or slight the elementary definition and the progressive adjustment of the problems that comprise his clinical experience. The teacher who ultimately benefits students the most is the one who is willing to establish parameters of discipline in the not unsophisticated but often unappreciated task of preventing this imprecision and disorganization.1
Hospitalists as generalist clinician‐educators have an opportunity to teach fundamental principles of medicine that span subspecialties. These principles must include clear organization and prioritization of complex medical information to enable coherent diagnostic and therapeutic planning and smooth continuity of care. The sign‐out and the all‐important discharge summary can be only as clear and as logical as the diagnoses that inform them. To these ends, let us maintain and reinvigorate the art of the problem list. As an exercise at morning report and attending rounds, we should emphasize the development of an accurate, comprehensive list of active problems before moving on to detailed discussion of any single issue, as Weed suggested nearly 40 years ago:
A serious mistake in teaching medicine is to expose the student, the house officer, or the physician to an analytical discussion of the diagnosis and management of one problem before establishing whether or not he is capable of identifying and defining all of the patient's problems at the outset1
We should expect this list to be formulated at the end of the admission history and physical examination. We must ensure that trainees can correctly identify the level of resolution achieved for each item. They must learn to distinguish among undifferentiated symptoms, for example, passed out; undifferentiated problems, expressed by medical terms with precise meaning, such as syncope; and precise etiologic diagnoses, such as ventricular tachycardia. Daily progress notes and sign‐out documents must reflect the progressive refinement in classification of each item and give the current status of the diagnostic evaluation. When therapy has been established, daily notes must reflect its precise status relative to its end points; examples include place in the timeline for antibiotics or, for a bleeding patient, a tally of blood products and their impact. In the end, we must ensure that the discharge summary reflects the highest level of diagnostic resolution achieved for each problem we have identified. In so doing, we will help to ensure coherent and efficient care for our patients, save time and spare confusion for our colleagues, and teach our trainees to think and communicate clearly about our collective efforts.
- .Medical Records, Medical Education and Patient Care.Cleveland, OH:Press of Case Western Reserve University;1971.
- .Medical records that guide and teach (concluded).N Engl J Med.1968;278:593–600.
- .Ten reasons why Lawrence Weed is right.N Engl J Med.1971;284:51–52.
My hospital's electronic medical record helpfully informs me after 1 week on service that there are 524 data available for my attention, a statistic that would be paralyzing without a cognitive framework for organizing and interpreting them in a manner that can be shared among my colleagues. Accurate information flow among clinicians was identified early on as an imperative of hospital medicine. Much attention has been focused on communication during transitions of care, such as that between inpatient and outpatient services and between inpatient teams, taking the form of the discharge summary and the sign‐out, respectively. But communication among physicians, consultants, and allied therapists must and inevitably does occur continuously day by day during even the most uneventful hospital stay. On academic services the need to keep multiple and ever‐rotating team members on the same page, so to speak, is particularly pressing.
The succinct and accurate problem list, formulated at the end of the history and physical examination and propagated through daily progress notes, is a powerful tool for promoting clear diagnostic and therapeutic planning and is ideally suited to meeting the need for continuous information flow among clinicians. Sadly, this inexpensive and potentially elegant device has fallen into disuse and disrepair and is in need of restoration.
In the 1960s, Dr. Lawrence Weed, the inventor of the SOAP note and a pioneer of medical informatics, wrote of the power of the problem list to impose order on the chaos of clinical information and to aid clear diagnostic thinking, in contrast with the simply chronological record popular in earlier years:
It is this multiplicity of problems with which the physician must deal in his daily work.[T]he multiplicity is inevitable but a random approach to the difficulties it creates is not. The instruction of physicians should be based on a system that helps them to define and follow clinical problems one by one and then systematically to relate and resolve them.[T]the basic criterion of the physician is how well he can identify the patient's problems and organize them for solution.1
Weed proposed that the product of our diagnostic thinking and investigations should be a concise list of diagnoses, as precisely as we are able to identify them, or, in their absence, a clear understanding of the specific problems awaiting resolution and a clear appreciation of the interrelationships among these entities:
The list shouldstate the problems at a level of refinement consistent with the physician's understanding, running the gamut from the precise diagnosis to the isolated, unexplained finding. Each item should be classified as one of the following: (1) a diagnosis, e.g., ASHD, followed by the principal manifestation that requires management; (2) a physiological finding, e.g., heart failure, followed by either the phrase etiology unknown or secondary to a diagnosis; (3) a symptom or physical finding, e.g., shortness of breath; or (4) an abnormal laboratory finding, e.g., an abnormal EKG. If a given diagnosis has several major manifestations, each of which requires individual management and separate, carefully delineated progress notes, then the second manifestation is presented as a second problem and designated as secondary to the major diagnosis.1
These principles were widely praised and adopted. An editorial in the New England Journal of Medicine proclaimed that his system is the essence of education itself,3 and it reigned throughout my own formal medical education.
In the decade that has seen our specialty flourish, with the attendant imperatives of clear thinking and communication, in teaching hospitals the problem list seems to have become an endangered species. The general pattern of its decline is that it is often supplanted by a list of organs, or worse, medical subspecialties, each followed by some assessment of its condition, whether diseased or not. The format resembles that used in critical care units for patients with multiple vital functions in jeopardy, on which survival depends from minute to minute, sometimes regardless of the original etiology of their failure. It is not clear how these notes began to spread from the ICU to the medical floor, where puzzles are solved and progress has goals more varied than mere survival. None of the residents I have queried over the years seem to know. The prevalence of this habit is also unknown, but it is widespread at both institutions at which I have been recently affiliated, and from the generation of notes in this format by trainees freshly graduated from medical schools across the land, I infer that it is no mere regional phenomenon. There may be an unspoken assumption that if this format is used for the sickest patients, it must be the superior format to use for all patients. Perhaps it reflects subspecialists teaching inpatient medicine, equipping trainees with vast technical knowledge of specific diseases and placing less emphasis on formulating coherent assessments. I believe its effects are pernicious and far‐reaching, affecting not only the quality of information flow among clinicians, but also the quality and rigor of diagnostic thinking of those in our training programs.
The history and physical examination properly culminate in the formulation of a problem list that establishes the framework for subsequent investigations and therapy. For each problem a narrative thread is initiated that can be followed in progress notes to resolution and succinctly reviewed in the discharge summary. It is now common to see diagnostic formulations arranged not by problem but by organ or subspecialty, for example, Endocrine: DKA. As everyone understands DKA to be an endocrine problem, the organ system preface adds nothing useful and only serves to bury the diagnosis in text. More tortured prose follows attempts to cram into the header all organs or specialties touched by the problem; hence pneumonia is often preceded by pulmonary/ID. A more egregious recent example was an esophageal variceal hemorrhage designated GI/Heme. And efforts to force an undifferentiated problem into an organ group can reach absurdity: Heme: Asymmetric leg swelling raised concern for DVT, but ultrasound was negative.
The organ preface at best merely adds clutter; the difficulty is compounded when the actual diagnosis or problem is omitted entirely in favor of mention of the organs, for example, for pneumonia: Pulm/ID: begin antibiotics. The reader may be left to guess exactly what is being treated, as with CV: begin heparin and beta‐blocker. The assessment and subsequent notes become even more unwieldy when the unifying diagnosis is approached circuitously on paper by way of its component elements, as with a recent patient with typical lobar pneumonia who was assessed by the house officer as having (1) ID: fever probably due to pneumonia; (2) Pulm: Hypoxia, sputum production and infiltrate on CXR consistent with pneumonia; and (3) Heme: leukocytosis likely due to pneumonia as well. Synthesis, the holy grail of the H&P, is thus replaced by analysis. Each tree is closely inspected, but we are lost in the forest. Weed wrote of such notes:
Failure to integrate findings into a valid single entity can almost always be traced to incomplete understanding.If a beginner puts cardiomegaly, edema, hepatomegaly and shortness of breath as four separate problems, it is his way of clearly admitting that he does not recognize cardiac failure when he sees it.2
Often, however, as in the example above, the physician fully understands the unifying diagnosis but nonetheless insists on addressing involved systems separately. Each feature is then apt to be separately followed in isolation through the progress notes, sometimes without any further mention of pneumonia as such. Many progress notes thus omit stating what is actually thought to be wrong with the patient.
The failure to commit to a diagnosis on paper, even when having done so in practice, ultimately can make its way to the discharge summary, propagating confusion to the outpatient department and ricocheting it into future admissions. It also robs us of the satisfaction of declaring a puzzle solved. I was compelled to write this piece in part by the recent case of a young woman who presented with fever and dyspnea. Through an elegant series of imaging studies and serologic tests, a diagnosis of lupus pericarditis was established, and steroid therapy produced dramatic remission of her symptomsa diagnostic triumph by any measure. How disheartening then to read the resident's final diagnosis for posterity in the discharge summary: fever and dyspnea.
The disembodied organ list thus sows confusion and redundant, convoluted prose throughout the medical record. Perhaps even more destructive is its effect on diagnostic thinking when applied to undifferentiated symptoms or problems, the general internist's pice de rsistance. Language shapes thought, and premature assignment of symptoms to a single organ or subspecialty constrains the imagination needed to puzzle things out. Examples are everywhere. Fever of unknown origin may be peremptorily designated ID, by implication excluding inflammatory, neoplastic, and iatrogenic causes from consideration. The asymmetrically swollen legs cited earlier are not hematologic, but they are still swollen. Undiagnosed problems should be labeled as such, with comment as to the differential diagnosis as it stands at the time and the status of the investigation. When a diagnosis is established, it should replace the undifferentiated symptom or abnormal finding in the list, with cardinal manifestations addressed as such when necessary. Thus, for example, fever in an intravenous drug user becomes endocarditis, and anasarca becomes nephrotic syndrome becomes glomerulonephritis as the diagnosis is established and refined. Weed saw the promise of the well‐groomed, problem‐based record in teaching diagnostic thinking:
The education of a physicianshould be based on his clinical experience and should be reflected in the records he maintains on his patients.The educationbecomes defective not when he is given too much or too little training in basic sciencebut rather when he is allowed to ignore or slight the elementary definition and the progressive adjustment of the problems that comprise his clinical experience. The teacher who ultimately benefits students the most is the one who is willing to establish parameters of discipline in the not unsophisticated but often unappreciated task of preventing this imprecision and disorganization.1
Hospitalists as generalist clinician‐educators have an opportunity to teach fundamental principles of medicine that span subspecialties. These principles must include clear organization and prioritization of complex medical information to enable coherent diagnostic and therapeutic planning and smooth continuity of care. The sign‐out and the all‐important discharge summary can be only as clear and as logical as the diagnoses that inform them. To these ends, let us maintain and reinvigorate the art of the problem list. As an exercise at morning report and attending rounds, we should emphasize the development of an accurate, comprehensive list of active problems before moving on to detailed discussion of any single issue, as Weed suggested nearly 40 years ago:
A serious mistake in teaching medicine is to expose the student, the house officer, or the physician to an analytical discussion of the diagnosis and management of one problem before establishing whether or not he is capable of identifying and defining all of the patient's problems at the outset1
We should expect this list to be formulated at the end of the admission history and physical examination. We must ensure that trainees can correctly identify the level of resolution achieved for each item. They must learn to distinguish among undifferentiated symptoms, for example, passed out; undifferentiated problems, expressed by medical terms with precise meaning, such as syncope; and precise etiologic diagnoses, such as ventricular tachycardia. Daily progress notes and sign‐out documents must reflect the progressive refinement in classification of each item and give the current status of the diagnostic evaluation. When therapy has been established, daily notes must reflect its precise status relative to its end points; examples include place in the timeline for antibiotics or, for a bleeding patient, a tally of blood products and their impact. In the end, we must ensure that the discharge summary reflects the highest level of diagnostic resolution achieved for each problem we have identified. In so doing, we will help to ensure coherent and efficient care for our patients, save time and spare confusion for our colleagues, and teach our trainees to think and communicate clearly about our collective efforts.
- .Medical Records, Medical Education and Patient Care.Cleveland, OH:Press of Case Western Reserve University;1971.
- .Medical records that guide and teach (concluded).N Engl J Med.1968;278:593–600.
- .Ten reasons why Lawrence Weed is right.N Engl J Med.1971;284:51–52.
- .Medical Records, Medical Education and Patient Care.Cleveland, OH:Press of Case Western Reserve University;1971.
- .Medical records that guide and teach (concluded).N Engl J Med.1968;278:593–600.
- .Ten reasons why Lawrence Weed is right.N Engl J Med.1971;284:51–52.
Anonymous System to Report Pediatric Medical Errors / Taylor et al.
The problem of medical errors in the United States has been well documented.1 There is evidence that pediatric patients may be at higher risk than are adult patients for certain types of errors.2 Ultimately, the only way to accurately assess whether pediatric patient safety is improved is by developing methodologies that will enable systematic counting of all medical errors. It is only through this technique that the effectiveness of interventions to improve safety can be adequately assessed. However, as a first step, it is crucial that data on at least a representative sample of medical errors occurring during the care of hospitalized children be collected so that the most common types and causes of these errors can be determined.
Many techniques have been used to collect data on medical errors including chart review, administrative data analysis, and malpractice claims analysis.35 Although each of these methodologies has advantages, each also has inherent biases in the types of errors that are detected. Direct observation of medical care is a powerful technique but has a number of limitations including cost.3 Voluntary or semivoluntary reporting systems have the potential to capture complete and representative information on errors, particularly near‐miss events. Voluntary reporting systems have been a highly successful method for understanding safety issues in other industries.6 In medicine, incident reports traditionally have been used as the main system for collecting data on a number of types of adverse events including medical errors.7 However, incident reports have been of limited use in understanding patient safety issues; only a small fraction of the errors made are reported, and certain types of errors are much more likely to be reported than others.4, 810 Medical professionals underreporting their own errors or those of their colleagues in incident reports may reflect fears that discovery of these errors will lead to embarrassment, job sanctions, or malpractice claims.1012
Cognizant of the tendency of professionals to underreport their errors, the aviation industry implemented a confidential reporting system for near‐miss events, the Aviation Safety Reporting System, in 1976.1 With this system, airline pilots file reports of near‐misses to a third party rather than to their employer, and the contents of the reports are kept confidential. Databases of the reports are anonymous. The implementation of the Aviation Safety Reporting System led to a substantial increase in reporting; analysis of the reports of near‐miss events has helped to significantly improve aviation safety in the past quarter century.1, 6 Based on the aviation experience, anonymous medical error reporting systems using either paper or Web‐based data entry have been implemented in adult intensive care units, neonatal intensive care units, and academic medical centers and for reporting specific types of errors.1318 There are limited data on whether these systems improve reporting of medical errors compared with use of the more traditional incident reporting systems already in place in virtually all hospitals.
We developed an online confidential and anonymous system for reporting medical errors in pediatric patients. For a 3‐month period this system replaced incident reports as the method by which medical errors were reported on 2 units in a large urban children's hospital. Data collected via the anonymous reporting system were compared with data in incident reports filed in the same 2 units during analogous 3‐month periods in the preceding 4 years. Prior to the study we postulated that substantially more medical errors would be reported through the anonymous system than through the incident reports and that information would be collected on a wider range of problems. It was hypothesized that reporting of near‐miss events would be particularly increased with the anonymous system.
METHODS
This study was conducted at Children's Hospital and Regional Medical Center (CHRMC), Seattle, Washington. CHRMC is both a community hospital serving pediatric patients and a tertiary‐care regional referral center. Two inpatient units, the infant intensive care unit (IICU) and the medical unit, participated in the project. The IICU provides care to critically ill neonates and infants up to 6 months of age; most patients admitted to the unit are premature newborns or newborns with congenital abnormalities. The medical unit is the major service for inpatient pediatric patients with nonsurgical problems. There 2 units were selected for the study because of a wide range of clinical problems, varying intensities of care and because of the clinical leadership's interest in patient safety issues.
Traditionally, medical errors at CHRMC have been documented through the use of a standard incident report system. However, during the 3‐month study period, from mid‐February through mid‐May 2003, physicians and nurses in the 2 study units were asked to report all medical errors using an electronic, anonymous reporting system that was installed on virtually all the computer workstations in the 2 units. Although all physicians and nurses were asked to use the anonymous system instead of completing incident reports, a physician or nurse who did not wish to participate in the research study could complete a standard incident report form as was consistent with hospital policy. Thus, medical errors were only reported once, either through the anonymous system for study participants or on incident reports for those who did not wish to participate in the project.
Before and during the data collection period, a member of the research team met with physicians on duty in the study units, including residents, fellows, and attending physicians, to explain the study procedures. Clinical nurse specialists in the study units provided the nursing staff with ongoing training based on a curriculum prepared specifically for the project. Topics covered in the training of both nurses and physicians included accessing the system, examples of medical errors, the importance of reporting errors, including near‐misses, and types of feedback provided. The anonymous nature of the reports was stressed, and the review procedures were explained.
During the study, nurses and physicians accessed the report form by clicking on an icon on a workstation desktop. The reporter was asked to provide the date and time when and the unit on which the event occurred. After filling in this information, the 2 dialog boxes on the form had to be completed. On the first, the reporter was asked to describe the event and on the second to report the outcome, if known, of the patient involved. All information on the form was completed using free text; there were no pull‐down menus or radio buttons. This was done to encourage more complete narratives and to be as inclusive as possible when asking nurses and physicians to report. Prior to the study, it was believed that asking potential reporters to classify whether events were errors or to classify them by type or other characterizations might keep nurses and physicians from reporting events that did not fit into a particular category and that a forced entry format would tend to reinforce current biases about errors rather than maximize the amount of new information gathered. Finally, to preserve anonymity, reporters were not asked to give any information about themselves, including profession (nurse or physician). However, they could provide their own names if they wanted feedback on the event, with the obvious loss of anonymity. Once the form was completed, the physician or nurse clicked the submit button to transmit the report to the research team.
A member of the research team reviewed every anonymous report within 48 hours of submission. If the event described was considered a medical error with the potential for serious patient injury, the investigator contacted a member of the clinical leadership of the unit (consisting of a medical director, one or more head nurses, and clinical nurse specialists) about the report. Every month members of the clinical leadership also received batched copies of all reports from their unit. Otherwise, neither the clinical nor the administrative leadership had access to the reports.
Each of the study's 3 pediatrician investigators (J.T., D.B., and E.K.) independently reviewed every report. First, the reviewer determined whether the event described constituted a medical error based on the definition provided by the Institute of Medicine.1 Events were further categorized by severity, occurrence to patient, and type. A medical error was considered serious if it resulted in or had the potential to result in permanent patient injury or death, moderately serious if it resulted in or had the potential to result in temporary physical or emotional injury, or trivial if it was unlikely to result in injury or change in treatment plan. Each error was further classified by whether it actually occurredeither as having actually happened to a patient or as being a near‐miss, an error detected before reaching the patient.
Because there is, to our knowledge, no standardized taxonomy for categorizing types of medical errors that occur in inpatient pediatric patients, a classification system was developed by the University of Washington Developmental Center for Evaluation and Research in Pediatric Patient Safety. (The developmental center and its organizational structure have been previously described).10 A preliminary classification system was patterned after the schema proposed by Leape et al. and adapted for use in pediatrics.19 After reviewing a series of incident reports for another project, the developers of this classification system for types of errors further refined it. The final taxonomy had 8 main types of medical errors, most with subtypes. The schema used for classifying types of errors in this study is shown in Table 1. Although the reviewers found frequent overlap, they determined the primary type of error for events described in each report based on this classification system. Final categorization of the errors, including severity, occurrence to patient, and type, was based on agreement by at least 2 of the 3 reviewers. In instances in which there was not sufficient agreement for categorization, the 3 reviewers reached a consensus after discussion.
| Type of error | Description |
|---|---|
| Communication | Error resulting from misunderstood verbal communication between health care providers or illegible or confusing orders |
| Patient identification | Patient with incorrect or missing identification, wrong patient receiving treatment, mislabeled laboratory slips, mislabeled or incorrect medical record |
| Equipment failure | Nonfunctioning or improperly functioning equipment such as monitors and intravenous pumps |
| Medication | Error in ordering, dispensing, or administering a drug |
| Treatment | Error in administering treatments other than medication such as procedures and intravenous fluids |
| Protocol deviation | Failure to follow established hospital procedures for providing care to patients |
| Medical judgment | Failure of a physician or nurse to properly evaluate or respond to a patient's condition, failure to respond to abnormal tests, provision of care that was clearly inappropriate |
| Other | Types of errors not otherwise listed |
For comparison, an identical review was conducted of incident reports completed in the 2 study units during the same months (mid‐February through mid‐May) in the years 1999‐2002. By including data from several previous years for comparison, the potential problem of selecting a period that was an outlier (in which one or more unusual factors led to increased or decreased reporting) was avoided. We selected the years 1999‐2002 because this was a period of increasing interest in better understanding medical errors at CHRMC. During this period, physicians and staff were encouraged to report medical errors, including near‐miss events, on incident reports. As with the anonymous electronic submissions, each investigator independently reviewed all the selected incident reports, with final classification based on the same schema used for the anonymous reports.
Comparison of the 2 reporting systems was complicated by the hospitalwide quality improvement program to increase the accuracy of labeling laboratory specimens that was ongoing during 1999‐2002. As part of this program, the hospital staff was encouraged to use the incident report system to document unlabeled or mismatched laboratory specimens and patients without proper identification from whom a laboratory specimen was to be obtained (eg, missing a hospital identification bracelet). Laboratory personnel completed most of these incident reports. In a previous review of incident report data from CHRMC, we found that 35% of medical errors reported were related to improper labeling of laboratory specimens (unpublished data). Although reporting these events may have been helpful for monitoring progress in quality improvement, many of the events described were extremely trivial in nature. Inclusion of this one specific type of event so skewed the overall number of medical errors reported that meaningful analysis of the types, relative frequencies, and reporting of errors was difficult. Based on this experience, we considered excluding this type of event from the analysis in the current study if it constituted a significant proportion of the medical errors conveyed in incident reports. Descriptions of mislabeled lab specimens or patients without identification bracelets constituted 33.8% of all incident reports from the 2 study units; no such events were described in submissions through the anonymous reporting system.
To compare the electronic anonymous and incident‐report error reporting systems, first the number of errors reported with each system was divided by the total number of patient‐days during which data were collected in the 2 units. Rates are expressed as the number of errors per 100 patient‐days. Rate ratios (RRs) with 95% confidence intervals (95% CIs) were calculated to compare the error reporting rates of the 2 reporting systems. Poisson regression was used to assess significance; a rate ratio whose 95% CI did not include 1.0 was considered statistically significant. Initial comparisons included all reports made through both systems. For subsequent comparisons, reports pertaining to mislabeled lab specimens were excluded. Error reporting rates were compared between the 2 reporting systems overall and by unit (medical unit and IICU), type, severity, and near‐miss status. In addition, to evaluate the possibility that secular trends in reporting medical errors were responsible for any observed overall differences, error reporting rates determined with the anonymous system were compared separately with incident report error rates in 1999, 2000, 2001, and 2002. Differences in the relative frequency of reporting different types of errors with the 2 systems were assessed with chi‐square tests. Kappa statistics were computed to assess the interobserver reliability of the 3 reviewers in classifying the events in the incident and anonymous reports as medical errors.
The study was approved by the Institutional Review Board of Children's Hospital and Regional Medical Center.
RESULTS
During the 3‐month study period, 146 reports were completed using the anonymous reporting system, 131 of which were classified as medical errors (89.7%). Ninety‐five errors were reported from the medical unit, and 36 were reported from the IICU. The kappa statistic for interobserver agreement in categorizing the anonymous reports as medical errors was .526. There were a total of 5420 patient‐days in the 2 units (medical service and IICU); thus, the rate of reporting medical errors via the anonymous system was 2.41/100 patient‐days (95% CI 2.02, 2.86). As shown in Table 2, the rate of errors reported in the IICU was higher than that in the medical unit. In addition to the errors reported via the anonymous system during the study period, 25 errors were reported using incident reports. Thus, the rate of reporting errors using both systems was 2.87.
| Reporting system | Medical unit* | IICU | Total | RR (95% CI) |
|---|---|---|---|---|
| ||||
| Anonymous reporting | 2.26 (1.83, 2.75) | 2.97 (2.09, 4.09) | 2.41 (2.02, 2.86) | |
| Incident reports | ||||
| All years | 1.35 (1.12, 1.53) | 2.23 (1.85, 2.66) | 1.56 (1.40, 1.73) | 1.54 (1.26, 1.90) |
| 1999 | 1.16 (0.86, 1.52) | 2.21 (1.50, 3.15) | 1.41 (1.12, 1.75) | 1.72 (1.29, 2.29) |
| 2000 | 1.55 (1.20, 1.97) | 2.90 (2.09, 3.91) | 1.92 (1.57, 2.31) | 1.26 (.97, 1.67) |
| 2001 | 1.26 (0.94, 1.65) | 2.63 (1.81, 3.70) | 1.52 (1.21, 1.87) | 1.59 (1.20, 2.12) |
| 2002 | 1.41 (1.08, 1.82) | 1.34 (1.10, 1.74) | 1.40 (1.10, 1.74) | 1.73 (1.30, 2.32) |
A total of 633 incident reports were completed in the 2 study units during the analogous 3‐month periods in 1999‐2002, 538 of which were categorized as medical errors (85.0%). When all reports were considered, the rate of medical errors reported via the incident report system was 2.40/100 patient‐days (95% CI 2.21, 2.61). However, 17.3% of all errors reported in 1999, 37.2% of those reported in 2000, 40.2% of those in 2001, and 39.8% of those in 2002 pertained to mislabeled laboratory specimens. After excluding these reports, the overall rate of medical error reporting during 1999‐2002, calculated using incident report data, was 1.56/100‐patient days (95% CI 1.40, 1.73). The kappa statistic for interobserver agreement in classifying incident reports as medical errors was .615. Rates of error reporting in the medical unit and IICU are shown in Table 2.
After excluding reports dealing with mislabeled laboratory specimens, the error reporting rate was significantly higher using the anonymous system than using incident reports (RR 1.54, 95% CI 1.26, 1.90). The rate of reporting errors with the anonymous system was higher than those for reporting via incident reports in 1999, 2001, and 2002; there was no significant difference in reporting rates when the data collected with the anonymous system were compared with the data on errors reported via incident reports in 2000 (RR 1.26, 95% CI 0.97, 1.67; Table 2).
Much of the increased rate of reporting via the anonymous system came from the medical unit. The medical unit had an overall RR for anonymous reporting compared with incidence report submission of 1.77 (95% CI 1.31, 2.14); the rate of reporting via the anonymous system was significantly higher than via incident reports for each of the years 1999‐2002. Conversely, the rate of reporting observed in the IICU was not significantly increased (RR 1.33, 95% CI 0.89, 1.95, P = .07).
The types of errors reported with the 2 systems are summarized in Table 3. Although the overall distribution was only marginally different between the 2 systems (P = .054), a higher proportion of the errors reported via the anonymous system were medication errors (P = .019), whereas a higher percentage of errors reported with incident reports dealt with equipment failures (P = .033). The rate of reporting medication errors with the anonymous system (1.57 reports/100 patient‐days) was significantly higher than that via incident reports (0.83 reports/100 patient days, RR 1.90, 95% CI 1.44, 2.47). When compared with the individual years for which incident report data were available, the reporting rate for medication errors was significantly higher via the anonymous system than with incident reports for each of the years 1999‐2002.
| Type of medical error | Anonymous system n (%) | Incident reports 1999‐2002 n (%)* |
|---|---|---|
| ||
| Communication | 12 (9.2) | 43 (12.4) |
| Patient identification | 2 (1.5) | 18 (5.2) |
| Equipment failure | 3 (2.3) | 26 (7.5) |
| Medication | 85 (64.9) | 185 (53.2) |
| Treatment | 11 (8.4) | 36 (10.3) |
| Protocol violation | 15 (11.5) | 37 (10.6) |
| Medical judgment | 3 (2.3) | 3 (0.9) |
The severity of medical errors reported with the 2 systems is shown in Table 4. As can be seen, errors reported via the anonymous system and in incident reports had a similar distribution of severity, with almost 80% of medical errors classified as moderately serious. The rate of reporting serious medical errors was 0.37/100 patient‐days with the anonymous system and 0.23/100 patient‐days via incident reports (RR 1.61, 95% CI 0.91, 2.76).
| Severity of reported errors | Anonymous system n (%) | Incident reports 1999‐2001 n (%)* |
|---|---|---|
| ||
| Trivial | 10 (7.6) | 23 (6.6) |
| Moderately serious | 101 (77.1) | 272 (78.6) |
| Serious | 20 (15.3) | 51 (14.7) |
With the anonymous system, 25.2% of reported medical errors were near‐misses compared with 12.6% of the errors reported with the incident report system (P = .001). The rate of reporting near‐miss medical errors was 3‐fold higher with the anonymous system relative to reporting via incident reports (RR 3.10, 95% CI 1.91, 4.98) and was significantly higher than in each of the years data on incident reports were collected and in each of the 2 units. The reporting of errors that reached the patient was also significantly more frequent with the anonymous system than via incident reports; however, this increase was less pronounced (RR 1.32, 95% CI 1.05, 1.67). Among the 33 near‐miss events reported via the anonymous system were 10 medical errors categorized as serious. Six of these were related to medications, including two 10‐fold overdoses of morphine. Overall, the rate of reporting near‐miss medication errors was significantly higher with the anonymous system than with incident reports (RR 3.10, 95% CI 1.81, 5.24).
DISCUSSION
The results of this study suggest that implementation of an anonymous system was associated with a modest increase in the reporting of medical errors during the care of hospitalized children compared with reporting via a traditional incident report system. After excluding reports of mislabeled laboratory specimens, reported as part of a specific quality improvement project, the rate of errors reported with the anonymous system was approximately 54% higher than that using incident reports. The most striking upsurge in reporting observed with the anonymous system was the 3‐fold increase in reporting of near‐miss medical errors.
Because of different types of patients, lack of denominator data, different durations of observation, and, presumably, different inherent rates of errors, it is difficult to compare different anonymous reporting systems for medical errors. In one of the few studies dealing with pediatric patients, Suresh et al, evaluated a Web‐based anonymous reporting system in 54 neonatal intensive care units (NICUs).16 Over a 27‐month period, 1230 reports were completed via the system, for an average of slightly less than 1 report per NICU per month. This is substantially lower than the 12 errors per month reported from the IICU in our study using the anonymous system. In a study of a Web‐based anonymous system used by 18 ICUs in 11 hospitals, 854 reports were filed during a 12‐month period. The average rate of reporting ranged from 4.3 to 7.5 reports per ICU per month, with an overall mean of 6.5 reports per hospital per month.1415 However, unlike in our study, in which the anonymous system temporarily supplanted incident reports, only 2 of the 11 hospitals discontinued incident reporting.14 A national Web‐based system has been established for reporting medication errors. During a 2‐year period beginning in 1999, 154,816 medication errors were reported from 403 hospitals, for an average of 16 reports per hospital per month.18 This is less than the 28 medication errors reported per month with our anonymous system.
Anonymous systems based at a single institution have been associated with higher rates of reporting. In one study, approximately 68 events were reported per month during the first 16 weeks after full implementation of a hospitalwide anonymous system, compared with the average of 44 errors reported monthly in our project.17 In the study perhaps most comparable to ours, Osmon et al. reported on the use of an anonymously completed paper form used to report medical errors in an adult ICU.13 Patient safety advocates extensively described and promoted the reporting system prior to its use and while it was implemented. During the 6‐month study period, 8.93 medical events/100 patient‐days were reported with the system. This rate of reporting was 10‐fold higher than that reported via the standard reporting system used at that hospital.
In addition to rate of reporting medical errors, our study was designed to compare some aspects of the content of anonymous and incident reports. No statistically significant difference was found in the severity of the events reported; the rate of reporting serious medical errors was comparable between the 2 systems. This might suggest serious errors are the most likely to be reported regardless of the system used. However, given the modest number of serious events reported with either the anonymous or the incident report system (20 and 51, respectively), the power to detect a significant difference in rates was limited. Conversely, implementation of the anonymous system was associated with increased reporting of near‐miss events of all types and was a particularly useful mechanism for reporting near‐miss medication errors. Because near‐miss events may not be detected by other methods for identifying medication errors such as chart review or search for specific triggers, the use of an anonymous system may be an important tool in a multifaceted effort to improve medication safety. Perhaps the best use of an online anonymous system would be to provide a mechanism for rapid reporting of near‐miss errors, whereas other systems, such as incident reports, could be used to report errors that reach the patient.
We were surprised that although the reporting of medical errors was increased on the medical unit with the implementation of the anonymous system, there was no significant change in overall reporting in the IICU. This was possibly because reporting via incident reports was already more complete in the IICU, so that a small increase with the anonymous system was less likely to be detected However, it is equally plausible that because of the severity of illness of the patients in the IICU, physicians and staff in this unit had a perception that they did not have enough free time to report all errors. Finally, it is possible that the staff and/or clinical leadership in the medical unit was more enthusiastic about the anonymous system. Regardless, this result suggests that despite training on reporting, provision of an easy‐to‐use system, and the guarantee of anonymity, significant barriers to reporting medical errors remain.
The Kappa statistic of .526 for level of agreement between reviewers in categorizing events described with the anonymous system as medical errors indicates only a good level of agreement.20 This lack of agreement may be in part a result of the limited amount of information provided in some of the narrative reports of events. Because anonymous reports did not include names of patients or providers, it was impossible to review medical records or other information to gain additional information about the events described. However, as pointed out by others, determination of when a medical error has occurred, although seemingly simple, is frequently much less clear when reviewing actual events.21
The findings in our study should be interpreted cautiously. Because of the need for a unified system to record events across the entire hospital, anonymous reports supplanted incident reports in the 2 study units for only a 3‐month period; it is impossible to predict the long‐term trends in reporting with this system. We selected the winterspring period for the study because it is a busy time of year for children's hospitals. Rates of reporting and medical errors may change dramatically during other times of the year, particularly in a teaching hospital. An underlying assumption of our comparisons between the 2 reporting systems was that the actual rate of medical errors was unchanged throughout the period and that the differences observed were a result of more complete reporting with the anonymous system. The increased rate of reporting of medical errors found with the anonymous reporting system might have been influenced by the training given the medical personnel. It is also possible that the increased reporting rates with the anonymous system occurred because of increased publicity, both in the press and in the hospital, about medical errors and patient safety, in general. However, because there was no definite secular trend in reporting observed during the years 1999‐2002, it is unlikely that this explains our findings. Finally, it is impossible to measure the relative impact of the increased ease of reporting with the online system versus the anonymity provided.
Although the anonymous system was associated with a 54% increase in rate of reporting, it is clear that the vast majority of medical errors were not reported. If the estimates that incident reports capture 1%‐10% of errors are accurate,8, 9 the increase in reporting that we observed with the anonymous system would indicate that 1.5%15% of errors were reported. The impressive 10‐fold increase in reporting observed by Osmon et al. in their study of an anonymous system was partly a result of the very low rate of reporting with their traditional system (approximately .67 reports of medical errors/100 adult ICU patient‐days).13 A common feature of studies of anonymous systems with higher rates of reporting medical errors is the continuing presence of on‐site patient safety investigators and advocates.13, 17 Rather than the particulars of the reporting system used, this on‐site presence and advocacy may be the most important element in increasing voluntary reporting of medical errors. In our study it is likely that some of the increase in reporting observed with the anonymous system was related to publicity about the system and ongoing promotion of the importance of reporting errors by the research team.
Since completion of the study, CHRMC has been using incident reports as the main tool for collecting data on medical errors in all units. However, based on our experiences, a new reporting tool, called e‐feedback, has been instituted. The goal of this system is to allow physicians and staff members to quickly report events that may be indicative of systems problems in the delivery of care. The reports are reviewed by designated multidisciplinary teams in various units throughout the hospital so that changes can be implemented, if needed.
CONCLUSIONS
Although there was a modest increase in the number of reports, the results of this study indicate that the implementation of an anonymous online reporting system (with training on the use of the system) was not a panacea for the problem of underreporting of medical error. Use of a system such as we have described may be an effective tool for increasing the reporting of near‐miss events., However, our results suggest that methodologies in addition to voluntary or semivoluntary reporting systems are needed to more fully collect information on medical errors.
- Kohn LT,Donaldson MS, eds.To Err is Human: Building a Safer Health System.Washington, DC:National Academy Press;2000.
- American Academy of Pediatrics,Committee on Drugs and Committee on Hospital Care.Prevention of medication errors in the pediatric inpatient setting.Pediatrics.2003;112:431–436.
- ,.Measuring errors and adverse events in health care.J Gen Intern Med.2003;18:61–67.
- ,,,.Detecting adverse events for patient safety research: a review of current methodologies.J Biomed Inform.2003;36:131–143.
- ,,,.Retrospective data collection and analytical techniques for patient safety studies.J Biomed Inform.2003;36:106–119.
- ,.Reporting and preventing medical mishaps: lessons from non‐medical near miss reporting systems.BMJ.2000;320:759–763.
- .Systems for risk identification. In:Carroll R, ed.Risk Management Handbook for Health Care Organizations.3rd ed.San Francisco, CA:Josey‐Bass Inc.;2001:171–189.
- ,,,,,.The incident reporting system does not detect adverse drug event: a problem for quality improvement.Jt Comm J Qual Improv.1995;21:541–548.
- ,,,,.Comparison of methods for detecting medication errors in 36 hospitals and skilled‐nursing facilities.Am J Health Syst Pharm.2002;59:436–446.
- ,,, et al.Use of incident reports by physicians and nurses to document medical errors in pediatric patients.Pediatrics.2004;114:729–735.
- ,,,.Perceived barriers in reporting medication administration errors.Best Pract Benchmarking Healthc.1996;1:191–197.
- ,,.Reasons for not reporting adverse events: an empirical study.J Eval Clin Pract.1999;5:13–21.
- ,,,,,.Reporting of medical errors: an intensive care unit experience.Crit Care Med.2004;32:727–733.
- ,, et al.Creating the web‐based intensive care unit safety reporting system.J A med Inform Assoc.2005;12:130–139.
- ,,, et al.Development of the ICU safety reporting system.J Patient Saf.2005;1:23–32.
- ,,, et al.Voluntary anonymous reporting of medical errors for neonatal intensive care.Pediatrics.2004;113:1609–1618.
- ,,,.Development of a web‐based event reporting system in an academic environment.J Am Med Inform Assoc.2004;11:11–18.
- ,,,.Medication errors: experience of the United States Pharmacopeia (USP) MEDMARX reporting system.J Clin Pharmacol.2003;43:760–767.
- ,,, et al.Preventing medical injury.Qual Rev Bull.1993;19:144–149.
- .Hypothesis testing: categorical data. In:Fundamentals of Biostatistics.4th ed.Belmont, CA:Wadsworth Publishing Company;1995:345–443.
- ,.What is an error?Eff Clin Pract.2000;6:261–269.
The problem of medical errors in the United States has been well documented.1 There is evidence that pediatric patients may be at higher risk than are adult patients for certain types of errors.2 Ultimately, the only way to accurately assess whether pediatric patient safety is improved is by developing methodologies that will enable systematic counting of all medical errors. It is only through this technique that the effectiveness of interventions to improve safety can be adequately assessed. However, as a first step, it is crucial that data on at least a representative sample of medical errors occurring during the care of hospitalized children be collected so that the most common types and causes of these errors can be determined.
Many techniques have been used to collect data on medical errors including chart review, administrative data analysis, and malpractice claims analysis.35 Although each of these methodologies has advantages, each also has inherent biases in the types of errors that are detected. Direct observation of medical care is a powerful technique but has a number of limitations including cost.3 Voluntary or semivoluntary reporting systems have the potential to capture complete and representative information on errors, particularly near‐miss events. Voluntary reporting systems have been a highly successful method for understanding safety issues in other industries.6 In medicine, incident reports traditionally have been used as the main system for collecting data on a number of types of adverse events including medical errors.7 However, incident reports have been of limited use in understanding patient safety issues; only a small fraction of the errors made are reported, and certain types of errors are much more likely to be reported than others.4, 810 Medical professionals underreporting their own errors or those of their colleagues in incident reports may reflect fears that discovery of these errors will lead to embarrassment, job sanctions, or malpractice claims.1012
Cognizant of the tendency of professionals to underreport their errors, the aviation industry implemented a confidential reporting system for near‐miss events, the Aviation Safety Reporting System, in 1976.1 With this system, airline pilots file reports of near‐misses to a third party rather than to their employer, and the contents of the reports are kept confidential. Databases of the reports are anonymous. The implementation of the Aviation Safety Reporting System led to a substantial increase in reporting; analysis of the reports of near‐miss events has helped to significantly improve aviation safety in the past quarter century.1, 6 Based on the aviation experience, anonymous medical error reporting systems using either paper or Web‐based data entry have been implemented in adult intensive care units, neonatal intensive care units, and academic medical centers and for reporting specific types of errors.1318 There are limited data on whether these systems improve reporting of medical errors compared with use of the more traditional incident reporting systems already in place in virtually all hospitals.
We developed an online confidential and anonymous system for reporting medical errors in pediatric patients. For a 3‐month period this system replaced incident reports as the method by which medical errors were reported on 2 units in a large urban children's hospital. Data collected via the anonymous reporting system were compared with data in incident reports filed in the same 2 units during analogous 3‐month periods in the preceding 4 years. Prior to the study we postulated that substantially more medical errors would be reported through the anonymous system than through the incident reports and that information would be collected on a wider range of problems. It was hypothesized that reporting of near‐miss events would be particularly increased with the anonymous system.
METHODS
This study was conducted at Children's Hospital and Regional Medical Center (CHRMC), Seattle, Washington. CHRMC is both a community hospital serving pediatric patients and a tertiary‐care regional referral center. Two inpatient units, the infant intensive care unit (IICU) and the medical unit, participated in the project. The IICU provides care to critically ill neonates and infants up to 6 months of age; most patients admitted to the unit are premature newborns or newborns with congenital abnormalities. The medical unit is the major service for inpatient pediatric patients with nonsurgical problems. There 2 units were selected for the study because of a wide range of clinical problems, varying intensities of care and because of the clinical leadership's interest in patient safety issues.
Traditionally, medical errors at CHRMC have been documented through the use of a standard incident report system. However, during the 3‐month study period, from mid‐February through mid‐May 2003, physicians and nurses in the 2 study units were asked to report all medical errors using an electronic, anonymous reporting system that was installed on virtually all the computer workstations in the 2 units. Although all physicians and nurses were asked to use the anonymous system instead of completing incident reports, a physician or nurse who did not wish to participate in the research study could complete a standard incident report form as was consistent with hospital policy. Thus, medical errors were only reported once, either through the anonymous system for study participants or on incident reports for those who did not wish to participate in the project.
Before and during the data collection period, a member of the research team met with physicians on duty in the study units, including residents, fellows, and attending physicians, to explain the study procedures. Clinical nurse specialists in the study units provided the nursing staff with ongoing training based on a curriculum prepared specifically for the project. Topics covered in the training of both nurses and physicians included accessing the system, examples of medical errors, the importance of reporting errors, including near‐misses, and types of feedback provided. The anonymous nature of the reports was stressed, and the review procedures were explained.
During the study, nurses and physicians accessed the report form by clicking on an icon on a workstation desktop. The reporter was asked to provide the date and time when and the unit on which the event occurred. After filling in this information, the 2 dialog boxes on the form had to be completed. On the first, the reporter was asked to describe the event and on the second to report the outcome, if known, of the patient involved. All information on the form was completed using free text; there were no pull‐down menus or radio buttons. This was done to encourage more complete narratives and to be as inclusive as possible when asking nurses and physicians to report. Prior to the study, it was believed that asking potential reporters to classify whether events were errors or to classify them by type or other characterizations might keep nurses and physicians from reporting events that did not fit into a particular category and that a forced entry format would tend to reinforce current biases about errors rather than maximize the amount of new information gathered. Finally, to preserve anonymity, reporters were not asked to give any information about themselves, including profession (nurse or physician). However, they could provide their own names if they wanted feedback on the event, with the obvious loss of anonymity. Once the form was completed, the physician or nurse clicked the submit button to transmit the report to the research team.
A member of the research team reviewed every anonymous report within 48 hours of submission. If the event described was considered a medical error with the potential for serious patient injury, the investigator contacted a member of the clinical leadership of the unit (consisting of a medical director, one or more head nurses, and clinical nurse specialists) about the report. Every month members of the clinical leadership also received batched copies of all reports from their unit. Otherwise, neither the clinical nor the administrative leadership had access to the reports.
Each of the study's 3 pediatrician investigators (J.T., D.B., and E.K.) independently reviewed every report. First, the reviewer determined whether the event described constituted a medical error based on the definition provided by the Institute of Medicine.1 Events were further categorized by severity, occurrence to patient, and type. A medical error was considered serious if it resulted in or had the potential to result in permanent patient injury or death, moderately serious if it resulted in or had the potential to result in temporary physical or emotional injury, or trivial if it was unlikely to result in injury or change in treatment plan. Each error was further classified by whether it actually occurredeither as having actually happened to a patient or as being a near‐miss, an error detected before reaching the patient.
Because there is, to our knowledge, no standardized taxonomy for categorizing types of medical errors that occur in inpatient pediatric patients, a classification system was developed by the University of Washington Developmental Center for Evaluation and Research in Pediatric Patient Safety. (The developmental center and its organizational structure have been previously described).10 A preliminary classification system was patterned after the schema proposed by Leape et al. and adapted for use in pediatrics.19 After reviewing a series of incident reports for another project, the developers of this classification system for types of errors further refined it. The final taxonomy had 8 main types of medical errors, most with subtypes. The schema used for classifying types of errors in this study is shown in Table 1. Although the reviewers found frequent overlap, they determined the primary type of error for events described in each report based on this classification system. Final categorization of the errors, including severity, occurrence to patient, and type, was based on agreement by at least 2 of the 3 reviewers. In instances in which there was not sufficient agreement for categorization, the 3 reviewers reached a consensus after discussion.
| Type of error | Description |
|---|---|
| Communication | Error resulting from misunderstood verbal communication between health care providers or illegible or confusing orders |
| Patient identification | Patient with incorrect or missing identification, wrong patient receiving treatment, mislabeled laboratory slips, mislabeled or incorrect medical record |
| Equipment failure | Nonfunctioning or improperly functioning equipment such as monitors and intravenous pumps |
| Medication | Error in ordering, dispensing, or administering a drug |
| Treatment | Error in administering treatments other than medication such as procedures and intravenous fluids |
| Protocol deviation | Failure to follow established hospital procedures for providing care to patients |
| Medical judgment | Failure of a physician or nurse to properly evaluate or respond to a patient's condition, failure to respond to abnormal tests, provision of care that was clearly inappropriate |
| Other | Types of errors not otherwise listed |
For comparison, an identical review was conducted of incident reports completed in the 2 study units during the same months (mid‐February through mid‐May) in the years 1999‐2002. By including data from several previous years for comparison, the potential problem of selecting a period that was an outlier (in which one or more unusual factors led to increased or decreased reporting) was avoided. We selected the years 1999‐2002 because this was a period of increasing interest in better understanding medical errors at CHRMC. During this period, physicians and staff were encouraged to report medical errors, including near‐miss events, on incident reports. As with the anonymous electronic submissions, each investigator independently reviewed all the selected incident reports, with final classification based on the same schema used for the anonymous reports.
Comparison of the 2 reporting systems was complicated by the hospitalwide quality improvement program to increase the accuracy of labeling laboratory specimens that was ongoing during 1999‐2002. As part of this program, the hospital staff was encouraged to use the incident report system to document unlabeled or mismatched laboratory specimens and patients without proper identification from whom a laboratory specimen was to be obtained (eg, missing a hospital identification bracelet). Laboratory personnel completed most of these incident reports. In a previous review of incident report data from CHRMC, we found that 35% of medical errors reported were related to improper labeling of laboratory specimens (unpublished data). Although reporting these events may have been helpful for monitoring progress in quality improvement, many of the events described were extremely trivial in nature. Inclusion of this one specific type of event so skewed the overall number of medical errors reported that meaningful analysis of the types, relative frequencies, and reporting of errors was difficult. Based on this experience, we considered excluding this type of event from the analysis in the current study if it constituted a significant proportion of the medical errors conveyed in incident reports. Descriptions of mislabeled lab specimens or patients without identification bracelets constituted 33.8% of all incident reports from the 2 study units; no such events were described in submissions through the anonymous reporting system.
To compare the electronic anonymous and incident‐report error reporting systems, first the number of errors reported with each system was divided by the total number of patient‐days during which data were collected in the 2 units. Rates are expressed as the number of errors per 100 patient‐days. Rate ratios (RRs) with 95% confidence intervals (95% CIs) were calculated to compare the error reporting rates of the 2 reporting systems. Poisson regression was used to assess significance; a rate ratio whose 95% CI did not include 1.0 was considered statistically significant. Initial comparisons included all reports made through both systems. For subsequent comparisons, reports pertaining to mislabeled lab specimens were excluded. Error reporting rates were compared between the 2 reporting systems overall and by unit (medical unit and IICU), type, severity, and near‐miss status. In addition, to evaluate the possibility that secular trends in reporting medical errors were responsible for any observed overall differences, error reporting rates determined with the anonymous system were compared separately with incident report error rates in 1999, 2000, 2001, and 2002. Differences in the relative frequency of reporting different types of errors with the 2 systems were assessed with chi‐square tests. Kappa statistics were computed to assess the interobserver reliability of the 3 reviewers in classifying the events in the incident and anonymous reports as medical errors.
The study was approved by the Institutional Review Board of Children's Hospital and Regional Medical Center.
RESULTS
During the 3‐month study period, 146 reports were completed using the anonymous reporting system, 131 of which were classified as medical errors (89.7%). Ninety‐five errors were reported from the medical unit, and 36 were reported from the IICU. The kappa statistic for interobserver agreement in categorizing the anonymous reports as medical errors was .526. There were a total of 5420 patient‐days in the 2 units (medical service and IICU); thus, the rate of reporting medical errors via the anonymous system was 2.41/100 patient‐days (95% CI 2.02, 2.86). As shown in Table 2, the rate of errors reported in the IICU was higher than that in the medical unit. In addition to the errors reported via the anonymous system during the study period, 25 errors were reported using incident reports. Thus, the rate of reporting errors using both systems was 2.87.
| Reporting system | Medical unit* | IICU | Total | RR (95% CI) |
|---|---|---|---|---|
| ||||
| Anonymous reporting | 2.26 (1.83, 2.75) | 2.97 (2.09, 4.09) | 2.41 (2.02, 2.86) | |
| Incident reports | ||||
| All years | 1.35 (1.12, 1.53) | 2.23 (1.85, 2.66) | 1.56 (1.40, 1.73) | 1.54 (1.26, 1.90) |
| 1999 | 1.16 (0.86, 1.52) | 2.21 (1.50, 3.15) | 1.41 (1.12, 1.75) | 1.72 (1.29, 2.29) |
| 2000 | 1.55 (1.20, 1.97) | 2.90 (2.09, 3.91) | 1.92 (1.57, 2.31) | 1.26 (.97, 1.67) |
| 2001 | 1.26 (0.94, 1.65) | 2.63 (1.81, 3.70) | 1.52 (1.21, 1.87) | 1.59 (1.20, 2.12) |
| 2002 | 1.41 (1.08, 1.82) | 1.34 (1.10, 1.74) | 1.40 (1.10, 1.74) | 1.73 (1.30, 2.32) |
A total of 633 incident reports were completed in the 2 study units during the analogous 3‐month periods in 1999‐2002, 538 of which were categorized as medical errors (85.0%). When all reports were considered, the rate of medical errors reported via the incident report system was 2.40/100 patient‐days (95% CI 2.21, 2.61). However, 17.3% of all errors reported in 1999, 37.2% of those reported in 2000, 40.2% of those in 2001, and 39.8% of those in 2002 pertained to mislabeled laboratory specimens. After excluding these reports, the overall rate of medical error reporting during 1999‐2002, calculated using incident report data, was 1.56/100‐patient days (95% CI 1.40, 1.73). The kappa statistic for interobserver agreement in classifying incident reports as medical errors was .615. Rates of error reporting in the medical unit and IICU are shown in Table 2.
After excluding reports dealing with mislabeled laboratory specimens, the error reporting rate was significantly higher using the anonymous system than using incident reports (RR 1.54, 95% CI 1.26, 1.90). The rate of reporting errors with the anonymous system was higher than those for reporting via incident reports in 1999, 2001, and 2002; there was no significant difference in reporting rates when the data collected with the anonymous system were compared with the data on errors reported via incident reports in 2000 (RR 1.26, 95% CI 0.97, 1.67; Table 2).
Much of the increased rate of reporting via the anonymous system came from the medical unit. The medical unit had an overall RR for anonymous reporting compared with incidence report submission of 1.77 (95% CI 1.31, 2.14); the rate of reporting via the anonymous system was significantly higher than via incident reports for each of the years 1999‐2002. Conversely, the rate of reporting observed in the IICU was not significantly increased (RR 1.33, 95% CI 0.89, 1.95, P = .07).
The types of errors reported with the 2 systems are summarized in Table 3. Although the overall distribution was only marginally different between the 2 systems (P = .054), a higher proportion of the errors reported via the anonymous system were medication errors (P = .019), whereas a higher percentage of errors reported with incident reports dealt with equipment failures (P = .033). The rate of reporting medication errors with the anonymous system (1.57 reports/100 patient‐days) was significantly higher than that via incident reports (0.83 reports/100 patient days, RR 1.90, 95% CI 1.44, 2.47). When compared with the individual years for which incident report data were available, the reporting rate for medication errors was significantly higher via the anonymous system than with incident reports for each of the years 1999‐2002.
| Type of medical error | Anonymous system n (%) | Incident reports 1999‐2002 n (%)* |
|---|---|---|
| ||
| Communication | 12 (9.2) | 43 (12.4) |
| Patient identification | 2 (1.5) | 18 (5.2) |
| Equipment failure | 3 (2.3) | 26 (7.5) |
| Medication | 85 (64.9) | 185 (53.2) |
| Treatment | 11 (8.4) | 36 (10.3) |
| Protocol violation | 15 (11.5) | 37 (10.6) |
| Medical judgment | 3 (2.3) | 3 (0.9) |
The severity of medical errors reported with the 2 systems is shown in Table 4. As can be seen, errors reported via the anonymous system and in incident reports had a similar distribution of severity, with almost 80% of medical errors classified as moderately serious. The rate of reporting serious medical errors was 0.37/100 patient‐days with the anonymous system and 0.23/100 patient‐days via incident reports (RR 1.61, 95% CI 0.91, 2.76).
| Severity of reported errors | Anonymous system n (%) | Incident reports 1999‐2001 n (%)* |
|---|---|---|
| ||
| Trivial | 10 (7.6) | 23 (6.6) |
| Moderately serious | 101 (77.1) | 272 (78.6) |
| Serious | 20 (15.3) | 51 (14.7) |
With the anonymous system, 25.2% of reported medical errors were near‐misses compared with 12.6% of the errors reported with the incident report system (P = .001). The rate of reporting near‐miss medical errors was 3‐fold higher with the anonymous system relative to reporting via incident reports (RR 3.10, 95% CI 1.91, 4.98) and was significantly higher than in each of the years data on incident reports were collected and in each of the 2 units. The reporting of errors that reached the patient was also significantly more frequent with the anonymous system than via incident reports; however, this increase was less pronounced (RR 1.32, 95% CI 1.05, 1.67). Among the 33 near‐miss events reported via the anonymous system were 10 medical errors categorized as serious. Six of these were related to medications, including two 10‐fold overdoses of morphine. Overall, the rate of reporting near‐miss medication errors was significantly higher with the anonymous system than with incident reports (RR 3.10, 95% CI 1.81, 5.24).
DISCUSSION
The results of this study suggest that implementation of an anonymous system was associated with a modest increase in the reporting of medical errors during the care of hospitalized children compared with reporting via a traditional incident report system. After excluding reports of mislabeled laboratory specimens, reported as part of a specific quality improvement project, the rate of errors reported with the anonymous system was approximately 54% higher than that using incident reports. The most striking upsurge in reporting observed with the anonymous system was the 3‐fold increase in reporting of near‐miss medical errors.
Because of different types of patients, lack of denominator data, different durations of observation, and, presumably, different inherent rates of errors, it is difficult to compare different anonymous reporting systems for medical errors. In one of the few studies dealing with pediatric patients, Suresh et al, evaluated a Web‐based anonymous reporting system in 54 neonatal intensive care units (NICUs).16 Over a 27‐month period, 1230 reports were completed via the system, for an average of slightly less than 1 report per NICU per month. This is substantially lower than the 12 errors per month reported from the IICU in our study using the anonymous system. In a study of a Web‐based anonymous system used by 18 ICUs in 11 hospitals, 854 reports were filed during a 12‐month period. The average rate of reporting ranged from 4.3 to 7.5 reports per ICU per month, with an overall mean of 6.5 reports per hospital per month.1415 However, unlike in our study, in which the anonymous system temporarily supplanted incident reports, only 2 of the 11 hospitals discontinued incident reporting.14 A national Web‐based system has been established for reporting medication errors. During a 2‐year period beginning in 1999, 154,816 medication errors were reported from 403 hospitals, for an average of 16 reports per hospital per month.18 This is less than the 28 medication errors reported per month with our anonymous system.
Anonymous systems based at a single institution have been associated with higher rates of reporting. In one study, approximately 68 events were reported per month during the first 16 weeks after full implementation of a hospitalwide anonymous system, compared with the average of 44 errors reported monthly in our project.17 In the study perhaps most comparable to ours, Osmon et al. reported on the use of an anonymously completed paper form used to report medical errors in an adult ICU.13 Patient safety advocates extensively described and promoted the reporting system prior to its use and while it was implemented. During the 6‐month study period, 8.93 medical events/100 patient‐days were reported with the system. This rate of reporting was 10‐fold higher than that reported via the standard reporting system used at that hospital.
In addition to rate of reporting medical errors, our study was designed to compare some aspects of the content of anonymous and incident reports. No statistically significant difference was found in the severity of the events reported; the rate of reporting serious medical errors was comparable between the 2 systems. This might suggest serious errors are the most likely to be reported regardless of the system used. However, given the modest number of serious events reported with either the anonymous or the incident report system (20 and 51, respectively), the power to detect a significant difference in rates was limited. Conversely, implementation of the anonymous system was associated with increased reporting of near‐miss events of all types and was a particularly useful mechanism for reporting near‐miss medication errors. Because near‐miss events may not be detected by other methods for identifying medication errors such as chart review or search for specific triggers, the use of an anonymous system may be an important tool in a multifaceted effort to improve medication safety. Perhaps the best use of an online anonymous system would be to provide a mechanism for rapid reporting of near‐miss errors, whereas other systems, such as incident reports, could be used to report errors that reach the patient.
We were surprised that although the reporting of medical errors was increased on the medical unit with the implementation of the anonymous system, there was no significant change in overall reporting in the IICU. This was possibly because reporting via incident reports was already more complete in the IICU, so that a small increase with the anonymous system was less likely to be detected However, it is equally plausible that because of the severity of illness of the patients in the IICU, physicians and staff in this unit had a perception that they did not have enough free time to report all errors. Finally, it is possible that the staff and/or clinical leadership in the medical unit was more enthusiastic about the anonymous system. Regardless, this result suggests that despite training on reporting, provision of an easy‐to‐use system, and the guarantee of anonymity, significant barriers to reporting medical errors remain.
The Kappa statistic of .526 for level of agreement between reviewers in categorizing events described with the anonymous system as medical errors indicates only a good level of agreement.20 This lack of agreement may be in part a result of the limited amount of information provided in some of the narrative reports of events. Because anonymous reports did not include names of patients or providers, it was impossible to review medical records or other information to gain additional information about the events described. However, as pointed out by others, determination of when a medical error has occurred, although seemingly simple, is frequently much less clear when reviewing actual events.21
The findings in our study should be interpreted cautiously. Because of the need for a unified system to record events across the entire hospital, anonymous reports supplanted incident reports in the 2 study units for only a 3‐month period; it is impossible to predict the long‐term trends in reporting with this system. We selected the winterspring period for the study because it is a busy time of year for children's hospitals. Rates of reporting and medical errors may change dramatically during other times of the year, particularly in a teaching hospital. An underlying assumption of our comparisons between the 2 reporting systems was that the actual rate of medical errors was unchanged throughout the period and that the differences observed were a result of more complete reporting with the anonymous system. The increased rate of reporting of medical errors found with the anonymous reporting system might have been influenced by the training given the medical personnel. It is also possible that the increased reporting rates with the anonymous system occurred because of increased publicity, both in the press and in the hospital, about medical errors and patient safety, in general. However, because there was no definite secular trend in reporting observed during the years 1999‐2002, it is unlikely that this explains our findings. Finally, it is impossible to measure the relative impact of the increased ease of reporting with the online system versus the anonymity provided.
Although the anonymous system was associated with a 54% increase in rate of reporting, it is clear that the vast majority of medical errors were not reported. If the estimates that incident reports capture 1%‐10% of errors are accurate,8, 9 the increase in reporting that we observed with the anonymous system would indicate that 1.5%15% of errors were reported. The impressive 10‐fold increase in reporting observed by Osmon et al. in their study of an anonymous system was partly a result of the very low rate of reporting with their traditional system (approximately .67 reports of medical errors/100 adult ICU patient‐days).13 A common feature of studies of anonymous systems with higher rates of reporting medical errors is the continuing presence of on‐site patient safety investigators and advocates.13, 17 Rather than the particulars of the reporting system used, this on‐site presence and advocacy may be the most important element in increasing voluntary reporting of medical errors. In our study it is likely that some of the increase in reporting observed with the anonymous system was related to publicity about the system and ongoing promotion of the importance of reporting errors by the research team.
Since completion of the study, CHRMC has been using incident reports as the main tool for collecting data on medical errors in all units. However, based on our experiences, a new reporting tool, called e‐feedback, has been instituted. The goal of this system is to allow physicians and staff members to quickly report events that may be indicative of systems problems in the delivery of care. The reports are reviewed by designated multidisciplinary teams in various units throughout the hospital so that changes can be implemented, if needed.
CONCLUSIONS
Although there was a modest increase in the number of reports, the results of this study indicate that the implementation of an anonymous online reporting system (with training on the use of the system) was not a panacea for the problem of underreporting of medical error. Use of a system such as we have described may be an effective tool for increasing the reporting of near‐miss events., However, our results suggest that methodologies in addition to voluntary or semivoluntary reporting systems are needed to more fully collect information on medical errors.
- Kohn LT,Donaldson MS, eds.To Err is Human: Building a Safer Health System.Washington, DC:National Academy Press;2000.
- American Academy of Pediatrics,Committee on Drugs and Committee on Hospital Care.Prevention of medication errors in the pediatric inpatient setting.Pediatrics.2003;112:431–436.
- ,.Measuring errors and adverse events in health care.J Gen Intern Med.2003;18:61–67.
- ,,,.Detecting adverse events for patient safety research: a review of current methodologies.J Biomed Inform.2003;36:131–143.
- ,,,.Retrospective data collection and analytical techniques for patient safety studies.J Biomed Inform.2003;36:106–119.
- ,.Reporting and preventing medical mishaps: lessons from non‐medical near miss reporting systems.BMJ.2000;320:759–763.
- .Systems for risk identification. In:Carroll R, ed.Risk Management Handbook for Health Care Organizations.3rd ed.San Francisco, CA:Josey‐Bass Inc.;2001:171–189.
- ,,,,,.The incident reporting system does not detect adverse drug event: a problem for quality improvement.Jt Comm J Qual Improv.1995;21:541–548.
- ,,,,.Comparison of methods for detecting medication errors in 36 hospitals and skilled‐nursing facilities.Am J Health Syst Pharm.2002;59:436–446.
- ,,, et al.Use of incident reports by physicians and nurses to document medical errors in pediatric patients.Pediatrics.2004;114:729–735.
- ,,,.Perceived barriers in reporting medication administration errors.Best Pract Benchmarking Healthc.1996;1:191–197.
- ,,.Reasons for not reporting adverse events: an empirical study.J Eval Clin Pract.1999;5:13–21.
- ,,,,,.Reporting of medical errors: an intensive care unit experience.Crit Care Med.2004;32:727–733.
- ,, et al.Creating the web‐based intensive care unit safety reporting system.J A med Inform Assoc.2005;12:130–139.
- ,,, et al.Development of the ICU safety reporting system.J Patient Saf.2005;1:23–32.
- ,,, et al.Voluntary anonymous reporting of medical errors for neonatal intensive care.Pediatrics.2004;113:1609–1618.
- ,,,.Development of a web‐based event reporting system in an academic environment.J Am Med Inform Assoc.2004;11:11–18.
- ,,,.Medication errors: experience of the United States Pharmacopeia (USP) MEDMARX reporting system.J Clin Pharmacol.2003;43:760–767.
- ,,, et al.Preventing medical injury.Qual Rev Bull.1993;19:144–149.
- .Hypothesis testing: categorical data. In:Fundamentals of Biostatistics.4th ed.Belmont, CA:Wadsworth Publishing Company;1995:345–443.
- ,.What is an error?Eff Clin Pract.2000;6:261–269.
Copyright © 2007 Society of Hospital Medicine
Inpatient Diabetes Care
Diabetes confers a substantial burden on the hospital system. Diabetes is the fourth‐leading comorbid condition associated with any hospital discharge in the United States1. During 2001, for more than 500,000 patients discharged from U.S. hospitals diabetes was listed as the principal diagnosis and for more than 4 million it was listed as a codiagnosis.2, 3 Nearly one‐third of diabetes patients require at least 2 hospitalizations annually,4 and inpatient stays account for the largest proportion of direct medical expenses incurred by persons with the disease.5
Numerous studies have demonstrated that hyperglycemia is associated with adverse outcomes of hospitalized patients.68 However, studies have also confirmed that attention to lowering glucose levels in the hospital improves patient outcomes.7, 8 Although inpatients with known diabetes will likely constitute the largest and most visible percentage of those who will require treatment for high glucose, the recommendation to control glucose applies to all inpatients regardless of whether they have been diagnosed with diabetes prior to hospitalization or have manifested hyperglycemia only during the hospital stay.79
Now that the relationship between hyperglycemia and hospital outcomes is well established, the task of organizations that deliver care and set policy is to translate current recommendations of good glucose control into real‐world hospital settings. Quality improvement organizations are currently working toward developing and disseminating performance measures for control of inpatient hyperglycemia.10, 11 Although management of hospital hyperglycemia is often perceived as suboptimal,12 actual data are limited and are based on review of small numbers of charts,1315 and information is even sparser on the pharmacologic strategies being used to treat inpatient hyperglycemia. Before educational programs and policies can be developed, individual hospital systems need to gain more insight into how hyperglycemia is being managed in the hospital.
We reported previously the results of a review of a small number of charts (n = 90) of patients hospitalized with diabetes. The findings from this review suggested there was clinical inertia in glycemia management in the hospital.15 Clinical inertia was originally described in relationship to diabetes care in the outpatient setting and was defined as a failure to perform a needed service or make a change in treatment when indicated.16, 17 Since the original description, additional reports have documented the problem of clinical inertia, but these have all been based on experiences in the outpatient setting.1822 To our knowledge, our previous report was the first to question whether clinical inertia occurred in the hospital environment. In addition, we described the negative therapeutic momentuma deintensification of treatment despite ongoing hyperglycemia15. However, our prior study examined only a small number of cases and did not include detailed data on pharmacologic treatment for hyperglycemia. Therefore, we expanded our analysis using an information systems rather than a chart reviewbased methodology to assess the status of hyperglycemia management in our hospital.
METHODS
Setting
Our tertiary‐care academic teaching hospital is a 200‐bed facility in metropolitan Phoenix, Arizona. All adult general medical and surgical specialties are represented, including transplantation services; the hospital also has a level 2 trauma center and an inpatient rehabilitation unit. Care is provided by various types of practitioners, including postgraduate trainees, faculty, physician assistants, and nurse‐practitioners. An electronic medical record links outpatient and inpatient records with laboratory results and pharmacy orders. The core electronic health record system is the Centricity/LastWord platform, provided by GE/IDX. The ancillary core systems, including laboratory and pharmacy, are interfaced with the Centricity system and maintained by on‐site Mayo Clinic information technology professionals.
Case Selection
Patients discharged with an International Classification of Diseases, 9th Revision, Clinical Modification (ICD‐9‐CM) diagnosis code for diabetes (ICD‐9‐CM code 250.xx) or hyperglycemia (ICD‐9‐CM code 790.6) were identified in a search of the hospital's electronic billing records.24 Our facility does not provide obstetric or pediatric services; therefore, corresponding ICD‐9‐CM codes for those populations were not included. Both primary and nonprimary diagnostic fields were searched. Discharges were extracted for the period between January 1, 2001, and December 31, 2004. Data retrieved included patient age, ethnicity/race, length of stay (LOS), and type of hospital service with primary responsibility for the patient's care. For confidentiality reasons, individual patients were not identified, and the unit of analysis was the discharge.
Our analyses focused principally on the noncritically ill, defined as those patients who did not require a stay in our intensive or intermediate care units; critically ill patients were identified based on room location in the data set and excluded. The reasons this study assessed hyperglycemia management in the noncritically ill were 2‐fold. First, the critically ill may migrate in and out of intensive care depending on their health status and thus experience different intensities of glucose management. Second, in our facility the therapeutic approach to hyperglycemia management is different for the critically ill than for the noncritically ill; the critically ill may receive intravenous and/or subcutaneous insulin, whereas subcutaneous insulin therapy only is given to the noncritically ill. Thus, the noncritically ill represent a more clearly defined patient population whose therapies would be easier to evaluate. We also restricted the final analysis to patients who had a LOS of 3 days or less, so that differences in glucose control and insulin therapy between the first and last 24 hours of hospital stay could be assessed.
Data on 30 randomly chosen patients from different years was extracted from electronic records. A spreadsheet of the data was compared against data in our online electronic medical records. The online data were printed, and packets were made of the data for each patient selected for review. The patient demographic information was validated against our registration screen. Inpatient stay was validated to verify a patient was in intensive or intermediate care. The result of each glucose test performed while the patient was in the hospital was printed and the calculations validated. The insulin given while the patient was hospitalized was also printed and reviewed to verify the type of insulin and calculations for the amounts of insulin given.
Assessment of Glycemic Control
After extraction of hospital cases, data were linked via patient identifiers to our electronic laboratory database to retrieve information on glucose values. Glucose data included both blood and bedside measurements. In our institution, bedside glucose monitoring is performed with an instrument that scans and records patient identification, followed by direct downloading to our laboratory database. Commercial software (Medical Automation Systems, Charlottesville, VA) facilitates the interfacing of glucometer data with the electronic laboratory file.
Nearly all hospitalized patients had either bedside glucose (84%) or blood glucose (86%) data available for analysis. However, the mean number of bedside glucose measurements was 3.4 per day, whereas the average number of blood glucose measurements was only 1.0 per day. Because of the greater number of bedside measurements and because practitioners typically make therapeutic decisions about hyperglycemia management on the basis of daily bedside glucose results, these values were used to assess glycemic control of patients in the hospital discharge data.15
To assess glycemic control, we used methods similar to those previously published by ourselves and others.15, 23 We averaged each patient's available bedside glucose measurements to determine the composite average (BedGlucavg). We also computed the average of bedside glucose measurements obtained during the first 24 hours after admission (F24BedGlucavg) and during the last 24 hours before discharge (L24BedGlucavg), then examined the distributions of BedGlucavg, F24BedGlucavg, and L24BedGlucavg. The first 24‐hour period was calculated forward from the recorded time of admission, and the last 24‐hour period was calculated backward from the time of discharge. We calculated the frequency that each patient's bedside measurements showed hypoglycemia (bedside glucose < 70, < 60, < 50, or < 40 mg/dL) and showed hyperglycemia (bedside glucose >2 00, > 250, > 300, > 350, or > 400 mg/dL). Results were recorded as the number of values per 100 measurements per person; this method allowed adjustment for variation in the individual number of measurements and captured information on multiple episodes of hypo‐ or hyperglycemia of individual patients.15, 23
Hyperglycemia Therapy
Links to our inpatient pharmacy database enabled determination of types of pharmacotherapy actually administered to patients to treat hyperglycemia. Our electronic pharmacy records are designed so that intravenous medications (eg, intravenous insulin), scheduled oral and subcutaneous medications (eg, subcutaneous insulin), and medications administered on a one‐time or as‐needed basis (eg, sliding‐scale insulin) are documented electronically as separate categories. In our facility, intravenous insulin is administered only in the intensive care setting or as a component of total parenteral nutrition, and we excluded intravenous insulin use from this data. Thus, our analysis of insulin therapy focused only on elucidating patterns of subcutaneous treatment.
We classified hyperglycemia treatment as no therapy, oral agents only, oral agents plus insulin, and insulin only. Patients were regarded as having received an oral agent or insulin if they were administered the medication at any time during their inpatient stay. For management of hyperglycemia in noncritically ill patients, the use of a programmed basal‐bolus insulin program is advocated rather than the use of only a short‐acting bolus or sliding‐scale regimen.7, 8 Therefore, we further examined the insulin treatment strategies by classifying the type of regimen as basal only (if only an extended‐release preparation was used), as basal bolus (if the therapy consisted of a long‐acting plus a short‐acting formulation), or as bolus only (if the only insulin administered was a short‐acting preparation).
In addition to characterizing the general therapeutic approaches to hyperglycemia, we determined changes in the amount of insulin administered according to the severity of the hyperglycemia. Among patients who received insulin, we compared the average total units of insulin used during the last 24 hours before discharge with the amount administered during the first 24 hours of hospitalization. If more units were used during the last 24 hours than in the first 24 hours, the amount of insulin administered was categorized as having increased; if fewer units were provided during the last 24 hours, then the insulin amount was classified as having decreased; otherwise, no change was considered to have occurred. The BedGlucavg values were divided into 3 intervals using tertile cut points, and the differences in the proportion of patients by each type of insulin treatment regimen and the categories of insulin change were compared across tertiles; differences in proportions were determined using the 2 statistic.
RESULTS
Patient Characteristics
Between January 1, 2001, and December 31, 2004, a total of 7361 patients were discharged from our facility with either a diabetes or a hyperglycemia diagnosis (16% of all discharges); the percentage of discharges associated with these diagnoses increased from 14.9% in 2001 to 16.4% in 2004. Most patients with diabetes or hyperglycemia (5198 or 71%) received care outside the intensive‐ or intermediate‐care setting.
Among the noncritically ill patients whose LOS was at least 3 days (N = 2916), average age was 69 years, and average LOS was 5.7 days. Most of the discharged patients were men (57%), and 90% were white. Most patients were discharged from primary care (45%; general internal medicine or family medicine) or surgical services (34%), with the rest discharged from other specialties (eg, cardiology, transplant medicine). Compared to the noncritically ill, who had an LOS of at least 3 days, those noncritically patients whose LOS was less than 3 days (n = 2282) were slightly younger (mean age 68 versus 69 years, P < .001 by Mann‐Whitney testing) but were comparable in sex and race distribution (P > .07 for both by chi‐square testing).
Glycemic Control
The median duration between admission and time of first bedside glucose measurement was 3.0 hours. Patients had an average of 19 bedside glucose measurements; the overall mean number of bedside measurements was 3.4 per day, 3.7 during the first 24‐hour period, and 3.4 during the last 24 hours of hospitalization. Nearly 25% of patients were hyperglycemic (bedside glucose > 200 mg/dL) during the first 24 hours of hospitalization (Fig. 1A), 20% had persistent hyperglycemia throughout the entire hospitalization (Fig. 1B), and 21% were hyperglycemic during the 24 hours before discharge (Fig. 1C), with some patients discharged with an average bedside glucose of at least 300 mg/dL during the 24 hours before discharge.
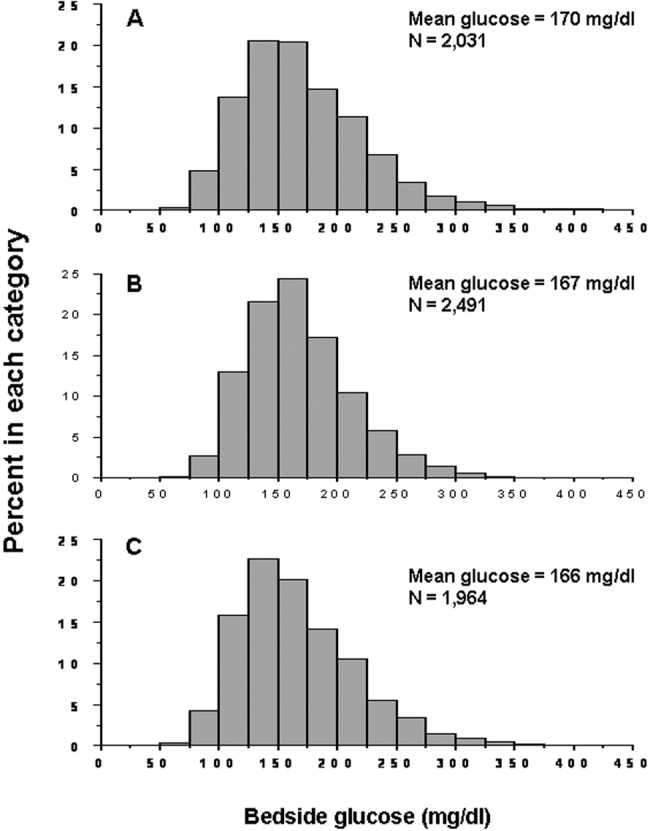
The incidence of hypoglycemic episodes was lower than that of hyperglycemic episodes: 21% of patients had at least 1 bedside glucose value less than 70 mg/dL, but 68% had at least 1 value greater than 200 mg/dL. The frequency of hypoglycemic measurements was low (Fig. 2A) compared with the frequency of hyperglycemic episodes (Fig. 2B).
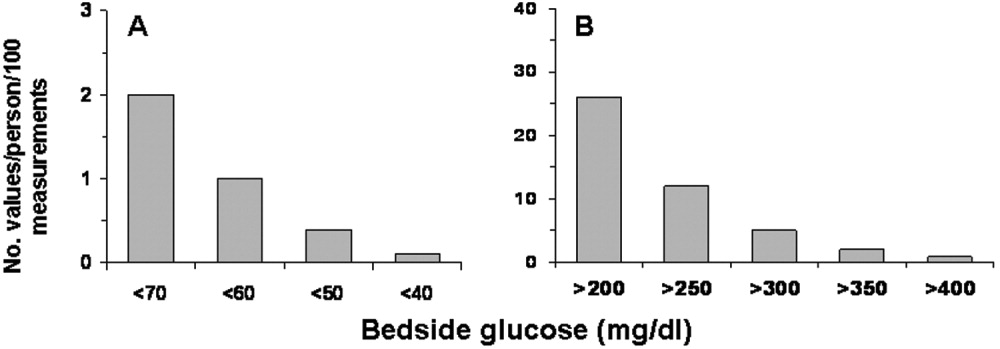
Hyperglycemia Therapy
Most patients (72%) received subcutaneous insulin at some point during their hospital stay; 19% had no therapy, 9% had oral agents only, 26% had oral agents plus insulin, and 46% had insulin only. The proportion receiving no therapy decreased from 32% among patients whose BedGlucavg was in the first tertile to 2% in the third tertile; the percentage of patients taking oral agents only decreased from 18% to 1%; the proportion taking oral agents plus insulin was 17% in the first tertile and 30% in the third; and the proportion of those taking insulin only was 32% in the first tertile and 66% in the third (Fig. 3). Thus, nearly all patients whose BedGlucavg value was in the third tertile received insulin, either as monotherapy or in combination with oral agents.
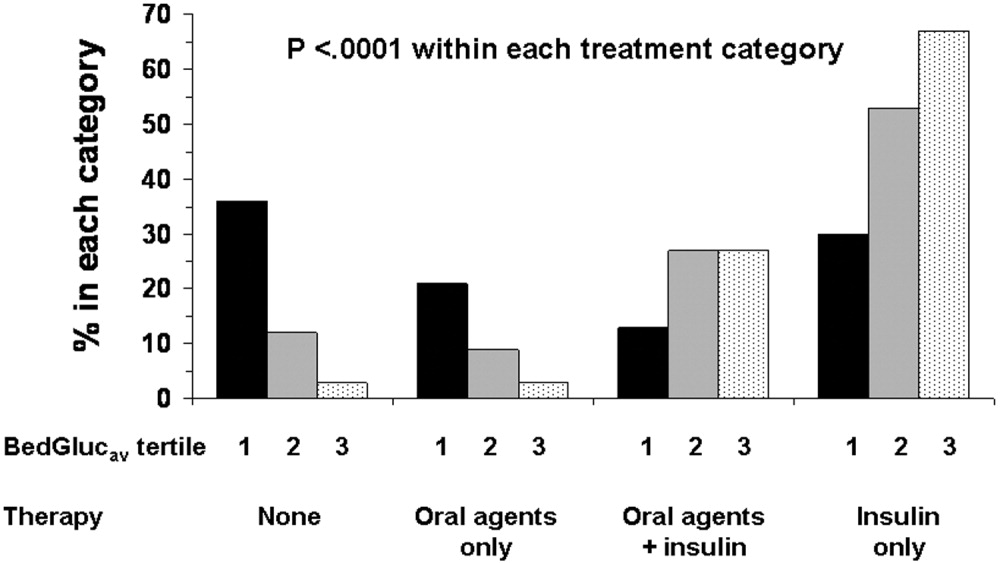
Among insulin users, 58% received bolus‐only, 42% received basal‐bolus, and 1% received basal‐only injections. Because of the small proportion of basal‐only patients, we conducted analyses only of patients whose insulin treatment fell into 1 of the first 2 categories. The use of a basal‐bolus insulin program increased from 34% in patients whose BedGlucavg was in the first tertile to 54% for those who had BedGlucavg in the third tertile (P < .001; Fig. 4, left). Thus, although there was a greater transition to a more intensive insulin regimen with worsening hyperglycemia, a substantial number of patients (46%) whose BedGlucavg was in the third tertile still did not have their insulin regimen intensified to a basal‐bolus program.
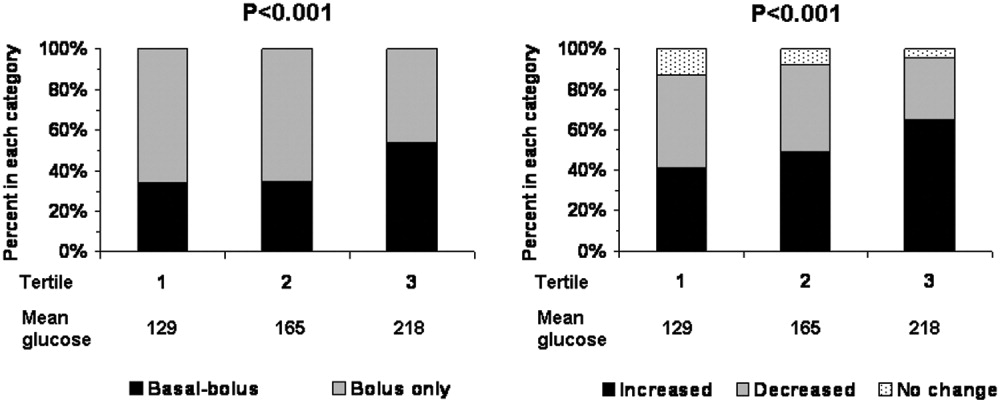
Fifty‐four percent of subcutaneous insulin users (N = 1680) had an increase in the amount of insulin administered between the first and last 24 hours of hospitalization (average increase, 17 U), 39% had a decrease (average decrease, 12 U), and 7% had no change. With rising hyperglycemia, more patients had their insulin increased by the time of discharge; 41% of persons who had BedGlucavg values in the first tertile were on more insulin by the time of discharge, whereas 65% of those who had average glucose values in the third tertile had insulin increased (Fig. 4, right). However, the pattern of changes in the amount of administered insulin was heterogeneous, with increases, decreases, and no change occurring in all tertiles of BedGlucavg (Fig. 3, right). Nearly 31% of patients whose BedGlucavg values were in the third tertile actually had a decrease in insulin. This decrease occurred despite evidence of a low frequency of hypoglycemia (only 1.2 values < 70 mg/dL per 100 measurements per person) and a high frequency of hyperglycemia (55.4 values > 200 mg/dL per person per 100 measurements).
DISCUSSION
The number of diabetes‐associated hospital discharges has been climbing2, 3; our own data indicate an increase in the number of patients with diabetes as a proportion of the total number of discharged patients. A recent consensus advocates good glucose control in the hospital to optimize outcomes,79 and institutions need to begin the process of assessing their quality of inpatient hyperglycemia management as a first step to enhancing care.
There are no guidelines about which method of glucose measurement (ie, blood glucose or bedside glucose) should be used as the quality measure to evaluate glycemic control in hospital patients. Both blood and bedside glucose measurements have been used in outcomes studies.23, 24 We analyzed capillary bedside values measured by a method subjected to ongoing quality control oversight and stored in the electronic laboratory database. Bedside glucose measurements are typically obtained with far greater frequency than blood glucose measurements and therefore provide better insight into daily changes in glycemic control; in practice, clinicians rely on bedside values when assessing hyperglycemia and making therapeutic decisions.
There is also no consensus about what glucose metric should be used to assess the status of glycemic control in the hospital. Some studies have used single glucose values to examine the relationship between hyperglycemia and outcomes,25, 26 whereas others have used values averaged over various lengths of time.24, 27 To evaluate glucose control, we averaged capillary measurements in the first 24 hours of hospitalization (F24BedGlucavg), the last 24 hours of hospitalization (L24BedGlucavg), and for the entire LOS (BedGlucavg), and we calculated the number of documented hyper‐ and hypoglycemic events. The measures we used to examine hyperglycemia would serve as useful benchmarks for following the progress of future institutional interventions directed at glucose control in hospitalized patients at our hospital.
A substantial number of our patients selected for analysis (ie, noncritically ill with LOS 3 days) were found to have sustained hyperglycemia at the beginning, during, and at the end of their hospital stay. We found very few instances of severe hypoglycemia (values < 50 or < 40 mg/dL), and the low frequency of hypoglycemia compared to that of hyperglycemia could encourage practitioners to be more aggressive in treating hyperglycemia. The high frequency of recorded bedside glucose compared with blood glucose measurements ( 3 per day), the ongoing patient surveillance by medical, nursing, and other staff members, and our institution's written hypoglycemia policy most likely minimize the number of unobserved, undocumented, or untreated hypoglycemic episodes. There are no data or recommendations about what would be an acceptable number of hypoglycemic episodes in the hospital.
Very little is known about the therapeutic strategies being applied to hyperglycemia in the hospital. Our data show that subcutaneous insulin (either alone or in combination with oral agents) was used at some point during hospitalization for nearly three‐fourths of noncritically patients who were in the hospital for 3 days or longer. Moreover, as hyperglycemia worsened, use of oral hypoglycemic agents declined, there was a shift toward greater use of a scheduled basal‐bolus insulin program, and a greater proportion of patients had more insulin administered.
Although these latter findings are encouraging and suggest that practitioners are responding to the severity of hyperglycemia, further examination of the data suggests that a substantial number of patients in the highest glucose tertile did not have insulin therapy intensified. Nearly half our patients whose glucose values were in the highest tertile were treated with short‐acting insulin aloneprobably an ineffective regimen23, 28or did not have more insulin administered. The higher doses administered were not likely solely a result of using more sliding‐scale insulin, as previous investigators actually found no correlation between intensity of the sliding scale and total daily insulin dose.14 Although evidence here is circumstantial (we did not examine changes in provider orders in response to glucose levels), these findings, together with those in our previous study15 and in another study,14 provide indirect evidence of clinical inertia in the hospital.
Beyond clinical inertia, however, there was evidence of negative therapeutic momentum: nearly one‐third of patients whose glucose was in the highest tertile had insulin decreased rather than increased, despite the low frequency of hypoglycemia and the high frequency of hyperglycemia. It is likely that even a single episode of hypoglycemia concerned practitioners, but the clinical response in these situations should be to investigate and correct the circumstances leading to the hypoglycemia, rather than to necessarily deintensify therapy in the face of continued hyperglycemia. The analysis of this larger data set corroborated our observations of clinical inertia and negative therapeutic momentum from an earlier study of chart reviews of a smaller patient sample.15
The variable application of insulin therapy to the treatment of hyperglycemia may be an indication of the level of comfort practitioners have about using this pharmacologic agent. A recently completed survey of resident physicians at our institution indicated that understanding how to use insulin was the most common barrier to successful management of inpatient hyperglycemia.29 These observations reinforce the need for institutions to develop standardized insulin order sets and develop programs to educate the staff on the use of insulin.
This study differs from our original analysis based on chart review in 4 ways. First, the sample size in our first study (n = 90) was small and derived from discharges from a single year (2003), whereas the sample in the present study spanned several years and included several thousand cases. Second, in our prior study we did not have detailed pharmacologic data on glucose management and how treatment approaches varied relative to severity of hyperglycemia. In general, there is very limited data on what therapeutic strategies are being applied to inpatient hyperglycemia, and this analysis of a large sample of cases provides more insight into how practitioners are managing glucose.
Third, we wanted to corroborate observations made in our previous report using a different methodologyin this instance, adapting existing information systems to assessment of inpatient diabetes care. For example, our last study was based on a limited number of glucose observations but suggested that the prevalence of hypoglycemia in our hospital was low compared with that of hyperglycemia; the present analysis of a very large number of glucose values confirmed these initial findings. In addition, use of information systems versus a chart review approach to assessing inpatient diabetes care corroborates our earlier suspicions about the presence of clinical inertia and negative therapeutic momentum in glucose management.
Fourth and finally, this study gave us experience with use of electronic records as a means to assess the status of inpatient diabetes care. Electronic data sources will likely be common tools to monitor quality of inpatient diabetes care and will likely figure prominently in future accreditation processes.10, 11 Unlike chart abstraction, which would require extensive man‐hours to extract data on few patients, use of electronic records allows examination of large numbers of hospital cases. Queries of information systems could be automated, and report cards potentially generated and feedback given to providers on the status of inpatient glycemic control. The industry is actively pursuing software development to assist hospitals in assessing the quality of inpatient glycemic control (eg, RALS‐TGCM, available at
However, there are also limitations to using electronic records as the sole method of assessing inpatient diabetes care. For instance, retrospective review of electronic records does not allow assessment of reasons underlying decision‐making behavior of clinicians (eg, why they did or did not change therapy). Diabetes and hyperglycemia associated hospitalizations must be identified by discharge diagnosis codes, so some cases of diabetes and hyperglycemia were likely missed.30, 31 Recent guidelines propose preprandial targets for glucose in the hospital.8 It is not easy to determine from an electronic data source which is a preprandial bedside glucose and which is a postprandial bedside glucose. Pre‐ and postpyramidal glucose categories would be difficult to define even during prospective studies, given the varying nature of nutritional support (ie, enteral, parenteral) used in the hospital and the administration of continuous dextrose infusions. Some type of quality control, such as conducting reviews of small samples of randomly selected charts to see how they compare with the electronic data, will need to be conducted.
From electronic discharge data, we cannot establish who had preexisting diabetes, who was admitted with new‐onset diabetes, and who developed hyperglycemia as a result of the hospital stay. Our previous random chart review15 indicated it is likely that most (more than 90%) had an established diagnosis of diabetes before admission. However, the recommendation to treat hyperglycemia should apply to all patients regardless of whether they had diagnosed diabetes prior to hospitalization or manifested hyperglycemia only during the hospital stay.79
As hospitals move toward making efforts to improve performance related to treating inpatient hyperglycemia, they must be cognizant of the heterogeneity of the inpatient population and the challenges to managing hospital hyperglycemia before drawing conclusions about their management. Inpatients with hyperglycemia are a diverse group, comprising patients with preexisting diabetes, with previously undiagnosed diabetes, and stress‐caused hyperglycemia. The unpredictable timing of procedures, various and changing forms of nutritional support, and different levels of staff expertise all contribute to the challenges of managing inpatient hyperglycemia. Inpatient practitioners may be forced to attempt glycemic control catch‐up for hospitalized persons who had poor outpatient glucose control. Patients who have required a stay in the intensive care unit may have very different glycemic outcomes than those who have not. Patients whose LOS was short (< 3days) may have different glycemic outcomes than persons whose LOS was longer ( 3 days as defined here) because of the length of time practitioners have to work to control their hyperglycemia. These and other variables may have to be taken into account when developing and assessing the impact of interventions.
Despite these limitations, our analysis was helpful in providing direction for enhancing the care of hospitalized patients with hyperglycemia in our facility. For instance, our generalists and surgeons are the principal caretakers of noncritically ill patients with diabetes, and these practitioners could be targeted for the first continuing educational programs about inpatient care of hyperglycemia. In addition, institutional guidelines on when and how to initiate and change therapyparticularly insulincan be designed so that hyperglycemia in noncritically ill hospital patients can be managed more effectively. These and other ongoing educational initiatives are necessary to ensure delivery of the highest quality of inpatient glucose care.
- ,,,.Hospitalization in the United States,1997.Rockville, MD:Agency for Healthcare Research and Quality;2000. Report No.: HCUP Fact Book No. 1; AHRQ Publication No. 00‐0031.
- Hospitalization for Diabetes as First‐Listed Diagnosis. Available at: http://www.cdc.gov/diabetes/statistics/dmfirst/index.htm. Accessed November 29,2006.
- Hospitalizations for Diabetes as Any‐Listed Diagnosis. Available at: http://www.cdc.gov/diabetes/statistics/dmany/index.htm. Accessed November 29,2006,
- ,,,.Multiple hospitalizations for patients with diabetes.Diabetes Care.2003;26:1421–1426.
- ,,.Economic costs of diabetes in the US in 2002.Diabetes Care.2003;26:917–932.
- ,,.Inpatient diabetology. The new frontier.J Gen Intern Med.2004;19:466–471.
- ,,, et al.American Diabetes Association Diabetes in Hospitals Writing Committee: Management of diabetes and hyperglycemia in hospitals.Diabetes Care.2004;27:553–591.
- ACE Task Force on Inpatient Diabetes and Metabolic Control.American College of Endocrinology position statement on inpatient diabetes and metabolic control.Endocr Pract,2004;10:77–82.
- ACE/ADA Task Force on Inpatient Diabetes.American College of Endocrinology and American Diabetes Association consensus statement on inpatient diabetes and glycemic control.Endocr Pract.2006;12:459–468.
- Getting started kit: prevent surgical site infections.2006 Available at: www.ihi.org/NR/rdonlyres/00EBAF1F‐A29F‐4822‐ABCE‐829573255AB8/0/SSIHowtoGuideFINAL.pdf. Accessed November 29,year="2006"2006.
- Joint Commission on Accreditation of Healthcare Organizations. American Diabetes Association and Joint Commission Collaborate on Joint Commission Inpatient Diabetes Care Certification.2006. Available at: http://www.jointcommission.org/NewsRoom/NewsReleases/jc_nr_072006.htm. Accessed November 29,year="2006"2006,
- ,.Glycemic chaos (not glycemic control) still the rule for inpatient care: How do we stop the insanity?J Hosp Med.2006;1:141–144.
- ,,,,.Unrecognized diabetes among hospitalized patients.Diabetes Care.1998;21(2):246–249.
- ,,,,.Inpatient management of diabetes and hyperglycemia among general medicine patients at a large teaching hospital.J Hosp Med.2006;1(3):145–150.
- ,,, et al.Diabetes care in the non‐ICU setting: is there clinical inertia in the hospital?J Hosp Med,2006;1(3):151–160.
- ,,, et al.Diabetes in urban African‐Americans. XVI. Overcoming clinical inertia improves glycemic control in patients with type 2 diabetes.Diabetes Care.1999;22:1494–500.
- ,,, et al.Clinical Inertia.Ann Intern Med.2001;135:825–834.
- ,,,Team UHCUDBP.Quality of diabetes care in U.S. academic medical centers: low rates of medical regimen change.Diabetes Care.2005;28:337–442.
- ,,, et al.Clinical inertia in the management of type 2 diabetes metabolic risk factors.Diabet Med,2004;21:150–155.
- ,.Clinical inertia: errors of omission in drug therapy.Am J Health Syst Pharm.2004;61:401–404.
- .Overcome clinical inertia to control systolic blood pressure.Arch Intern Med,2003;163:2677–2678.
- ,,,,.Clinical inertia in response to inadequate glycemic control: do specialists differ from primary care physicians?Diabetes Care.2005;28:600–606.
- ,,.Glycemic Control and Sliding Scale Insulin Use in Medical Inpatients With Diabetes Mellitus.Arch Intern Med.1997;157:545–552.
- ,,.Effect of hyperglycemia and continuous intraveneous insulin infusions on outcomes of cardiac surgical procedures: the Portland Diabetic Project.Endocr Pract.2004;10(2):21–33.
- ,,, et al.Plasma glucose at hospital admission and previous metabolic control determine myocardial infarct size and survival in patients with and without type 2 diabetes: the Langendreer Myocardial Infarction and Blood Glucose in Diabetic Patients Assessment (LAMBDA).Diabetes Care.2005;28:2551–2553.
- ,,.Admission hyperglycemia as a prognostic indicator in trauma.J Trauma Inj Infect Crit Care.2003;55(1):33–38.
- ,,, et al.Intraoperative hyperglycemia and perioperative outcomes in cardiac surgery patients.Mayo Clin Proc.2005;80:862–866.
- ,,,,.Efficacy of sliding‐scale insulin therapy: a comparison with prospective regimens.Fam Pract Res J.1994;14:313–22.
- ,,, et al.Management of inpatient hyperglycemia: assessing perceptions and barriers to care among resident physicians.Endocr Pract., to appear.
- ,,,,.Diabetes‐related hospitalization and hospital utilization. In:Diabetes in America.Bethesda, MD:National Institutes of Diabetes and Digestive Diseases;1995:553–563.
- ,,, et al.Hospital discharge records under‐report the prevalence of diabetes in inpatients.Diabetes Res Clin Pract.2003;59(2):145–151.
Diabetes confers a substantial burden on the hospital system. Diabetes is the fourth‐leading comorbid condition associated with any hospital discharge in the United States1. During 2001, for more than 500,000 patients discharged from U.S. hospitals diabetes was listed as the principal diagnosis and for more than 4 million it was listed as a codiagnosis.2, 3 Nearly one‐third of diabetes patients require at least 2 hospitalizations annually,4 and inpatient stays account for the largest proportion of direct medical expenses incurred by persons with the disease.5
Numerous studies have demonstrated that hyperglycemia is associated with adverse outcomes of hospitalized patients.68 However, studies have also confirmed that attention to lowering glucose levels in the hospital improves patient outcomes.7, 8 Although inpatients with known diabetes will likely constitute the largest and most visible percentage of those who will require treatment for high glucose, the recommendation to control glucose applies to all inpatients regardless of whether they have been diagnosed with diabetes prior to hospitalization or have manifested hyperglycemia only during the hospital stay.79
Now that the relationship between hyperglycemia and hospital outcomes is well established, the task of organizations that deliver care and set policy is to translate current recommendations of good glucose control into real‐world hospital settings. Quality improvement organizations are currently working toward developing and disseminating performance measures for control of inpatient hyperglycemia.10, 11 Although management of hospital hyperglycemia is often perceived as suboptimal,12 actual data are limited and are based on review of small numbers of charts,1315 and information is even sparser on the pharmacologic strategies being used to treat inpatient hyperglycemia. Before educational programs and policies can be developed, individual hospital systems need to gain more insight into how hyperglycemia is being managed in the hospital.
We reported previously the results of a review of a small number of charts (n = 90) of patients hospitalized with diabetes. The findings from this review suggested there was clinical inertia in glycemia management in the hospital.15 Clinical inertia was originally described in relationship to diabetes care in the outpatient setting and was defined as a failure to perform a needed service or make a change in treatment when indicated.16, 17 Since the original description, additional reports have documented the problem of clinical inertia, but these have all been based on experiences in the outpatient setting.1822 To our knowledge, our previous report was the first to question whether clinical inertia occurred in the hospital environment. In addition, we described the negative therapeutic momentuma deintensification of treatment despite ongoing hyperglycemia15. However, our prior study examined only a small number of cases and did not include detailed data on pharmacologic treatment for hyperglycemia. Therefore, we expanded our analysis using an information systems rather than a chart reviewbased methodology to assess the status of hyperglycemia management in our hospital.
METHODS
Setting
Our tertiary‐care academic teaching hospital is a 200‐bed facility in metropolitan Phoenix, Arizona. All adult general medical and surgical specialties are represented, including transplantation services; the hospital also has a level 2 trauma center and an inpatient rehabilitation unit. Care is provided by various types of practitioners, including postgraduate trainees, faculty, physician assistants, and nurse‐practitioners. An electronic medical record links outpatient and inpatient records with laboratory results and pharmacy orders. The core electronic health record system is the Centricity/LastWord platform, provided by GE/IDX. The ancillary core systems, including laboratory and pharmacy, are interfaced with the Centricity system and maintained by on‐site Mayo Clinic information technology professionals.
Case Selection
Patients discharged with an International Classification of Diseases, 9th Revision, Clinical Modification (ICD‐9‐CM) diagnosis code for diabetes (ICD‐9‐CM code 250.xx) or hyperglycemia (ICD‐9‐CM code 790.6) were identified in a search of the hospital's electronic billing records.24 Our facility does not provide obstetric or pediatric services; therefore, corresponding ICD‐9‐CM codes for those populations were not included. Both primary and nonprimary diagnostic fields were searched. Discharges were extracted for the period between January 1, 2001, and December 31, 2004. Data retrieved included patient age, ethnicity/race, length of stay (LOS), and type of hospital service with primary responsibility for the patient's care. For confidentiality reasons, individual patients were not identified, and the unit of analysis was the discharge.
Our analyses focused principally on the noncritically ill, defined as those patients who did not require a stay in our intensive or intermediate care units; critically ill patients were identified based on room location in the data set and excluded. The reasons this study assessed hyperglycemia management in the noncritically ill were 2‐fold. First, the critically ill may migrate in and out of intensive care depending on their health status and thus experience different intensities of glucose management. Second, in our facility the therapeutic approach to hyperglycemia management is different for the critically ill than for the noncritically ill; the critically ill may receive intravenous and/or subcutaneous insulin, whereas subcutaneous insulin therapy only is given to the noncritically ill. Thus, the noncritically ill represent a more clearly defined patient population whose therapies would be easier to evaluate. We also restricted the final analysis to patients who had a LOS of 3 days or less, so that differences in glucose control and insulin therapy between the first and last 24 hours of hospital stay could be assessed.
Data on 30 randomly chosen patients from different years was extracted from electronic records. A spreadsheet of the data was compared against data in our online electronic medical records. The online data were printed, and packets were made of the data for each patient selected for review. The patient demographic information was validated against our registration screen. Inpatient stay was validated to verify a patient was in intensive or intermediate care. The result of each glucose test performed while the patient was in the hospital was printed and the calculations validated. The insulin given while the patient was hospitalized was also printed and reviewed to verify the type of insulin and calculations for the amounts of insulin given.
Assessment of Glycemic Control
After extraction of hospital cases, data were linked via patient identifiers to our electronic laboratory database to retrieve information on glucose values. Glucose data included both blood and bedside measurements. In our institution, bedside glucose monitoring is performed with an instrument that scans and records patient identification, followed by direct downloading to our laboratory database. Commercial software (Medical Automation Systems, Charlottesville, VA) facilitates the interfacing of glucometer data with the electronic laboratory file.
Nearly all hospitalized patients had either bedside glucose (84%) or blood glucose (86%) data available for analysis. However, the mean number of bedside glucose measurements was 3.4 per day, whereas the average number of blood glucose measurements was only 1.0 per day. Because of the greater number of bedside measurements and because practitioners typically make therapeutic decisions about hyperglycemia management on the basis of daily bedside glucose results, these values were used to assess glycemic control of patients in the hospital discharge data.15
To assess glycemic control, we used methods similar to those previously published by ourselves and others.15, 23 We averaged each patient's available bedside glucose measurements to determine the composite average (BedGlucavg). We also computed the average of bedside glucose measurements obtained during the first 24 hours after admission (F24BedGlucavg) and during the last 24 hours before discharge (L24BedGlucavg), then examined the distributions of BedGlucavg, F24BedGlucavg, and L24BedGlucavg. The first 24‐hour period was calculated forward from the recorded time of admission, and the last 24‐hour period was calculated backward from the time of discharge. We calculated the frequency that each patient's bedside measurements showed hypoglycemia (bedside glucose < 70, < 60, < 50, or < 40 mg/dL) and showed hyperglycemia (bedside glucose >2 00, > 250, > 300, > 350, or > 400 mg/dL). Results were recorded as the number of values per 100 measurements per person; this method allowed adjustment for variation in the individual number of measurements and captured information on multiple episodes of hypo‐ or hyperglycemia of individual patients.15, 23
Hyperglycemia Therapy
Links to our inpatient pharmacy database enabled determination of types of pharmacotherapy actually administered to patients to treat hyperglycemia. Our electronic pharmacy records are designed so that intravenous medications (eg, intravenous insulin), scheduled oral and subcutaneous medications (eg, subcutaneous insulin), and medications administered on a one‐time or as‐needed basis (eg, sliding‐scale insulin) are documented electronically as separate categories. In our facility, intravenous insulin is administered only in the intensive care setting or as a component of total parenteral nutrition, and we excluded intravenous insulin use from this data. Thus, our analysis of insulin therapy focused only on elucidating patterns of subcutaneous treatment.
We classified hyperglycemia treatment as no therapy, oral agents only, oral agents plus insulin, and insulin only. Patients were regarded as having received an oral agent or insulin if they were administered the medication at any time during their inpatient stay. For management of hyperglycemia in noncritically ill patients, the use of a programmed basal‐bolus insulin program is advocated rather than the use of only a short‐acting bolus or sliding‐scale regimen.7, 8 Therefore, we further examined the insulin treatment strategies by classifying the type of regimen as basal only (if only an extended‐release preparation was used), as basal bolus (if the therapy consisted of a long‐acting plus a short‐acting formulation), or as bolus only (if the only insulin administered was a short‐acting preparation).
In addition to characterizing the general therapeutic approaches to hyperglycemia, we determined changes in the amount of insulin administered according to the severity of the hyperglycemia. Among patients who received insulin, we compared the average total units of insulin used during the last 24 hours before discharge with the amount administered during the first 24 hours of hospitalization. If more units were used during the last 24 hours than in the first 24 hours, the amount of insulin administered was categorized as having increased; if fewer units were provided during the last 24 hours, then the insulin amount was classified as having decreased; otherwise, no change was considered to have occurred. The BedGlucavg values were divided into 3 intervals using tertile cut points, and the differences in the proportion of patients by each type of insulin treatment regimen and the categories of insulin change were compared across tertiles; differences in proportions were determined using the 2 statistic.
RESULTS
Patient Characteristics
Between January 1, 2001, and December 31, 2004, a total of 7361 patients were discharged from our facility with either a diabetes or a hyperglycemia diagnosis (16% of all discharges); the percentage of discharges associated with these diagnoses increased from 14.9% in 2001 to 16.4% in 2004. Most patients with diabetes or hyperglycemia (5198 or 71%) received care outside the intensive‐ or intermediate‐care setting.
Among the noncritically ill patients whose LOS was at least 3 days (N = 2916), average age was 69 years, and average LOS was 5.7 days. Most of the discharged patients were men (57%), and 90% were white. Most patients were discharged from primary care (45%; general internal medicine or family medicine) or surgical services (34%), with the rest discharged from other specialties (eg, cardiology, transplant medicine). Compared to the noncritically ill, who had an LOS of at least 3 days, those noncritically patients whose LOS was less than 3 days (n = 2282) were slightly younger (mean age 68 versus 69 years, P < .001 by Mann‐Whitney testing) but were comparable in sex and race distribution (P > .07 for both by chi‐square testing).
Glycemic Control
The median duration between admission and time of first bedside glucose measurement was 3.0 hours. Patients had an average of 19 bedside glucose measurements; the overall mean number of bedside measurements was 3.4 per day, 3.7 during the first 24‐hour period, and 3.4 during the last 24 hours of hospitalization. Nearly 25% of patients were hyperglycemic (bedside glucose > 200 mg/dL) during the first 24 hours of hospitalization (Fig. 1A), 20% had persistent hyperglycemia throughout the entire hospitalization (Fig. 1B), and 21% were hyperglycemic during the 24 hours before discharge (Fig. 1C), with some patients discharged with an average bedside glucose of at least 300 mg/dL during the 24 hours before discharge.
The incidence of hypoglycemic episodes was lower than that of hyperglycemic episodes: 21% of patients had at least 1 bedside glucose value less than 70 mg/dL, but 68% had at least 1 value greater than 200 mg/dL. The frequency of hypoglycemic measurements was low (Fig. 2A) compared with the frequency of hyperglycemic episodes (Fig. 2B).
Hyperglycemia Therapy
Most patients (72%) received subcutaneous insulin at some point during their hospital stay; 19% had no therapy, 9% had oral agents only, 26% had oral agents plus insulin, and 46% had insulin only. The proportion receiving no therapy decreased from 32% among patients whose BedGlucavg was in the first tertile to 2% in the third tertile; the percentage of patients taking oral agents only decreased from 18% to 1%; the proportion taking oral agents plus insulin was 17% in the first tertile and 30% in the third; and the proportion of those taking insulin only was 32% in the first tertile and 66% in the third (Fig. 3). Thus, nearly all patients whose BedGlucavg value was in the third tertile received insulin, either as monotherapy or in combination with oral agents.
Among insulin users, 58% received bolus‐only, 42% received basal‐bolus, and 1% received basal‐only injections. Because of the small proportion of basal‐only patients, we conducted analyses only of patients whose insulin treatment fell into 1 of the first 2 categories. The use of a basal‐bolus insulin program increased from 34% in patients whose BedGlucavg was in the first tertile to 54% for those who had BedGlucavg in the third tertile (P < .001; Fig. 4, left). Thus, although there was a greater transition to a more intensive insulin regimen with worsening hyperglycemia, a substantial number of patients (46%) whose BedGlucavg was in the third tertile still did not have their insulin regimen intensified to a basal‐bolus program.
Fifty‐four percent of subcutaneous insulin users (N = 1680) had an increase in the amount of insulin administered between the first and last 24 hours of hospitalization (average increase, 17 U), 39% had a decrease (average decrease, 12 U), and 7% had no change. With rising hyperglycemia, more patients had their insulin increased by the time of discharge; 41% of persons who had BedGlucavg values in the first tertile were on more insulin by the time of discharge, whereas 65% of those who had average glucose values in the third tertile had insulin increased (Fig. 4, right). However, the pattern of changes in the amount of administered insulin was heterogeneous, with increases, decreases, and no change occurring in all tertiles of BedGlucavg (Fig. 3, right). Nearly 31% of patients whose BedGlucavg values were in the third tertile actually had a decrease in insulin. This decrease occurred despite evidence of a low frequency of hypoglycemia (only 1.2 values < 70 mg/dL per 100 measurements per person) and a high frequency of hyperglycemia (55.4 values > 200 mg/dL per person per 100 measurements).
DISCUSSION
The number of diabetes‐associated hospital discharges has been climbing2, 3; our own data indicate an increase in the number of patients with diabetes as a proportion of the total number of discharged patients. A recent consensus advocates good glucose control in the hospital to optimize outcomes,79 and institutions need to begin the process of assessing their quality of inpatient hyperglycemia management as a first step to enhancing care.
There are no guidelines about which method of glucose measurement (ie, blood glucose or bedside glucose) should be used as the quality measure to evaluate glycemic control in hospital patients. Both blood and bedside glucose measurements have been used in outcomes studies.23, 24 We analyzed capillary bedside values measured by a method subjected to ongoing quality control oversight and stored in the electronic laboratory database. Bedside glucose measurements are typically obtained with far greater frequency than blood glucose measurements and therefore provide better insight into daily changes in glycemic control; in practice, clinicians rely on bedside values when assessing hyperglycemia and making therapeutic decisions.
There is also no consensus about what glucose metric should be used to assess the status of glycemic control in the hospital. Some studies have used single glucose values to examine the relationship between hyperglycemia and outcomes,25, 26 whereas others have used values averaged over various lengths of time.24, 27 To evaluate glucose control, we averaged capillary measurements in the first 24 hours of hospitalization (F24BedGlucavg), the last 24 hours of hospitalization (L24BedGlucavg), and for the entire LOS (BedGlucavg), and we calculated the number of documented hyper‐ and hypoglycemic events. The measures we used to examine hyperglycemia would serve as useful benchmarks for following the progress of future institutional interventions directed at glucose control in hospitalized patients at our hospital.
A substantial number of our patients selected for analysis (ie, noncritically ill with LOS 3 days) were found to have sustained hyperglycemia at the beginning, during, and at the end of their hospital stay. We found very few instances of severe hypoglycemia (values < 50 or < 40 mg/dL), and the low frequency of hypoglycemia compared to that of hyperglycemia could encourage practitioners to be more aggressive in treating hyperglycemia. The high frequency of recorded bedside glucose compared with blood glucose measurements ( 3 per day), the ongoing patient surveillance by medical, nursing, and other staff members, and our institution's written hypoglycemia policy most likely minimize the number of unobserved, undocumented, or untreated hypoglycemic episodes. There are no data or recommendations about what would be an acceptable number of hypoglycemic episodes in the hospital.
Very little is known about the therapeutic strategies being applied to hyperglycemia in the hospital. Our data show that subcutaneous insulin (either alone or in combination with oral agents) was used at some point during hospitalization for nearly three‐fourths of noncritically patients who were in the hospital for 3 days or longer. Moreover, as hyperglycemia worsened, use of oral hypoglycemic agents declined, there was a shift toward greater use of a scheduled basal‐bolus insulin program, and a greater proportion of patients had more insulin administered.
Although these latter findings are encouraging and suggest that practitioners are responding to the severity of hyperglycemia, further examination of the data suggests that a substantial number of patients in the highest glucose tertile did not have insulin therapy intensified. Nearly half our patients whose glucose values were in the highest tertile were treated with short‐acting insulin aloneprobably an ineffective regimen23, 28or did not have more insulin administered. The higher doses administered were not likely solely a result of using more sliding‐scale insulin, as previous investigators actually found no correlation between intensity of the sliding scale and total daily insulin dose.14 Although evidence here is circumstantial (we did not examine changes in provider orders in response to glucose levels), these findings, together with those in our previous study15 and in another study,14 provide indirect evidence of clinical inertia in the hospital.
Beyond clinical inertia, however, there was evidence of negative therapeutic momentum: nearly one‐third of patients whose glucose was in the highest tertile had insulin decreased rather than increased, despite the low frequency of hypoglycemia and the high frequency of hyperglycemia. It is likely that even a single episode of hypoglycemia concerned practitioners, but the clinical response in these situations should be to investigate and correct the circumstances leading to the hypoglycemia, rather than to necessarily deintensify therapy in the face of continued hyperglycemia. The analysis of this larger data set corroborated our observations of clinical inertia and negative therapeutic momentum from an earlier study of chart reviews of a smaller patient sample.15
The variable application of insulin therapy to the treatment of hyperglycemia may be an indication of the level of comfort practitioners have about using this pharmacologic agent. A recently completed survey of resident physicians at our institution indicated that understanding how to use insulin was the most common barrier to successful management of inpatient hyperglycemia.29 These observations reinforce the need for institutions to develop standardized insulin order sets and develop programs to educate the staff on the use of insulin.
This study differs from our original analysis based on chart review in 4 ways. First, the sample size in our first study (n = 90) was small and derived from discharges from a single year (2003), whereas the sample in the present study spanned several years and included several thousand cases. Second, in our prior study we did not have detailed pharmacologic data on glucose management and how treatment approaches varied relative to severity of hyperglycemia. In general, there is very limited data on what therapeutic strategies are being applied to inpatient hyperglycemia, and this analysis of a large sample of cases provides more insight into how practitioners are managing glucose.
Third, we wanted to corroborate observations made in our previous report using a different methodologyin this instance, adapting existing information systems to assessment of inpatient diabetes care. For example, our last study was based on a limited number of glucose observations but suggested that the prevalence of hypoglycemia in our hospital was low compared with that of hyperglycemia; the present analysis of a very large number of glucose values confirmed these initial findings. In addition, use of information systems versus a chart review approach to assessing inpatient diabetes care corroborates our earlier suspicions about the presence of clinical inertia and negative therapeutic momentum in glucose management.
Fourth and finally, this study gave us experience with use of electronic records as a means to assess the status of inpatient diabetes care. Electronic data sources will likely be common tools to monitor quality of inpatient diabetes care and will likely figure prominently in future accreditation processes.10, 11 Unlike chart abstraction, which would require extensive man‐hours to extract data on few patients, use of electronic records allows examination of large numbers of hospital cases. Queries of information systems could be automated, and report cards potentially generated and feedback given to providers on the status of inpatient glycemic control. The industry is actively pursuing software development to assist hospitals in assessing the quality of inpatient glycemic control (eg, RALS‐TGCM, available at
However, there are also limitations to using electronic records as the sole method of assessing inpatient diabetes care. For instance, retrospective review of electronic records does not allow assessment of reasons underlying decision‐making behavior of clinicians (eg, why they did or did not change therapy). Diabetes and hyperglycemia associated hospitalizations must be identified by discharge diagnosis codes, so some cases of diabetes and hyperglycemia were likely missed.30, 31 Recent guidelines propose preprandial targets for glucose in the hospital.8 It is not easy to determine from an electronic data source which is a preprandial bedside glucose and which is a postprandial bedside glucose. Pre‐ and postpyramidal glucose categories would be difficult to define even during prospective studies, given the varying nature of nutritional support (ie, enteral, parenteral) used in the hospital and the administration of continuous dextrose infusions. Some type of quality control, such as conducting reviews of small samples of randomly selected charts to see how they compare with the electronic data, will need to be conducted.
From electronic discharge data, we cannot establish who had preexisting diabetes, who was admitted with new‐onset diabetes, and who developed hyperglycemia as a result of the hospital stay. Our previous random chart review15 indicated it is likely that most (more than 90%) had an established diagnosis of diabetes before admission. However, the recommendation to treat hyperglycemia should apply to all patients regardless of whether they had diagnosed diabetes prior to hospitalization or manifested hyperglycemia only during the hospital stay.79
As hospitals move toward making efforts to improve performance related to treating inpatient hyperglycemia, they must be cognizant of the heterogeneity of the inpatient population and the challenges to managing hospital hyperglycemia before drawing conclusions about their management. Inpatients with hyperglycemia are a diverse group, comprising patients with preexisting diabetes, with previously undiagnosed diabetes, and stress‐caused hyperglycemia. The unpredictable timing of procedures, various and changing forms of nutritional support, and different levels of staff expertise all contribute to the challenges of managing inpatient hyperglycemia. Inpatient practitioners may be forced to attempt glycemic control catch‐up for hospitalized persons who had poor outpatient glucose control. Patients who have required a stay in the intensive care unit may have very different glycemic outcomes than those who have not. Patients whose LOS was short (< 3days) may have different glycemic outcomes than persons whose LOS was longer ( 3 days as defined here) because of the length of time practitioners have to work to control their hyperglycemia. These and other variables may have to be taken into account when developing and assessing the impact of interventions.
Despite these limitations, our analysis was helpful in providing direction for enhancing the care of hospitalized patients with hyperglycemia in our facility. For instance, our generalists and surgeons are the principal caretakers of noncritically ill patients with diabetes, and these practitioners could be targeted for the first continuing educational programs about inpatient care of hyperglycemia. In addition, institutional guidelines on when and how to initiate and change therapyparticularly insulincan be designed so that hyperglycemia in noncritically ill hospital patients can be managed more effectively. These and other ongoing educational initiatives are necessary to ensure delivery of the highest quality of inpatient glucose care.
- ,,,.Hospitalization in the United States,1997.Rockville, MD:Agency for Healthcare Research and Quality;2000. Report No.: HCUP Fact Book No. 1; AHRQ Publication No. 00‐0031.
- Hospitalization for Diabetes as First‐Listed Diagnosis. Available at: http://www.cdc.gov/diabetes/statistics/dmfirst/index.htm. Accessed November 29,2006.
- Hospitalizations for Diabetes as Any‐Listed Diagnosis. Available at: http://www.cdc.gov/diabetes/statistics/dmany/index.htm. Accessed November 29,2006,
- ,,,.Multiple hospitalizations for patients with diabetes.Diabetes Care.2003;26:1421–1426.
- ,,.Economic costs of diabetes in the US in 2002.Diabetes Care.2003;26:917–932.
- ,,.Inpatient diabetology. The new frontier.J Gen Intern Med.2004;19:466–471.
- ,,, et al.American Diabetes Association Diabetes in Hospitals Writing Committee: Management of diabetes and hyperglycemia in hospitals.Diabetes Care.2004;27:553–591.
- ACE Task Force on Inpatient Diabetes and Metabolic Control.American College of Endocrinology position statement on inpatient diabetes and metabolic control.Endocr Pract,2004;10:77–82.
- ACE/ADA Task Force on Inpatient Diabetes.American College of Endocrinology and American Diabetes Association consensus statement on inpatient diabetes and glycemic control.Endocr Pract.2006;12:459–468.
- Getting started kit: prevent surgical site infections.2006 Available at: www.ihi.org/NR/rdonlyres/00EBAF1F‐A29F‐4822‐ABCE‐829573255AB8/0/SSIHowtoGuideFINAL.pdf. Accessed November 29,year="2006"2006.
- Joint Commission on Accreditation of Healthcare Organizations. American Diabetes Association and Joint Commission Collaborate on Joint Commission Inpatient Diabetes Care Certification.2006. Available at: http://www.jointcommission.org/NewsRoom/NewsReleases/jc_nr_072006.htm. Accessed November 29,year="2006"2006,
- ,.Glycemic chaos (not glycemic control) still the rule for inpatient care: How do we stop the insanity?J Hosp Med.2006;1:141–144.
- ,,,,.Unrecognized diabetes among hospitalized patients.Diabetes Care.1998;21(2):246–249.
- ,,,,.Inpatient management of diabetes and hyperglycemia among general medicine patients at a large teaching hospital.J Hosp Med.2006;1(3):145–150.
- ,,, et al.Diabetes care in the non‐ICU setting: is there clinical inertia in the hospital?J Hosp Med,2006;1(3):151–160.
- ,,, et al.Diabetes in urban African‐Americans. XVI. Overcoming clinical inertia improves glycemic control in patients with type 2 diabetes.Diabetes Care.1999;22:1494–500.
- ,,, et al.Clinical Inertia.Ann Intern Med.2001;135:825–834.
- ,,,Team UHCUDBP.Quality of diabetes care in U.S. academic medical centers: low rates of medical regimen change.Diabetes Care.2005;28:337–442.
- ,,, et al.Clinical inertia in the management of type 2 diabetes metabolic risk factors.Diabet Med,2004;21:150–155.
- ,.Clinical inertia: errors of omission in drug therapy.Am J Health Syst Pharm.2004;61:401–404.
- .Overcome clinical inertia to control systolic blood pressure.Arch Intern Med,2003;163:2677–2678.
- ,,,,.Clinical inertia in response to inadequate glycemic control: do specialists differ from primary care physicians?Diabetes Care.2005;28:600–606.
- ,,.Glycemic Control and Sliding Scale Insulin Use in Medical Inpatients With Diabetes Mellitus.Arch Intern Med.1997;157:545–552.
- ,,.Effect of hyperglycemia and continuous intraveneous insulin infusions on outcomes of cardiac surgical procedures: the Portland Diabetic Project.Endocr Pract.2004;10(2):21–33.
- ,,, et al.Plasma glucose at hospital admission and previous metabolic control determine myocardial infarct size and survival in patients with and without type 2 diabetes: the Langendreer Myocardial Infarction and Blood Glucose in Diabetic Patients Assessment (LAMBDA).Diabetes Care.2005;28:2551–2553.
- ,,.Admission hyperglycemia as a prognostic indicator in trauma.J Trauma Inj Infect Crit Care.2003;55(1):33–38.
- ,,, et al.Intraoperative hyperglycemia and perioperative outcomes in cardiac surgery patients.Mayo Clin Proc.2005;80:862–866.
- ,,,,.Efficacy of sliding‐scale insulin therapy: a comparison with prospective regimens.Fam Pract Res J.1994;14:313–22.
- ,,, et al.Management of inpatient hyperglycemia: assessing perceptions and barriers to care among resident physicians.Endocr Pract., to appear.
- ,,,,.Diabetes‐related hospitalization and hospital utilization. In:Diabetes in America.Bethesda, MD:National Institutes of Diabetes and Digestive Diseases;1995:553–563.
- ,,, et al.Hospital discharge records under‐report the prevalence of diabetes in inpatients.Diabetes Res Clin Pract.2003;59(2):145–151.
Copyright © 2007 Society of Hospital Medicine

A Lame Doc

This is my last issue as physician editor of The Hospitalist. It has certainly been an interesting and rewarding two years. It has been an exceptional experience working with Lisa Dionne, Wiley, and SHM.
I look forward to the changes my worthy successor Jeff Glasheen, MD, will put into place. As I approach the end of my tenure, I can glimpse the light at the end of the tunnel.
I have a sense of déjà vu. I have a sense of déjà vu. I know the feeling well. I’ve noted it on the last day on a rotation, the last hour on a shift; I even remember it from the last month of residency. All of these were periods of transition, variations on the well known theme of “senior-itis.” A colleague, a one-year hospitalist named Jeremy Cetnar who is off to greener oncologic pastures, suggested his final few weeks on service were like being a lame duck president; a combination of temporizing and survival.
What is a lame duck beside the punch line for a corny joke? The term may have originated in the London stock exchange in the mid-18th century. When settlement day came, and a member was unable to meet his debt, he “waddled” out of Exchange Alley. From an avian standpoint one could also be a rook (a type of crow), which was a swindler. That was better then being a dove, which was the rook’s prey (hence the saying “They got rooked”).
Perhaps better to be a mammal like a bull or a bear, than a lame duck. Lame ducks are also seen in entertainment. There is a Finnish rock band and a Norwegian ska punk band by that name. The lame duck is also a well-known tango position, but my orthopedist has forbidden me from demonstrating.
The 20th Amendment (the big XX) is called the lame duck amendment. It comes right after XIX, also known as the “No shoes, no shirt, no service” amendment. (Actually XIX is “The right of the citizens of the U.S. to vote shall not be denied or abridged on account of sex”—a biggie for sure).
Amendment XX was established in 1933 to reduce the time between the election of the president and Congress and the beginning of their terms. Having a delayed inauguration could lead to problems, as in the case of Abraham Lincoln: The Confederate States seceded before he could be sworn into office.
It is never easy to sit in office as a lame duck, whether a senator, congressman, or president. As a president, the current two-term limit creates the lame duck situation more frequently. Prior to the inception of this limit, there was always the possibility of running for a third term to add spice to those last years in office. The first Roosevelt to run for a third term was Teddy, running as a “Bull Moose.” He lost his bid to Woodrow Wilson in 1912. After FDR, there would be no more two-term-plus presidents.
There have been five lame ducks since the amendment was passed: Eisenhower, Nixon, Reagan, Clinton, and our current lame president, Bush. The last two years of the second term can be hard. For Eisenhower and Reagan their prestige and public admiration carried them through. Nixon and Clinton were significantly less lucky in this regard. How the current resident of 1600 Pennsylvania Ave. finishes his term will be of great interest to historians—and to those of us who live through it.
“How does this have anything to do with hospital medicine?” you may ask yourself, as the readers of this column frequently query.
As a resident, the last few months were never ending. The predominant sensation was being ready to move on. If it’s the last day on service after a long run, and a patient gets admitted, I still sometimes have to fight that feeling. There are unanswered questions, tests to be ordered, labs pending, but still you know that when those results come back, it won’t be you who interprets them. It creates a disconnect that is hard to avoid.
For a one-year hospitalist, spending a year on service as filler between residency and fellowship, this is a huge issue. As the transitional hospitalist nears the end, how can he or she stay involved in decision-making and maintain interest in the workings and improvement of the group? Transitional hospitalists are an important resource in many academic centers, and making their entire year a success is of paramount importance to the patients they serve.
The best recommendation I can make is to make sure one-year hospitalists are not on service their last two weeks. Let them save their vacation time and non-service time until the end, when they really need it for the transition to the next phase in their lives. This also helps avoid the creation of a malcontent and the potential for substandard care by a disengaged provider.
As physician editor—aka Grand Kahuna—of The Hospitalist, I have felt that sensation of being ready to hand over the reins. I am ready for my senescence. Nonetheless, it has been a great two years. We have covered stories from all over the world—Iraq, Afghanistan, Holland, and Brazil. We have explored medical history from ancient Greece to colonial America. We have even looked at maggot debridement. Oh, and also some hospitalist stuff.
I can’t wait to see what The Hospitalist will look like in the years to come. As the great poet-physician Oliver Wendell Holmes Sr. observed, “The great thing in the world is not so much where we stand, as in what direction we are moving.” TH
Dr. Newman served as physician editor of The Hospitalist since 2005. He’s also consultant, Hospital Internal Medicine, and assistant professor of internal medicine and medical history, Mayo Clinic College of Medicine, Rochester, Minn.
Promote Proper CPT Coding

Code nearly all visits at the highest level” was the entire orientation I got to CPT coding when I first started practice as a hospitalist in the 1980s.
I couldn’t believe this advice, which came from another physician, was sound—and it isn’t. So I tried to learn a little more about the subject on my own. After a year or so of somewhat futile self-education in coding, I decided I could never learn the very confusing rules and chose to do nearly the opposite of the “code all visits high” strategy: I coded nearly all visits at very low levels.
While some hospitalists are experts at proper CPT coding, I think a lot (the majority?) feel uneasy and do what I tended to do years ago: They “downcode” many visits, believing this will provide a margin of safety against being audited and accused of “upcoding.” The problem with this approach is that it can cost your practice significant professional fee revenue. And according to the letter of the law, downcoding is just as illegal as upcoding. (Though I haven’t seen any newspaper headlines about Medicare creating teams of auditors to stamp out illegal downcoding.)
Strategies to Improve
If you’re like many hospitalists and feel uneasy about how accurately you’re choosing CPT codes, I have a few suggestions.
First, SHM has a new course on CPT coding designed specifically for hospitalists. The next meetings are Oct. 3 in San Francisco and April 3, 2008, in San Diego as a precourse to SHM’s Annual Meeting 2008. The previous versions of the course have received high praise.
There are also a number of strategies your hospitalist group can use to help ensure proper coding stays on each doctor’s mind. Some organizations have an internal coding expert who might regularly review each doctor’s coding and provide education to address problem areas. Whether you have such an internal expert or not, you should probably have an annual audit by an external certified coder—someone who has no financial connection to your institution.
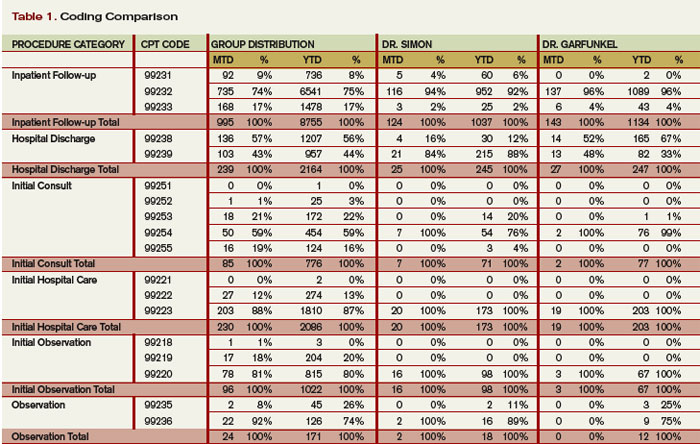
In addition to external resources, I think every group should create a monthly or quarterly report that allows each doctor to see his or her own pattern of coding compared with that of everyone else in the group. This will be most valuable if everyone’s name remains visible to everyone else. It should then be easy for me to tell that I code discharges at the low level far more often than the group average. I should be able to see that my partner Jane codes half of initial consult visits at the highest level and I code most of them much lower.
It would be unusual that this information would lead to strife and dissent within the group. If it does, you probably have significant cultural and interpersonal problems within your group. It will usually lead to the doctors talking about their patterns of documenting and coding among themselves—which goes a long way to keep the issue on everyone’s mind.
One format for such a report is on p. 61. CPT codes are grouped by category on the left side. The next set of columns is labeled “group distribution” and shows the month-to-date (MTD) and running 12-month (YTD) distribution of codes for all doctors in the group. Specific data for two doctors in the group is to the right of the group distribution. Note that there are more than 10 doctors in this hypothetical group, but I have shown only two of them because of space limitations.
When reviewing this table, Dr. Simon may get a little uncomfortable because she codes only 2% of follow-up visits at the highest level, but the group as a whole uses the highest code 17% of the time. And, she codes 88% of discharges at the high level, compared with 44% for the group as a whole. She is also out of step with her partners in highest initial consult and the middle initial observation codes. This information will probably make her receptive to peer-to-peer learning from her partners and may motivate her to review some of the coding rules.
Dr. Simon and Dr. Garfunkel are out of step with the group in how often they use the code for the middle level initial observation visit. This group needs to investigate whether these two doctors are coding these visits correctly, and everyone else is in error, or vice versa.
It is important to point out that the goal of the report isn’t to get each doctor to simply mirror the distribution of the group’s overall coding pattern. There might be cases in which the outlier doctor is coding correctly and everyone else is wrong. So the group average can’t be accepted as correct, and any significant discrepancies between one or two doctors and the group as a whole should be reviewed and discussed.
While a coding comparison table like this isn’t enough to ensure proper coding, it is a useful tool for highlighting the areas most in need of attention. I know of cases in which hospitalists who practiced together for several years had no idea their coding patterns were so dramatically different until they created a report like this. TH
Dr. Nelson has been a practicing hospitalist since 1988 and is co-founder and past president of SHM. He is a principal in Nelson/Flores Associates, a national hospitalist practice management consulting firm. This column represents his views and is not intended to reflect an official position of SHM.
Code nearly all visits at the highest level” was the entire orientation I got to CPT coding when I first started practice as a hospitalist in the 1980s.
I couldn’t believe this advice, which came from another physician, was sound—and it isn’t. So I tried to learn a little more about the subject on my own. After a year or so of somewhat futile self-education in coding, I decided I could never learn the very confusing rules and chose to do nearly the opposite of the “code all visits high” strategy: I coded nearly all visits at very low levels.
While some hospitalists are experts at proper CPT coding, I think a lot (the majority?) feel uneasy and do what I tended to do years ago: They “downcode” many visits, believing this will provide a margin of safety against being audited and accused of “upcoding.” The problem with this approach is that it can cost your practice significant professional fee revenue. And according to the letter of the law, downcoding is just as illegal as upcoding. (Though I haven’t seen any newspaper headlines about Medicare creating teams of auditors to stamp out illegal downcoding.)
Strategies to Improve
If you’re like many hospitalists and feel uneasy about how accurately you’re choosing CPT codes, I have a few suggestions.
First, SHM has a new course on CPT coding designed specifically for hospitalists. The next meetings are Oct. 3 in San Francisco and April 3, 2008, in San Diego as a precourse to SHM’s Annual Meeting 2008. The previous versions of the course have received high praise.
There are also a number of strategies your hospitalist group can use to help ensure proper coding stays on each doctor’s mind. Some organizations have an internal coding expert who might regularly review each doctor’s coding and provide education to address problem areas. Whether you have such an internal expert or not, you should probably have an annual audit by an external certified coder—someone who has no financial connection to your institution.
In addition to external resources, I think every group should create a monthly or quarterly report that allows each doctor to see his or her own pattern of coding compared with that of everyone else in the group. This will be most valuable if everyone’s name remains visible to everyone else. It should then be easy for me to tell that I code discharges at the low level far more often than the group average. I should be able to see that my partner Jane codes half of initial consult visits at the highest level and I code most of them much lower.
It would be unusual that this information would lead to strife and dissent within the group. If it does, you probably have significant cultural and interpersonal problems within your group. It will usually lead to the doctors talking about their patterns of documenting and coding among themselves—which goes a long way to keep the issue on everyone’s mind.
One format for such a report is on p. 61. CPT codes are grouped by category on the left side. The next set of columns is labeled “group distribution” and shows the month-to-date (MTD) and running 12-month (YTD) distribution of codes for all doctors in the group. Specific data for two doctors in the group is to the right of the group distribution. Note that there are more than 10 doctors in this hypothetical group, but I have shown only two of them because of space limitations.
When reviewing this table, Dr. Simon may get a little uncomfortable because she codes only 2% of follow-up visits at the highest level, but the group as a whole uses the highest code 17% of the time. And, she codes 88% of discharges at the high level, compared with 44% for the group as a whole. She is also out of step with her partners in highest initial consult and the middle initial observation codes. This information will probably make her receptive to peer-to-peer learning from her partners and may motivate her to review some of the coding rules.
Dr. Simon and Dr. Garfunkel are out of step with the group in how often they use the code for the middle level initial observation visit. This group needs to investigate whether these two doctors are coding these visits correctly, and everyone else is in error, or vice versa.
It is important to point out that the goal of the report isn’t to get each doctor to simply mirror the distribution of the group’s overall coding pattern. There might be cases in which the outlier doctor is coding correctly and everyone else is wrong. So the group average can’t be accepted as correct, and any significant discrepancies between one or two doctors and the group as a whole should be reviewed and discussed.
While a coding comparison table like this isn’t enough to ensure proper coding, it is a useful tool for highlighting the areas most in need of attention. I know of cases in which hospitalists who practiced together for several years had no idea their coding patterns were so dramatically different until they created a report like this. TH
Dr. Nelson has been a practicing hospitalist since 1988 and is co-founder and past president of SHM. He is a principal in Nelson/Flores Associates, a national hospitalist practice management consulting firm. This column represents his views and is not intended to reflect an official position of SHM.
In the Literature

Retrospective Study of Symptoms in Post-Discharge Patients
Epstein K, Juarez E, Loya K, et al. Frequency of new or worsening symptoms in the posthospitalization period. J Hosp Med. March/April 2007;2(2):58-68.
As hospital stays shorten and acuity rises, patients often are discharged with complex instructions and discharge plans including home health services, physical therapy, hospice service, antibiotic infusions, and follow-up appointments. The potential for new or progressive symptoms in the days following discharge is an important parameter in assessing whether our planning is safe and effective.
The researchers in this study investigated the post-discharge period using a retrospective analysis of new or worsening symptoms within two to five days of hospital discharge among 15,767 patients surveyed between May 1 and Oct. 31, 2003. Patients were all under the care of hospitalists employed by IPC, a large private hospitalist group based in North Hollywood, Calif. Total discharges from which this cohort was selected numbered 48,236.
Staff with medical backgrounds conducted a scripted survey by phone. Licensed nursing personnel contacted those patients whose answers to initial questions suggested they were at high risk for postdischarge complications. A five-point Likert scale was used so patients could rate their overall health status in addition to specific symptomatology ranging from abdominal pain to bleeding. Other questions targeted pick-up and administration of prescribed medications, insulin regimen adherence, and implementation of home health services.
Among all patients discharged, 32.7% were contacted within two days of discharge. The mean age was 60.1 years, and 57% were female. Ethnicity and socioeconomic status were not reported. Medicare and HMOs were the most common type of insurance. Of the 15,767 patients contacted, 11.9% reported symptoms that were new or worsening since discharge; of this subgroup, 64% had new symptoms whereas 36% had “worse” symptoms.
Women were more likely than men to report new or worsening symptoms, and patients who rated themselves as having a poor health status were more likely to have new or worsening symptoms. Younger patients were less likely to report new or worsening symptoms, particularly younger men. Those with new or worse symptoms were slightly more likely to have made a follow-up appointment but also more likely to have a problem with their medications. Interestingly, there was no correlation between self-rated health status and reported severity of illness based on the diagnosis related group (DRG) score. Patients discharged with a DRG of chest pain were less likely to report symptoms than all other patients.
The authors acknowledge the low response rate (32.7%) relative to the 48,236 discharges during the study period. Logistic challenges, resource limitations, and erroneous contact information precluded successful contact for the remainder of patients. The magnitude of this exclusion effect essentially precludes statistically valid extrapolation to the inception cohort (all discharges). For example, in a sensitivity analysis where all the excluded patients are assumed to have developed new or worsening symptoms, the actual rate overall would have been 71%. If none developed new or worsening symptoms, that rate would be 3.8%. The rate for the inception cohort may or may not approximate the 11.9% found among the studied patients. There is insufficient evidence to determine whether the studied cohort reflects the entire population of discharged patients.
To their credit, no such analysis or interpretation is claimed or intended by the authors, and the information derived from the included cohort nonetheless provides interesting and important descriptive data.
Ethnicity and cultural factors were not taken into consideration. One might postulate that language barriers could affect compliance and symptom reporting. Day-of-the-week and holiday status also were not reported with regard to discharge. It would be interesting and useful to know whether access to pharmacy and other resources varied in this regard and whether symptom reporting was affected by such timing.
In the final analysis, this study suggests hospitalists remain alert to possible problems that might develop during the vulnerable first few days following discharge. It reminds us to advise patients how to receive prompt and knowledgeable medical advice from someone familiar with their hospital care prior to their first scheduled follow-up.
Based on the reported rate of new or worsening symptoms, should a post-discharge clinic be part of hospitalists’ scope of practice, at least for selected patients? Can subsets of patients who would benefit most from such intervention be identified? These and many more questions are raised by this study. We look forward to further research into the best process for ensuring optimal outcomes in the immediate post-discharge period.
Rosiglitazone’s Effect on MI Risk in Diabetes Patients
Nissen SE, Wolski K. Effect of rosiglitazone on the risk of myocardial infarction and death from cardiovascular causes. N Engl J Med. 2007 June 14;356(24):2457-2471.
Cardiovascular causes account for more than 65% of deaths in diabetic patients. Rosiglitazone—a thiazolidinedione-class drug—has been broadly used in diabetes, but its effect on cardiovascular morbidity and mortality has not been conclusively determined. The authors initiated this meta-analysis to determine the effect of rosiglitazone on the risk of myocardial infarction (MI) and death from cardiovascular causes in diabetics.
The meta-analysis included 42 trials from three data sources. Forty trials were obtained from the Food and Drug Administration (FDA) Web site and the GlaxoSmithKline clinical trials registry. The third data source comprised two recent large, well-known trials: the Diabetes Reduction Assessment with Ramipril and Rosiglitazone Medication (DREAM) and the A Diabetes Outcome Prevention Trial (ADOPT).1-2 The authors’ inclusion criteria were a study with a duration of more than 24 weeks, the use of a randomized control group not receiving rosiglitazone (placebo or comparator drug), and the availability of outcome data for MI and death from cardiovascular causes.
The studies included 15,560 patients randomly assigned to regimens that included rosiglitazone and 12,283 patients to comparator groups that did not include rosiglitazone.
The authors reviewed the data summaries of the 42 trials and tabulated adverse events (not reported as outcomes) of MI and death from cardiovascular causes. Hazard ratios could not be calculated since time-to-event data were lacking. Summary data also precluded the ability to determine whether the same patient suffered both an MI and death from cardiovascular causes.
Results of the authors’ statistical analyses included odds ratios and 95% confidence intervals to assess the risk associated with the rosiglitazone group as well as the subgroups of metformin, sulfonylurea, insulin, and placebo versus rosiglitazone.
The authors tabulated 86 MIs and 39 unadjudicated deaths from cardiovascular causes in the rosiglitazone group, and 72 MIs plus 22 deaths from cardiovascular causes in the control group.
The main conclusion was that rosiglitazone was associated with a statistically significant increase in the risk of MI (odds ratio 1.43, 95% confidence interval 1.03 to 1.98, p=0.03), but was not associated with a statistically significant increase in the risk of death from cardiovascular causes (odds ratio 1.64, 95% confidence interval 0.98 to 2.74, p=0.06).
Additionally, there were no statistical differences between rosiglitazone versus placebo or the individual antidiabetics in the subanalyses.
The authors have recognized the following major limitations in this meta-analysis:
- The low rate of MI is 0.55% (86 of 15,560 cases) in the rosiglitazone group and 0.59% (72 of 12,283 cases) in the control group. The odds ratio of 1.43 was statistically significant in the rosiglitazone group, although the event rate was higher in the control group. The risk of cardiovascular death was not significant, though a trend toward a higher death rate is noted;
- The lack of source data did not allow the use of time event analysis including hazard ratios;
- The definition of MI was unavailable; and
- MI and cardiovascular events were recorded in the trials as adverse events, not outcomes. Therefore, deaths from the latter were unadjudicated.
The authors suggested that the potential mechanism for increased MI in the rosiglitazone group could be its known effects on increasing low-density lipoproteins (LDL), precipitating congestive heart failure and reducing hemoglobin levels.
Rosiglitazone is one of two peroxisome proliferation activated receptor y (PPAR-y) agonists licensed for use in the United States; the other is pioglitazone. The third drug was troglitazone; it was taken off the market in March of 2000 due to hepatotoxicity.
The PPAR-y agonists decrease plasma glycemia by increasing insulin sensitivity in the peripheral tissues. These drugs have complex physiologic effects in activating and suppressing multiple genes, with most target genes being unknown. The observed side effects with rosiglitazone are not necessarily a class effect. Pioglitazone showed a trend toward reducing triglycerides and cardiovascular events, including MI and CVA, in a prospective, randomized trial called Prospective Pioglitazone Clinical Trial in Macrovascular Events (PROACTIVE).
This meta-analysis precipitated an interim analysis of the ongoing Rosiglitazone Evaluated for Cardiovascular Outcomes and Regulation of Glycemia in Diabetes (RECORD) trial.3 The RECORD trial is a randomized, open-label, multicenter, non-inferiority trial of 4,427 patients; 2,220 received add-on rosiglitazone, and 2,227 received a combination of metformin plus sulfonylurea (control group). The primary end point was hospitalization or death from cardiovascular causes. Interim findings were inconclusive for the rosiglitazone group. There was also no evidence of any increase in death from cardiovascular causes or all causes. However, rosiglitazone was found to be associated with an increased risk of congestive heart failure. The data were insufficient to determine whether the drug was associated with increased MI risk.
This important meta-analysis raises concerns about the association of rosiglitazone with cardiovascular events—but do not consider it definitive. For now, patients with comparable alternatives to rosiglitazone (indeed all patients on this medication) should be advised of the undetermined safety concerns. For those who consider rosiglitazone a compelling choice, abrupt discontinuation on the basis of this study may be premature.
Finally, we need to remain cognizant of the proven negative side effects of rosiglitazone—it increases fracture risks in women, precipitates congestive heart failure, increases LDL, and decreases hemoglobin levels. We should consider alternative anti-hyperglycemic agents in selected patients at risk until there are solid data from large randomized control trials with rosiglitazone that pre-empt its use altogether.
References
- Gerstein HC, Yusuf S, Bosch J, et al. Effect of rosiglitazone on the frequency of diabetes in patients with impaired glucose tolerance or impaired fasting glucose: a randomized controlled trial. Lancet 2006 Sep 23; 368(9547):1096-1105.
- Kahn SE, Haffner SM, Heise MA, et al; ADOPT Study Group. Glycemic durability of rosiglitazone, metformin, or glyburide monotherapy. N Engl J Med. 2006 Dec 7;355(23):2427-2443.
- Home PD, Pocock SJ, Beck-Nielsen H, et al. Rosiglitazone evaluated for cardiac outcomes and regulation of glycemia in diabetes (RECORD): study design and protocol. Diabetologia. 2005;48:1726-1735.
Statins and Sepsis in Dialysis Patients
Gupta R, Plantinga LC, Fink NE, et al. Statin use and hospitalization for sepsis in patients with chronic kidney disease. JAMA. 2007 Apr 4;297(13):1455-1464.
Epidemiological data has revealed an increase in the rate of sepsis in the U.S. during the past two decades.1 In individuals with chronic kidney disease who are on dialysis, sepsis is a significant cause of morbidity and mortality. Various studies have looked at risk factors associated with septicemia in patients with chronic kidney disease; however, no preventive treatments have been identified.
Recent research has shown the use of statins has been associated with a decreased rate of sepsis and improved sepsis outcomes. The authors of this study investigated whether statin use may help reduce the incidence of sepsis in patients with chronic kidney disease on dialysis.
This prospective cohort study enrolled 1,041 participants attending dialysis clinics from October 1995 to June 1998, with a follow-up through Jan. 1, 2005. Statin use at baseline was determined by review of medical records. The primary outcome was hospitalization for sepsis, indicated by hospital data from the U.S. Renal Data System (mean follow-up 3.4 years).
The association of statin use and sepsis was assessed using two analyses. A multivariate regression analysis was performed on the entire cohort, and adjustments were made for potential confounders. An analysis was performed on a sub-cohort comparing sepsis rates in statin users with a control group identified through the likelihood of having been prescribed a statin (propensity matching).
There were 303 hospitalizations for sepsis among the 1,041 patients enrolled, with 14% of participants receiving a statin at baseline. The crude incidence rate of sepsis was 41/1,000 patient-years among statin users compared with 110/1,000 patient-years in the control group (p<0.001). The fully adjusted incidence ratio for sepsis among statin users versus nonusers was 0.38, or 62% lower among statin users.
In the propensity-matched subcohort group, there were 54 hospitalizations during follow-up. The relative risk of sepsis was 0.24 (95% confidence interval, 0.11-0.49) for statin users compared with nonusers.
A strong and independent association exists between statin use and reduced incidence of sepsis in chronic kidney disease patients. This association remained statistically significant after controlling for potential confounding. Why the statins might have this effect is not definitively known.
This national study further demonstrates the potential protective effect of statins on the occurrence of sepsis, which has been observed in previous research in a non-renal population. The author mentions that this is the first study to show a strong and significant effect of a medication administered long term on lower rates of sepsis among patients with chronic kidney disease.
Because this is an observational study, it is limited due to lack of randomization. As such, this study cannot prove causality. Further limitations include the assessment of patient and treatment factors at baseline, which can lead to a misclassification of factors that change over time. It is important to point out the study was dependent on U.S. Renal Data System and Medicare data to determine outcome, and the use of their ICD-9 coding information may have resulted in decreased reporting of sepsis.
Still, the relevant results of this investigation warrant further examination of statins and the prevention of sepsis in a prospective randomized trial. TH
Reference
- Sarnak MJ, Jaber BL. Mortality caused by sepsis in patients with end-stage renal disease compared with the general population. Kidney Int. 2000 Oct;58(4):1758-1764.
The AIDS Divide
This is the second in a two-part series. Part 1 appeared in the July issue, p. 29.
While the HIV/AIDS epidemic rages worldwide—an estimated 40 million people have the virus—the lifespan for many HIV-positive patients in the U.S. continues to improve.
Patients on highly active antiretroviral therapy (HAART) live long enough to develop common age-related illnesses. Those without sufficient resources and/or social supports continue to present with AIDS-defining syndromes seen at the beginning of the epidemic. Hospitalists must face these different populations of HIV/AIDS patients and their unique challenges.
In the second part of our series, we address:
- The ramifications for hospitalists of the Centers for Disease Control and Prevention’s (CDC) revised HIV testing guidelines;
- Challenges specific to managing children with HIV; and
- Ways hospitalists can make a difference with HIV patients through social services collaboration, education, and counseling.
Testing Guidelines Shift
On Sept. 22, 2006, the CDC issued revised recommendations for HIV testing of adults, adolescents, and pregnant women in healthcare settings.1 Testing had previously been recommended only for high-risk individuals, such as injection drug users or those with multiple sex partners. The new recommendations advise testing all individuals 13 through 64 in all healthcare settings. In its rationale for extended testing, the CDC notes that of the 1 million to 1.2 million people thought to be living with HIV in the United States, nearly 25% are unaware of their infected status. Expansion of testing, the CDC argues, would mean earlier access to life-extending treatments and reduced transmission risk.
Expanded testing is a good idea, says Theresa Barton, MD, assistant professor of pediatrics at the University of Texas Southwestern Medical Center in Dallas. Dr. Barton is also a pediatric hospitalist and director of the AIDS Related Medical Services (ARM) Clinic at UT.
“According to the CDC, a large number of newly diagnosed HIV patients have no risk factor at all [other than sexual contact with a partner],” Dr. Barton says. “Many people, particularly heterosexuals, do not perceive having sex as a risk factor. That’s certainly the case for women who are pregnant. They report they have no risk factor when you know they have a risk factor by default because they’re pregnant.”
Testing should be offered to everyone in the hospital, agrees George Mathew, MD, a hospitalist with infectious disease training at Emory University Hospital in Atlanta, and instructor of medicine at Emory University Medical School. However, testing everyone who comes to the hospital may be impractical for two reasons, he believes:
- Hospitalists feel time constraints with other components of diagnosing and admitting patients; and
- Hospitalists will not be impelled to offer patients routine HIV testing unless it is mandated by the Joint Commission on Accreditation of Healthcare Organizations (JCAHO) as a core measure.
“Hospitalists will need help [from their institutions] in the introduction of this recommendation, maybe as an inclusion on a general admission form or as a prompt during computerized physician order entry (CPOE),” Dr. Mathew says.
Until universal testing of all inpatients is instituted, it is still advisable for hospitalists to include HIV testing in the diagnostic workup. Neil Winawer, MD, director of the hospitalist program at Grady Memorial, one of Emory University’s affiliated hospitals in Atlanta, advises that hospitalists “should always keep the diagnosis of HIV and AIDS on their radar screen in this day and age. There can be certain things in a patient’s profile that trigger you to think about testing for HIV, such as lymphopenia, recurrent infections, subtle evidence of weight loss, or alopecia.”

Hospitalists should also heed how they introduce the need for the test. “To be honest, I think in many ways we have made the testing process too scary,” says Dr. Barton. She believes patients and their families may become unduly alarmed because of the emphasis on informed consent, as well as the secrecy of results. Her approach with families in the hospital or at the clinic is to tell parents she wants to do an HIV test to “make sure that every stone is uncovered” in making a diagnosis. “We should all do our best to explain to families what our plan is or what kind of testing we will be doing, whether it’s an HIV test or not,” she says.
Dr. Barton also cautions pediatric hospitalist colleagues to be sensitive to parents’ wishes when a diagnostic work-up includes a CD4 count or HIV test. If the child has been seen in an outpatient setting, it is possible the parents have not yet told their child that he or she is HIV-infected. “Try to be cognizant of the parents’ involvement and wishes,” she advises. “To have a perfect stranger [the hospitalist] tell you that you’re HIV-infected can be shocking.”

HIV in Children
The numbers of children with HIV in the United States tend to be small in comparison with the world’s estimated 2.5 million children under 15 living with the virus. From the start of the epidemic until 2002, 9,300 U.S. children under 13 had been reported to the CDC as living with HIV/AIDS. The majority of those children acquired the virus from their mothers before or during birth or through breast-feeding.
Most cases of HIV infection in infants are diagnosed at birth, according to Dr. Barton. With the advent of AZT (zidovudine) and HAART, only 92 new cases of pediatric AIDS were reported in 2002. The patterns of pediatric HIV/AIDS rates parallel those in adult groups: rates are higher among minority and economically disadvantaged inner-city populations.2
As with adult HIV populations, healthy children with HIV do not often present in the hospital setting because their condition is well controlled. However, Dr. Barton is seeing teenagers with acute retroviral syndrome—which occurs in those recently infected—and immigrant children with HIV-related diseases. The latter group, she says, do not have access to ongoing outpatient care, and their disease has gone undiagnosed until it brings them to the hospital.
The incidence of opportunistic infections differs in children, where pneumoncystis pneumonia (PCP) and cytomegalovirus (CMV) are primary infections. In adults these diseases usually result from the reactivation of latent infections. Lymphocytic interstitial pneumonitis is more common in children than in adults. Severe candidiasis, a yeast infection, can cause constant diaper rash or manifest as oral thrush.
Dr. Barton emphasizes that pediatric hospitalists should keep a low threshold for thinking about HIV when diagnosing children. Possible reasons to test for HIV include:
- Failure to thrive;
- Delayed developmental milestones, such as crawling, walking, and talking;
- Severe presentation of common illnesses, such as diarrhea;
- Chronic appearance of common illnesses, such as colds; and
- Seizures, fever, dehydration, and pneumonia.
Finding appropriate drug regimens for children with HIV can be even more of a challenge than for adult HIV patients. Children with HIV are treated with HAART. Many drugs approved for adults are not available in liquid form for younger children. Even if children can swallow pills, the dose may be too high for them. HAART in the pediatric setting also carries risks of multiple toxicities and drug resistance.
Drug interactions become a factor when, as is common, children develop seizures, says Dr. Barton. “It’s sometimes difficult to find drugs that don’t have a lot of interactions, so obtaining the advice of the pharmacist is really crucial,” she says.
Adolescents are a particularly troublesome subset of growing HIV cases. “By nature of their being adolescents, they do not routinely access care,” notes Dr. Barton. “There is a long window of time—often many years—before a patient becomes symptomatic, so they may not present until they are severely ill.”

Inpatient Management
If and how hospitalists interact with HIV/AIDS patients depends on their institution’s resources, catchment area, and formal affiliations with teaching hospitals. Tomas Villanueva, DO, is a hospitalist at Baptist Hospital of Miami, a 650-bed not-for-profit hospital in South Florida.
“I’m one of those very spoiled hospitalists because I have everything and everybody available to me,” he says. “I have the good fortune to work with infectious disease doctors and with clinical pharmacologists.” Access to these consultants, he says, helps with admitting HIV patients taking antiretrovirals, especially when withdrawing oral nutrition is indicated.
“Atlanta has a large HIV-positive population,” notes Dr. Mathew. As in many U.S. urban centers, patients in Atlanta often present with opportunistic infections and end-stage AIDS. Dr. Mathew advises hospitalists to consult with the infectious disease specialist when HIV/AIDS patients are admitted. “You call the nephrologist when you have an end-stage renal disease patient, so you should call the ID [infectious disease] specialist when you have an HIV patient,” he says. “There are multiple presentations of antiretroviral toxicities, which most hospitalists do not know how to handle. Yet it is also not advisable to take them off their HAART presumptuously.” Dr. Mathew also observes that many HIV patients consider ID specialists their primary care providers, so it is important to respect that bond while patients are in the hospital.

Accessing the expertise of ID specialists who work on the teaching service can help hospitalists stay abreast of treatment trends, notes Dr. Winawer. Because of Grady Memorial’s affiliation with Emory University, house staff can access the expertise of the university’s world-renowned ID program through the teaching service. As a result, house staff are more aware of issues related to treating HIV/AIDS, he says.
Hospitalists likely will not be the lead physicians for managing HIV/AIDS patients once admitted, especially if their institutions are affiliated with university teaching hospitals. However, hospitalists can still have an impact on providing essential public health messages and improving the quality of care. HIV and ID specialist Harry Hollander, MD, program director for the University of California at San Francisco Internal Medicine Residency Program and professor of Clinical Medicine at UCSF, notes that hospitalists can play a reinforcing role by educating patients to modify risk behaviors. For instance, he says, “If patients are admitted with complications of risk behaviors that may be associated with HIV infection—such as sexually transmitted infections, or medical problems related to injection drug use—addressing those issues becomes as important as imparting a smoking cessation message to someone who comes in with pneumonia or pulmonary problems.”
Emphasizing links to care is another key role for hospitalists. At Grady, reports Dr. Winawer, at least 60 inpatients with HIV/AIDS are being treated at any given time by the four immunology service teams run by the Department of Infectious Diseases, as well as 12 ward teams and four ICU teams.
Most indigent patients do not have strong social support, so Dr. Winawer emphasizes how hospitalists can provide compassionate care by collaborating with social workers. For example, HIV patients admitted to the hospital with respiratory illnesses might be placed in isolation to rule out tuberculosis. “Many times these patients do not have good family or other social support, and they are left in their room to dwell on their diagnosis. It can feel very isolating and demoralizing if they do not have knowledge of services that can be offered to them. So it is critical to involve social services at that time.”
Make a Difference at Discharge
Can hospitalists do a better job of acquainting themselves with community resources available to discharged patients? Dr. Mathew believes so but concedes hospitalists may not have the time. He notes that funding for HIV/AIDS outpatient clinics is at an all-time high, and social workers are expert in linking patients with outside resources.
Social workers at [an] ID clinic, he said, “are very, very attentive to the needs of their patients.”
Strong alliances with social workers are critical for hospitalists who see large numbers of indigent HIV/AIDS patients, says Dr. Winawer. “These patients often use the hospital as their primary care center,” he notes. “So the inpatient social workers know them better than their colleagues in the ID clinic do. A lot of the ‘bounce-backs’ we see are related to non-compliance [with therapy regimens], to substance abuse, or to other issues related to housing and environments that are not conducive to taking their medications.
“There are a lot of factors that cause our patients to not receive the best care upon their discharge. From my perspective as a hospitalist, once they no longer have criteria for hospitalization, much depends on patients’ willingness to do the things that you try to promote. Social services can play a big part so that [patients] don’t fall through the cracks due to their inability to afford medication or proper housing. From our experience, a highly functional network of social support is critical.”
Any encounter with the healthcare system is an opportunity for education. Dr. Villanueva includes education as one of his primary roles in dealing with HIV-positive patients. “I’m working now not only on education, but communication,” he says. “We pretty much have to be the physician champions in making sure we communicate with all parties.” TH
References
- Revised recommendations for HIV testing of adults, adolescents and pregnant women in health-care settings. Morbidity and Mortality Weekly Report, September 22, 2006/ 55(RR14); 1-17. Available online at www.cdc.gov/mmwr/preview/mmwrhtml/rr5514a1.htm. Last accessed April 27, 2007.
- HIV infection in infants and children. National Institute of Allergy and Infectious Diseases Fact Sheet, July 2004. Available at www.niaid.nih.gov/factsheets/hivchildren.htm. Last accessed May 22, 2007.
This is the second in a two-part series. Part 1 appeared in the July issue, p. 29.
While the HIV/AIDS epidemic rages worldwide—an estimated 40 million people have the virus—the lifespan for many HIV-positive patients in the U.S. continues to improve.
Patients on highly active antiretroviral therapy (HAART) live long enough to develop common age-related illnesses. Those without sufficient resources and/or social supports continue to present with AIDS-defining syndromes seen at the beginning of the epidemic. Hospitalists must face these different populations of HIV/AIDS patients and their unique challenges.
In the second part of our series, we address:
- The ramifications for hospitalists of the Centers for Disease Control and Prevention’s (CDC) revised HIV testing guidelines;
- Challenges specific to managing children with HIV; and
- Ways hospitalists can make a difference with HIV patients through social services collaboration, education, and counseling.
Testing Guidelines Shift
On Sept. 22, 2006, the CDC issued revised recommendations for HIV testing of adults, adolescents, and pregnant women in healthcare settings.1 Testing had previously been recommended only for high-risk individuals, such as injection drug users or those with multiple sex partners. The new recommendations advise testing all individuals 13 through 64 in all healthcare settings. In its rationale for extended testing, the CDC notes that of the 1 million to 1.2 million people thought to be living with HIV in the United States, nearly 25% are unaware of their infected status. Expansion of testing, the CDC argues, would mean earlier access to life-extending treatments and reduced transmission risk.
Expanded testing is a good idea, says Theresa Barton, MD, assistant professor of pediatrics at the University of Texas Southwestern Medical Center in Dallas. Dr. Barton is also a pediatric hospitalist and director of the AIDS Related Medical Services (ARM) Clinic at UT.
“According to the CDC, a large number of newly diagnosed HIV patients have no risk factor at all [other than sexual contact with a partner],” Dr. Barton says. “Many people, particularly heterosexuals, do not perceive having sex as a risk factor. That’s certainly the case for women who are pregnant. They report they have no risk factor when you know they have a risk factor by default because they’re pregnant.”
Testing should be offered to everyone in the hospital, agrees George Mathew, MD, a hospitalist with infectious disease training at Emory University Hospital in Atlanta, and instructor of medicine at Emory University Medical School. However, testing everyone who comes to the hospital may be impractical for two reasons, he believes:
- Hospitalists feel time constraints with other components of diagnosing and admitting patients; and
- Hospitalists will not be impelled to offer patients routine HIV testing unless it is mandated by the Joint Commission on Accreditation of Healthcare Organizations (JCAHO) as a core measure.
“Hospitalists will need help [from their institutions] in the introduction of this recommendation, maybe as an inclusion on a general admission form or as a prompt during computerized physician order entry (CPOE),” Dr. Mathew says.
Until universal testing of all inpatients is instituted, it is still advisable for hospitalists to include HIV testing in the diagnostic workup. Neil Winawer, MD, director of the hospitalist program at Grady Memorial, one of Emory University’s affiliated hospitals in Atlanta, advises that hospitalists “should always keep the diagnosis of HIV and AIDS on their radar screen in this day and age. There can be certain things in a patient’s profile that trigger you to think about testing for HIV, such as lymphopenia, recurrent infections, subtle evidence of weight loss, or alopecia.”
Hospitalists should also heed how they introduce the need for the test. “To be honest, I think in many ways we have made the testing process too scary,” says Dr. Barton. She believes patients and their families may become unduly alarmed because of the emphasis on informed consent, as well as the secrecy of results. Her approach with families in the hospital or at the clinic is to tell parents she wants to do an HIV test to “make sure that every stone is uncovered” in making a diagnosis. “We should all do our best to explain to families what our plan is or what kind of testing we will be doing, whether it’s an HIV test or not,” she says.
Dr. Barton also cautions pediatric hospitalist colleagues to be sensitive to parents’ wishes when a diagnostic work-up includes a CD4 count or HIV test. If the child has been seen in an outpatient setting, it is possible the parents have not yet told their child that he or she is HIV-infected. “Try to be cognizant of the parents’ involvement and wishes,” she advises. “To have a perfect stranger [the hospitalist] tell you that you’re HIV-infected can be shocking.”
HIV in Children
The numbers of children with HIV in the United States tend to be small in comparison with the world’s estimated 2.5 million children under 15 living with the virus. From the start of the epidemic until 2002, 9,300 U.S. children under 13 had been reported to the CDC as living with HIV/AIDS. The majority of those children acquired the virus from their mothers before or during birth or through breast-feeding.
Most cases of HIV infection in infants are diagnosed at birth, according to Dr. Barton. With the advent of AZT (zidovudine) and HAART, only 92 new cases of pediatric AIDS were reported in 2002. The patterns of pediatric HIV/AIDS rates parallel those in adult groups: rates are higher among minority and economically disadvantaged inner-city populations.2
As with adult HIV populations, healthy children with HIV do not often present in the hospital setting because their condition is well controlled. However, Dr. Barton is seeing teenagers with acute retroviral syndrome—which occurs in those recently infected—and immigrant children with HIV-related diseases. The latter group, she says, do not have access to ongoing outpatient care, and their disease has gone undiagnosed until it brings them to the hospital.
The incidence of opportunistic infections differs in children, where pneumoncystis pneumonia (PCP) and cytomegalovirus (CMV) are primary infections. In adults these diseases usually result from the reactivation of latent infections. Lymphocytic interstitial pneumonitis is more common in children than in adults. Severe candidiasis, a yeast infection, can cause constant diaper rash or manifest as oral thrush.
Dr. Barton emphasizes that pediatric hospitalists should keep a low threshold for thinking about HIV when diagnosing children. Possible reasons to test for HIV include:
- Failure to thrive;
- Delayed developmental milestones, such as crawling, walking, and talking;
- Severe presentation of common illnesses, such as diarrhea;
- Chronic appearance of common illnesses, such as colds; and
- Seizures, fever, dehydration, and pneumonia.
Finding appropriate drug regimens for children with HIV can be even more of a challenge than for adult HIV patients. Children with HIV are treated with HAART. Many drugs approved for adults are not available in liquid form for younger children. Even if children can swallow pills, the dose may be too high for them. HAART in the pediatric setting also carries risks of multiple toxicities and drug resistance.
Drug interactions become a factor when, as is common, children develop seizures, says Dr. Barton. “It’s sometimes difficult to find drugs that don’t have a lot of interactions, so obtaining the advice of the pharmacist is really crucial,” she says.
Adolescents are a particularly troublesome subset of growing HIV cases. “By nature of their being adolescents, they do not routinely access care,” notes Dr. Barton. “There is a long window of time—often many years—before a patient becomes symptomatic, so they may not present until they are severely ill.”
Inpatient Management
If and how hospitalists interact with HIV/AIDS patients depends on their institution’s resources, catchment area, and formal affiliations with teaching hospitals. Tomas Villanueva, DO, is a hospitalist at Baptist Hospital of Miami, a 650-bed not-for-profit hospital in South Florida.
“I’m one of those very spoiled hospitalists because I have everything and everybody available to me,” he says. “I have the good fortune to work with infectious disease doctors and with clinical pharmacologists.” Access to these consultants, he says, helps with admitting HIV patients taking antiretrovirals, especially when withdrawing oral nutrition is indicated.
“Atlanta has a large HIV-positive population,” notes Dr. Mathew. As in many U.S. urban centers, patients in Atlanta often present with opportunistic infections and end-stage AIDS. Dr. Mathew advises hospitalists to consult with the infectious disease specialist when HIV/AIDS patients are admitted. “You call the nephrologist when you have an end-stage renal disease patient, so you should call the ID [infectious disease] specialist when you have an HIV patient,” he says. “There are multiple presentations of antiretroviral toxicities, which most hospitalists do not know how to handle. Yet it is also not advisable to take them off their HAART presumptuously.” Dr. Mathew also observes that many HIV patients consider ID specialists their primary care providers, so it is important to respect that bond while patients are in the hospital.
Accessing the expertise of ID specialists who work on the teaching service can help hospitalists stay abreast of treatment trends, notes Dr. Winawer. Because of Grady Memorial’s affiliation with Emory University, house staff can access the expertise of the university’s world-renowned ID program through the teaching service. As a result, house staff are more aware of issues related to treating HIV/AIDS, he says.
Hospitalists likely will not be the lead physicians for managing HIV/AIDS patients once admitted, especially if their institutions are affiliated with university teaching hospitals. However, hospitalists can still have an impact on providing essential public health messages and improving the quality of care. HIV and ID specialist Harry Hollander, MD, program director for the University of California at San Francisco Internal Medicine Residency Program and professor of Clinical Medicine at UCSF, notes that hospitalists can play a reinforcing role by educating patients to modify risk behaviors. For instance, he says, “If patients are admitted with complications of risk behaviors that may be associated with HIV infection—such as sexually transmitted infections, or medical problems related to injection drug use—addressing those issues becomes as important as imparting a smoking cessation message to someone who comes in with pneumonia or pulmonary problems.”
Emphasizing links to care is another key role for hospitalists. At Grady, reports Dr. Winawer, at least 60 inpatients with HIV/AIDS are being treated at any given time by the four immunology service teams run by the Department of Infectious Diseases, as well as 12 ward teams and four ICU teams.
Most indigent patients do not have strong social support, so Dr. Winawer emphasizes how hospitalists can provide compassionate care by collaborating with social workers. For example, HIV patients admitted to the hospital with respiratory illnesses might be placed in isolation to rule out tuberculosis. “Many times these patients do not have good family or other social support, and they are left in their room to dwell on their diagnosis. It can feel very isolating and demoralizing if they do not have knowledge of services that can be offered to them. So it is critical to involve social services at that time.”
Make a Difference at Discharge
Can hospitalists do a better job of acquainting themselves with community resources available to discharged patients? Dr. Mathew believes so but concedes hospitalists may not have the time. He notes that funding for HIV/AIDS outpatient clinics is at an all-time high, and social workers are expert in linking patients with outside resources.
Social workers at [an] ID clinic, he said, “are very, very attentive to the needs of their patients.”
Strong alliances with social workers are critical for hospitalists who see large numbers of indigent HIV/AIDS patients, says Dr. Winawer. “These patients often use the hospital as their primary care center,” he notes. “So the inpatient social workers know them better than their colleagues in the ID clinic do. A lot of the ‘bounce-backs’ we see are related to non-compliance [with therapy regimens], to substance abuse, or to other issues related to housing and environments that are not conducive to taking their medications.
“There are a lot of factors that cause our patients to not receive the best care upon their discharge. From my perspective as a hospitalist, once they no longer have criteria for hospitalization, much depends on patients’ willingness to do the things that you try to promote. Social services can play a big part so that [patients] don’t fall through the cracks due to their inability to afford medication or proper housing. From our experience, a highly functional network of social support is critical.”
Any encounter with the healthcare system is an opportunity for education. Dr. Villanueva includes education as one of his primary roles in dealing with HIV-positive patients. “I’m working now not only on education, but communication,” he says. “We pretty much have to be the physician champions in making sure we communicate with all parties.” TH
References
- Revised recommendations for HIV testing of adults, adolescents and pregnant women in health-care settings. Morbidity and Mortality Weekly Report, September 22, 2006/ 55(RR14); 1-17. Available online at www.cdc.gov/mmwr/preview/mmwrhtml/rr5514a1.htm. Last accessed April 27, 2007.
- HIV infection in infants and children. National Institute of Allergy and Infectious Diseases Fact Sheet, July 2004. Available at www.niaid.nih.gov/factsheets/hivchildren.htm. Last accessed May 22, 2007.
The Gray Zone
In part 1 of this two-part series (July 2007, p. 16), hospitalists and emergency medicine physicians expressed their views on the relationship between their two specialties. In part 2, we look at how those relationships intersect—and what issues are at stake when they do.
One area where there is a bit of overlap between hospital medicine and emergency medicine is observational medicine,” says James W. Hoekstra, MD, professor and chairman, Department of Emergency Medicine, Wake Forest University Health Sciences Center, Winston-Salem, N.C.
Those patients who require a short stay for observation, he says, are neither in the ED or admitted to the hospital—they are in a zone of their own.
“That’s a gray zone in terms of who takes care of those patients,” he says, “and it depends on the hospital. It will be interesting to see how that works out, or whether that is ever worked out. It may just stay a shared area.”
The observation conundrum is complicated by the fact that many people use emergency departments for primary care. (See Figure 1, p. 33) “ True emergencies make up only some of the patient [cases] in the ED,” says Debra L. Burgy, MD, a hospitalist at Abbott Northwestern Hospital in Minneapolis. “We do have a 23-hour observation unit of 10 beds, and, frankly, could use 10 more to [handle unpredictable volumes of patients and insufficient support staff. That unit] has certainly helped to alleviate unnecessary admissions.”
Collaboration between hospitalists and emergency medicine physicians happens a number of ways at the University of Colorado at Denver and Health Sciences Center, where Jeff Glasheen, MD, is director of both the hospital medicine program and inpatient clinical services in the department of medicine.
“One way we work closely with the ED—because we think it is the right thing to do—is by building a much more comprehensive observation unit,” Dr. Glasheen says. “In some settings the observation unit lives in the ED and is run by the ED and in others, it is run by hospitalists. The hospitalists [here] will now run the unit, but we want to help solve some of the ED’s throughput issues.”
When Dr. Glasheen arrived at his institution, the observation unit was limited to patients with chest pain. “I didn’t understand why we would get chest pain patients through efficiently and not all patients,” he says.
A team that began operating in July will be available for all patients under the admission status of observation. The team will be hospitalist-led and aim to reduce length of stay and increase quality of care for those patients.
“Right now those patients are very scattered throughout the system and they may be [covered by] six to eight different teams,” Dr. Glasheen explains. One team of caregivers will be more efficient and reduce length of stay, he says.
By nurturing their working relationship with the emergency department, hospitalists will be able to more easily say: “We understand that that workup’s not complete, but we also understand that they’re going to come into the hospital and let us know what things need to be done. We’ll be happy to take that patient a little earlier than we did in the past to get them out of the ED.”
That’s a tricky thing to do, he says, “because the benefit to us isn’t huge, we’re self-sacrificing to help the ED, and that’s what I want hospitalist groups nationally to be thinking: how we can make the whole system better and not just make our own job better.”
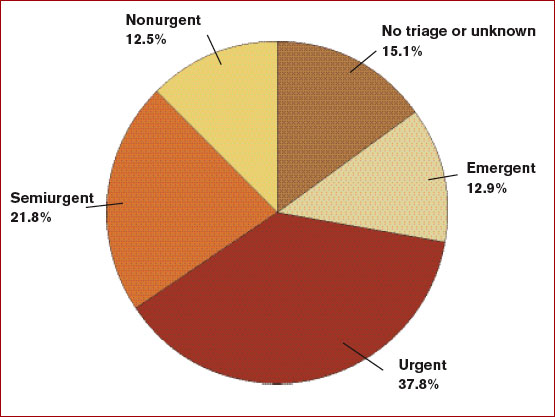
Dr. Glasheen believes the professional structure in his institution is representative of what other hospitals will function like in the next 10 years.
“You have a backbone structure of basically four types of physicians: emergency medicine docs, hospitalists, intensivists, and a surgical team,” Dr. Glasheen says. “Everyone else, more and more, is serving in a consultative role.” Having that backbone allows you to tackle the issues, which are primarily complex, systems-based issues, he says. “It is no longer [a matter of just] the ED trying to deal with capacity issues. Now they have an ally on the inpatient side.”
An excess of patients for the number of beds means some patients spend a disproportionate amount of their stay in the ED, and that challenges communication and efficiency. “The challenges may be simple things, such as it being harder for a hospitalist to get to the ED to see a patient than it is upstairs,” Dr. Glasheen says. “[Or] it’s harder to decide who really has ownership of that patient.” In his hospital, as soon as a patient is assigned to a hospitalist, the primary responsibility for that patient is seen as the hospitalist’s.
But there are other issues. “Even if we are able to get down [to the ED] and write orders, that is problematic for the ED and the hospitalist; as a hospitalist we don’t have the nurses with staffing ratios and skills in the ED that they have on floors and in the ICU,” says Dr. Glasheen. “It is not always possible to get things done as efficiently as they probably could if the patients were in a proper unit. Locally and globally in my experience, the biggest issue is: How do you take care of these patients who now spend their inpatient stay in the ED?”
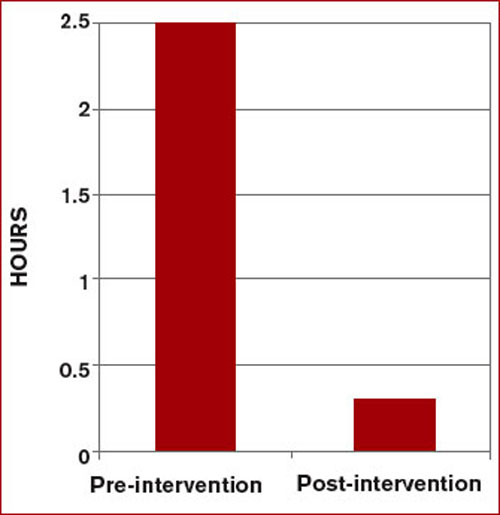
Collaborations, Models, and Solutions
A number of hospitalists raise the issue of managing internal medicine residents doing rotations in the ED.
“We were approached recently by the ED because most of our admissions are called in directly to the medical residents,” says Jason R. Orlinick, MD, PhD, head of the section of Hospital Medicine at Norwalk Hospital, Conn. “I think the ED would like to talk directly with the medical attending assuming care for the patient. One of the things we haven’t done well is meet on a regular basis to discuss communication issues.”
The hospitalists and emergency medicine group at Dr. Orlinick’s institution have entertained the idea of setting up a direct triage system whereby medical residents are taken out of the picture. “The emergency medicine docs would page us directly—at least during the busiest hours of the day. Eventually, the hope is to make it a 24-hour, seven-days-a-week, 365 [days-a-year process],” says Dr. Orlinick. By bringing this to the emergency medicine physicians, the intent was to send the message that hospitalists recognize ED overcrowding as an institutional issue and want to improve communication with their ED colleagues to improve patient care.
This model, devised at Johns Hopkins Bayview Medical Center in Baltimore, enabled communication between ED doctors and hospitalists, and reduced wait times by more than two hours when a bed was available.2 This triage and direct-admission protocol was not associated with increased mortality and resulted in improved patient and physician satisfaction. (See Figure 2 at right). Once the ED attending decides to admit a patient, direct communication is facilitated with a hospitalist. The approach includes monthly meetings between the department of medicine and the ED to continue to discuss improvements in admissions.
At Norwalk Hospital, the administration asked the hospitalist group to intervene in that throughput process. But Dr. Orlinick, also a clinical instructor of medicine at Yale University in New Haven, Conn., says they’ve hesitated out of sensitivity to their ED colleagues.
“We as a group have really struggled with that concept because [although] we feel like that is something we can do well, this is really within the purview of the emergency medicine docs,” says Dr. Orlinick. Adopting the Johns Hopkins model is a win-win solution where each specialty is providing its best skills to solve mutual issues. “What we can do well is look at the patients … on the floor[s], look at flow through the hospital systems in terms of getting testing; make sure that all that—and consults—happen in a timely manner, and that people leave the hospital when they’ve reached their goals of hospitalization,” he says. “It’s afterload as opposed to preload.”
Hospitalists see committee collaboration as important to solving the complex multidisciplinary systemic issues. Jasen W. Gundersen, MD, participates on a pneumonia task force with several hospitalists, a pulmonologist, and one of the heads of the ED. “We address the whole gamut from when patients come in to when they go through the hospital,” says Dr. Gundersen, head of the Hospital Medicine Division, University of Massachusetts Memorial Medical Center, Worcester. “We can learn from each other as we go through the process.”
Many of the ways hospitalists and ED physicians tackle systems-related issues are new to Dr. Glasheen’s institution because the hospital medicine program was begun in 2004. It is now common to see higher-level leadership from different specialties and areas all in the same room—talking about issues of capacity, for instance. There are also many more instances of hospitalists and ED physicians sitting on the same committees. Further, “It is relatively common for our ED to call our hospitalists to say, ‘Can you help see this patient? I’m not sure what to do,’ or, ‘I’ve got this situation with this patient, this needs to be done and I need help getting that done,’ ” Dr. Glasheen says. Even though he concedes that is more of a workaround as opposed to a solution for a faulty system, it still represents ED physicians and hospitalists co-managing that workaround.
The Future
Because he “sits on both sides of the fence” between emergency medicine and hospital medicine, Dr. Gundersen thinks it is especially important for hospitalists to train in all the different areas—including emergency medicine—when they are medical students and residents.
Emergency medicine physicians Dr. Hoekstra and Benjamin Honigman, MD, professor of surgery and head of the Division of Emergency Medicine at the University of Colorado School of Medicine, Denver, believe hospital medicine will be integral to that training. Dr. Glasheen, also the director of the longest-running internal medicine hospitalist-training program in the U.S., expects greater attention to hospitalist training. “My sense is that many hospitalists groups are in a growth phase and are trying to solve their own problems,” he says. Basically, their primary focus is staffing the hospital with good people and retaining them. He believes that once groups have been around for three to five years, they are more likely to take on bigger issues, such as hospital efficiency and capacity management.
“One of the reasons we started a hospitalist training program is that I didn’t want hospitalists to fall into the same mistakes, barriers, or issues that we’ve had in the past,” Dr. Glasheen says. He fears “this sort of continued balkanization of hospital care, where everyone silos everything out and considers such issues as throughput and ED divert as outside of their [jurisdiction]. I want to get to the place where hospitalists are looking at the whole hospital system and are justly rewarded for that either by financial incentives or time to [work on systemic issues].”
Dr. Glasheen and his team remind themselves of where their commitment resides: “This hospital is where we live—and with everything between the front door to the back door, our primary job is to make this a better place.” TH
Andrea Sattinger is a frequent contributor to The Hospitalist.
References
- Burt CW, McCaig LF. Staffing, capacity, and ambulance diversion in emergency departments: United States, 2003-04. Adv Data; US Department of Health and Human Services, Centers for Disease Control and Prevention, National Center for Health Statistics, Hyattsville, Md. Sept. 27, 2006. Available at: www.cdc.gov/nchs/data/ad/ad376.pdf. Last accessed June 25, 2007.
- Howell EE, Bessman ES, Rubin HR. Hospitalists and an innovative emergency department admission process. J Gen Intern Med. 2004 Mar;19(3):266-268.
In part 1 of this two-part series (July 2007, p. 16), hospitalists and emergency medicine physicians expressed their views on the relationship between their two specialties. In part 2, we look at how those relationships intersect—and what issues are at stake when they do.
One area where there is a bit of overlap between hospital medicine and emergency medicine is observational medicine,” says James W. Hoekstra, MD, professor and chairman, Department of Emergency Medicine, Wake Forest University Health Sciences Center, Winston-Salem, N.C.
Those patients who require a short stay for observation, he says, are neither in the ED or admitted to the hospital—they are in a zone of their own.
“That’s a gray zone in terms of who takes care of those patients,” he says, “and it depends on the hospital. It will be interesting to see how that works out, or whether that is ever worked out. It may just stay a shared area.”
The observation conundrum is complicated by the fact that many people use emergency departments for primary care. (See Figure 1, p. 33) “ True emergencies make up only some of the patient [cases] in the ED,” says Debra L. Burgy, MD, a hospitalist at Abbott Northwestern Hospital in Minneapolis. “We do have a 23-hour observation unit of 10 beds, and, frankly, could use 10 more to [handle unpredictable volumes of patients and insufficient support staff. That unit] has certainly helped to alleviate unnecessary admissions.”
Collaboration between hospitalists and emergency medicine physicians happens a number of ways at the University of Colorado at Denver and Health Sciences Center, where Jeff Glasheen, MD, is director of both the hospital medicine program and inpatient clinical services in the department of medicine.
“One way we work closely with the ED—because we think it is the right thing to do—is by building a much more comprehensive observation unit,” Dr. Glasheen says. “In some settings the observation unit lives in the ED and is run by the ED and in others, it is run by hospitalists. The hospitalists [here] will now run the unit, but we want to help solve some of the ED’s throughput issues.”
When Dr. Glasheen arrived at his institution, the observation unit was limited to patients with chest pain. “I didn’t understand why we would get chest pain patients through efficiently and not all patients,” he says.
A team that began operating in July will be available for all patients under the admission status of observation. The team will be hospitalist-led and aim to reduce length of stay and increase quality of care for those patients.
“Right now those patients are very scattered throughout the system and they may be [covered by] six to eight different teams,” Dr. Glasheen explains. One team of caregivers will be more efficient and reduce length of stay, he says.
By nurturing their working relationship with the emergency department, hospitalists will be able to more easily say: “We understand that that workup’s not complete, but we also understand that they’re going to come into the hospital and let us know what things need to be done. We’ll be happy to take that patient a little earlier than we did in the past to get them out of the ED.”
That’s a tricky thing to do, he says, “because the benefit to us isn’t huge, we’re self-sacrificing to help the ED, and that’s what I want hospitalist groups nationally to be thinking: how we can make the whole system better and not just make our own job better.”
Dr. Glasheen believes the professional structure in his institution is representative of what other hospitals will function like in the next 10 years.
“You have a backbone structure of basically four types of physicians: emergency medicine docs, hospitalists, intensivists, and a surgical team,” Dr. Glasheen says. “Everyone else, more and more, is serving in a consultative role.” Having that backbone allows you to tackle the issues, which are primarily complex, systems-based issues, he says. “It is no longer [a matter of just] the ED trying to deal with capacity issues. Now they have an ally on the inpatient side.”
An excess of patients for the number of beds means some patients spend a disproportionate amount of their stay in the ED, and that challenges communication and efficiency. “The challenges may be simple things, such as it being harder for a hospitalist to get to the ED to see a patient than it is upstairs,” Dr. Glasheen says. “[Or] it’s harder to decide who really has ownership of that patient.” In his hospital, as soon as a patient is assigned to a hospitalist, the primary responsibility for that patient is seen as the hospitalist’s.
But there are other issues. “Even if we are able to get down [to the ED] and write orders, that is problematic for the ED and the hospitalist; as a hospitalist we don’t have the nurses with staffing ratios and skills in the ED that they have on floors and in the ICU,” says Dr. Glasheen. “It is not always possible to get things done as efficiently as they probably could if the patients were in a proper unit. Locally and globally in my experience, the biggest issue is: How do you take care of these patients who now spend their inpatient stay in the ED?”
Collaborations, Models, and Solutions
A number of hospitalists raise the issue of managing internal medicine residents doing rotations in the ED.
“We were approached recently by the ED because most of our admissions are called in directly to the medical residents,” says Jason R. Orlinick, MD, PhD, head of the section of Hospital Medicine at Norwalk Hospital, Conn. “I think the ED would like to talk directly with the medical attending assuming care for the patient. One of the things we haven’t done well is meet on a regular basis to discuss communication issues.”
The hospitalists and emergency medicine group at Dr. Orlinick’s institution have entertained the idea of setting up a direct triage system whereby medical residents are taken out of the picture. “The emergency medicine docs would page us directly—at least during the busiest hours of the day. Eventually, the hope is to make it a 24-hour, seven-days-a-week, 365 [days-a-year process],” says Dr. Orlinick. By bringing this to the emergency medicine physicians, the intent was to send the message that hospitalists recognize ED overcrowding as an institutional issue and want to improve communication with their ED colleagues to improve patient care.
This model, devised at Johns Hopkins Bayview Medical Center in Baltimore, enabled communication between ED doctors and hospitalists, and reduced wait times by more than two hours when a bed was available.2 This triage and direct-admission protocol was not associated with increased mortality and resulted in improved patient and physician satisfaction. (See Figure 2 at right). Once the ED attending decides to admit a patient, direct communication is facilitated with a hospitalist. The approach includes monthly meetings between the department of medicine and the ED to continue to discuss improvements in admissions.
At Norwalk Hospital, the administration asked the hospitalist group to intervene in that throughput process. But Dr. Orlinick, also a clinical instructor of medicine at Yale University in New Haven, Conn., says they’ve hesitated out of sensitivity to their ED colleagues.
“We as a group have really struggled with that concept because [although] we feel like that is something we can do well, this is really within the purview of the emergency medicine docs,” says Dr. Orlinick. Adopting the Johns Hopkins model is a win-win solution where each specialty is providing its best skills to solve mutual issues. “What we can do well is look at the patients … on the floor[s], look at flow through the hospital systems in terms of getting testing; make sure that all that—and consults—happen in a timely manner, and that people leave the hospital when they’ve reached their goals of hospitalization,” he says. “It’s afterload as opposed to preload.”
Hospitalists see committee collaboration as important to solving the complex multidisciplinary systemic issues. Jasen W. Gundersen, MD, participates on a pneumonia task force with several hospitalists, a pulmonologist, and one of the heads of the ED. “We address the whole gamut from when patients come in to when they go through the hospital,” says Dr. Gundersen, head of the Hospital Medicine Division, University of Massachusetts Memorial Medical Center, Worcester. “We can learn from each other as we go through the process.”
Many of the ways hospitalists and ED physicians tackle systems-related issues are new to Dr. Glasheen’s institution because the hospital medicine program was begun in 2004. It is now common to see higher-level leadership from different specialties and areas all in the same room—talking about issues of capacity, for instance. There are also many more instances of hospitalists and ED physicians sitting on the same committees. Further, “It is relatively common for our ED to call our hospitalists to say, ‘Can you help see this patient? I’m not sure what to do,’ or, ‘I’ve got this situation with this patient, this needs to be done and I need help getting that done,’ ” Dr. Glasheen says. Even though he concedes that is more of a workaround as opposed to a solution for a faulty system, it still represents ED physicians and hospitalists co-managing that workaround.
The Future
Because he “sits on both sides of the fence” between emergency medicine and hospital medicine, Dr. Gundersen thinks it is especially important for hospitalists to train in all the different areas—including emergency medicine—when they are medical students and residents.
Emergency medicine physicians Dr. Hoekstra and Benjamin Honigman, MD, professor of surgery and head of the Division of Emergency Medicine at the University of Colorado School of Medicine, Denver, believe hospital medicine will be integral to that training. Dr. Glasheen, also the director of the longest-running internal medicine hospitalist-training program in the U.S., expects greater attention to hospitalist training. “My sense is that many hospitalists groups are in a growth phase and are trying to solve their own problems,” he says. Basically, their primary focus is staffing the hospital with good people and retaining them. He believes that once groups have been around for three to five years, they are more likely to take on bigger issues, such as hospital efficiency and capacity management.
“One of the reasons we started a hospitalist training program is that I didn’t want hospitalists to fall into the same mistakes, barriers, or issues that we’ve had in the past,” Dr. Glasheen says. He fears “this sort of continued balkanization of hospital care, where everyone silos everything out and considers such issues as throughput and ED divert as outside of their [jurisdiction]. I want to get to the place where hospitalists are looking at the whole hospital system and are justly rewarded for that either by financial incentives or time to [work on systemic issues].”
Dr. Glasheen and his team remind themselves of where their commitment resides: “This hospital is where we live—and with everything between the front door to the back door, our primary job is to make this a better place.” TH
Andrea Sattinger is a frequent contributor to The Hospitalist.
References
- Burt CW, McCaig LF. Staffing, capacity, and ambulance diversion in emergency departments: United States, 2003-04. Adv Data; US Department of Health and Human Services, Centers for Disease Control and Prevention, National Center for Health Statistics, Hyattsville, Md. Sept. 27, 2006. Available at: www.cdc.gov/nchs/data/ad/ad376.pdf. Last accessed June 25, 2007.
- Howell EE, Bessman ES, Rubin HR. Hospitalists and an innovative emergency department admission process. J Gen Intern Med. 2004 Mar;19(3):266-268.
QI for Kids
With the current focus in hospital medicine on quality and reporting quality measures, you don’t hear much about pediatric patients. What’s happening with quality and children?
In “Pediatric Hospitalist Quality Forum: Standards, Reporting and Improvement,” Erin Stucky, MD, academic director, Children’s Hospital and Health Center in San Diego, Calif., and Lakshmi Halasyamani, MD, assistant chairperson of the Department of Internal Medicine at St. Joseph Mercy Hospital in Ann Arbor, Mich., provided an overview of what’s happening in pediatric quality of care and strategies for organizational and clinical improvement.

“The pediatric quality landscape is emerging, and you have a tremendous opportunity to help shape that landscape,” Dr. Stucky told the audience of hospitalist-pediatricians.
Dr. Halasyamani provided an overview of national organizations that are implementing quality indicators for hospitalized adult patients, from the Joint Commission on Accreditation of Healthcare Organizations (JCAHO) to the Hospital Quality Alliance to the Institute for Healthcare Improvement. These groups and others have shown some interest in pediatric-specific quality initiatives, but “organizations are trying to coordinate things,” explained Dr. Stucky. “We can’t let the local efforts die while we’re focusing on the national level.”
QI at the Local Level
There are steps a hospitalist can take to improve quality and safety at his or her hospital.
“What can you do?” asked Dr. Halasyamani. The most obvious thing is to continue your education by pursuing CMEs, classes, and workshops in relevant areas. You can improve physician awareness, which forces everyone to look at the bigger picture. But this alone may not change behaviors. At a process and systems level, implementing a multidisciplinary team is a good step. “And you must dispel the myth that to be more effective, it has to be more difficult,” added Dr. Halasyamani.
Elements of success, or sustainability, for a quality improvement (QI) effort include establishing absolute team clarity and unity on goals, ensuring you have the organizational support to eliminate any barriers, and a built-in measurement system for what you’re trying to demonstrate. You’ll need organizational structures for your project to recruit your team, as well as a clear reporting structure. “Make sure the stakeholders are at the table,” advised Dr. Halasyamani.

—Erin Stucky, MD, academic director, Children’s Hospital and Health Center in San Diego
A Case Study
The presenters supplied a local example of a QI initiative hospitalists can follow. Dr. Stucky outlined an asthma QI project her hospitalist-led team had undertaken.
Her team reviews their algorithms every six to 12 months. “Even if review says what we’re doing is good, we still need to look at it and make sure we’re making that decision personally,” explained Dr. Stucky. In looking at the asthma data, the team noticed some pediatric patients were receiving a lot of chest X-rays.
“We looked at our first- and second-quarter data, and compared it to the [Pediatric Health Information System] data,” said Dr. Stucky. “We saw that we ordered chest X-rays at about the national average [on 61% and 62% of eligible patients versus an average of 66%], but is that average a good number?” The team decided to break down the data to see where X-rays were ordered—in the ED and on the ward—and why.
The team mapped a new asthma pathway for the ED based on the end of first-hour events, asthma scores, and medical history. “We decided to involve a respiratory therapist more with decisions on hospital placement” in the ED, said Dr. Stucky. The therapist then drove the protocols for mild, moderate, and severe cases.
The team changed the chest X-ray order set on the ward to read, “Consider ordering CRX if it will affect your treatment plan, and you must check or write the indication if ordering one.”
The result: The percentage of patients with chest X-rays in hospital beds dropped to 55%.
“Performance improvement is here to stay,” pronounced Dr. Stucky. “Leadership in pediatric QI is in our hands.” TH
With the current focus in hospital medicine on quality and reporting quality measures, you don’t hear much about pediatric patients. What’s happening with quality and children?
In “Pediatric Hospitalist Quality Forum: Standards, Reporting and Improvement,” Erin Stucky, MD, academic director, Children’s Hospital and Health Center in San Diego, Calif., and Lakshmi Halasyamani, MD, assistant chairperson of the Department of Internal Medicine at St. Joseph Mercy Hospital in Ann Arbor, Mich., provided an overview of what’s happening in pediatric quality of care and strategies for organizational and clinical improvement.
“The pediatric quality landscape is emerging, and you have a tremendous opportunity to help shape that landscape,” Dr. Stucky told the audience of hospitalist-pediatricians.
Dr. Halasyamani provided an overview of national organizations that are implementing quality indicators for hospitalized adult patients, from the Joint Commission on Accreditation of Healthcare Organizations (JCAHO) to the Hospital Quality Alliance to the Institute for Healthcare Improvement. These groups and others have shown some interest in pediatric-specific quality initiatives, but “organizations are trying to coordinate things,” explained Dr. Stucky. “We can’t let the local efforts die while we’re focusing on the national level.”
QI at the Local Level
There are steps a hospitalist can take to improve quality and safety at his or her hospital.
“What can you do?” asked Dr. Halasyamani. The most obvious thing is to continue your education by pursuing CMEs, classes, and workshops in relevant areas. You can improve physician awareness, which forces everyone to look at the bigger picture. But this alone may not change behaviors. At a process and systems level, implementing a multidisciplinary team is a good step. “And you must dispel the myth that to be more effective, it has to be more difficult,” added Dr. Halasyamani.
Elements of success, or sustainability, for a quality improvement (QI) effort include establishing absolute team clarity and unity on goals, ensuring you have the organizational support to eliminate any barriers, and a built-in measurement system for what you’re trying to demonstrate. You’ll need organizational structures for your project to recruit your team, as well as a clear reporting structure. “Make sure the stakeholders are at the table,” advised Dr. Halasyamani.
—Erin Stucky, MD, academic director, Children’s Hospital and Health Center in San Diego
A Case Study
The presenters supplied a local example of a QI initiative hospitalists can follow. Dr. Stucky outlined an asthma QI project her hospitalist-led team had undertaken.
Her team reviews their algorithms every six to 12 months. “Even if review says what we’re doing is good, we still need to look at it and make sure we’re making that decision personally,” explained Dr. Stucky. In looking at the asthma data, the team noticed some pediatric patients were receiving a lot of chest X-rays.
“We looked at our first- and second-quarter data, and compared it to the [Pediatric Health Information System] data,” said Dr. Stucky. “We saw that we ordered chest X-rays at about the national average [on 61% and 62% of eligible patients versus an average of 66%], but is that average a good number?” The team decided to break down the data to see where X-rays were ordered—in the ED and on the ward—and why.
The team mapped a new asthma pathway for the ED based on the end of first-hour events, asthma scores, and medical history. “We decided to involve a respiratory therapist more with decisions on hospital placement” in the ED, said Dr. Stucky. The therapist then drove the protocols for mild, moderate, and severe cases.
The team changed the chest X-ray order set on the ward to read, “Consider ordering CRX if it will affect your treatment plan, and you must check or write the indication if ordering one.”
The result: The percentage of patients with chest X-rays in hospital beds dropped to 55%.
“Performance improvement is here to stay,” pronounced Dr. Stucky. “Leadership in pediatric QI is in our hands.” TH
Move to the Head of the Class

Moving up the ranks of academic hospital medicine—from instructor to assistant professor, and especially from assistant professor to associate professor—was covered in-depth by professors Scott Flanders, MD, and Sanjay Saint, MD, MPH, of the University of Michigan in Ann Arbor, and Stephan D. Fihn, MD, MPH, head of the Division of General Internal Medicine at the University of Washington, in the session “How to Get Promoted as an Academic Hospitalist.”
Choose a Track
Dr. Flanders said there are several tracks within hospital medicine in academia. They include:
Clinician-Investigator: This is usually a tenure-track position, where 60% to 80% of the hospitalist’s time is protected for research. Usually, you’ll receive at least partial salary support for about three years, after which you’re responsible for finding independent funding to cover most of your salary. Retention and promotion are based on academic productivity including publications, grants, and national recognition.
Clinician-Educator: With approximately 10% to 30% of their time protected for research, these professionals usually get indefinite salary support—although they’re expected to generate most of their salary through clinical work. Retention and promotion are based on teaching accomplishments and clinical skills and, to a lesser extent, academic productivity.
Clinician-Administrator: With anywhere from 10% to 50% of their time protected for administrative work, these experienced hospitalists serve as directors, associate or assistant directors in a hospital medicine group, or in a clerkship role at a university. Retention and promotion are based on administrative skills, teaching prowess, clinical skills, and academic productivity.
Criteria for Promotion
Regardless of which track you’re on, when applying for a promotion you’ll be evaluated in these domains: clinical work, teaching, and administrative and scholarly work.
“These are universal to all institutions,” said Dr. Flanders. “You need to demonstrate excellence in each.” More specifically, you’ll need five to seven letters from impartial faculty outside your institution—preferably leaders in the field who hold at least the rank you are trying to achieve.
“Ask yourself as you get halfway between your associate and assistant professorship,” said Dr. Flanders, “who outside your institution knows you and your work.”
Steps for Promotion
Dr. Flanders offered advice on how to prepare for a successful career in academia.
“It helps if you develop a clinical niche,” he said. “Become the expert in one area in your group or institution.”
He also advised working toward giving clinical lectures to faculty and trainees in other departments, performing grand rounds in other departments, and speaking at neighboring institutions. To establish excellence in teaching, get feedback from students and work on improving your methods. Be innovative in your teaching and document your work in an education portfolio.
When focusing on administrative excellence, if you’re a director or an assistant director of a hospital medicine program, “make substantial contributions,” said Dr. Flanders. “… demonstrate that you’ve done leadership in … QI projects, and that this was important for your institution and more importantly, for other institutions.”
To generate scholarly work, write up your clinical cases as vignettes, case reports, or clinical problem solving; evaluate and disseminate your QI interventions; and establish connections with trained researchers.
“Ultimately, the goal is to have a national reputation,” Dr. Flanders reiterated. “It’s easiest if you’ve got 10 to 12 [articles in] peer-reviewed publications.”
Good Habits
Dr. Saint provided a list of seven habits of highly effective junior faculty members. They include:
- Know the rules. Understand what’s expected of you and the criteria for promotion;
- Develop expertise;
- Learn how to diversify your portfolio. Balance the risk between high-, moderate-, and low-risk projects;
- Find and utilize good mentors and collaborators;
- Quickly demonstrate academic productivity;
- Build a superb team. Hire the right research assistant; and
- Manage your time wisely. Guard your protected time. TH