User login
Impact of Physician Facecards
The patient‐physician relationship is fundamental to safe and effective care. Hospital settings present unique challenges to this partnership, including the lack of a prior relationship for hospital‐based physicians, rapid pace of clinical care, and dynamic nature of inpatient medical teams. Prior studies document that a majority of hospitalized patients are unable to correctly identify their physicians or nurses, and patients in teaching hospitals have difficulty understanding their physicians' level of training.[1, 2, 3, 4] Acknowledging these deficits, professional societies and the Accreditation Council for Graduate Medical Education (ACMGE) have issued policies stating that patients and caregivers need to know who is responsible at every point during patient care.[5, 6] These policies do not, however, make recommendations on methods to achieve better understanding.
Simple interventions improve patients' ability to correctly identify the names and roles of their hospital physicians. Maniaci and colleagues found that patients were better able to identify attending physicians when their names were written on the dry‐erase board in the room.[7] Arora and colleagues asked hospital physicians to give facecards, which included their picture and a description of their role, to patients.[8] Patients were more likely to correctly identify 1 physicians, but, surprisingly, less likely to understand physicians' roles. In a similar study, Francis and colleagues placed photographs with names of the attending and resident physicians on the wall in patient rooms.[9] Patients who had photographs of their physicians on the wall were more likely to correctly identify physicians on their team compared with patients who had no photographs. Additionally, patients who were able to identify more physicians rated satisfaction with physicians higher in 2 of 6 survey questions used. However, the study was limited by the use of a nonvalidated instrument to assess patient satisfaction and the use of an intermediate outcome (ie, ability to identify physicians) as the independent variable rather than the intervention itself (ie, physician photographs).
Beyond satisfaction, lack of familiarity may negatively impact patients' trust and agreement with hospital physicians. Trust and agreement are important predictors of adherence to recommended treatment in outpatient settings[10, 11, 12, 13, 14, 15, 16, 17, 18] but have not been adequately evaluated in hospital settings. Therefore, we sought to pilot the use of physician facecards and assess their potential impact on patients' knowledge of physicians' names and roles as well as patient satisfaction, trust, and agreement with physicians.
METHODS
Setting and Study Design
We performed a cluster randomized controlled trial at Northwestern Memorial Hospital (NMH), an 897‐bed tertiary‐care teaching hospital in Chicago, Illinois. One of 2 similar hospitalist service units and 1 of 2 similar teaching‐service units were randomly selected to implement the use of physician facecards. General medical patients were admitted to the study units by NMH bed‐assignment personnel subject to unit bed availability. No other criteria (eg, diagnosis, severity of illness, or source of patient admission) were used in patient assignment. Each unit consisted of 30 beds, with the exception of 1 hospitalist unit, which had 23. As a result of a prior intervention, physicians were localized to care for patients on specific units.[19] Hospitalist units were each staffed by hospitalists who worked in 7‐day rotations without the assistance of residents or midlevel providers. Teaching units were staffed by physician teams consisting of 1 attending, 1 senior resident, 1 intern, and 1 or 2 third‐year medical students. No fourth‐year students (ie, acting interns) rotated on these services during the study period. Housestaff worked in 4‐week rotations, and attending physicians on the teaching service worked in 2‐week rotations.
Patient rooms included a whiteboard facing the patient with a template prompting insertion of physician name(s). Nurses had the primary responsibility for completing information on the whiteboards.
Physician Facecard
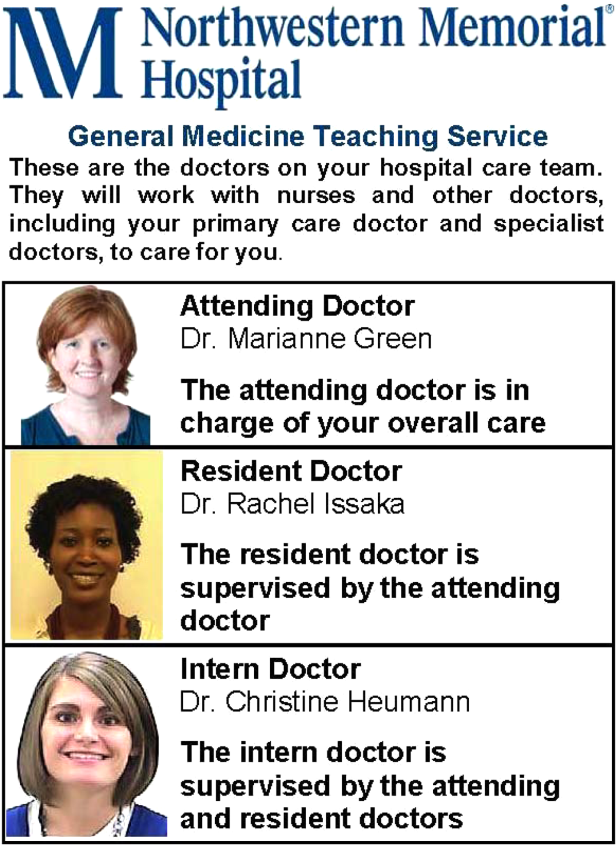
We created draft physician facecards featuring pictures of physicians and descriptions of their roles. We used Lexile analysis, a widely used measure of reading difficulty, to improve readability in an iterative fashion.[20, 21] We then sought feedback at hospitalist and resident meetings. Specifically, we asked for suggested revisions to content and recommendations on reliable methods to deliver facecards to patients. Teaching physicians felt strongly that each team member should be listed and shown on 1 card, which would fit easily into a lab‐coat pocket. We similarly engaged the NMH Patient and Family Advisory Council to seek recommended revisions to content and delivery of the facecards. The Council consists of 18 patient and caregiver members who meet regularly to provide input on hospital programs and proposals. Council members felt strongly that physicians should deliver the cards themselves during their initial introduction, rather than having patients receive cards by other means (eg, as part of unit orientation materials delivered by nonphysician staff members). We incorporated feedback from these stakeholder groups into a final version of the physician facecard and method for delivery (Figure 1).

We implemented the use of facecards from May to June 2012. Physicians on intervention units were informed of the study via email, and one of the co‐investigators (T.C.) distributed a supply of facecards to these physicians at the start of each rotation. This distribution was performed in person, and physicians were instructed to provide a facecard to each new patient during their first encounter. We also placed facecards in easily visible cardholders at the nurses' station on intervention units. Reminder emails were sent once each week to reinforce physician delivery of facecards.
Data Collection and Measures
Each weekday during the study period, we randomly selected patients for structured interviews in the afternoon of their second or third hospital day. We did not conduct interviews on the first day of physicians' rotations and excluded patients whose preferred language was not English and those disoreinted to person, place, or time.
Patients were asked to name the physician(s) primarily responsible for their hospital care and to state the role of each physician they identified. We documented receipt of facecards if one was viewed during the interview and by asking patients if they had received one. We also documented whether 1 correct physician names were written on the whiteboard in the patients' rooms. We used questions from the Hospital Consumer Assessment of Healthcare Providers and Systems (HCAHPS) survey to assess satisfaction with physician communication and overall hospital care. HCAHPS is a validated patient‐satisfaction survey developed by the Agency for Healthcare Research and Quality (AHRQ) to assess hospitalized patients' experiences with care. Physician‐communication questions used ordinal response options of never, sometimes, usually, and always. Overall hospital rating was assessed using a 010 scale with 0=worst hospital possible and 10=best hospital possible. Trust with physicians was assessed using the Wake Forest University Trust Scale.[22] Prior research using this instrument has shown an association between trust and self‐management behaviors.[23] This 10‐item scale uses a 5‐point Likert scale and generates scores ranging from 10 to 50. Agreement with physicians was assessed using 3 questions used in a prior study by Staiger and colleagues showing an association between levels of agreement and health outcomes among outpatients treated for back pain.[17] Specifically, we asked patients to rate their agreement with hospital physicians' (1) explanation for the cause of primary symptoms, (2) plan for diagnostic tests, and (3) suggested plan for treatment using a 5‐point Likert scale. The agreement scale generated scores ranging from 3 to 15.
Approval for the study was obtained from the institutional review board of Northwestern University.
Statistical Analysis
Patient demographic data were obtained from the electronic health record and complemented data from interviews. We used [2] and t tests to compare patient characteristics. We used [2] tests to compare the percentage of patients able to correctly identify 1 of their physicians and 1 of their physicians' roles. We used [2] tests to compare the percentage of patients giving top‐box ratings to all 3 physician‐communicationsatisfaction questions (ie, always) and giving an overall hospital rating of 9 or 10. We used top‐box comparisons, rather than comparison of mean or median scores, because patient‐satisfaction data are typically highly skewed toward favorable responses. This approach is consistent with prior HCAHPS research.[24, 25] We used Mann‐Whitney U tests to compare ratings of trust and agreement. Because delivery of facecards was imperfect, we performed analyses both by intention to treat (ie, intervention vs control units) and based on treatment received (ie, received a facecard vs did not receive a facecard). All analyses were conducted using Stata version 11.2 (StataCorp, College Station, TX).
RESULTS
Study Subjects and Facecard Receipt
Overall, 217 patients were approached for interview. Thirty‐six were excluded because of disorientation, 12 were excluded because their preferred language was not English, and 31 declined to participate in the study. Patient characteristics for the 138 study patients are shown in Table 1. There were no significant differences in patient age, sex, or race. There was no significant difference in the percentage of patients with 1 correct physicians listed on the whiteboard in the room. Delivery of facecards was incomplete, with only 68% of intervention‐unit patients confirmed as having received them. A higher percentage of patients on the hospitalist intervention unit received facecards (23 of 30; 76.7%) than on the teaching intervention unit (22 of 36; 61.1%), but the difference was not statistically significant (P=0.18). There were no significant differences in age, sex, or race between patients who received a facecard compared with those who did not.
| Characteristic | Control Group, N=72 | Intervention Group, N=66 | P Value |
|---|---|---|---|
| |||
| Mean age, years (SD) | 56.8 (18.0) | 55.2 (18.2) | 0.62 |
| Women, n (%) | 35 (48.6) | 28 (42.4) | 0.47 |
| Nonwhite race, n (%) | 35 (50.7) | 36 (57.1) | 0.46 |
| Teaching unit, n (%) | 34 (47.2) | 36 (54.6) | 0.39 |
| Correct physician name on whiteboard, n (%)a | 46 (76.7) | 37 (72.6) | 0.62 |
| Received a facecard, n (%) | 1 (1) | 45 (68.2) | <0.01 |
Patients' Knowledge of Physicians
As shown in Table 2, more patients in the intervention group were able to correctly identify 1 of their treating physicians compared with the control group, but the result was not statistically significant (69.7% vs 58.3%; P=0.17). A significantly larger percentage of patients in the intervention group were able to identify the role of their hospital physicians (51.5% vs 16.7%; P<0.01). When comparing those that received a facecard and those that did not, patients who were given a facecard were more likely to correctly identify their hospital physician (89.1% vs 51.1%; P<0.01). Similarly, patients who had received a facecard were more likely to correctly identify the role of their hospital physician than patients who had not received a facecard (67.4% vs 16.3%; P<0.01).
| Impact | Control Group, N=72, n (%) | Intervention Group, N=66, n (%) | P Value |
|---|---|---|---|
| Patient correctly named 1 hospital physician | 42 (58.3) | 46 (69.7) | 0.17 |
| Patient correctly named role of hospital physician | 12 (16.7) | 34 (51.5) | <0.01 |
| Did Not Receive Facecard, N=92 | Received Facecard, N=46 | P Value | |
| Patient correctly named 1 hospital physician | 47 (51.1) | 41 (89.1) | <0.01 |
| Patient correctly named role of hospital physician | 15 (16.3) | 31 (67.4) | <0.01 |
Levels of Satisfaction, Trust, and Agreement
Overall, patients had high levels of satisfaction, trust, and agreement with hospital physicians. The overall satisfaction with physician communication was 75.6% (mean of top‐box scores across all 3 items), and 81 of 138 (58.7%) patients gave top‐box ratings to all 3 physician‐communicationsatisfaction items. Ninety‐seven of 137 (70.8%) patients rated overall hospital care as 9 or 10. The mean trust score for all patients was 40.77.8 and the median was 41.5 (interquartile range, 3747). The mean agreement score for all patients was 12.42.4 and the median was 12 (interquartile range, 1115). As shown in Table 3, satisfaction, trust, and agreement were similar for patients in the intervention group compared with the control group. Patients who received a facecard rated satisfaction, trust, and agreement slightly higher compared with those who had not received a facecard, but the results were not statistically significant.
| Ratings | Control Group, N=72 | Intervention Group, N=66 | P Value |
|---|---|---|---|
| |||
| Satisfaction with physicians, n (%)a | 39 (54.2) | 42 (63.6) | 0.26 |
| Overall hospital satisfaction, n (%)b | 51 (70.8) | 46 (70.8) | 0.99 |
| Median trust (IQR)c | 42 (3747) | 41 (3746) | 0.81 |
| Median agreement (IQR)c | 12 (1115) | 12 (1215) | 0.72 |
| Did Not Receive Facecard, N=92 | Received Facecard, N=46 | P Value | |
| Satisfaction with physicians, n (%)a | 51 (55.4) | 30 (65.2) | 0.27 |
| Overall hospital satisfaction, n (%)b | 64 (69.6) | 33 (73.3) | 0.65 |
| Median trust (IQR)c | 41 (3547) | 42 (3847) | 0.32 |
| Median agreement (IQR)c | 12 (1114.5) | 12.5 (1215) | 0.37 |
DISCUSSION
We found that receipt of physician facecards significantly improved patients' knowledge of the names and roles of hospital physicians but had little to no impact on satisfaction, trust, or agreement with physicians. Our finding of improved knowledge of the names and roles of physician providers is consistent with prior studies using similar interventions.[7, 8, 9] Facecards may have prompted more effective introductions on the part of physicians and may have served as memory aids for patients to better retain information about their newly introduced hospital physicians.
Patient receipt of the facecard on intervention units was incomplete in our study. Despite engagement of physicians in designing cards that could easily fit into lab coats and a robust strategy to inform and motivate physician delivery of facecards, only 68% of intended patients received them. Although not explicitly reported, prior studies appear to have similarly struggled to deliver interventions consistently. Arora and colleagues reported that facecards were visible in only 59% of patients' rooms among those able to correctly identify 1 of their physicians.[8] A post hoc survey of physicians involved in our study revealed the biggest impediment to delivering facecards was simply forgetting to do so (data not shown). Technologic innovations may help by automating the identification of providers. For example, the University of Pittsburgh Medical Center has piloted smart rooms that use sensor technology to announce the name and role of providers as they enter patients' rooms.[26]
We hypothesized that facecards might improve other important aspects of the patient‐physicians relationship. Although levels of patient satisfaction were slightly higher in patients who had received facecards, the results were not statistically significant. Levels of trust and agreement were minimally higher in patients who received facecards, and the results were not statistically significant. Notably, baseline levels of trust and agreement were higher than we had expected. In fact, levels of trust were nearly identical to those seen in a prior study of outpatients who had been with the same physician for a median of 4 years.[22] Patients in our study may have had high levels of trust in the hospital and transferred this trust to their assigned physicians as representatives of the organization. The high level of agreement may relate to patients' tendency to prefer a more passive role as they encounter serious illness.[27, 28] Paradoxically, these findings may impede optimal patient care. The high levels of trust and agreement in the current study suggest that patients may not question their physicians to clarify plans and the rationale behind them. Prior research has shown that deficits in patients' comprehension of the care plan are often not apparent to patients or their physicians.[4, 29, 30]
Our study has several limitations. First, we assessed an intervention involving 4 units in a single hospital. Generalizability may be limited, as physician‐staffing models, hospitals, and the patients they serve vary. Second, as previously mentioned, patients in the intervention group did not receive physician facecards as consistently as intended. We conducted analyses based on treatment received in an effort to evaluate the impact of facecards if optimally delivered. Third, questions assessing satisfaction, trust, and agreement did not specifically ask patients to reflect on care provided by the primary physician team. It is possible that interactions with other physicians (ie, consultants) may have influenced these results. Fourth, we were underpowered to detect statistically significant improvements in satisfaction, trust, or agreement resulting from our intervention. Assuming the intervention might truly improve satisfaction with physicians from 54.2% to 63.6%, we would have needed 900 patients (ie, 450 each for the intervention and control groups) to have 80% power to detect a statistically significant difference. However, our results show that patients have high levels of trust and agreement with hospital physicians despite the relative lack of familiarity. Therefore, any existing deficits in hospitalized patients' comprehension of the care plan do not appear to be exacerbated by a lack of trust and/or agreement with treating physicians.
CONCLUSION
In summary, we found that physician facecards significantly improved patients' knowledge of the names and roles of hospital physicians but had little to no impact on satisfaction, trust, or agreement with physicians. Baseline levels of satisfaction, trust, and agreement were high, suggesting lack of familiarity with hospital physicians does not impede these important aspects of the patient‐physician relationship. Larger studies are needed to definitively assess the impact of facecards on satisfaction, trust, and agreement with physicians.
Acknowledgments
The authors express their gratitude to members of the NMH Patient and Family Advisory Council for providing input on the design of the physician facecard.
Disclosures: This study was supported by a grant from the Globe Foundation. The authors report no conflicts of interest.
- , , , , , . Ability of hospitalized patients to identify their in‐hospital physicians. Arch Intern Med. 2009;169(2):199–201.
- , . Does your patient know your name? An approach to enhancing patients' awareness of their caretaker's name. J Healthc Qual. 2005;27(4):53–56.
- , , Hospitalized patients' understanding of their plan of care. Mayo Clin Proc. 2010;85(1):47–52.
- , . Communication discrepancies between physicians and hospitalized patients. Arch Intern Med. 2010;170(15):1302–1307.
- Accreditation Council for Graduate Medical Education. Common program requirements. Available at: http://www.acgme.org/acgmeweb/Portals/0/PFAssets/ProgramRequirements/CPRs2013.pdf. Revised July 1, 2013.
- , , , et al. Transitions of Care Consensus policy statement: American College of Physicians, Society of General Internal Medicine, Society of Hospital Medicine, American Geriatrics Society, American College Of Emergency Physicians, and Society for Academic Emergency Medicine. J Hosp Med. 2009;4(6):364–370.
- , , . Increasing a patient's ability to identify his or her attending physician using a patient room display. Arch Intern Med. 2010;170(12):1084–1085.
- , , , et al. Improving inpatients' identification of their doctors: use of FACE cards. Jt Comm J Qual Patient Saf. 2009;35(12):613–619.
- , , . Patient satisfaction associated with correct identification of physician's photographs. Mayo Clin Proc. 2001;76(6):604–608.
- , , , , , . Physician‐patient relationship and medication compliance: a primary care investigation. Ann Fam Med. 2004;2(5):455–461.
- , , , , . Trust in the health care system and the use of preventive health services by older black and white adults. Am J Public Health. 2009;99(7):1293–1299.
- , , , . The role of patient‐physician trust in moderating medication nonadherence due to cost pressures. Arch Intern Med. 2005;165(15):1749–1755.
- , , . Trust and the acceptance of and adherence to antiretroviral therapy. J Acquir Immune Defic Syndr. 2001;28(1):47–58.
- , , , , , . Linking primary care performance to outcomes of care. J Fam Pract. 1998;47(3):213–220.
- , , , ; The Stanford Trust Study Physicians. Further validation and reliability testing of the Trust in Physician Scale. Med Care. 1999;37(5):510–517.
- , , , , , . The physician's actions and the outcome of illness in family practice. J Fam Pract. 1986;23(1):43–47.
- , , , , . Brief Report: Patient‐physician agreement as a predictor of outcomes in patients with back pain. J Gen Intern Med. 2005;20(10):935–937.
- , , , , , . The influence of patient‐practitioner agreement on outcome of care. Am J Public Health. 1981;71(2):127–131.
- , , , et al. Impact of localizing physicians to hospital units on nurse‐physician communication and agreement on the plan of care. J Gen Intern Med. 2009;24(11):1223–1227.
- , , , . The Lexile Framework. Durham, NC: Metametrics, Inc.; 1998.
- National Center for Education Statistics; , . Assessing the Lexile Framework: results of a panel meeting. NCES Working Paper Series, No. 2001‐08. Washington, DC: US Department of Education, Office of Educational Research and Improvement; 2001.
- , , , et al. Measuring patients' trust in their primary care providers. Med Care Res Rev. 2002;59(3):293–318.
- , , , , , . The association of patient trust and self‐care among patients with diabetes mellitus. BMC Fam Pract. 2004;5:26.
- , , , , . Development, implementation, and public reporting of the HCAHPS survey. Med Care Res Rev. 2010;67(1):27–37.
- , , , , . Measuring hospital care from the patients' perspective: an overview of the CAHPS Hospital Survey development process. Health Serv Res. 2005;40(6 pt 2):1977–1995.
- . Smart rooms, smart care delivery: UPMC clinician leaders leverage technology for greater effectiveness in patient care. Healthc Inform. 2011;28(9):36, 38–39, 42.
- , . Decision making during serious illness: what role do patients really want to play? J Clin Epidemiol. 1992;45(9):941–950.
- , , , , . The dynamics of change: cancer patients' preferences for information, involvement and support. Ann Oncol. 1997;8(9):857–863.
- , , , et al. Patient‐physician communication at hospital discharge and patients' understanding of the postdischarge treatment plan. Arch Intern Med. 1997;157(9):1026–1030.
- , , , , , . Patient comprehension of emergency department care and instructions: are patients aware of when they do not understand? Ann Emerg Med. 2009;53(4):454.e15–461.e15.
The patient‐physician relationship is fundamental to safe and effective care. Hospital settings present unique challenges to this partnership, including the lack of a prior relationship for hospital‐based physicians, rapid pace of clinical care, and dynamic nature of inpatient medical teams. Prior studies document that a majority of hospitalized patients are unable to correctly identify their physicians or nurses, and patients in teaching hospitals have difficulty understanding their physicians' level of training.[1, 2, 3, 4] Acknowledging these deficits, professional societies and the Accreditation Council for Graduate Medical Education (ACMGE) have issued policies stating that patients and caregivers need to know who is responsible at every point during patient care.[5, 6] These policies do not, however, make recommendations on methods to achieve better understanding.
Simple interventions improve patients' ability to correctly identify the names and roles of their hospital physicians. Maniaci and colleagues found that patients were better able to identify attending physicians when their names were written on the dry‐erase board in the room.[7] Arora and colleagues asked hospital physicians to give facecards, which included their picture and a description of their role, to patients.[8] Patients were more likely to correctly identify 1 physicians, but, surprisingly, less likely to understand physicians' roles. In a similar study, Francis and colleagues placed photographs with names of the attending and resident physicians on the wall in patient rooms.[9] Patients who had photographs of their physicians on the wall were more likely to correctly identify physicians on their team compared with patients who had no photographs. Additionally, patients who were able to identify more physicians rated satisfaction with physicians higher in 2 of 6 survey questions used. However, the study was limited by the use of a nonvalidated instrument to assess patient satisfaction and the use of an intermediate outcome (ie, ability to identify physicians) as the independent variable rather than the intervention itself (ie, physician photographs).
Beyond satisfaction, lack of familiarity may negatively impact patients' trust and agreement with hospital physicians. Trust and agreement are important predictors of adherence to recommended treatment in outpatient settings[10, 11, 12, 13, 14, 15, 16, 17, 18] but have not been adequately evaluated in hospital settings. Therefore, we sought to pilot the use of physician facecards and assess their potential impact on patients' knowledge of physicians' names and roles as well as patient satisfaction, trust, and agreement with physicians.
METHODS
Setting and Study Design
We performed a cluster randomized controlled trial at Northwestern Memorial Hospital (NMH), an 897‐bed tertiary‐care teaching hospital in Chicago, Illinois. One of 2 similar hospitalist service units and 1 of 2 similar teaching‐service units were randomly selected to implement the use of physician facecards. General medical patients were admitted to the study units by NMH bed‐assignment personnel subject to unit bed availability. No other criteria (eg, diagnosis, severity of illness, or source of patient admission) were used in patient assignment. Each unit consisted of 30 beds, with the exception of 1 hospitalist unit, which had 23. As a result of a prior intervention, physicians were localized to care for patients on specific units.[19] Hospitalist units were each staffed by hospitalists who worked in 7‐day rotations without the assistance of residents or midlevel providers. Teaching units were staffed by physician teams consisting of 1 attending, 1 senior resident, 1 intern, and 1 or 2 third‐year medical students. No fourth‐year students (ie, acting interns) rotated on these services during the study period. Housestaff worked in 4‐week rotations, and attending physicians on the teaching service worked in 2‐week rotations.
Patient rooms included a whiteboard facing the patient with a template prompting insertion of physician name(s). Nurses had the primary responsibility for completing information on the whiteboards.
Physician Facecard
We created draft physician facecards featuring pictures of physicians and descriptions of their roles. We used Lexile analysis, a widely used measure of reading difficulty, to improve readability in an iterative fashion.[20, 21] We then sought feedback at hospitalist and resident meetings. Specifically, we asked for suggested revisions to content and recommendations on reliable methods to deliver facecards to patients. Teaching physicians felt strongly that each team member should be listed and shown on 1 card, which would fit easily into a lab‐coat pocket. We similarly engaged the NMH Patient and Family Advisory Council to seek recommended revisions to content and delivery of the facecards. The Council consists of 18 patient and caregiver members who meet regularly to provide input on hospital programs and proposals. Council members felt strongly that physicians should deliver the cards themselves during their initial introduction, rather than having patients receive cards by other means (eg, as part of unit orientation materials delivered by nonphysician staff members). We incorporated feedback from these stakeholder groups into a final version of the physician facecard and method for delivery (Figure 1).
We implemented the use of facecards from May to June 2012. Physicians on intervention units were informed of the study via email, and one of the co‐investigators (T.C.) distributed a supply of facecards to these physicians at the start of each rotation. This distribution was performed in person, and physicians were instructed to provide a facecard to each new patient during their first encounter. We also placed facecards in easily visible cardholders at the nurses' station on intervention units. Reminder emails were sent once each week to reinforce physician delivery of facecards.
Data Collection and Measures
Each weekday during the study period, we randomly selected patients for structured interviews in the afternoon of their second or third hospital day. We did not conduct interviews on the first day of physicians' rotations and excluded patients whose preferred language was not English and those disoreinted to person, place, or time.
Patients were asked to name the physician(s) primarily responsible for their hospital care and to state the role of each physician they identified. We documented receipt of facecards if one was viewed during the interview and by asking patients if they had received one. We also documented whether 1 correct physician names were written on the whiteboard in the patients' rooms. We used questions from the Hospital Consumer Assessment of Healthcare Providers and Systems (HCAHPS) survey to assess satisfaction with physician communication and overall hospital care. HCAHPS is a validated patient‐satisfaction survey developed by the Agency for Healthcare Research and Quality (AHRQ) to assess hospitalized patients' experiences with care. Physician‐communication questions used ordinal response options of never, sometimes, usually, and always. Overall hospital rating was assessed using a 010 scale with 0=worst hospital possible and 10=best hospital possible. Trust with physicians was assessed using the Wake Forest University Trust Scale.[22] Prior research using this instrument has shown an association between trust and self‐management behaviors.[23] This 10‐item scale uses a 5‐point Likert scale and generates scores ranging from 10 to 50. Agreement with physicians was assessed using 3 questions used in a prior study by Staiger and colleagues showing an association between levels of agreement and health outcomes among outpatients treated for back pain.[17] Specifically, we asked patients to rate their agreement with hospital physicians' (1) explanation for the cause of primary symptoms, (2) plan for diagnostic tests, and (3) suggested plan for treatment using a 5‐point Likert scale. The agreement scale generated scores ranging from 3 to 15.
Approval for the study was obtained from the institutional review board of Northwestern University.
Statistical Analysis
Patient demographic data were obtained from the electronic health record and complemented data from interviews. We used [2] and t tests to compare patient characteristics. We used [2] tests to compare the percentage of patients able to correctly identify 1 of their physicians and 1 of their physicians' roles. We used [2] tests to compare the percentage of patients giving top‐box ratings to all 3 physician‐communicationsatisfaction questions (ie, always) and giving an overall hospital rating of 9 or 10. We used top‐box comparisons, rather than comparison of mean or median scores, because patient‐satisfaction data are typically highly skewed toward favorable responses. This approach is consistent with prior HCAHPS research.[24, 25] We used Mann‐Whitney U tests to compare ratings of trust and agreement. Because delivery of facecards was imperfect, we performed analyses both by intention to treat (ie, intervention vs control units) and based on treatment received (ie, received a facecard vs did not receive a facecard). All analyses were conducted using Stata version 11.2 (StataCorp, College Station, TX).
RESULTS
Study Subjects and Facecard Receipt
Overall, 217 patients were approached for interview. Thirty‐six were excluded because of disorientation, 12 were excluded because their preferred language was not English, and 31 declined to participate in the study. Patient characteristics for the 138 study patients are shown in Table 1. There were no significant differences in patient age, sex, or race. There was no significant difference in the percentage of patients with 1 correct physicians listed on the whiteboard in the room. Delivery of facecards was incomplete, with only 68% of intervention‐unit patients confirmed as having received them. A higher percentage of patients on the hospitalist intervention unit received facecards (23 of 30; 76.7%) than on the teaching intervention unit (22 of 36; 61.1%), but the difference was not statistically significant (P=0.18). There were no significant differences in age, sex, or race between patients who received a facecard compared with those who did not.
| Characteristic | Control Group, N=72 | Intervention Group, N=66 | P Value |
|---|---|---|---|
| |||
| Mean age, years (SD) | 56.8 (18.0) | 55.2 (18.2) | 0.62 |
| Women, n (%) | 35 (48.6) | 28 (42.4) | 0.47 |
| Nonwhite race, n (%) | 35 (50.7) | 36 (57.1) | 0.46 |
| Teaching unit, n (%) | 34 (47.2) | 36 (54.6) | 0.39 |
| Correct physician name on whiteboard, n (%)a | 46 (76.7) | 37 (72.6) | 0.62 |
| Received a facecard, n (%) | 1 (1) | 45 (68.2) | <0.01 |
Patients' Knowledge of Physicians
As shown in Table 2, more patients in the intervention group were able to correctly identify 1 of their treating physicians compared with the control group, but the result was not statistically significant (69.7% vs 58.3%; P=0.17). A significantly larger percentage of patients in the intervention group were able to identify the role of their hospital physicians (51.5% vs 16.7%; P<0.01). When comparing those that received a facecard and those that did not, patients who were given a facecard were more likely to correctly identify their hospital physician (89.1% vs 51.1%; P<0.01). Similarly, patients who had received a facecard were more likely to correctly identify the role of their hospital physician than patients who had not received a facecard (67.4% vs 16.3%; P<0.01).
| Impact | Control Group, N=72, n (%) | Intervention Group, N=66, n (%) | P Value |
|---|---|---|---|
| Patient correctly named 1 hospital physician | 42 (58.3) | 46 (69.7) | 0.17 |
| Patient correctly named role of hospital physician | 12 (16.7) | 34 (51.5) | <0.01 |
| Did Not Receive Facecard, N=92 | Received Facecard, N=46 | P Value | |
| Patient correctly named 1 hospital physician | 47 (51.1) | 41 (89.1) | <0.01 |
| Patient correctly named role of hospital physician | 15 (16.3) | 31 (67.4) | <0.01 |
Levels of Satisfaction, Trust, and Agreement
Overall, patients had high levels of satisfaction, trust, and agreement with hospital physicians. The overall satisfaction with physician communication was 75.6% (mean of top‐box scores across all 3 items), and 81 of 138 (58.7%) patients gave top‐box ratings to all 3 physician‐communicationsatisfaction items. Ninety‐seven of 137 (70.8%) patients rated overall hospital care as 9 or 10. The mean trust score for all patients was 40.77.8 and the median was 41.5 (interquartile range, 3747). The mean agreement score for all patients was 12.42.4 and the median was 12 (interquartile range, 1115). As shown in Table 3, satisfaction, trust, and agreement were similar for patients in the intervention group compared with the control group. Patients who received a facecard rated satisfaction, trust, and agreement slightly higher compared with those who had not received a facecard, but the results were not statistically significant.
| Ratings | Control Group, N=72 | Intervention Group, N=66 | P Value |
|---|---|---|---|
| |||
| Satisfaction with physicians, n (%)a | 39 (54.2) | 42 (63.6) | 0.26 |
| Overall hospital satisfaction, n (%)b | 51 (70.8) | 46 (70.8) | 0.99 |
| Median trust (IQR)c | 42 (3747) | 41 (3746) | 0.81 |
| Median agreement (IQR)c | 12 (1115) | 12 (1215) | 0.72 |
| Did Not Receive Facecard, N=92 | Received Facecard, N=46 | P Value | |
| Satisfaction with physicians, n (%)a | 51 (55.4) | 30 (65.2) | 0.27 |
| Overall hospital satisfaction, n (%)b | 64 (69.6) | 33 (73.3) | 0.65 |
| Median trust (IQR)c | 41 (3547) | 42 (3847) | 0.32 |
| Median agreement (IQR)c | 12 (1114.5) | 12.5 (1215) | 0.37 |
DISCUSSION
We found that receipt of physician facecards significantly improved patients' knowledge of the names and roles of hospital physicians but had little to no impact on satisfaction, trust, or agreement with physicians. Our finding of improved knowledge of the names and roles of physician providers is consistent with prior studies using similar interventions.[7, 8, 9] Facecards may have prompted more effective introductions on the part of physicians and may have served as memory aids for patients to better retain information about their newly introduced hospital physicians.
Patient receipt of the facecard on intervention units was incomplete in our study. Despite engagement of physicians in designing cards that could easily fit into lab coats and a robust strategy to inform and motivate physician delivery of facecards, only 68% of intended patients received them. Although not explicitly reported, prior studies appear to have similarly struggled to deliver interventions consistently. Arora and colleagues reported that facecards were visible in only 59% of patients' rooms among those able to correctly identify 1 of their physicians.[8] A post hoc survey of physicians involved in our study revealed the biggest impediment to delivering facecards was simply forgetting to do so (data not shown). Technologic innovations may help by automating the identification of providers. For example, the University of Pittsburgh Medical Center has piloted smart rooms that use sensor technology to announce the name and role of providers as they enter patients' rooms.[26]
We hypothesized that facecards might improve other important aspects of the patient‐physicians relationship. Although levels of patient satisfaction were slightly higher in patients who had received facecards, the results were not statistically significant. Levels of trust and agreement were minimally higher in patients who received facecards, and the results were not statistically significant. Notably, baseline levels of trust and agreement were higher than we had expected. In fact, levels of trust were nearly identical to those seen in a prior study of outpatients who had been with the same physician for a median of 4 years.[22] Patients in our study may have had high levels of trust in the hospital and transferred this trust to their assigned physicians as representatives of the organization. The high level of agreement may relate to patients' tendency to prefer a more passive role as they encounter serious illness.[27, 28] Paradoxically, these findings may impede optimal patient care. The high levels of trust and agreement in the current study suggest that patients may not question their physicians to clarify plans and the rationale behind them. Prior research has shown that deficits in patients' comprehension of the care plan are often not apparent to patients or their physicians.[4, 29, 30]
Our study has several limitations. First, we assessed an intervention involving 4 units in a single hospital. Generalizability may be limited, as physician‐staffing models, hospitals, and the patients they serve vary. Second, as previously mentioned, patients in the intervention group did not receive physician facecards as consistently as intended. We conducted analyses based on treatment received in an effort to evaluate the impact of facecards if optimally delivered. Third, questions assessing satisfaction, trust, and agreement did not specifically ask patients to reflect on care provided by the primary physician team. It is possible that interactions with other physicians (ie, consultants) may have influenced these results. Fourth, we were underpowered to detect statistically significant improvements in satisfaction, trust, or agreement resulting from our intervention. Assuming the intervention might truly improve satisfaction with physicians from 54.2% to 63.6%, we would have needed 900 patients (ie, 450 each for the intervention and control groups) to have 80% power to detect a statistically significant difference. However, our results show that patients have high levels of trust and agreement with hospital physicians despite the relative lack of familiarity. Therefore, any existing deficits in hospitalized patients' comprehension of the care plan do not appear to be exacerbated by a lack of trust and/or agreement with treating physicians.
CONCLUSION
In summary, we found that physician facecards significantly improved patients' knowledge of the names and roles of hospital physicians but had little to no impact on satisfaction, trust, or agreement with physicians. Baseline levels of satisfaction, trust, and agreement were high, suggesting lack of familiarity with hospital physicians does not impede these important aspects of the patient‐physician relationship. Larger studies are needed to definitively assess the impact of facecards on satisfaction, trust, and agreement with physicians.
Acknowledgments
The authors express their gratitude to members of the NMH Patient and Family Advisory Council for providing input on the design of the physician facecard.
Disclosures: This study was supported by a grant from the Globe Foundation. The authors report no conflicts of interest.
- , , , , , . Ability of hospitalized patients to identify their in‐hospital physicians. Arch Intern Med. 2009;169(2):199–201.
- , . Does your patient know your name? An approach to enhancing patients' awareness of their caretaker's name. J Healthc Qual. 2005;27(4):53–56.
- , , Hospitalized patients' understanding of their plan of care. Mayo Clin Proc. 2010;85(1):47–52.
- , . Communication discrepancies between physicians and hospitalized patients. Arch Intern Med. 2010;170(15):1302–1307.
- Accreditation Council for Graduate Medical Education. Common program requirements. Available at: http://www.acgme.org/acgmeweb/Portals/0/PFAssets/ProgramRequirements/CPRs2013.pdf. Revised July 1, 2013.
- , , , et al. Transitions of Care Consensus policy statement: American College of Physicians, Society of General Internal Medicine, Society of Hospital Medicine, American Geriatrics Society, American College Of Emergency Physicians, and Society for Academic Emergency Medicine. J Hosp Med. 2009;4(6):364–370.
- , , . Increasing a patient's ability to identify his or her attending physician using a patient room display. Arch Intern Med. 2010;170(12):1084–1085.
- , , , et al. Improving inpatients' identification of their doctors: use of FACE cards. Jt Comm J Qual Patient Saf. 2009;35(12):613–619.
- , , . Patient satisfaction associated with correct identification of physician's photographs. Mayo Clin Proc. 2001;76(6):604–608.
- , , , , , . Physician‐patient relationship and medication compliance: a primary care investigation. Ann Fam Med. 2004;2(5):455–461.
- , , , , . Trust in the health care system and the use of preventive health services by older black and white adults. Am J Public Health. 2009;99(7):1293–1299.
- , , , . The role of patient‐physician trust in moderating medication nonadherence due to cost pressures. Arch Intern Med. 2005;165(15):1749–1755.
- , , . Trust and the acceptance of and adherence to antiretroviral therapy. J Acquir Immune Defic Syndr. 2001;28(1):47–58.
- , , , , , . Linking primary care performance to outcomes of care. J Fam Pract. 1998;47(3):213–220.
- , , , ; The Stanford Trust Study Physicians. Further validation and reliability testing of the Trust in Physician Scale. Med Care. 1999;37(5):510–517.
- , , , , , . The physician's actions and the outcome of illness in family practice. J Fam Pract. 1986;23(1):43–47.
- , , , , . Brief Report: Patient‐physician agreement as a predictor of outcomes in patients with back pain. J Gen Intern Med. 2005;20(10):935–937.
- , , , , , . The influence of patient‐practitioner agreement on outcome of care. Am J Public Health. 1981;71(2):127–131.
- , , , et al. Impact of localizing physicians to hospital units on nurse‐physician communication and agreement on the plan of care. J Gen Intern Med. 2009;24(11):1223–1227.
- , , , . The Lexile Framework. Durham, NC: Metametrics, Inc.; 1998.
- National Center for Education Statistics; , . Assessing the Lexile Framework: results of a panel meeting. NCES Working Paper Series, No. 2001‐08. Washington, DC: US Department of Education, Office of Educational Research and Improvement; 2001.
- , , , et al. Measuring patients' trust in their primary care providers. Med Care Res Rev. 2002;59(3):293–318.
- , , , , , . The association of patient trust and self‐care among patients with diabetes mellitus. BMC Fam Pract. 2004;5:26.
- , , , , . Development, implementation, and public reporting of the HCAHPS survey. Med Care Res Rev. 2010;67(1):27–37.
- , , , , . Measuring hospital care from the patients' perspective: an overview of the CAHPS Hospital Survey development process. Health Serv Res. 2005;40(6 pt 2):1977–1995.
- . Smart rooms, smart care delivery: UPMC clinician leaders leverage technology for greater effectiveness in patient care. Healthc Inform. 2011;28(9):36, 38–39, 42.
- , . Decision making during serious illness: what role do patients really want to play? J Clin Epidemiol. 1992;45(9):941–950.
- , , , , . The dynamics of change: cancer patients' preferences for information, involvement and support. Ann Oncol. 1997;8(9):857–863.
- , , , et al. Patient‐physician communication at hospital discharge and patients' understanding of the postdischarge treatment plan. Arch Intern Med. 1997;157(9):1026–1030.
- , , , , , . Patient comprehension of emergency department care and instructions: are patients aware of when they do not understand? Ann Emerg Med. 2009;53(4):454.e15–461.e15.
© 2013 Society of Hospital Medicine
Evidence Needing a Lift
In this issue of the Journal of Hospital Medicine, Hansen and colleagues provide a first, early look at the effectiveness of the BOOST intervention to reduce 30‐day readmissions among hospitalized patients.[1] BOOST[2] is 1 of a number of care transition improvement methodologies that have been applied to the problem of readmissions, each of which has evidence to support its effectiveness in its initial settings[3, 4] but has proven to be difficult to translate to other sites.[5, 6, 7]
BOOST stands in contrast with other, largely research protocol‐derived, programs in that it allows sites to tailor adoption of recommendations to local contexts and is therefore potentially more feasible to implement. Feasibility and practicality has led BOOST to be adopted in large national settings, even if it has had little evidence to support its effectiveness to date.
Given the nonstandardized and ad hoc nature of most multicenter collaboratives generally, and the flexibility of the BOOST model specifically, the BOOST authors are to be commended for undertaking any evaluation at all. Perhaps, not surprisingly, they encountered many of the problems associated with a multicenter studydropout of sites, problematic data, and limited evidence for adoption of the intervention at participating hospitals. Although these represent real‐world experiences of a quality‐improvement program, as a group they pose a number of problems that limit the study's robustness, and generate important caveats that readers should use to temper their interpretation of the authors' findings.
The first caveat relates to the substantial number of sites that either dropped out of BOOST or failed to submit data after enlisting in the collaborative. Although this may be common in quality improvement collaboratives, similar problems would not be permissible in a trial of a new drug or device. Dropout and selected ability to contribute data suggest that the ability to fully adopt BOOST may not be universal, and raises the possibility of bias, because the least successful sites may have had less interest in remaining engaged and submitting data.
The second caveat relates to how readmission rates were assessed. Because sites provided rates of readmissions at the unit level rather than the actual counts of admissions or readmissions, the authors were unable to conduct statistical analyses typically performed for these interventions, such as time series or difference‐in‐difference analyses. More importantly, one cannot discern whether their results are driven by a small absolute but large relative change in the number of readmissions at small sites. That is, large percentage changes of low statistical significance could have misleadingly affected the overall results. Conversely, we cannot identify large sites where a similar relative reduction could be statistically significant and more broadly interpreted as representing the real effectiveness of BOOST efforts.
The third caveat is in regard to the data describing the sites' performance. The effectiveness of BOOST in this analysis varied greatly among sites, with only 1 site showing a strong reduction in readmission rate, and nearly all others showing no statistical improvements. In fact, it appears that their overall results were almost entirely driven by the improvements at that 1 site.
Variable effectiveness of an intervention can be related to variable adoption or contextual factors (such as availability of personnel to implement the program). Although these authors have data on BOOST programmatic adoption, they do not have qualitative data on local barriers and facilitators to BOOST implementation, which at this stage of evaluation would be particularly valuable in understanding the results. Analyzing site‐level effectiveness is of growing relevance to multicenter quality improvement collaboratives,[8, 9] but this evaluation provides little insight into reasons for variable success across institutions.
Finally, their study design does not allow us to understand a number of key questions. How many patients were involved in the intervention? How many patients received all BOOST‐recommended interventions? Which of these interventions seemed most effective in which patients? To what degree did patient severity of illness, cognitive status, social supports, or access to primary care influence readmission risk? Such information would help frame cost‐effective deployment of BOOST or related tools.
In the end, it seems unlikely that this iteration of the BOOST program produced broad reductions in readmission rates. Having said this, the authors provide the necessary start down the road toward a fuller understanding of real‐world efforts to reduce readmissions. Stated alternately, the nuances and flaws of this study provide ample fodder for others working in the field. BOOST is in good stead with other care transition models that have not translated well from their initial research environment to real‐world practices. The question now is: Do any of these interventions actually work in clinical practice settings, and will we ever know? Even more fundamentally, how important and meaningful are these hospital‐based care transition interventions? Where is the engagement with primary care? Where are the primary care outcomes? Does BOOST truly impact outcomes other than readmission?[10]
Doing high‐quality research in the context of a rapidly evolving quality improvement program is hard. Doing it at more than 1 site is harder. BOOST's flexibility is both a great source of strength and a clear challenge to rigorous evaluation. However, when the costs of care transition programs are so high, and the potential consequences of high readmission rates are so great for patients and for hospitals, the need to address these issues with real data and better evidence is paramount. We look forward to the next phase of BOOST and to the growth and refinement of the evidence base for how to improve care coordination and transitions effectively.
- , , , et al. Project BOOST: effectiveness of a multihospital effort to reduce rehospitalization. J Hosp Med. 2013;8:421–427.
- , . BOOSTing the hospital discharge. J Hosp Med. 2009;4:209–210.
- , , , et al. A reengineered hospital discharge program to decrease rehospitalization: a randomized trial. Ann Intern Med. 2009;150:178–187.
- , , , et al. Comprehensive discharge planning and home follow‐up of hospitalized elders: a randomized clinical trial. JAMA. 1999;281:613–620.
- , , , et al. Effectiveness and cost of a transitional care program for heart failure: a prospective study with concurrent controls. Arch Intern Med. 2011;171:1238–1243.
- . Hospitals question Medicare rules on readmissions. New York Times. March 29, 2013. Available at: http://www.nytimes.com/2013/03/30/business/hospitals‐question‐fairness‐of‐new‐medicare‐rules.html?pagewanted=all
In this issue of the Journal of Hospital Medicine, Hansen and colleagues provide a first, early look at the effectiveness of the BOOST intervention to reduce 30‐day readmissions among hospitalized patients.[1] BOOST[2] is 1 of a number of care transition improvement methodologies that have been applied to the problem of readmissions, each of which has evidence to support its effectiveness in its initial settings[3, 4] but has proven to be difficult to translate to other sites.[5, 6, 7]
BOOST stands in contrast with other, largely research protocol‐derived, programs in that it allows sites to tailor adoption of recommendations to local contexts and is therefore potentially more feasible to implement. Feasibility and practicality has led BOOST to be adopted in large national settings, even if it has had little evidence to support its effectiveness to date.
Given the nonstandardized and ad hoc nature of most multicenter collaboratives generally, and the flexibility of the BOOST model specifically, the BOOST authors are to be commended for undertaking any evaluation at all. Perhaps, not surprisingly, they encountered many of the problems associated with a multicenter studydropout of sites, problematic data, and limited evidence for adoption of the intervention at participating hospitals. Although these represent real‐world experiences of a quality‐improvement program, as a group they pose a number of problems that limit the study's robustness, and generate important caveats that readers should use to temper their interpretation of the authors' findings.
The first caveat relates to the substantial number of sites that either dropped out of BOOST or failed to submit data after enlisting in the collaborative. Although this may be common in quality improvement collaboratives, similar problems would not be permissible in a trial of a new drug or device. Dropout and selected ability to contribute data suggest that the ability to fully adopt BOOST may not be universal, and raises the possibility of bias, because the least successful sites may have had less interest in remaining engaged and submitting data.
The second caveat relates to how readmission rates were assessed. Because sites provided rates of readmissions at the unit level rather than the actual counts of admissions or readmissions, the authors were unable to conduct statistical analyses typically performed for these interventions, such as time series or difference‐in‐difference analyses. More importantly, one cannot discern whether their results are driven by a small absolute but large relative change in the number of readmissions at small sites. That is, large percentage changes of low statistical significance could have misleadingly affected the overall results. Conversely, we cannot identify large sites where a similar relative reduction could be statistically significant and more broadly interpreted as representing the real effectiveness of BOOST efforts.
The third caveat is in regard to the data describing the sites' performance. The effectiveness of BOOST in this analysis varied greatly among sites, with only 1 site showing a strong reduction in readmission rate, and nearly all others showing no statistical improvements. In fact, it appears that their overall results were almost entirely driven by the improvements at that 1 site.
Variable effectiveness of an intervention can be related to variable adoption or contextual factors (such as availability of personnel to implement the program). Although these authors have data on BOOST programmatic adoption, they do not have qualitative data on local barriers and facilitators to BOOST implementation, which at this stage of evaluation would be particularly valuable in understanding the results. Analyzing site‐level effectiveness is of growing relevance to multicenter quality improvement collaboratives,[8, 9] but this evaluation provides little insight into reasons for variable success across institutions.
Finally, their study design does not allow us to understand a number of key questions. How many patients were involved in the intervention? How many patients received all BOOST‐recommended interventions? Which of these interventions seemed most effective in which patients? To what degree did patient severity of illness, cognitive status, social supports, or access to primary care influence readmission risk? Such information would help frame cost‐effective deployment of BOOST or related tools.
In the end, it seems unlikely that this iteration of the BOOST program produced broad reductions in readmission rates. Having said this, the authors provide the necessary start down the road toward a fuller understanding of real‐world efforts to reduce readmissions. Stated alternately, the nuances and flaws of this study provide ample fodder for others working in the field. BOOST is in good stead with other care transition models that have not translated well from their initial research environment to real‐world practices. The question now is: Do any of these interventions actually work in clinical practice settings, and will we ever know? Even more fundamentally, how important and meaningful are these hospital‐based care transition interventions? Where is the engagement with primary care? Where are the primary care outcomes? Does BOOST truly impact outcomes other than readmission?[10]
Doing high‐quality research in the context of a rapidly evolving quality improvement program is hard. Doing it at more than 1 site is harder. BOOST's flexibility is both a great source of strength and a clear challenge to rigorous evaluation. However, when the costs of care transition programs are so high, and the potential consequences of high readmission rates are so great for patients and for hospitals, the need to address these issues with real data and better evidence is paramount. We look forward to the next phase of BOOST and to the growth and refinement of the evidence base for how to improve care coordination and transitions effectively.
- , , , et al. Project BOOST: effectiveness of a multihospital effort to reduce rehospitalization. J Hosp Med. 2013;8:421–427.
- , . BOOSTing the hospital discharge. J Hosp Med. 2009;4:209–210.
- , , , et al. A reengineered hospital discharge program to decrease rehospitalization: a randomized trial. Ann Intern Med. 2009;150:178–187.
- , , , et al. Comprehensive discharge planning and home follow‐up of hospitalized elders: a randomized clinical trial. JAMA. 1999;281:613–620.
- , , , et al. Effectiveness and cost of a transitional care program for heart failure: a prospective study with concurrent controls. Arch Intern Med. 2011;171:1238–1243.
- . Hospitals question Medicare rules on readmissions. New York Times. March 29, 2013. Available at: http://www.nytimes.com/2013/03/30/business/hospitals‐question‐fairness‐of‐new‐medicare‐rules.html?pagewanted=all
Hospitalist Communication Training
Hospital settings present unique challenges to patient‐clinician communication and collaboration. Patients frequently have multiple, active conditions. Interprofessional teams are large and care for multiple patients at the same time, and team membership is dynamic and dispersed. Moreover, physicians spend relatively little time with patients[1, 2] and seldom receive training in communication skills after medical school.
The Agency for Healthcare Research and Quality (AHRQ) has developed the Hospital Consumer Assessment of Healthcare Providers and Systems (HCAHPS) survey to assess hospitalized patients' experiences with care.[3, 4, 5] Results are publicly reported on the US Department of Health and Human Services Hospital Compare Web site[6] and now affect hospital payment through the Center for Medicare and Medicaid Services Hospital Value‐Based Purchasing Program.[7]
Despite this increased transparency and accountability for performance related to the patient experience, little research has been conducted on how hospitals or clinicians might improve performance. Although interventions to enhance physician communication skills have shown improvements in observed behaviors, few studies have assessed benefit from the patient's perspective and few interventions have been integrated into practice.[8] We sought to assess the impact of a communication‐skills training program, based on a common framework used by hospitals, on patient satisfaction with doctor communication and overall hospital care.
METHODS
Setting and Study Design
The study was conducted at Northwestern Memorial Hospital (NMH), an 897‐bed tertiary‐care teaching hospital in Chicago, IL, and was approved by the institutional review board of Northwestern University. This study was a preintervention vs postintervention comparison of patient‐satisfaction scores. The intervention was a communication‐skills training program for all NMH hospitalists. We compared patient‐satisfaction survey data for patients admitted to the nonteaching hospitalist service during the 26 weeks prior to the intervention with data for patients admitted to the same service during the 22 weeks afterward. Hospitalists on this service worked 7 consecutive days, usually followed by 7 days free from clinical duty. Hospitalists cared for approximately 1014 patients per day without the assistance of resident physicians or midlevel providers (ie, physician assistants or nurse practitioners). Nighttime patient care was provided by in‐house hospitalists (ie, nocturnists). A majority of nighttime shifts were staffed by physicians who worked for the group for a single year. As a result of a prior intervention, hospitalists' patients were localized to specific units, each overseen by a hospitalist‐unit medical director.[9] We excluded all patients initially admitted to other services (eg, intensive care unit, surgical services) and patients discharged from other services.
Hospitalist Communication Skills Training Program
Northwestern Memorial Hospital implemented a communication‐skills training program in 2009 intended to enhance patient experience and improve patient‐satisfaction scores. All nonphysician staff were required to attend a 4‐hour training session based on the AIDET (Acknowledge, Introduce, Duration, Explanation, and Thank You) principles developed by the Studer Group.[10] The Studer Group is a well‐known healthcare consulting firm that aims to assist healthcare organizations to improve clinical, operational, and financial outcomes. The acronym AIDET provides a framework for communication‐skills behaviors (Table 1).
| AIDET Element | Explanation | Examples |
|---|---|---|
| ||
| Acknowledge | Use appropriate greeting, smile, and make eye contact. | Knock on patient's door. Hello, may I come in now? |
| Respect privacy: Knock and ask for permission before entering. Use curtains/doors appropriately. | Good morning. Is it a good time to talk? | |
| Position yourself on the same level as the patient. | Who do you have here with you today? | |
| Do not ignore others in the room (visitors or colleagues). | ||
| Introduce | Introduce yourself by name and role. | My name is Dr. Smith and I am your hospitalist physician. I'll be taking care of you while you are in the hospital. |
| Introduce any accompanying members of your team. | When on teaching service: I'm the supervising physician or I'm the physician in charge of your care. | |
| Address patients by title and last name (eg, Mrs. Smith) unless given permission to use first name. | ||
| Explain why you are there. | ||
| Do not assume patients remember your name or role. | ||
| Duration | Provide specific information on when you will be available, or when you will be back. | I'll be back between 2 and 3 pm, so if you think of any additional questions I can answer them then. |
| For tests/procedures: Explain how long it will take. Provide a time range for when it will happen. | In my experience, the test I am ordering for you will be done within the next 12 to 24 hours. | |
| Provide updates to the patient if the expected wait time has changed. | I should have the results for this test when I see you tomorrow morning. | |
| Do not blame another department or staff for delays. | ||
| Explanation | Explain your rationale for decisions. | I have ordered this test because |
| Use terms the patient can understand. | The possible side effects of this medication include | |
| Explain next steps/summarize plan for the day. | What questions do you have? | |
| Confirm understanding using teach back. | What are you most concerned about? | |
| Assume patients have questions and/or concerns. | I want to make sure you understood everything. Can you tell me in your own words what you will need to do once you are at home? | |
| Do not use acronyms that patients may not understand (eg, PRN, IR, ICU). | ||
| Thank you | Thank the patient and/or family. | I really appreciate you telling me about your symptoms. I know you told several people before. |
| Ask if there is anything else you can do for the patient. | Thank you for giving me the opportunity to care for you. What else can I do for you today? | |
| Explain when you will be back and how the patient can reach you if needed. | I'll see you again tomorrow morning. If you need me before then, just ask the nurse to page me. | |
| Do not appear rushed or distracted when ending your interaction. | ||
We adapted the AIDET framework and designed a communication‐skills training program, specifically for physicians, to emphasize reflection on current communication behaviors, deliberate practice of enhanced communication skills, and feedback based on performance during simulated and real clinical encounters. These educational methods are consistent with recommended strategies to improve behavioral performance.[11] During the first session, we discussed measurement of patient satisfaction, introduced AIDET principles, gave examples of specific behaviors for each principle, and had participants view 2 short videos displaying a range of communication skills followed by facilitated debriefing.[12] The second session included 3 simulation‐based exercises. Participants rotated roles in the scenarios (eg, patient, family member, physician) and facilitated debriefing was co‐led by a hospitalist leader (K.J.O.) and a patient‐experience administrative leader (either T.D. or J.R.). The third session involved direct observation of participants' clinical encounters and immediate feedback. This coaching session was performed for an initial group of 5 hospitalist‐unit medical directors by the manager of patient experience (T.D.) and subsequently by these medical directors for the remaining participants in the program. Each of the 3 sessions lasted 90 minutes. Instructional materials are available from the authors upon request.
The communication‐skills training program began in August 2011 and extended through January 2012. Participation was strongly encouraged but not mandatory. Sessions were offered multiple times to accommodate clinical schedules. One of the co‐investigators took attendance at each session to assess participation rates.
Survey Instruments and Data
During the study period, NMH used a third‐party vendor, Press Ganey Associates, Inc., to administer the HCAHPS survey to a random sample of 40% of hospitalized patients between 48 hours and 6 weeks after discharge. The HCAHPS survey has 27 total questions, including 3 questions assessing doctor communication as a domain.[3] In addition to the HCAHPS questions, the survey administered to NMH patients included questions developed by Press Ganey. Questions in the surveys used ordinal response scales. Specifically, response options for HCAHPS doctor‐communication questions were never, sometimes, usually, and always. Response options for Press Ganey doctor‐communication questions were very poor, poor, fair, good, and very good. Patients provided an overall hospital rating in the HCAHPS survey using a 010 scale, with 0=worst hospital possible and 10=best hospital possible.
We defined the preintervention period as the 26 weeks prior to implementation of the communication‐skills program (patients admitted on or between January 31, 2011, and July 31, 2011) and the postintervention period as the 22 weeks after implementation (patients admitted on or between January 31, 2012, and June 30, 2012). The postintervention period was 1 month shorter than the preintervention period in an effort to avoid confounding due to a number of new hospitalists starting in July 2012. We defined a discharge attending as highly trained if he/she attended all 3 sessions of the communication‐skills training program. The discharge attending was designated as no/low training if he/she attended fewer than the full 3 sessions.
Data Analysis
Data were obtained from the Northwestern Medicine Enterprise Data Warehouse, a single, integrated database of all clinical and research data from all patients receiving treatment through Northwestern University healthcare affiliates. We used 2 and Student t tests to compare patient demographic characteristics preintervention vs postintervention. We used 2 tests to compare the percentage of patients giving top‐box ratings to each doctor‐communication question (ie, always for HCAHPS and very good for Press Ganey) and giving an overall hospital rating of 9 or 10. We used top‐box comparisons, rather than comparison of mean or median scores, because patient‐satisfaction data are typically highly skewed toward favorable responses. This approach is consistent with prior HCAHPS research.[4, 5] We calculated composite doctor‐communication scores as the proportion of top‐box responses across items in each survey (ie, HCAHPS and Press Ganey). We first compared all patients during the preintervention and postintervention period. We then identified patients for whom the discharge attending worked as a hospitalist at NMH during both the preintervention and postintervention periods and compared satisfaction for patients discharged by hospitalists who had no/low training and for patients discharged by hospitalists who were highly trained. We performed multivariate logistic regression, using intervention period as the predictor variable and top‐box rating as the outcome variable for each doctor‐communication question and for overall hospital rating of 9 or 10. Covariates included patient age, sex, race, payer, self‐reported education level, and self‐reported health status. Models accounted for clustering of patients within discharge physicians. Similarly, we conducted multivariate logistic regression, using discharge attending category as the predictor variable (no/low training vs highly trained). The various comparisons described were intended to mimic intention to treat and treatment received analyses in light of incomplete participation in the communication‐skills program. All analyses were conducted using Stata version 11.2 (StataCorp, College Station, TX).
RESULTS
Overall, 61 (97%) of 63 hospitalists completed the first session, 44 (70%) completed the second session, and 25 (40%) completed the third session of program. Patient‐satisfaction data were available for 278 patients during the preintervention period and 186 patients during the postintervention period. Patient demographic characteristics were similar for the 2 periods (Table 2).
| Characteristic | Preintervention (n=278) | Postintervention (n=186) | P Value |
|---|---|---|---|
| |||
| Mean age, y (SD) | 62.8 (17.0) | 61.6 (17.6) | 0.45 |
| Female, no. (%) | 155 (55.8) | 114 (61.3) | 0.24 |
| Nonwhite race, no. (%) | 87 (32.2) | 53 (29.1) | 0.48 |
| Highest education completed, no. (%) | |||
| Did not complete high school | 12 (4.6) | 6 (3.3) | 0.45 |
| High school | 110 (41.7) | 81 (44.0) | |
| 4‐year college | 50 (18.9) | 43 (23.4) | |
| Advanced degree | 92 (34.9) | 54 (29.4) | |
| Payer, no. (%) | |||
| Medicare | 137 (49.3) | 89 (47.9) | 0.83 |
| Private | 113 (40.7) | 73 (39.3) | |
| Medicaid | 13 (4.7) | 11 (5.9) | |
| Self‐pay/other | 15 (5.4) | 13 (7.0) | |
| Self‐reported health status, no. (%) | |||
| Poor | 19 (7.1) | 18 (9.8) | 0.41 |
| Fair | 53 (19.7) | 43 (23.4) | |
| Good | 89 (33.1) | 57 (31.0) | |
| Very good | 89 (33.1) | 49 (26.6) | |
| Excellent | 19 (7.1) | 17 (9.2) | |
Patient Satisfaction With Hospitalist Communication
The HCAHPS and Press Ganey doctor communication domain scores were not significantly different between the preintervention and postintervention periods (75.8 vs 79.2, P=0.42 and 61.4 vs 65.9, P=0.39). Two of the 3 HCAHPS items assessing doctor communication were rated higher during the postintervention period, but no result was statistically significant (Table 3). Similarly, all 5 of the Press Ganey items assessing doctor communication were rated higher during the postintervention period, but no result was statistically significant. The HCAHPS overall rating of hospital care was also not significantly different between the preintervention and postintervention period. Results were similar in multivariate analyses, with no items showing statistically significant differences between the preintervention and postintervention periods.
| Unadjusted Analysisa | Adjusted Analysis | ||||
|---|---|---|---|---|---|
| Preintervention, No. (%) [n=270277] | Postintervention, No. (%) [n=183186] | P Value | OR (95% CI) | P Value | |
| |||||
| HCAHPS doctor‐communication domain | |||||
| How often did doctors treat you with courtesy and respect? | 224 (83) | 160 (86) | 0.31 | 1.23 (0.81‐2.44) | 0.22 |
| How often did doctors listen carefully to you? | 205 (75) | 145 (78) | 0.52 | 1.22 (0.74‐2.04) | 0.42 |
| How often did doctors explain things in a way you could understand? | 203 (75) | 137 (74) | 0.84 | 0.98 (0.59‐1.64) | 0.94 |
| Press Ganey physician‐communication domain | |||||
| Skill of physician | 189 (68) | 137 (74) | 0.19 | 1.38 (0.82‐2.31) | 0.22 |
| Physician's concern for your questions and worries | 157 (57) | 117 (64) | 0.14 | 1.30 (0.79‐2.12) | 0.30 |
| How well physician kept you informed | 158 (58) | 114 (62) | 0.36 | 1.15 (0.78‐1.72) | 0.71 |
| Time physician spent with you | 140 (51) | 101 (54) | 0.43 | 1.12 (0.66‐1.89) | 0.67 |
| Friendliness/courtesy of physician | 198 (71) | 136 (74) | 0.57 | 1.20 (0.74‐1.94) | 0.46 |
| HCAHPS global ratings | |||||
| Overall rating of hospital | 189 (70) [n=270] | 137 (74) [n=186] | 0.40 | 1.33 (0.82‐2.17) | 0.24 |
Pre‐post comparisons based on level of hospitalist participation in the training program are shown in Table 4. For patients discharged by no/low‐training hospitalists, 4 of the 8 total items assessing doctor communication were rated higher during the postintervention period, and 4 were rated lower, but no result was statistically significant. For patients discharged by highly trained hospitalists, all 8 items assessing doctor communication were rated higher during the postintervention period, but no result was statistically significant. Multivariate analyses were similar, with no items showing statistically significant differences between the preintervention and postintervention periods for either group.
| No/Low Training | Highly Trained | |||||||||
|---|---|---|---|---|---|---|---|---|---|---|
| Unadjusted Analysisa | Adjusted Analysis | Unadjusted Analysisa | Adjusted Analysis | |||||||
| Preintervention, No. (%) [n=151156] | Postintervention, No. (%) [n=6770] | P Value | OR (95% CI) | P Value | Preintervention, No. (%) [n=119122] | Postintervention, No. (%) [n=115116] | P Value | OR (95% CI) | P Value | |
| ||||||||||
| HCAHPS doctor‐ communication domain | ||||||||||
| How often did doctors treat you with courtesy and respect? | 125 (83) | 61 (88) | 0.28 | 1.79 (0.82‐3.89) | 0.14 | 99 (83) | 99 (85) | 0.65 | 1.33 (0.62‐2.91) | 0.46 |
| How often did doctors listen carefully to you? | 116 (77) | 53 (76) | 0.86 | 1.08 (0.49‐2.38) | 0.19 | 89 (74) | 92 (79) | 0.30 | 1.43 (0.76‐2.69) | 0.27 |
| How often did doctors explain things in a way you could understand? | 115 (76) | 47 (68) | 0.24 | 0.59 (0.27‐1.28) | 0.18 | 88 (74) | 90 (78) | 0.52 | 1.31 (0.68‐2.50) | 0.42 |
| Press Ganey physician‐communication domain | ||||||||||
| Skill of physician | 110 (71) | 52 (74) | 0.56 | 1.32 (0.78‐2.22) | 0.31 | 79 (65) | 85 (73) | 0.16 | 1.45 (0.65‐3.27) | 0.37 |
| Physician's concern for your questions and worries | 92 (60) | 41 (61) | 0.88 | 1.00 (0.59‐1.77) | 0.99 | 65 (53) | 76 (66) | 0.06 | 1.71 (0.81‐3.60) | 0.16 |
| How well physician kept you informed | 89 (59) | 42 (61) | 0.75 | 1.16 (0.64‐2.08) | 0.62 | 69 (57) | 72 (63) | 0.34 | 1.29 (0.75‐2.20) | 0.35 |
| Time physician spent with you | 83 (54) | 37 (53) | 0.92 | 0.87 (0.47‐1.61) | 0.65 | 57 (47) | 64 (55) | 0.19 | 1.44 (0.64‐3.21) | 0.38 |
| Friendliness/courtesy of physician | 116 (75) | 45 (66) | 0.18 | 0.72 (0.37‐1.38) | 0.32 | 82 (67) | 91 (78) | 0.05 | 1.89 (0.97‐3.68) | 0.60 |
| HCAHPS global ratings | ||||||||||
| Overall rating of hospital | 109 (73) | 53 (75) | 0.63 | 1.37 (0.67‐2.81) | 0.39 | 86 (71) | 90 (78) | 0.21 | 1.60 (0.73‐3.53) | 0.24 |
DISCUSSION
We found no significant improvement in patient satisfaction with doctor communication or overall rating of hospital care after implementation of a communication‐skills training program for hospitalists. There are several potential explanations for our results. First, though we used sound educational methods and attempted to replicate common clinical scenarios during simulation exercises, our program may not have resulted in improved communication behaviors during actual clinical care. We attempted to balance instructional methods that would result in behavioral change with a feasible investment of time and effort on the part of our learners (ie, practicing hospitalists). It is possible that additional time, feedback, and practice of communication skills would be necessary to change behaviors in the clinical setting. However, prior communication‐skills interventions have similarly struggled to show an impact on patient satisfaction.[13, 14] Second, we had incomplete participation in the program, with only 40% of hospitalists completing all 3 planned sessions. We encouraged all hospitalists, regardless of job type, to participate in the program. Participation rates were lower for 1‐year hospitalists compared with career hospitalists. The results of our analyses based on level of hospitalist participation in the training program, although not achieving statistical significance, suggest a greater effect of the program with higher degrees of participation.
Most important, the study was likely underpowered to detect a statistically significant difference in satisfaction results. Leaders were committed to providing communication‐skills training throughout our organization. We did not know the magnitude of potential improvement in satisfaction scores that might arise from our efforts, and therefore we did not conduct power calculations before designing and implementing the training program. Our HCAHPS composite doctor‐communication domain performance was 76% during the preintervention period and 79% during the postintervention period. Assuming an absolute 3% improvement is indeed possible, we would have needed >3000 patients in each period to have 80% power to detect a significant difference. Similarly, we would have needed >2000 patients during each period to have 80% power to detect an absolute 4% improvement in global rating of hospital care.
In an attempt to discern whether our favorable results were due to secular trends, we conducted post hoc analyses of HCAHPS nurse‐communication and hospital‐environment domains for the preintervention vs postintervention periods. Two of the 3 nurse‐communication items were rated lower during the postintervention period, but no result was statistically significant. Both hospital‐environment domain items were rated lower during the postintervention period, and 1 result was statistically significant (quiet at night). This post hoc evaluation lends additional support to the potential benefit of the communication‐skills training program.
The findings from this study represent an important issue for leaders attempting to improve quality performance within their organizations. What level of proof is needed before investing time and effort in implementing an intervention? With mounting pressure to improve performance, leaders are often left to make informed decisions based on data that fall short of scientifically rigorous evidence. Importantly, an increase in composite doctor‐communication ratings from 76% to 79% would translate into an improvement from the 25th percentile to 50th‐percentile performance in the fiscal‐year 2011 Press Ganey University Healthcare Consortium benchmark comparison (based on surveys received from September 1, 2010, to August 31, 2011).[15]
Our study has several limitations. First, we assessed an intervention on a single service in a single hospital. Generalizability may be limited, as hospital medicine groups, hospitals, and the patients they serve vary. Second, our intervention was based on a framework (ie, AIDET) that has face validity but has not undergone extensive study to confirm that the underlying constructs, and the behaviors related to them, are tightly linked to patient satisfaction. Third, as previously mentioned, we were likely underpowered to detect a significant improvement in satisfaction resulting from our intervention. Incomplete participation in the training program may have also limited the effect of our intervention. Finally, our comparisons by hospitalist level of participation were based on the discharging physician. Attribution of a patient response to a single physician is problematic because many patients encounter more than 1 hospitalist and 1 or more specialist physicians during their stay.
CONCLUSION
In summary, we found improvements in patient satisfaction with doctor communication, which were not statistically significant, after implementation of a communication‐skills training program for hospitalists. Larger studies are needed to assess whether a communication‐skills training program can truly improve patient satisfaction with doctor communication and overall hospital care.
Acknowledgments
The authors express their gratitude to the hospitalists involved in this program, especially Eric Schaefer, Nita Kulkarni, Stevie Mazyck, Rachel Cyrus, and Hiren Shah. The authors also thank Nicholas Christensen for assistance in data acquisition.
Disclosures: Nothing to report.
- , , , , , . Four minutes for a patient, twenty seconds for a relative—an observational study at a university hospital. BMC Health Serv Res. 2010;10:94.
- , , . How hospitalists spend their time: insights on efficiency and safety. J Hosp Med. 2006;1(2):88–93.
- CAHPS: Surveys and Tools to Advance Patient‐Centered Care. Available at: http://cahps.ahrq.gov. Accessed July 12, 2012.
- , , , , . Development, implementation, and public reporting of the HCAHPS survey. Med Care Res Rev. 2010;67(1):27–37.
- , , , , . Measuring hospital care from the patients' perspective: an overview of the CAHPS Hospital Survey development process. Health Serv Res. 2005;40(6 part 2):1977–1995.
- US Department of Health and Human Services. Hospital Compare. Available at: http://hospitalcompare.hhs.gov/. Accessed November 5, 2012.
- Center for Medicare and Medicaid Services. Hospital Value Based Purchasing Program. Available at: http://www.cms.gov/Medicare/Quality‐Initiatives‐Patient‐Assessment‐Instruments/hospital‐value‐based‐purchasing/index.html?redirect=/hospital‐value‐based‐purchasing. Accessed August 1, 2012.
- , , , . Communication interventions make a difference in conversations between physicians and patients: a systematic review of the evidence. Med Care. 2007;45(4):340–349.
- , , , et al. Impact of localizing physicians to hospital units on nurse‐physician communication and agreement on the plan of care. J Gen Intern Med. 2009;24(11):1223–1227.
- Studer Group. Acknowledge, Introduce, Duration, Explanation and Thank You. Available at: http://www.studergroup.com/aidet. Accessed November 5, 2012.
- Kern DE, Thomas PA, Bass EB, Howard DM, eds. Curriculum Development for Medical Education: A Six‐Step Approach. Baltimore, MD: Johns Hopkins University Press; 1998.
- Vanderbilt University Medical Center and Studer Group. Building Patient Trust with AIDET®: Clinical Excellence with Patient Compliance Through Effective Communication. Gulf Breeze, FL: Fire Starter Publishing; 2008.
- , , , . Effect of clinician communication skills training on patient satisfaction: a randomized, controlled trial. Ann Intern Med. 1999;131(11):822–829.
- , , , , , . Effectiveness of a short course in clinical communication skills for hospital doctors: results of a crossover randomized controlled trial (ISRCTN22153332). Patient Educ Couns. 2010;84(2):163–169.
- Press Ganey HCAHPS Top Box and Rank Report, Fiscal Year 2011. Inpatient, University Healthcare Consortium Peer Group. South Bend, IN: Press Ganey Associates; 2011.
Hospital settings present unique challenges to patient‐clinician communication and collaboration. Patients frequently have multiple, active conditions. Interprofessional teams are large and care for multiple patients at the same time, and team membership is dynamic and dispersed. Moreover, physicians spend relatively little time with patients[1, 2] and seldom receive training in communication skills after medical school.
The Agency for Healthcare Research and Quality (AHRQ) has developed the Hospital Consumer Assessment of Healthcare Providers and Systems (HCAHPS) survey to assess hospitalized patients' experiences with care.[3, 4, 5] Results are publicly reported on the US Department of Health and Human Services Hospital Compare Web site[6] and now affect hospital payment through the Center for Medicare and Medicaid Services Hospital Value‐Based Purchasing Program.[7]
Despite this increased transparency and accountability for performance related to the patient experience, little research has been conducted on how hospitals or clinicians might improve performance. Although interventions to enhance physician communication skills have shown improvements in observed behaviors, few studies have assessed benefit from the patient's perspective and few interventions have been integrated into practice.[8] We sought to assess the impact of a communication‐skills training program, based on a common framework used by hospitals, on patient satisfaction with doctor communication and overall hospital care.
METHODS
Setting and Study Design
The study was conducted at Northwestern Memorial Hospital (NMH), an 897‐bed tertiary‐care teaching hospital in Chicago, IL, and was approved by the institutional review board of Northwestern University. This study was a preintervention vs postintervention comparison of patient‐satisfaction scores. The intervention was a communication‐skills training program for all NMH hospitalists. We compared patient‐satisfaction survey data for patients admitted to the nonteaching hospitalist service during the 26 weeks prior to the intervention with data for patients admitted to the same service during the 22 weeks afterward. Hospitalists on this service worked 7 consecutive days, usually followed by 7 days free from clinical duty. Hospitalists cared for approximately 1014 patients per day without the assistance of resident physicians or midlevel providers (ie, physician assistants or nurse practitioners). Nighttime patient care was provided by in‐house hospitalists (ie, nocturnists). A majority of nighttime shifts were staffed by physicians who worked for the group for a single year. As a result of a prior intervention, hospitalists' patients were localized to specific units, each overseen by a hospitalist‐unit medical director.[9] We excluded all patients initially admitted to other services (eg, intensive care unit, surgical services) and patients discharged from other services.
Hospitalist Communication Skills Training Program
Northwestern Memorial Hospital implemented a communication‐skills training program in 2009 intended to enhance patient experience and improve patient‐satisfaction scores. All nonphysician staff were required to attend a 4‐hour training session based on the AIDET (Acknowledge, Introduce, Duration, Explanation, and Thank You) principles developed by the Studer Group.[10] The Studer Group is a well‐known healthcare consulting firm that aims to assist healthcare organizations to improve clinical, operational, and financial outcomes. The acronym AIDET provides a framework for communication‐skills behaviors (Table 1).
| AIDET Element | Explanation | Examples |
|---|---|---|
| ||
| Acknowledge | Use appropriate greeting, smile, and make eye contact. | Knock on patient's door. Hello, may I come in now? |
| Respect privacy: Knock and ask for permission before entering. Use curtains/doors appropriately. | Good morning. Is it a good time to talk? | |
| Position yourself on the same level as the patient. | Who do you have here with you today? | |
| Do not ignore others in the room (visitors or colleagues). | ||
| Introduce | Introduce yourself by name and role. | My name is Dr. Smith and I am your hospitalist physician. I'll be taking care of you while you are in the hospital. |
| Introduce any accompanying members of your team. | When on teaching service: I'm the supervising physician or I'm the physician in charge of your care. | |
| Address patients by title and last name (eg, Mrs. Smith) unless given permission to use first name. | ||
| Explain why you are there. | ||
| Do not assume patients remember your name or role. | ||
| Duration | Provide specific information on when you will be available, or when you will be back. | I'll be back between 2 and 3 pm, so if you think of any additional questions I can answer them then. |
| For tests/procedures: Explain how long it will take. Provide a time range for when it will happen. | In my experience, the test I am ordering for you will be done within the next 12 to 24 hours. | |
| Provide updates to the patient if the expected wait time has changed. | I should have the results for this test when I see you tomorrow morning. | |
| Do not blame another department or staff for delays. | ||
| Explanation | Explain your rationale for decisions. | I have ordered this test because |
| Use terms the patient can understand. | The possible side effects of this medication include | |
| Explain next steps/summarize plan for the day. | What questions do you have? | |
| Confirm understanding using teach back. | What are you most concerned about? | |
| Assume patients have questions and/or concerns. | I want to make sure you understood everything. Can you tell me in your own words what you will need to do once you are at home? | |
| Do not use acronyms that patients may not understand (eg, PRN, IR, ICU). | ||
| Thank you | Thank the patient and/or family. | I really appreciate you telling me about your symptoms. I know you told several people before. |
| Ask if there is anything else you can do for the patient. | Thank you for giving me the opportunity to care for you. What else can I do for you today? | |
| Explain when you will be back and how the patient can reach you if needed. | I'll see you again tomorrow morning. If you need me before then, just ask the nurse to page me. | |
| Do not appear rushed or distracted when ending your interaction. | ||
We adapted the AIDET framework and designed a communication‐skills training program, specifically for physicians, to emphasize reflection on current communication behaviors, deliberate practice of enhanced communication skills, and feedback based on performance during simulated and real clinical encounters. These educational methods are consistent with recommended strategies to improve behavioral performance.[11] During the first session, we discussed measurement of patient satisfaction, introduced AIDET principles, gave examples of specific behaviors for each principle, and had participants view 2 short videos displaying a range of communication skills followed by facilitated debriefing.[12] The second session included 3 simulation‐based exercises. Participants rotated roles in the scenarios (eg, patient, family member, physician) and facilitated debriefing was co‐led by a hospitalist leader (K.J.O.) and a patient‐experience administrative leader (either T.D. or J.R.). The third session involved direct observation of participants' clinical encounters and immediate feedback. This coaching session was performed for an initial group of 5 hospitalist‐unit medical directors by the manager of patient experience (T.D.) and subsequently by these medical directors for the remaining participants in the program. Each of the 3 sessions lasted 90 minutes. Instructional materials are available from the authors upon request.
The communication‐skills training program began in August 2011 and extended through January 2012. Participation was strongly encouraged but not mandatory. Sessions were offered multiple times to accommodate clinical schedules. One of the co‐investigators took attendance at each session to assess participation rates.
Survey Instruments and Data
During the study period, NMH used a third‐party vendor, Press Ganey Associates, Inc., to administer the HCAHPS survey to a random sample of 40% of hospitalized patients between 48 hours and 6 weeks after discharge. The HCAHPS survey has 27 total questions, including 3 questions assessing doctor communication as a domain.[3] In addition to the HCAHPS questions, the survey administered to NMH patients included questions developed by Press Ganey. Questions in the surveys used ordinal response scales. Specifically, response options for HCAHPS doctor‐communication questions were never, sometimes, usually, and always. Response options for Press Ganey doctor‐communication questions were very poor, poor, fair, good, and very good. Patients provided an overall hospital rating in the HCAHPS survey using a 010 scale, with 0=worst hospital possible and 10=best hospital possible.
We defined the preintervention period as the 26 weeks prior to implementation of the communication‐skills program (patients admitted on or between January 31, 2011, and July 31, 2011) and the postintervention period as the 22 weeks after implementation (patients admitted on or between January 31, 2012, and June 30, 2012). The postintervention period was 1 month shorter than the preintervention period in an effort to avoid confounding due to a number of new hospitalists starting in July 2012. We defined a discharge attending as highly trained if he/she attended all 3 sessions of the communication‐skills training program. The discharge attending was designated as no/low training if he/she attended fewer than the full 3 sessions.
Data Analysis
Data were obtained from the Northwestern Medicine Enterprise Data Warehouse, a single, integrated database of all clinical and research data from all patients receiving treatment through Northwestern University healthcare affiliates. We used 2 and Student t tests to compare patient demographic characteristics preintervention vs postintervention. We used 2 tests to compare the percentage of patients giving top‐box ratings to each doctor‐communication question (ie, always for HCAHPS and very good for Press Ganey) and giving an overall hospital rating of 9 or 10. We used top‐box comparisons, rather than comparison of mean or median scores, because patient‐satisfaction data are typically highly skewed toward favorable responses. This approach is consistent with prior HCAHPS research.[4, 5] We calculated composite doctor‐communication scores as the proportion of top‐box responses across items in each survey (ie, HCAHPS and Press Ganey). We first compared all patients during the preintervention and postintervention period. We then identified patients for whom the discharge attending worked as a hospitalist at NMH during both the preintervention and postintervention periods and compared satisfaction for patients discharged by hospitalists who had no/low training and for patients discharged by hospitalists who were highly trained. We performed multivariate logistic regression, using intervention period as the predictor variable and top‐box rating as the outcome variable for each doctor‐communication question and for overall hospital rating of 9 or 10. Covariates included patient age, sex, race, payer, self‐reported education level, and self‐reported health status. Models accounted for clustering of patients within discharge physicians. Similarly, we conducted multivariate logistic regression, using discharge attending category as the predictor variable (no/low training vs highly trained). The various comparisons described were intended to mimic intention to treat and treatment received analyses in light of incomplete participation in the communication‐skills program. All analyses were conducted using Stata version 11.2 (StataCorp, College Station, TX).
RESULTS
Overall, 61 (97%) of 63 hospitalists completed the first session, 44 (70%) completed the second session, and 25 (40%) completed the third session of program. Patient‐satisfaction data were available for 278 patients during the preintervention period and 186 patients during the postintervention period. Patient demographic characteristics were similar for the 2 periods (Table 2).
| Characteristic | Preintervention (n=278) | Postintervention (n=186) | P Value |
|---|---|---|---|
| |||
| Mean age, y (SD) | 62.8 (17.0) | 61.6 (17.6) | 0.45 |
| Female, no. (%) | 155 (55.8) | 114 (61.3) | 0.24 |
| Nonwhite race, no. (%) | 87 (32.2) | 53 (29.1) | 0.48 |
| Highest education completed, no. (%) | |||
| Did not complete high school | 12 (4.6) | 6 (3.3) | 0.45 |
| High school | 110 (41.7) | 81 (44.0) | |
| 4‐year college | 50 (18.9) | 43 (23.4) | |
| Advanced degree | 92 (34.9) | 54 (29.4) | |
| Payer, no. (%) | |||
| Medicare | 137 (49.3) | 89 (47.9) | 0.83 |
| Private | 113 (40.7) | 73 (39.3) | |
| Medicaid | 13 (4.7) | 11 (5.9) | |
| Self‐pay/other | 15 (5.4) | 13 (7.0) | |
| Self‐reported health status, no. (%) | |||
| Poor | 19 (7.1) | 18 (9.8) | 0.41 |
| Fair | 53 (19.7) | 43 (23.4) | |
| Good | 89 (33.1) | 57 (31.0) | |
| Very good | 89 (33.1) | 49 (26.6) | |
| Excellent | 19 (7.1) | 17 (9.2) | |
Patient Satisfaction With Hospitalist Communication
The HCAHPS and Press Ganey doctor communication domain scores were not significantly different between the preintervention and postintervention periods (75.8 vs 79.2, P=0.42 and 61.4 vs 65.9, P=0.39). Two of the 3 HCAHPS items assessing doctor communication were rated higher during the postintervention period, but no result was statistically significant (Table 3). Similarly, all 5 of the Press Ganey items assessing doctor communication were rated higher during the postintervention period, but no result was statistically significant. The HCAHPS overall rating of hospital care was also not significantly different between the preintervention and postintervention period. Results were similar in multivariate analyses, with no items showing statistically significant differences between the preintervention and postintervention periods.
| Unadjusted Analysisa | Adjusted Analysis | ||||
|---|---|---|---|---|---|
| Preintervention, No. (%) [n=270277] | Postintervention, No. (%) [n=183186] | P Value | OR (95% CI) | P Value | |
| |||||
| HCAHPS doctor‐communication domain | |||||
| How often did doctors treat you with courtesy and respect? | 224 (83) | 160 (86) | 0.31 | 1.23 (0.81‐2.44) | 0.22 |
| How often did doctors listen carefully to you? | 205 (75) | 145 (78) | 0.52 | 1.22 (0.74‐2.04) | 0.42 |
| How often did doctors explain things in a way you could understand? | 203 (75) | 137 (74) | 0.84 | 0.98 (0.59‐1.64) | 0.94 |
| Press Ganey physician‐communication domain | |||||
| Skill of physician | 189 (68) | 137 (74) | 0.19 | 1.38 (0.82‐2.31) | 0.22 |
| Physician's concern for your questions and worries | 157 (57) | 117 (64) | 0.14 | 1.30 (0.79‐2.12) | 0.30 |
| How well physician kept you informed | 158 (58) | 114 (62) | 0.36 | 1.15 (0.78‐1.72) | 0.71 |
| Time physician spent with you | 140 (51) | 101 (54) | 0.43 | 1.12 (0.66‐1.89) | 0.67 |
| Friendliness/courtesy of physician | 198 (71) | 136 (74) | 0.57 | 1.20 (0.74‐1.94) | 0.46 |
| HCAHPS global ratings | |||||
| Overall rating of hospital | 189 (70) [n=270] | 137 (74) [n=186] | 0.40 | 1.33 (0.82‐2.17) | 0.24 |
Pre‐post comparisons based on level of hospitalist participation in the training program are shown in Table 4. For patients discharged by no/low‐training hospitalists, 4 of the 8 total items assessing doctor communication were rated higher during the postintervention period, and 4 were rated lower, but no result was statistically significant. For patients discharged by highly trained hospitalists, all 8 items assessing doctor communication were rated higher during the postintervention period, but no result was statistically significant. Multivariate analyses were similar, with no items showing statistically significant differences between the preintervention and postintervention periods for either group.
| No/Low Training | Highly Trained | |||||||||
|---|---|---|---|---|---|---|---|---|---|---|
| Unadjusted Analysisa | Adjusted Analysis | Unadjusted Analysisa | Adjusted Analysis | |||||||
| Preintervention, No. (%) [n=151156] | Postintervention, No. (%) [n=6770] | P Value | OR (95% CI) | P Value | Preintervention, No. (%) [n=119122] | Postintervention, No. (%) [n=115116] | P Value | OR (95% CI) | P Value | |
| ||||||||||
| HCAHPS doctor‐ communication domain | ||||||||||
| How often did doctors treat you with courtesy and respect? | 125 (83) | 61 (88) | 0.28 | 1.79 (0.82‐3.89) | 0.14 | 99 (83) | 99 (85) | 0.65 | 1.33 (0.62‐2.91) | 0.46 |
| How often did doctors listen carefully to you? | 116 (77) | 53 (76) | 0.86 | 1.08 (0.49‐2.38) | 0.19 | 89 (74) | 92 (79) | 0.30 | 1.43 (0.76‐2.69) | 0.27 |
| How often did doctors explain things in a way you could understand? | 115 (76) | 47 (68) | 0.24 | 0.59 (0.27‐1.28) | 0.18 | 88 (74) | 90 (78) | 0.52 | 1.31 (0.68‐2.50) | 0.42 |
| Press Ganey physician‐communication domain | ||||||||||
| Skill of physician | 110 (71) | 52 (74) | 0.56 | 1.32 (0.78‐2.22) | 0.31 | 79 (65) | 85 (73) | 0.16 | 1.45 (0.65‐3.27) | 0.37 |
| Physician's concern for your questions and worries | 92 (60) | 41 (61) | 0.88 | 1.00 (0.59‐1.77) | 0.99 | 65 (53) | 76 (66) | 0.06 | 1.71 (0.81‐3.60) | 0.16 |
| How well physician kept you informed | 89 (59) | 42 (61) | 0.75 | 1.16 (0.64‐2.08) | 0.62 | 69 (57) | 72 (63) | 0.34 | 1.29 (0.75‐2.20) | 0.35 |
| Time physician spent with you | 83 (54) | 37 (53) | 0.92 | 0.87 (0.47‐1.61) | 0.65 | 57 (47) | 64 (55) | 0.19 | 1.44 (0.64‐3.21) | 0.38 |
| Friendliness/courtesy of physician | 116 (75) | 45 (66) | 0.18 | 0.72 (0.37‐1.38) | 0.32 | 82 (67) | 91 (78) | 0.05 | 1.89 (0.97‐3.68) | 0.60 |
| HCAHPS global ratings | ||||||||||
| Overall rating of hospital | 109 (73) | 53 (75) | 0.63 | 1.37 (0.67‐2.81) | 0.39 | 86 (71) | 90 (78) | 0.21 | 1.60 (0.73‐3.53) | 0.24 |
DISCUSSION
We found no significant improvement in patient satisfaction with doctor communication or overall rating of hospital care after implementation of a communication‐skills training program for hospitalists. There are several potential explanations for our results. First, though we used sound educational methods and attempted to replicate common clinical scenarios during simulation exercises, our program may not have resulted in improved communication behaviors during actual clinical care. We attempted to balance instructional methods that would result in behavioral change with a feasible investment of time and effort on the part of our learners (ie, practicing hospitalists). It is possible that additional time, feedback, and practice of communication skills would be necessary to change behaviors in the clinical setting. However, prior communication‐skills interventions have similarly struggled to show an impact on patient satisfaction.[13, 14] Second, we had incomplete participation in the program, with only 40% of hospitalists completing all 3 planned sessions. We encouraged all hospitalists, regardless of job type, to participate in the program. Participation rates were lower for 1‐year hospitalists compared with career hospitalists. The results of our analyses based on level of hospitalist participation in the training program, although not achieving statistical significance, suggest a greater effect of the program with higher degrees of participation.
Most important, the study was likely underpowered to detect a statistically significant difference in satisfaction results. Leaders were committed to providing communication‐skills training throughout our organization. We did not know the magnitude of potential improvement in satisfaction scores that might arise from our efforts, and therefore we did not conduct power calculations before designing and implementing the training program. Our HCAHPS composite doctor‐communication domain performance was 76% during the preintervention period and 79% during the postintervention period. Assuming an absolute 3% improvement is indeed possible, we would have needed >3000 patients in each period to have 80% power to detect a significant difference. Similarly, we would have needed >2000 patients during each period to have 80% power to detect an absolute 4% improvement in global rating of hospital care.
In an attempt to discern whether our favorable results were due to secular trends, we conducted post hoc analyses of HCAHPS nurse‐communication and hospital‐environment domains for the preintervention vs postintervention periods. Two of the 3 nurse‐communication items were rated lower during the postintervention period, but no result was statistically significant. Both hospital‐environment domain items were rated lower during the postintervention period, and 1 result was statistically significant (quiet at night). This post hoc evaluation lends additional support to the potential benefit of the communication‐skills training program.
The findings from this study represent an important issue for leaders attempting to improve quality performance within their organizations. What level of proof is needed before investing time and effort in implementing an intervention? With mounting pressure to improve performance, leaders are often left to make informed decisions based on data that fall short of scientifically rigorous evidence. Importantly, an increase in composite doctor‐communication ratings from 76% to 79% would translate into an improvement from the 25th percentile to 50th‐percentile performance in the fiscal‐year 2011 Press Ganey University Healthcare Consortium benchmark comparison (based on surveys received from September 1, 2010, to August 31, 2011).[15]
Our study has several limitations. First, we assessed an intervention on a single service in a single hospital. Generalizability may be limited, as hospital medicine groups, hospitals, and the patients they serve vary. Second, our intervention was based on a framework (ie, AIDET) that has face validity but has not undergone extensive study to confirm that the underlying constructs, and the behaviors related to them, are tightly linked to patient satisfaction. Third, as previously mentioned, we were likely underpowered to detect a significant improvement in satisfaction resulting from our intervention. Incomplete participation in the training program may have also limited the effect of our intervention. Finally, our comparisons by hospitalist level of participation were based on the discharging physician. Attribution of a patient response to a single physician is problematic because many patients encounter more than 1 hospitalist and 1 or more specialist physicians during their stay.
CONCLUSION
In summary, we found improvements in patient satisfaction with doctor communication, which were not statistically significant, after implementation of a communication‐skills training program for hospitalists. Larger studies are needed to assess whether a communication‐skills training program can truly improve patient satisfaction with doctor communication and overall hospital care.
Acknowledgments
The authors express their gratitude to the hospitalists involved in this program, especially Eric Schaefer, Nita Kulkarni, Stevie Mazyck, Rachel Cyrus, and Hiren Shah. The authors also thank Nicholas Christensen for assistance in data acquisition.
Disclosures: Nothing to report.
- , , , , , . Four minutes for a patient, twenty seconds for a relative—an observational study at a university hospital. BMC Health Serv Res. 2010;10:94.
- , , . How hospitalists spend their time: insights on efficiency and safety. J Hosp Med. 2006;1(2):88–93.
- CAHPS: Surveys and Tools to Advance Patient‐Centered Care. Available at: http://cahps.ahrq.gov. Accessed July 12, 2012.
- , , , , . Development, implementation, and public reporting of the HCAHPS survey. Med Care Res Rev. 2010;67(1):27–37.
- , , , , . Measuring hospital care from the patients' perspective: an overview of the CAHPS Hospital Survey development process. Health Serv Res. 2005;40(6 part 2):1977–1995.
- US Department of Health and Human Services. Hospital Compare. Available at: http://hospitalcompare.hhs.gov/. Accessed November 5, 2012.
- Center for Medicare and Medicaid Services. Hospital Value Based Purchasing Program. Available at: http://www.cms.gov/Medicare/Quality‐Initiatives‐Patient‐Assessment‐Instruments/hospital‐value‐based‐purchasing/index.html?redirect=/hospital‐value‐based‐purchasing. Accessed August 1, 2012.
- , , , . Communication interventions make a difference in conversations between physicians and patients: a systematic review of the evidence. Med Care. 2007;45(4):340–349.
- , , , et al. Impact of localizing physicians to hospital units on nurse‐physician communication and agreement on the plan of care. J Gen Intern Med. 2009;24(11):1223–1227.
- Studer Group. Acknowledge, Introduce, Duration, Explanation and Thank You. Available at: http://www.studergroup.com/aidet. Accessed November 5, 2012.
- Kern DE, Thomas PA, Bass EB, Howard DM, eds. Curriculum Development for Medical Education: A Six‐Step Approach. Baltimore, MD: Johns Hopkins University Press; 1998.
- Vanderbilt University Medical Center and Studer Group. Building Patient Trust with AIDET®: Clinical Excellence with Patient Compliance Through Effective Communication. Gulf Breeze, FL: Fire Starter Publishing; 2008.
- , , , . Effect of clinician communication skills training on patient satisfaction: a randomized, controlled trial. Ann Intern Med. 1999;131(11):822–829.
- , , , , , . Effectiveness of a short course in clinical communication skills for hospital doctors: results of a crossover randomized controlled trial (ISRCTN22153332). Patient Educ Couns. 2010;84(2):163–169.
- Press Ganey HCAHPS Top Box and Rank Report, Fiscal Year 2011. Inpatient, University Healthcare Consortium Peer Group. South Bend, IN: Press Ganey Associates; 2011.
Copyright © 2013 Society of Hospital Medicine
Assessing Teamwork in SIDR
Teamwork is essential to delivering safe and effective hospital care,15 yet the fluidity and geographic dispersion of team members in the hospital setting presents a significant barrier to teamwork.6 Physicians, nurses, and other hospital professionals frequently lack convenient and reliable opportunities to interact, and may struggle in efforts to discuss the care of their patients in person. Research studies show that nurses and physicians on patient care units do not communicate consistently and frequently do not agree on key aspects of their patients' plans of care.7, 8
Interdisciplinary rounds (IDR), also known as multidisciplinary rounds, provide a means to assemble hospital care team members and improve collaboration.913 Prior research on the use of IDR has demonstrated improved ratings of collaboration,11, 12 but inconsistent effects on length of stay and cost.10, 12, 13 Notably, the format, frequency, and duration of IDR in prior studies has been variable and no studies, to our knowledge, have evaluated teamwork performance during IDR. Lamb and colleagues conducted observations of cancer teams during multidisciplinary meetings.14 Trained observers used a validated observation tool to rate teamwork and found significant variation in performance by subteams. However, the study focused mainly on discussion among physician team members during meetings to plan longitudinal care for oncology patients.
We recently reported on the use of structured interdisciplinary rounds (SIDR) on 2 medical units in our hospital.15, 16 SIDR combines a structured format for communication, similar to a goals‐of‐care form,17, 18 with a forum for daily interdisciplinary meetings. Though no effect was seen on length of stay or cost, SIDR was associated with significantly higher ratings of the quality of collaboration and teamwork climate, and a reduction in the rate of adverse events.19 In March 2010, we implemented SIDR across all medical units in our hospital. We subjectively noted variation in teamwork performance during SIDR after a modification of nurse manager roles. We sought to evaluate teamwork during SIDR and to determine whether variation in performance existed and, if present, to characterize it.
METHODS
Setting and Study Design
The study was conducted at Northwestern Memorial Hospital (NMH), a 920‐bed tertiary care teaching hospital in Chicago, IL, and was deemed exempt by the Institutional Review Board of Northwestern University. General medical patients were admitted to 1 of 6 units based on bed availability. Five of the medical units consisted of 30 beds, and 1 unit consisted of 23. Each unit was equipped with continuous cardiac telemetry monitoring. Three units were staffed by teaching service physician teams consisting of 1 attending, 1 resident, and 1 or 2 interns. The other 3 units were staffed by hospitalists without the assistance of resident or intern physicians. As a result of a prior intervention, physicians' patients were localized to specific units in an effort to improve communication practices among nurses and physicians.20
Beginning in March 2010, all general medical units held SIDR each weekday morning. SIDR took place in the unit conference room, was expected to last approximately 3040 minutes, and was co‐led by the unit nurse manager and a medical director. Unit nurse managers and medical directors received specific training for their roles, including 3 hours of simulation‐based exercises designed to enhance their skills in facilitating discussion during SIDR. All nurses and physicians caring for patients on the unit, as well as the pharmacist, social worker, and case manager assigned to the unit, attended SIDR. Attendees used a structured communication tool to review patients admitted in the previous 24 hours. The plan of care for other patients was also discussed in SIDR, but without the use of the structured communication tool.
Importantly, nurse management underwent restructuring in the summer of 2011. Nurse managers, who had previously been responsible for overseeing all nursing activities on a single unit, were redeployed to be responsible for specific activities across 34 units. This restructuring made it very difficult for nurse managers to colead SIDR. As a result, the unit nurse clinical coordinator assumed coleadership of SIDR with the unit medical director. Nurse clinical coordinators worked every weekday and did not have patient care responsibilities while on duty. In addition to their role in coleading SIDR, nurse clinical coordinators addressed daily staffing and scheduling challenges and other short‐term patient care needs.
Teamwork Assessment
We adapted the Observational Teamwork Assessment for Surgery (OTAS) tool, a behaviorally anchored rating scale shown to be reliable and valid in surgical settings.2123 The OTAS tool provides scores ranging from 0 to 6 (0 = problematic behavior; 3 = team function neither hindered nor enhanced by behavior; 6 = exemplary behavior) across 5 domains (communication, coordination, cooperation/backup behavior, leadership, and monitoring/situational awareness) and for prespecified subteams. We defined domains as described by the researchers who developed OTAS. Communication referred to the quality and the quantity of information exchanged by team members. Coordination referred to management and timing of activities and tasks. Cooperation and backup behavior referred to assistance provided among members of the team, supporting others and correcting errors. Leadership referred to provision of directions, assertiveness, and support among team members. Monitoring and situational awareness referred to team observation and awareness of ongoing processes. We defined subteams for each group of professionals expected to attend SIDR. Specifically, subteams included physicians, nurses, social work‐case management (SW‐CM), pharmacy, and coleaders. We combined social work and case management because these professionals have similar patient care activities. Similarly, we combined unit medical directors and nurse clinical coordinators as coleaders. By providing data on teamwork performance within specific domains and for specific subteams, the OTAS instrument helps identify factors influencing overall teamwork performance. We modified OTAS anchors to reflect behaviors during SIDR. Anchors assisted observers in their rating of teamwork behaviors during SIDR. For example, an anchor for exemplary physician communication behavior was listens actively to other team members (looks at other team members, nods, etc). An anchor for exemplary physician leadership was assigns responsibility for task completion when appropriate.
Two researchers conducted unannounced direct observations of SIDRs. One researcher (Y.N.B) was a medical librarian with previous experience conducting observational research. The other researcher (A.J.C.) had observed 170 prior SIDRs as part of a related study. Both researchers observed 10 SIDRs to practice data collection and to inform minor revisions of the anchors. We aimed to conduct 78 independent observations for each unit, and 20 joint observations to assess inter‐rater reliability. All subteams were scored for each domain. For example, all subteams received leadership domain scores because all team members exhibit leadership behaviors, depending on the situation. In addition to teamwork scores, observers recorded the number of patients on the unit, the number of patients discussed during SIDR, attendance by subteam members, and the duration of SIDR. For the SW‐CM and coleader subteams, we documented presence if one of the subteam members was present for each patients' discussion. For example, we recorded present for SW‐CM if the social worker was in attendance but the case manager was not.
Data Analysis
We calculated descriptive statistics to characterize SIDRs. We used Spearman's rank correlation coefficients to assess inter‐rater reliability for joint observations. Spearman's rank correlation is a nonparametric test of association and appropriate for assessing agreement between observers when using data that is not normally distributed. Spearman rho values range from 1 to 1, with 1 signifying perfect inverse correlation, 0 signifying no correlation, and 1 signifying perfect correlation. We used the MannWhitney U test to assess for differences in overall team scores between services (teaching vs nonteaching hospitalist service) and KruskalWallis tests to assess for differences across units, domains, and subteams. The Kruskal‐Wallis test is a nonparametric test appropriate for comparing three or more independent samples in which the outcome is not normally distributed. We used a t test to assess for difference in duration by service, and Spearman rank correlation to assess for correlation between time spent in discussion per patient and overall team score. All analyses were conducted using Stata version 11.0 (College Station, TX).
RESULTS
SIDR Characteristics
We performed 7 direct observations of SIDR for 4 units, and 8 observations for 2 units (44 total observations). Units were at 99% capacity, and SIDR attendees discussed 98% of patients on the unit. Attendance exceeded 98% for each subteam (physicians, nurses, SW‐CM, pharmacy, and coleaders). SIDR lasted a mean 41.4 11.1 minutes, with a mean 1.5 0.4 minutes spent in discussion per patient. SIDR was significantly longer in duration on teaching service units compared to the nonteaching hospitalist service units (1.7 0.3 vs 1.3 0.4 minutes per patient; P < 0.001).
Inter‐Rater Reliability
Inter‐rater reliability across unit level scores was excellent (rho = 0.75). As shown in Table 1, inter‐rater reliability across domains was good (rho = 0.530.68). Inter‐rater reliability across subteams was good to excellent (rho = 0.530.76) with the exception of the physician subteam, for which it was poor (rho = 0.35).
| Spearman's rho | P Value | |
|---|---|---|
| ||
| Domain (n = 20) | ||
| Communication | 0.62 | <0.01 |
| Coordination | 0.60 | <0.01 |
| Cooperation/backup behavior | 0.66 | <0.01 |
| Leadership | 0.68 | <0.01 |
| Monitoring/situational awareness | 0.53 | 0.02 |
| Subteam (n = 20) | ||
| Physicians | 0.35 | 0.14 |
| Nurses | 0.53 | 0.02 |
| SW‐CM | 0.60 | <0.01 |
| Pharmacy | 0.76 | <0.01 |
| Coleaders | 0.68 | <0.01 |
Assessment of Teamwork by Unit, Domain, and Subteams
Teaching and nonteaching hospitalist units had similar team scores (median [interquartile range (IQR)] = 5.2 [1.0] vs 5.2 [0.4]; P = 0.55). We found significant differences in teamwork scores across units and domains, and found differences of borderline statistical significance across subteams (see Table 2). For unit teamwork scores, the median (IQR) was 4.4 (3.94.9) for the lowest and 5.4 (5.35.5) for the highest performing unit (P = 0.008). Across domain scores, leadership received the lowest score (median [IQR] = 5.0 [4.65.3]), and cooperation/backup behavior and monitoring/situational awareness received the highest scores (median [IQR]) = 5.4 [5.05.5] and 5.4 [5.05.7]; P = 0.02). Subteam scores ranged from a median (IQR) 5.0 (4.45.8) for coleaders to 5.5 (5.05.8) for SW‐CM (P = 0.05). We found no relationship between unit teamwork score and time spent in discussion per patient (rho = 0.04; P = 0.79).
| Median (IQR) | P Value | |
|---|---|---|
| ||
| Unit (n = 44)* | ||
| A | 5.3 (5.15.4) | 0.008 |
| B | 5.4 (5.35.5) | |
| C | 5.1 (4.95.2) | |
| D | 5.4 (5.25.6) | |
| E | 4.4 (3.94.9) | |
| F | 5.3 (5.15.5) | |
| Domain (n = 44) | ||
| Communication | 5.2 (4.95.4) | 0.02 |
| Coordination | 5.2 (4.75.4) | |
| Cooperation/backup behavior | 5.4 (5.05.5) | |
| Leadership | 5.0 (4.65.3) | |
| Monitoring/situational awareness | 5.4 (5.05.7) | |
| Subteam (n = 44) | ||
| Physicians | 5.2 (4.95.4) | 0.05 |
| Nurses | 5.2 (5.05.4) | |
| SW‐CM | 5.5 (5.05.8) | |
| Pharmacy | 5.3 (4.85.8) | |
| Coleaders | 5.0 (4.45.8) | |
DISCUSSION
We found that the adapted OTAS instrument demonstrated acceptable reliability for assessing teamwork during SIDR across units, domains, and most subteams. Although teamwork scores during SIDR were generally high, we found variation in performance across units, domains, and subteams. Variation in performance is notable in light of our efforts to implement a consistent format for SIDR across units. Specifically, all units have similar timing, duration, frequency, and location of SIDR, use a structured communication tool for new patients, expect the same professions to be represented, and use coleaders to facilitate discussion. We believe teamwork within IDR likely varies across units in other hospitals, and perhaps to a larger degree, given the emphasis on purposeful design and implementation of SIDR in our hospital.
Our findings are important for several reasons. First, though commonly used in hospital settings, the effectiveness of IDR is seldom assessed. Hospitalists and other professionals may not be able to identify or characterize deficiencies in teamwork during IDR without objective assessment. The adapted OTAS instrument provides a useful tool to evaluate team performance during IDR. Second, professionals may conclude that the mere implementation of an intervention such as SIDR will improve teamwork ratings and improve patient safety. Importantly, published studies evaluating the benefits of SIDR reflected a pilot study occurring on 2 units.15, 16, 19 The current study emphasizes the need to ensure that interventions proven to be effective on a small scale are implemented consistently when put into place on a larger scale.
Despite good reliability for assessing teamwork during SIDR across units, domains, and most subteams, we found poor inter‐rater reliability for the physician subteam. The explanation for this finding is not entirely clear. We reviewed the anchors for the physician subteam behaviors and were unable to identify ambiguity in anchor definitions. An analysis of domain scores within the physician subteam did not reveal any specific pattern to explain the poor correlation.
We found that the leadership domain and coleader subteam received particularly low scores. The explanation for this finding likely relates to changes in the nurse management structure shortly before our study, which reduced attendance by nurse managers and created a need for clinical coordinators to take on a leadership role during SIDR. Although we provided simulation‐based training to unit medical directors and nurse managers prior to implementing SIDR in March 2010, clinical coordinators were not part of the initial training. Our study suggests a need to provide additional training to coleaders, including clinical coordinators, to enhance their ability to facilitate discussion in SIDR.
We found no difference in overall teamwork scores when comparing teaching service units to nonteaching hospitalist service units. Duration of SIDR was significantly longer on teaching service units, but there was no association between duration of discussion and overall team score. The difference in duration of SIDR is likely explained by less succinct discussions on the part of housestaff physicians compared to more experienced hospitalists. Importantly, the quality of input, and its impact on teamwork during SIDR, does not appear to suffer when physician discussion is less efficient.
Our study has several limitations. First, we evaluated IDR in a single, urban, academic institution, which may limit generalizability. Our version of IDR (ie, SIDR) was designed to improve teamwork and incorporate a structured communication tool with regularly held interdisciplinary meetings. Features of IDR may differ in other hospitals. Second, the high teamwork scores seen in our study may not be generalizable to hospitals which have used a less rigorous, less standardized approach to IDR. Third, SIDR did not include patients or caregivers. Research is needed to test strategies to include patients and caregivers as active team members and participants in clinical decisions during hospitalization. Finally, we used the term interdisciplinary rounds to be consistent with prior published research. The term interprofessional may be more appropriate, as it specifically describes interactions among members of different professions (eg, physicians, nurses, social workers) rather than among different disciplines within a profession (eg, cardiologists, hospitalists, surgeons).
In summary, we found that teamwork during IDR could be reliably assessed using an adapted OTAS instrument. Although scores were generally high, we found variation in performance across units and domains suggesting a need to improve consistency of teamwork performance across units, domains, and subteams. Our study fills an important gap in the literature. Although IDR is commonly used in hospitals, and research shows improvements in ratings of collaboration,11, 12 little if any research has evaluated teamwork during IDR. Beyond the mere implementation of IDR, our study suggests the need to confirm that teamwork is optimal and consistent. Furthermore, hospital leaders should consider specific training for clinicians leading discussion during IDR.
Acknowledgements
The authors express their gratitude to Nick Sevdalis, BSc, MSc, PhD for providing the OTAS instrument and detailed instructions on its use.
Disclosures: Dr O'Leary, Ms Creden, and Dr Williams received salary support from the Agency for Healthcare Research and Quality, grant R18 HS019630. All authors disclose no other relevant or financial conflicts of interest.
- Joint Commission on Accreditation of Healthcare Organizations. Sentinel Event Statistics. Available at: http://www.jointcommission.org/SentinelEvents/Statistics/. Accessed January 19,2012.
- ,,, et al.A look into the nature and causes of human errors in the intensive care unit.Crit Care Med.1995;23(2):294–300.
- ,,, et al.The nature of adverse events in hospitalized patients. Results of the Harvard Medical Practice Study II.N Engl J Med.1991;324(6):377–384.
- ,,.Communication failures: an insidious contributor to medical mishaps.Acad Med.2004;79(2):186–194.
- ,,,,,.The Quality in Australian Health Care Study.Med J Aust.1995;163(9):458–471.
- ,,,,,.Teamwork on inpatient medical units: assessing attitudes and barriers.Qual Saf Health Care.2010;19(2):117–121.
- ,,,,,.Can we talk? Priorities for patient care differed among health care providers. In: Henriksen K, Battles JB, Marks ES, Lewin DI, eds.Advances in Patient Safety: From Research to Implementation. Vol1: Research Findings. AHRQ Publication No. 05–0021‐1.Rockville, MD:Agency for Healthcare Research and Quality;2005.
- ,,, et al.Patterns of nurse‐physician communication and agreement on the plan of care.Qual Saf Health Care.2010;19(3):195–199.
- ,,, et al.The effect of a multidisciplinary hospitalist/physician and advanced practice nurse collaboration on hospital costs.J Nurs Adm.2006;36(2):79–85.
- ,,.A firm trial of interdisciplinary rounds on the inpatient medical wards: an intervention designed using continuous quality improvement.Med Care.1998;36(8 suppl):AS4–AS12.
- ,,,.Effect of a multidisciplinary intervention on communication and collaboration among physicians and nurses.Am J Crit Care.2005;14(1):71–77.
- ,,,,.Use of multidisciplinary rounds to simultaneously improve quality outcomes, enhance resident education, and shorten length of stay.J Gen Intern Med.2007;22(8):1073–1079.
- ,,,.Effects of interdisciplinary rounds on length of stay in a telemetry unit.J Public Health Manag Pract.2004;10(1):63–69.
- ,,,,.Teamwork and team performance in multidisciplinary cancer teams: development and evaluation of an observational assessment tool.BMJ Qual Saf.2011 [Epub ahead of print].
- ,,,,,.Improving teamwork: impact of structured interdisciplinary rounds on a hospitalist unit.J Hosp Med.2011;6(2):88–93.
- ,,,,,.Improving teamwork: impact of structured interdisciplinary rounds on a medical teaching unit.J Gen Intern Med.2010;25(8):826–832.
- ,,,,.Improving nurse‐physician communication and satisfaction in the intensive care unit with a daily goals worksheet.Am J Crit Care.2006;15(2):217–222.
- ,,,,,.Improving communication in the ICU using daily goals.J Crit Care.2003;18(2):71–75.
- ,,, et al.Structured interdisciplinary rounds in a medical teaching unit: improving patient safety.Arch Intern Med.2011;171(7):678–684.
- ,,, et al.Impact of localizing physicians to hospital units on nurse‐physician communication and agreement on the plan of care.J Gen Intern Med.2009;24(11):1223–1227.
- ,,,,.Observational teamwork assessment for surgery (OTAS): refinement and application in urological surgery.World J Surg.2007;31(7):1373–1381.
- ,,,,,.Observational teamwork assessment for surgery: construct validation with expert versus novice raters.Ann Surg.2009;249(6):1047–1051.
- ,,,,.Observational teamwork assessment for surgery: content validation and tool refinement.J Am Coll Surg.2011;212(2):234–243.e1–5.
Teamwork is essential to delivering safe and effective hospital care,15 yet the fluidity and geographic dispersion of team members in the hospital setting presents a significant barrier to teamwork.6 Physicians, nurses, and other hospital professionals frequently lack convenient and reliable opportunities to interact, and may struggle in efforts to discuss the care of their patients in person. Research studies show that nurses and physicians on patient care units do not communicate consistently and frequently do not agree on key aspects of their patients' plans of care.7, 8
Interdisciplinary rounds (IDR), also known as multidisciplinary rounds, provide a means to assemble hospital care team members and improve collaboration.913 Prior research on the use of IDR has demonstrated improved ratings of collaboration,11, 12 but inconsistent effects on length of stay and cost.10, 12, 13 Notably, the format, frequency, and duration of IDR in prior studies has been variable and no studies, to our knowledge, have evaluated teamwork performance during IDR. Lamb and colleagues conducted observations of cancer teams during multidisciplinary meetings.14 Trained observers used a validated observation tool to rate teamwork and found significant variation in performance by subteams. However, the study focused mainly on discussion among physician team members during meetings to plan longitudinal care for oncology patients.
We recently reported on the use of structured interdisciplinary rounds (SIDR) on 2 medical units in our hospital.15, 16 SIDR combines a structured format for communication, similar to a goals‐of‐care form,17, 18 with a forum for daily interdisciplinary meetings. Though no effect was seen on length of stay or cost, SIDR was associated with significantly higher ratings of the quality of collaboration and teamwork climate, and a reduction in the rate of adverse events.19 In March 2010, we implemented SIDR across all medical units in our hospital. We subjectively noted variation in teamwork performance during SIDR after a modification of nurse manager roles. We sought to evaluate teamwork during SIDR and to determine whether variation in performance existed and, if present, to characterize it.
METHODS
Setting and Study Design
The study was conducted at Northwestern Memorial Hospital (NMH), a 920‐bed tertiary care teaching hospital in Chicago, IL, and was deemed exempt by the Institutional Review Board of Northwestern University. General medical patients were admitted to 1 of 6 units based on bed availability. Five of the medical units consisted of 30 beds, and 1 unit consisted of 23. Each unit was equipped with continuous cardiac telemetry monitoring. Three units were staffed by teaching service physician teams consisting of 1 attending, 1 resident, and 1 or 2 interns. The other 3 units were staffed by hospitalists without the assistance of resident or intern physicians. As a result of a prior intervention, physicians' patients were localized to specific units in an effort to improve communication practices among nurses and physicians.20
Beginning in March 2010, all general medical units held SIDR each weekday morning. SIDR took place in the unit conference room, was expected to last approximately 3040 minutes, and was co‐led by the unit nurse manager and a medical director. Unit nurse managers and medical directors received specific training for their roles, including 3 hours of simulation‐based exercises designed to enhance their skills in facilitating discussion during SIDR. All nurses and physicians caring for patients on the unit, as well as the pharmacist, social worker, and case manager assigned to the unit, attended SIDR. Attendees used a structured communication tool to review patients admitted in the previous 24 hours. The plan of care for other patients was also discussed in SIDR, but without the use of the structured communication tool.
Importantly, nurse management underwent restructuring in the summer of 2011. Nurse managers, who had previously been responsible for overseeing all nursing activities on a single unit, were redeployed to be responsible for specific activities across 34 units. This restructuring made it very difficult for nurse managers to colead SIDR. As a result, the unit nurse clinical coordinator assumed coleadership of SIDR with the unit medical director. Nurse clinical coordinators worked every weekday and did not have patient care responsibilities while on duty. In addition to their role in coleading SIDR, nurse clinical coordinators addressed daily staffing and scheduling challenges and other short‐term patient care needs.
Teamwork Assessment
We adapted the Observational Teamwork Assessment for Surgery (OTAS) tool, a behaviorally anchored rating scale shown to be reliable and valid in surgical settings.2123 The OTAS tool provides scores ranging from 0 to 6 (0 = problematic behavior; 3 = team function neither hindered nor enhanced by behavior; 6 = exemplary behavior) across 5 domains (communication, coordination, cooperation/backup behavior, leadership, and monitoring/situational awareness) and for prespecified subteams. We defined domains as described by the researchers who developed OTAS. Communication referred to the quality and the quantity of information exchanged by team members. Coordination referred to management and timing of activities and tasks. Cooperation and backup behavior referred to assistance provided among members of the team, supporting others and correcting errors. Leadership referred to provision of directions, assertiveness, and support among team members. Monitoring and situational awareness referred to team observation and awareness of ongoing processes. We defined subteams for each group of professionals expected to attend SIDR. Specifically, subteams included physicians, nurses, social work‐case management (SW‐CM), pharmacy, and coleaders. We combined social work and case management because these professionals have similar patient care activities. Similarly, we combined unit medical directors and nurse clinical coordinators as coleaders. By providing data on teamwork performance within specific domains and for specific subteams, the OTAS instrument helps identify factors influencing overall teamwork performance. We modified OTAS anchors to reflect behaviors during SIDR. Anchors assisted observers in their rating of teamwork behaviors during SIDR. For example, an anchor for exemplary physician communication behavior was listens actively to other team members (looks at other team members, nods, etc). An anchor for exemplary physician leadership was assigns responsibility for task completion when appropriate.
Two researchers conducted unannounced direct observations of SIDRs. One researcher (Y.N.B) was a medical librarian with previous experience conducting observational research. The other researcher (A.J.C.) had observed 170 prior SIDRs as part of a related study. Both researchers observed 10 SIDRs to practice data collection and to inform minor revisions of the anchors. We aimed to conduct 78 independent observations for each unit, and 20 joint observations to assess inter‐rater reliability. All subteams were scored for each domain. For example, all subteams received leadership domain scores because all team members exhibit leadership behaviors, depending on the situation. In addition to teamwork scores, observers recorded the number of patients on the unit, the number of patients discussed during SIDR, attendance by subteam members, and the duration of SIDR. For the SW‐CM and coleader subteams, we documented presence if one of the subteam members was present for each patients' discussion. For example, we recorded present for SW‐CM if the social worker was in attendance but the case manager was not.
Data Analysis
We calculated descriptive statistics to characterize SIDRs. We used Spearman's rank correlation coefficients to assess inter‐rater reliability for joint observations. Spearman's rank correlation is a nonparametric test of association and appropriate for assessing agreement between observers when using data that is not normally distributed. Spearman rho values range from 1 to 1, with 1 signifying perfect inverse correlation, 0 signifying no correlation, and 1 signifying perfect correlation. We used the MannWhitney U test to assess for differences in overall team scores between services (teaching vs nonteaching hospitalist service) and KruskalWallis tests to assess for differences across units, domains, and subteams. The Kruskal‐Wallis test is a nonparametric test appropriate for comparing three or more independent samples in which the outcome is not normally distributed. We used a t test to assess for difference in duration by service, and Spearman rank correlation to assess for correlation between time spent in discussion per patient and overall team score. All analyses were conducted using Stata version 11.0 (College Station, TX).
RESULTS
SIDR Characteristics
We performed 7 direct observations of SIDR for 4 units, and 8 observations for 2 units (44 total observations). Units were at 99% capacity, and SIDR attendees discussed 98% of patients on the unit. Attendance exceeded 98% for each subteam (physicians, nurses, SW‐CM, pharmacy, and coleaders). SIDR lasted a mean 41.4 11.1 minutes, with a mean 1.5 0.4 minutes spent in discussion per patient. SIDR was significantly longer in duration on teaching service units compared to the nonteaching hospitalist service units (1.7 0.3 vs 1.3 0.4 minutes per patient; P < 0.001).
Inter‐Rater Reliability
Inter‐rater reliability across unit level scores was excellent (rho = 0.75). As shown in Table 1, inter‐rater reliability across domains was good (rho = 0.530.68). Inter‐rater reliability across subteams was good to excellent (rho = 0.530.76) with the exception of the physician subteam, for which it was poor (rho = 0.35).
| Spearman's rho | P Value | |
|---|---|---|
| ||
| Domain (n = 20) | ||
| Communication | 0.62 | <0.01 |
| Coordination | 0.60 | <0.01 |
| Cooperation/backup behavior | 0.66 | <0.01 |
| Leadership | 0.68 | <0.01 |
| Monitoring/situational awareness | 0.53 | 0.02 |
| Subteam (n = 20) | ||
| Physicians | 0.35 | 0.14 |
| Nurses | 0.53 | 0.02 |
| SW‐CM | 0.60 | <0.01 |
| Pharmacy | 0.76 | <0.01 |
| Coleaders | 0.68 | <0.01 |
Assessment of Teamwork by Unit, Domain, and Subteams
Teaching and nonteaching hospitalist units had similar team scores (median [interquartile range (IQR)] = 5.2 [1.0] vs 5.2 [0.4]; P = 0.55). We found significant differences in teamwork scores across units and domains, and found differences of borderline statistical significance across subteams (see Table 2). For unit teamwork scores, the median (IQR) was 4.4 (3.94.9) for the lowest and 5.4 (5.35.5) for the highest performing unit (P = 0.008). Across domain scores, leadership received the lowest score (median [IQR] = 5.0 [4.65.3]), and cooperation/backup behavior and monitoring/situational awareness received the highest scores (median [IQR]) = 5.4 [5.05.5] and 5.4 [5.05.7]; P = 0.02). Subteam scores ranged from a median (IQR) 5.0 (4.45.8) for coleaders to 5.5 (5.05.8) for SW‐CM (P = 0.05). We found no relationship between unit teamwork score and time spent in discussion per patient (rho = 0.04; P = 0.79).
| Median (IQR) | P Value | |
|---|---|---|
| ||
| Unit (n = 44)* | ||
| A | 5.3 (5.15.4) | 0.008 |
| B | 5.4 (5.35.5) | |
| C | 5.1 (4.95.2) | |
| D | 5.4 (5.25.6) | |
| E | 4.4 (3.94.9) | |
| F | 5.3 (5.15.5) | |
| Domain (n = 44) | ||
| Communication | 5.2 (4.95.4) | 0.02 |
| Coordination | 5.2 (4.75.4) | |
| Cooperation/backup behavior | 5.4 (5.05.5) | |
| Leadership | 5.0 (4.65.3) | |
| Monitoring/situational awareness | 5.4 (5.05.7) | |
| Subteam (n = 44) | ||
| Physicians | 5.2 (4.95.4) | 0.05 |
| Nurses | 5.2 (5.05.4) | |
| SW‐CM | 5.5 (5.05.8) | |
| Pharmacy | 5.3 (4.85.8) | |
| Coleaders | 5.0 (4.45.8) | |
DISCUSSION
We found that the adapted OTAS instrument demonstrated acceptable reliability for assessing teamwork during SIDR across units, domains, and most subteams. Although teamwork scores during SIDR were generally high, we found variation in performance across units, domains, and subteams. Variation in performance is notable in light of our efforts to implement a consistent format for SIDR across units. Specifically, all units have similar timing, duration, frequency, and location of SIDR, use a structured communication tool for new patients, expect the same professions to be represented, and use coleaders to facilitate discussion. We believe teamwork within IDR likely varies across units in other hospitals, and perhaps to a larger degree, given the emphasis on purposeful design and implementation of SIDR in our hospital.
Our findings are important for several reasons. First, though commonly used in hospital settings, the effectiveness of IDR is seldom assessed. Hospitalists and other professionals may not be able to identify or characterize deficiencies in teamwork during IDR without objective assessment. The adapted OTAS instrument provides a useful tool to evaluate team performance during IDR. Second, professionals may conclude that the mere implementation of an intervention such as SIDR will improve teamwork ratings and improve patient safety. Importantly, published studies evaluating the benefits of SIDR reflected a pilot study occurring on 2 units.15, 16, 19 The current study emphasizes the need to ensure that interventions proven to be effective on a small scale are implemented consistently when put into place on a larger scale.
Despite good reliability for assessing teamwork during SIDR across units, domains, and most subteams, we found poor inter‐rater reliability for the physician subteam. The explanation for this finding is not entirely clear. We reviewed the anchors for the physician subteam behaviors and were unable to identify ambiguity in anchor definitions. An analysis of domain scores within the physician subteam did not reveal any specific pattern to explain the poor correlation.
We found that the leadership domain and coleader subteam received particularly low scores. The explanation for this finding likely relates to changes in the nurse management structure shortly before our study, which reduced attendance by nurse managers and created a need for clinical coordinators to take on a leadership role during SIDR. Although we provided simulation‐based training to unit medical directors and nurse managers prior to implementing SIDR in March 2010, clinical coordinators were not part of the initial training. Our study suggests a need to provide additional training to coleaders, including clinical coordinators, to enhance their ability to facilitate discussion in SIDR.
We found no difference in overall teamwork scores when comparing teaching service units to nonteaching hospitalist service units. Duration of SIDR was significantly longer on teaching service units, but there was no association between duration of discussion and overall team score. The difference in duration of SIDR is likely explained by less succinct discussions on the part of housestaff physicians compared to more experienced hospitalists. Importantly, the quality of input, and its impact on teamwork during SIDR, does not appear to suffer when physician discussion is less efficient.
Our study has several limitations. First, we evaluated IDR in a single, urban, academic institution, which may limit generalizability. Our version of IDR (ie, SIDR) was designed to improve teamwork and incorporate a structured communication tool with regularly held interdisciplinary meetings. Features of IDR may differ in other hospitals. Second, the high teamwork scores seen in our study may not be generalizable to hospitals which have used a less rigorous, less standardized approach to IDR. Third, SIDR did not include patients or caregivers. Research is needed to test strategies to include patients and caregivers as active team members and participants in clinical decisions during hospitalization. Finally, we used the term interdisciplinary rounds to be consistent with prior published research. The term interprofessional may be more appropriate, as it specifically describes interactions among members of different professions (eg, physicians, nurses, social workers) rather than among different disciplines within a profession (eg, cardiologists, hospitalists, surgeons).
In summary, we found that teamwork during IDR could be reliably assessed using an adapted OTAS instrument. Although scores were generally high, we found variation in performance across units and domains suggesting a need to improve consistency of teamwork performance across units, domains, and subteams. Our study fills an important gap in the literature. Although IDR is commonly used in hospitals, and research shows improvements in ratings of collaboration,11, 12 little if any research has evaluated teamwork during IDR. Beyond the mere implementation of IDR, our study suggests the need to confirm that teamwork is optimal and consistent. Furthermore, hospital leaders should consider specific training for clinicians leading discussion during IDR.
Acknowledgements
The authors express their gratitude to Nick Sevdalis, BSc, MSc, PhD for providing the OTAS instrument and detailed instructions on its use.
Disclosures: Dr O'Leary, Ms Creden, and Dr Williams received salary support from the Agency for Healthcare Research and Quality, grant R18 HS019630. All authors disclose no other relevant or financial conflicts of interest.
- Joint Commission on Accreditation of Healthcare Organizations. Sentinel Event Statistics. Available at: http://www.jointcommission.org/SentinelEvents/Statistics/. Accessed January 19,2012.
- ,,, et al.A look into the nature and causes of human errors in the intensive care unit.Crit Care Med.1995;23(2):294–300.
- ,,, et al.The nature of adverse events in hospitalized patients. Results of the Harvard Medical Practice Study II.N Engl J Med.1991;324(6):377–384.
- ,,.Communication failures: an insidious contributor to medical mishaps.Acad Med.2004;79(2):186–194.
- ,,,,,.The Quality in Australian Health Care Study.Med J Aust.1995;163(9):458–471.
- ,,,,,.Teamwork on inpatient medical units: assessing attitudes and barriers.Qual Saf Health Care.2010;19(2):117–121.
- ,,,,,.Can we talk? Priorities for patient care differed among health care providers. In: Henriksen K, Battles JB, Marks ES, Lewin DI, eds.Advances in Patient Safety: From Research to Implementation. Vol1: Research Findings. AHRQ Publication No. 05–0021‐1.Rockville, MD:Agency for Healthcare Research and Quality;2005.
- ,,, et al.Patterns of nurse‐physician communication and agreement on the plan of care.Qual Saf Health Care.2010;19(3):195–199.
- ,,, et al.The effect of a multidisciplinary hospitalist/physician and advanced practice nurse collaboration on hospital costs.J Nurs Adm.2006;36(2):79–85.
- ,,.A firm trial of interdisciplinary rounds on the inpatient medical wards: an intervention designed using continuous quality improvement.Med Care.1998;36(8 suppl):AS4–AS12.
- ,,,.Effect of a multidisciplinary intervention on communication and collaboration among physicians and nurses.Am J Crit Care.2005;14(1):71–77.
- ,,,,.Use of multidisciplinary rounds to simultaneously improve quality outcomes, enhance resident education, and shorten length of stay.J Gen Intern Med.2007;22(8):1073–1079.
- ,,,.Effects of interdisciplinary rounds on length of stay in a telemetry unit.J Public Health Manag Pract.2004;10(1):63–69.
- ,,,,.Teamwork and team performance in multidisciplinary cancer teams: development and evaluation of an observational assessment tool.BMJ Qual Saf.2011 [Epub ahead of print].
- ,,,,,.Improving teamwork: impact of structured interdisciplinary rounds on a hospitalist unit.J Hosp Med.2011;6(2):88–93.
- ,,,,,.Improving teamwork: impact of structured interdisciplinary rounds on a medical teaching unit.J Gen Intern Med.2010;25(8):826–832.
- ,,,,.Improving nurse‐physician communication and satisfaction in the intensive care unit with a daily goals worksheet.Am J Crit Care.2006;15(2):217–222.
- ,,,,,.Improving communication in the ICU using daily goals.J Crit Care.2003;18(2):71–75.
- ,,, et al.Structured interdisciplinary rounds in a medical teaching unit: improving patient safety.Arch Intern Med.2011;171(7):678–684.
- ,,, et al.Impact of localizing physicians to hospital units on nurse‐physician communication and agreement on the plan of care.J Gen Intern Med.2009;24(11):1223–1227.
- ,,,,.Observational teamwork assessment for surgery (OTAS): refinement and application in urological surgery.World J Surg.2007;31(7):1373–1381.
- ,,,,,.Observational teamwork assessment for surgery: construct validation with expert versus novice raters.Ann Surg.2009;249(6):1047–1051.
- ,,,,.Observational teamwork assessment for surgery: content validation and tool refinement.J Am Coll Surg.2011;212(2):234–243.e1–5.
Copyright © 2012 Society of Hospital Medicine
Unprofessional Behavior and Hospitalists
The discrepancy between what is taught about professionalism in formal medical education and what is witnessed in the hospital has received increasing attention.17 This latter aspect of medical education contributes to the hidden curriculum and impacts medical trainees' views on professionalism.8 The hidden curriculum refers to the lessons trainees learn through informal interactions within the multilayered educational learning environment.9 A growing body of work examines how the hidden curriculum and disruptive physicians impact the learning environment.9, 10 In response, regulatory agencies, such as the Liaison Committee on Medical Education (LCME) and Accreditation Council for Graduate Medical Education (ACGME), require training programs and medical schools to maintain standards of professionalism, and to regularly evaluate the learning environment and its impact on professionalism.11, 12 The ACGME in 2011 expanded its standards regarding professionalism by making certain that the program director and institution ensure a culture of professionalism that supports patient safety and personal responsibility.11 Given this increasing focus on professionalism in medical school and residency training programs, it is critical to examine faculty perceptions and actions that may perpetuate the discrepancy between the formal and hidden curriculum.13 This early exposure is especially significant because unprofessional behavior in medical school is strongly associated with later disciplinary action by a medical board.14, 15 Certain unprofessional behaviors can also compromise patient care and safety, and can detract from the hospital working environment.1618
In our previous work, we demonstrated that internal medicine interns reported increased participation in unprofessional behaviors regarding on‐call etiquette during internship.19, 20 Examples of these behaviors include refusing an admission (ie, blocking) and misrepresenting a test as urgent. Interestingly, students and residents have highlighted the powerful role of supervising faculty physicians in condoning or inhibiting such behavior. Given the increasing role of hospitalists as resident supervisors, it is important to consider the perceptions and actions of hospitalists with respect to perpetuating or hindering some unprofessional behaviors. Although hospital medicine is a relatively new specialty, many hospitalists are in frequent contact with medical trainees, perhaps because many residency programs and medical schools have a strong inpatient focus.2123 It is thus possible that hospitalists have a major influence on residents' behaviors and views of professionalism. In fact, the Society of Hospital Medicine's Core Competencies for Hospital Medicine explicitly state that hospitalists are expected to serve as a role model for professional and ethical conduct to house staff, medical students and other members of the interdisciplinary team.24
Therefore, the current study had 2 aims: first, to measure internal medicine hospitalists' perceptions of, and participation in, unprofessional behaviors using a previously validated survey; and second, to examine associations between job characteristics and participation in unprofessional behaviors.
METHODS
Study Design
This was a multi‐institutional, observational study that took place at the University of Chicago Pritzker School of Medicine, Northwestern University Feinberg School of Medicine, and NorthShore University HealthSystem. Hospitalist physicians employed at these hospitals were recruited for this study between June 2010 and July 2010. The Institutional Review Boards of the University of Chicago, Northwestern University, and NorthShore University HealthSystem approved this study. All subjects provided informed consent before participating.
Survey Development and Administration
Based on a prior survey of interns and third‐year medical students, a 35‐item survey was used to measure perceptions of, and participation in, unprofessional behaviors.8, 19, 20 The original survey was developed in 2005 by medical students who observed behaviors by trainees and faculty that they considered to be unprofessional. The survey was subsequently modified by interns to ascertain unprofessional behavior among interns. For this iteration, hospitalists and study authors at each site reviewed the survey items and adapted each item to ensure relevance to hospitalist work and also generalizability to site. New items were also created to refer specifically to work routinely performed by hospitalist attendings (attesting to resident notes, transferring patients to other services to reduce workload, etc). Because of this, certain items utilized jargon to refer to the unprofessional behavior as hospitalists do (ie, blocking admissions and turfing), and resonate with literature describing these phenomena.25 Items were also written in such a fashion to elicit the unprofessional nature (ie, blocking an admission that could be appropriate for your service).
The final survey (see Supporting Information, Appendix, in the online version of this article) included domains such as interactions with others, interactions with trainees, and patient‐care scenarios. Demographic information and job characteristics were collected including year of residency completion, total amount of clinical work, amount of night work, and amount of administrative work. Hospitalists were not asked whether they completed residency at the institution where they currently work in order to maintain anonymity in the context of a small sample. Instead, they were asked to rate their familiarity with residents at their institution on a Likert‐type scale ranging from very unfamiliar (1) to familiar (3) to very familiar (5). To help standardize levels of familiarity across hospitalists, we developed anchors that corresponded to how well a hospitalist would know resident names with familiar defined as knowing over half of resident names.
Participants reported whether they participated in, or observed, a particular behavior and rated their perception of each behavior from 1 (unprofessional) to 5 (professional), with unprofessional and somewhat unprofessional defined as unprofessional. A site champion administered paper surveys during a routine faculty meeting at each site. An electronic version was administered using SurveyMonkey (SurveyMonkey, Palo Alto, CA) to hospitalists not present at the faculty meeting. Participants chose a unique, nonidentifiable code to facilitate truthful reporting while allowing data tracking in follow‐up studies.
Data Analysis
Clinical time was dichotomized using above and below 50% full‐time equivalents (FTE) to define those that did less clinical. Because teaching time was relatively low with the median percent FTE spent on teaching at 10%, we used a cutoff of greater than 10% as greater teaching. Because many hospitalists engaged in no night work, night work was reported as those who engaged in any night work and those who did not. Similarly, because many hospitalists had no administrative time, administrative time was split into those with any administrative work and those without any administrative work. Lastly, those born after 1970 were classified as younger hospitalists.
Chi‐square tests were used to compare site response rates, and descriptive statistics were used to examine demographic characteristics of hospitalist respondents, in addition to perception of, and participation in, unprofessional behaviors. Because items on the survey were highly correlated, we used factor analysis to identify the underlying constructs that related to unprofessional behavior.26 Factor analysis is a statistical procedure that is most often used to explore which variables in a data set are most related or correlated to each other. By examining the patterns of similar responses, the underlying factors can be identified and extracted. These factors, by definition, are not correlated with each other. To select the number of factors to retain, the most common convention is to use Kaiser criterion, or retain all factors with eigenvalues greater than, or equal to, one.27 An eigenvalue measures the amount of variation in all of the items on the survey which is accounted for by that factor. If a factor has a low eigenvalue (less than 1 is the convention), then it is contributing little and is ignored, as it is likely redundant with the higher value factors.
Because use of Kaiser criterion often overestimates the number of factors to retain, another method is to use a scree plot which tends to underestimate the factors. Both were used in this study to ensure a stable solution. To name the factors, we examined which items or group of items loaded or were most highly related to which factor. To ensure an optimal factor solution, items with minimal participation (less than 3%) were excluded from factor analysis.
Then, site‐adjusted multivariate regression analysis was used to examine associations between job and demographic characteristics, and the factors of unprofessional behavior identified. Models controlled for gender and familiarity with residents. Because sample medians were used to define greater teaching (>10% FTE), we also performed a sensitivity analysis using different cutoffs for teaching time (>20% FTE and teaching tertiles). Likewise, we also used varying definitions of less clinical time to ensure that any statistically significant associations were robust across varying definitions. All data were analyzed using STATA 11.0 (Stata Corp, College Station, TX) and statistical significance was defined as P < 0.05.
RESULTS
Seventy‐seven of the 101 hospitalists (76.2%) at 3 sites completed the survey. While response rates varied by site (site 1, 67%; site 2, 74%; site 3, 86%), the differences were not statistically significant (2 = 2.9, P = 0.24). Most hospitalists (79.2%) completed residency after 2000. Over half (57.1%) of participants were male, and over half (61%) reported having worked with their current hospitalist group from 1 to 4 years. Almost 60% (59.7%) reported being unfamiliar with residents in the program. Over 40% of hospitalists did not do any night work. Hospitalists were largely clinical, one‐quarter of hospitalists reported working over 50% FTE, and the median was 80% FTE. While 78% of hospitalists reported some teaching time, median time on teaching service was low at 10% (Table 1).
| Total n (%) | |
|---|---|
| |
| Male (%) | 44 (57.1) |
| Completed residency (%) | |
| Between 1981 and 1990 | 2 (2.6) |
| Between 1991 and 2000 | 14 (18.2) |
| After 2000 | 61 (79.2) |
| Medical school matriculation (%) (n = 76) | |
| US medical school | 59 (77.6) |
| International medical school | 17 (22.3) |
| Years spent with current hospitalist group (%) | |
| <1 yr | 14 (18.2) |
| 14 yr | 47 (61.0) |
| 59 yr | 15 (19.5) |
| >10 yr | 1 (1.3) |
| Familiarity with residents (%) | |
| Familiar | 31 (40.2) |
| Unfamiliar | 46 (59.7) |
| No. of weeks per year spent on (median IQR) | |
| Hospitalist practice (n = 72) | 26.0 [16.026.0] |
| Teaching services (n = 68) | 4.0 [1.08.0] |
| Weeks working nights* (n = 71) | |
| >2 wk | 16 (22.5) |
| 12 wk | 24 (33.8) |
| 0 wk | 31 (43.7) |
| % Clinical time (median IQR)* (n = 73) | 80 (5099) |
| % Teaching time (median IQR)* (n = 74) | 10 (120) |
| Any research time (%)* (n = 71) | 22 (31.0) |
| Any administrative time (%) (n = 72) | 29 (40.3) |
| Completed fellowship (%)* | 12 (15.6) |
| Won teaching awards (%)* (n = 76) | 21 (27.6) |
| View a career in hospital medicine as (%) | |
| Temporary | 11 (14.3) |
| Long term | 47 (61.0) |
| Unsure | 19 (24.7) |
Hospitalists perceived almost all behaviors as unprofessional (unprofessional or somewhat unprofessional on a 5‐point Likert Scale). The only behavior rated as professional with a mean of 4.25 (95% CI 4.014.49) was staying past shift limit to complete a patient‐care task that could have been signed out. This behavior also had the highest level of participation by hospitalists (81.7%). Hospitalists were most ambivalent when rating professionalism of attending an industry‐sponsored dinner or social event (mean 3.20, 95% CI 2.983.41) (Table 2).
| Behavior | Reported Perception (Mean Likert score)* | Reported Participation (%) | Reported Observation (%) |
|---|---|---|---|
| |||
| Having nonmedical/personal conversations in patient corridors (eg, discussing evening plans) | 2.55 (2.342.76) | 67.1 | 80.3 |
| Ordering a routine test as urgent to get it expedited | 2.82 (2.583.06) | 62.3 | 80.5 |
| Making fun of other physicians to colleagues | 1.56 (1.391.70) | 40.3 | 67.5 |
| Disparaging the ER team/outpatient doctor to others for findings later discovered on the floor (eg, after the patient is admitted) | 2.01 (1.842.19) | 39.5 | 67.1 |
| Signing out patients over the phone at the end of shift when sign‐out could have been done in person | 2.95 (2.743.16) | 40.8 | 65.8 |
| Texting or using smartphone during educational conferences (ie, noon lecture) | 2.16 (1.952.36) | 39.0 | 72.7 |
| Discussing patient information in public spaces | 1.49 (1.341.63) | 37.7 | 66.2 |
| Making fun of other attendings to colleagues | 1.62 (1.461.78) | 35.1 | 61.0 |
| Deferring family members' concerns about a change in the patient's clinical course to the primary team in order to avoid engaging in such a discussion | 2.16 (1.912.40) | 30.3 | 55.3 |
| Making disparaging comments about a patient on rounds | 1.42 (1.271.56) | 29.8 | 67.5 |
| Attending an industry (eg, pharmaceutical or equipment/device manufacturer)‐sponsored dinner or social event | 3.20 (2.983.41) | 28.6 | 60.5 |
| Ignoring family member's nonurgent questions about a cross‐cover patient when you had time to answer | 2.05 (1.852.25) | 26.3 | 48.7 |
| Attesting to a resident's note when not fully confident of the content of their documentation | 1.65 (1.451.85) | 23.4 | 32.5 |
| Making fun of support staff to colleagues | 1.45 (1.311.59) | 22.1 | 57.9 |
| Not correcting someone who mistakes a student for a physician | 2.19 (2.012.38) | 20.8 | 35.1 |
| Celebrating a blocked‐admission | 1.80 (1.612.00) | 21.1 | 60.5 |
| Making fun of residents to colleagues | 1.53 (1.371.70) | 18.2 | 44.2 |
| Coming to work when you have a significant illness (eg, influenza) | 1.99 (1.792.19) | 14.3 | 35.1 |
| Celebrating a successful turf | 1.71 (1.511.92) | 11.7 | 39.0 |
| Failing to notify the patient that a member of the team made, or is concerned that they made, an error | 1.53 (1.341.71) | 10.4 | 20.8 |
| Transferring a patient, who could be cared for on one's own service, to another service in order to reduce one's census (eg, turfing) | 1.72 (1.521.91) | 9.3 | 58.7 |
| Refusing an admission which could be considered appropriate for your service (eg, blocking) | 1.63 (1.441.82) | 7.9 | 68.4 |
| Falsifying patient records (ie, back‐dating a note, copying forward unverified information, or documenting physical findings not personally obtained) | 1.22 (1.101.34) | 6.5 | 27.3 |
| Making fun of students to colleagues | 1.35 (1.191.51) | 6.5 | 24.7 |
| Failing to notify patient‐safety or risk management that a member of the team made, or is concerned that they made, an error | 1.64 (1.461.82) | 5.2 | 13.2 |
| Introducing a student as a doctor to patients | 1.96 (1.762.16) | 3.9 | 20.8 |
| Signing‐out a procedure or task, that could have been completed during a required shift or by the primary team, in order to go home as early in the day as possible | 1.48 (1.321.64) | 3.9 | 48.1 |
| Performing medical or surgical procedures on a patient beyond self‐perceived level of skill | 1.27 (1.141.41) | 2.6 | 7.8 |
| Asking a student to obtain written consent from a patient or their proxy without supervision (eg, for blood transfusion or minor procedures) | 1.60 (1.421.78) | 2.63 | 6.5 |
| Encouraging a student to state that they are a doctor in order to expedite patient care | 1.31 (1.151.47) | 2.6 | 6.5 |
| Discharging a patient before they are ready to go home in order to reduce one's census | 1.18 (1.071.29) | 2.6 | 19.5 |
| Reporting patient information (eg, labs, test results, exam results) as normal when uncertain of the true results | 1.29 (1.161.41) | 2.6 | 15.6 |
| Asking a student to perform medical or surgical procedures which are perceived to be beyond their level of skill | 1.26 (1.121.40) | 1.3 | 3.9 |
| Asking a student to discuss, with patients, medical or surgical information which is perceived to be beyond their level of knowledge | 1.41 (1.261.56) | 0.0 | 15.8 |
Participation in egregious behaviors, such as falsifying patient records (6.49%) and performing medical or surgical procedures on a patient beyond self‐perceived level of skill (2.60%), was very low. The most common behaviors rated as unprofessional that hospitalists reported participating in were having nonmedical/personal conversations in patient corridors (67.1%), ordering a routine test as urgent to expedite care (62.3%), and making fun of other physicians to colleagues (40.3%). Forty percent of participants reported disparaging the emergency room (ER) team or primary care physician for findings later discovered, signing out over the phone when it could have been done in person, and texting or using smartphones during educational conferences. In particular, participation in unprofessional behaviors related to trainees was close to zero (eg, asking a student to discuss, with patients, medical or surgical information which is perceived to be beyond their level of knowledge). The least common behaviors that hospitalists reported participating in were discharging a patient before they are ready to go home in order to reduce one's census (2.56%) and reporting patient information as normal when uncertain of the true results (2.60%). Like previous studies of unprofessional behaviors, those that reported participation were less likely to report the behavior as unprofessional.8, 19
Observation of behaviors ranged from 4% to 80%. In all cases, observation of the behavior was reported at a higher level than participation. Correlation between observation and participation was also high, with the exception of a few behaviors that had zero or near zero participation rates (ie, reporting patient information as normal when unsure of true results.)
After performing factor analysis, 4 factors had eigenvalues greater than 1 and were therefore retained and extracted for further analysis. These 4 factors accounted for 76% of the variance in responses reported on the survey. By examining which items or groups of items most strongly loaded on each factor, the factors were named accordingly: factor 1 referred to behaviors related to making fun of others, factor 2 referred to workload management, factor 3 referred to behaviors related to the learning environment, and factor 4 referred to behaviors related to time pressure (Table 3).
|
| Factor 1: Making fun of others |
| Making fun of other physicians (0.78) |
| Making fun of attendings (0.77) |
| Making fun of residents (0.70) |
| Making disparaging comments about a patient on rounds (0.51) |
| Factor 2: Workload management |
| Celebrating a successful turf (0.81) |
| Celebrating a blocked‐admission (0.65) |
| Coming to work sick (0.56) |
| Transferring a patient, who could be cared for on one's own service, to another service in order to reduce one's census (eg, turfing.) (0.51) |
| Disparaging the ER team/outpatient doctor to others for findings later discovered on the floor (0.48) |
| Discharging a patient before they are ready to go home in order to reduce one's census (0.43) |
| Factor 3: Learning environment |
| Not correcting someone who mistakes a student for a physician (0.72) |
| Texting or using smartphone during educational conferences (ie, noon lecture) (0.51) |
| Failing to notify patient‐safety or risk management that a member of the team made, or is concerned that they made, an error (0.45) |
| Having nonmedical/personal conversations in patient corridors (eg, discussing evening plans) (0.43) |
| Factor 4: Time pressure |
| Ignoring family member's nonurgent questions about a cross‐cover patient when you had the time to answer (0.50) |
| Signing out patients over the phone at the end of shift when sign‐out could have been done in person (0.46) |
| Attesting to a resident's note when not fully confident of the content of their documentation (0.44) |
Using site‐adjusted multivariate regression, certain hospitalist job characteristics were associated with certain patterns of participating in unprofessional behavior (Table 4). Those with less clinical time (<50% FTE) were more likely to participate in unprofessional behaviors related to making fun of others (factor 1, value = 0.94, 95% CI 0.32 to 1.56, P value <0.05). Hospitalists who had any administrative time ( value = 0.61, 95% CI 0.111.10, P value <0.05) were more likely to report participation in behaviors related to workload management. Hospitalists engaged in any night work were more likely to report participation in unprofessional behaviors related to time pressure ( value = 0.67, 95% CI 0.171.17, P value <0.05). Time devoted to teaching or research was not associated with greater participation in any of the domains of unprofessional behavior surveyed.
| Model | Making Fun of Others | Learning Environment | Workload Management | Time Pressure |
|---|---|---|---|---|
| Predictor | Beta [95% CI] | Beta [95% CI] | Beta [95% CI] | Beta [95% CI] |
| ||||
| Job characteristics | ||||
| Less clinical | 0.94 [0.32, 1.56]* | 0.01 [0.66, 0.64] | 0.17 [0.84, 0.49] | 0.39 [0.24, 1.01] |
| Administrative | 0.30 [0.16, 0.76] | 0.06 [0.43, 0.54] | 0.61 [0.11, 1.10]* | 0.26 [0.20, 0.72] |
| Teaching | 0.01 [0.49, 0.48] | 0.09 [0.60, 0.42] | 0.12 [0.64, 0.40] | 0.16 [0.33, 0.65] |
| Research | 0.30 [0.87, 0.27] | 0.38 [0.98, 0.22] | 0.37 [0.98, 0.24] | 0.13 [0.45, 0.71] |
| Any nights | 0.08 [0.58, 0.42] | 0.24 [0.28, 0.77] | 0.24 [0.29, 0.76] | 0.67 [0.17,1.17]* |
| Demographic characteristics | ||||
| Male | 0.06 [0.42, 0.53] | 0.03 [0.47, 0.53] | 0.05 [0.56, 0.47] | 0.40 [0.89, 0.08] |
| Younger∥ | 0.05 [0.79, 0.69] | 0.64 [1.42, 0.14] | 0.87 [0.07, 1.67]* | 0.62 [0.13, 1.37] |
| Unfamiliar with residents | 0.32 [0.85, 0.22] | 0.32 [0.89, 0.24] | 0.13 [0.45, 0.70] | 0.47 [0.08, 1.01] |
| Institution | ||||
| Site 1 | 0.58 [0.22, 1.38] | 0.05 [0.89, 0.79] | 1.01 [0.15, 1.86]* | 0.77 [1.57, 0.04] |
| Site 3 | 0.11 [0.68, 0.47] | 0.70 [1.31, 0.09]* | 0.43 [0.20, 1.05] | 0.45 [0.13, 1.04] |
| Constant | 0.03 [0.99, 1.06] | 0.94 [0.14, 2.02] | 1.23[2.34, 0.13]* | 1.34[2.39, 0.31]* |
The only demographic characteristic that was significantly associated with unprofessional behavior was age. Specifically, those who were born after 1970 were more likely to participate in unprofessional behaviors related to workload management ( value = 0.87, 95% CI 0.071.67, P value <0.05). Site differences were also present. Specifically, one site was more likely to report participation in unprofessional behaviors related to workload management ( value site 1 = 1.01, 95% CI 0.15 to 1.86, P value <0.05), while another site was less likely to report participation in behaviors related to the learning environment ( value site 3 = 0.70, 95% CI 1.31 to 0.09, P value <0.05). Gender and familiarity with residents were not significant predictors of participation in unprofessional behaviors. Results remained robust in sensitivity analyses using different cutoffs of clinical time and teaching time.
DISCUSSION
This multisite study adds to what is known about the perceptions of, and participation in, unprofessional behaviors among internal medicine hospitalists. Hospitalists perceived almost all surveyed behaviors as unprofessional. Participation in egregious and trainee‐related unprofessional behaviors was very low. Four categories appeared to explain the variability in how hospitalists reported participation in unprofessional behaviors: making fun of others, workload management, learning environment, and time pressure. Participation in behaviors within these factors was associated with certain job characteristics, such as clinical time, administrative time, and night work, as well as age and site.
It is reassuring that participation in, and trainee‐related, unprofessional behaviors is very low, and it is noteworthy that attending an industry‐sponsored dinner is not considered unprofessional. This was surprising in the setting of increased external pressures to report and ban such interactions.28 Perception that attending such dinners is acceptable may reflect a lag between current practice and national recommendations.
It is important to explore why certain job characteristics are associated with participation in unprofessional behaviors. For example, those with less clinical time were more likely to participate in making fun of others. It may be the case that hospitalists with more clinical time may make a larger effort to develop and maintain positive relationships. Another possible explanation is that hospitalists with less clinical time are more easily influenced by those in the learning environment who make fun of others, such as residents who they are supervising for only a brief period.
For unprofessional behaviors related to workload management, those who were younger, and those with any administrative time, were more likely to participate in behaviors such as celebrating a blocked‐admission. Our prior work shows that behaviors related to workload management are more widespread in residency, and therefore younger hospitalists, who are often recent residency graduates, may be more prone to participating in these behaviors. While unproven, it is possible that those with more administrative time may have competing priorities with their administrative roles, which motivate them to more actively manage their workload, leading them to participate in workload management behaviors.
Hospitalists who did any night work were more likely to participate in unprofessional behaviors related to time pressure. This could reflect the high workloads that night hospitalists may face and the pressure they feel to wrap up work, resulting in a hasty handoff (ie, over the phone) or to defer work (ie, family questions). Site differences were also observed for participation in behaviors related to the learning environment, speaking to the importance of institutional culture.
It is worth mentioning that hospitalists who were teachers were not any less likely to report participating in certain behaviors. While 78% of hospitalists reported some level of teaching, the median reported percentage of teaching was 10% FTE. This level of teaching likely reflects the diverse nature of work in which hospitalists engage. While hospitalists spend some time working with trainees, services that are not staffed with residents (eg, uncovered services) are becoming increasingly common due to stricter resident duty hour restrictions. This may explain why 60% of hospitalists reported being unfamiliar with residents. We also used a high bar for familiarity, which we defined as knowing half of residents by name, and served as a proxy for those who may have trained at the institution where they currently work. In spite of hospitalists reporting a low fraction of their total clinical time devoted to resident services, a significant fraction of resident services were staffed by hospitalists at all sites, making them a natural target for interventions.
These results have implications for future work to assess and improve professionalism in the hospital learning environment. First, interventions to address unprofessional behaviors should focus on behaviors with the highest participation rates. Like our earlier studies of residents, participation is high in certain behaviors, such as misrepresenting a test as urgent, or disparaging the ER or primary care physician (PCP) for a missed finding.19, 20 While blocking an admission was common in our studies of residents, reported participation among hospitalists was low. Similar to a prior study of clinical year medical students at one of our sites, 1 in 5 hospitalists reported not correcting someone who mistakes a student for a physician, highlighting the role that hospitalists may have in perpetuating this behavior.8 Additionally, addressing the behaviors identified in this study, through novel curricular tools, may help to teach residents many of the interpersonal and communication skills called for in the 2011 ACGME Common Program Requirements.11 The ACGME requirements also include the expectation that faculty model how to manage their time before, during, and after clinical assignments, and recognize that transferring a patient to a rested provider is best. Given that most hospitalists believe staying past shift limit is professional, these requirements will be difficult to adopt without widespread culture change.
Moreover, interventions could be tailored to hospitalists with certain job characteristics. Interventions may be educational or systems based. An example of the former is stressing the impact of the learning and working environment on trainees, and an example of the latter is streamlining the process in which ordered tests are executed to result in a more timely completion of tests. This may result in fewer physicians misrepresenting a test as urgent in order to have the test done in a timely manner. Additionally, hospitalists with less clinical time could receive education on their impact as a role model for trainees. Hospitalists who are younger or with administrative commitments could be trained on the importance of avoiding behaviors related to workload management, such as blocking or turfing patients. Lastly, given the site differences, critical examination of institutional culture and policies is also important. With funding from the American Board of Internal Medicine (ABIM) Foundation, we are currently creating an educational intervention, targeting those behaviors that were most frequent among hospitalists and residents at our institutions to promote dialogue and critical reflection, with the hope of reducing the most prevalent behaviors encountered.
There are several limitations to this study. Despite the anonymity of the survey, participants may have inaccurately reported their participation in unprofessional behaviors due to socially desirable response. In addition, because we used factor analysis and multivariate regression models with a small sample size, item nonresponse limited the sample for regression analyses and raises the concern for response bias. However, all significant associations remained so after performing backwards stepwise elimination of covariates that were P > 0.10 in models that were larger (ranging from 65 to 69). Because we used self‐report and not direct observation of participation in unprofessional behaviors, it is not possible to validate the responses given. Future work could rely on the use of 360 degree evaluations or other methods to validate responses given by self‐report. It is also important to consider assessing whether these behaviors are associated with actual patient outcomes, such as length of stay or readmission. Some items may not always be unprofessional. For example, texting during an educational conference might be to advance care, which would not necessarily be unprofessional. The order in which the questions were asked could have led to bias. We asked about participation before perception to try to limit bias reporting in participation. Changing the order of these questions would potentially have resulted in under‐reporting participation in behaviors that one perceived to be unprofessional. This study was conducted at 3 institutions located in Chicago, limiting generalizability to institutions outside of this area. Only internal medicine hospitalists were surveyed, which also limits generalizability to other disciplines and specialties within internal medicine. Lastly, it is important to highlight that hospitalists are not the sole teachers on inpatient services, since residents encounter a variety of faculty who serve as teaching attendings. Future work should expand to other centers and other specialties.
In conclusion, in this multi‐institutional study of hospitalists, participation in egregious behaviors was low. Four factors or patterns underlie hospitalists' reports of participation in unprofessional behavior: making fun of others, learning environment, workload management, and time pressure. Job characteristics (clinical time, administrative time, night work), age, and site were all associated with different patterns of unprofessional behavior. Specifically, hospitalists with less clinical time were more likely to make fun of others. Hospitalists who were younger in age, as well as those who had any administrative work, were more likely to participate in behaviors related to workload management. Hospitalists who work nights were more likely to report behaviors related to time pressure. Interventions to promote professionalism should take institutional culture into account and should focus on behaviors with the highest participation rates. Efforts should also be made to address underlying reasons for participation in these behaviors.
Acknowledgements
The authors thank Meryl Prochaska for her research assistance and manuscript preparation.
Disclosures: The authors acknowledge funding from the ABIM Foundation and the Pritzker Summer Research Program. The funders had no role in the design of the study; the collection, analysis, and interpretation of the data; or the decision to approve publication of the finished manuscript. Prior presentations of the data include the 2010 University of Chicago Pritzker School of Medicine Summer Research Forum, the 2010 University of Chicago Pritzker School of Medicine Medical Education Day, the 2010 Midwest Society of Hospital Medicine Meeting in Chicago, IL, and the 2011 Society of Hospital Medicine National Meeting in Dallas, TX. All authors disclose no relevant or financial conflicts of interest.
- .Practicing what we preach? An analysis of the curriculum of values in medical education.Am J Med.1998;104:569–575.
- ,,.Medical professionalism: conflicting values for tomorrow's doctors.J Gen Intern Med.2010;25(12):1330–1336.
- ,,,,.Medical students' professionalism narratives: a window on the informal and hidden curriculum.Acad Med.2010;85(1):124–133.
- ,,,,,.Interpreting values conflicts experienced by obstetrics‐gynecology clerkship students using reflective writing.Acad Med.2009;84(5):587–596.
- .The teaching of professionalism during residency: why it is failing and a suggestion to improve its success.Anesth Analg.2009;108(3):948–954.
- ,.What we don't know we are teaching: unveiling the hidden curriculum.Clin Orthop Relat Res.2006;449:20–27.
- .Definitions of professionalism: a search for meaning and identity.Clin Orthop Relat Res.2006;449:193–204.
- ,,, et al.Third‐year medical students' participation in and perceptions of unprofessional behaviors.Acad Med.2007;82:S35–S39.
- .Beyond curriculum reform: confronting medicine's hidden curriculum.Acad Med.1998;73:403–407.
- .Physicians' “disruptive” behavior: consequences for medical quality and safety.Am J Med Qual.2008;23:165–167.
- Accreditation Council for Graduate Medical Education. Common Program Requirements: General Competencies. Available at: http://www.acgme.org/acwebsite/home/common_program_requirements_07012011.pdf. Accessed December 19,2011.
- Liaison Committee on Medical Education. Functions and Structure of a Medical School. Available at: http://www.lcme.org/functions2010jun.pdf.. Accessed June 30,2010.
- ,,,,.Residents' perceptions of their own professionalism and the professionalism of their learning environment.J Grad Med Educ.2009;1:208–215.
- ,,,.Unprofessional behavior in medical school is associated with subsequent disciplinary action by a state medical board.Acad Med.2004;79:244–249.
- ,,, et al.Disciplinary action by medical boards and prior behavior in medical school.N Engl J Med.2005;353:2673–2682.
- ,.A survey of the impact of disruptive behaviors and communication defects on patient safety.Jt Comm J Qual Patient Saf.2008;34:464–471.
- ,.Managing disruptive physician behavior—impact on staff relationships and patient care.Neurology.2008;70:1564–1570.
- The Joint Commission.Behaviors that undermine a culture of safety. Sentinel Event Alert.2008. Available at: http://www.jointcommission.org/assets/1/18/SEA_40.PDF. Accessed April 28, 2012.
- ,,,,.Participation in and perceptions of unprofessional behaviors among incoming internal medicine interns.JAMA.2008;300:1132–1134.
- ,,, et al.Changes in perception of and participation in unprofessional behaviors during internship.Acad Med.2010;85:S76–S80.
- .Reflections: the hospitalist movement a decade later.J Hosp Med.2006;1:248–252.
- Society of Hospital Medicine, 2007–2008 Bi‐Annual Survey.2008. Available at: http://www.medscape.org/viewarticle/578134. Accessed April 28, 2012.
- ,,, et al.Reforming internal medicine residency training. A report from the Society of General Internal Medicine's Task Force for Residency Reform.J Gen Intern Med.2005;20:1165–1172.
- Society of Hospital Medicine.The Core Competencies in Hospital Medicine: a framework for curriculum development by the Society of Hospital Medicine.J Hosp Med.2006;1(suppl 1):2–5.
- ,,.Can patients tell when they are unwanted? “Turfing” in residency training.Patient Educ Couns.2005;56:104–111.
- ,.Best practices in exploratory factor analysis: four recommendations for getting the most from your analysis.Pract Assess Res Eval.2005;10:1–9.
- Principal Components and Factor Analysis. StatSoft Electronic Statistics Textbook. Available at: http://www.statsoft.com/textbook/principal‐components‐factor‐analysis/. Accessed December 30,2011.
- ,,, et al.Health industry practices that create conflicts of interest: a policy proposal for academic medical centers.JAMA.2006;295(4):429–433.
The discrepancy between what is taught about professionalism in formal medical education and what is witnessed in the hospital has received increasing attention.17 This latter aspect of medical education contributes to the hidden curriculum and impacts medical trainees' views on professionalism.8 The hidden curriculum refers to the lessons trainees learn through informal interactions within the multilayered educational learning environment.9 A growing body of work examines how the hidden curriculum and disruptive physicians impact the learning environment.9, 10 In response, regulatory agencies, such as the Liaison Committee on Medical Education (LCME) and Accreditation Council for Graduate Medical Education (ACGME), require training programs and medical schools to maintain standards of professionalism, and to regularly evaluate the learning environment and its impact on professionalism.11, 12 The ACGME in 2011 expanded its standards regarding professionalism by making certain that the program director and institution ensure a culture of professionalism that supports patient safety and personal responsibility.11 Given this increasing focus on professionalism in medical school and residency training programs, it is critical to examine faculty perceptions and actions that may perpetuate the discrepancy between the formal and hidden curriculum.13 This early exposure is especially significant because unprofessional behavior in medical school is strongly associated with later disciplinary action by a medical board.14, 15 Certain unprofessional behaviors can also compromise patient care and safety, and can detract from the hospital working environment.1618
In our previous work, we demonstrated that internal medicine interns reported increased participation in unprofessional behaviors regarding on‐call etiquette during internship.19, 20 Examples of these behaviors include refusing an admission (ie, blocking) and misrepresenting a test as urgent. Interestingly, students and residents have highlighted the powerful role of supervising faculty physicians in condoning or inhibiting such behavior. Given the increasing role of hospitalists as resident supervisors, it is important to consider the perceptions and actions of hospitalists with respect to perpetuating or hindering some unprofessional behaviors. Although hospital medicine is a relatively new specialty, many hospitalists are in frequent contact with medical trainees, perhaps because many residency programs and medical schools have a strong inpatient focus.2123 It is thus possible that hospitalists have a major influence on residents' behaviors and views of professionalism. In fact, the Society of Hospital Medicine's Core Competencies for Hospital Medicine explicitly state that hospitalists are expected to serve as a role model for professional and ethical conduct to house staff, medical students and other members of the interdisciplinary team.24
Therefore, the current study had 2 aims: first, to measure internal medicine hospitalists' perceptions of, and participation in, unprofessional behaviors using a previously validated survey; and second, to examine associations between job characteristics and participation in unprofessional behaviors.
METHODS
Study Design
This was a multi‐institutional, observational study that took place at the University of Chicago Pritzker School of Medicine, Northwestern University Feinberg School of Medicine, and NorthShore University HealthSystem. Hospitalist physicians employed at these hospitals were recruited for this study between June 2010 and July 2010. The Institutional Review Boards of the University of Chicago, Northwestern University, and NorthShore University HealthSystem approved this study. All subjects provided informed consent before participating.
Survey Development and Administration
Based on a prior survey of interns and third‐year medical students, a 35‐item survey was used to measure perceptions of, and participation in, unprofessional behaviors.8, 19, 20 The original survey was developed in 2005 by medical students who observed behaviors by trainees and faculty that they considered to be unprofessional. The survey was subsequently modified by interns to ascertain unprofessional behavior among interns. For this iteration, hospitalists and study authors at each site reviewed the survey items and adapted each item to ensure relevance to hospitalist work and also generalizability to site. New items were also created to refer specifically to work routinely performed by hospitalist attendings (attesting to resident notes, transferring patients to other services to reduce workload, etc). Because of this, certain items utilized jargon to refer to the unprofessional behavior as hospitalists do (ie, blocking admissions and turfing), and resonate with literature describing these phenomena.25 Items were also written in such a fashion to elicit the unprofessional nature (ie, blocking an admission that could be appropriate for your service).
The final survey (see Supporting Information, Appendix, in the online version of this article) included domains such as interactions with others, interactions with trainees, and patient‐care scenarios. Demographic information and job characteristics were collected including year of residency completion, total amount of clinical work, amount of night work, and amount of administrative work. Hospitalists were not asked whether they completed residency at the institution where they currently work in order to maintain anonymity in the context of a small sample. Instead, they were asked to rate their familiarity with residents at their institution on a Likert‐type scale ranging from very unfamiliar (1) to familiar (3) to very familiar (5). To help standardize levels of familiarity across hospitalists, we developed anchors that corresponded to how well a hospitalist would know resident names with familiar defined as knowing over half of resident names.
Participants reported whether they participated in, or observed, a particular behavior and rated their perception of each behavior from 1 (unprofessional) to 5 (professional), with unprofessional and somewhat unprofessional defined as unprofessional. A site champion administered paper surveys during a routine faculty meeting at each site. An electronic version was administered using SurveyMonkey (SurveyMonkey, Palo Alto, CA) to hospitalists not present at the faculty meeting. Participants chose a unique, nonidentifiable code to facilitate truthful reporting while allowing data tracking in follow‐up studies.
Data Analysis
Clinical time was dichotomized using above and below 50% full‐time equivalents (FTE) to define those that did less clinical. Because teaching time was relatively low with the median percent FTE spent on teaching at 10%, we used a cutoff of greater than 10% as greater teaching. Because many hospitalists engaged in no night work, night work was reported as those who engaged in any night work and those who did not. Similarly, because many hospitalists had no administrative time, administrative time was split into those with any administrative work and those without any administrative work. Lastly, those born after 1970 were classified as younger hospitalists.
Chi‐square tests were used to compare site response rates, and descriptive statistics were used to examine demographic characteristics of hospitalist respondents, in addition to perception of, and participation in, unprofessional behaviors. Because items on the survey were highly correlated, we used factor analysis to identify the underlying constructs that related to unprofessional behavior.26 Factor analysis is a statistical procedure that is most often used to explore which variables in a data set are most related or correlated to each other. By examining the patterns of similar responses, the underlying factors can be identified and extracted. These factors, by definition, are not correlated with each other. To select the number of factors to retain, the most common convention is to use Kaiser criterion, or retain all factors with eigenvalues greater than, or equal to, one.27 An eigenvalue measures the amount of variation in all of the items on the survey which is accounted for by that factor. If a factor has a low eigenvalue (less than 1 is the convention), then it is contributing little and is ignored, as it is likely redundant with the higher value factors.
Because use of Kaiser criterion often overestimates the number of factors to retain, another method is to use a scree plot which tends to underestimate the factors. Both were used in this study to ensure a stable solution. To name the factors, we examined which items or group of items loaded or were most highly related to which factor. To ensure an optimal factor solution, items with minimal participation (less than 3%) were excluded from factor analysis.
Then, site‐adjusted multivariate regression analysis was used to examine associations between job and demographic characteristics, and the factors of unprofessional behavior identified. Models controlled for gender and familiarity with residents. Because sample medians were used to define greater teaching (>10% FTE), we also performed a sensitivity analysis using different cutoffs for teaching time (>20% FTE and teaching tertiles). Likewise, we also used varying definitions of less clinical time to ensure that any statistically significant associations were robust across varying definitions. All data were analyzed using STATA 11.0 (Stata Corp, College Station, TX) and statistical significance was defined as P < 0.05.
RESULTS
Seventy‐seven of the 101 hospitalists (76.2%) at 3 sites completed the survey. While response rates varied by site (site 1, 67%; site 2, 74%; site 3, 86%), the differences were not statistically significant (2 = 2.9, P = 0.24). Most hospitalists (79.2%) completed residency after 2000. Over half (57.1%) of participants were male, and over half (61%) reported having worked with their current hospitalist group from 1 to 4 years. Almost 60% (59.7%) reported being unfamiliar with residents in the program. Over 40% of hospitalists did not do any night work. Hospitalists were largely clinical, one‐quarter of hospitalists reported working over 50% FTE, and the median was 80% FTE. While 78% of hospitalists reported some teaching time, median time on teaching service was low at 10% (Table 1).
| Total n (%) | |
|---|---|
| |
| Male (%) | 44 (57.1) |
| Completed residency (%) | |
| Between 1981 and 1990 | 2 (2.6) |
| Between 1991 and 2000 | 14 (18.2) |
| After 2000 | 61 (79.2) |
| Medical school matriculation (%) (n = 76) | |
| US medical school | 59 (77.6) |
| International medical school | 17 (22.3) |
| Years spent with current hospitalist group (%) | |
| <1 yr | 14 (18.2) |
| 14 yr | 47 (61.0) |
| 59 yr | 15 (19.5) |
| >10 yr | 1 (1.3) |
| Familiarity with residents (%) | |
| Familiar | 31 (40.2) |
| Unfamiliar | 46 (59.7) |
| No. of weeks per year spent on (median IQR) | |
| Hospitalist practice (n = 72) | 26.0 [16.026.0] |
| Teaching services (n = 68) | 4.0 [1.08.0] |
| Weeks working nights* (n = 71) | |
| >2 wk | 16 (22.5) |
| 12 wk | 24 (33.8) |
| 0 wk | 31 (43.7) |
| % Clinical time (median IQR)* (n = 73) | 80 (5099) |
| % Teaching time (median IQR)* (n = 74) | 10 (120) |
| Any research time (%)* (n = 71) | 22 (31.0) |
| Any administrative time (%) (n = 72) | 29 (40.3) |
| Completed fellowship (%)* | 12 (15.6) |
| Won teaching awards (%)* (n = 76) | 21 (27.6) |
| View a career in hospital medicine as (%) | |
| Temporary | 11 (14.3) |
| Long term | 47 (61.0) |
| Unsure | 19 (24.7) |
Hospitalists perceived almost all behaviors as unprofessional (unprofessional or somewhat unprofessional on a 5‐point Likert Scale). The only behavior rated as professional with a mean of 4.25 (95% CI 4.014.49) was staying past shift limit to complete a patient‐care task that could have been signed out. This behavior also had the highest level of participation by hospitalists (81.7%). Hospitalists were most ambivalent when rating professionalism of attending an industry‐sponsored dinner or social event (mean 3.20, 95% CI 2.983.41) (Table 2).
| Behavior | Reported Perception (Mean Likert score)* | Reported Participation (%) | Reported Observation (%) |
|---|---|---|---|
| |||
| Having nonmedical/personal conversations in patient corridors (eg, discussing evening plans) | 2.55 (2.342.76) | 67.1 | 80.3 |
| Ordering a routine test as urgent to get it expedited | 2.82 (2.583.06) | 62.3 | 80.5 |
| Making fun of other physicians to colleagues | 1.56 (1.391.70) | 40.3 | 67.5 |
| Disparaging the ER team/outpatient doctor to others for findings later discovered on the floor (eg, after the patient is admitted) | 2.01 (1.842.19) | 39.5 | 67.1 |
| Signing out patients over the phone at the end of shift when sign‐out could have been done in person | 2.95 (2.743.16) | 40.8 | 65.8 |
| Texting or using smartphone during educational conferences (ie, noon lecture) | 2.16 (1.952.36) | 39.0 | 72.7 |
| Discussing patient information in public spaces | 1.49 (1.341.63) | 37.7 | 66.2 |
| Making fun of other attendings to colleagues | 1.62 (1.461.78) | 35.1 | 61.0 |
| Deferring family members' concerns about a change in the patient's clinical course to the primary team in order to avoid engaging in such a discussion | 2.16 (1.912.40) | 30.3 | 55.3 |
| Making disparaging comments about a patient on rounds | 1.42 (1.271.56) | 29.8 | 67.5 |
| Attending an industry (eg, pharmaceutical or equipment/device manufacturer)‐sponsored dinner or social event | 3.20 (2.983.41) | 28.6 | 60.5 |
| Ignoring family member's nonurgent questions about a cross‐cover patient when you had time to answer | 2.05 (1.852.25) | 26.3 | 48.7 |
| Attesting to a resident's note when not fully confident of the content of their documentation | 1.65 (1.451.85) | 23.4 | 32.5 |
| Making fun of support staff to colleagues | 1.45 (1.311.59) | 22.1 | 57.9 |
| Not correcting someone who mistakes a student for a physician | 2.19 (2.012.38) | 20.8 | 35.1 |
| Celebrating a blocked‐admission | 1.80 (1.612.00) | 21.1 | 60.5 |
| Making fun of residents to colleagues | 1.53 (1.371.70) | 18.2 | 44.2 |
| Coming to work when you have a significant illness (eg, influenza) | 1.99 (1.792.19) | 14.3 | 35.1 |
| Celebrating a successful turf | 1.71 (1.511.92) | 11.7 | 39.0 |
| Failing to notify the patient that a member of the team made, or is concerned that they made, an error | 1.53 (1.341.71) | 10.4 | 20.8 |
| Transferring a patient, who could be cared for on one's own service, to another service in order to reduce one's census (eg, turfing) | 1.72 (1.521.91) | 9.3 | 58.7 |
| Refusing an admission which could be considered appropriate for your service (eg, blocking) | 1.63 (1.441.82) | 7.9 | 68.4 |
| Falsifying patient records (ie, back‐dating a note, copying forward unverified information, or documenting physical findings not personally obtained) | 1.22 (1.101.34) | 6.5 | 27.3 |
| Making fun of students to colleagues | 1.35 (1.191.51) | 6.5 | 24.7 |
| Failing to notify patient‐safety or risk management that a member of the team made, or is concerned that they made, an error | 1.64 (1.461.82) | 5.2 | 13.2 |
| Introducing a student as a doctor to patients | 1.96 (1.762.16) | 3.9 | 20.8 |
| Signing‐out a procedure or task, that could have been completed during a required shift or by the primary team, in order to go home as early in the day as possible | 1.48 (1.321.64) | 3.9 | 48.1 |
| Performing medical or surgical procedures on a patient beyond self‐perceived level of skill | 1.27 (1.141.41) | 2.6 | 7.8 |
| Asking a student to obtain written consent from a patient or their proxy without supervision (eg, for blood transfusion or minor procedures) | 1.60 (1.421.78) | 2.63 | 6.5 |
| Encouraging a student to state that they are a doctor in order to expedite patient care | 1.31 (1.151.47) | 2.6 | 6.5 |
| Discharging a patient before they are ready to go home in order to reduce one's census | 1.18 (1.071.29) | 2.6 | 19.5 |
| Reporting patient information (eg, labs, test results, exam results) as normal when uncertain of the true results | 1.29 (1.161.41) | 2.6 | 15.6 |
| Asking a student to perform medical or surgical procedures which are perceived to be beyond their level of skill | 1.26 (1.121.40) | 1.3 | 3.9 |
| Asking a student to discuss, with patients, medical or surgical information which is perceived to be beyond their level of knowledge | 1.41 (1.261.56) | 0.0 | 15.8 |
Participation in egregious behaviors, such as falsifying patient records (6.49%) and performing medical or surgical procedures on a patient beyond self‐perceived level of skill (2.60%), was very low. The most common behaviors rated as unprofessional that hospitalists reported participating in were having nonmedical/personal conversations in patient corridors (67.1%), ordering a routine test as urgent to expedite care (62.3%), and making fun of other physicians to colleagues (40.3%). Forty percent of participants reported disparaging the emergency room (ER) team or primary care physician for findings later discovered, signing out over the phone when it could have been done in person, and texting or using smartphones during educational conferences. In particular, participation in unprofessional behaviors related to trainees was close to zero (eg, asking a student to discuss, with patients, medical or surgical information which is perceived to be beyond their level of knowledge). The least common behaviors that hospitalists reported participating in were discharging a patient before they are ready to go home in order to reduce one's census (2.56%) and reporting patient information as normal when uncertain of the true results (2.60%). Like previous studies of unprofessional behaviors, those that reported participation were less likely to report the behavior as unprofessional.8, 19
Observation of behaviors ranged from 4% to 80%. In all cases, observation of the behavior was reported at a higher level than participation. Correlation between observation and participation was also high, with the exception of a few behaviors that had zero or near zero participation rates (ie, reporting patient information as normal when unsure of true results.)
After performing factor analysis, 4 factors had eigenvalues greater than 1 and were therefore retained and extracted for further analysis. These 4 factors accounted for 76% of the variance in responses reported on the survey. By examining which items or groups of items most strongly loaded on each factor, the factors were named accordingly: factor 1 referred to behaviors related to making fun of others, factor 2 referred to workload management, factor 3 referred to behaviors related to the learning environment, and factor 4 referred to behaviors related to time pressure (Table 3).
|
| Factor 1: Making fun of others |
| Making fun of other physicians (0.78) |
| Making fun of attendings (0.77) |
| Making fun of residents (0.70) |
| Making disparaging comments about a patient on rounds (0.51) |
| Factor 2: Workload management |
| Celebrating a successful turf (0.81) |
| Celebrating a blocked‐admission (0.65) |
| Coming to work sick (0.56) |
| Transferring a patient, who could be cared for on one's own service, to another service in order to reduce one's census (eg, turfing.) (0.51) |
| Disparaging the ER team/outpatient doctor to others for findings later discovered on the floor (0.48) |
| Discharging a patient before they are ready to go home in order to reduce one's census (0.43) |
| Factor 3: Learning environment |
| Not correcting someone who mistakes a student for a physician (0.72) |
| Texting or using smartphone during educational conferences (ie, noon lecture) (0.51) |
| Failing to notify patient‐safety or risk management that a member of the team made, or is concerned that they made, an error (0.45) |
| Having nonmedical/personal conversations in patient corridors (eg, discussing evening plans) (0.43) |
| Factor 4: Time pressure |
| Ignoring family member's nonurgent questions about a cross‐cover patient when you had the time to answer (0.50) |
| Signing out patients over the phone at the end of shift when sign‐out could have been done in person (0.46) |
| Attesting to a resident's note when not fully confident of the content of their documentation (0.44) |
Using site‐adjusted multivariate regression, certain hospitalist job characteristics were associated with certain patterns of participating in unprofessional behavior (Table 4). Those with less clinical time (<50% FTE) were more likely to participate in unprofessional behaviors related to making fun of others (factor 1, value = 0.94, 95% CI 0.32 to 1.56, P value <0.05). Hospitalists who had any administrative time ( value = 0.61, 95% CI 0.111.10, P value <0.05) were more likely to report participation in behaviors related to workload management. Hospitalists engaged in any night work were more likely to report participation in unprofessional behaviors related to time pressure ( value = 0.67, 95% CI 0.171.17, P value <0.05). Time devoted to teaching or research was not associated with greater participation in any of the domains of unprofessional behavior surveyed.
| Model | Making Fun of Others | Learning Environment | Workload Management | Time Pressure |
|---|---|---|---|---|
| Predictor | Beta [95% CI] | Beta [95% CI] | Beta [95% CI] | Beta [95% CI] |
| ||||
| Job characteristics | ||||
| Less clinical | 0.94 [0.32, 1.56]* | 0.01 [0.66, 0.64] | 0.17 [0.84, 0.49] | 0.39 [0.24, 1.01] |
| Administrative | 0.30 [0.16, 0.76] | 0.06 [0.43, 0.54] | 0.61 [0.11, 1.10]* | 0.26 [0.20, 0.72] |
| Teaching | 0.01 [0.49, 0.48] | 0.09 [0.60, 0.42] | 0.12 [0.64, 0.40] | 0.16 [0.33, 0.65] |
| Research | 0.30 [0.87, 0.27] | 0.38 [0.98, 0.22] | 0.37 [0.98, 0.24] | 0.13 [0.45, 0.71] |
| Any nights | 0.08 [0.58, 0.42] | 0.24 [0.28, 0.77] | 0.24 [0.29, 0.76] | 0.67 [0.17,1.17]* |
| Demographic characteristics | ||||
| Male | 0.06 [0.42, 0.53] | 0.03 [0.47, 0.53] | 0.05 [0.56, 0.47] | 0.40 [0.89, 0.08] |
| Younger∥ | 0.05 [0.79, 0.69] | 0.64 [1.42, 0.14] | 0.87 [0.07, 1.67]* | 0.62 [0.13, 1.37] |
| Unfamiliar with residents | 0.32 [0.85, 0.22] | 0.32 [0.89, 0.24] | 0.13 [0.45, 0.70] | 0.47 [0.08, 1.01] |
| Institution | ||||
| Site 1 | 0.58 [0.22, 1.38] | 0.05 [0.89, 0.79] | 1.01 [0.15, 1.86]* | 0.77 [1.57, 0.04] |
| Site 3 | 0.11 [0.68, 0.47] | 0.70 [1.31, 0.09]* | 0.43 [0.20, 1.05] | 0.45 [0.13, 1.04] |
| Constant | 0.03 [0.99, 1.06] | 0.94 [0.14, 2.02] | 1.23[2.34, 0.13]* | 1.34[2.39, 0.31]* |
The only demographic characteristic that was significantly associated with unprofessional behavior was age. Specifically, those who were born after 1970 were more likely to participate in unprofessional behaviors related to workload management ( value = 0.87, 95% CI 0.071.67, P value <0.05). Site differences were also present. Specifically, one site was more likely to report participation in unprofessional behaviors related to workload management ( value site 1 = 1.01, 95% CI 0.15 to 1.86, P value <0.05), while another site was less likely to report participation in behaviors related to the learning environment ( value site 3 = 0.70, 95% CI 1.31 to 0.09, P value <0.05). Gender and familiarity with residents were not significant predictors of participation in unprofessional behaviors. Results remained robust in sensitivity analyses using different cutoffs of clinical time and teaching time.
DISCUSSION
This multisite study adds to what is known about the perceptions of, and participation in, unprofessional behaviors among internal medicine hospitalists. Hospitalists perceived almost all surveyed behaviors as unprofessional. Participation in egregious and trainee‐related unprofessional behaviors was very low. Four categories appeared to explain the variability in how hospitalists reported participation in unprofessional behaviors: making fun of others, workload management, learning environment, and time pressure. Participation in behaviors within these factors was associated with certain job characteristics, such as clinical time, administrative time, and night work, as well as age and site.
It is reassuring that participation in, and trainee‐related, unprofessional behaviors is very low, and it is noteworthy that attending an industry‐sponsored dinner is not considered unprofessional. This was surprising in the setting of increased external pressures to report and ban such interactions.28 Perception that attending such dinners is acceptable may reflect a lag between current practice and national recommendations.
It is important to explore why certain job characteristics are associated with participation in unprofessional behaviors. For example, those with less clinical time were more likely to participate in making fun of others. It may be the case that hospitalists with more clinical time may make a larger effort to develop and maintain positive relationships. Another possible explanation is that hospitalists with less clinical time are more easily influenced by those in the learning environment who make fun of others, such as residents who they are supervising for only a brief period.
For unprofessional behaviors related to workload management, those who were younger, and those with any administrative time, were more likely to participate in behaviors such as celebrating a blocked‐admission. Our prior work shows that behaviors related to workload management are more widespread in residency, and therefore younger hospitalists, who are often recent residency graduates, may be more prone to participating in these behaviors. While unproven, it is possible that those with more administrative time may have competing priorities with their administrative roles, which motivate them to more actively manage their workload, leading them to participate in workload management behaviors.
Hospitalists who did any night work were more likely to participate in unprofessional behaviors related to time pressure. This could reflect the high workloads that night hospitalists may face and the pressure they feel to wrap up work, resulting in a hasty handoff (ie, over the phone) or to defer work (ie, family questions). Site differences were also observed for participation in behaviors related to the learning environment, speaking to the importance of institutional culture.
It is worth mentioning that hospitalists who were teachers were not any less likely to report participating in certain behaviors. While 78% of hospitalists reported some level of teaching, the median reported percentage of teaching was 10% FTE. This level of teaching likely reflects the diverse nature of work in which hospitalists engage. While hospitalists spend some time working with trainees, services that are not staffed with residents (eg, uncovered services) are becoming increasingly common due to stricter resident duty hour restrictions. This may explain why 60% of hospitalists reported being unfamiliar with residents. We also used a high bar for familiarity, which we defined as knowing half of residents by name, and served as a proxy for those who may have trained at the institution where they currently work. In spite of hospitalists reporting a low fraction of their total clinical time devoted to resident services, a significant fraction of resident services were staffed by hospitalists at all sites, making them a natural target for interventions.
These results have implications for future work to assess and improve professionalism in the hospital learning environment. First, interventions to address unprofessional behaviors should focus on behaviors with the highest participation rates. Like our earlier studies of residents, participation is high in certain behaviors, such as misrepresenting a test as urgent, or disparaging the ER or primary care physician (PCP) for a missed finding.19, 20 While blocking an admission was common in our studies of residents, reported participation among hospitalists was low. Similar to a prior study of clinical year medical students at one of our sites, 1 in 5 hospitalists reported not correcting someone who mistakes a student for a physician, highlighting the role that hospitalists may have in perpetuating this behavior.8 Additionally, addressing the behaviors identified in this study, through novel curricular tools, may help to teach residents many of the interpersonal and communication skills called for in the 2011 ACGME Common Program Requirements.11 The ACGME requirements also include the expectation that faculty model how to manage their time before, during, and after clinical assignments, and recognize that transferring a patient to a rested provider is best. Given that most hospitalists believe staying past shift limit is professional, these requirements will be difficult to adopt without widespread culture change.
Moreover, interventions could be tailored to hospitalists with certain job characteristics. Interventions may be educational or systems based. An example of the former is stressing the impact of the learning and working environment on trainees, and an example of the latter is streamlining the process in which ordered tests are executed to result in a more timely completion of tests. This may result in fewer physicians misrepresenting a test as urgent in order to have the test done in a timely manner. Additionally, hospitalists with less clinical time could receive education on their impact as a role model for trainees. Hospitalists who are younger or with administrative commitments could be trained on the importance of avoiding behaviors related to workload management, such as blocking or turfing patients. Lastly, given the site differences, critical examination of institutional culture and policies is also important. With funding from the American Board of Internal Medicine (ABIM) Foundation, we are currently creating an educational intervention, targeting those behaviors that were most frequent among hospitalists and residents at our institutions to promote dialogue and critical reflection, with the hope of reducing the most prevalent behaviors encountered.
There are several limitations to this study. Despite the anonymity of the survey, participants may have inaccurately reported their participation in unprofessional behaviors due to socially desirable response. In addition, because we used factor analysis and multivariate regression models with a small sample size, item nonresponse limited the sample for regression analyses and raises the concern for response bias. However, all significant associations remained so after performing backwards stepwise elimination of covariates that were P > 0.10 in models that were larger (ranging from 65 to 69). Because we used self‐report and not direct observation of participation in unprofessional behaviors, it is not possible to validate the responses given. Future work could rely on the use of 360 degree evaluations or other methods to validate responses given by self‐report. It is also important to consider assessing whether these behaviors are associated with actual patient outcomes, such as length of stay or readmission. Some items may not always be unprofessional. For example, texting during an educational conference might be to advance care, which would not necessarily be unprofessional. The order in which the questions were asked could have led to bias. We asked about participation before perception to try to limit bias reporting in participation. Changing the order of these questions would potentially have resulted in under‐reporting participation in behaviors that one perceived to be unprofessional. This study was conducted at 3 institutions located in Chicago, limiting generalizability to institutions outside of this area. Only internal medicine hospitalists were surveyed, which also limits generalizability to other disciplines and specialties within internal medicine. Lastly, it is important to highlight that hospitalists are not the sole teachers on inpatient services, since residents encounter a variety of faculty who serve as teaching attendings. Future work should expand to other centers and other specialties.
In conclusion, in this multi‐institutional study of hospitalists, participation in egregious behaviors was low. Four factors or patterns underlie hospitalists' reports of participation in unprofessional behavior: making fun of others, learning environment, workload management, and time pressure. Job characteristics (clinical time, administrative time, night work), age, and site were all associated with different patterns of unprofessional behavior. Specifically, hospitalists with less clinical time were more likely to make fun of others. Hospitalists who were younger in age, as well as those who had any administrative work, were more likely to participate in behaviors related to workload management. Hospitalists who work nights were more likely to report behaviors related to time pressure. Interventions to promote professionalism should take institutional culture into account and should focus on behaviors with the highest participation rates. Efforts should also be made to address underlying reasons for participation in these behaviors.
Acknowledgements
The authors thank Meryl Prochaska for her research assistance and manuscript preparation.
Disclosures: The authors acknowledge funding from the ABIM Foundation and the Pritzker Summer Research Program. The funders had no role in the design of the study; the collection, analysis, and interpretation of the data; or the decision to approve publication of the finished manuscript. Prior presentations of the data include the 2010 University of Chicago Pritzker School of Medicine Summer Research Forum, the 2010 University of Chicago Pritzker School of Medicine Medical Education Day, the 2010 Midwest Society of Hospital Medicine Meeting in Chicago, IL, and the 2011 Society of Hospital Medicine National Meeting in Dallas, TX. All authors disclose no relevant or financial conflicts of interest.
- .Practicing what we preach? An analysis of the curriculum of values in medical education.Am J Med.1998;104:569–575.
- ,,.Medical professionalism: conflicting values for tomorrow's doctors.J Gen Intern Med.2010;25(12):1330–1336.
- ,,,,.Medical students' professionalism narratives: a window on the informal and hidden curriculum.Acad Med.2010;85(1):124–133.
- ,,,,,.Interpreting values conflicts experienced by obstetrics‐gynecology clerkship students using reflective writing.Acad Med.2009;84(5):587–596.
- .The teaching of professionalism during residency: why it is failing and a suggestion to improve its success.Anesth Analg.2009;108(3):948–954.
- ,.What we don't know we are teaching: unveiling the hidden curriculum.Clin Orthop Relat Res.2006;449:20–27.
- .Definitions of professionalism: a search for meaning and identity.Clin Orthop Relat Res.2006;449:193–204.
- ,,, et al.Third‐year medical students' participation in and perceptions of unprofessional behaviors.Acad Med.2007;82:S35–S39.
- .Beyond curriculum reform: confronting medicine's hidden curriculum.Acad Med.1998;73:403–407.
- .Physicians' “disruptive” behavior: consequences for medical quality and safety.Am J Med Qual.2008;23:165–167.
- Accreditation Council for Graduate Medical Education. Common Program Requirements: General Competencies. Available at: http://www.acgme.org/acwebsite/home/common_program_requirements_07012011.pdf. Accessed December 19,2011.
- Liaison Committee on Medical Education. Functions and Structure of a Medical School. Available at: http://www.lcme.org/functions2010jun.pdf.. Accessed June 30,2010.
- ,,,,.Residents' perceptions of their own professionalism and the professionalism of their learning environment.J Grad Med Educ.2009;1:208–215.
- ,,,.Unprofessional behavior in medical school is associated with subsequent disciplinary action by a state medical board.Acad Med.2004;79:244–249.
- ,,, et al.Disciplinary action by medical boards and prior behavior in medical school.N Engl J Med.2005;353:2673–2682.
- ,.A survey of the impact of disruptive behaviors and communication defects on patient safety.Jt Comm J Qual Patient Saf.2008;34:464–471.
- ,.Managing disruptive physician behavior—impact on staff relationships and patient care.Neurology.2008;70:1564–1570.
- The Joint Commission.Behaviors that undermine a culture of safety. Sentinel Event Alert.2008. Available at: http://www.jointcommission.org/assets/1/18/SEA_40.PDF. Accessed April 28, 2012.
- ,,,,.Participation in and perceptions of unprofessional behaviors among incoming internal medicine interns.JAMA.2008;300:1132–1134.
- ,,, et al.Changes in perception of and participation in unprofessional behaviors during internship.Acad Med.2010;85:S76–S80.
- .Reflections: the hospitalist movement a decade later.J Hosp Med.2006;1:248–252.
- Society of Hospital Medicine, 2007–2008 Bi‐Annual Survey.2008. Available at: http://www.medscape.org/viewarticle/578134. Accessed April 28, 2012.
- ,,, et al.Reforming internal medicine residency training. A report from the Society of General Internal Medicine's Task Force for Residency Reform.J Gen Intern Med.2005;20:1165–1172.
- Society of Hospital Medicine.The Core Competencies in Hospital Medicine: a framework for curriculum development by the Society of Hospital Medicine.J Hosp Med.2006;1(suppl 1):2–5.
- ,,.Can patients tell when they are unwanted? “Turfing” in residency training.Patient Educ Couns.2005;56:104–111.
- ,.Best practices in exploratory factor analysis: four recommendations for getting the most from your analysis.Pract Assess Res Eval.2005;10:1–9.
- Principal Components and Factor Analysis. StatSoft Electronic Statistics Textbook. Available at: http://www.statsoft.com/textbook/principal‐components‐factor‐analysis/. Accessed December 30,2011.
- ,,, et al.Health industry practices that create conflicts of interest: a policy proposal for academic medical centers.JAMA.2006;295(4):429–433.
Copyright © 2012 Society of Hospital Medicine
HQPS Competencies
Healthcare quality is defined as the degree to which health services for individuals and populations increase the likelihood of desired health outcomes and are consistent with current professional knowledge.1 Delivering high quality care to patients in the hospital setting is especially challenging, given the rapid pace of clinical care, the severity and multitude of patient conditions, and the interdependence of complex processes within the hospital system. Research has shown that hospitalized patients do not consistently receive recommended care2 and are at risk for experiencing preventable harm.3 In an effort to stimulate improvement, stakeholders have called for increased accountability, including enhanced transparency and differential payment based on performance. A growing number of hospital process and outcome measures are readily available to the public via the Internet.46 The Joint Commission, which accredits US hospitals, requires the collection of core quality measure data7 and sets the expectation that National Patient Safety Goals be met to maintain accreditation.8 Moreover, the Center for Medicare and Medicaid Services (CMS) has developed a Value‐Based Purchasing (VBP) plan intended to adjust hospital payment based on quality measures and the occurrence of certain hospital‐acquired conditions.9, 10
Because of their clinical expertise, understanding of hospital clinical operations, leadership of multidisciplinary inpatient teams, and vested interest to improve the systems in which they work, hospitalists are perfectly positioned to collaborate with their institutions to improve the quality of care delivered to inpatients. However, many hospitalists are inadequately prepared to engage in efforts to improve quality, because medical schools and residency programs have not traditionally included or emphasized healthcare quality and patient safety in their curricula.1113 In a survey of 389 internal medicine‐trained hospitalists, significant educational deficiencies were identified in the area of systems‐based practice.14 Specifically, the topics of quality improvement, team management, practice guideline development, health information systems management, and coordination of care between healthcare settings were listed as essential skills for hospitalist practice but underemphasized in residency training. Recognizing the gap between the needs of practicing physicians and current medical education provided in healthcare quality, professional societies have recently published position papers calling for increased training in quality, safety, and systems, both in medical school11 and residency training.15, 16
The Society of Hospital Medicine (SHM) convened a Quality Summit in December 2008 to develop strategic plans related to healthcare quality. Summit attendees felt that most hospitalists lack the formal training necessary to evaluate, implement, and sustain system changes within the hospital. In response, the SHM Hospital Quality and Patient Safety (HQPS) Committee formed a Quality Improvement Education (QIE) subcommittee in 2009 to assess the needs of hospitalists with respect to hospital quality and patient safety, and to evaluate and expand upon existing educational programs in this area. Membership of the QIE subcommittee consisted of hospitalists with extensive experience in healthcare quality and medical education. The QIE subcommittee refined and expanded upon the healthcare quality and patient safety‐related competencies initially described in the Core Competencies in Hospital Medicine.17 The purpose of this report is to describe the development, provide definitions, and make recommendations on the use of the Hospital Quality and Patient Safety (HQPS) Competencies.
Development of The Hospital Quality and Patient Safety Competencies
The multistep process used by the SHM QIE subcommittee to develop the HQPS Competencies is summarized in Figure 1. We performed an in‐depth evaluation of current educational materials and offerings, including a review of the Core Competencies in Hospital Medicine, past annual SHM Quality Improvement Pre‐Course objectives, and the content of training courses offered by other organizations.1722 Throughout our analysis, we emphasized the identification of gaps in content relevant to hospitalists. We then used the Institute of Medicine's (IOM) 6 aims for healthcare quality as a foundation for developing the HQPS Competencies.1 Specifically, the IOM states that healthcare should be safe, effective, patient‐centered, timely, efficient, and equitable. Additionally, we reviewed and integrated elements of the Practice‐Based Learning and Improvement (PBLI) and Systems‐Based Practice (SBP) competencies as defined by the Accreditation Council for Graduate Medical Education (ACGME).23 We defined general areas of competence and specific standards for knowledge, skills, and attitudes within each area. Subcommittee members reflected on their own experience, as clinicians, educators, and leaders in healthcare quality and patient safety, to inform and refine the competency definitions and standards. Acknowledging that some hospitalists may serve as collaborators or clinical content experts, while others may serve as leaders of hospital quality initiatives, 3 levels of expertise were established: basic, intermediate, and advanced.

The QIE subcommittee presented a draft version of the HQPS Competencies to the HQPS Committee in the fall of 2009 and incorporated suggested revisions. The revised set of competencies was then reviewed by members of the Leadership and Education Committees during the winter of 2009‐2010, and additional recommendations were included in the final version now described.
Description of The Competencies
The 8 areas of competence include: Quality Measurement and Stakeholder Interests, Data Acquisition and Interpretation, Organizational Knowledge and Leadership Skills, Patient Safety Principles, Teamwork and Communication, Quality and Safety Improvement Methods, Health Information Systems, and Patient Centeredness. Three levels of competence and standards within each level and area are defined in Table 1. Standards use carefully selected action verbs to reflect educational goals for hospitalists at each level.24 The basic level represents a minimum level of competency for all practicing hospitalists. The intermediate level represents a hospitalist who is prepared to meaningfully engage and collaborate with his or her institution in quality improvement efforts. A hospitalist at this level may also lead uncomplicated improvement projects for his or her medical center and/or hospital medicine group. The advanced level represents a hospitalist prepared to lead quality improvement efforts for his or her institution and/or hospital medicine group. Many hospitalists at this level will have, or will be prepared to have, leadership positions in quality and patient safety at their institutions. Advanced level hospitalists will also have the expertise to teach and mentor other individuals in their quality improvement efforts.
| Competency | Basic | Intermediate | Advanced |
|---|---|---|---|
| |||
| Quality measurement and stakeholder interests | Define structure, process, and outcome measures | Compare and contrast relative benefits of using one type of measure vs another | Anticipate and respond to stakeholders' needs and interests |
| Define stakeholders and understand their interests related to healthcare quality | Explain measures as defined by stakeholders (Center for Medicare and Medicaid Services, Leapfrog, etc) | Anticipate and respond to changes in quality measures and incentive programs | |
| Identify measures as defined by stakeholders (Center for Medicare and Medicaid Services, Leapfrog, etc) | Appreciate variation in quality and utilization performance | Lead efforts to reduce variation in care delivery (see also quality improvement methods) | |
| Describe potential unintended consequences of quality measurement and incentive programs | Avoid unintended consequences of quality measurement and incentive programs | ||
| Data acquisition and interpretation | Interpret simple statistical methods to compare populations within a sample (chi‐square, t tests, etc) | Describe sources of data for quality measurement | Acquire data from internal and external sources |
| Define basic terms used to describe continuous and categorical data (mean, median, standard deviation, interquartile range, percentages, rates, etc) | Identify potential pitfalls in administrative data | Create visual representations of data (Bar, Pareto, and Control Charts) | |
| Summarize basic principles of statistical process control | Explain variation in data | Use simple statistical methods to compare populations within a sample (chi‐square, t tests, etc) | |
| Interpret data displayed in Pareto and Control Charts | Administer and interpret a survey | ||
| Summarize basic survey techniques (including methods to maximize response, minimize bias, and use of ordinal response scales) | |||
| Use appropriate terms to describe continuous and categorical data (mean, median, standard deviation, interquartile range, percentages, rates, etc) | |||
| Organizational knowledge and leadership skills | Describe the organizational structure of one's institution | Define interests of internal and external stakeholders | Effectively negotiate with stakeholders |
| Define leaders within the organization and describe their roles | Collaborate as an effective team member of a quality improvement project | Assemble a quality improvement project team and effectively lead meetings (setting agendas, hold members accountable, etc) | |
| Exemplify the importance of leading by example | Explain principles of change management and how it can positively or negatively impact quality improvement project implementation | Motivate change and create vision for ideal state | |
| Effectively communicate quality or safety issues identified during routine patient care to the appropriate parties | Communicate effectively in a variety of settings (lead a meeting, public speaking, etc) | ||
| Serve as a resource and/or mentor for less‐experienced team members | |||
| Patient safety principles | Identify potential sources of error encountered during routine patient care | Compare methods to measure errors and adverse events, including administrative data analysis, chart review, and incident reporting systems | Lead efforts to appropriately measure medical error and/or adverse events |
| Compare and contrast medical error with adverse event | Identify and explain how human factors can contribute to medical errors | Lead efforts to redesign systems to reduce errors from occurring; this may include the facilitation of a hospital, departmental, or divisional Root Cause Analysis | |
| Describe how the systems approach to medical error is more productive than assigning individual blame | Know the difference between a strong vs a weak action plan for improvement (ie, brief education intervention is weak; skills training with deliberate practice or physical changes are stronger) | Lead efforts to advance the culture of patient safety in the hospital | |
| Differentiate among types of error (knowledge/judgment vs systems vs procedural/technical; latent vs active) | |||
| Explain the role that incident reporting plays in quality improvement efforts and how reporting can foster a culture of safety | |||
| Describe principles of medical error disclosure | |||
| Teamwork and communication | Explain how poor teamwork and communication failures contribute to adverse events | Collaborate on administration and interpretation of teamwork and safety culture measures | Lead efforts to improve teamwork and safety culture |
| Identify the potential for errors during transitions within and between healthcare settings (handoffs, transfers, discharge) | Describe the principles of effective teamwork and identify behaviors consistent with effective teamwork | Lead efforts to improve teamwork in specific settings (intensive care, medical‐surgical unit, etc) | |
| Identify deficiencies in transitions within and between healthcare settings (handoffs, transfers, discharge) | Successfully improve the safety of transitions within and between healthcare settings (handoffs, transfers, discharge) | ||
| Quality and safety improvement methods and tools | Define the quality improvement methods used and infrastructure in place at one's hospital | Compare and contrast various quality improvement methods, including six sigma, lean, and PDSA | Lead a quality improvement project using six sigma, lean, or PDSA methodology |
| Summarize the basic principles and use of Root Cause Analysis as a tool to evaluate medical error | Collaborate on a quality improvement project using six sigma, lean, or PDSA | Use high level process mapping, fishbone diagrams, etc, to identify areas for opportunity in evaluating a process | |
| Describe and collaborate on Failure Mode and Effects Analysis | Lead the development and implementation of clinical protocols to standardize care delivery when appropriate | ||
| Actively participate in a Root Cause Analysis | Conduct Failure Mode and Effects Analysis | ||
| Conduct Root Cause Analysis | |||
| Health information systems | Identify the potential for information systems to reduce as well as contribute to medical error | Define types of clinical decision support | Lead or co‐lead efforts to leverage information systems in quality measurement |
| Describe how information systems fit into provider workflow and care delivery | Collaborate on the design of health information systems | Lead or co‐lead efforts to leverage information systems to reduce error and/or improve delivery of effective care | |
| Anticipate and prevent unintended consequences of implementation or revision of information systems | |||
| Lead or co‐lead efforts to leverage clinical decision support to improve quality and safety | |||
| Patient centeredness | Explain the clinical benefits of a patient‐centered approach | Explain benefits and potential limitations of patient satisfaction surveys | Interpret data from patient satisfaction surveys and lead efforts to improve patient satisfaction |
| Identify system barriers to effective and safe care from the patient's perspective | Identify clinical areas with suboptimal efficiency and/or timeliness from the patient's perspective | Lead effort to reduce inefficiency and/or improve timeliness from the patient's perspective | |
| Describe the value of patient satisfaction surveys and patient and family partnership in care | Promote patient and caregiver education including use of effective education tools | Lead efforts to eliminate system barriers to effective and safe care from the patient's perspective | |
| Lead efforts to improve patent and caregiver education including development or implementation of effective education tools | |||
| Lead efforts to actively involve patients and families in the redesign of healthcare delivery systems and processes | |||
Recommended Use of The Competencies
The HQPS Competencies provide a framework for curricula and other professional development experiences in healthcare quality and patient safety. We recommend a step‐wise approach to curriculum development which includes conducting a targeted needs assessment, defining goals and specific learning objectives, and evaluation of the curriculum.25 The HQPS Competencies can be used at each step and provide educational targets for learners across a range of interest and experience.
Professional Development
Since residency programs historically have not trained their graduates to achieve a basic level of competence, practicing hospitalists will need to seek out professional development opportunities. Some educational opportunities which already exist include the Quality Track sessions during the SHM Annual Meeting, and the SHM Quality Improvement Pre‐Course. Hospitalist leaders are currently using the HQPS Competencies to review and revise annual meeting and pre‐course objectives and content in an effort to meet the expected level of competence for SHM members. Similarly, local SHM Chapter and regional hospital medicine leaders should look to the competencies to help select topics and objectives for future presentations. Additionally, the SHM Web site offers tools to develop skills, including a resource room and quality improvement primer.26 Mentored‐implementation programs, supported by SHM, can help hospitalists' acquire more advanced experiential training in quality improvement.
New educational opportunities are being developed, including a comprehensive set of Internet‐based modules designed to help practicing hospitalists achieve a basic level of competence. Hospitalists will be able to achieve continuing medical education (CME) credit upon completion of individual modules. Plans are underway to provide Certification in Hospital Quality and Patient Safety, reflecting an advanced level of competence, upon completion of the entire set, and demonstration of knowledge and skill application through an approved quality improvement project. The certification process will leverage the success of the SHM Leadership Academies and Mentored Implementation projects to help hospitalists apply their new skills in a real world setting.
HQPS Competencies and Focused Practice in Hospital Medicine
Recently, the American Board of Internal Medicine (ABIM) has recognized the field of hospital medicine by developing a new program that provides hospitalists the opportunity to earn Maintenance of Certification (MOC) in Internal Medicine with a Focused Practice in Hospital Medicine.27 Appropriately, hospital quality and patient safety content is included among the knowledge questions on the secure exam, and completion of a practice improvement module (commonly known as PIM) is required for the certification. The SHM Education Committee has developed a Self‐Evaluation of Medical Knowledge module related to hospital quality and patient safety for use in the MOC process. ABIM recertification with Focused Practice in Hospital Medicine is an important and visible step for the Hospital Medicine movement; the content of both the secure exam and the MOC reaffirms the notion that the acquisition of knowledge, skills, and attitudes in hospital quality and patient safety is essential to the practice of hospital medicine.
Medical Education
Because teaching hospitalists frequently serve in important roles as educators and physician leaders in quality improvement, they are often responsible for medical student and resident training in healthcare quality and patient safety. Medical schools and residency programs have struggled to integrate healthcare quality and patient safety into their curricula.11, 12, 28 Hospitalists can play a major role in academic medical centers by helping to develop curricular materials and evaluations related to healthcare quality. Though intended primarily for future and current hospitalists, the HQPS Competencies and standards for the basic level may be adapted to provide educational targets for many learners in undergraduate and graduate medical education. Teaching hospitalists may use these standards to evaluate current educational efforts and design new curricula in collaboration with their medical school and residency program leaders.
Beyond the basic level of training in healthcare quality required for all, many residents will benefit from more advanced training experiences, including opportunities to apply knowledge and develop skills related to quality improvement. A recent report from the ACGME concluded that role models and mentors were essential for engaging residents in quality improvement efforts.29 Hospitalists are ideally suited to serve as role models during residents' experiential learning opportunities related to hospital quality. Several residency programs have begun to implement hospitalist tracks13 and quality improvement rotations.3032 Additionally, some academic medical centers have begun to develop and offer fellowship training in Hospital Medicine.33 These hospitalist‐led educational programs are an ideal opportunity to teach the intermediate and advanced training components, of healthcare quality and patient safety, to residents and fellows that wish to incorporate activity or leadership in quality improvement and patient safety science into their generalist or subspecialty careers. Teaching hospitalists should use the HQPS competency standards to define learning objectives for trainees at this stage of development.
To address the enormous educational needs in quality and safety for future physicians, a cadre of expert teachers in quality and safety will need to be developed. In collaboration with the Alliance for Academic Internal Medicine (AAIM), SHM is developing a Quality and Safety Educators Academy which will target academic hospitalists and other medical educators interested in developing advanced skills in quality improvement and patient safety education.
Assessment of Competence
An essential component of a rigorous faculty development program or medical education initiative is the assessment of whether these endeavors are achieving their stated aims. Published literature provides examples of useful assessment methods applicable to the HQPS Competencies. Knowledge in several areas of HQPS competence may be assessed with the use of multiple choice tests.34, 35 Knowledge of quality improvement methods may be assessed using the Quality Improvement Knowledge Application Tool (QIKAT), an instrument in which the learner responds to each of 3 scenarios with an aim, outcome and process measures, and ideas for changes which may result in improved performance.36 Teamwork and communication skills may be assessed using 360‐degree evaluations3739 and direct observation using behaviorally anchored rating scales.4043 Objective structured clinical examinations have been used to assess knowledge and skills related to patient safety principles.44, 45 Notably, few studies have rigorously assessed the validity and reliability of tools designed to evaluate competence related to healthcare quality.46 Additionally, to our knowledge, no prior research has evaluated assessment specifically for hospitalists. Thus, the development and validation of new assessment tools based on the HQPS Competencies for learners at each level is a crucial next step in the educational process. Additionally, evaluation of educational initiatives should include analyses of clinical benefit, as the ultimate goal of these efforts is to improve patient care.47, 48
Conclusion
Hospitalists are poised to have a tremendous impact on improving the quality of care for hospitalized patients. The lack of training in quality improvement in traditional medical education programs, in which most current hospitalists were trained, can be overcome through appropriate use of the HQPS Competencies. Formal incorporation of the HQPS Competencies into professional development programs, and innovative educational initiatives and curricula, will help provide current hospitalists and the next generations of hospitalists with the needed skills to be successful.
- Crossing the Quality Chasm: A New Health System for the Twenty‐first Century.Washington, DC:Institute of Medicine;2001.
- ,,,.Care in U.S. hospitals—the Hospital Quality Alliance program.N Engl J Med.2005;353(3):265–274.
- ,.Excess length of stay, charges, and mortality attributable to medical injuries during hospitalization.JAMA.2003;290(14):1868–1874.
- Hospital Compare—A quality tool provided by Medicare. Available at: http://www.hospitalcompare.hhs.gov/. Accessed April 23,2010.
- The Leapfrog Group: Hospital Quality Ratings. Available at: http://www.leapfroggroup.org/cp. Accessed April 30,2010.
- Why Not the Best? A Healthcare Quality Improvement Resource. Available at: http://www.whynotthebest.org/. Accessed April 30,2010.
- The Joint Commission: Facts about ORYX for hospitals (National Hospital Quality Measures). Available at: http://www.jointcommission.org/accreditationprograms/hospitals/oryx/oryx_facts.htm. Accessed August 19,2010.
- The Joint Commission: National Patient Safety Goals. Available at: http://www.jointcommission.org/patientsafety/nationalpatientsafetygoals/. Accessed August 9,2010.
- Hospital Acquired Conditions: Overview. Available at: http://www.cms.gov/HospitalAcqCond/01_Overview.asp. Accessed April 30,2010.
- Report to Congress:Plan to Implement a Medicare Hospital Value‐based Purchasing Program. Washington, DC: US Department of Health and Human Services, Center for Medicare and Medicaid Services;2007.
- Unmet Needs: Teaching Physicians to Provide Safe Patient Care.Boston, MA:Lucian Leape Institute at the National Patient Safety Foundation;2010.
- ,,,,.Patient safety education at U.S. and Canadian medical schools: results from the 2006 Clerkship Directors in Internal Medicine survey.Acad Med.2009;84(12):1672–1676.
- ,,,,.Fulfilling the promise of hospital medicine: tailoring internal medicine training to address hospitalists' needs.J Gen Intern Med.2008;23(7):1110–1115.
- ,,,.Hospitalists' perceptions of their residency training needs: results of a national survey.Am J Med.2001;111(3):247–254.
- ,,,,.Redesigning residency education in internal medicine: a position paper from the Association of Program Directors in Internal Medicine.Ann Intern Med.2006;144(12):920–926.
- ,,.Redesigning training for internal medicine.Ann Intern Med.2006;144(12):927–932.
- ,,,,.Core competencies in hospital medicine: development and methodology.J Hosp Med.2006;1(1):48–56.
- Intermountain Healthcare. 20‐Day Course for Executives 2001.
- ,,,.Curriculum Development for Medical Education: A Six‐step Approach.Baltimore, MD:Johns Hopkins Press;1998.
- Society of Hospital Medicine Quality Improvement Basics. Available at: http://www.hospitalmedicine.org/Content/NavigationMenu/QualityImprovement/QIPrimer/QI_Primer_Landing_Pa.htm. Accessed June 4,2010.
- American Board of Internal Medicine: Questions and Answers Regarding ABIM's Maintenance of Certification in Internal Medicine With a Focused Practice in Hospital Medicine Program. Available at: http://www.abim.org/news/news/focused‐practice‐hospital‐medicine‐qa.aspx. Accessed August 9,2010.
- ,,.Assessing the needs of residency program directors to meet the ACGME general competencies.Acad Med.2002;77(7):750.
- .Accreditation Council for Graduate Medical Education and Institute for Healthcare Improvement 90‐Day Project. Involving Residents in Quality Improvement: Contrasting “Top‐Down” and “Bottom‐Up” Approaches.Chicago, IL;ACGME;2008.
- ,,,.Teaching internal medicine residents quality improvement techniques using the ABIM's practice improvement modules.J Gen Intern Med.2008;23(7):927–930.
- ,,,,.A self‐instructional model to teach systems‐based practice and practice‐based learning and improvement.J Gen Intern Med.2008;23(7):931–936.
- ,,,,.Creating a quality improvement elective for medical house officers.J Gen Intern Med.2004;19(8):861–867.
- ,,,.Hospital medicine fellowships: works in progress.Am J Med.2006;119(1):72.e1‐e7.
- ,,,.Web‐based education in systems‐based practice: a randomized trial.Arch Intern Med.2007;167(4):361–366.
- ,,,,.A self‐instructional model to teach systems‐based practice and practice‐based learning and improvement.J Gen Intern Med.2008;23(7):931–936.
- ,,,.The quality improvement knowledge application tool: an instrument to assess knowledge application in practice‐based learning and improvement.J Gen Intern Med.2003;18(suppl 1):250.
- ,,, et al.Effect of multisource feedback on resident communication skills and professionalism: a randomized controlled trial.Arch Pediatr Adolesc Med.2007;161(1):44–49.
- ,.Reliability of a 360‐degree evaluation to assess resident competence.Am J Phys Med Rehabil.2007;86(10):845–852.
- ,,,.Pilot study of a 360‐degree assessment instrument for physical medicine 82(5):394–402.
- ,,,,,.Anaesthetists' non‐technical skills (ANTS): evaluation of a behavioural marker system.Br J Anaesth.2003;90(5):580–588.
- ,,, et al.The Mayo high performance teamwork scale: reliability and validity for evaluating key crew resource management skills.Simul Healthc.2007;2(1):4–10.
- ,,,,,.Reliability of a revised NOTECHS scale for use in surgical teams.Am J Surg.2008;196(2):184–190.
- ,,,,,.Observational teamwork assessment for surgery: construct validation with expert versus novice raters.Ann Surg.2009;249(6):1047–1051.
- ,,,,,.A patient safety objective structured clinical examination.J Patient Saf.2009;5(2):55–60.
- ,.The Objective Structured Clinical Examination as an educational tool in patient safety.Jt Comm J Qual Patient Saf.2007;33(1):48–53.
- ,,.Measurement of the general competencies of the Accreditation Council for Graduate Medical Education: a systematic review.Acad Med.2009;84(3):301–309.
- ,,,,,.Effectiveness of teaching quality improvement to clinicians: a systematic review.JAMA.2007;298(9):1023–1037.
- ,,,,.Methodological rigor of quality improvement curricula for physician trainees: a systematic review and recommendations for change.Acad Med.2009;84(12):1677–1692.
Healthcare quality is defined as the degree to which health services for individuals and populations increase the likelihood of desired health outcomes and are consistent with current professional knowledge.1 Delivering high quality care to patients in the hospital setting is especially challenging, given the rapid pace of clinical care, the severity and multitude of patient conditions, and the interdependence of complex processes within the hospital system. Research has shown that hospitalized patients do not consistently receive recommended care2 and are at risk for experiencing preventable harm.3 In an effort to stimulate improvement, stakeholders have called for increased accountability, including enhanced transparency and differential payment based on performance. A growing number of hospital process and outcome measures are readily available to the public via the Internet.46 The Joint Commission, which accredits US hospitals, requires the collection of core quality measure data7 and sets the expectation that National Patient Safety Goals be met to maintain accreditation.8 Moreover, the Center for Medicare and Medicaid Services (CMS) has developed a Value‐Based Purchasing (VBP) plan intended to adjust hospital payment based on quality measures and the occurrence of certain hospital‐acquired conditions.9, 10
Because of their clinical expertise, understanding of hospital clinical operations, leadership of multidisciplinary inpatient teams, and vested interest to improve the systems in which they work, hospitalists are perfectly positioned to collaborate with their institutions to improve the quality of care delivered to inpatients. However, many hospitalists are inadequately prepared to engage in efforts to improve quality, because medical schools and residency programs have not traditionally included or emphasized healthcare quality and patient safety in their curricula.1113 In a survey of 389 internal medicine‐trained hospitalists, significant educational deficiencies were identified in the area of systems‐based practice.14 Specifically, the topics of quality improvement, team management, practice guideline development, health information systems management, and coordination of care between healthcare settings were listed as essential skills for hospitalist practice but underemphasized in residency training. Recognizing the gap between the needs of practicing physicians and current medical education provided in healthcare quality, professional societies have recently published position papers calling for increased training in quality, safety, and systems, both in medical school11 and residency training.15, 16
The Society of Hospital Medicine (SHM) convened a Quality Summit in December 2008 to develop strategic plans related to healthcare quality. Summit attendees felt that most hospitalists lack the formal training necessary to evaluate, implement, and sustain system changes within the hospital. In response, the SHM Hospital Quality and Patient Safety (HQPS) Committee formed a Quality Improvement Education (QIE) subcommittee in 2009 to assess the needs of hospitalists with respect to hospital quality and patient safety, and to evaluate and expand upon existing educational programs in this area. Membership of the QIE subcommittee consisted of hospitalists with extensive experience in healthcare quality and medical education. The QIE subcommittee refined and expanded upon the healthcare quality and patient safety‐related competencies initially described in the Core Competencies in Hospital Medicine.17 The purpose of this report is to describe the development, provide definitions, and make recommendations on the use of the Hospital Quality and Patient Safety (HQPS) Competencies.
Development of The Hospital Quality and Patient Safety Competencies
The multistep process used by the SHM QIE subcommittee to develop the HQPS Competencies is summarized in Figure 1. We performed an in‐depth evaluation of current educational materials and offerings, including a review of the Core Competencies in Hospital Medicine, past annual SHM Quality Improvement Pre‐Course objectives, and the content of training courses offered by other organizations.1722 Throughout our analysis, we emphasized the identification of gaps in content relevant to hospitalists. We then used the Institute of Medicine's (IOM) 6 aims for healthcare quality as a foundation for developing the HQPS Competencies.1 Specifically, the IOM states that healthcare should be safe, effective, patient‐centered, timely, efficient, and equitable. Additionally, we reviewed and integrated elements of the Practice‐Based Learning and Improvement (PBLI) and Systems‐Based Practice (SBP) competencies as defined by the Accreditation Council for Graduate Medical Education (ACGME).23 We defined general areas of competence and specific standards for knowledge, skills, and attitudes within each area. Subcommittee members reflected on their own experience, as clinicians, educators, and leaders in healthcare quality and patient safety, to inform and refine the competency definitions and standards. Acknowledging that some hospitalists may serve as collaborators or clinical content experts, while others may serve as leaders of hospital quality initiatives, 3 levels of expertise were established: basic, intermediate, and advanced.
The QIE subcommittee presented a draft version of the HQPS Competencies to the HQPS Committee in the fall of 2009 and incorporated suggested revisions. The revised set of competencies was then reviewed by members of the Leadership and Education Committees during the winter of 2009‐2010, and additional recommendations were included in the final version now described.
Description of The Competencies
The 8 areas of competence include: Quality Measurement and Stakeholder Interests, Data Acquisition and Interpretation, Organizational Knowledge and Leadership Skills, Patient Safety Principles, Teamwork and Communication, Quality and Safety Improvement Methods, Health Information Systems, and Patient Centeredness. Three levels of competence and standards within each level and area are defined in Table 1. Standards use carefully selected action verbs to reflect educational goals for hospitalists at each level.24 The basic level represents a minimum level of competency for all practicing hospitalists. The intermediate level represents a hospitalist who is prepared to meaningfully engage and collaborate with his or her institution in quality improvement efforts. A hospitalist at this level may also lead uncomplicated improvement projects for his or her medical center and/or hospital medicine group. The advanced level represents a hospitalist prepared to lead quality improvement efforts for his or her institution and/or hospital medicine group. Many hospitalists at this level will have, or will be prepared to have, leadership positions in quality and patient safety at their institutions. Advanced level hospitalists will also have the expertise to teach and mentor other individuals in their quality improvement efforts.
| Competency | Basic | Intermediate | Advanced |
|---|---|---|---|
| |||
| Quality measurement and stakeholder interests | Define structure, process, and outcome measures | Compare and contrast relative benefits of using one type of measure vs another | Anticipate and respond to stakeholders' needs and interests |
| Define stakeholders and understand their interests related to healthcare quality | Explain measures as defined by stakeholders (Center for Medicare and Medicaid Services, Leapfrog, etc) | Anticipate and respond to changes in quality measures and incentive programs | |
| Identify measures as defined by stakeholders (Center for Medicare and Medicaid Services, Leapfrog, etc) | Appreciate variation in quality and utilization performance | Lead efforts to reduce variation in care delivery (see also quality improvement methods) | |
| Describe potential unintended consequences of quality measurement and incentive programs | Avoid unintended consequences of quality measurement and incentive programs | ||
| Data acquisition and interpretation | Interpret simple statistical methods to compare populations within a sample (chi‐square, t tests, etc) | Describe sources of data for quality measurement | Acquire data from internal and external sources |
| Define basic terms used to describe continuous and categorical data (mean, median, standard deviation, interquartile range, percentages, rates, etc) | Identify potential pitfalls in administrative data | Create visual representations of data (Bar, Pareto, and Control Charts) | |
| Summarize basic principles of statistical process control | Explain variation in data | Use simple statistical methods to compare populations within a sample (chi‐square, t tests, etc) | |
| Interpret data displayed in Pareto and Control Charts | Administer and interpret a survey | ||
| Summarize basic survey techniques (including methods to maximize response, minimize bias, and use of ordinal response scales) | |||
| Use appropriate terms to describe continuous and categorical data (mean, median, standard deviation, interquartile range, percentages, rates, etc) | |||
| Organizational knowledge and leadership skills | Describe the organizational structure of one's institution | Define interests of internal and external stakeholders | Effectively negotiate with stakeholders |
| Define leaders within the organization and describe their roles | Collaborate as an effective team member of a quality improvement project | Assemble a quality improvement project team and effectively lead meetings (setting agendas, hold members accountable, etc) | |
| Exemplify the importance of leading by example | Explain principles of change management and how it can positively or negatively impact quality improvement project implementation | Motivate change and create vision for ideal state | |
| Effectively communicate quality or safety issues identified during routine patient care to the appropriate parties | Communicate effectively in a variety of settings (lead a meeting, public speaking, etc) | ||
| Serve as a resource and/or mentor for less‐experienced team members | |||
| Patient safety principles | Identify potential sources of error encountered during routine patient care | Compare methods to measure errors and adverse events, including administrative data analysis, chart review, and incident reporting systems | Lead efforts to appropriately measure medical error and/or adverse events |
| Compare and contrast medical error with adverse event | Identify and explain how human factors can contribute to medical errors | Lead efforts to redesign systems to reduce errors from occurring; this may include the facilitation of a hospital, departmental, or divisional Root Cause Analysis | |
| Describe how the systems approach to medical error is more productive than assigning individual blame | Know the difference between a strong vs a weak action plan for improvement (ie, brief education intervention is weak; skills training with deliberate practice or physical changes are stronger) | Lead efforts to advance the culture of patient safety in the hospital | |
| Differentiate among types of error (knowledge/judgment vs systems vs procedural/technical; latent vs active) | |||
| Explain the role that incident reporting plays in quality improvement efforts and how reporting can foster a culture of safety | |||
| Describe principles of medical error disclosure | |||
| Teamwork and communication | Explain how poor teamwork and communication failures contribute to adverse events | Collaborate on administration and interpretation of teamwork and safety culture measures | Lead efforts to improve teamwork and safety culture |
| Identify the potential for errors during transitions within and between healthcare settings (handoffs, transfers, discharge) | Describe the principles of effective teamwork and identify behaviors consistent with effective teamwork | Lead efforts to improve teamwork in specific settings (intensive care, medical‐surgical unit, etc) | |
| Identify deficiencies in transitions within and between healthcare settings (handoffs, transfers, discharge) | Successfully improve the safety of transitions within and between healthcare settings (handoffs, transfers, discharge) | ||
| Quality and safety improvement methods and tools | Define the quality improvement methods used and infrastructure in place at one's hospital | Compare and contrast various quality improvement methods, including six sigma, lean, and PDSA | Lead a quality improvement project using six sigma, lean, or PDSA methodology |
| Summarize the basic principles and use of Root Cause Analysis as a tool to evaluate medical error | Collaborate on a quality improvement project using six sigma, lean, or PDSA | Use high level process mapping, fishbone diagrams, etc, to identify areas for opportunity in evaluating a process | |
| Describe and collaborate on Failure Mode and Effects Analysis | Lead the development and implementation of clinical protocols to standardize care delivery when appropriate | ||
| Actively participate in a Root Cause Analysis | Conduct Failure Mode and Effects Analysis | ||
| Conduct Root Cause Analysis | |||
| Health information systems | Identify the potential for information systems to reduce as well as contribute to medical error | Define types of clinical decision support | Lead or co‐lead efforts to leverage information systems in quality measurement |
| Describe how information systems fit into provider workflow and care delivery | Collaborate on the design of health information systems | Lead or co‐lead efforts to leverage information systems to reduce error and/or improve delivery of effective care | |
| Anticipate and prevent unintended consequences of implementation or revision of information systems | |||
| Lead or co‐lead efforts to leverage clinical decision support to improve quality and safety | |||
| Patient centeredness | Explain the clinical benefits of a patient‐centered approach | Explain benefits and potential limitations of patient satisfaction surveys | Interpret data from patient satisfaction surveys and lead efforts to improve patient satisfaction |
| Identify system barriers to effective and safe care from the patient's perspective | Identify clinical areas with suboptimal efficiency and/or timeliness from the patient's perspective | Lead effort to reduce inefficiency and/or improve timeliness from the patient's perspective | |
| Describe the value of patient satisfaction surveys and patient and family partnership in care | Promote patient and caregiver education including use of effective education tools | Lead efforts to eliminate system barriers to effective and safe care from the patient's perspective | |
| Lead efforts to improve patent and caregiver education including development or implementation of effective education tools | |||
| Lead efforts to actively involve patients and families in the redesign of healthcare delivery systems and processes | |||
Recommended Use of The Competencies
The HQPS Competencies provide a framework for curricula and other professional development experiences in healthcare quality and patient safety. We recommend a step‐wise approach to curriculum development which includes conducting a targeted needs assessment, defining goals and specific learning objectives, and evaluation of the curriculum.25 The HQPS Competencies can be used at each step and provide educational targets for learners across a range of interest and experience.
Professional Development
Since residency programs historically have not trained their graduates to achieve a basic level of competence, practicing hospitalists will need to seek out professional development opportunities. Some educational opportunities which already exist include the Quality Track sessions during the SHM Annual Meeting, and the SHM Quality Improvement Pre‐Course. Hospitalist leaders are currently using the HQPS Competencies to review and revise annual meeting and pre‐course objectives and content in an effort to meet the expected level of competence for SHM members. Similarly, local SHM Chapter and regional hospital medicine leaders should look to the competencies to help select topics and objectives for future presentations. Additionally, the SHM Web site offers tools to develop skills, including a resource room and quality improvement primer.26 Mentored‐implementation programs, supported by SHM, can help hospitalists' acquire more advanced experiential training in quality improvement.
New educational opportunities are being developed, including a comprehensive set of Internet‐based modules designed to help practicing hospitalists achieve a basic level of competence. Hospitalists will be able to achieve continuing medical education (CME) credit upon completion of individual modules. Plans are underway to provide Certification in Hospital Quality and Patient Safety, reflecting an advanced level of competence, upon completion of the entire set, and demonstration of knowledge and skill application through an approved quality improvement project. The certification process will leverage the success of the SHM Leadership Academies and Mentored Implementation projects to help hospitalists apply their new skills in a real world setting.
HQPS Competencies and Focused Practice in Hospital Medicine
Recently, the American Board of Internal Medicine (ABIM) has recognized the field of hospital medicine by developing a new program that provides hospitalists the opportunity to earn Maintenance of Certification (MOC) in Internal Medicine with a Focused Practice in Hospital Medicine.27 Appropriately, hospital quality and patient safety content is included among the knowledge questions on the secure exam, and completion of a practice improvement module (commonly known as PIM) is required for the certification. The SHM Education Committee has developed a Self‐Evaluation of Medical Knowledge module related to hospital quality and patient safety for use in the MOC process. ABIM recertification with Focused Practice in Hospital Medicine is an important and visible step for the Hospital Medicine movement; the content of both the secure exam and the MOC reaffirms the notion that the acquisition of knowledge, skills, and attitudes in hospital quality and patient safety is essential to the practice of hospital medicine.
Medical Education
Because teaching hospitalists frequently serve in important roles as educators and physician leaders in quality improvement, they are often responsible for medical student and resident training in healthcare quality and patient safety. Medical schools and residency programs have struggled to integrate healthcare quality and patient safety into their curricula.11, 12, 28 Hospitalists can play a major role in academic medical centers by helping to develop curricular materials and evaluations related to healthcare quality. Though intended primarily for future and current hospitalists, the HQPS Competencies and standards for the basic level may be adapted to provide educational targets for many learners in undergraduate and graduate medical education. Teaching hospitalists may use these standards to evaluate current educational efforts and design new curricula in collaboration with their medical school and residency program leaders.
Beyond the basic level of training in healthcare quality required for all, many residents will benefit from more advanced training experiences, including opportunities to apply knowledge and develop skills related to quality improvement. A recent report from the ACGME concluded that role models and mentors were essential for engaging residents in quality improvement efforts.29 Hospitalists are ideally suited to serve as role models during residents' experiential learning opportunities related to hospital quality. Several residency programs have begun to implement hospitalist tracks13 and quality improvement rotations.3032 Additionally, some academic medical centers have begun to develop and offer fellowship training in Hospital Medicine.33 These hospitalist‐led educational programs are an ideal opportunity to teach the intermediate and advanced training components, of healthcare quality and patient safety, to residents and fellows that wish to incorporate activity or leadership in quality improvement and patient safety science into their generalist or subspecialty careers. Teaching hospitalists should use the HQPS competency standards to define learning objectives for trainees at this stage of development.
To address the enormous educational needs in quality and safety for future physicians, a cadre of expert teachers in quality and safety will need to be developed. In collaboration with the Alliance for Academic Internal Medicine (AAIM), SHM is developing a Quality and Safety Educators Academy which will target academic hospitalists and other medical educators interested in developing advanced skills in quality improvement and patient safety education.
Assessment of Competence
An essential component of a rigorous faculty development program or medical education initiative is the assessment of whether these endeavors are achieving their stated aims. Published literature provides examples of useful assessment methods applicable to the HQPS Competencies. Knowledge in several areas of HQPS competence may be assessed with the use of multiple choice tests.34, 35 Knowledge of quality improvement methods may be assessed using the Quality Improvement Knowledge Application Tool (QIKAT), an instrument in which the learner responds to each of 3 scenarios with an aim, outcome and process measures, and ideas for changes which may result in improved performance.36 Teamwork and communication skills may be assessed using 360‐degree evaluations3739 and direct observation using behaviorally anchored rating scales.4043 Objective structured clinical examinations have been used to assess knowledge and skills related to patient safety principles.44, 45 Notably, few studies have rigorously assessed the validity and reliability of tools designed to evaluate competence related to healthcare quality.46 Additionally, to our knowledge, no prior research has evaluated assessment specifically for hospitalists. Thus, the development and validation of new assessment tools based on the HQPS Competencies for learners at each level is a crucial next step in the educational process. Additionally, evaluation of educational initiatives should include analyses of clinical benefit, as the ultimate goal of these efforts is to improve patient care.47, 48
Conclusion
Hospitalists are poised to have a tremendous impact on improving the quality of care for hospitalized patients. The lack of training in quality improvement in traditional medical education programs, in which most current hospitalists were trained, can be overcome through appropriate use of the HQPS Competencies. Formal incorporation of the HQPS Competencies into professional development programs, and innovative educational initiatives and curricula, will help provide current hospitalists and the next generations of hospitalists with the needed skills to be successful.
- Crossing the Quality Chasm: A New Health System for the Twenty‐first Century.Washington, DC:Institute of Medicine;2001.
- ,,,.Care in U.S. hospitals—the Hospital Quality Alliance program.N Engl J Med.2005;353(3):265–274.
- ,.Excess length of stay, charges, and mortality attributable to medical injuries during hospitalization.JAMA.2003;290(14):1868–1874.
- Hospital Compare—A quality tool provided by Medicare. Available at: http://www.hospitalcompare.hhs.gov/. Accessed April 23,2010.
- The Leapfrog Group: Hospital Quality Ratings. Available at: http://www.leapfroggroup.org/cp. Accessed April 30,2010.
- Why Not the Best? A Healthcare Quality Improvement Resource. Available at: http://www.whynotthebest.org/. Accessed April 30,2010.
- The Joint Commission: Facts about ORYX for hospitals (National Hospital Quality Measures). Available at: http://www.jointcommission.org/accreditationprograms/hospitals/oryx/oryx_facts.htm. Accessed August 19,2010.
- The Joint Commission: National Patient Safety Goals. Available at: http://www.jointcommission.org/patientsafety/nationalpatientsafetygoals/. Accessed August 9,2010.
- Hospital Acquired Conditions: Overview. Available at: http://www.cms.gov/HospitalAcqCond/01_Overview.asp. Accessed April 30,2010.
- Report to Congress:Plan to Implement a Medicare Hospital Value‐based Purchasing Program. Washington, DC: US Department of Health and Human Services, Center for Medicare and Medicaid Services;2007.
- Unmet Needs: Teaching Physicians to Provide Safe Patient Care.Boston, MA:Lucian Leape Institute at the National Patient Safety Foundation;2010.
- ,,,,.Patient safety education at U.S. and Canadian medical schools: results from the 2006 Clerkship Directors in Internal Medicine survey.Acad Med.2009;84(12):1672–1676.
- ,,,,.Fulfilling the promise of hospital medicine: tailoring internal medicine training to address hospitalists' needs.J Gen Intern Med.2008;23(7):1110–1115.
- ,,,.Hospitalists' perceptions of their residency training needs: results of a national survey.Am J Med.2001;111(3):247–254.
- ,,,,.Redesigning residency education in internal medicine: a position paper from the Association of Program Directors in Internal Medicine.Ann Intern Med.2006;144(12):920–926.
- ,,.Redesigning training for internal medicine.Ann Intern Med.2006;144(12):927–932.
- ,,,,.Core competencies in hospital medicine: development and methodology.J Hosp Med.2006;1(1):48–56.
- Intermountain Healthcare. 20‐Day Course for Executives 2001.
- ,,,.Curriculum Development for Medical Education: A Six‐step Approach.Baltimore, MD:Johns Hopkins Press;1998.
- Society of Hospital Medicine Quality Improvement Basics. Available at: http://www.hospitalmedicine.org/Content/NavigationMenu/QualityImprovement/QIPrimer/QI_Primer_Landing_Pa.htm. Accessed June 4,2010.
- American Board of Internal Medicine: Questions and Answers Regarding ABIM's Maintenance of Certification in Internal Medicine With a Focused Practice in Hospital Medicine Program. Available at: http://www.abim.org/news/news/focused‐practice‐hospital‐medicine‐qa.aspx. Accessed August 9,2010.
- ,,.Assessing the needs of residency program directors to meet the ACGME general competencies.Acad Med.2002;77(7):750.
- .Accreditation Council for Graduate Medical Education and Institute for Healthcare Improvement 90‐Day Project. Involving Residents in Quality Improvement: Contrasting “Top‐Down” and “Bottom‐Up” Approaches.Chicago, IL;ACGME;2008.
- ,,,.Teaching internal medicine residents quality improvement techniques using the ABIM's practice improvement modules.J Gen Intern Med.2008;23(7):927–930.
- ,,,,.A self‐instructional model to teach systems‐based practice and practice‐based learning and improvement.J Gen Intern Med.2008;23(7):931–936.
- ,,,,.Creating a quality improvement elective for medical house officers.J Gen Intern Med.2004;19(8):861–867.
- ,,,.Hospital medicine fellowships: works in progress.Am J Med.2006;119(1):72.e1‐e7.
- ,,,.Web‐based education in systems‐based practice: a randomized trial.Arch Intern Med.2007;167(4):361–366.
- ,,,,.A self‐instructional model to teach systems‐based practice and practice‐based learning and improvement.J Gen Intern Med.2008;23(7):931–936.
- ,,,.The quality improvement knowledge application tool: an instrument to assess knowledge application in practice‐based learning and improvement.J Gen Intern Med.2003;18(suppl 1):250.
- ,,, et al.Effect of multisource feedback on resident communication skills and professionalism: a randomized controlled trial.Arch Pediatr Adolesc Med.2007;161(1):44–49.
- ,.Reliability of a 360‐degree evaluation to assess resident competence.Am J Phys Med Rehabil.2007;86(10):845–852.
- ,,,.Pilot study of a 360‐degree assessment instrument for physical medicine 82(5):394–402.
- ,,,,,.Anaesthetists' non‐technical skills (ANTS): evaluation of a behavioural marker system.Br J Anaesth.2003;90(5):580–588.
- ,,, et al.The Mayo high performance teamwork scale: reliability and validity for evaluating key crew resource management skills.Simul Healthc.2007;2(1):4–10.
- ,,,,,.Reliability of a revised NOTECHS scale for use in surgical teams.Am J Surg.2008;196(2):184–190.
- ,,,,,.Observational teamwork assessment for surgery: construct validation with expert versus novice raters.Ann Surg.2009;249(6):1047–1051.
- ,,,,,.A patient safety objective structured clinical examination.J Patient Saf.2009;5(2):55–60.
- ,.The Objective Structured Clinical Examination as an educational tool in patient safety.Jt Comm J Qual Patient Saf.2007;33(1):48–53.
- ,,.Measurement of the general competencies of the Accreditation Council for Graduate Medical Education: a systematic review.Acad Med.2009;84(3):301–309.
- ,,,,,.Effectiveness of teaching quality improvement to clinicians: a systematic review.JAMA.2007;298(9):1023–1037.
- ,,,,.Methodological rigor of quality improvement curricula for physician trainees: a systematic review and recommendations for change.Acad Med.2009;84(12):1677–1692.
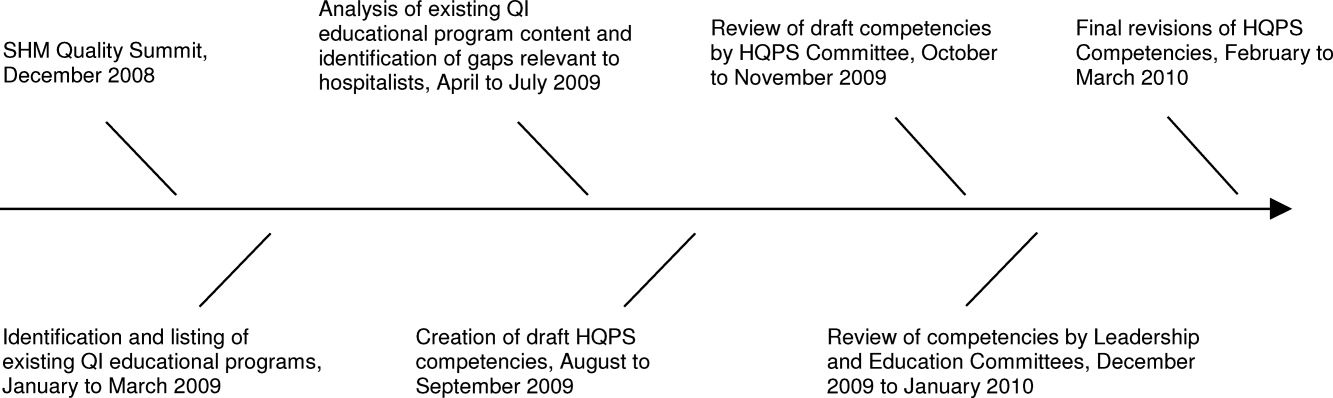
Teamwork in Hospitals
Teamwork is important in providing high‐quality hospital care. Despite tremendous efforts in the 10 years since publication of the Institute of Medicine's To Err is Human report,1 hospitalized patients remain at risk for adverse events (AEs).2 Although many AEs are not preventable, a large portion of those which are identified as preventable can be attributed to communication and teamwork failures.35 A Joint Commission study indicated that communication failures were the root cause for two‐thirds of the 3548 sentinel events reported from 1995 to 2005.6 Another study, involving interviews of resident physicians about recent medical mishaps, found that communication failures contributed to 91% of the AEs they reported.5
Teamwork also plays an important role in other aspects of hospital care delivery. Patients' ratings of nurse‐physician coordination correlate with their overall perception of the quality of care received.7, 8 A study of Veterans Health Administration (VHA) hospitals found that teamwork culture was significantly and positively associated with overall patient satisfaction.9 Another VHA study found that hospitals with higher teamwork culture ratings had lower nurse resignations rates.10 Furthermore, poor teamwork within hospitals may have an adverse effect on financial performance, as a result of inefficiencies in physician and nurse workflow.11
Some organizations are capable of operating in complex, hazardous environments while maintaining exceptional performance over long periods of time. These high reliability organizations (HRO) include aircraft carriers, air traffic control systems, and nuclear power plants, and are characterized by their preoccupation with failure, reluctance to simplify interpretations, sensitivity to operations, commitment to resilience, and deference to expertise.12, 13 Preoccupation with failure is manifested by an organization's efforts to avoid complacency and persist in the search for additional risks. Reluctance to simplify interpretations is exemplified by an interest in pursuing a deep understanding of the issues that arise. Sensitivity to operations is the close attention paid to input from front‐line personnel and processes. Commitment to resilience relates to an organization's ability to contain errors once they occur and mitigate harm. Deference to expertise describes the practice of having authority migrate to the people with the most expertise, regardless of rank. Collectively, these qualities produce a state of mindfulness, allowing teams to anticipate and become aware of unexpected events, yet also quickly contain and learn from them. Recent publications have highlighted the need for hospitals to learn from HROs and the teams within them.14, 15
Recognizing the importance of teamwork in hospitals, senior leadership from the American College of Physician Executives (ACPE), the American Hospital Association (AHA), the American Organization of Nurse Executives (AONE), and the Society of Hospital Medicine (SHM) established the High Performance Teams and the Hospital of the Future project. This collaborative learning effort aims to redesign care delivery to provide optimal value to hospitalized patients. As an initial step, the High Performance Teams and the Hospital of the Future project team completed a literature review related to teamwork in hospitals. The purpose of this report is to summarize the current understanding of teamwork, describe interventions designed to improve teamwork, and make practical recommendations for hospitals to assess and improve teamwork‐related performance. We approach teamwork from the hospitalized patient's perspective, and restrict our discussion to interactions occurring among healthcare professionals within the hospital. We recognize the importance of teamwork at all points in the continuum of patient care. Highly functional inpatient teams should be integrated into an overall system of coordinated and collaborative care.
TEAMWORK: DEFINITION AND CONSTRUCTS
Physicians, nurses, and other healthcare professionals spend a great deal of their time on communication and coordination of care activities.1618 In spite of this and the patient safety concerns previously noted, interpersonal communication skills and teamwork have been historically underemphasized in professional training.1922 A team is defined as 2 or more individuals with specified roles interacting adaptively, interdependently, and dynamically toward a shared and common goal.23 Elements of effective teamwork have been identified through research conducted in aviation, the military, and more recently, healthcare. Salas and colleagues have synthesized this research into 5 core components: team leadership, mutual performance monitoring, backup behavior, adaptability, and team orientation (see Table 1).23 Additionally, 3 supporting and coordinating mechanisms are essential for effective teamwork: shared mental model, closed‐loop communication, and mutual trust (see Table 1).23 High‐performing teams use these elements to develop a culture for speaking up, and situational awareness among team members. Situational awareness refers to a person's perception and understanding of their dynamic environment, and human errors often result from a lack of such awareness.24 These teamwork constructs provide the foundational basis for understanding how hospitals can identify teamwork challenges, assess team performance, and design effective interventions.
| Teamwork | Definition | Behavioral Examples |
|---|---|---|
| ||
| Component | ||
| Team leadership | The leader directs and coordinates team members activities | Facilitate team problem solving; |
| Provide performance expectations; | ||
| Clarify team member roles; | ||
| Assist in conflict resolution | ||
| Mutual performance monitoring | Team members are able to monitor one another's performance | Identify mistakes and lapses in other team member actions; |
| Provide feedback to fellow team members to facilitate self‐correction | ||
| Backup behavior | Team members anticipate and respond to one another's needs | Recognize workload distribution problem; |
| Shift work responsibilities to underutilized members | ||
| Adaptability | The team adjusts strategies based on new information | Identify cues that change has occurred and develop plan to deal with changes; |
| Remain vigilant to change in internal and external environment | ||
| Team orientation | Team members prioritize team goals above individual goals | Take into account alternate solutions by teammates; |
| Increased task involvement, information sharing, and participatory goal setting | ||
| Coordinating mechanism | ||
| Shared mental model | An organizing knowledge of the task of the team and how members will interact to achieve their goal | Anticipate and predict each other's needs; |
| Identify changes in team, task, or teammates | ||
| Closed‐loop communication | Acknowledgement and confirmation of information received | Follow up with team members to ensure message received; |
| Acknowledge that message was received; | ||
| Clarify information received | ||
| Mutual trust | Shared belief that team members will perform their roles | Share information; |
| Willingly admit mistakes and accept feedback | ||
CHALLENGES TO EFFECTIVE TEAMWORK
Several important and unique barriers to teamwork exist in hospitals. Teams are large and formed in an ad hoc fashion. On a given day, a patient's hospital team might include a hospitalist, a nurse, a case manager, a pharmacist, and 1 or more consulting physicians and therapists. Team members in each respective discipline care for multiple patients at the same time, yet few hospitals align team membership (ie, patient assignment). Therefore, a nurse caring for 4 patients may interact with 4 different hospitalists. Similarly, a hospitalist caring for 14 patients may interact with multiple nurses in a given day. Team membership is ever changing because hospital professionals work in shifts and rotations. Finally, team members are seldom in the same place at the same time because physicians often care for patients on multiple units and floors, while nurses and other team members are often unit‐based. Salas and others have noted that team size, instability, and geographic dispersion of membership serve as important barriers to improving teamwork.25, 26 As a result of these barriers, nurses and physicians do not communicate consistently, and often disagree on the daily plan of care for their patients.27, 28 When communication does occur, clinicians may overestimate how well their messages are understood by other team members, reflecting a phenomenon well known in communication psychology related to egocentric thought processes.29, 30
The traditionally steep hierarchy within medicine may also serve as a barrier to teamwork. Studies in intensive care units (ICUs), operating rooms, and general medical units reveal widely discrepant views on the quality of collaboration and communication between healthcare professionals.3133 Although physicians generally give high ratings to the quality of collaboration with nurses, nurses consistently rate the quality of collaboration with physicians as poor. Similarly, specialist physicians rate collaboration with hospitalists higher than hospitalists rate collaboration with specialists.33 Effective teams in other high‐risk industries, like aviation, strive to flatten hierarchy so that team members feel comfortable raising concerns and engaging in open and respectful communications.34
The effect of technology on communication practices and teamwork is complex and incompletely understood. The implementation of electronic heath records and computerized provider order entry systems fundamentally changes work‐flow, and may result in less synchronization and feedback during nurse‐physician collaboration.35 Similarly, the expanded use of text messages delivered via alphanumeric paging or mobile phone results in a transition toward asynchronous modes of communication. These asynchronous modes allow healthcare professionals to review and respond to messages at their convenience, and may reduce unnecessary interruptions. Research shows that these systems are popular among clinicians.3638 However, receipt and understanding of the intended message may not be confirmed with the use of asynchronous modes of communication. Moreover, important face‐to‐face communication elements (tone of voice, expression, gesture, eye contract)39, 40 are lacking. One promising approach is a system which sends low‐priority messages to a Web‐based task list for periodic review, while allowing higher priority messages to pass through to an alphanumeric pager and interrupt the intended recipient.41 Another common frustration in hospitals, despite advancing technology, is difficulty identifying the correct physician(s) and nurse(s) caring for a particular patient at a given point in time.33 Wong and colleagues found that 14% of pages in their hospital were initially sent to the wrong physician.42
ASSESSMENT OF TEAMWORK
One of the challenges in improving teamwork is the difficulty in measuring it. Teamwork assessment entails measuring the performance of teams composed of multiple individuals. Methods of teamwork assessment can be broadly categorized as self assessment, peer assessment, direct observation, survey of team climate or culture, and measurement of the outcome of effective teamwork. While self‐report tools are easy to administer and can capture affective components influencing team performance, they may not reflect actual skills on the part of individuals or teams. Peer assessment includes the use of 360‐degree evaluations or multisource feedback, and provides an evaluation of individual performance.4347
Direct observation provides a more accurate assessment of team‐related behaviors using trained observers. Observers use checklists and/or behaviorally anchored rating scales (BARS) to evaluate individual and team performance. A number of BARS have been developed and validated for the evaluation of team performance.4852 Of note, direct observation may be difficult in settings in which team members are not in the same place at the same time. An alternative method, which may be better suited for general medical units, is the use of survey instruments designed to assess attitudes and teamwork climate.5355 Importantly, higher survey ratings of collaboration and teamwork have been associated with better patient outcomes in observational studies.5658
The ultimate goal of teamwork efforts is to improve patient outcomes. Because patient outcomes are affected by a number of factors and because hospitals frequently engage in multiple, simultaneous efforts to improve care, it is often difficult to clearly link improved outcomes with teamwork interventions. Continued efforts to rigorously evaluate teamwork interventions should remain a priority, particularly as the cost of these interventions must be weighed against other interventions and investments.
EXAMPLES OF SUCCESSFUL INTERVENTIONS
A number of interventions have been used to improve teamwork in hospitals (see Table 2).
| Intervention | Advantages | Disadvantages |
|---|---|---|
| Localization of physicians | Increases frequency of nurse‐physician communication; provides foundation for additional interventions | Insufficient in creating a shared mental model; does not specifically enhance communication skills |
| Daily goals‐of‐care forms and checklists | Provides structure to interdisciplinary discussions and ensures input from all team members | May be completed in a perfunctory manner and may not be updated as plans of care evolve |
| Teamwork training | Emphasizes improved communication behaviors relevant across a range of team member interactions | Requires time and deliberate practice of new skills; effect may be attenuated if members are dispersed. |
| Interdisciplinary rounds | Provides a forum for regular interdisciplinary communication | Requires leadership to organize discussion and does not address need for updates as plans of care evolve |
Geographic Localization of Physicians
As mentioned earlier, physicians in large hospitals may care for patients on multiple units or floors. Designating certain physicians to care for patients admitted to specific units may improve efficiency and communication among healthcare professionals. One study recently reported on the effect of localization of hospital physicians to specific patient care units. Localization resulted in an increase in the rate of nurse‐physician communication, but did not improve providers' shared understanding of the plan of care.56 Notably, localizing physicians may improve the feasibility of additional interventions, like teamwork training and interdisciplinary rounds.
Daily Goals of Care and Surgery Safety Checklists
In ICU and operating room settings, physicians and nurses work in proximity, allowing interdisciplinary discussions to occur at the bedside. The finding that professionals in ICUs and operating rooms have widely discrepant views on the quality of collaboration31, 32 indicates that proximity, alone, is not sufficient for effective communication. Pronovost et al. used a daily goals form for bedside ICU rounds in an effort to standardize communication about the daily plan of care.57 The form defined essential goals of care for patients, and its use resulted in a significant improvement in the team's understanding of the daily goals. Narasimhan et al. performed a similar study using a daily goals worksheet during ICU rounds,58 and also found a significant improvement in physicians' and nurses' ratings of their understanding of the goals of care. The forms used in these studies provided structure to the interdisciplinary conversations during rounds to create a shared understanding of patients' plans of care.
Haynes and colleagues recently reported on the use of a surgical safety checklist in a large, multicenter pre‐post study.59 The checklist consisted of verbal confirmation of the completion of basic steps essential to safe care in the operating room, and provided structure to communication among surgical team members to ensure a shared understanding of the operative plan. The intervention resulted in a significant reduction in inpatient complications and mortality.
Team Training
Formalized team training, based on crew resource management, has been studied as a potential method to improve teamwork in a variety of medical settings.6062 Training emphasizes the core components of successful teamwork and essential coordinating mechanisms previously mentioned.23 Team training appears to positively influence culture, as assessed by teamwork and patient safety climate survey instruments.60 Based on these findings and extensive research demonstrating the success of teamwork training in aviation,63 the Agency for Healthcare Research and Quality (AHRQ) and the Department of Defense (DoD) have partnered in offering the Team Strategies and Tools to Enhance Performance and Patient Safety (TeamSTEPPS) program, designed to improve teamwork skills for healthcare professionals.64, 65
Only a handful of studies have evaluated the effectiveness of teamwork training programs on patient outcomes, and the results are mixed.66 Morey et al. found a reduction in the rate of observed errors as a result of teamwork training in emergency departments, but observers in the study were not blinded with regard to whether teams had undergone training.61 A research group in the United Kingdom evaluated the benefit of simulation‐based team training on outcomes in an obstetrical setting.67, 68 Training included management of specific complications, including shoulder dystocia and uterine cord prolapse. Using retrospective chart review, the investigators found a significant reduction in the proportion of babies born with an obstetric brachial palsy injury and a reduction in the time from diagnosis of uterine cord prolapse to infant delivery. Nielsen and colleagues also evaluated the use of teamwork training in an obstetric setting.62 In a cluster randomized controlled trial, the investigators found no reduction in the rate of adverse outcomes. Differences in the duration of teamwork training and the degree of emphasis on deliberate practice of new skills (eg, with the use of simulation‐based training) likely explains the lack of consistent results.
Very little research has evaluated teamwork training in the general medical environment.69, 70 Sehgal and colleagues recently published an evaluation of the effect of teamwork training delivered to internal medicine residents, hospitalists, nurses, pharmacists, case managers, and social workers on medical services in 3 Northern California hospitals.69 The 4‐hour training sessions covered topical areas of safety culture, teamwork, and communication through didactics, videos, facilitated discussions, and small group role plays to practice new skills and behaviors. The intervention was rated highly among participants,69 and the training along with subsequent follow‐up interventions resulted in improved patient perceptions of teamwork and communication but had no impact on key patient outcomes.71
Interdisciplinary Rounds
Interdisciplinary rounds (IDR) have been used for many years as a means to assemble team members in a single location,7275 and the use of IDR has been associated with lower mortality among ICU patients.76 Interdisciplinary rounds may be particularly useful for clinical settings in which team members are traditionally dispersed in time and place, such as medical‐surgical units. Recent studies have evaluated the effect of structured inter‐disciplinary rounds (SIDR),77, 78 which combine a structured format for communication, similar to a daily goals‐of‐care form, with a forum for daily interdisciplinary meetings. Though no effect was seen on length of stay or cost, SIDR resulted in significantly higher ratings of the quality of collaboration and teamwork climate, and a reduction in the rate of AEs.79 Importantly, the majority of clinicians in the studies agreed that SIDR improved the efficiency of their work day, and expressed a desire that SIDR continue indefinitely. Many investigators have emphasized the importance of leadership during IDR, often by a medical director, nurse manager, or both.74, 77, 78
Summary of Interventions to Improve Teamwork
Localization of physicians increases the frequency of nurse‐physician communication, but is insufficient in creating a shared understanding of patients' plans of care. Providing structure for the discussion among team members (eg, daily goals of care forms and checklists) ensures that critical elements of the plan of care are communicated. Teamwork training is based upon a strong foundation of research both inside and outside of healthcare, and has demonstrated improved knowledge of teamwork principles, attitudes about the importance of teamwork, and overall safety climate. Creating a forum for team members to assemble and discuss their patients (eg, IDR) can overcome some of the unique barriers to collaboration in settings where members are dispersed in time and space. Leaders wishing to improve interdisciplinary teamwork should consider implementing a combination of complementary interventions. For example, localization may increase the frequency of team member interactions, the quality of which may be enhanced with teamwork training and reinforced with the use of structured communication tools and IDR. Future research should evaluate the effect of these combined interventions.
CONCLUSIONS
In summary, teamwork is critically important to provide safe and effective care. Important and unique barriers to teamwork exist in hospitals. We recommend the use of survey instruments, such as those mentioned earlier, as the most feasible method to assess teamwork in the general medical setting. Because each intervention addresses only a portion of the barriers to optimal teamwork, we encourage leaders to use a multifaceted approach. We recommend the implementation of a combination of interventions with adaptations to fit unique clinical settings and local culture.
Acknowledgements
This manuscript was prepared as part of the High Performance Teams and the Hospital of the Future project, a collaborative effort including senior leadership from the American College of Physician Executives, the American Hospital Association, the American Organization of Nurse Executives, and the Society of Hospital Medicine. The authors thank Taylor Marsh for her administrative support and help in coordinating project meetings.
- To Err Is Human: Building a Safer Health System.Washington, DC:Institute of Medicine;1999.
- ,,,,,.Temporal trends in rates of patient harm resulting from medical care.N Engl J Med.2010;363(22):2124–2134.
- ,,.Exploring the causes of adverse events in NHS hospital practice.J R Soc Med.2001;94(7):322–330.
- ,,,,,.The Quality in Australian Health Care Study.Med J Aust.1995;163(9):458–471.
- ,,.Communication failures: an insidious contributor to medical mishaps.Acad Med.2004;79(2):186–194.
- Improving America's Hospitals: The Joint Commission's Annual Report on Quality and Safety 2007. Available at: http://www.jointcommissionreport.org. Accessed November2007.
- ,,.Patient perceptions of coordinated care: the importance of organized communication in hospitals.J Healthc Qual.1999;21(5):18–23.
- ,,.Am I safe here? Improving patients' perceptions of safety in hospitals.J Nurs Care Qual.2006;21(1):30–40.
- ,,.Teamwork culture and patient satisfaction in hospitals.Med Care.2004;42(5):492–498.
- ,,.The influence of teamwork culture on physician and nurse resignation rates in hospitals.Health Serv Manage Res.2008;21(1):23–31.
- ,,.Quantifying the economic impact of communication inefficiencies in U.S. hospitals.J Healthc Manag.2010;55(4):265–282.
- ,.Managing the Unexpected: Assuring High Performance in an Age of Complexity.San Francisco, CA:Jossey‐Bass;2001.
- .Some characteristics of high reliability organizations.Organization Science.1990;1(2):160–177.
- ,,.Teamwork as an essential component of high‐reliability organizations.Health Serv Res.2006;41(4 pt 2):1576–1598.
- ,,,.Promoting health care safety through training high reliability teams.Qual Saf Health Care.2005;14(4):303–309.
- ,,,,,.Analyzing the time and value of housestaff inpatient work.J Gen Intern Med.1998;13(8):534–540.
- ,,, et al.Quantifying nursing workflow in medication administration.J Nurs Adm.2008;38(1):19–26.
- ,,.How hospitalists spend their time: insights on efficiency and safety.J Hosp Med.2006;1(2):88–93.
- ,,,,.Redesigning residency education in internal medicine: a position paper from the Association of Program Directors in Internal Medicine.Ann Intern Med.2006;144(12):920–926.
- ,,,.Hospitalists' perceptions of their residency training needs: results of a national survey.Am J Med.2001;111(3):247–254.
- ,,.Redesigning training for internal medicine.Ann Intern Med.2006;144(12):927–932.
- ,,,,.The role of teamwork in the professional education of physicians: current status and assessment recommendations.Jt Comm J Qual Patient Saf.2005;31(4):185–202.
- ,,.Is there a “big five” in teamwork?Small Group Research.2005;36:555–599.
- ,,.Objective measures of situation awareness in a simulated medical environment.Qual Saf Health Care.2004;13(suppl 1):i65–i71.
- ,.What do we know about health care team effectiveness? A review of the literature.Med Care Res Rev.2006;63(3):263–300.
- ,,, et al.Does team training improve team performance? A meta‐analysis.Hum Factors.2008;50(6):903–933.
- ,,,,,.Can we talk? Priorities for patient care differed among health care providers. AHRQ Publication No. 05–0021‐1.Rockville, MD:Agency for Healthcare Research and Quality;2005.
- ,,, et al.Patterns of nurse–physicians communication and agreement on the plan of care.Qual Saf Health Care.2010;19:195–199.
- ,,,,.Interns overestimate the effectiveness of their hand‐off communication.Pediatrics.2010;125(3):491–496.
- ,.Speakers' overestimation of their effectiveness.Psychol Sci.2002;13(3):207–212.
- ,,, et al.Operating room teamwork among physicians and nurses: teamwork in the eye of the beholder.J Am Coll Surg.2006;202(5):746–752.
- ,,.Discrepant attitudes about teamwork among critical care nurses and physicians.Crit Care Med.2003;31(3):956–959.
- ,,,,,.Teamwork on inpatient medical units: assessing attitudes and barriers.Qual Saf Health Care.2010;19(2):117–121.
- ,,.Error, stress, and teamwork in medicine and aviation: cross sectional surveys.BMJ.2000;320(7237):745–749.
- ,,,,.Impact of a computerized physician order entry system on nurse‐physician collaboration in the medication process.Int J Med Inform.2008;77(11):735–744.
- ,,,,.Alphanumeric paging in an academic hospital setting.Am J Surg.2006;191(4):561–565.
- ,,,.Implementation and evaluation of an alpha‐numeric paging system on a resident inpatient teaching service.J Hosp Med.2009;4(8):E34–E40.
- ,,, et al.The use of smartphones for clinical communication on internal medicine wards.J Hosp Med.2010;5(9):553–559.
- ,.Organizational information requirements, media richness, and structural design.Management Science.1986;32(5):554–571.
- ,.Decoding of inconsistent communications of personality and social psychology.J Pers Soc Psychol.1967;6(1):109–114.
- ,,,,.Beyond paging: building a Web‐based communication tool for nurses and physicians.J Gen Intern Med.2009;24(1):105–110.
- ,,, et al.Frequency and clinical importance of pages sent to the wrong physician.Arch Intern Med.2009;169(11):1072–1073.
- ,,, et al.Evaluation of resident communication skills and professionalism: a matter of perspective?Pediatrics.2006;118(4):1371–1379.
- ,,, et al.Effect of multisource feedback on resident communication skills and professionalism: a randomized controlled trial.Arch Pediatr Adolesc Med.2007;161(1):44–49.
- .Multisource feedback in the assessment of physician competencies.J Contin Educ Health Prof.2003;23(1):4–12.
- ,.Reliability of a 360‐degree evaluation to assess resident competence.Am J Phys Med Rehabil.2007;86(10):845–852.
- ,,,.Pilot study of a 360‐degree assessment instrument for physical medicine 82(5):394–402.
- ,,,,,.Anaesthetists' Non‐Technical Skills (ANTS): evaluation of a behavioural marker system.Br J Anaesth.2003;90(5):580–588.
- ,,,.Using the Communication and Teamwork Skills (CATS) Assessment to measure health care team performance.Jt Comm J Qual Patient Saf.2007;33(9):549–558.
- ,,, et al.The Mayo High Performance Teamwork Scale: reliability and validity for evaluating key crew resource management skills.Simul Healthc.2007;2(1):4–10.
- ,,,,,.Reliability of a revised NOTECHS scale for use in surgical teams.Am J Surg.2008;196(2):184–190.
- ,,,,,.Observational teamwork assessment for surgery: construct validation with expert versus novice raters.Ann Surg.2009;249(6):1047–1051.
- ,,, et al.The Safety Attitudes Questionnaire: psychometric properties, benchmarking data, and emerging research.BMC Health Serv Res.2006;6:44.
- .Development of an instrument to measure collaboration and satisfaction about care decisions.J Adv Nurs.1994;20(1):176–182.
- ,,,,,.Psychometric properties of an attitude scale measuring physician‐nurse collaboration.Eval Health Prof.1999;22(2):208–220.
- ,,, et al.Impact of localizing physicians to hospital units on nurse‐physician communication and agreement on the plan of care.J Gen Intern Med.2009;24(11):1223–1227.
- ,,,,,.Improving communication in the ICU using daily goals.J Crit Care.2003;18(2):71–75.
- ,,,,.Improving nurse‐physician communication and satisfaction in the intensive care unit with a daily goals worksheet.Am J Crit Care.2006;15(2):217–222.
- ,,, et al.A surgical safety checklist to reduce morbidity and mortality in a global population.N Engl J Med.2009;360(5):491–499.
- ,,, et al.Effect of crew resource management training in a multidisciplinary obstetrical setting.Int J Qual Health Care.2008;20(4):254–263.
- ,,, et al.Error reduction and performance improvement in the emergency department through formal teamwork training: evaluation results of the MedTeams project.Health Serv Res.2002;37(6):1553–1581.
- ,,, et al.Effects of teamwork training on adverse outcomes and process of care in labor and delivery: a randomized controlled trial.Obstet Gynecol.2007;109(1):48–55.
- ,,,,.Medical Teamwork and Patient Safety: The Evidence‐Based Relation.Rockville, MD:Agency for Healthcare Research and Quality;2005.
- Agency for Healthcare Research and Quality. TeamSTEPPS Home. Available at: http://teamstepps.ahrq.gov/index.htm. Accessed January 18,2010.
- ,.TeamSTEPPS: assuring optimal teamwork in clinical settings.Am J Med Qual.2007;22(3):214–217.
- ,,,.Does crew resource management training work? An update, an extension, and some critical needs.Hum Factors.2006;48(2):392–412.
- ,,, et al.Improving neonatal outcome through practical shoulder dystocia training.Obstet Gynecol.2008;112(1):14–20.
- ,,, et al.Retrospective cohort study of diagnosis‐delivery interval with umbilical cord prolapse: the effect of team training.Br J Obstet Gynaecol.2009;116(8):1089–1096.
- ,,, et al.A multidisciplinary teamwork training program: the Triad for Optimal Patient Safety (TOPS) experience.J Gen Intern Med.2008;23(12):2053–2057.
- ,,,,.Teambuilding and leadership training in an internal medicine residency training program.J Gen Intern Med.2004;19(6):692–697.
- ,,, et al. Effects of a multicenter teamwork and communication program on patient outcomes: results from the Triad for Optimal Patient Safety (TOPS) project. In press.
- ,,, et al.The effect of a multidisciplinary hospitalist/physician and advanced practice nurse collaboration on hospital costs.J Nurs Adm.2006;36(2):79–85.
- ,,.A firm trial of interdisciplinary rounds on the inpatient medical wards: an intervention designed using continuous quality improvement.Med Care.1998;36(8 suppl):AS4–A12.
- ,,,,.Use of multidisciplinary rounds to simultaneously improve quality outcomes, enhance resident education, and shorten length of stay.J Gen Intern Med.2007;22(8):1073–1079.
- ,,,.Effect of a multidisciplinary intervention on communication and collaboration among physicians and nurses.Am J Crit Care.2005;14(1):71–77.
- ,,,,.The effect of multidisciplinary care teams on intensive care unit mortality.Arch Intern Med.2010;170(4):369–376.
- ,,,,,.Improving teamwork: impact of structured interdisciplinary rounds on a hospitalist unit.J Hosp Med.2011;6(2):88–93.
- ,,,,,.Improving teamwork: impact of structured interdisciplinary rounds on a medical teaching unit.J Gen Intern Med.2010;25(8):826–832.
- ,,, et al.Structured interdisciplinary rounds in a medical teaching unit: improving patient safety.Arch Intern Med.2011;171(7):678–684.
Teamwork is important in providing high‐quality hospital care. Despite tremendous efforts in the 10 years since publication of the Institute of Medicine's To Err is Human report,1 hospitalized patients remain at risk for adverse events (AEs).2 Although many AEs are not preventable, a large portion of those which are identified as preventable can be attributed to communication and teamwork failures.35 A Joint Commission study indicated that communication failures were the root cause for two‐thirds of the 3548 sentinel events reported from 1995 to 2005.6 Another study, involving interviews of resident physicians about recent medical mishaps, found that communication failures contributed to 91% of the AEs they reported.5
Teamwork also plays an important role in other aspects of hospital care delivery. Patients' ratings of nurse‐physician coordination correlate with their overall perception of the quality of care received.7, 8 A study of Veterans Health Administration (VHA) hospitals found that teamwork culture was significantly and positively associated with overall patient satisfaction.9 Another VHA study found that hospitals with higher teamwork culture ratings had lower nurse resignations rates.10 Furthermore, poor teamwork within hospitals may have an adverse effect on financial performance, as a result of inefficiencies in physician and nurse workflow.11
Some organizations are capable of operating in complex, hazardous environments while maintaining exceptional performance over long periods of time. These high reliability organizations (HRO) include aircraft carriers, air traffic control systems, and nuclear power plants, and are characterized by their preoccupation with failure, reluctance to simplify interpretations, sensitivity to operations, commitment to resilience, and deference to expertise.12, 13 Preoccupation with failure is manifested by an organization's efforts to avoid complacency and persist in the search for additional risks. Reluctance to simplify interpretations is exemplified by an interest in pursuing a deep understanding of the issues that arise. Sensitivity to operations is the close attention paid to input from front‐line personnel and processes. Commitment to resilience relates to an organization's ability to contain errors once they occur and mitigate harm. Deference to expertise describes the practice of having authority migrate to the people with the most expertise, regardless of rank. Collectively, these qualities produce a state of mindfulness, allowing teams to anticipate and become aware of unexpected events, yet also quickly contain and learn from them. Recent publications have highlighted the need for hospitals to learn from HROs and the teams within them.14, 15
Recognizing the importance of teamwork in hospitals, senior leadership from the American College of Physician Executives (ACPE), the American Hospital Association (AHA), the American Organization of Nurse Executives (AONE), and the Society of Hospital Medicine (SHM) established the High Performance Teams and the Hospital of the Future project. This collaborative learning effort aims to redesign care delivery to provide optimal value to hospitalized patients. As an initial step, the High Performance Teams and the Hospital of the Future project team completed a literature review related to teamwork in hospitals. The purpose of this report is to summarize the current understanding of teamwork, describe interventions designed to improve teamwork, and make practical recommendations for hospitals to assess and improve teamwork‐related performance. We approach teamwork from the hospitalized patient's perspective, and restrict our discussion to interactions occurring among healthcare professionals within the hospital. We recognize the importance of teamwork at all points in the continuum of patient care. Highly functional inpatient teams should be integrated into an overall system of coordinated and collaborative care.
TEAMWORK: DEFINITION AND CONSTRUCTS
Physicians, nurses, and other healthcare professionals spend a great deal of their time on communication and coordination of care activities.1618 In spite of this and the patient safety concerns previously noted, interpersonal communication skills and teamwork have been historically underemphasized in professional training.1922 A team is defined as 2 or more individuals with specified roles interacting adaptively, interdependently, and dynamically toward a shared and common goal.23 Elements of effective teamwork have been identified through research conducted in aviation, the military, and more recently, healthcare. Salas and colleagues have synthesized this research into 5 core components: team leadership, mutual performance monitoring, backup behavior, adaptability, and team orientation (see Table 1).23 Additionally, 3 supporting and coordinating mechanisms are essential for effective teamwork: shared mental model, closed‐loop communication, and mutual trust (see Table 1).23 High‐performing teams use these elements to develop a culture for speaking up, and situational awareness among team members. Situational awareness refers to a person's perception and understanding of their dynamic environment, and human errors often result from a lack of such awareness.24 These teamwork constructs provide the foundational basis for understanding how hospitals can identify teamwork challenges, assess team performance, and design effective interventions.
| Teamwork | Definition | Behavioral Examples |
|---|---|---|
| ||
| Component | ||
| Team leadership | The leader directs and coordinates team members activities | Facilitate team problem solving; |
| Provide performance expectations; | ||
| Clarify team member roles; | ||
| Assist in conflict resolution | ||
| Mutual performance monitoring | Team members are able to monitor one another's performance | Identify mistakes and lapses in other team member actions; |
| Provide feedback to fellow team members to facilitate self‐correction | ||
| Backup behavior | Team members anticipate and respond to one another's needs | Recognize workload distribution problem; |
| Shift work responsibilities to underutilized members | ||
| Adaptability | The team adjusts strategies based on new information | Identify cues that change has occurred and develop plan to deal with changes; |
| Remain vigilant to change in internal and external environment | ||
| Team orientation | Team members prioritize team goals above individual goals | Take into account alternate solutions by teammates; |
| Increased task involvement, information sharing, and participatory goal setting | ||
| Coordinating mechanism | ||
| Shared mental model | An organizing knowledge of the task of the team and how members will interact to achieve their goal | Anticipate and predict each other's needs; |
| Identify changes in team, task, or teammates | ||
| Closed‐loop communication | Acknowledgement and confirmation of information received | Follow up with team members to ensure message received; |
| Acknowledge that message was received; | ||
| Clarify information received | ||
| Mutual trust | Shared belief that team members will perform their roles | Share information; |
| Willingly admit mistakes and accept feedback | ||
CHALLENGES TO EFFECTIVE TEAMWORK
Several important and unique barriers to teamwork exist in hospitals. Teams are large and formed in an ad hoc fashion. On a given day, a patient's hospital team might include a hospitalist, a nurse, a case manager, a pharmacist, and 1 or more consulting physicians and therapists. Team members in each respective discipline care for multiple patients at the same time, yet few hospitals align team membership (ie, patient assignment). Therefore, a nurse caring for 4 patients may interact with 4 different hospitalists. Similarly, a hospitalist caring for 14 patients may interact with multiple nurses in a given day. Team membership is ever changing because hospital professionals work in shifts and rotations. Finally, team members are seldom in the same place at the same time because physicians often care for patients on multiple units and floors, while nurses and other team members are often unit‐based. Salas and others have noted that team size, instability, and geographic dispersion of membership serve as important barriers to improving teamwork.25, 26 As a result of these barriers, nurses and physicians do not communicate consistently, and often disagree on the daily plan of care for their patients.27, 28 When communication does occur, clinicians may overestimate how well their messages are understood by other team members, reflecting a phenomenon well known in communication psychology related to egocentric thought processes.29, 30
The traditionally steep hierarchy within medicine may also serve as a barrier to teamwork. Studies in intensive care units (ICUs), operating rooms, and general medical units reveal widely discrepant views on the quality of collaboration and communication between healthcare professionals.3133 Although physicians generally give high ratings to the quality of collaboration with nurses, nurses consistently rate the quality of collaboration with physicians as poor. Similarly, specialist physicians rate collaboration with hospitalists higher than hospitalists rate collaboration with specialists.33 Effective teams in other high‐risk industries, like aviation, strive to flatten hierarchy so that team members feel comfortable raising concerns and engaging in open and respectful communications.34
The effect of technology on communication practices and teamwork is complex and incompletely understood. The implementation of electronic heath records and computerized provider order entry systems fundamentally changes work‐flow, and may result in less synchronization and feedback during nurse‐physician collaboration.35 Similarly, the expanded use of text messages delivered via alphanumeric paging or mobile phone results in a transition toward asynchronous modes of communication. These asynchronous modes allow healthcare professionals to review and respond to messages at their convenience, and may reduce unnecessary interruptions. Research shows that these systems are popular among clinicians.3638 However, receipt and understanding of the intended message may not be confirmed with the use of asynchronous modes of communication. Moreover, important face‐to‐face communication elements (tone of voice, expression, gesture, eye contract)39, 40 are lacking. One promising approach is a system which sends low‐priority messages to a Web‐based task list for periodic review, while allowing higher priority messages to pass through to an alphanumeric pager and interrupt the intended recipient.41 Another common frustration in hospitals, despite advancing technology, is difficulty identifying the correct physician(s) and nurse(s) caring for a particular patient at a given point in time.33 Wong and colleagues found that 14% of pages in their hospital were initially sent to the wrong physician.42
ASSESSMENT OF TEAMWORK
One of the challenges in improving teamwork is the difficulty in measuring it. Teamwork assessment entails measuring the performance of teams composed of multiple individuals. Methods of teamwork assessment can be broadly categorized as self assessment, peer assessment, direct observation, survey of team climate or culture, and measurement of the outcome of effective teamwork. While self‐report tools are easy to administer and can capture affective components influencing team performance, they may not reflect actual skills on the part of individuals or teams. Peer assessment includes the use of 360‐degree evaluations or multisource feedback, and provides an evaluation of individual performance.4347
Direct observation provides a more accurate assessment of team‐related behaviors using trained observers. Observers use checklists and/or behaviorally anchored rating scales (BARS) to evaluate individual and team performance. A number of BARS have been developed and validated for the evaluation of team performance.4852 Of note, direct observation may be difficult in settings in which team members are not in the same place at the same time. An alternative method, which may be better suited for general medical units, is the use of survey instruments designed to assess attitudes and teamwork climate.5355 Importantly, higher survey ratings of collaboration and teamwork have been associated with better patient outcomes in observational studies.5658
The ultimate goal of teamwork efforts is to improve patient outcomes. Because patient outcomes are affected by a number of factors and because hospitals frequently engage in multiple, simultaneous efforts to improve care, it is often difficult to clearly link improved outcomes with teamwork interventions. Continued efforts to rigorously evaluate teamwork interventions should remain a priority, particularly as the cost of these interventions must be weighed against other interventions and investments.
EXAMPLES OF SUCCESSFUL INTERVENTIONS
A number of interventions have been used to improve teamwork in hospitals (see Table 2).
| Intervention | Advantages | Disadvantages |
|---|---|---|
| Localization of physicians | Increases frequency of nurse‐physician communication; provides foundation for additional interventions | Insufficient in creating a shared mental model; does not specifically enhance communication skills |
| Daily goals‐of‐care forms and checklists | Provides structure to interdisciplinary discussions and ensures input from all team members | May be completed in a perfunctory manner and may not be updated as plans of care evolve |
| Teamwork training | Emphasizes improved communication behaviors relevant across a range of team member interactions | Requires time and deliberate practice of new skills; effect may be attenuated if members are dispersed. |
| Interdisciplinary rounds | Provides a forum for regular interdisciplinary communication | Requires leadership to organize discussion and does not address need for updates as plans of care evolve |
Geographic Localization of Physicians
As mentioned earlier, physicians in large hospitals may care for patients on multiple units or floors. Designating certain physicians to care for patients admitted to specific units may improve efficiency and communication among healthcare professionals. One study recently reported on the effect of localization of hospital physicians to specific patient care units. Localization resulted in an increase in the rate of nurse‐physician communication, but did not improve providers' shared understanding of the plan of care.56 Notably, localizing physicians may improve the feasibility of additional interventions, like teamwork training and interdisciplinary rounds.
Daily Goals of Care and Surgery Safety Checklists
In ICU and operating room settings, physicians and nurses work in proximity, allowing interdisciplinary discussions to occur at the bedside. The finding that professionals in ICUs and operating rooms have widely discrepant views on the quality of collaboration31, 32 indicates that proximity, alone, is not sufficient for effective communication. Pronovost et al. used a daily goals form for bedside ICU rounds in an effort to standardize communication about the daily plan of care.57 The form defined essential goals of care for patients, and its use resulted in a significant improvement in the team's understanding of the daily goals. Narasimhan et al. performed a similar study using a daily goals worksheet during ICU rounds,58 and also found a significant improvement in physicians' and nurses' ratings of their understanding of the goals of care. The forms used in these studies provided structure to the interdisciplinary conversations during rounds to create a shared understanding of patients' plans of care.
Haynes and colleagues recently reported on the use of a surgical safety checklist in a large, multicenter pre‐post study.59 The checklist consisted of verbal confirmation of the completion of basic steps essential to safe care in the operating room, and provided structure to communication among surgical team members to ensure a shared understanding of the operative plan. The intervention resulted in a significant reduction in inpatient complications and mortality.
Team Training
Formalized team training, based on crew resource management, has been studied as a potential method to improve teamwork in a variety of medical settings.6062 Training emphasizes the core components of successful teamwork and essential coordinating mechanisms previously mentioned.23 Team training appears to positively influence culture, as assessed by teamwork and patient safety climate survey instruments.60 Based on these findings and extensive research demonstrating the success of teamwork training in aviation,63 the Agency for Healthcare Research and Quality (AHRQ) and the Department of Defense (DoD) have partnered in offering the Team Strategies and Tools to Enhance Performance and Patient Safety (TeamSTEPPS) program, designed to improve teamwork skills for healthcare professionals.64, 65
Only a handful of studies have evaluated the effectiveness of teamwork training programs on patient outcomes, and the results are mixed.66 Morey et al. found a reduction in the rate of observed errors as a result of teamwork training in emergency departments, but observers in the study were not blinded with regard to whether teams had undergone training.61 A research group in the United Kingdom evaluated the benefit of simulation‐based team training on outcomes in an obstetrical setting.67, 68 Training included management of specific complications, including shoulder dystocia and uterine cord prolapse. Using retrospective chart review, the investigators found a significant reduction in the proportion of babies born with an obstetric brachial palsy injury and a reduction in the time from diagnosis of uterine cord prolapse to infant delivery. Nielsen and colleagues also evaluated the use of teamwork training in an obstetric setting.62 In a cluster randomized controlled trial, the investigators found no reduction in the rate of adverse outcomes. Differences in the duration of teamwork training and the degree of emphasis on deliberate practice of new skills (eg, with the use of simulation‐based training) likely explains the lack of consistent results.
Very little research has evaluated teamwork training in the general medical environment.69, 70 Sehgal and colleagues recently published an evaluation of the effect of teamwork training delivered to internal medicine residents, hospitalists, nurses, pharmacists, case managers, and social workers on medical services in 3 Northern California hospitals.69 The 4‐hour training sessions covered topical areas of safety culture, teamwork, and communication through didactics, videos, facilitated discussions, and small group role plays to practice new skills and behaviors. The intervention was rated highly among participants,69 and the training along with subsequent follow‐up interventions resulted in improved patient perceptions of teamwork and communication but had no impact on key patient outcomes.71
Interdisciplinary Rounds
Interdisciplinary rounds (IDR) have been used for many years as a means to assemble team members in a single location,7275 and the use of IDR has been associated with lower mortality among ICU patients.76 Interdisciplinary rounds may be particularly useful for clinical settings in which team members are traditionally dispersed in time and place, such as medical‐surgical units. Recent studies have evaluated the effect of structured inter‐disciplinary rounds (SIDR),77, 78 which combine a structured format for communication, similar to a daily goals‐of‐care form, with a forum for daily interdisciplinary meetings. Though no effect was seen on length of stay or cost, SIDR resulted in significantly higher ratings of the quality of collaboration and teamwork climate, and a reduction in the rate of AEs.79 Importantly, the majority of clinicians in the studies agreed that SIDR improved the efficiency of their work day, and expressed a desire that SIDR continue indefinitely. Many investigators have emphasized the importance of leadership during IDR, often by a medical director, nurse manager, or both.74, 77, 78
Summary of Interventions to Improve Teamwork
Localization of physicians increases the frequency of nurse‐physician communication, but is insufficient in creating a shared understanding of patients' plans of care. Providing structure for the discussion among team members (eg, daily goals of care forms and checklists) ensures that critical elements of the plan of care are communicated. Teamwork training is based upon a strong foundation of research both inside and outside of healthcare, and has demonstrated improved knowledge of teamwork principles, attitudes about the importance of teamwork, and overall safety climate. Creating a forum for team members to assemble and discuss their patients (eg, IDR) can overcome some of the unique barriers to collaboration in settings where members are dispersed in time and space. Leaders wishing to improve interdisciplinary teamwork should consider implementing a combination of complementary interventions. For example, localization may increase the frequency of team member interactions, the quality of which may be enhanced with teamwork training and reinforced with the use of structured communication tools and IDR. Future research should evaluate the effect of these combined interventions.
CONCLUSIONS
In summary, teamwork is critically important to provide safe and effective care. Important and unique barriers to teamwork exist in hospitals. We recommend the use of survey instruments, such as those mentioned earlier, as the most feasible method to assess teamwork in the general medical setting. Because each intervention addresses only a portion of the barriers to optimal teamwork, we encourage leaders to use a multifaceted approach. We recommend the implementation of a combination of interventions with adaptations to fit unique clinical settings and local culture.
Acknowledgements
This manuscript was prepared as part of the High Performance Teams and the Hospital of the Future project, a collaborative effort including senior leadership from the American College of Physician Executives, the American Hospital Association, the American Organization of Nurse Executives, and the Society of Hospital Medicine. The authors thank Taylor Marsh for her administrative support and help in coordinating project meetings.
- To Err Is Human: Building a Safer Health System.Washington, DC:Institute of Medicine;1999.
- ,,,,,.Temporal trends in rates of patient harm resulting from medical care.N Engl J Med.2010;363(22):2124–2134.
- ,,.Exploring the causes of adverse events in NHS hospital practice.J R Soc Med.2001;94(7):322–330.
- ,,,,,.The Quality in Australian Health Care Study.Med J Aust.1995;163(9):458–471.
- ,,.Communication failures: an insidious contributor to medical mishaps.Acad Med.2004;79(2):186–194.
- Improving America's Hospitals: The Joint Commission's Annual Report on Quality and Safety 2007. Available at: http://www.jointcommissionreport.org. Accessed November2007.
- ,,.Patient perceptions of coordinated care: the importance of organized communication in hospitals.J Healthc Qual.1999;21(5):18–23.
- ,,.Am I safe here? Improving patients' perceptions of safety in hospitals.J Nurs Care Qual.2006;21(1):30–40.
- ,,.Teamwork culture and patient satisfaction in hospitals.Med Care.2004;42(5):492–498.
- ,,.The influence of teamwork culture on physician and nurse resignation rates in hospitals.Health Serv Manage Res.2008;21(1):23–31.
- ,,.Quantifying the economic impact of communication inefficiencies in U.S. hospitals.J Healthc Manag.2010;55(4):265–282.
- ,.Managing the Unexpected: Assuring High Performance in an Age of Complexity.San Francisco, CA:Jossey‐Bass;2001.
- .Some characteristics of high reliability organizations.Organization Science.1990;1(2):160–177.
- ,,.Teamwork as an essential component of high‐reliability organizations.Health Serv Res.2006;41(4 pt 2):1576–1598.
- ,,,.Promoting health care safety through training high reliability teams.Qual Saf Health Care.2005;14(4):303–309.
- ,,,,,.Analyzing the time and value of housestaff inpatient work.J Gen Intern Med.1998;13(8):534–540.
- ,,, et al.Quantifying nursing workflow in medication administration.J Nurs Adm.2008;38(1):19–26.
- ,,.How hospitalists spend their time: insights on efficiency and safety.J Hosp Med.2006;1(2):88–93.
- ,,,,.Redesigning residency education in internal medicine: a position paper from the Association of Program Directors in Internal Medicine.Ann Intern Med.2006;144(12):920–926.
- ,,,.Hospitalists' perceptions of their residency training needs: results of a national survey.Am J Med.2001;111(3):247–254.
- ,,.Redesigning training for internal medicine.Ann Intern Med.2006;144(12):927–932.
- ,,,,.The role of teamwork in the professional education of physicians: current status and assessment recommendations.Jt Comm J Qual Patient Saf.2005;31(4):185–202.
- ,,.Is there a “big five” in teamwork?Small Group Research.2005;36:555–599.
- ,,.Objective measures of situation awareness in a simulated medical environment.Qual Saf Health Care.2004;13(suppl 1):i65–i71.
- ,.What do we know about health care team effectiveness? A review of the literature.Med Care Res Rev.2006;63(3):263–300.
- ,,, et al.Does team training improve team performance? A meta‐analysis.Hum Factors.2008;50(6):903–933.
- ,,,,,.Can we talk? Priorities for patient care differed among health care providers. AHRQ Publication No. 05–0021‐1.Rockville, MD:Agency for Healthcare Research and Quality;2005.
- ,,, et al.Patterns of nurse–physicians communication and agreement on the plan of care.Qual Saf Health Care.2010;19:195–199.
- ,,,,.Interns overestimate the effectiveness of their hand‐off communication.Pediatrics.2010;125(3):491–496.
- ,.Speakers' overestimation of their effectiveness.Psychol Sci.2002;13(3):207–212.
- ,,, et al.Operating room teamwork among physicians and nurses: teamwork in the eye of the beholder.J Am Coll Surg.2006;202(5):746–752.
- ,,.Discrepant attitudes about teamwork among critical care nurses and physicians.Crit Care Med.2003;31(3):956–959.
- ,,,,,.Teamwork on inpatient medical units: assessing attitudes and barriers.Qual Saf Health Care.2010;19(2):117–121.
- ,,.Error, stress, and teamwork in medicine and aviation: cross sectional surveys.BMJ.2000;320(7237):745–749.
- ,,,,.Impact of a computerized physician order entry system on nurse‐physician collaboration in the medication process.Int J Med Inform.2008;77(11):735–744.
- ,,,,.Alphanumeric paging in an academic hospital setting.Am J Surg.2006;191(4):561–565.
- ,,,.Implementation and evaluation of an alpha‐numeric paging system on a resident inpatient teaching service.J Hosp Med.2009;4(8):E34–E40.
- ,,, et al.The use of smartphones for clinical communication on internal medicine wards.J Hosp Med.2010;5(9):553–559.
- ,.Organizational information requirements, media richness, and structural design.Management Science.1986;32(5):554–571.
- ,.Decoding of inconsistent communications of personality and social psychology.J Pers Soc Psychol.1967;6(1):109–114.
- ,,,,.Beyond paging: building a Web‐based communication tool for nurses and physicians.J Gen Intern Med.2009;24(1):105–110.
- ,,, et al.Frequency and clinical importance of pages sent to the wrong physician.Arch Intern Med.2009;169(11):1072–1073.
- ,,, et al.Evaluation of resident communication skills and professionalism: a matter of perspective?Pediatrics.2006;118(4):1371–1379.
- ,,, et al.Effect of multisource feedback on resident communication skills and professionalism: a randomized controlled trial.Arch Pediatr Adolesc Med.2007;161(1):44–49.
- .Multisource feedback in the assessment of physician competencies.J Contin Educ Health Prof.2003;23(1):4–12.
- ,.Reliability of a 360‐degree evaluation to assess resident competence.Am J Phys Med Rehabil.2007;86(10):845–852.
- ,,,.Pilot study of a 360‐degree assessment instrument for physical medicine 82(5):394–402.
- ,,,,,.Anaesthetists' Non‐Technical Skills (ANTS): evaluation of a behavioural marker system.Br J Anaesth.2003;90(5):580–588.
- ,,,.Using the Communication and Teamwork Skills (CATS) Assessment to measure health care team performance.Jt Comm J Qual Patient Saf.2007;33(9):549–558.
- ,,, et al.The Mayo High Performance Teamwork Scale: reliability and validity for evaluating key crew resource management skills.Simul Healthc.2007;2(1):4–10.
- ,,,,,.Reliability of a revised NOTECHS scale for use in surgical teams.Am J Surg.2008;196(2):184–190.
- ,,,,,.Observational teamwork assessment for surgery: construct validation with expert versus novice raters.Ann Surg.2009;249(6):1047–1051.
- ,,, et al.The Safety Attitudes Questionnaire: psychometric properties, benchmarking data, and emerging research.BMC Health Serv Res.2006;6:44.
- .Development of an instrument to measure collaboration and satisfaction about care decisions.J Adv Nurs.1994;20(1):176–182.
- ,,,,,.Psychometric properties of an attitude scale measuring physician‐nurse collaboration.Eval Health Prof.1999;22(2):208–220.
- ,,, et al.Impact of localizing physicians to hospital units on nurse‐physician communication and agreement on the plan of care.J Gen Intern Med.2009;24(11):1223–1227.
- ,,,,,.Improving communication in the ICU using daily goals.J Crit Care.2003;18(2):71–75.
- ,,,,.Improving nurse‐physician communication and satisfaction in the intensive care unit with a daily goals worksheet.Am J Crit Care.2006;15(2):217–222.
- ,,, et al.A surgical safety checklist to reduce morbidity and mortality in a global population.N Engl J Med.2009;360(5):491–499.
- ,,, et al.Effect of crew resource management training in a multidisciplinary obstetrical setting.Int J Qual Health Care.2008;20(4):254–263.
- ,,, et al.Error reduction and performance improvement in the emergency department through formal teamwork training: evaluation results of the MedTeams project.Health Serv Res.2002;37(6):1553–1581.
- ,,, et al.Effects of teamwork training on adverse outcomes and process of care in labor and delivery: a randomized controlled trial.Obstet Gynecol.2007;109(1):48–55.
- ,,,,.Medical Teamwork and Patient Safety: The Evidence‐Based Relation.Rockville, MD:Agency for Healthcare Research and Quality;2005.
- Agency for Healthcare Research and Quality. TeamSTEPPS Home. Available at: http://teamstepps.ahrq.gov/index.htm. Accessed January 18,2010.
- ,.TeamSTEPPS: assuring optimal teamwork in clinical settings.Am J Med Qual.2007;22(3):214–217.
- ,,,.Does crew resource management training work? An update, an extension, and some critical needs.Hum Factors.2006;48(2):392–412.
- ,,, et al.Improving neonatal outcome through practical shoulder dystocia training.Obstet Gynecol.2008;112(1):14–20.
- ,,, et al.Retrospective cohort study of diagnosis‐delivery interval with umbilical cord prolapse: the effect of team training.Br J Obstet Gynaecol.2009;116(8):1089–1096.
- ,,, et al.A multidisciplinary teamwork training program: the Triad for Optimal Patient Safety (TOPS) experience.J Gen Intern Med.2008;23(12):2053–2057.
- ,,,,.Teambuilding and leadership training in an internal medicine residency training program.J Gen Intern Med.2004;19(6):692–697.
- ,,, et al. Effects of a multicenter teamwork and communication program on patient outcomes: results from the Triad for Optimal Patient Safety (TOPS) project. In press.
- ,,, et al.The effect of a multidisciplinary hospitalist/physician and advanced practice nurse collaboration on hospital costs.J Nurs Adm.2006;36(2):79–85.
- ,,.A firm trial of interdisciplinary rounds on the inpatient medical wards: an intervention designed using continuous quality improvement.Med Care.1998;36(8 suppl):AS4–A12.
- ,,,,.Use of multidisciplinary rounds to simultaneously improve quality outcomes, enhance resident education, and shorten length of stay.J Gen Intern Med.2007;22(8):1073–1079.
- ,,,.Effect of a multidisciplinary intervention on communication and collaboration among physicians and nurses.Am J Crit Care.2005;14(1):71–77.
- ,,,,.The effect of multidisciplinary care teams on intensive care unit mortality.Arch Intern Med.2010;170(4):369–376.
- ,,,,,.Improving teamwork: impact of structured interdisciplinary rounds on a hospitalist unit.J Hosp Med.2011;6(2):88–93.
- ,,,,,.Improving teamwork: impact of structured interdisciplinary rounds on a medical teaching unit.J Gen Intern Med.2010;25(8):826–832.
- ,,, et al.Structured interdisciplinary rounds in a medical teaching unit: improving patient safety.Arch Intern Med.2011;171(7):678–684.
Hospitalist Time Motion Study
Hospital Medicine represents the fastest‐growing specialty in the history of medicine in the United States, with approximately 28,000 hospitalists now working in over half of American hospitals.1 Hospitalists increasingly fill the gap between demand for care of hospitalized patients and the deficit of physicians previously availableprimary care physicians in community hospitals and residents in teaching hospitals.2, 3 This growth has also been driven by hospitalists' ability to increase clinical efficiency. Research consistently demonstrates a reduction in overall costs and length of stay with the use of hospitalists.47 Additionally, many teaching hospitals have implemented nonteaching hospitalist services in an effort to comply with the Accreditation Council for Graduate Medicine Education (ACGME) program requirements regarding resident duty hours.8 Given the potential for improved clinical efficiency and the need to comply with revised ACGME program requirements, the Hospital Medicine Service at Northwestern Memorial Hospital (NMH) was established in 2003. Today, this service cares for more than half of hospitalized medical patients at NMH.
Although extensive research documents that implementation of a hospitalist program improves the efficiency of hospital care delivery,4, 6 there is little data to explain how hospitalists achieve this level of efficiency or how efficiency might be increased further. Several authors have suggested potential explanations for hospitalists' efficiency gains, but none has yet received strong empirical validation.5, 7 The only previously published study to directly observe more than a small portion of the activities of hospitalists was conducted at NMH in 2006.9 O'Leary et al. used time‐motion methodology to study ten hospitalists for 75 hours total. They found that hospitalists spend a large amount of time on communication when compared to nonhospitalist physicians. However, the study only reported partial information about how and with whom this communications was performed. Similarly, the authors reported that documentation occupied about a quarter of hospitalists' time, but did not report more detailed information about what was being documented and how. Additionally, they noted that hospitalists spent 21% of their time multitasking, but did not report what types of activities were performed during these episodes. Finally, at the time of that study hospitalists at NMH saw about 40% fewer patients per day than they do now. Increasing the number of patients each physician sees in a day is an obvious way to increase productivity, but it is unclear how this affects hospitalist workflow and time spent in various clinical activities.
Another important trend in hospital care delivery is the implementation of electronic medical records (EMR).10 NMH was just transitioning to a fully integrated EMR and computerized physician order entry (CPOE) system when the previous time‐motion study was performed. Now that the system is in place, a significant proportion of hospitalists' time has shifted from using a paper‐based record to sitting in front of a computer. However, we do not know exactly how hospitalists interact with the EMR and how this alters workflow; an increasingly important issue as hospitals across the U.S. implement EMRs at the behest of the federal government and aiming to improve patient safety.11
To better understand the workflow of hospitalists and validate the findings of the O'Leary study in a larger sample of hospitalists, we undertook this study seeking to collect data continuously for complete shifts, rather than sampling just a few hours at a time. We hypothesized that this would reduce observer effects and provide us with a more complete and accurate assessment of a day in the life of a hospitalist.
Methods
Study Site
The study was conducted at NMH, an 897‐bed tertiary care teaching hospital in Chicago, IL, and was approved by the Institutional Review Board of Northwestern University. Patients are admitted to the Hospital Medicine Service from the Emergency Department or directly from physicians' offices based on bed availability in a quasi‐randomized fashion. Hospitalists included in the study cared for patients without the assistance of housestaff physicians and worked 7 consecutive days while on service, usually followed by 7 consecutive days off service. During weeks on service, hospitalist shifts started at 7 AM and ended between 5 PM and 7 PM.
Data Collection Tool Development
To facilitate collection of detailed information sought for this study, we developed an electronic data collection tool. A systematic review of the medical literature on time studies performed by our research group indicated a lack of methodological standardization and dissimilar activity categorizations across studies.12 We attempted to develop a standardized method and data collection instrument for future studies, and first created a data dictionary consisting of a list of hospitalist activities and their descriptions. The initial components were drawn from prior time‐motion studies9, 13, 14 and input from experienced hospitalists (KJO and MVW). The activity list was then refined after a preliminary observation period in which five hospitalists were followed for a total of 6 shifts. Observers noted the specific activities being performed by the hospitalists and asked for explanations and clarification when necessary. In order for an activity to be included in the final list, the activity had to be easily observable and identifiable without subjective interpretation from the observer. The preliminary observation period ended once we were satisfied that no new activities were emerging.
The compiled list of activities was then broken down into related groups and separated into additional subcategories to increase the specificity of data collection. The final list of activities was reviewed by several experienced hospitalists to ensure completeness. The data dictionary was then loaded onto a Palm Pilot Tx using WorkStudy+ Plus software. The final activity list consisted of 8 main categories, 32 secondary categories, and 53 tertiary categories (See Appendix). To facilitate comparisons with prior studies, we followed the convention of including the categories of direct and indirect patient care. We defined direct patient care as those activities involving face‐to‐face interaction between the hospitalist and the patient. The more general indirect care category encompassed other categories of activity relevant to the patient's care but not performed in the presence of the patient (ie, professional communication, interaction with the EMR, and other patient related activities like searching for medical knowledge on the Internet or reading telemetry monitors).
Pilot Testing
We trained 6 observers in the use of the data collection tool. Each observer practiced shadowing for more than 20 hours with the tool before collecting study data. During this pilot testing phase we optimized the layout of the tool to facilitate rapid documentation of hospitalist activities and multitasking. Interobserver reliability was confirmed by having 2 observers shadow the same hospitalist for a three hour time period. In all cases, the observers obtained an average interclass correlation coefficient of at least 0.95 with a 95% confidence interval of .85 to 1.0 prior to collecting study data.
Study Design
Data collection occurred between July and September of 2008. A total of 24 hospitalists were observed, each for 2 complete weekday shifts starting at 7 AM and ending between 5 PM and 7 PM. Of note, we only observed hospitalists who were directly caring for patients and not part of a teaching service. Each hospitalist was contacted about the project at least a week prior to any observations and informed consent was obtained. A single observer shadowed a single hospitalist continuously, trading off with a new observer every 3 hours to avoid fatigue. To minimize any observation effect our data collectors were instructed not to initiate and to minimize conversation with the hospitalists. At the end of the hospitalist's shift the following data were tallied: the number of patients in the hospitalist's care at the beginning of the day, the number of patients discharged during the day, and the number of admissions. Patient load was determined by adding the number of admissions to the number of patients at the beginning of the day.
Data Analysis
Minutes were tallied for each of the categories and subcategories. Data is reported as percentages of total duration of observed activities (ie, including multitasking) unless otherwise specified. To explore the effect of patient volume on hospitalist workflow we performed t‐tests comparing the number of minutes hospitalists spent per patient in various activities on days with below average patient volume as compared to those with above average volume. Additionally, we performed a Wilcoxon two‐samples test to check for a difference in length of shift between these 2 groups.
Results
A total of 24 hospitalists were shadowed for a total of approximately 494 hours. For 43 of these hours a hospitalist was observed performing 2 tasks simultaneously, bringing the total duration of observed activities to 537 hours with multitasking. The hospitalists were a mean 34 1.1 years of age and 12 (50%) were female. Twenty (83%) had completed residency 2 or more years prior to the study, 2 (8%) had a year of hospitalist experience since residency, and the remaining 2 (8%) had just completed residency. Sixteen (67%) hospitalists were Asian or Pacific Islanders, 6 (25%) were White, and 2 (8%) were Black. The hospitalists cared for an average of 13.2 0.6 patients per shift and an average shift lasted 10 hours and 19 minutes 52 minutes.
Table 1 lists the mean percentage of time hospitalists spent on the various activities. Subjects spent the most time (34.1%) interacting with the EMR. Communication and direct care were the next most frequent activities at 25.9% and 17.4% of each shift respectively, followed by professional development (6.5%), travel (6.2%), personal time (5.6%), other indirect care (3.9%), and waiting (0.4%). The 3 subcategories included in indirect care time accounted for about 64% of all recorded activities.
| Main Category | % Total Observed Activities | (95% CI)* | Subcategory | % Main Category | (95% CI)* |
|---|---|---|---|---|---|
| |||||
| EMR* | 34.1 | (32.435.9) | |||
| Writing | 58.4 | (55.761.0) | |||
| Orders | 20.2 | (18.521.9) | |||
| Reading/reviewing | 19.4 | (17.321.5) | |||
| Other | 2.1 | (1.82.5) | |||
| Communication* | 25.9 | (24.427.4) | |||
| Outgoing call | 36.9 | (33.640.2) | |||
| Face to face | 28.1 | (25.231.0) | |||
| Incoming call | 14.4 | (12.616.3) | |||
| Sending page | 8.6 | (7.79.4) | |||
| Rounds | 3.8 | (1.85.8) | |||
| Receiving page | 3.4 | (2.94.0) | |||
| E‐mail | 2.9 | (1.83.9) | |||
| Reviewing page | 1.8 | (1.32.3) | |||
| Fax | 0.1 | (0.00.2) | |||
| Direct care | 17.4 | (15.918.9) | |||
| Professional Development | 6.5 | (4.48.5) | |||
| Travel | 6.2 | (5.66.7) | |||
| Personal | 5.7 | (4.17.2) | |||
| Other indirect care* | 3.9 | (3.44.4) | |||
| Wait | 0.4 | (0.20.5) | |||
Of the nearly 4 hours (233 minutes) per shift hospitalists spent using the EMR, the majority (58.4%) was spent documenting (See Table 1). Placing orders and reading/reviewing notes were nearly equal at 20.2% and 19.4% respectively, and other EMR activities took 2.1% of EMR time. Over half of the time (54.1%) hospitalists spent documenting in the EMR system was dedicated to progress notes. The remainder of effort was expended on writing histories and physicals (15.3%), discharge instructions (14.7%), discharge summaries (7.9%), sign‐outs (6.8%), and performing medication reconciliation (1.4%). Of the time spent reading and reviewing documents on the EMR, most was spent reviewing lab results (45.4%) or notes from the current admission (40.4%). Reviewing imaging studies occupied 8.1%, and notes from past encounters accounted for 6.2% of this category's time.
Various modes of communication were used during the nearly three hours (176 minutes) per shift dedicated to communication. Phone calls took up approximately half of the hospitalists' communication time, with 36.8% spent on outgoing calls and 14.2% incoming calls. Face‐to‐face communication was the next most common mode, accounting for 28.2% of the total. Time spent sending pages (8.8%), receiving pages (3.4%), and reviewing pages (1.8%) consumed 14% of all communication time. E‐mail and fax were used sparingly, at 3.1% and 0.1% of communication time, respectively. Finally, meetings involving other hospital staff (interdisciplinary rounds) occupied 3.4% of communication time.
The amount of time hospitalists spent communicating with specific types of individuals is shown in Table 2. Hospitalists spent the most time communicating with other physicians (44.5%) and nurses (18.1%). They spent less time communicating with people from the remaining categories; utilization staff (5.7%), patients' family members (5.6%), case managers (4.2%), primary care physicians (3.4%), ancillary staff (3.1%), and pharmacists (0.6%). Communication with other individuals that did not fit in the above categories accounted for 8.8%, and 5.3% of communication could not be clearly categorized, generally because the hospitalist was communicating by phone or text page and ascertaining with whom would have required significant interruption.
| Subcategory | % Main Category | (95% CI)* |
|---|---|---|
| ||
| Inpatient physician | 44.5 | (41.747.2) |
| Nursing staff | 18.0 | (16.019.9) |
| Other | 8.5 | (6.810.2) |
| Family | 5.8 | (4.07.7) |
| Utilization staff | 5.8 | (4.67.0) |
| Uncategorized | 5.7 | (3.77.6) |
| PCC | 4.0 | (2.35.7) |
| PCP | 3.6 | (2.74.5) |
| Ancillary staff | 2.9 | (2.23.7) |
| Pharmacy | 1.4 | (0.82.0) |
We found that 16% of all recorded activities occurred when another activity was also ongoing. This means that hospitalists were performing more than one activity for approximately 54 minutes per day, or about 9% of the average 10.3‐hour shift. Instances of multitasking occurred frequently, but were usually brief; the hospitalists performed 2 activities simultaneously an average of 75 times per day, but 79% of these occurrences lasted less than 1 minute. Of the 86 hours of multitasking activities recorded, 41% was communication time and another 41% was EMR use. This means that a second activity was being performed during 19% of the time hospitalists spent using the EMR and 26% of the time they spent communicating. Of the time spent on critical documentation activities like writing prescriptions and orders, 24% was recorded during a multitasking event.
The amount of time hospitalists spent per patient on days with above average patient volume as compared to those with below average patient volume is shown in Table 3. Hospitalists with above average patient numbers spent about 3 minutes less per patient interacting with the EMR (a 17% reduction; P < 0.01), and about 2 minutes less per patient communicating (a 14% reduction; P < 0.01). The average length of shift increased by 12 minutes on days when patient volume was above average; P < 0.05.
| Subcategory | Minutes: Below Average Census | (95% CI)* | Minutes: Above Average Census | (95% CI)* | Pr > |t| |
|---|---|---|---|---|---|
| |||||
| EMR | 19.12 | (17.5020.75) | 15.83 | (14.1717.49) | <.001 |
| Communication | 14.28 | (12.8615.71) | 12.21 | (11.0713.36) | 0.002 |
| Direct care | 9.30 | (8.1810.42) | 8.59 | (7.279.91) | 0.293 |
| Professional development | 4.09 | (2.365.81) | 2.57 | (1.263.89) | 0.026 |
| Personal | 3.52 | (2.394.65) | 2.05 | (1.292.82) | 0.032 |
| Travel | 3.32 | (2.863.79) | 2.93 | (2.643.22) | 0.566 |
| Other indirect care | 2.37 | (1.902.84) | 1.65 | (1.321.98) | 0.292 |
| Wait | 0.25 | (0.080.41) | 0.14 | (0.040.25) | 0.881 |
Discussion
To our knowledge, this study represents the largest time‐motion evaluation of hospitalist activities ever undertaken, and provides the most detailed assessment of hospitalists' activities when caring for patients without residents or medical students. We confirmed that hospitalists spend the majority of their time (64%) undertaking care activities away from the patient's bedside, and are involved in direct patient care contact only 17% of their time, averaging about 9 minutes per patient. The hospitalists spent about a quarter (26%) of their time communicating with others. Compared to other physicians, this is an unusually large amount of time. For example, Hollingsworth et al.15 found that emergency medicine physicians spent just half as much (13%) of their time on communication with other providers and staff. This may reflect hospitalists' central role in the coordination of consulting specialists. The other significant portion of hospitalists' effort focuses on documentation in the electronic medical record, with 22% of their time required for CPOE and note writing, and overall a third of their time (34.1%) committed to interacting with the EMR.
In many respects, our results confirm the findings of O'Leary et al.'s previous work. While this current study more precisely identified how hospitalists spend their time, the general proportions of times were similar. Both studies found that indirect care activities occupied about two‐thirds of hospitalists' time (64% in this study and 69% in the previous study). We also documented similar portions of total time for direct patient care (17% vs. 18%) and communication (26% vs. 24%). Interestingly, with complete implementation of the EMR system, the percentage of time spent on documentation appeared to decrease. O'Leary et al. reported that documentation accounted for 26% of hospitalists' time, while the equivalent activities (writing in the EMR or paper prescriptions) accounted for only 21% in the current study. Unfortunately, the significance of this finding is difficult to determine given the concurrent changes in patient volumes and the varying extent of EMR implementation during the earlier study.
Over half of hospitalists' communication time is spent either making or receiving phone calls. This suggests that efforts to facilitate communication (eg, use of mobile phone systems and voicemail) might enhance efficiency. Additionally, we found that nearly half of our hospitalists' communication was with other physicians. Not surprisingly, our study confirmed that an important part of hospitalists' work involves organizing and collaborating with a variety of specialists to provide optimal care for their patients.
Hospitalists spent a great deal of time multitasking. We found that multitasking time accounted for nearly 1 of every 10 minutes during the day. The most common combination of activities involved communication that occurred during a period of EMR use. These interruptions could have serious consequences should physicians lose track of what they are doing while ordering procedures or prescribing medications.
We documented a smaller portion of multitasking time than O'Leary's earlier study. This could be due to differences in how multitasking was defined or recorded in the 2 studies. Our electronic data collection tool allowed us to capture rapid task switching and multitasking to the second, rather than to the minute, as was done with the stopwatch and paper form used in the previous study. This precision was important, especially considering that nearly 80% of the recorded instances of multitasking lasted less than 1 minute.
Our data also suggests that patient census has significant effects on certain parts of hospitalist workflow. Patient volume for our subjects ranged from 10 to 19 patients per shift, with a mean of 13.2 patients. The amount of time our hospitalists spent with each patient did not differ significantly between above and below average census days. However, EMR time per patient was significantly reduced on above average census days. Anecdotally, several of our hospitalists suggested that on high census days they put off less time‐sensitive documentation activities like discharge summaries until after they leave the hospital and complete the work from home or on the following day. Thus, our study likely underestimates the total additional effort on high volume days, but unfortunately we had no direct way of quantifying work performed outside of the hospital or on subsequent days. Communication time was also significantly reduced when patient volumes were above average, suggesting that hospitalists had less time to confer with consultants or answer the questions of nurses and patient family members.
Several factors limit the interpretation and application of our findings. First, our study was conducted at a single urban, academic hospital, which may limit its applicability for hospitalists working at community hospitals. Given that more than 90% of hospital care in the U.S. occurs in the community hospital setting, research to confirm these findings in such hospitals is needed.16 Nonclinical research assistants collected all of the data, so the results may be limited by the accuracy of their interpretations. However, our extensive training and documentation of their accuracy serves as a strength of the study. Finally, we focused exclusively on daytime, weekday activities of hospitalists. Notably, 3 hospitalists work through the night at our facility, and 24‐hour coverage by hospitalists is increasingly common across the U.S. We expect weekend and night shift workflow to be somewhat different from standard day shifts due to the decreased availability of other medical providers for testing, consults, and procedures. Future research should focus on potential differences in activities on nights and weekends compared to weekdays.
This extensive, comprehensive analysis of hospitalist activities and workflow provides a foundation for future research and confirms much of O'Leary et al.'s original study. O'Leary's simpler approach of observing smaller blocks of time rather than full shifts proved effective; the two methodologies produced markedly similar results. The current study also offers some insight into matters of efficiency. We found that hospitalists with higher patient loads cut down on EMR and communication time. We also confirmed that hospitalists spend the largest portion of their time interacting with the EMR. A more efficient EMR system could therefore be especially helpful in providing more time for direct patient care and the communication necessary to coordinate care. Given that most hospitals provide financial support for hospital medicine programs (an average of $95,000 per hospitalist full‐time equivalent (FTE)1), hospital administrators have a keen interest in understanding how hospitalists might be more efficient. For example, if hospitalists could evaluate and manage two additional patients each day by exchanging time focused on medical record documentation for direct care activities, the cost of a hospitalist drops substantively. By understanding current hospitalist activities, efforts at redesigning their workflow can be more successful at addressing issues related to scheduling, communication, and compensation, thus improving the overall model of practice as well as the quality of patient care.17
Acknowledgements
We thank Caitlin Lawes and Stephen Williams for help with data collection, and all the hospitalists who participated in this study.
- Society of Hospital Medicine. About SHM.2008; http://www.hospitalmedicine.org/AM/Template.cfm?Section=About_SHM. Accessed April 2010.
- , .The evolution and future of hospital medicine.Mt Sinai J Med.2008;75(5):418–423.
- , , .Rehospitalizations among patients in the Fee‐for‐Service Medicare Program.N Engl J Med.2009;360(14):1418–1428.
- , , , , , .Outcomes of care by hospitalists, general internists, and family physicians.[see comment].N Engl J Med.2007;357(25):2589–2600.
- , .The hospitalist movement 5 years later.JAMA.2002;287:487–494.
- , .The impact of hospitalists on the cost and quality of inpatient care in the United States: a research synthesis.Med Care Res Rev.2005;62:379–406.
- .Hospitalists and the hospital medicine system of care are good for patient care.Arch Intern Med.2008;168(12):1254–1256; discussion 1259–1260.
- , .Hospitalists in teaching hospitals: opportunities but not without danger.J Gen Intern Med.2004;19:392–393.
- , , .How hospitalists spend their time: insights on efficiency and safety.J Hosp Med.2006;1(2):88–93.
- , , , et al.Use of electronic health records in U.S. hospitals.N Engl J Med.2009;360.
- .Electronic medical records at a crossroads: impetus for change or missed opportunity?JAMA.2009;302(10):1109–1111.
- , , , , .Systematic review of time studies evaluating physicians in the hospital setting.J Hosp Med.2010;5(6):000–000.
- , , , .All in a day's work: an observational study to quantify how and with whom doctors on hospital wards spend their time.Med J Aust.2008;188(9):506–509.
- , , , .Emergency department workplace interruptions: are emergency physicians “interrupt‐driven” and “multitasking”?Acad Emerg Med.2000;7:1239–1243.
- , , , , .How do physicians and nurses spend their time in the emergency department?Ann Emerg Med.1998;31(1):87–91.
- , , , , .The ecology of medical care revisited.N Engl J Med.2001;344(26):2021–2025.
- , .Organizing a hospitalist program: an overview of fundamental concepts.Med Clin North Am.2002;86(4):887–909.
Hospital Medicine represents the fastest‐growing specialty in the history of medicine in the United States, with approximately 28,000 hospitalists now working in over half of American hospitals.1 Hospitalists increasingly fill the gap between demand for care of hospitalized patients and the deficit of physicians previously availableprimary care physicians in community hospitals and residents in teaching hospitals.2, 3 This growth has also been driven by hospitalists' ability to increase clinical efficiency. Research consistently demonstrates a reduction in overall costs and length of stay with the use of hospitalists.47 Additionally, many teaching hospitals have implemented nonteaching hospitalist services in an effort to comply with the Accreditation Council for Graduate Medicine Education (ACGME) program requirements regarding resident duty hours.8 Given the potential for improved clinical efficiency and the need to comply with revised ACGME program requirements, the Hospital Medicine Service at Northwestern Memorial Hospital (NMH) was established in 2003. Today, this service cares for more than half of hospitalized medical patients at NMH.
Although extensive research documents that implementation of a hospitalist program improves the efficiency of hospital care delivery,4, 6 there is little data to explain how hospitalists achieve this level of efficiency or how efficiency might be increased further. Several authors have suggested potential explanations for hospitalists' efficiency gains, but none has yet received strong empirical validation.5, 7 The only previously published study to directly observe more than a small portion of the activities of hospitalists was conducted at NMH in 2006.9 O'Leary et al. used time‐motion methodology to study ten hospitalists for 75 hours total. They found that hospitalists spend a large amount of time on communication when compared to nonhospitalist physicians. However, the study only reported partial information about how and with whom this communications was performed. Similarly, the authors reported that documentation occupied about a quarter of hospitalists' time, but did not report more detailed information about what was being documented and how. Additionally, they noted that hospitalists spent 21% of their time multitasking, but did not report what types of activities were performed during these episodes. Finally, at the time of that study hospitalists at NMH saw about 40% fewer patients per day than they do now. Increasing the number of patients each physician sees in a day is an obvious way to increase productivity, but it is unclear how this affects hospitalist workflow and time spent in various clinical activities.
Another important trend in hospital care delivery is the implementation of electronic medical records (EMR).10 NMH was just transitioning to a fully integrated EMR and computerized physician order entry (CPOE) system when the previous time‐motion study was performed. Now that the system is in place, a significant proportion of hospitalists' time has shifted from using a paper‐based record to sitting in front of a computer. However, we do not know exactly how hospitalists interact with the EMR and how this alters workflow; an increasingly important issue as hospitals across the U.S. implement EMRs at the behest of the federal government and aiming to improve patient safety.11
To better understand the workflow of hospitalists and validate the findings of the O'Leary study in a larger sample of hospitalists, we undertook this study seeking to collect data continuously for complete shifts, rather than sampling just a few hours at a time. We hypothesized that this would reduce observer effects and provide us with a more complete and accurate assessment of a day in the life of a hospitalist.
Methods
Study Site
The study was conducted at NMH, an 897‐bed tertiary care teaching hospital in Chicago, IL, and was approved by the Institutional Review Board of Northwestern University. Patients are admitted to the Hospital Medicine Service from the Emergency Department or directly from physicians' offices based on bed availability in a quasi‐randomized fashion. Hospitalists included in the study cared for patients without the assistance of housestaff physicians and worked 7 consecutive days while on service, usually followed by 7 consecutive days off service. During weeks on service, hospitalist shifts started at 7 AM and ended between 5 PM and 7 PM.
Data Collection Tool Development
To facilitate collection of detailed information sought for this study, we developed an electronic data collection tool. A systematic review of the medical literature on time studies performed by our research group indicated a lack of methodological standardization and dissimilar activity categorizations across studies.12 We attempted to develop a standardized method and data collection instrument for future studies, and first created a data dictionary consisting of a list of hospitalist activities and their descriptions. The initial components were drawn from prior time‐motion studies9, 13, 14 and input from experienced hospitalists (KJO and MVW). The activity list was then refined after a preliminary observation period in which five hospitalists were followed for a total of 6 shifts. Observers noted the specific activities being performed by the hospitalists and asked for explanations and clarification when necessary. In order for an activity to be included in the final list, the activity had to be easily observable and identifiable without subjective interpretation from the observer. The preliminary observation period ended once we were satisfied that no new activities were emerging.
The compiled list of activities was then broken down into related groups and separated into additional subcategories to increase the specificity of data collection. The final list of activities was reviewed by several experienced hospitalists to ensure completeness. The data dictionary was then loaded onto a Palm Pilot Tx using WorkStudy+ Plus software. The final activity list consisted of 8 main categories, 32 secondary categories, and 53 tertiary categories (See Appendix). To facilitate comparisons with prior studies, we followed the convention of including the categories of direct and indirect patient care. We defined direct patient care as those activities involving face‐to‐face interaction between the hospitalist and the patient. The more general indirect care category encompassed other categories of activity relevant to the patient's care but not performed in the presence of the patient (ie, professional communication, interaction with the EMR, and other patient related activities like searching for medical knowledge on the Internet or reading telemetry monitors).
Pilot Testing
We trained 6 observers in the use of the data collection tool. Each observer practiced shadowing for more than 20 hours with the tool before collecting study data. During this pilot testing phase we optimized the layout of the tool to facilitate rapid documentation of hospitalist activities and multitasking. Interobserver reliability was confirmed by having 2 observers shadow the same hospitalist for a three hour time period. In all cases, the observers obtained an average interclass correlation coefficient of at least 0.95 with a 95% confidence interval of .85 to 1.0 prior to collecting study data.
Study Design
Data collection occurred between July and September of 2008. A total of 24 hospitalists were observed, each for 2 complete weekday shifts starting at 7 AM and ending between 5 PM and 7 PM. Of note, we only observed hospitalists who were directly caring for patients and not part of a teaching service. Each hospitalist was contacted about the project at least a week prior to any observations and informed consent was obtained. A single observer shadowed a single hospitalist continuously, trading off with a new observer every 3 hours to avoid fatigue. To minimize any observation effect our data collectors were instructed not to initiate and to minimize conversation with the hospitalists. At the end of the hospitalist's shift the following data were tallied: the number of patients in the hospitalist's care at the beginning of the day, the number of patients discharged during the day, and the number of admissions. Patient load was determined by adding the number of admissions to the number of patients at the beginning of the day.
Data Analysis
Minutes were tallied for each of the categories and subcategories. Data is reported as percentages of total duration of observed activities (ie, including multitasking) unless otherwise specified. To explore the effect of patient volume on hospitalist workflow we performed t‐tests comparing the number of minutes hospitalists spent per patient in various activities on days with below average patient volume as compared to those with above average volume. Additionally, we performed a Wilcoxon two‐samples test to check for a difference in length of shift between these 2 groups.
Results
A total of 24 hospitalists were shadowed for a total of approximately 494 hours. For 43 of these hours a hospitalist was observed performing 2 tasks simultaneously, bringing the total duration of observed activities to 537 hours with multitasking. The hospitalists were a mean 34 1.1 years of age and 12 (50%) were female. Twenty (83%) had completed residency 2 or more years prior to the study, 2 (8%) had a year of hospitalist experience since residency, and the remaining 2 (8%) had just completed residency. Sixteen (67%) hospitalists were Asian or Pacific Islanders, 6 (25%) were White, and 2 (8%) were Black. The hospitalists cared for an average of 13.2 0.6 patients per shift and an average shift lasted 10 hours and 19 minutes 52 minutes.
Table 1 lists the mean percentage of time hospitalists spent on the various activities. Subjects spent the most time (34.1%) interacting with the EMR. Communication and direct care were the next most frequent activities at 25.9% and 17.4% of each shift respectively, followed by professional development (6.5%), travel (6.2%), personal time (5.6%), other indirect care (3.9%), and waiting (0.4%). The 3 subcategories included in indirect care time accounted for about 64% of all recorded activities.
| Main Category | % Total Observed Activities | (95% CI)* | Subcategory | % Main Category | (95% CI)* |
|---|---|---|---|---|---|
| |||||
| EMR* | 34.1 | (32.435.9) | |||
| Writing | 58.4 | (55.761.0) | |||
| Orders | 20.2 | (18.521.9) | |||
| Reading/reviewing | 19.4 | (17.321.5) | |||
| Other | 2.1 | (1.82.5) | |||
| Communication* | 25.9 | (24.427.4) | |||
| Outgoing call | 36.9 | (33.640.2) | |||
| Face to face | 28.1 | (25.231.0) | |||
| Incoming call | 14.4 | (12.616.3) | |||
| Sending page | 8.6 | (7.79.4) | |||
| Rounds | 3.8 | (1.85.8) | |||
| Receiving page | 3.4 | (2.94.0) | |||
| E‐mail | 2.9 | (1.83.9) | |||
| Reviewing page | 1.8 | (1.32.3) | |||
| Fax | 0.1 | (0.00.2) | |||
| Direct care | 17.4 | (15.918.9) | |||
| Professional Development | 6.5 | (4.48.5) | |||
| Travel | 6.2 | (5.66.7) | |||
| Personal | 5.7 | (4.17.2) | |||
| Other indirect care* | 3.9 | (3.44.4) | |||
| Wait | 0.4 | (0.20.5) | |||
Of the nearly 4 hours (233 minutes) per shift hospitalists spent using the EMR, the majority (58.4%) was spent documenting (See Table 1). Placing orders and reading/reviewing notes were nearly equal at 20.2% and 19.4% respectively, and other EMR activities took 2.1% of EMR time. Over half of the time (54.1%) hospitalists spent documenting in the EMR system was dedicated to progress notes. The remainder of effort was expended on writing histories and physicals (15.3%), discharge instructions (14.7%), discharge summaries (7.9%), sign‐outs (6.8%), and performing medication reconciliation (1.4%). Of the time spent reading and reviewing documents on the EMR, most was spent reviewing lab results (45.4%) or notes from the current admission (40.4%). Reviewing imaging studies occupied 8.1%, and notes from past encounters accounted for 6.2% of this category's time.
Various modes of communication were used during the nearly three hours (176 minutes) per shift dedicated to communication. Phone calls took up approximately half of the hospitalists' communication time, with 36.8% spent on outgoing calls and 14.2% incoming calls. Face‐to‐face communication was the next most common mode, accounting for 28.2% of the total. Time spent sending pages (8.8%), receiving pages (3.4%), and reviewing pages (1.8%) consumed 14% of all communication time. E‐mail and fax were used sparingly, at 3.1% and 0.1% of communication time, respectively. Finally, meetings involving other hospital staff (interdisciplinary rounds) occupied 3.4% of communication time.
The amount of time hospitalists spent communicating with specific types of individuals is shown in Table 2. Hospitalists spent the most time communicating with other physicians (44.5%) and nurses (18.1%). They spent less time communicating with people from the remaining categories; utilization staff (5.7%), patients' family members (5.6%), case managers (4.2%), primary care physicians (3.4%), ancillary staff (3.1%), and pharmacists (0.6%). Communication with other individuals that did not fit in the above categories accounted for 8.8%, and 5.3% of communication could not be clearly categorized, generally because the hospitalist was communicating by phone or text page and ascertaining with whom would have required significant interruption.
| Subcategory | % Main Category | (95% CI)* |
|---|---|---|
| ||
| Inpatient physician | 44.5 | (41.747.2) |
| Nursing staff | 18.0 | (16.019.9) |
| Other | 8.5 | (6.810.2) |
| Family | 5.8 | (4.07.7) |
| Utilization staff | 5.8 | (4.67.0) |
| Uncategorized | 5.7 | (3.77.6) |
| PCC | 4.0 | (2.35.7) |
| PCP | 3.6 | (2.74.5) |
| Ancillary staff | 2.9 | (2.23.7) |
| Pharmacy | 1.4 | (0.82.0) |
We found that 16% of all recorded activities occurred when another activity was also ongoing. This means that hospitalists were performing more than one activity for approximately 54 minutes per day, or about 9% of the average 10.3‐hour shift. Instances of multitasking occurred frequently, but were usually brief; the hospitalists performed 2 activities simultaneously an average of 75 times per day, but 79% of these occurrences lasted less than 1 minute. Of the 86 hours of multitasking activities recorded, 41% was communication time and another 41% was EMR use. This means that a second activity was being performed during 19% of the time hospitalists spent using the EMR and 26% of the time they spent communicating. Of the time spent on critical documentation activities like writing prescriptions and orders, 24% was recorded during a multitasking event.
The amount of time hospitalists spent per patient on days with above average patient volume as compared to those with below average patient volume is shown in Table 3. Hospitalists with above average patient numbers spent about 3 minutes less per patient interacting with the EMR (a 17% reduction; P < 0.01), and about 2 minutes less per patient communicating (a 14% reduction; P < 0.01). The average length of shift increased by 12 minutes on days when patient volume was above average; P < 0.05.
| Subcategory | Minutes: Below Average Census | (95% CI)* | Minutes: Above Average Census | (95% CI)* | Pr > |t| |
|---|---|---|---|---|---|
| |||||
| EMR | 19.12 | (17.5020.75) | 15.83 | (14.1717.49) | <.001 |
| Communication | 14.28 | (12.8615.71) | 12.21 | (11.0713.36) | 0.002 |
| Direct care | 9.30 | (8.1810.42) | 8.59 | (7.279.91) | 0.293 |
| Professional development | 4.09 | (2.365.81) | 2.57 | (1.263.89) | 0.026 |
| Personal | 3.52 | (2.394.65) | 2.05 | (1.292.82) | 0.032 |
| Travel | 3.32 | (2.863.79) | 2.93 | (2.643.22) | 0.566 |
| Other indirect care | 2.37 | (1.902.84) | 1.65 | (1.321.98) | 0.292 |
| Wait | 0.25 | (0.080.41) | 0.14 | (0.040.25) | 0.881 |
Discussion
To our knowledge, this study represents the largest time‐motion evaluation of hospitalist activities ever undertaken, and provides the most detailed assessment of hospitalists' activities when caring for patients without residents or medical students. We confirmed that hospitalists spend the majority of their time (64%) undertaking care activities away from the patient's bedside, and are involved in direct patient care contact only 17% of their time, averaging about 9 minutes per patient. The hospitalists spent about a quarter (26%) of their time communicating with others. Compared to other physicians, this is an unusually large amount of time. For example, Hollingsworth et al.15 found that emergency medicine physicians spent just half as much (13%) of their time on communication with other providers and staff. This may reflect hospitalists' central role in the coordination of consulting specialists. The other significant portion of hospitalists' effort focuses on documentation in the electronic medical record, with 22% of their time required for CPOE and note writing, and overall a third of their time (34.1%) committed to interacting with the EMR.
In many respects, our results confirm the findings of O'Leary et al.'s previous work. While this current study more precisely identified how hospitalists spend their time, the general proportions of times were similar. Both studies found that indirect care activities occupied about two‐thirds of hospitalists' time (64% in this study and 69% in the previous study). We also documented similar portions of total time for direct patient care (17% vs. 18%) and communication (26% vs. 24%). Interestingly, with complete implementation of the EMR system, the percentage of time spent on documentation appeared to decrease. O'Leary et al. reported that documentation accounted for 26% of hospitalists' time, while the equivalent activities (writing in the EMR or paper prescriptions) accounted for only 21% in the current study. Unfortunately, the significance of this finding is difficult to determine given the concurrent changes in patient volumes and the varying extent of EMR implementation during the earlier study.
Over half of hospitalists' communication time is spent either making or receiving phone calls. This suggests that efforts to facilitate communication (eg, use of mobile phone systems and voicemail) might enhance efficiency. Additionally, we found that nearly half of our hospitalists' communication was with other physicians. Not surprisingly, our study confirmed that an important part of hospitalists' work involves organizing and collaborating with a variety of specialists to provide optimal care for their patients.
Hospitalists spent a great deal of time multitasking. We found that multitasking time accounted for nearly 1 of every 10 minutes during the day. The most common combination of activities involved communication that occurred during a period of EMR use. These interruptions could have serious consequences should physicians lose track of what they are doing while ordering procedures or prescribing medications.
We documented a smaller portion of multitasking time than O'Leary's earlier study. This could be due to differences in how multitasking was defined or recorded in the 2 studies. Our electronic data collection tool allowed us to capture rapid task switching and multitasking to the second, rather than to the minute, as was done with the stopwatch and paper form used in the previous study. This precision was important, especially considering that nearly 80% of the recorded instances of multitasking lasted less than 1 minute.
Our data also suggests that patient census has significant effects on certain parts of hospitalist workflow. Patient volume for our subjects ranged from 10 to 19 patients per shift, with a mean of 13.2 patients. The amount of time our hospitalists spent with each patient did not differ significantly between above and below average census days. However, EMR time per patient was significantly reduced on above average census days. Anecdotally, several of our hospitalists suggested that on high census days they put off less time‐sensitive documentation activities like discharge summaries until after they leave the hospital and complete the work from home or on the following day. Thus, our study likely underestimates the total additional effort on high volume days, but unfortunately we had no direct way of quantifying work performed outside of the hospital or on subsequent days. Communication time was also significantly reduced when patient volumes were above average, suggesting that hospitalists had less time to confer with consultants or answer the questions of nurses and patient family members.
Several factors limit the interpretation and application of our findings. First, our study was conducted at a single urban, academic hospital, which may limit its applicability for hospitalists working at community hospitals. Given that more than 90% of hospital care in the U.S. occurs in the community hospital setting, research to confirm these findings in such hospitals is needed.16 Nonclinical research assistants collected all of the data, so the results may be limited by the accuracy of their interpretations. However, our extensive training and documentation of their accuracy serves as a strength of the study. Finally, we focused exclusively on daytime, weekday activities of hospitalists. Notably, 3 hospitalists work through the night at our facility, and 24‐hour coverage by hospitalists is increasingly common across the U.S. We expect weekend and night shift workflow to be somewhat different from standard day shifts due to the decreased availability of other medical providers for testing, consults, and procedures. Future research should focus on potential differences in activities on nights and weekends compared to weekdays.
This extensive, comprehensive analysis of hospitalist activities and workflow provides a foundation for future research and confirms much of O'Leary et al.'s original study. O'Leary's simpler approach of observing smaller blocks of time rather than full shifts proved effective; the two methodologies produced markedly similar results. The current study also offers some insight into matters of efficiency. We found that hospitalists with higher patient loads cut down on EMR and communication time. We also confirmed that hospitalists spend the largest portion of their time interacting with the EMR. A more efficient EMR system could therefore be especially helpful in providing more time for direct patient care and the communication necessary to coordinate care. Given that most hospitals provide financial support for hospital medicine programs (an average of $95,000 per hospitalist full‐time equivalent (FTE)1), hospital administrators have a keen interest in understanding how hospitalists might be more efficient. For example, if hospitalists could evaluate and manage two additional patients each day by exchanging time focused on medical record documentation for direct care activities, the cost of a hospitalist drops substantively. By understanding current hospitalist activities, efforts at redesigning their workflow can be more successful at addressing issues related to scheduling, communication, and compensation, thus improving the overall model of practice as well as the quality of patient care.17
Acknowledgements
We thank Caitlin Lawes and Stephen Williams for help with data collection, and all the hospitalists who participated in this study.
- Society of Hospital Medicine. About SHM.2008; http://www.hospitalmedicine.org/AM/Template.cfm?Section=About_SHM. Accessed April 2010.
- , .The evolution and future of hospital medicine.Mt Sinai J Med.2008;75(5):418–423.
- , , .Rehospitalizations among patients in the Fee‐for‐Service Medicare Program.N Engl J Med.2009;360(14):1418–1428.
- , , , , , .Outcomes of care by hospitalists, general internists, and family physicians.[see comment].N Engl J Med.2007;357(25):2589–2600.
- , .The hospitalist movement 5 years later.JAMA.2002;287:487–494.
- , .The impact of hospitalists on the cost and quality of inpatient care in the United States: a research synthesis.Med Care Res Rev.2005;62:379–406.
- .Hospitalists and the hospital medicine system of care are good for patient care.Arch Intern Med.2008;168(12):1254–1256; discussion 1259–1260.
- , .Hospitalists in teaching hospitals: opportunities but not without danger.J Gen Intern Med.2004;19:392–393.
- , , .How hospitalists spend their time: insights on efficiency and safety.J Hosp Med.2006;1(2):88–93.
- , , , et al.Use of electronic health records in U.S. hospitals.N Engl J Med.2009;360.
- .Electronic medical records at a crossroads: impetus for change or missed opportunity?JAMA.2009;302(10):1109–1111.
- , , , , .Systematic review of time studies evaluating physicians in the hospital setting.J Hosp Med.2010;5(6):000–000.
- , , , .All in a day's work: an observational study to quantify how and with whom doctors on hospital wards spend their time.Med J Aust.2008;188(9):506–509.
- , , , .Emergency department workplace interruptions: are emergency physicians “interrupt‐driven” and “multitasking”?Acad Emerg Med.2000;7:1239–1243.
- , , , , .How do physicians and nurses spend their time in the emergency department?Ann Emerg Med.1998;31(1):87–91.
- , , , , .The ecology of medical care revisited.N Engl J Med.2001;344(26):2021–2025.
- , .Organizing a hospitalist program: an overview of fundamental concepts.Med Clin North Am.2002;86(4):887–909.
Copyright © 2010 Society of Hospital Medicine
Improving Teamwork with SIDR
Communication among hospital care providers is critically important to provide safe and effective care.15 Yet, studies in operating rooms, intensive care units (ICUs), and general medical units have revealed widely discrepant views on the quality of collaboration and communication between physicians and nurses.68 Although physicians consistently gave high ratings to the quality of collaboration with nurses, nurses rated the quality of collaboration with physicians relatively poorly.
A significant barrier to communication among providers on patient care units is the fluidity and geographic dispersion of team members.8 Physicians, nurses, and other hospital care providers have difficulty finding a way to discuss the care of their patients in person. Research has shown that nurses and physicians on patient care units do not communicate consistently and frequently are not in agreement about their patients' plans of care9, 10
Interdisciplinary Rounds (IDR) have been used as a means to assemble patient care unit team members and improve collaboration on the plan of care.1114 Prior research has demonstrated improved ratings of collaboration on the part of physicians,13, 14 but the effect of IDR on nurses' ratings of collaboration and teamwork has not been adequately assessed. One IDR study did not assess nurses' perceptions,13 while others used instruments not previously described and/or validated in the literature.12, 14 Regarding more concrete outcomes, research indicates variable effects of IDR on length of stay (LOS) and cost. Although 2 studies documented a reduction in LOS and cost with the use of IDR,12, 13 another study showed no effect.15 Furthermore, prior studies evaluated the use of IDR on resident‐covered teaching services. The effect IDR has on collaboration, LOS, and cost in a nonteaching hospitalist service setting is not known.
This study had 3 aims. The first was to assess the impact of an intervention, Structured Inter‐Disciplinary Rounds (SIDR), on nurses' ratings of collaboration and teamwork. The second was to assess the feasibility and sustainability of the intervention. The third was to assess the impact of the intervention on hospital LOS and cost.
Methods
Setting and Study Design
The study was conducted at Northwestern Memorial Hospital (NMH), an 897‐bed tertiary care teaching hospital in Chicago, IL, and was approved by the Institutional Review Board of Northwestern University. The study was a controlled trial of an intervention, SIDR, on collaboration and teamwork on patient care units. One of 2 similar hospitalist service units was randomly selected for the intervention, while the other served as a control unit. SIDR was implemented in August 2008 and data were collected over a 24 week study period.
Each hospitalist service unit consisted of 30 beds and was equipped with continuous cardiac telemetry monitoring. Units were also identical in structure and staffing of nonphysician personnel. The intervention unit included a heart failure‐hospitalist comanagement service. Patients followed at the Center for Heart Failure in the Bluhm Cardiovascular Institute of Northwestern were preferentially admitted to this service. All other patients were admitted to units based on bed availability in a quasi‐randomized fashion. Hospitalists worked 7 consecutive days while on service and cared for patients primarily on the units involved in this study. Therefore, hospitalists cared for patients on both the intervention and control units during their weeks on service. Hospitalists cared for patients independently without the assistance of resident physicians or mid‐level providers (ie, physician assistants or nurse practitioners).
Intervention
SIDR combined a structured format for communication with a forum for regular interdisciplinary meetings. A working group, consisting of nurses, hospitalists, and the unit pharmacist, social worker, and case manager, met weekly for 12 weeks prior to implementation. The working group determined the optimal timing, frequency, and location for SIDR. Additionally, the working group finalized the content of a structured communication tool (Supporting Information) to be used during SIDR. The structured communication tool was modeled after prior research demonstrating the benefit of daily goals of care forms16, 17 and ensured that important elements of the daily plan of care were discussed. Based on the working group's recommendation, SIDR took place each weekday at 11:00 AM in the unit conference room and lasted approximately 30 minutes. The nurse manager and a unit medical director co‐led rounds each day. SIDR was attended by all nurses and hospitalists caring for patients on the unit, as well as the pharmacist, social worker, and case manager assigned to the unit.
Provider Survey
Nurses working on the intervention and control units during the study period were administered a survey 16 weeks to 20 weeks after implementation of SIDR to assess ratings of collaboration and teamwork. The first portion of the survey was based on previously published surveys assessing teamwork attitudes among providers.6, 7 We asked nurses to rate the quality of communication and collaboration they had experienced with hospitalists using a 5‐point ordinal scale (1 = very low, 2 = low, 3 = adequate, 4 = high, 5 = very high). The second portion of the survey assessed teamwork and safety climate using the teamwork and safety domains of the Safety Attitudes Questionnaire (SAQ) developed by Sexton et al.18 The SAQ is based on previous research in aviation and medicine and has been validated in clinical settings.19, 20 Because hospitalists worked with nurses on both units, and in light of our prior research demonstrating that hospitalists rate the quality of collaboration with nurses highly,8 we did not assess hospitalists' ratings of collaboration. A final portion of the survey assessed nurses' perceptions of whether SIDR improved efficiency of communication, collaboration among team members, and patient care using a 5‐point Likert scale (1 = strongly disagree; 2 = disagree; 3 = neutral; 4 = agree; 5 = strongly agree). Hospitalists also received this portion of the survey at the completion of each clinical rotation. All surveys were administered in a web‐based format using an internet link (
SIDR Characteristics and Attendance
The unit medical director recorded the duration of SIDR, the number of patients on the unit, and the number of patients discussed each day. Attendance for each discipline was also recorded each day during the study period.
Data Analysis
Provider demographic data were obtained from completed surveys and group comparisons were done using chi‐square and t tests. The percentage of nurses on each unit rating of the quality of communication and collaboration with hospitalist physicians as high or very high was compared using chi‐square. Teamwork and safety climate scores were compared using the Mann Whitney U test.
Patient data were obtained from administrative databases for both the control and intervention unit during the study period as well as for the intervention unit in the 24 weeks preceding the study period. Demographic data were compared using chi‐square and t tests. Primary discharge diagnosis ICD‐9 codes were grouped into diagnosis clusters using the Healthcare Cost and Utilization Project system of the Agency for Healthcare Research and Quality.21 Diagnosis clusters were then analyzed using the chi‐square test. Because of case mix differences between patients on the intervention and control units, we analyzed LOS and cost using a concurrent control as well as an historic control. Unadjusted LOS and costs were compared using the Mann Whitney U test. We then conducted multivariable linear regression analyses to assess the impact of SIDR on LOS and cost. To satisfy normality requirements and distribution of residuals, we explored 2 methods of transforming skewed data on LOS and cost: logarithmic conversion and truncation at the mean LOS + 3 standard deviations (SDs). Since both techniques yielded similar results, we chose to present results by using truncation. Covariates for multivariable analyses included age, gender, race, payor, admission source, case‐mix, discharge disposition, presence of ICU stay during hospitalization, and Medicare Severity‐Diagnosis Related Group (MS‐DRG) weight. We used standard errors robust to the clustering of patients within each physician. All analyses were conducted using Stata version 10.0 (College Station, TX).
Results
Characteristics of Providers, Patients, and SIDR
Forty‐nine of 58 (84%) nurses completed the survey. Eighty‐eight of 96 (92%) surveys were completed by hospitalists at the end of their week on service. Hospitalist surveys represented 33 different hospitalists because individuals may have worked on study units more than once during the study period. Nurses were a mean 35.0 10.4 years of age and had been working at the hospital for a mean 5.0 6.3 years. Hospitalists were a mean 32.8 2.8 years of age and had been working at the hospital for a mean 2.6 1.9 years.
Patient characteristics are shown in Table 1. Intervention unit patients were admitted from the Emergency Department slightly more often in the postSIDR period. Patient case mix differed between the control and intervention unit, but was similar when comparing the intervention unit preSIDR and postSIDR. Intervention unit MS‐DRG weight was lower in the postSIDR period.
| Control Unit (n = 815) | Intervention Unit Pre‐SIDR (n = 722) | Intervention Unit Post‐SIDR (n = 684) | P Value for Comparison of Intervention Unit Post‐SIDR vs. Control | P Value for Comparison of Intervention Unit Post‐ vs. Pre‐SIDR | |
|---|---|---|---|---|---|
| |||||
| Mean age, years (SD) | 63.8 (16.0) | 64.2 (16.3) | 64.1 (17.2) | 0.74 | 0.92 |
| Women, n (%) | 403 (49) | 347 (48) | 336 (49) | 0.90 | 0.69 |
| Ethnicity, n (%) | 0.22 | 0.71 | |||
| White | 438 (54) | 350 (48) | 334 (49) | ||
| Black | 269 (33) | 266 (37) | 264 (39) | ||
| Hispanic | 48 (6) | 40 (6) | 34 (5) | ||
| Asian | 6 (1) | 8 (1) | 4 (1) | ||
| Other | 54 (7) | 58 (8) | 48 (7) | ||
| Payor, n (%) | 0.07 | 0.67 | |||
| Medicare | 456 (56) | 436 (60) | 399 (58) | ||
| Private | 261 (32) | 176 (24) | 182 (27) | ||
| Medicaid | 67 (8) | 75 (10) | 65 (10) | ||
| Self pay | 31 (4) | 35 (5) | 38 (6) | ||
| Admission source, n (%) | 0.51 | 0.03 | |||
| Emergency department | 695 (85) | 590 (82) | 593 (87) | ||
| Direct admission | 92 (11) | 99 (14) | 65 (10) | ||
| Transfer | 28 (3) | 33 (5) | 26 (4) | ||
| Case mix, n (%) | |||||
| Congestive heart failure | 78 (10) | 164 (23) | 144 (21) | <0.01 | 0.45 |
| Cardiac dysrhythmia | 167 (20) | 69 (10) | 81 (12) | <0.01 | 0.17 |
| Chest pain | 100 (12) | 47 (7) | 59 (9) | 0.02 | 0.13 |
| Coronary atherosclerosis | 52 (6) | 19 (3) | 19 (3) | <0.01 | 0.87 |
| Hypertension | 24 (3) | 38 (5) | 24 (4) | 0.54 | 0.11 |
| Syncope | 27 (3) | 23 (3) | 26 (4) | 0.61 | 0.53 |
| Fluid or electrolyte disorder | 11 (1) | 25 (3) | 23 (3) | 0.01 | 0.92 |
| Pneumonia | 14 (2) | 13 (2) | 22 (3) | 0.06 | 0.09 |
| Pulmonary heart disease | 16 (2) | 13 (2) | 14 (2) | 0.91 | 0.74 |
| Intervertebral disc or other back problem | 32 (4) | 3 (0) | 6 (1) | <0.01 | 0.28 |
| Other diagnosis | 294 (36) | 308 (43) | 266 (39) | 0.26 | 0.15 |
| Cardiovascular procedure during admission | 151 (19) | 95 (13) | 86 (13) | <0.01 | 0.74 |
| Intensive care unit stay during admission, n (%) | 39 (5) | 44 (6) | 27 (4) | 0.43 | 0.07 |
| Discharge disposition, n (%) | |||||
| Home | 736 (90) | 646 (89) | 610 (89) | 0.88 | 0.82 |
| Skilled nursing facility or rehabilitation | 66 (8) | 61 (8) | 63 (9) | ||
| Other facility | 9 (1) | 11 (2) | 7 (1) | ||
| Expired | 4 (0) | 4 (1) | 4 (1) | ||
| Mean Medicare severity ‐diagnosis related group weight (SD) | 1.08 (0.73) | 1.14 (0.76) | 1.06 (0.72) | 0.61 | 0.04 |
SIDR occurred each weekday (with the exception of holidays) on the intervention unit and lasted a mean 27.7 4.6 minutes. The unit had a mean 27 patients per day and 86% of patients on the unit were discussed each day. Attendance exceeded 85% for each discipline (hospitalists, nurses, and the unit pharmacist, social worker, and case manager).
Ratings of Teamwork and Perceptions of SIDR
As shown in Figure 1, a larger percentage of nurses rated the quality of communication and collaboration with hospitalists as high or very high on the intervention unit compared to the control unit (80% vs. 54%; P = 0.05).
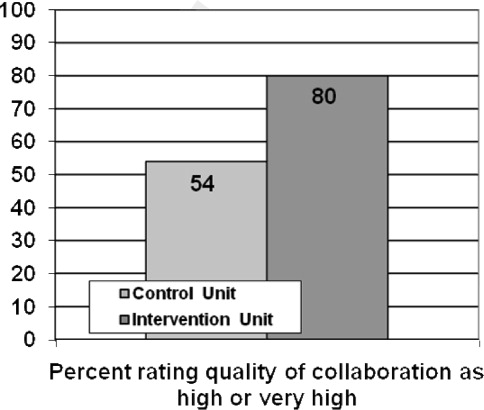
Nurses' ratings of the teamwork and safety climate are summarized in Table 2. The median teamwork climate score was 85.7 (interquartile range [IQR], 75.092.9) for the intervention unit as compared to 61.6 (IQR, 48.283.9) for the control unit (P = 0.008). The median safety climate score was 75.0 (IQR, 70.581.3) for the intervention unit as compared to 61.1 (IQR, 30.281.3) for the control unit (P = 0.03).
| Control Unit, n = 24 | Intervention Unit, n = 25 | P Value | |
|---|---|---|---|
| |||
| Median Teamwork Climate Score (IQR) | 75.0 (70.581.3) | 61.6 (48.283.9) | 0.008 |
| Median Safety Climate Score (IQR) | 85.7 (75.092.9) | 61.1 (30.281.3) | 0.03 |
Sixty‐five of 88 (74%) hospitalists and 18 of 24 (75%) nurses agreed that SIDR improved the efficiency of their work day. Eighty of 88 (91%) hospitalists and 18 of 24 (75%) nurses agreed that SIDR improved team collaboration. Seventy‐six of 88 (86%) hospitalists and 18 of 24 (75%) nurses agreed that SIDR improved patient care. Sixty‐seven of 88 (76%) hospitalists and 22 of 25 (88%) nurses indicated that they wanted SIDR to continue indefinitely.
SIDR Impact on LOS and Cost
The unadjusted mean LOS was significantly higher for the intervention unit postSIDR as compared to the control unit (4.0 3.4 vs. 3.7 3.3 days; P = 0.03). However, the unadjusted mean LOS was not significantly different for the intervention unit postSIDR as compared to the intervention unit preSIDR (4.0 3.4 vs. 4.26 3.5 days; P = 0.10). The unadjusted cost was lower for the intervention unit postSIDR as compared to the control unit ($7,513.23 7,085.10 vs. $8,588.66 7,381.03; P < 0.001). The unadjusted mean cost was not significantly different for the invention unit postSIDR as compared to the intervention unit preSIDR ($7,513.23 7,085.10 vs. $7,937.00 7,512.23; P = 0.19).
Multivariable analyses of LOS and cost are summarized in Table 3. The adjusted LOS was not significantly different when comparing the intervention unit postSIDR to either the control unit or the intervention unit preSIDR. The adjusted cost for the intervention unit postSIDR was $739.55 less than the control unit (P = 0.02). The adjusted cost was not significantly different when comparing the intervention unit postSIDR to the intervention unit preSIDR.
| Adjusted Difference for Intervention Unit Post‐SIDR vs. Control | P Value for Adjusted Difference for Intervention Unit Post‐SIDR vs. Control | Adjusted Difference for Intervention Unit Post‐ vs. Pre‐SIDR | P Value for Adjusted Difference for Intervention Unit Post‐ vs. Pre‐SIDR | |
|---|---|---|---|---|
| ||||
| Length of stay | 0.05 | 0.75 | 0.04 | 0.83 |
| Cost | 739.55 | 0.02 | 302.94 | 0.34 |
Discussion
We found that nurses working on a unit using SIDR rated the quality of communication and collaboration with hospitalists significantly higher as compared to a control unit. Notably, because hospitalists worked on both the intervention and control unit during their weeks on service, nurses on each unit were rating the quality of collaboration with the same hospitalists. Nurses also rated the teamwork and safety climate higher on the intervention unit. These findings are important because prior research has shown that nurses are often dissatisfied with the quality of collaboration and teamwork with physicians.68 Potential explanations include fundamental differences between nurses and physicians with regard to status/authority, gender, training, and patient care responsibilities.6 Unfortunately, a culture of poor teamwork may lead to a workplace in which team members feel unable to approach certain individuals and uncomfortable raising concerns. Not surprisingly, higher ratings of teamwork culture have been associated with nurse retention.22, 23 SIDR provided a facilitated forum for interdisciplinary discussion, exchange of critical clinical information, and collaboration on the plan of care.
Our findings are also important because poor communication represents a major etiology of preventable adverse events in hospitals.15 Higher ratings of collaboration and teamwork have been associated with better patient outcomes in observational studies.2426 Further research should evaluate the impact of improved interdisciplinary collaboration as a result of SIDR on the safety of care delivered on inpatient medical units.
The majority of providers agreed that SIDR improved patient care and that SIDR should continue indefinitely. Importantly, providers also felt that SIDR improved the efficiency of their workday and attendance was high among all disciplines. Prior studies on IDR either did not report attendance or struggled with attendance.11 Incorporating the input of frontline providers into the design of SIDR allowed us to create a sustainable intervention which fit into daily workflow.
Our bivariate analyses found significant patient case‐mix differences between the intervention and control unit, limiting our ability to perform direct comparisons in LOS and cost. Pre‐post analyses of LOS and cost may be affected by cyclical or secular trends. Because each approach has its own limitations, we felt that analyses using both an historic as well as a concurrent control would provide a more complete assessment of the effect of the intervention. We included case mix, among other variables, in out multivariable regression analyses and found no benefit to SIDR with regard to LOS and cost. Two prior studies have shown a reduction in LOS and cost with the use of IDR.12, 13 However, one study was conducted approximately 15 years ago and included patients with a longer mean LOS.12 The second study used a pre‐post study design which may not have accounted for unmeasured confounders affecting LOS and cost.13 A third, smaller study showed no effect on LOS and cost with the use of IDR.15 No prior study has evaluated the effect of IDR on LOS and cost in a nonteaching hospitalist service setting.
Our study has several limitations. First, our study reflects the experience of an intervention unit compared to a control unit in a single hospital. Larger studies will be required to test the reproducibility and generalizability of our findings. Second, we did not conduct preintervention provider surveys for comparison ratings of collaboration and teamwork. A prior study, conducted by our research group, found that nurses gave low ratings to the teamwork climate and the quality of collaboration with hospitalists.8 Because this baseline study showed consistently low nurse ratings of collaboration and teamwork across all medical units, and because the units in the current study were identical in size, structure, and staffing of nonphysician personnel, we did not repeat nurse surveys prior to the intervention. Third, as previously mentioned, our study did not directly assess the effect of improved teamwork and collaboration on patient safety. Further study is needed to evaluate this. Although we are not aware of any other interventions to improve interdisciplinary communication on the intervention unit, it is possible that other unknown factors contributed to our findings. We believe this is unlikely due to the magnitude of the improvement in collaboration and the high ratings of SIDR by nurses and physicians on the intervention unit.
In summary, SIDR had a positive effect on nurses' ratings of collaboration and teamwork on a nonteaching hospitalist unit. Future research efforts should assess whether improved teamwork as a result of SIDR also translates into safer patient care.
- Joint Commission on Accreditation of Healthcare Organizations. Sentinel Event Statistics. Available at: http://www.jointcommission.org/SentinelEvents/Statistics. Accessed March2010.
- ,,, et al.A look into the nature and causes of human errors in the intensive care unit.Crit Care Med.1995;23(2):294–300.
- ,,, et al.The nature of adverse events in hospitalized patients. Results of the Harvard Medical Practice Study II.N Engl J Med.1991;324(6):377–384.
- ,,.Communication failures: an insidious contributor to medical mishaps.Acad Med.2004;79(2):186–194.
- ,,,,,.The quality in Australian Health Care Study.Med J Aust.1995;163(9):458–471.
- ,,, et al.Operating room teamwork among physicians and nurses: teamwork in the eye of the beholder.J Am Coll Surg.2006;202(5):746–752.
- ,,.Discrepant attitudes about teamwork among critical care nurses and physicians.Crit Care Med.2003;31(3):956–959.
- ,,,,,.Teamwork on inpatient medical units: assessing attitudes and barriers.Qual Saf Health Care2010;19(2):117–121.
- ,,,,,.Can we talk? Priorities for patient care differed among health care providers:AHRQ;2005.
- ,,, et al.Patterns of nurse—physicians communication and agreement on the plan of care.Qual Saf Health Care. In press.
- ,,, et al.The effect of a multidisciplinary hospitalist/physician and advanced practice nurse collaboration on hospital costs.J Nurs Adm.2006;36(2):79–85.
- ,,.A firm trial of interdisciplinary rounds on the inpatient medical wards: an intervention designed using continuous quality improvement.Med Care.1998;36(8 Suppl):AS4–A12.
- ,,,,.Use of multidisciplinary rounds to simultaneously improve quality outcomes, enhance resident education, and shorten length of stay.J Gen Intern Med.2007;22(8):1073–1079.
- ,,,.Effect of a multidisciplinary intervention on communication and collaboration among physicians and nurses.Am J Crit Care.2005;14(1):71–77.
- ,,,.Effects of interdisciplinary rounds on length of stay in a telemetry unit.J Public Health Manag Pract.2004;10(1):63–69.
- ,,,,.Improving nurse‐physician communication and satisfaction in the intensive care unit with a daily goals worksheet.Am J Crit Care.2006;15(2):217–222.
- ,,,,,.Improving communication in the ICU using daily goals.J Crit Care.2003;18(2):71–75.
- ,,, et al.The Safety Attitudes Questionnaire: psychometric properties, benchmarking data, and emerging research.BMC Health Serv Res.2006;6:44.
- ,,,.Safety Climate Survey: reliability of results from a multicenter ICU survey.Qual Saf Health Care.2005;14(4):273–278.
- ,,, et al.Teamwork in the operating room: frontline perspectives among hospitals and operating room personnel.Anesthesiology.2006;105(5):877–884.
- HCUP Clinical Classification Software [computer program]. Version: Agency for Healthcare Research and Quality, Rockville, MD. Available at: http://www.hcup‐us.ahrq.gov/toolssoftware/ccs/ccs.jsp. Accessed March2010.
- ,,.The influence of teamwork culture on physician and nurse resignation rates in hospitals.Health Serv Manage Res.2008;21(1):23–31.
- .Original research: nurse‐physician relationships: impact on nurse satisfaction and retention.Am J Nurs.2002;102(6):26–34.
- ,,, et al.Association between nurse‐physician collaboration and patient outcomes in three intensive care units.Crit Care Med.1999;27(9):1991–1998.
- ,,,,.Risk‐adjusted morbidity in teaching hospitals correlates with reported levels of communication and collaboration on surgical teams but not with scale measures of teamwork climate, safety climate, or working conditions.J Am Coll Surg.2007;205(6):778–784.
- ,,.The link between teamwork and patients' outcomes in intensive care units.Am J Crit Care.2003;12(6):527–534.
Communication among hospital care providers is critically important to provide safe and effective care.15 Yet, studies in operating rooms, intensive care units (ICUs), and general medical units have revealed widely discrepant views on the quality of collaboration and communication between physicians and nurses.68 Although physicians consistently gave high ratings to the quality of collaboration with nurses, nurses rated the quality of collaboration with physicians relatively poorly.
A significant barrier to communication among providers on patient care units is the fluidity and geographic dispersion of team members.8 Physicians, nurses, and other hospital care providers have difficulty finding a way to discuss the care of their patients in person. Research has shown that nurses and physicians on patient care units do not communicate consistently and frequently are not in agreement about their patients' plans of care9, 10
Interdisciplinary Rounds (IDR) have been used as a means to assemble patient care unit team members and improve collaboration on the plan of care.1114 Prior research has demonstrated improved ratings of collaboration on the part of physicians,13, 14 but the effect of IDR on nurses' ratings of collaboration and teamwork has not been adequately assessed. One IDR study did not assess nurses' perceptions,13 while others used instruments not previously described and/or validated in the literature.12, 14 Regarding more concrete outcomes, research indicates variable effects of IDR on length of stay (LOS) and cost. Although 2 studies documented a reduction in LOS and cost with the use of IDR,12, 13 another study showed no effect.15 Furthermore, prior studies evaluated the use of IDR on resident‐covered teaching services. The effect IDR has on collaboration, LOS, and cost in a nonteaching hospitalist service setting is not known.
This study had 3 aims. The first was to assess the impact of an intervention, Structured Inter‐Disciplinary Rounds (SIDR), on nurses' ratings of collaboration and teamwork. The second was to assess the feasibility and sustainability of the intervention. The third was to assess the impact of the intervention on hospital LOS and cost.
Methods
Setting and Study Design
The study was conducted at Northwestern Memorial Hospital (NMH), an 897‐bed tertiary care teaching hospital in Chicago, IL, and was approved by the Institutional Review Board of Northwestern University. The study was a controlled trial of an intervention, SIDR, on collaboration and teamwork on patient care units. One of 2 similar hospitalist service units was randomly selected for the intervention, while the other served as a control unit. SIDR was implemented in August 2008 and data were collected over a 24 week study period.
Each hospitalist service unit consisted of 30 beds and was equipped with continuous cardiac telemetry monitoring. Units were also identical in structure and staffing of nonphysician personnel. The intervention unit included a heart failure‐hospitalist comanagement service. Patients followed at the Center for Heart Failure in the Bluhm Cardiovascular Institute of Northwestern were preferentially admitted to this service. All other patients were admitted to units based on bed availability in a quasi‐randomized fashion. Hospitalists worked 7 consecutive days while on service and cared for patients primarily on the units involved in this study. Therefore, hospitalists cared for patients on both the intervention and control units during their weeks on service. Hospitalists cared for patients independently without the assistance of resident physicians or mid‐level providers (ie, physician assistants or nurse practitioners).
Intervention
SIDR combined a structured format for communication with a forum for regular interdisciplinary meetings. A working group, consisting of nurses, hospitalists, and the unit pharmacist, social worker, and case manager, met weekly for 12 weeks prior to implementation. The working group determined the optimal timing, frequency, and location for SIDR. Additionally, the working group finalized the content of a structured communication tool (Supporting Information) to be used during SIDR. The structured communication tool was modeled after prior research demonstrating the benefit of daily goals of care forms16, 17 and ensured that important elements of the daily plan of care were discussed. Based on the working group's recommendation, SIDR took place each weekday at 11:00 AM in the unit conference room and lasted approximately 30 minutes. The nurse manager and a unit medical director co‐led rounds each day. SIDR was attended by all nurses and hospitalists caring for patients on the unit, as well as the pharmacist, social worker, and case manager assigned to the unit.
Provider Survey
Nurses working on the intervention and control units during the study period were administered a survey 16 weeks to 20 weeks after implementation of SIDR to assess ratings of collaboration and teamwork. The first portion of the survey was based on previously published surveys assessing teamwork attitudes among providers.6, 7 We asked nurses to rate the quality of communication and collaboration they had experienced with hospitalists using a 5‐point ordinal scale (1 = very low, 2 = low, 3 = adequate, 4 = high, 5 = very high). The second portion of the survey assessed teamwork and safety climate using the teamwork and safety domains of the Safety Attitudes Questionnaire (SAQ) developed by Sexton et al.18 The SAQ is based on previous research in aviation and medicine and has been validated in clinical settings.19, 20 Because hospitalists worked with nurses on both units, and in light of our prior research demonstrating that hospitalists rate the quality of collaboration with nurses highly,8 we did not assess hospitalists' ratings of collaboration. A final portion of the survey assessed nurses' perceptions of whether SIDR improved efficiency of communication, collaboration among team members, and patient care using a 5‐point Likert scale (1 = strongly disagree; 2 = disagree; 3 = neutral; 4 = agree; 5 = strongly agree). Hospitalists also received this portion of the survey at the completion of each clinical rotation. All surveys were administered in a web‐based format using an internet link (
SIDR Characteristics and Attendance
The unit medical director recorded the duration of SIDR, the number of patients on the unit, and the number of patients discussed each day. Attendance for each discipline was also recorded each day during the study period.
Data Analysis
Provider demographic data were obtained from completed surveys and group comparisons were done using chi‐square and t tests. The percentage of nurses on each unit rating of the quality of communication and collaboration with hospitalist physicians as high or very high was compared using chi‐square. Teamwork and safety climate scores were compared using the Mann Whitney U test.
Patient data were obtained from administrative databases for both the control and intervention unit during the study period as well as for the intervention unit in the 24 weeks preceding the study period. Demographic data were compared using chi‐square and t tests. Primary discharge diagnosis ICD‐9 codes were grouped into diagnosis clusters using the Healthcare Cost and Utilization Project system of the Agency for Healthcare Research and Quality.21 Diagnosis clusters were then analyzed using the chi‐square test. Because of case mix differences between patients on the intervention and control units, we analyzed LOS and cost using a concurrent control as well as an historic control. Unadjusted LOS and costs were compared using the Mann Whitney U test. We then conducted multivariable linear regression analyses to assess the impact of SIDR on LOS and cost. To satisfy normality requirements and distribution of residuals, we explored 2 methods of transforming skewed data on LOS and cost: logarithmic conversion and truncation at the mean LOS + 3 standard deviations (SDs). Since both techniques yielded similar results, we chose to present results by using truncation. Covariates for multivariable analyses included age, gender, race, payor, admission source, case‐mix, discharge disposition, presence of ICU stay during hospitalization, and Medicare Severity‐Diagnosis Related Group (MS‐DRG) weight. We used standard errors robust to the clustering of patients within each physician. All analyses were conducted using Stata version 10.0 (College Station, TX).
Results
Characteristics of Providers, Patients, and SIDR
Forty‐nine of 58 (84%) nurses completed the survey. Eighty‐eight of 96 (92%) surveys were completed by hospitalists at the end of their week on service. Hospitalist surveys represented 33 different hospitalists because individuals may have worked on study units more than once during the study period. Nurses were a mean 35.0 10.4 years of age and had been working at the hospital for a mean 5.0 6.3 years. Hospitalists were a mean 32.8 2.8 years of age and had been working at the hospital for a mean 2.6 1.9 years.
Patient characteristics are shown in Table 1. Intervention unit patients were admitted from the Emergency Department slightly more often in the postSIDR period. Patient case mix differed between the control and intervention unit, but was similar when comparing the intervention unit preSIDR and postSIDR. Intervention unit MS‐DRG weight was lower in the postSIDR period.
| Control Unit (n = 815) | Intervention Unit Pre‐SIDR (n = 722) | Intervention Unit Post‐SIDR (n = 684) | P Value for Comparison of Intervention Unit Post‐SIDR vs. Control | P Value for Comparison of Intervention Unit Post‐ vs. Pre‐SIDR | |
|---|---|---|---|---|---|
| |||||
| Mean age, years (SD) | 63.8 (16.0) | 64.2 (16.3) | 64.1 (17.2) | 0.74 | 0.92 |
| Women, n (%) | 403 (49) | 347 (48) | 336 (49) | 0.90 | 0.69 |
| Ethnicity, n (%) | 0.22 | 0.71 | |||
| White | 438 (54) | 350 (48) | 334 (49) | ||
| Black | 269 (33) | 266 (37) | 264 (39) | ||
| Hispanic | 48 (6) | 40 (6) | 34 (5) | ||
| Asian | 6 (1) | 8 (1) | 4 (1) | ||
| Other | 54 (7) | 58 (8) | 48 (7) | ||
| Payor, n (%) | 0.07 | 0.67 | |||
| Medicare | 456 (56) | 436 (60) | 399 (58) | ||
| Private | 261 (32) | 176 (24) | 182 (27) | ||
| Medicaid | 67 (8) | 75 (10) | 65 (10) | ||
| Self pay | 31 (4) | 35 (5) | 38 (6) | ||
| Admission source, n (%) | 0.51 | 0.03 | |||
| Emergency department | 695 (85) | 590 (82) | 593 (87) | ||
| Direct admission | 92 (11) | 99 (14) | 65 (10) | ||
| Transfer | 28 (3) | 33 (5) | 26 (4) | ||
| Case mix, n (%) | |||||
| Congestive heart failure | 78 (10) | 164 (23) | 144 (21) | <0.01 | 0.45 |
| Cardiac dysrhythmia | 167 (20) | 69 (10) | 81 (12) | <0.01 | 0.17 |
| Chest pain | 100 (12) | 47 (7) | 59 (9) | 0.02 | 0.13 |
| Coronary atherosclerosis | 52 (6) | 19 (3) | 19 (3) | <0.01 | 0.87 |
| Hypertension | 24 (3) | 38 (5) | 24 (4) | 0.54 | 0.11 |
| Syncope | 27 (3) | 23 (3) | 26 (4) | 0.61 | 0.53 |
| Fluid or electrolyte disorder | 11 (1) | 25 (3) | 23 (3) | 0.01 | 0.92 |
| Pneumonia | 14 (2) | 13 (2) | 22 (3) | 0.06 | 0.09 |
| Pulmonary heart disease | 16 (2) | 13 (2) | 14 (2) | 0.91 | 0.74 |
| Intervertebral disc or other back problem | 32 (4) | 3 (0) | 6 (1) | <0.01 | 0.28 |
| Other diagnosis | 294 (36) | 308 (43) | 266 (39) | 0.26 | 0.15 |
| Cardiovascular procedure during admission | 151 (19) | 95 (13) | 86 (13) | <0.01 | 0.74 |
| Intensive care unit stay during admission, n (%) | 39 (5) | 44 (6) | 27 (4) | 0.43 | 0.07 |
| Discharge disposition, n (%) | |||||
| Home | 736 (90) | 646 (89) | 610 (89) | 0.88 | 0.82 |
| Skilled nursing facility or rehabilitation | 66 (8) | 61 (8) | 63 (9) | ||
| Other facility | 9 (1) | 11 (2) | 7 (1) | ||
| Expired | 4 (0) | 4 (1) | 4 (1) | ||
| Mean Medicare severity ‐diagnosis related group weight (SD) | 1.08 (0.73) | 1.14 (0.76) | 1.06 (0.72) | 0.61 | 0.04 |
SIDR occurred each weekday (with the exception of holidays) on the intervention unit and lasted a mean 27.7 4.6 minutes. The unit had a mean 27 patients per day and 86% of patients on the unit were discussed each day. Attendance exceeded 85% for each discipline (hospitalists, nurses, and the unit pharmacist, social worker, and case manager).
Ratings of Teamwork and Perceptions of SIDR
As shown in Figure 1, a larger percentage of nurses rated the quality of communication and collaboration with hospitalists as high or very high on the intervention unit compared to the control unit (80% vs. 54%; P = 0.05).
Nurses' ratings of the teamwork and safety climate are summarized in Table 2. The median teamwork climate score was 85.7 (interquartile range [IQR], 75.092.9) for the intervention unit as compared to 61.6 (IQR, 48.283.9) for the control unit (P = 0.008). The median safety climate score was 75.0 (IQR, 70.581.3) for the intervention unit as compared to 61.1 (IQR, 30.281.3) for the control unit (P = 0.03).
| Control Unit, n = 24 | Intervention Unit, n = 25 | P Value | |
|---|---|---|---|
| |||
| Median Teamwork Climate Score (IQR) | 75.0 (70.581.3) | 61.6 (48.283.9) | 0.008 |
| Median Safety Climate Score (IQR) | 85.7 (75.092.9) | 61.1 (30.281.3) | 0.03 |
Sixty‐five of 88 (74%) hospitalists and 18 of 24 (75%) nurses agreed that SIDR improved the efficiency of their work day. Eighty of 88 (91%) hospitalists and 18 of 24 (75%) nurses agreed that SIDR improved team collaboration. Seventy‐six of 88 (86%) hospitalists and 18 of 24 (75%) nurses agreed that SIDR improved patient care. Sixty‐seven of 88 (76%) hospitalists and 22 of 25 (88%) nurses indicated that they wanted SIDR to continue indefinitely.
SIDR Impact on LOS and Cost
The unadjusted mean LOS was significantly higher for the intervention unit postSIDR as compared to the control unit (4.0 3.4 vs. 3.7 3.3 days; P = 0.03). However, the unadjusted mean LOS was not significantly different for the intervention unit postSIDR as compared to the intervention unit preSIDR (4.0 3.4 vs. 4.26 3.5 days; P = 0.10). The unadjusted cost was lower for the intervention unit postSIDR as compared to the control unit ($7,513.23 7,085.10 vs. $8,588.66 7,381.03; P < 0.001). The unadjusted mean cost was not significantly different for the invention unit postSIDR as compared to the intervention unit preSIDR ($7,513.23 7,085.10 vs. $7,937.00 7,512.23; P = 0.19).
Multivariable analyses of LOS and cost are summarized in Table 3. The adjusted LOS was not significantly different when comparing the intervention unit postSIDR to either the control unit or the intervention unit preSIDR. The adjusted cost for the intervention unit postSIDR was $739.55 less than the control unit (P = 0.02). The adjusted cost was not significantly different when comparing the intervention unit postSIDR to the intervention unit preSIDR.
| Adjusted Difference for Intervention Unit Post‐SIDR vs. Control | P Value for Adjusted Difference for Intervention Unit Post‐SIDR vs. Control | Adjusted Difference for Intervention Unit Post‐ vs. Pre‐SIDR | P Value for Adjusted Difference for Intervention Unit Post‐ vs. Pre‐SIDR | |
|---|---|---|---|---|
| ||||
| Length of stay | 0.05 | 0.75 | 0.04 | 0.83 |
| Cost | 739.55 | 0.02 | 302.94 | 0.34 |
Discussion
We found that nurses working on a unit using SIDR rated the quality of communication and collaboration with hospitalists significantly higher as compared to a control unit. Notably, because hospitalists worked on both the intervention and control unit during their weeks on service, nurses on each unit were rating the quality of collaboration with the same hospitalists. Nurses also rated the teamwork and safety climate higher on the intervention unit. These findings are important because prior research has shown that nurses are often dissatisfied with the quality of collaboration and teamwork with physicians.68 Potential explanations include fundamental differences between nurses and physicians with regard to status/authority, gender, training, and patient care responsibilities.6 Unfortunately, a culture of poor teamwork may lead to a workplace in which team members feel unable to approach certain individuals and uncomfortable raising concerns. Not surprisingly, higher ratings of teamwork culture have been associated with nurse retention.22, 23 SIDR provided a facilitated forum for interdisciplinary discussion, exchange of critical clinical information, and collaboration on the plan of care.
Our findings are also important because poor communication represents a major etiology of preventable adverse events in hospitals.15 Higher ratings of collaboration and teamwork have been associated with better patient outcomes in observational studies.2426 Further research should evaluate the impact of improved interdisciplinary collaboration as a result of SIDR on the safety of care delivered on inpatient medical units.
The majority of providers agreed that SIDR improved patient care and that SIDR should continue indefinitely. Importantly, providers also felt that SIDR improved the efficiency of their workday and attendance was high among all disciplines. Prior studies on IDR either did not report attendance or struggled with attendance.11 Incorporating the input of frontline providers into the design of SIDR allowed us to create a sustainable intervention which fit into daily workflow.
Our bivariate analyses found significant patient case‐mix differences between the intervention and control unit, limiting our ability to perform direct comparisons in LOS and cost. Pre‐post analyses of LOS and cost may be affected by cyclical or secular trends. Because each approach has its own limitations, we felt that analyses using both an historic as well as a concurrent control would provide a more complete assessment of the effect of the intervention. We included case mix, among other variables, in out multivariable regression analyses and found no benefit to SIDR with regard to LOS and cost. Two prior studies have shown a reduction in LOS and cost with the use of IDR.12, 13 However, one study was conducted approximately 15 years ago and included patients with a longer mean LOS.12 The second study used a pre‐post study design which may not have accounted for unmeasured confounders affecting LOS and cost.13 A third, smaller study showed no effect on LOS and cost with the use of IDR.15 No prior study has evaluated the effect of IDR on LOS and cost in a nonteaching hospitalist service setting.
Our study has several limitations. First, our study reflects the experience of an intervention unit compared to a control unit in a single hospital. Larger studies will be required to test the reproducibility and generalizability of our findings. Second, we did not conduct preintervention provider surveys for comparison ratings of collaboration and teamwork. A prior study, conducted by our research group, found that nurses gave low ratings to the teamwork climate and the quality of collaboration with hospitalists.8 Because this baseline study showed consistently low nurse ratings of collaboration and teamwork across all medical units, and because the units in the current study were identical in size, structure, and staffing of nonphysician personnel, we did not repeat nurse surveys prior to the intervention. Third, as previously mentioned, our study did not directly assess the effect of improved teamwork and collaboration on patient safety. Further study is needed to evaluate this. Although we are not aware of any other interventions to improve interdisciplinary communication on the intervention unit, it is possible that other unknown factors contributed to our findings. We believe this is unlikely due to the magnitude of the improvement in collaboration and the high ratings of SIDR by nurses and physicians on the intervention unit.
In summary, SIDR had a positive effect on nurses' ratings of collaboration and teamwork on a nonteaching hospitalist unit. Future research efforts should assess whether improved teamwork as a result of SIDR also translates into safer patient care.
- Joint Commission on Accreditation of Healthcare Organizations. Sentinel Event Statistics. Available at: http://www.jointcommission.org/SentinelEvents/Statistics. Accessed March2010.
- ,,, et al.A look into the nature and causes of human errors in the intensive care unit.Crit Care Med.1995;23(2):294–300.
- ,,, et al.The nature of adverse events in hospitalized patients. Results of the Harvard Medical Practice Study II.N Engl J Med.1991;324(6):377–384.
- ,,.Communication failures: an insidious contributor to medical mishaps.Acad Med.2004;79(2):186–194.
- ,,,,,.The quality in Australian Health Care Study.Med J Aust.1995;163(9):458–471.
- ,,, et al.Operating room teamwork among physicians and nurses: teamwork in the eye of the beholder.J Am Coll Surg.2006;202(5):746–752.
- ,,.Discrepant attitudes about teamwork among critical care nurses and physicians.Crit Care Med.2003;31(3):956–959.
- ,,,,,.Teamwork on inpatient medical units: assessing attitudes and barriers.Qual Saf Health Care2010;19(2):117–121.
- ,,,,,.Can we talk? Priorities for patient care differed among health care providers:AHRQ;2005.
- ,,, et al.Patterns of nurse—physicians communication and agreement on the plan of care.Qual Saf Health Care. In press.
- ,,, et al.The effect of a multidisciplinary hospitalist/physician and advanced practice nurse collaboration on hospital costs.J Nurs Adm.2006;36(2):79–85.
- ,,.A firm trial of interdisciplinary rounds on the inpatient medical wards: an intervention designed using continuous quality improvement.Med Care.1998;36(8 Suppl):AS4–A12.
- ,,,,.Use of multidisciplinary rounds to simultaneously improve quality outcomes, enhance resident education, and shorten length of stay.J Gen Intern Med.2007;22(8):1073–1079.
- ,,,.Effect of a multidisciplinary intervention on communication and collaboration among physicians and nurses.Am J Crit Care.2005;14(1):71–77.
- ,,,.Effects of interdisciplinary rounds on length of stay in a telemetry unit.J Public Health Manag Pract.2004;10(1):63–69.
- ,,,,.Improving nurse‐physician communication and satisfaction in the intensive care unit with a daily goals worksheet.Am J Crit Care.2006;15(2):217–222.
- ,,,,,.Improving communication in the ICU using daily goals.J Crit Care.2003;18(2):71–75.
- ,,, et al.The Safety Attitudes Questionnaire: psychometric properties, benchmarking data, and emerging research.BMC Health Serv Res.2006;6:44.
- ,,,.Safety Climate Survey: reliability of results from a multicenter ICU survey.Qual Saf Health Care.2005;14(4):273–278.
- ,,, et al.Teamwork in the operating room: frontline perspectives among hospitals and operating room personnel.Anesthesiology.2006;105(5):877–884.
- HCUP Clinical Classification Software [computer program]. Version: Agency for Healthcare Research and Quality, Rockville, MD. Available at: http://www.hcup‐us.ahrq.gov/toolssoftware/ccs/ccs.jsp. Accessed March2010.
- ,,.The influence of teamwork culture on physician and nurse resignation rates in hospitals.Health Serv Manage Res.2008;21(1):23–31.
- .Original research: nurse‐physician relationships: impact on nurse satisfaction and retention.Am J Nurs.2002;102(6):26–34.
- ,,, et al.Association between nurse‐physician collaboration and patient outcomes in three intensive care units.Crit Care Med.1999;27(9):1991–1998.
- ,,,,.Risk‐adjusted morbidity in teaching hospitals correlates with reported levels of communication and collaboration on surgical teams but not with scale measures of teamwork climate, safety climate, or working conditions.J Am Coll Surg.2007;205(6):778–784.
- ,,.The link between teamwork and patients' outcomes in intensive care units.Am J Crit Care.2003;12(6):527–534.
Copyright © 2010 Society of Hospital Medicine
