User login
Does my patient need maintenance fluids?
My adult nonacutely ill patient, weighing 70 kg with a glomerular filtration rate (GFR) greater than 60 mL/min/1.73 m2, is admitted to the general medical service. She is to receive nothing by mouth for at least the next 24 hours for testing. Do I need to provide maintenance fluids intravenously?
The question seems like it should have an easy answer. However, there is no consensus either on the type of fluids or the need for them at all.
Mortiz and Ayus1 have described the role of maintenance intravenous (IV) fluids in acutely ill patients and made the case for isotonic saline (0.9% NaCl) to minimize the risk of hyponatremia, while acknowledging that it provides 7 to 10 g of sodium per day.
Recommendations for IV fluids for nonacutely ill hospitalized patients range from isotonic solutions such as 0.9% NaCl and lactated Ringer’s, to hypotonic fluids such as 5% dextrose in water (D5W) in 0.45% NaCl and D5W in 0.2% NaCl.2–5
The 2013 guidelines of the UK National Institute for Health and Care Excellence (NICE) recommend hypotonic fluids to provide 25 to 30 mL/kg/day of water with 1 mmol/kg/day of sodium. For a 70-kg patient (body surface area 1.7 m2), this would be 1,750 to 2,000 mL of water, with a maximum of 70 mEq/L of sodium (35 mEq/L).5 An option would be D5W in 0.2% NaCl, which has 34 mEq/L of sodium.
When choosing maintenance IV fluids, we need to consider the following questions:
- What is my patient’s volume status?
- What is the baseline serum sodium and renal function?
- Are there comorbid conditions that may affect antidiuretic hormone (ADH) status such as physiologic stimulation from volume depletion, drugs, pathologic medical conditions, or syndrome of inappropriate ADH stimulation?
- Will my patient be receiving strictly nothing by mouth?
- Are there unusual fluid losses?
SCENARIO 1: ‘USUAL’ MAINTENANCE
If the patient is euvolemic, with a normal serum osmolality, a GFR more than 60 mL/min/1.73 m2, no stimuli for ADH secretion, and no unusual fluid losses, “usual” maintenance would be expected. The usual volume for this patient can be estimated by the following formulas:
- Maintenance volume: 2,550 mL (1,500 mL × 1.7 m2 body surface area)
- Holliday-Segar method6: 2,500 mL (1,500 mL plus 20 mL/kg for every kilogram over 20 kg).
The usual sodium can be also estimated by the following formulas:
- 2 g Na/day = 2,000 mg/day = 87 mEq/day
- Holliday-Segar6: 3 mEq Na/100 mL and 2 mEq K/100 mL of maintenance fluid.
Maintenance IV fluids for our nonacutely ill adult patient could be:
- NICE guideline5: D5W in 0.2% NaCl with 20 mEq KCl, to run at 75 mL/hour
- Holliday-Segar method6: D5W in 0.2% NaCl with 20 mEq KCl, to run at 100 mL/hour.
Twenty-four hours later, assuming no unusual fluid losses or stimulation of ADH secretion, our patient would weigh the same and would have no significant change in serum osmolality.
OTHER OPTIONS
What if I provide 0.9% NaCl instead?
Each 1 L of normal saline provides 154 mEq of sodium, equivalent to 3.5 g of sodium. Thus, for the 24 hours, with administration of 2 to 2.5 L, the patient would receive a sodium load of 7 to 8.75 g. The consequences of this can be debated, but for 24 hours, more than likely, nothing will happen or be noticeable. The kidneys have a wonderful ability to “dump” excess sodium ingested in the diet, as evidenced by the average Western diet with a sodium load in the range of 4 g per day.7,8
What if I provide 0.45% NaCl instead?
Each liter provides 50% of the sodium load of 0.9% NaCl. With the 24-hour administration of 2 to 2.5 L of D5W in 0.45% NaCl, the sodium load would be 3.5 to 4.8 g, and the kidneys would dump the excess sodium.
What if I provide ‘catch-up’ fluids after 24 hours, not maintenance fluids?
Assuming only usual losses and no unusual ADH stimulation except for the physiologic stimuli from volume depletion for 24 hours, our patient would lose 2 kg (1 L fluid loss = 1 kg weight loss) and 87 mEq of sodium. This is approximately 4.5% dehydration; thus, other than increased thirst, no physical findings of volume depletion would be clinically evident.

However, serum osmolality and sodium would increase. After 24 hours of nothing by mouth with usual fluid losses, there would be a rise in serum osmolality of 13.5 mOsm/L (a rise in sodium of 6 to 7 mEq/L), which would stimulate ADH in an attempt to minimize further urinary losses. There would be an intracellular volume loss of 1.3 L (Table 1). Clinically, just as with the administration of 0.9% sodium, these changes would not likely be of any clinical consequence in the first 24 hours.
SCENARIO 2: IMPAIRED WATER EXCRETION, AND FLUIDS GIVEN
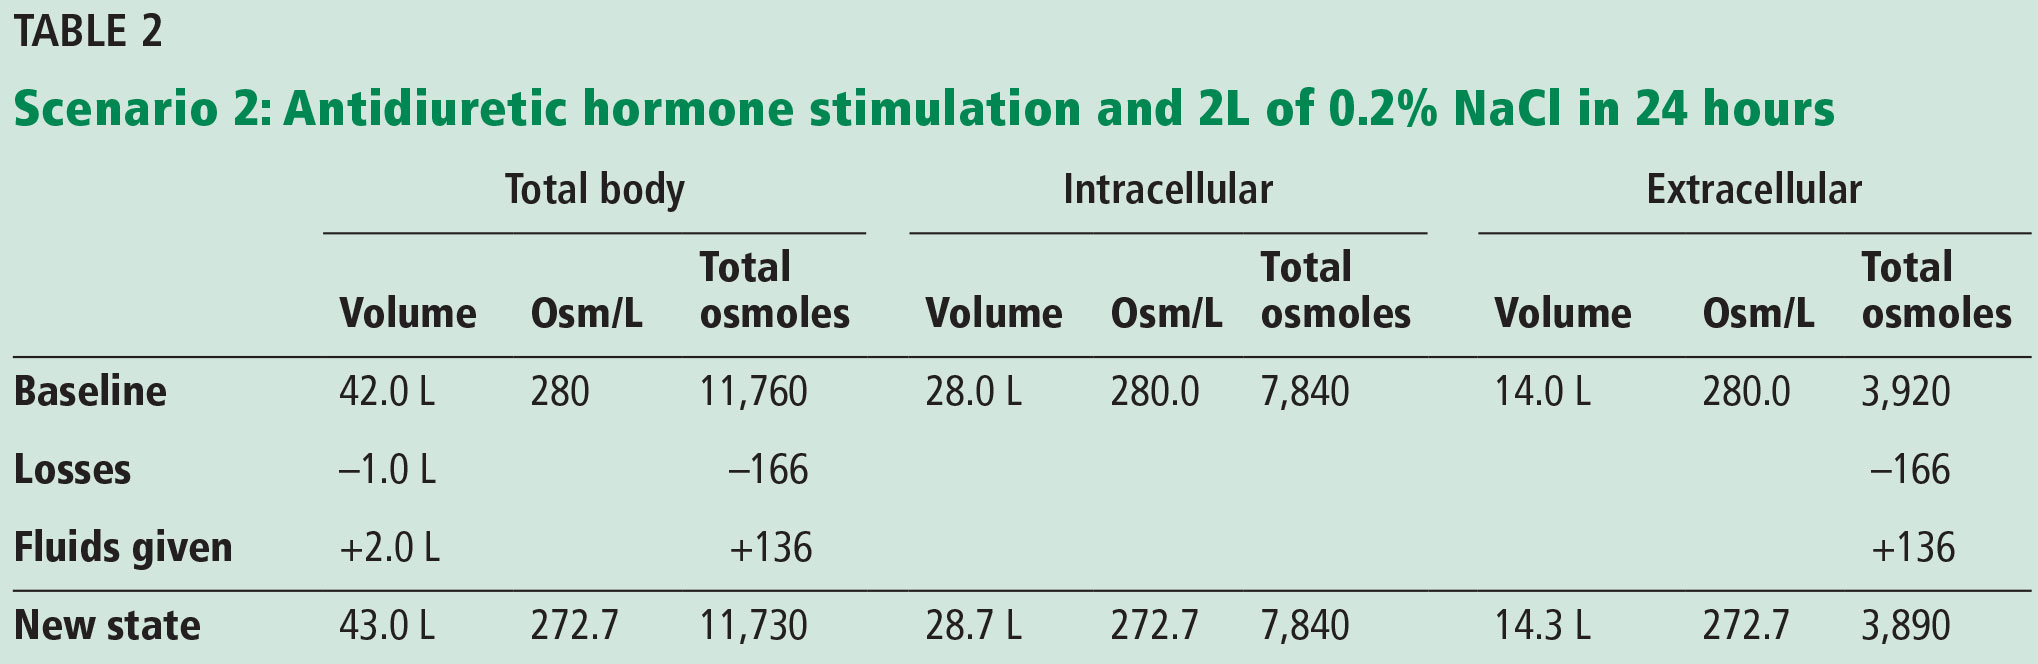
If the patient is euvolemic but has or is at risk for ADH stimulation,1,9 providing maintenance IV fluids according to the NICE or Holliday-Segar recommendations (a total of 2 L of 0.2% NaCl = 34 mEq Na/L = 68 mOsm/L) would result in an excess of free water, as an increase in ADH secretion impairs free water clearance. A potential scenario with impaired water excretion is shown in Table 2.
After 24 hours, the patient’s serum osmolality would drop by about 7 mOsm/L, and the serum sodium would decrease by 3 or 4 mEq. The consequence of the intracellular fluid shift would be seen by the expansion of the intracellular volume from 28 to 28.7 L.
If this patient were to have received 2 L of 0.9% NaCl (308 mOsm/L × 2 L = 616 Osm) as suggested by Moritz and Ayus,1 the result would be a serum osmolality of 284 mOsm/L, thus avoiding hyponatremia and intracellular fluid shifts.
THE BOTTOM LINE
Know your patient, answer the clinical questions noted above, and decide.
For a euvolemic patient with normal serum sodium, GFR greater than 60 mL/1.73 m2, and no ADH stimulation, for 24 hours it probably doesn’t matter that much, but a daily reassessment of the continued need for and type of intravenous fluids is critical.
For patients not meeting the criteria noted above such as a patient with systolic or diastolic heart failure, advanced or end-stage renal disease puts the patient at risk for early potential complications of either hyponatremia or sodium overload. For these patients, maintenance intravenous fluids need to be chosen wisely. Daily weights, examinations, and laboratory testing will let you know if something is not right and will allow for early detection and treatment.
- Mortiz ML, Ayus JC. Maintenance intravenous fluids in acutely ill patients. N Engl J Med 2015; 373(14):1350–1360. doi:10.1056/NEJMra1412877
- Feld LG, Neuspiel DR, Foster BA, et al; Subcommittee on Fluid and Electrolyte Therapy. Clinical practice guideline: maintenance intravenous fluids in children. Pediatrics 2018;142(6). doi:10.1542/peds.2018-3083
- Sterns RH. Maintenance and replacement fluid therapy in adults. www.uptodate.com/contents/maintenance-and-replacement-fluid-therapy-in-adults. Accessed August 21, 2019.
- Shafiee MA, Bohn D, Hoorn EJ, Halperin ML. How to select optimal maintenance intravenous fluid therapy. QJM 2003; 96(8):601–610. doi:10.1093/qjmed/hcg101
- National Institute for Health and Care Excellence (NICE). Intravenous fluid therapy in adults in hospital. www.nice.org.uk/guidance/cg174. Accessed August 21, 2019.
- Holliday MA, Segar WE. The maintenance need for water in parenteral fluid therapy. Pediatrics 1957; 19(5):823–832. pmid:13431307
- Appel LJ, Foti K. Sources of dietary sodium: implications for patients, physicians, and policy. Circulation 2017; 135(19):1784–1787. doi:10.1161/CIRCULATIONAHA.117.027933
- Harnack LJ, Cogswell ME, Shikany JM, et al. Sources of sodium in US adults from 3 geographic regions. Circulation 2017; 135(19):1775–1783. doi:10.1161/CIRCULATIONAHA.116.024446
- Sterns RH. Pathophysiology and etiology of the syndrome of inappropriate antidiuretic hormone secretion (SIADH). www.uptodate.com/contents/pathophysiology-and-etiology-of-the-syndrome-of-inappropriate-antidiuretic-hormone-secretion-siadh. Accessed August 21, 2019.
My adult nonacutely ill patient, weighing 70 kg with a glomerular filtration rate (GFR) greater than 60 mL/min/1.73 m2, is admitted to the general medical service. She is to receive nothing by mouth for at least the next 24 hours for testing. Do I need to provide maintenance fluids intravenously?
The question seems like it should have an easy answer. However, there is no consensus either on the type of fluids or the need for them at all.
Mortiz and Ayus1 have described the role of maintenance intravenous (IV) fluids in acutely ill patients and made the case for isotonic saline (0.9% NaCl) to minimize the risk of hyponatremia, while acknowledging that it provides 7 to 10 g of sodium per day.
Recommendations for IV fluids for nonacutely ill hospitalized patients range from isotonic solutions such as 0.9% NaCl and lactated Ringer’s, to hypotonic fluids such as 5% dextrose in water (D5W) in 0.45% NaCl and D5W in 0.2% NaCl.2–5
The 2013 guidelines of the UK National Institute for Health and Care Excellence (NICE) recommend hypotonic fluids to provide 25 to 30 mL/kg/day of water with 1 mmol/kg/day of sodium. For a 70-kg patient (body surface area 1.7 m2), this would be 1,750 to 2,000 mL of water, with a maximum of 70 mEq/L of sodium (35 mEq/L).5 An option would be D5W in 0.2% NaCl, which has 34 mEq/L of sodium.
When choosing maintenance IV fluids, we need to consider the following questions:
- What is my patient’s volume status?
- What is the baseline serum sodium and renal function?
- Are there comorbid conditions that may affect antidiuretic hormone (ADH) status such as physiologic stimulation from volume depletion, drugs, pathologic medical conditions, or syndrome of inappropriate ADH stimulation?
- Will my patient be receiving strictly nothing by mouth?
- Are there unusual fluid losses?
SCENARIO 1: ‘USUAL’ MAINTENANCE
If the patient is euvolemic, with a normal serum osmolality, a GFR more than 60 mL/min/1.73 m2, no stimuli for ADH secretion, and no unusual fluid losses, “usual” maintenance would be expected. The usual volume for this patient can be estimated by the following formulas:
- Maintenance volume: 2,550 mL (1,500 mL × 1.7 m2 body surface area)
- Holliday-Segar method6: 2,500 mL (1,500 mL plus 20 mL/kg for every kilogram over 20 kg).
The usual sodium can be also estimated by the following formulas:
- 2 g Na/day = 2,000 mg/day = 87 mEq/day
- Holliday-Segar6: 3 mEq Na/100 mL and 2 mEq K/100 mL of maintenance fluid.
Maintenance IV fluids for our nonacutely ill adult patient could be:
- NICE guideline5: D5W in 0.2% NaCl with 20 mEq KCl, to run at 75 mL/hour
- Holliday-Segar method6: D5W in 0.2% NaCl with 20 mEq KCl, to run at 100 mL/hour.
Twenty-four hours later, assuming no unusual fluid losses or stimulation of ADH secretion, our patient would weigh the same and would have no significant change in serum osmolality.
OTHER OPTIONS
What if I provide 0.9% NaCl instead?
Each 1 L of normal saline provides 154 mEq of sodium, equivalent to 3.5 g of sodium. Thus, for the 24 hours, with administration of 2 to 2.5 L, the patient would receive a sodium load of 7 to 8.75 g. The consequences of this can be debated, but for 24 hours, more than likely, nothing will happen or be noticeable. The kidneys have a wonderful ability to “dump” excess sodium ingested in the diet, as evidenced by the average Western diet with a sodium load in the range of 4 g per day.7,8
What if I provide 0.45% NaCl instead?
Each liter provides 50% of the sodium load of 0.9% NaCl. With the 24-hour administration of 2 to 2.5 L of D5W in 0.45% NaCl, the sodium load would be 3.5 to 4.8 g, and the kidneys would dump the excess sodium.
What if I provide ‘catch-up’ fluids after 24 hours, not maintenance fluids?
Assuming only usual losses and no unusual ADH stimulation except for the physiologic stimuli from volume depletion for 24 hours, our patient would lose 2 kg (1 L fluid loss = 1 kg weight loss) and 87 mEq of sodium. This is approximately 4.5% dehydration; thus, other than increased thirst, no physical findings of volume depletion would be clinically evident.
However, serum osmolality and sodium would increase. After 24 hours of nothing by mouth with usual fluid losses, there would be a rise in serum osmolality of 13.5 mOsm/L (a rise in sodium of 6 to 7 mEq/L), which would stimulate ADH in an attempt to minimize further urinary losses. There would be an intracellular volume loss of 1.3 L (Table 1). Clinically, just as with the administration of 0.9% sodium, these changes would not likely be of any clinical consequence in the first 24 hours.
SCENARIO 2: IMPAIRED WATER EXCRETION, AND FLUIDS GIVEN
If the patient is euvolemic but has or is at risk for ADH stimulation,1,9 providing maintenance IV fluids according to the NICE or Holliday-Segar recommendations (a total of 2 L of 0.2% NaCl = 34 mEq Na/L = 68 mOsm/L) would result in an excess of free water, as an increase in ADH secretion impairs free water clearance. A potential scenario with impaired water excretion is shown in Table 2.
After 24 hours, the patient’s serum osmolality would drop by about 7 mOsm/L, and the serum sodium would decrease by 3 or 4 mEq. The consequence of the intracellular fluid shift would be seen by the expansion of the intracellular volume from 28 to 28.7 L.
If this patient were to have received 2 L of 0.9% NaCl (308 mOsm/L × 2 L = 616 Osm) as suggested by Moritz and Ayus,1 the result would be a serum osmolality of 284 mOsm/L, thus avoiding hyponatremia and intracellular fluid shifts.
THE BOTTOM LINE
Know your patient, answer the clinical questions noted above, and decide.
For a euvolemic patient with normal serum sodium, GFR greater than 60 mL/1.73 m2, and no ADH stimulation, for 24 hours it probably doesn’t matter that much, but a daily reassessment of the continued need for and type of intravenous fluids is critical.
For patients not meeting the criteria noted above such as a patient with systolic or diastolic heart failure, advanced or end-stage renal disease puts the patient at risk for early potential complications of either hyponatremia or sodium overload. For these patients, maintenance intravenous fluids need to be chosen wisely. Daily weights, examinations, and laboratory testing will let you know if something is not right and will allow for early detection and treatment.
- Mortiz ML, Ayus JC. Maintenance intravenous fluids in acutely ill patients. N Engl J Med 2015; 373(14):1350–1360. doi:10.1056/NEJMra1412877
- Feld LG, Neuspiel DR, Foster BA, et al; Subcommittee on Fluid and Electrolyte Therapy. Clinical practice guideline: maintenance intravenous fluids in children. Pediatrics 2018;142(6). doi:10.1542/peds.2018-3083
- Sterns RH. Maintenance and replacement fluid therapy in adults. www.uptodate.com/contents/maintenance-and-replacement-fluid-therapy-in-adults. Accessed August 21, 2019.
- Shafiee MA, Bohn D, Hoorn EJ, Halperin ML. How to select optimal maintenance intravenous fluid therapy. QJM 2003; 96(8):601–610. doi:10.1093/qjmed/hcg101
- National Institute for Health and Care Excellence (NICE). Intravenous fluid therapy in adults in hospital. www.nice.org.uk/guidance/cg174. Accessed August 21, 2019.
- Holliday MA, Segar WE. The maintenance need for water in parenteral fluid therapy. Pediatrics 1957; 19(5):823–832. pmid:13431307
- Appel LJ, Foti K. Sources of dietary sodium: implications for patients, physicians, and policy. Circulation 2017; 135(19):1784–1787. doi:10.1161/CIRCULATIONAHA.117.027933
- Harnack LJ, Cogswell ME, Shikany JM, et al. Sources of sodium in US adults from 3 geographic regions. Circulation 2017; 135(19):1775–1783. doi:10.1161/CIRCULATIONAHA.116.024446
- Sterns RH. Pathophysiology and etiology of the syndrome of inappropriate antidiuretic hormone secretion (SIADH). www.uptodate.com/contents/pathophysiology-and-etiology-of-the-syndrome-of-inappropriate-antidiuretic-hormone-secretion-siadh. Accessed August 21, 2019.
A 66-year-old man with abnormal thyroid function tests
A 66-year-old man presented to the emergency department with increasing shortness of breath and productive cough, which had begun 5 days earlier. Three years previously, he had been diagnosed with chronic obstructive pulmonary disease (COPD).
One week before the current presentation, he developed a sore throat, rhinorrhea, and nasal congestion, and the shortness of breath had started 2 days after that. Although he could speak in sentences, he was breathless even at rest. His dyspnea was associated with noisy breathing and cough productive of yellowish sputum; there was no hemoptysis. He reported fever, but he had no chills, night sweats, chest pain, or paroxysmal nocturnal dyspnea. The review of other systems was unremarkable.
His COPD was known to be mild, in Global Initiative for Chronic Obstructive Lung Disease (GOLD) grade 1, group A. His postbronchodilator ratio of forced expiratory volume in 1 second (FEV1) to forced vital capacity (FVC) was less than 0.70, and his FEV1 was 84% of predicted. Apart from mild intermittent cough with white sputum, his COPD had been under good control with inhaled ipratropium 4 times daily and inhaled albuterol as needed. He said he did not have shortness of breath except when hurrying on level ground or walking up a slight hill (Modified Medical Research Council dyspnea scale grade 1; COPD Assessment Test score < 10). In the last 3 years, he had 2 exacerbations of COPD, 1 year apart, both requiring oral prednisone and antibiotic therapy.
Other relevant history included hypertension and dyslipidemia of 15-year duration, for which he was taking candesartan 16 mg twice daily and atorvastatin 20 mg daily. He was compliant with his medications.
Though he usually received an influenza vaccine every year, he did not get it the previous year. Also, 3 years previously, he received the 23-valent pneumococcal polysaccharide vaccine (PPSV23), and the year before that he received the pneumococcal conjugate vaccine (PCV13). In addition, he was immunized against herpes zoster and tetanus.
The patient had smoked 1 pack per day for the past 38 years. His primary care physician had advised him many times to quit smoking. He had enrolled in a smoking cessation program 2 years previously, in which he received varenicline in addition to behavioral counseling in the form of motivational interviewing and a telephone quit-line. Nevertheless, he continued to smoke.
He was a retired engineer. He did not drink alcohol or use illicit drugs.
PHYSICAL EXAMINATION
On physical examination, the patient was sitting up in bed, leaning forward. He was alert and oriented but was breathing rapidly and looked sick. He had no cyanosis, clubbing, pallor, or jaundice. His blood pressure was 145/90 mm Hg, heart rate 110 beats per minute and regular, respiratory rate 29 breaths per minute, and oral temperature 38.1°C (100.6°F). His oxygen saturation was 88% while breathing room air. His body mass index was 27.1 kg/m2.
His throat was mildly congested. His neck veins were flat, and there were no carotid bruits. His thyroid examination was normal, without goiter, nodules, or tenderness.
Intercostal retractions were noted around the anterolateral costal margins. He had no chest wall deformities. Chest expansion was reduced bilaterally. There was hyperresonance bilaterally. Expiratory wheezes were heard over both lungs, without crackles.
His heart had no murmurs or added sounds. There was no lower-limb edema or swelling. The rest of his physical examination was unremarkable.

Results of initial laboratory testing are shown in Table 1.
Assessment: A 66-year-old man with GOLD grade 1, group A COPD, presenting with a severe exacerbation, most likely due to viral bronchitis.
INITIAL MANAGEMENT
The patient was given oxygen 28% by Venturi mask, and his oxygen saturation went up to 90%. He was started on nebulized albuterol 2.5 mg with ipratropium bromide 500 µg every 4 hours, prednisone 40 mg orally daily for 5 days, and ceftriaxone 1 g intravenously every 24 hours. The first dose of each medication was given in the emergency department.
The patient was then admitted to a progressive care unit, where he was placed on noninvasive positive pressure ventilation, continuous cardiac monitoring, and pulse oximetry. He was started on enoxaparin 40 mg subcutaneously daily to prevent venous thromboembolism, and the oral medications he had been taking at home were continued. Because he was receiving a glucocorticoid, his blood glucose was monitored in the fasting state, 2 hours after each meal, and as needed.
Two hours after he started noninvasive positive pressure ventilation, his arterial blood gases were remeasured and showed the following results:
- pH 7.35
- Partial pressure of carbon dioxide (Paco2) 52 mm Hg
- Bicarbonate 28 mmol/L
- Partial pressure of oxygen (Pao2) 60 mm Hg
- Oxygen saturation 90%.
HOSPITAL COURSE
On hospital day 3, his dyspnea had slightly improved. His respiratory rate was 26 to 28 breaths per minute. His oxygen saturation remained between 90% and 92%.
At 10:21 pm, his cardiac monitor showed an episode of focal atrial tachycardia at a rate of 129 beats per minute that lasted for 3 minutes and 21 seconds, terminating spontaneously. He denied any change in his clinical condition during the episode, with no chest pain, palpitation, or change in dyspnea. There was no change in his vital signs. He had another similar asymptomatic episode lasting 4 minutes and 9 seconds at 6:30 am of hospital day 4.
Because of these episodes, the attending physician ordered thyroid function tests.
THYROID FUNCTION TESTING
1. Which thyroid function test is most likely to be helpful in the assessment of this patient’s thyroid status?
- Serum thyroid-stimulating hormone (TSH) alone
- Serum TSH and total thyroxine (T4)
- Serum TSH and total triiodothyronine (T3)
- Serum TSH and free T4
- Serum TSH and free T3
There are several tests to assess thyroid function: the serum TSH, total T4, free T4, total T3, and free T3 concentrations.1
In normal physiology, TSH from the pituitary stimulates the thyroid gland to produce and secrete T4 and T3, which in turn inhibit TSH secretion through negative feedback. A negative log-linear relation exists between serum free T4 and TSH levels.2 Thus, the serum free T4 level can remain within the normal reference range even if the TSH level is high or low.
TSH assays can have different detection limits. A third-generation TSH assay with a detection limit of 0.01 mU/L is recommended for use in clinical practice.3
TSH testing alone. Given its superior sensitivity and specificity, serum TSH measurement is considered the best single test for assessing thyroid function in most cases.4 Nevertheless, measurement of the serum TSH level alone could be misleading in several situations, eg, hypothalamic or pituitary disorders, recent treatment of thyrotoxicosis, impaired sensitivity to thyroid hormone, and acute nonthyroidal illness.4

Free vs total T4 and T3 levels
Serum total T4 includes a fraction that is bound, mainly to thyroxin-binding globulin, and a very small unbound (free) fraction. The same applies to T3. Only free thyroid hormones represent the “active” fraction available for interaction with their protein receptors in the nucleus.8 Patients with conditions that can affect the thyroid-binding protein concentrations usually have altered serum total T4 and T3 levels, whereas their free hormone concentrations remain normal. Accordingly, measurement of free hormone levels, especially free T4, is usually recommended.
Although equilibrium dialysis is the method most likely to provide an accurate serum free T4 measurement, it is not commonly used because of its limited availability and high cost. Thus, most commercial laboratories use “direct” free T4 measurement or, to a lesser degree, the free T4 index.9 However, none of the currently available free T4 tests actually measure free T4 directly; rather, they estimate it.10
Commercial laboratories can provide a direct free T3 estimate, but it may be less reliable than total T3. If serum T3 measurement is indicated, serum total T3 is usually measured. However, total T3 measurement is rarely indicated for patients with hypothyroidism because it usually remains within the normal reference range.11 Nevertheless, serum total T3 measurement could be useful in patients with T3 toxicosis and in those who are acutely ill.
Accordingly, in acutely ill hospitalized patients like ours, measuring serum TSH using a third-generation assay and free T4 is essential to assess thyroid function. Many clinicians also measure serum total T3.
CASE CONTINUED: LOW TSH, LOW-NORMAL FREE T4, LOW TOTAL T3
The attending physician ordered serum TSH, free T4, and total T3 measurements, which yielded the following:
- TSH 0.1 mU/L (0.5–5.0)
- Total T3 55 ng/dL (80–180)
- Free T4 0.9 ng/dL (0.9–2.4).
2. Which best explains this patient’s abnormal thyroid test results?
- His acute illness
- Central hypothyroidism due to pituitary infarction
- His albuterol therapy
- Subclinical thyrotoxicosis
- Hashimoto thyroiditis
Since euthyroid patients with an acute illness may have abnormal thyroid test results (Table 2),5–7 thyroid function testing is not recommended unless there is a strong indication for it, such as new-onset atrial fibrillation, atrial flutter, or focal atrial tachycardia.1 In such patients, it is important to know whether the test abnormalities represent true thyroid disorder or are the result of a nonthyroidal illness.
 to triiodothyronine (T3), reverse T3, and diiodothyronine (T2) by deiodinase types 1, 2, and 3 (D1, D2, D3) in healthy people and in patients with nonthyroidal illness.")

Thyroid function testing in patients with nonthyroidal illness usually shows low serum total T3, normal or low serum TSH, and normal, low, or high serum free T4. However, transient mild serum TSH elevation can be seen in some patients during the recovery period.16 These abnormalities with their mechanisms are shown in Table 2.5–7 In several commercial kits, serum direct free T4 can be falsely decreased or increased.8
THE DIFFERENTIAL DIAGNOSIS
Our patient had low serum TSH, low-normal serum direct free T4, and low serum total T3. This profile could be caused by a nonthyroidal illness, “true” central hypothyroidism, or his glucocorticoid treatment. The reason we use the term “true” in this setting is that some experts suggest that the thyroid function test abnormalities in patients with acute nonthyroidal illness represent a transient central hypothyroidism.17 The clinical presentation is key in differentiating true central hypothyroidism from nonthyroidal illness.
In addition, measuring serum cortisol may help to differentiate between the 2 states, as it would be elevated in patients with nonthyroidal illness as part of a stress response but low in patients with true central hypothyroidism, since it is usually part of combined pituitary hormone deficiency.18 Of note, some critically ill patients have low serum cortisol because of transient central adrenal insufficiency.19,20
The serum concentration of reverse T3 has been suggested as a way to differentiate between hypothyroidism (low) and nonthyroidal illness (high); however, further studies showed that it does not reliably differentiate between the conditions.21
GLUCOCORTICOIDS AND THYROID FUNCTION TESTS
By inhibiting D1, glucocorticoids can decrease peripheral conversion of T4 to T3 and thus decrease serum total T3. This effect depends on the type and dose of the glucocorticoid and the duration of therapy.
In one study,22 there was a significant reduction in serum total T3 concentration 24 hours after a single oral dose of dexamethasone 12 mg in normal participants. This effect lasted 48 hours, after which serum total T3 returned to its pretreatment level.
In another study,23 a daily oral dose of betamethasone 1.5 mg for 5 days did not significantly reduce the serum total T3 in healthy volunteers, but a daily dose of 3 mg did. This effect was more pronounced at a daily dose of 4.5 mg, whereas a dose of 6.0 mg had no further effect.
Long-term glucocorticoid therapy also decreases serum total T4 and total T3 by lowering serum thyroid-binding globulin.24
Finally, glucocorticoids can decrease TSH secretion by directly inhibiting thyrotropin-releasing hormone.25,26 However, chronic hypercortisolism, whether endogenous or exogenous, does not cause clinically central hypothyroidism, possibly because of the negative feedback mechanism of low thyroid hormones on the pituitary and the hypothalamus.27
Other drugs including dopamine, dopamine agonists, dobutamine, and somatostatin analogues can suppress serum TSH. As with glucocorticoids, these drugs do not cause clinically evident central hypothyroidism.28 Bexarotene, a retinoid X receptor ligand used in the treatment of cutaneous T-cell lymphoma, has been reported to cause clinically evident central hypothyroidism by suppressing TSH and increasing T4 clearance.29
BETA-BLOCKERS, BETA-AGONISTS AND THYROID FUNCTION
While there is general agreement that beta-adrenergic antagonists (beta-blockers) do not affect the serum TSH concentration, conflicting data have been reported concerning their effect on other thyroid function tests. This may be due to several factors, including dose, duration of therapy, the patient’s thyroid status, and differences in laboratory methodology.30
In studies of propranolol, serum total T4 concentrations did not change or were increased with daily doses of 160 mg or more in both euthyroid participants and hyperthyroid patients31–33; serum total T3 concentrations did not change or were decreased with 40 mg or more daily34; and serum reverse T3 concentrations were increased with daily doses of 80 mg or more.31 It is most likely that propranolol exerts these changes by inhibiting D1 activity in peripheral tissues.
Furthermore, a significant decrease in serum total T3 concentrations was observed in hyperthyroid patients treated with atenolol 100 mg daily, metoprolol 100 mg daily, and alprenolol 100 mg daily, but not with sotalol 80 mg daily or nadolol (up to 240 mg daily).35,36
On the other hand, beta-adrenergic agonists have not been reported to cause significant changes in thyroid function tests.37
SUBCLINICAL THYROTOXICOSIS OR HASHIMOTO THYROIDITIS?
Our patient’s thyroid function test results are more likely due to his nonthyroidal illness and glucocorticoid therapy, as there is no clinical evidence to point to a hypothalamic-pituitary disorder accounting for true central hypothyroidism.
The other options mentioned in question 2 are unlikely to explain our patient’s thyroid function test results.
Subclinical thyrotoxicosis is characterized by suppressed serum TSH, but both serum free T4 and total T3 remain within the normal reference ranges. In addition, the serum TSH level may help to differentiate between thyrotoxicosis and nonthyroidal illness. In the former, serum TSH is usually suppressed (< 0.01 mU/L), whereas in the latter it is usually low but detectable (0.05– 0.3 mU/L).38,39
Hashimoto thyroiditis is a chronic autoimmune thyroid disease characterized by diffuse lymphocytic infiltration of the thyroid gland. Almost all patients with Hashimoto thyroiditis have elevated levels of antibodies to thyroid peroxidase or thyroglobulin.40 Clinically, patients with Hashimoto thyroiditis can either be hypothyroid or have normal thyroid function, which is not the case in our patient.
CASE CONTINUED
An endocrinologist, consulted for a second opinion, agreed that the patient’s thyroid function test results were most likely due to his nonthyroidal illness and glucocorticoid therapy.
3. In view of the endocrinologist’s opinion, which should be the next step in the management of the patient’s thyroid condition?
- Start levothyroxine (T4) therapy
- Start liothyronine (T3) therapy
- Start N-acetylcysteine therapy
- Start thyrotropin-releasing hormone therapy
- Remeasure thyroid hormones after full recovery from his acute illness
It is not clear whether the changes in thyroid hormone levels during an acute illness are a pathologic alteration for which thyroid hormone therapy may be beneficial, or a physiologic adaptation for which such therapy would not be indicated.41
However, current data argue against thyroid hormone therapy using T4 or T3 for patients with nonthyroidal illness syndrome (also called euthyroid sick syndrome).42 Indeed, several randomized controlled trials showed that thyroid hormone therapy is not beneficial in such patients and may be detrimental.41,43
Therapies other than thyroid hormone have been investigated to ameliorate thyroid hormone abnormalities in patients with nonthyroidal illness. These include N-acetylcysteine, thyrotropin-releasing hormone therapy, and nutritional support.
Some studies showed that giving N-acetylcysteine, an antioxidant, increased serum T3 and decreased serum reverse T3 concentrations in patients with acute myocardial infarction.44 Nevertheless, the mortality rate and length of hospitalization were not affected. Further studies are needed to know whether N-acetylcysteine therapy is beneficial for such patients.
Similarly, a study using a thyrotropin-releasing hormone analogue along with growth hormone-releasing peptide 2 showed an increase in serum TSH, T4, and T3 levels in critically ill patients.45 The benefit of this therapy has yet to be determined. On the other hand, early nutritional support was reported to prevent thyroid hormonal changes in patients postoperatively.46
Measuring thyroid hormone levels after full recovery is the most appropriate next step in our patient, as the changes in thyroid hormone concentrations subside as the acute illness resolves.47
CASE CONTINUED
The patient continued to improve. On hospital day 6, he was feeling better but still had mild respiratory distress. There had been no further episodes of arrhythmia since day 4. His blood pressure was 136/86 mm Hg, heart rate 88 beats per minute and regular, respiratory rate 18 breaths per minute, and oral temperature 37.1°C. His oxygen saturation was 92% on room air.
Before discharge, he was encouraged to quit smoking. He was offered behavioral counseling and medication therapy, but he only said that he would think about it. He was discharged on oral cefixime for 4 more days and was instructed to switch to a long-acting bronchodilator along with his other home medications and to return in 1 week to have his thyroid hormones checked.
One week later, his laboratory results were:
- TSH 11.2 mU/L (reference range 0.5–5.0)
- Free T4 1.2 ng/dL (0.9–2.4)
- Total T3 92 ng/dL (80–180).
Clinically, the patient was euthyroid, and examination of his thyroid was unremarkable.
4. Based on these last test results, which statement is correct?
- Levothyroxine therapy should be started
- His serum TSH elevation is most likely transient
- Thyroid ultrasonography is strongly indicated
- A radioactive iodine uptake study should be performed
- Measurement of thyroid-stimulating immunoglobulins is indicated
During recovery from nonthyroidal illness, some patients may have elevated serum TSH levels that are usually transient and modest (< 20 mU/L).48 Normalization of the thyroid function tests including serum TSH may take several weeks49 or months.50 However, a systematic review found that the likelihood of permanent primary hypothyroidism is high in patients with serum TSH levels higher than 20 mU/L during the recovery phase of their nonthyroidal illness.51
Ultrasonography is useful for evaluating patients with thyroid nodules or goiter but is of little benefit for patients like ours, in whom the thyroid is normal on examination.
Similarly, a radioactive iodine uptake study is not indicated, as it is principally used to help differentiate between types of thyrotoxicosis. (Radioactive iodine is also used to treat differentiated thyroid cancer.)
Thyroid-stimulating immunoglobins are TSH receptor-stimulating antibodies that cause Graves disease. Nevertheless, measuring them is not routinely indicated for its diagnosis. However, their measurement is of significant help in the diagnosis of Graves disease if a radioactive iodine uptake study cannot be performed (as in pregnancy) and in atypical presentations such as euthyroid Graves ophthalmopathy.52 Other indications for thyroid-stimulating immunoglobin measurement are beyond the scope of the article. Our patient’s test results are not consistent with hyperthyroidism, so measuring thyroid-stimulating immunoglobins is not indicated.
CASE CONCLUSION: BETTER, BUT STILL SMOKING
The patient missed his 1-month clinic follow-up, but he visited the clinic for follow-up 3 months later. He was feeling well with no complaints. Test results including serum TSH, free T4, and total T3 were within normal ranges. His COPD was under control, with an FEV1 88% of predicted.
He was again encouraged to quit smoking and was offered drug therapy and behavioral counseling, but he declined. In addition, he was instructed to adhere to his annual influenza vaccination.
KEY POINTS
- In patients with acute illness, it is recommended that thyroid function not be assessed unless there is a strong indication.
- If thyroid function assessment is indicated for critically ill patients, serum TSH and free T4 concentrations should be measured. Some clinicians also measure serum total T3 level.
- Thyroid function testing in critically ill patients usually shows low serum total T3, normal or low serum TSH, and normal or low serum free T4.
- Many drugs can alter thyroid hormone levels.
- Thyroid hormone therapy is not recommended for critically ill patients with low T3, low T4, or both.
- During recovery from nonthyroidal illness, some patients may have mild elevation in serum TSH levels (< 20 mU/L).
- Thyroid hormone levels may take several weeks or months to return to normal after the acute illness.
- Patients with serum TSH levels higher than 20 mU/L during the recovery phase of their nonthyroidal illness are more likely to have permanent primary hypothyroidism.
- Lamb EJ, Martin J. Thyroid function tests: often justified in the acutely ill. Ann Clin Biochem 2000; 37(pt 2):158–164. doi:10.1258/0004563001899159
- Spencer CA, LoPresti JS, Patel A, et al. Applications of a new chemiluminometric thyrotropin assay to subnormal measurement. J Clin Endocrinol Metab 1990; 70(2):453–460. doi:10.1210/jcem-70-2-453
- Ross DS, Ardisson LJ, Meskell MJ. Measurement of thyrotropin in clinical and subclinical hyperthyroidism using a new chemiluminescent assay. J Clin Endocrinol Metab 1989; 69(3):684–688. doi:10.1210/jcem-69-3-684
- Koulouri O, Moran C, Halsall D, Chatterjee K, Gurnell M. Pitfalls in the measurement and interpretation of thyroid function tests. Best Pract Res Clin Endocrinol Metab 2013; 27(6):745–762. doi:10.1016/j.beem.2013.10.003
- Lechan RM, Fekete C. Role of thyroid hormone deiodination in the hypothalamus. Thyroid 2005; 15(8):883–897. doi:10.1089/thy.2005.15.883
- Chopra IJ, Hershman JM, Pardridge WM, Nicoloff JT. Thyroid function in nonthyroidal ilnesses. Ann Intern Med 1983; 98(6):946–957. doi:10.7326/0003-4819-98-6-946
- Chopra IJ, Solomon DH, Hepner HW, Mortenstein AA. Misleadingly low free thyroxine index and usefulness of reverse triiodothyronine measurement in nonthyroidal illnesses. Ann Intern Med 1979; 90(6):905–912. doi:10.7326/0003-4819-90-6-905
- Pontecorvi A, Robbins J. The plasma membrane and thyroid hormone entry into cells. Trends Endocrinol Metab 1989; 1(2):90–94. pmid:18411097
- Hennemann G, Krenning EP. Pitfalls in the interpretation of thyroid function tests in old age and non-thyroidal illness. Horm Res 1987; 26(1–4):100–104. doi:10.1159/000180688
- Baloch Z, Carayon P, Conte-Devolx B, et al; Guidelines Committee, National Academy of Clinical Biochemistry. Laboratory medicine practice guidelines. Laboratory support for the diagnosis and monitoring of thyroid disease. Thyroid 2003; 13(1):3–126. doi:10.1089/105072503321086962
- Lum S, Nicoloff JT, Spencer CA, Kaptein EM. Peripheral tissue mechanism for maintenance of serum triiodothyronine values in a thyroxine-deficient state in man. J Clin Invest 1984; 73(2):570–575. doi:10.1172/JCI111245
- Ortiga-Carvalho TM, Chiamolera MI, Pazos-Moura CC, Wondisford FE. Hypothalamus-pituitary-thyroid axis. Compr Physiol 2016; 6(3):1387–1428. doi:10.1002/cphy.c150027
- de Vries EM, Fliers E, Boelen A. The molecular basis of the non-thyroidal illness syndrome. J Endocrinol 2015; 225(3):R67–R81. doi:10.1530/JOE-15-0133
- Chopra IJ, Huang TS, Beredo A, Solomon DH, Teco GN, Mean JF. Evidence for an inhibitor of extrathyroidal conversion of thyroxine to 3, 5, 3'-triiodothyronine in sera of patients with nonthyroidal illnesses. J Clin Endocrinol Metab 1985; 60(4):666–672. doi:10.1210/jcem-60-4-666
- Peeters RP, Debaveye Y, Fliers E, Visser TJ. Changes within the thyroid axis during critical illness. Crit Care Clin 2006; 22(1):41–55. doi:10.1016/j.ccc.2005.08.006
- Spencer C, Eigen A, Shen D, et al. Specificity of sensitive assays of thyrotropin (TSH) used to screen for thyroid disease in hospitalized patients. Clin Chem 1987; 33(8):1391–1396. pmid:3301067
- Adler SM, Wartofsky L. The nonthyroidal illness syndrome. Endocrinol Metab Clin North Am 2007; 36(3):657–672. doi:10.1016/j.ecl.2007.04.007
- Persani L. Central hypothyroidism: pathogenic, diagnostic, and therapeutic challenges. J Clin Endocrinol Metab 2012; 97(9):3068–3078. doi:10.1210/jc.2012-1616
- Kidess AI, Caplan RH, Reynertson RH, Wickus GG, Goodnough DE. Transient corticotropin deficiency in critical illness. Mayo Clin Proc 1993; 68(5):435–441. doi:10.1016/s0025-6196(12)60188-8
- Lamberts SW, Bruining HA, De Jong FH. Corticosteroid therapy in severe illness. N Engl J Med 1997; 337(18):1285–1292. doi:10.1056/NEJM199710303371807
- Burmeister LA. Reverse T3 does not reliably differentiate hypothyroid sick syndrome from euthyroid sick syndrome. Thyroid 1995; 5(6):435–441. doi:10.1089/thy.1995.5.435
- Duick DS, Warren DW, Nicoloff JT, Otis CL, Croxson MS. Effect of single dose dexamethasone on the concentration of serum triiodothyronine in man. J Clin Endocrinol Metab 1974; 39(6):1151–1154. doi:10.1210/jcem-39-6-1151
- Gamstedt A, Järnerot G, Kågedal B. Dose related effects of betamethasone on iodothyronines and thyroid hormone-binding proteins in serum. Acta Endocrinol (Copenh) 1981; 96(4):484–490. doi:10.1530/acta.0.0960484
- Wartofsky L, Burman KD. Alterations in thyroid function in patients with systemic illness: the “euthyroid sick syndrome.” Endocr Rev 1982; 3(2):164–217. doi:10.1210/edrv-3-2-164
- Wilber JF, Utiger RD. The effect of glucocorticoids on thyrotropin secretion. J Clin Invest 1969; 48(11):2096–2103. doi:10.1172/JCI106176
- Nicoloff JT, Fisher DA, Appleman MD Jr. The role of glucocorticoids in the regulation of thyroid function in man. J Clin Invest 1970; 49(10):1922–1929. doi:10.1172/JCI106411
- Surks MI, Sievert R. Drugs and thyroid function. N Engl J Med 1995; 333(25):1688–1694. doi:10.1056/NEJM199512213332507
- Haugen BR. Drugs that suppress TSH or cause central hypothyroidism. Best Pract Res Clin Endocrinol Metab 2009; 23(6):793–800. doi:10.1016/j.beem.2009.08.003
- Sherman SI, Gopal J, Haugen BR, et al. Central hypothyroidism associated with retinoid X receptor–selective ligands. N Engl J Med 1999; 340(14):1075–1079. doi:10.1056/NEJM199904083401404
- Murchison LE, How J, Bewsher PD. Comparison of propranolol and metoprolol in the management of hyperthyroidism. Br J Clin Pharmacol 1979; 8(6):581–587. doi:10.1111/j.1365-2125.1979.tb01048.x
- Faber J, Friis T, Kirkegaard C, et al. Serum T4, T3 and reverse T3 during treatment with propranolol in hyperthyroidism, L-T4 treated myxedema and in normal man. Horm Metab Res 1979; 11(1):34–36. doi:10.1055/s-0028-1092678
- Kristensen BO, Weeke J. Propranolol-induced increments in total and free serum thyroxine in patients with essential hypertension. Clin Pharmacol Ther 1977; 22(6):864–867. doi:10.1002/cpt1977226864
- Murchison LE, Bewsher PD, Chesters MI, Ferrier WR. Comparison of propranolol and practolol in the management of hyperthyroidism. Br J Clin Pharmacol 1976; 3(2):273–277. doi:10.1111/j.1365-2125.1976.tb00603.x
- Lotti G, Delitala G, Devilla L, Alagna S, Masala A. Reduction of plasma triiodothyronine (T3) induced by propranolol. Clin Endocrinol 1977; 6(6):405–410. doi:10.1111/j.1365-2265.1977.tb03322.x
- Perrild H, Hansen JM, Skovsted L, Christensen LK. Different effects of propranolol, alprenolol, sotalol, atenolol and metoprolol on serum T3 and serum rT3 in hyperthyroidism. Clin Endocrinol (Oxf) 1983; 18(2):139–142. pmid:6133659
- Reeves RA, From GL, Paul W, Leenen FH. Nadolol, propranolol, and thyroid hormones: evidence for a membrane-stabilizing action of propranolol. Clin Pharmacol Ther 1985; 37(2):157–161. doi:10.1038/clpt.1985.28
- Walker N, Jung RT, Jennings G, James WP. The effect of a beta-receptor agonist (salbutamol) on peripheral thyroid metabolism in euthyroid subjects. Horm Metab Res 1981; 13(10):590–591. doi:10.1055/s-2007-1019346
- Melmed S, Geola FL, Reed AW, Pekary AE, Park J, Hershman JM. A comparison of methods for assessing thyroid function in nonthyroidal illness. J Clin Endocrinol Metab 1982; 54(2):300–306. doi:10.1210/jcem-54-2-300
- Docter R, Krenning E, De Jong M, Hennemann G. The sick euthyroid syndrome: changes in thyroid hormone serum parameters and hormone metabolism. Clin Endocrinol (Oxf) 1993; 39(5):499–518. pmid:8252737
- Mariotti S, Caturegli P, Piccolo P, Barbesino G, Pinchera A. Antithyroid peroxidase autoantibodies in thyroid diseases. J Clin Endocrinol Metab 1990; 71(3):661–669. doi:10.1210/jcem-71-3-661
- De Groot LJ. Non-thyroidal illness syndrome is a manifestation of hypothalamic-pituitary dysfunction, and in view of current evidence, should be treated with appropriate replacement therapies. Crit Care Clin 2006; 22(1):57–86. doi:10.1016/j.ccc.2005.10.001
- Jonklaas J, Bianco AC, Bauer AJ, et al; American Thyroid Association Task Force on Thyroid Hormone Replacement. Guidelines for the treatment of hypothyroidism: prepared by the American Thyroid Association Task Force on Thyroid Hormone Replacement. Thyroid 2014; 24(12):1670–1751. doi:10.1089/thy.2014.0028
- Kaptein EM, Beale E, Chan LS. Thyroid hormone therapy for obesity and nonthyroidal illnesses: a systematic review. J Clin Endocrinol Metab 2009; 94(10):3663–3675. doi:10.1210/jc.2009-0899
- Vidart J, Wajner SM, Leite RS, et al. N-acetylcysteine administration prevents nonthyroidal illness syndrome in patients with acute myocardial infarction: a randomized clinical trial. J Clin Endocrinol Metab 2014; 99(12):4537–4545. doi:10.1210/jc.2014-2192
- Van den Berghe G, Wouters P, Weekers F, et al. Reactivation of pituitary hormone release and metabolic improvement by infusion of growth hormone-releasing peptide and thyrotropin-releasing hormone in patients with protracted critical illness. J Clin Endocrinol Metab 1999; 84(4):1311–1323. doi:10.1210/jcem.84.4.5636
- Langouche L, Vander Perre S, Marques M, et al. Impact of early nutrient restriction during critical illness on the nonthyroidal illness syndrome and its relation with outcome: a randomized, controlled clinical study. J Clin Endocrinol Metab 2013; 98(3):1006–1013. doi:10.1210/jc.2012-2809
- Economidou F, Douka E, Tzanela M, Nanas S, Kotanidou A. Thyroid function during critical illness. Hormones (Athens) 2011; 10(2):117–124. doi:10.14310/horm.2002.1301
- Hamblin PS, Dyer SA, Mohr VS, et al. Relationship between thyrotropin and thyroxine changes during recovery from severe hypothyroxinemia of critical illness. J Clin Endocrinol Metab 1986; 62(4):717–722. doi:10.1210/jcem-62-4-717
- Iglesias P, Diez JJ. Thyroid dysfunction and kidney disease. Eur J Endocrinol 2009; 160(4):503–515. doi:10.1530/EJE-08-0837
- Spencer CA. Clinical utility and cost-effectiveness of sensitive thyrotropin assays in ambulatory and hospitalized patients. Mayo Clin Proc 1988; 63(12):1214–1222. doi:10.1016/s0025-6196(12)65408-1
- Attia J, Margetts P, Guyatt G. Diagnosis of thyroid disease in hospitalized patients: a systematic review. Arch Intern Med 1999; 159(7):658–665. pmid:10218744
- Barbesino G, Tomer Y. Clinical review: clinical utility of TSH receptor antibodies. J Clin Endocrinol Metab 2013; 98(6):2247–2255. doi:10.1210/jc.2012-4309
A 66-year-old man presented to the emergency department with increasing shortness of breath and productive cough, which had begun 5 days earlier. Three years previously, he had been diagnosed with chronic obstructive pulmonary disease (COPD).
One week before the current presentation, he developed a sore throat, rhinorrhea, and nasal congestion, and the shortness of breath had started 2 days after that. Although he could speak in sentences, he was breathless even at rest. His dyspnea was associated with noisy breathing and cough productive of yellowish sputum; there was no hemoptysis. He reported fever, but he had no chills, night sweats, chest pain, or paroxysmal nocturnal dyspnea. The review of other systems was unremarkable.
His COPD was known to be mild, in Global Initiative for Chronic Obstructive Lung Disease (GOLD) grade 1, group A. His postbronchodilator ratio of forced expiratory volume in 1 second (FEV1) to forced vital capacity (FVC) was less than 0.70, and his FEV1 was 84% of predicted. Apart from mild intermittent cough with white sputum, his COPD had been under good control with inhaled ipratropium 4 times daily and inhaled albuterol as needed. He said he did not have shortness of breath except when hurrying on level ground or walking up a slight hill (Modified Medical Research Council dyspnea scale grade 1; COPD Assessment Test score < 10). In the last 3 years, he had 2 exacerbations of COPD, 1 year apart, both requiring oral prednisone and antibiotic therapy.
Other relevant history included hypertension and dyslipidemia of 15-year duration, for which he was taking candesartan 16 mg twice daily and atorvastatin 20 mg daily. He was compliant with his medications.
Though he usually received an influenza vaccine every year, he did not get it the previous year. Also, 3 years previously, he received the 23-valent pneumococcal polysaccharide vaccine (PPSV23), and the year before that he received the pneumococcal conjugate vaccine (PCV13). In addition, he was immunized against herpes zoster and tetanus.
The patient had smoked 1 pack per day for the past 38 years. His primary care physician had advised him many times to quit smoking. He had enrolled in a smoking cessation program 2 years previously, in which he received varenicline in addition to behavioral counseling in the form of motivational interviewing and a telephone quit-line. Nevertheless, he continued to smoke.
He was a retired engineer. He did not drink alcohol or use illicit drugs.
PHYSICAL EXAMINATION
On physical examination, the patient was sitting up in bed, leaning forward. He was alert and oriented but was breathing rapidly and looked sick. He had no cyanosis, clubbing, pallor, or jaundice. His blood pressure was 145/90 mm Hg, heart rate 110 beats per minute and regular, respiratory rate 29 breaths per minute, and oral temperature 38.1°C (100.6°F). His oxygen saturation was 88% while breathing room air. His body mass index was 27.1 kg/m2.
His throat was mildly congested. His neck veins were flat, and there were no carotid bruits. His thyroid examination was normal, without goiter, nodules, or tenderness.
Intercostal retractions were noted around the anterolateral costal margins. He had no chest wall deformities. Chest expansion was reduced bilaterally. There was hyperresonance bilaterally. Expiratory wheezes were heard over both lungs, without crackles.
His heart had no murmurs or added sounds. There was no lower-limb edema or swelling. The rest of his physical examination was unremarkable.
Results of initial laboratory testing are shown in Table 1.
Assessment: A 66-year-old man with GOLD grade 1, group A COPD, presenting with a severe exacerbation, most likely due to viral bronchitis.
INITIAL MANAGEMENT
The patient was given oxygen 28% by Venturi mask, and his oxygen saturation went up to 90%. He was started on nebulized albuterol 2.5 mg with ipratropium bromide 500 µg every 4 hours, prednisone 40 mg orally daily for 5 days, and ceftriaxone 1 g intravenously every 24 hours. The first dose of each medication was given in the emergency department.
The patient was then admitted to a progressive care unit, where he was placed on noninvasive positive pressure ventilation, continuous cardiac monitoring, and pulse oximetry. He was started on enoxaparin 40 mg subcutaneously daily to prevent venous thromboembolism, and the oral medications he had been taking at home were continued. Because he was receiving a glucocorticoid, his blood glucose was monitored in the fasting state, 2 hours after each meal, and as needed.
Two hours after he started noninvasive positive pressure ventilation, his arterial blood gases were remeasured and showed the following results:
- pH 7.35
- Partial pressure of carbon dioxide (Paco2) 52 mm Hg
- Bicarbonate 28 mmol/L
- Partial pressure of oxygen (Pao2) 60 mm Hg
- Oxygen saturation 90%.
HOSPITAL COURSE
On hospital day 3, his dyspnea had slightly improved. His respiratory rate was 26 to 28 breaths per minute. His oxygen saturation remained between 90% and 92%.
At 10:21 pm, his cardiac monitor showed an episode of focal atrial tachycardia at a rate of 129 beats per minute that lasted for 3 minutes and 21 seconds, terminating spontaneously. He denied any change in his clinical condition during the episode, with no chest pain, palpitation, or change in dyspnea. There was no change in his vital signs. He had another similar asymptomatic episode lasting 4 minutes and 9 seconds at 6:30 am of hospital day 4.
Because of these episodes, the attending physician ordered thyroid function tests.
THYROID FUNCTION TESTING
1. Which thyroid function test is most likely to be helpful in the assessment of this patient’s thyroid status?
- Serum thyroid-stimulating hormone (TSH) alone
- Serum TSH and total thyroxine (T4)
- Serum TSH and total triiodothyronine (T3)
- Serum TSH and free T4
- Serum TSH and free T3
There are several tests to assess thyroid function: the serum TSH, total T4, free T4, total T3, and free T3 concentrations.1
In normal physiology, TSH from the pituitary stimulates the thyroid gland to produce and secrete T4 and T3, which in turn inhibit TSH secretion through negative feedback. A negative log-linear relation exists between serum free T4 and TSH levels.2 Thus, the serum free T4 level can remain within the normal reference range even if the TSH level is high or low.
TSH assays can have different detection limits. A third-generation TSH assay with a detection limit of 0.01 mU/L is recommended for use in clinical practice.3
TSH testing alone. Given its superior sensitivity and specificity, serum TSH measurement is considered the best single test for assessing thyroid function in most cases.4 Nevertheless, measurement of the serum TSH level alone could be misleading in several situations, eg, hypothalamic or pituitary disorders, recent treatment of thyrotoxicosis, impaired sensitivity to thyroid hormone, and acute nonthyroidal illness.4
Free vs total T4 and T3 levels
Serum total T4 includes a fraction that is bound, mainly to thyroxin-binding globulin, and a very small unbound (free) fraction. The same applies to T3. Only free thyroid hormones represent the “active” fraction available for interaction with their protein receptors in the nucleus.8 Patients with conditions that can affect the thyroid-binding protein concentrations usually have altered serum total T4 and T3 levels, whereas their free hormone concentrations remain normal. Accordingly, measurement of free hormone levels, especially free T4, is usually recommended.
Although equilibrium dialysis is the method most likely to provide an accurate serum free T4 measurement, it is not commonly used because of its limited availability and high cost. Thus, most commercial laboratories use “direct” free T4 measurement or, to a lesser degree, the free T4 index.9 However, none of the currently available free T4 tests actually measure free T4 directly; rather, they estimate it.10
Commercial laboratories can provide a direct free T3 estimate, but it may be less reliable than total T3. If serum T3 measurement is indicated, serum total T3 is usually measured. However, total T3 measurement is rarely indicated for patients with hypothyroidism because it usually remains within the normal reference range.11 Nevertheless, serum total T3 measurement could be useful in patients with T3 toxicosis and in those who are acutely ill.
Accordingly, in acutely ill hospitalized patients like ours, measuring serum TSH using a third-generation assay and free T4 is essential to assess thyroid function. Many clinicians also measure serum total T3.
CASE CONTINUED: LOW TSH, LOW-NORMAL FREE T4, LOW TOTAL T3
The attending physician ordered serum TSH, free T4, and total T3 measurements, which yielded the following:
- TSH 0.1 mU/L (0.5–5.0)
- Total T3 55 ng/dL (80–180)
- Free T4 0.9 ng/dL (0.9–2.4).
2. Which best explains this patient’s abnormal thyroid test results?
- His acute illness
- Central hypothyroidism due to pituitary infarction
- His albuterol therapy
- Subclinical thyrotoxicosis
- Hashimoto thyroiditis
Since euthyroid patients with an acute illness may have abnormal thyroid test results (Table 2),5–7 thyroid function testing is not recommended unless there is a strong indication for it, such as new-onset atrial fibrillation, atrial flutter, or focal atrial tachycardia.1 In such patients, it is important to know whether the test abnormalities represent true thyroid disorder or are the result of a nonthyroidal illness.
Thyroid function testing in patients with nonthyroidal illness usually shows low serum total T3, normal or low serum TSH, and normal, low, or high serum free T4. However, transient mild serum TSH elevation can be seen in some patients during the recovery period.16 These abnormalities with their mechanisms are shown in Table 2.5–7 In several commercial kits, serum direct free T4 can be falsely decreased or increased.8
THE DIFFERENTIAL DIAGNOSIS
Our patient had low serum TSH, low-normal serum direct free T4, and low serum total T3. This profile could be caused by a nonthyroidal illness, “true” central hypothyroidism, or his glucocorticoid treatment. The reason we use the term “true” in this setting is that some experts suggest that the thyroid function test abnormalities in patients with acute nonthyroidal illness represent a transient central hypothyroidism.17 The clinical presentation is key in differentiating true central hypothyroidism from nonthyroidal illness.
In addition, measuring serum cortisol may help to differentiate between the 2 states, as it would be elevated in patients with nonthyroidal illness as part of a stress response but low in patients with true central hypothyroidism, since it is usually part of combined pituitary hormone deficiency.18 Of note, some critically ill patients have low serum cortisol because of transient central adrenal insufficiency.19,20
The serum concentration of reverse T3 has been suggested as a way to differentiate between hypothyroidism (low) and nonthyroidal illness (high); however, further studies showed that it does not reliably differentiate between the conditions.21
GLUCOCORTICOIDS AND THYROID FUNCTION TESTS
By inhibiting D1, glucocorticoids can decrease peripheral conversion of T4 to T3 and thus decrease serum total T3. This effect depends on the type and dose of the glucocorticoid and the duration of therapy.
In one study,22 there was a significant reduction in serum total T3 concentration 24 hours after a single oral dose of dexamethasone 12 mg in normal participants. This effect lasted 48 hours, after which serum total T3 returned to its pretreatment level.
In another study,23 a daily oral dose of betamethasone 1.5 mg for 5 days did not significantly reduce the serum total T3 in healthy volunteers, but a daily dose of 3 mg did. This effect was more pronounced at a daily dose of 4.5 mg, whereas a dose of 6.0 mg had no further effect.
Long-term glucocorticoid therapy also decreases serum total T4 and total T3 by lowering serum thyroid-binding globulin.24
Finally, glucocorticoids can decrease TSH secretion by directly inhibiting thyrotropin-releasing hormone.25,26 However, chronic hypercortisolism, whether endogenous or exogenous, does not cause clinically central hypothyroidism, possibly because of the negative feedback mechanism of low thyroid hormones on the pituitary and the hypothalamus.27
Other drugs including dopamine, dopamine agonists, dobutamine, and somatostatin analogues can suppress serum TSH. As with glucocorticoids, these drugs do not cause clinically evident central hypothyroidism.28 Bexarotene, a retinoid X receptor ligand used in the treatment of cutaneous T-cell lymphoma, has been reported to cause clinically evident central hypothyroidism by suppressing TSH and increasing T4 clearance.29
BETA-BLOCKERS, BETA-AGONISTS AND THYROID FUNCTION
While there is general agreement that beta-adrenergic antagonists (beta-blockers) do not affect the serum TSH concentration, conflicting data have been reported concerning their effect on other thyroid function tests. This may be due to several factors, including dose, duration of therapy, the patient’s thyroid status, and differences in laboratory methodology.30
In studies of propranolol, serum total T4 concentrations did not change or were increased with daily doses of 160 mg or more in both euthyroid participants and hyperthyroid patients31–33; serum total T3 concentrations did not change or were decreased with 40 mg or more daily34; and serum reverse T3 concentrations were increased with daily doses of 80 mg or more.31 It is most likely that propranolol exerts these changes by inhibiting D1 activity in peripheral tissues.
Furthermore, a significant decrease in serum total T3 concentrations was observed in hyperthyroid patients treated with atenolol 100 mg daily, metoprolol 100 mg daily, and alprenolol 100 mg daily, but not with sotalol 80 mg daily or nadolol (up to 240 mg daily).35,36
On the other hand, beta-adrenergic agonists have not been reported to cause significant changes in thyroid function tests.37
SUBCLINICAL THYROTOXICOSIS OR HASHIMOTO THYROIDITIS?
Our patient’s thyroid function test results are more likely due to his nonthyroidal illness and glucocorticoid therapy, as there is no clinical evidence to point to a hypothalamic-pituitary disorder accounting for true central hypothyroidism.
The other options mentioned in question 2 are unlikely to explain our patient’s thyroid function test results.
Subclinical thyrotoxicosis is characterized by suppressed serum TSH, but both serum free T4 and total T3 remain within the normal reference ranges. In addition, the serum TSH level may help to differentiate between thyrotoxicosis and nonthyroidal illness. In the former, serum TSH is usually suppressed (< 0.01 mU/L), whereas in the latter it is usually low but detectable (0.05– 0.3 mU/L).38,39
Hashimoto thyroiditis is a chronic autoimmune thyroid disease characterized by diffuse lymphocytic infiltration of the thyroid gland. Almost all patients with Hashimoto thyroiditis have elevated levels of antibodies to thyroid peroxidase or thyroglobulin.40 Clinically, patients with Hashimoto thyroiditis can either be hypothyroid or have normal thyroid function, which is not the case in our patient.
CASE CONTINUED
An endocrinologist, consulted for a second opinion, agreed that the patient’s thyroid function test results were most likely due to his nonthyroidal illness and glucocorticoid therapy.
3. In view of the endocrinologist’s opinion, which should be the next step in the management of the patient’s thyroid condition?
- Start levothyroxine (T4) therapy
- Start liothyronine (T3) therapy
- Start N-acetylcysteine therapy
- Start thyrotropin-releasing hormone therapy
- Remeasure thyroid hormones after full recovery from his acute illness
It is not clear whether the changes in thyroid hormone levels during an acute illness are a pathologic alteration for which thyroid hormone therapy may be beneficial, or a physiologic adaptation for which such therapy would not be indicated.41
However, current data argue against thyroid hormone therapy using T4 or T3 for patients with nonthyroidal illness syndrome (also called euthyroid sick syndrome).42 Indeed, several randomized controlled trials showed that thyroid hormone therapy is not beneficial in such patients and may be detrimental.41,43
Therapies other than thyroid hormone have been investigated to ameliorate thyroid hormone abnormalities in patients with nonthyroidal illness. These include N-acetylcysteine, thyrotropin-releasing hormone therapy, and nutritional support.
Some studies showed that giving N-acetylcysteine, an antioxidant, increased serum T3 and decreased serum reverse T3 concentrations in patients with acute myocardial infarction.44 Nevertheless, the mortality rate and length of hospitalization were not affected. Further studies are needed to know whether N-acetylcysteine therapy is beneficial for such patients.
Similarly, a study using a thyrotropin-releasing hormone analogue along with growth hormone-releasing peptide 2 showed an increase in serum TSH, T4, and T3 levels in critically ill patients.45 The benefit of this therapy has yet to be determined. On the other hand, early nutritional support was reported to prevent thyroid hormonal changes in patients postoperatively.46
Measuring thyroid hormone levels after full recovery is the most appropriate next step in our patient, as the changes in thyroid hormone concentrations subside as the acute illness resolves.47
CASE CONTINUED
The patient continued to improve. On hospital day 6, he was feeling better but still had mild respiratory distress. There had been no further episodes of arrhythmia since day 4. His blood pressure was 136/86 mm Hg, heart rate 88 beats per minute and regular, respiratory rate 18 breaths per minute, and oral temperature 37.1°C. His oxygen saturation was 92% on room air.
Before discharge, he was encouraged to quit smoking. He was offered behavioral counseling and medication therapy, but he only said that he would think about it. He was discharged on oral cefixime for 4 more days and was instructed to switch to a long-acting bronchodilator along with his other home medications and to return in 1 week to have his thyroid hormones checked.
One week later, his laboratory results were:
- TSH 11.2 mU/L (reference range 0.5–5.0)
- Free T4 1.2 ng/dL (0.9–2.4)
- Total T3 92 ng/dL (80–180).
Clinically, the patient was euthyroid, and examination of his thyroid was unremarkable.
4. Based on these last test results, which statement is correct?
- Levothyroxine therapy should be started
- His serum TSH elevation is most likely transient
- Thyroid ultrasonography is strongly indicated
- A radioactive iodine uptake study should be performed
- Measurement of thyroid-stimulating immunoglobulins is indicated
During recovery from nonthyroidal illness, some patients may have elevated serum TSH levels that are usually transient and modest (< 20 mU/L).48 Normalization of the thyroid function tests including serum TSH may take several weeks49 or months.50 However, a systematic review found that the likelihood of permanent primary hypothyroidism is high in patients with serum TSH levels higher than 20 mU/L during the recovery phase of their nonthyroidal illness.51
Ultrasonography is useful for evaluating patients with thyroid nodules or goiter but is of little benefit for patients like ours, in whom the thyroid is normal on examination.
Similarly, a radioactive iodine uptake study is not indicated, as it is principally used to help differentiate between types of thyrotoxicosis. (Radioactive iodine is also used to treat differentiated thyroid cancer.)
Thyroid-stimulating immunoglobins are TSH receptor-stimulating antibodies that cause Graves disease. Nevertheless, measuring them is not routinely indicated for its diagnosis. However, their measurement is of significant help in the diagnosis of Graves disease if a radioactive iodine uptake study cannot be performed (as in pregnancy) and in atypical presentations such as euthyroid Graves ophthalmopathy.52 Other indications for thyroid-stimulating immunoglobin measurement are beyond the scope of the article. Our patient’s test results are not consistent with hyperthyroidism, so measuring thyroid-stimulating immunoglobins is not indicated.
CASE CONCLUSION: BETTER, BUT STILL SMOKING
The patient missed his 1-month clinic follow-up, but he visited the clinic for follow-up 3 months later. He was feeling well with no complaints. Test results including serum TSH, free T4, and total T3 were within normal ranges. His COPD was under control, with an FEV1 88% of predicted.
He was again encouraged to quit smoking and was offered drug therapy and behavioral counseling, but he declined. In addition, he was instructed to adhere to his annual influenza vaccination.
KEY POINTS
- In patients with acute illness, it is recommended that thyroid function not be assessed unless there is a strong indication.
- If thyroid function assessment is indicated for critically ill patients, serum TSH and free T4 concentrations should be measured. Some clinicians also measure serum total T3 level.
- Thyroid function testing in critically ill patients usually shows low serum total T3, normal or low serum TSH, and normal or low serum free T4.
- Many drugs can alter thyroid hormone levels.
- Thyroid hormone therapy is not recommended for critically ill patients with low T3, low T4, or both.
- During recovery from nonthyroidal illness, some patients may have mild elevation in serum TSH levels (< 20 mU/L).
- Thyroid hormone levels may take several weeks or months to return to normal after the acute illness.
- Patients with serum TSH levels higher than 20 mU/L during the recovery phase of their nonthyroidal illness are more likely to have permanent primary hypothyroidism.
- Lamb EJ, Martin J. Thyroid function tests: often justified in the acutely ill. Ann Clin Biochem 2000; 37(pt 2):158–164. doi:10.1258/0004563001899159
- Spencer CA, LoPresti JS, Patel A, et al. Applications of a new chemiluminometric thyrotropin assay to subnormal measurement. J Clin Endocrinol Metab 1990; 70(2):453–460. doi:10.1210/jcem-70-2-453
- Ross DS, Ardisson LJ, Meskell MJ. Measurement of thyrotropin in clinical and subclinical hyperthyroidism using a new chemiluminescent assay. J Clin Endocrinol Metab 1989; 69(3):684–688. doi:10.1210/jcem-69-3-684
- Koulouri O, Moran C, Halsall D, Chatterjee K, Gurnell M. Pitfalls in the measurement and interpretation of thyroid function tests. Best Pract Res Clin Endocrinol Metab 2013; 27(6):745–762. doi:10.1016/j.beem.2013.10.003
- Lechan RM, Fekete C. Role of thyroid hormone deiodination in the hypothalamus. Thyroid 2005; 15(8):883–897. doi:10.1089/thy.2005.15.883
- Chopra IJ, Hershman JM, Pardridge WM, Nicoloff JT. Thyroid function in nonthyroidal ilnesses. Ann Intern Med 1983; 98(6):946–957. doi:10.7326/0003-4819-98-6-946
- Chopra IJ, Solomon DH, Hepner HW, Mortenstein AA. Misleadingly low free thyroxine index and usefulness of reverse triiodothyronine measurement in nonthyroidal illnesses. Ann Intern Med 1979; 90(6):905–912. doi:10.7326/0003-4819-90-6-905
- Pontecorvi A, Robbins J. The plasma membrane and thyroid hormone entry into cells. Trends Endocrinol Metab 1989; 1(2):90–94. pmid:18411097
- Hennemann G, Krenning EP. Pitfalls in the interpretation of thyroid function tests in old age and non-thyroidal illness. Horm Res 1987; 26(1–4):100–104. doi:10.1159/000180688
- Baloch Z, Carayon P, Conte-Devolx B, et al; Guidelines Committee, National Academy of Clinical Biochemistry. Laboratory medicine practice guidelines. Laboratory support for the diagnosis and monitoring of thyroid disease. Thyroid 2003; 13(1):3–126. doi:10.1089/105072503321086962
- Lum S, Nicoloff JT, Spencer CA, Kaptein EM. Peripheral tissue mechanism for maintenance of serum triiodothyronine values in a thyroxine-deficient state in man. J Clin Invest 1984; 73(2):570–575. doi:10.1172/JCI111245
- Ortiga-Carvalho TM, Chiamolera MI, Pazos-Moura CC, Wondisford FE. Hypothalamus-pituitary-thyroid axis. Compr Physiol 2016; 6(3):1387–1428. doi:10.1002/cphy.c150027
- de Vries EM, Fliers E, Boelen A. The molecular basis of the non-thyroidal illness syndrome. J Endocrinol 2015; 225(3):R67–R81. doi:10.1530/JOE-15-0133
- Chopra IJ, Huang TS, Beredo A, Solomon DH, Teco GN, Mean JF. Evidence for an inhibitor of extrathyroidal conversion of thyroxine to 3, 5, 3'-triiodothyronine in sera of patients with nonthyroidal illnesses. J Clin Endocrinol Metab 1985; 60(4):666–672. doi:10.1210/jcem-60-4-666
- Peeters RP, Debaveye Y, Fliers E, Visser TJ. Changes within the thyroid axis during critical illness. Crit Care Clin 2006; 22(1):41–55. doi:10.1016/j.ccc.2005.08.006
- Spencer C, Eigen A, Shen D, et al. Specificity of sensitive assays of thyrotropin (TSH) used to screen for thyroid disease in hospitalized patients. Clin Chem 1987; 33(8):1391–1396. pmid:3301067
- Adler SM, Wartofsky L. The nonthyroidal illness syndrome. Endocrinol Metab Clin North Am 2007; 36(3):657–672. doi:10.1016/j.ecl.2007.04.007
- Persani L. Central hypothyroidism: pathogenic, diagnostic, and therapeutic challenges. J Clin Endocrinol Metab 2012; 97(9):3068–3078. doi:10.1210/jc.2012-1616
- Kidess AI, Caplan RH, Reynertson RH, Wickus GG, Goodnough DE. Transient corticotropin deficiency in critical illness. Mayo Clin Proc 1993; 68(5):435–441. doi:10.1016/s0025-6196(12)60188-8
- Lamberts SW, Bruining HA, De Jong FH. Corticosteroid therapy in severe illness. N Engl J Med 1997; 337(18):1285–1292. doi:10.1056/NEJM199710303371807
- Burmeister LA. Reverse T3 does not reliably differentiate hypothyroid sick syndrome from euthyroid sick syndrome. Thyroid 1995; 5(6):435–441. doi:10.1089/thy.1995.5.435
- Duick DS, Warren DW, Nicoloff JT, Otis CL, Croxson MS. Effect of single dose dexamethasone on the concentration of serum triiodothyronine in man. J Clin Endocrinol Metab 1974; 39(6):1151–1154. doi:10.1210/jcem-39-6-1151
- Gamstedt A, Järnerot G, Kågedal B. Dose related effects of betamethasone on iodothyronines and thyroid hormone-binding proteins in serum. Acta Endocrinol (Copenh) 1981; 96(4):484–490. doi:10.1530/acta.0.0960484
- Wartofsky L, Burman KD. Alterations in thyroid function in patients with systemic illness: the “euthyroid sick syndrome.” Endocr Rev 1982; 3(2):164–217. doi:10.1210/edrv-3-2-164
- Wilber JF, Utiger RD. The effect of glucocorticoids on thyrotropin secretion. J Clin Invest 1969; 48(11):2096–2103. doi:10.1172/JCI106176
- Nicoloff JT, Fisher DA, Appleman MD Jr. The role of glucocorticoids in the regulation of thyroid function in man. J Clin Invest 1970; 49(10):1922–1929. doi:10.1172/JCI106411
- Surks MI, Sievert R. Drugs and thyroid function. N Engl J Med 1995; 333(25):1688–1694. doi:10.1056/NEJM199512213332507
- Haugen BR. Drugs that suppress TSH or cause central hypothyroidism. Best Pract Res Clin Endocrinol Metab 2009; 23(6):793–800. doi:10.1016/j.beem.2009.08.003
- Sherman SI, Gopal J, Haugen BR, et al. Central hypothyroidism associated with retinoid X receptor–selective ligands. N Engl J Med 1999; 340(14):1075–1079. doi:10.1056/NEJM199904083401404
- Murchison LE, How J, Bewsher PD. Comparison of propranolol and metoprolol in the management of hyperthyroidism. Br J Clin Pharmacol 1979; 8(6):581–587. doi:10.1111/j.1365-2125.1979.tb01048.x
- Faber J, Friis T, Kirkegaard C, et al. Serum T4, T3 and reverse T3 during treatment with propranolol in hyperthyroidism, L-T4 treated myxedema and in normal man. Horm Metab Res 1979; 11(1):34–36. doi:10.1055/s-0028-1092678
- Kristensen BO, Weeke J. Propranolol-induced increments in total and free serum thyroxine in patients with essential hypertension. Clin Pharmacol Ther 1977; 22(6):864–867. doi:10.1002/cpt1977226864
- Murchison LE, Bewsher PD, Chesters MI, Ferrier WR. Comparison of propranolol and practolol in the management of hyperthyroidism. Br J Clin Pharmacol 1976; 3(2):273–277. doi:10.1111/j.1365-2125.1976.tb00603.x
- Lotti G, Delitala G, Devilla L, Alagna S, Masala A. Reduction of plasma triiodothyronine (T3) induced by propranolol. Clin Endocrinol 1977; 6(6):405–410. doi:10.1111/j.1365-2265.1977.tb03322.x
- Perrild H, Hansen JM, Skovsted L, Christensen LK. Different effects of propranolol, alprenolol, sotalol, atenolol and metoprolol on serum T3 and serum rT3 in hyperthyroidism. Clin Endocrinol (Oxf) 1983; 18(2):139–142. pmid:6133659
- Reeves RA, From GL, Paul W, Leenen FH. Nadolol, propranolol, and thyroid hormones: evidence for a membrane-stabilizing action of propranolol. Clin Pharmacol Ther 1985; 37(2):157–161. doi:10.1038/clpt.1985.28
- Walker N, Jung RT, Jennings G, James WP. The effect of a beta-receptor agonist (salbutamol) on peripheral thyroid metabolism in euthyroid subjects. Horm Metab Res 1981; 13(10):590–591. doi:10.1055/s-2007-1019346
- Melmed S, Geola FL, Reed AW, Pekary AE, Park J, Hershman JM. A comparison of methods for assessing thyroid function in nonthyroidal illness. J Clin Endocrinol Metab 1982; 54(2):300–306. doi:10.1210/jcem-54-2-300
- Docter R, Krenning E, De Jong M, Hennemann G. The sick euthyroid syndrome: changes in thyroid hormone serum parameters and hormone metabolism. Clin Endocrinol (Oxf) 1993; 39(5):499–518. pmid:8252737
- Mariotti S, Caturegli P, Piccolo P, Barbesino G, Pinchera A. Antithyroid peroxidase autoantibodies in thyroid diseases. J Clin Endocrinol Metab 1990; 71(3):661–669. doi:10.1210/jcem-71-3-661
- De Groot LJ. Non-thyroidal illness syndrome is a manifestation of hypothalamic-pituitary dysfunction, and in view of current evidence, should be treated with appropriate replacement therapies. Crit Care Clin 2006; 22(1):57–86. doi:10.1016/j.ccc.2005.10.001
- Jonklaas J, Bianco AC, Bauer AJ, et al; American Thyroid Association Task Force on Thyroid Hormone Replacement. Guidelines for the treatment of hypothyroidism: prepared by the American Thyroid Association Task Force on Thyroid Hormone Replacement. Thyroid 2014; 24(12):1670–1751. doi:10.1089/thy.2014.0028
- Kaptein EM, Beale E, Chan LS. Thyroid hormone therapy for obesity and nonthyroidal illnesses: a systematic review. J Clin Endocrinol Metab 2009; 94(10):3663–3675. doi:10.1210/jc.2009-0899
- Vidart J, Wajner SM, Leite RS, et al. N-acetylcysteine administration prevents nonthyroidal illness syndrome in patients with acute myocardial infarction: a randomized clinical trial. J Clin Endocrinol Metab 2014; 99(12):4537–4545. doi:10.1210/jc.2014-2192
- Van den Berghe G, Wouters P, Weekers F, et al. Reactivation of pituitary hormone release and metabolic improvement by infusion of growth hormone-releasing peptide and thyrotropin-releasing hormone in patients with protracted critical illness. J Clin Endocrinol Metab 1999; 84(4):1311–1323. doi:10.1210/jcem.84.4.5636
- Langouche L, Vander Perre S, Marques M, et al. Impact of early nutrient restriction during critical illness on the nonthyroidal illness syndrome and its relation with outcome: a randomized, controlled clinical study. J Clin Endocrinol Metab 2013; 98(3):1006–1013. doi:10.1210/jc.2012-2809
- Economidou F, Douka E, Tzanela M, Nanas S, Kotanidou A. Thyroid function during critical illness. Hormones (Athens) 2011; 10(2):117–124. doi:10.14310/horm.2002.1301
- Hamblin PS, Dyer SA, Mohr VS, et al. Relationship between thyrotropin and thyroxine changes during recovery from severe hypothyroxinemia of critical illness. J Clin Endocrinol Metab 1986; 62(4):717–722. doi:10.1210/jcem-62-4-717
- Iglesias P, Diez JJ. Thyroid dysfunction and kidney disease. Eur J Endocrinol 2009; 160(4):503–515. doi:10.1530/EJE-08-0837
- Spencer CA. Clinical utility and cost-effectiveness of sensitive thyrotropin assays in ambulatory and hospitalized patients. Mayo Clin Proc 1988; 63(12):1214–1222. doi:10.1016/s0025-6196(12)65408-1
- Attia J, Margetts P, Guyatt G. Diagnosis of thyroid disease in hospitalized patients: a systematic review. Arch Intern Med 1999; 159(7):658–665. pmid:10218744
- Barbesino G, Tomer Y. Clinical review: clinical utility of TSH receptor antibodies. J Clin Endocrinol Metab 2013; 98(6):2247–2255. doi:10.1210/jc.2012-4309
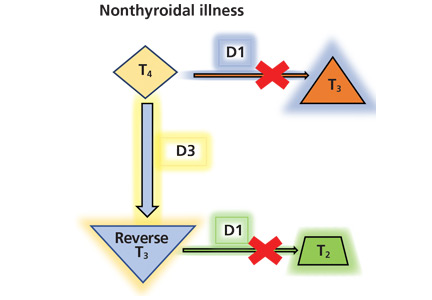
Myopathy for the general internist: Statins and much more
Myopathies can present with a wide variety of symptoms, so patients with muscle weakness are often seen initially by a general practitioner. Nonrheumatologists should be able to evaluate a patient presenting with muscle weakness or myalgia and be aware of red flags indicating potentially dangerous syndromes that require a prompt, thorough investigation.
This article reviews selected causes of muscle weakness, such as statin-induced and autoimmune disorders, and systemic features of inflammatory myopathies beyond myositis, such as dermatologic and pulmonary manifestations.
FOCUSING THE EVALUATION
The evaluation of a patient presenting with muscle weakness should include several assessments:
Temporal progression. Was the onset of symptoms rapid or insidious? Patterns of onset may give clues to etiology, including the possibility of an associated autoimmune condition.
Location of muscle weakness. Are symptoms global or localized? And if localized, are they proximal or distal? Proximal weakness can be manifested by difficulty rising from a chair (hip muscles) or combing one’s hair (shoulder muscles), whereas distal weakness can involve difficulty standing on toes (gastrocnemius and soleus muscles) or performing fine motor activities (intrinsic hand muscles).
Symmetry. A focal or asymmetric pattern often has a neurologic etiology, but this could also be consistent with inclusion body myositis.
Other symptoms. Arthritis, rash, and swallowing problems point to a possible underlying rheumatologic disease. Weight gain or loss may indicate a thyroid disorder.
Family history. Some patients report that others in their family have this pattern of weakness, indicating a likely genetic myopathy. If the patient reports a relative with multiple sclerosis, lupus erythematosus, rheumatoid arthritis, or another autoimmune disease, then an immune-mediated myopathy should be considered.
Medications should be reviewed, particularly statins.
CASE 1: SLOWLY PROGRESSIVE WEAKNESS
A 65-year-old man presented with the insidious onset of muscle weakness and episodes of falling. On review of his medical record, his serum creatine kinase (CK) levels were elevated at various periods at 2 to 4 times the upper limit of normal. Electromyography (EMG) previously showed a myopathic pattern, and a muscle biopsy was abnormal, consistent with endomysial inflammation (term is consistent with “polymyositis”). He was treated for polymyositis for several years with prednisone alone, with steroids plus methotrexate, and with combined immunosuppression including methotrexate and azathioprine, but with no improvement. Eventually, another muscle biopsy revealed inclusion bodies with rimmed vacuoles, consistent with inclusion body myositis.
Inclusion body myositis
Inclusion body myositis is the most common myopathy in middle-aged to elderly people, especially men. These patients are often told “You are just getting old,” but they have a defined condition. It should also be considered in patients failing to respond to treatment or with those with “refractory” polymyositis.
The onset of muscle weakness is insidious and painless, and the weakness progresses slowly. The pattern is distal and asymmetric (eg, foot drop), and muscle atrophy typically affects the forearm flexors, quadriceps, and intrinsic muscles of the hands.1
Magnetic resonance imaging may show marked muscle atrophy. Unfortunately, no treatment has shown efficacy, and most neuromuscular and rheumatology experts do not treat inclusion body myositis with immunosuppressive drugs.
CASE 2: MILD MYALGIA WITHOUT WEAKNESS
A black 52-year-old man was referred because of myalgia and a CK level of 862 U/L (reference range < 200). His physician wanted to start him on a statin but was hesitant to do so without first consulting a rheumatologist.
The patient had a long history of mild arthralgias and myalgias without muscle weakness. He had dyslipidemia and hypertension. He reported no family history of myopathy and no illicit drug use. He was formerly an athlete. Medications included a thiazide diuretic and a beta-blocker. On examination, his muscles were strong (rated 5 on a scale of 5) in the upper and lower extremities, without atrophy.
His records showed that his CK levels had risen and fallen repeatedly over the past few years, ranging from 600 to 1,100 U/L. On further questioning, he reported that when he had joined the army 30 years previously, a physician had recommended he undergo a liver biopsy in view of elevated liver function tests, but that he had refused because he felt fine.
Currently, his gamma-glutamyl transpeptidase levels were normal.
Idiopathic ‘hyperCKemia’
So-called idiopathic hyperCKemia is not a form of myositis but merely a laboratory result outside the “normal” range. Reference ranges are based predominantly on measurements in white people and on an assumption that the distribution is Gaussian (bell-shaped). A normal CK level is usually defined as less than 200 U/L. Using this standard, up to 20% of men and 5% of women have hyperCKemia.2
However, CK levels vary by sex and ethnicity, with mean levels highest in black men, followed by black women, white men, and white women. The mean level in black men is higher than the standard cutoff point for normal, and especially in this population, there is wide fluctuation around the mean, leading to hyperCKemia quite frequently in black men. Exercise and manual labor also drive up CK levels.3–5
Idiopathic hyperCKemia is benign. D’Adda et al6 followed 55 patients for a mean of 7.5 years. CK levels normalized in 12 patients or at least decreased in 24. Most remained symptom-free or had minimal symptoms.
Idiopathic hyperCKemia: Bottom line
Before prescribing a statin, determine the baseline CK level. If slightly elevated (ie, up to 3 to 5 times the upper limit of normal, or even higher) in the setting of normal muscle strength, there is no need for electromyography or muscle biopsy, and the patient can certainly receive a statin. Most of these patients do not need to see a rheumatologist but can simply have their CK and muscle strength monitored.
CLASSIFYING MYOSITIS
Myositis (idiopathic inflammatory myopathy) is a heterogeneous group of autoimmune syndromes of unknown cause characterized by chronic muscle weakness and inflammation of striated muscle. These syndromes likely arise as a result of genetic predisposition and an environmental or infectious “hit.”
Myositis is rare, with an incidence of 5 to 10 cases per million per year and an estimated prevalence of 50 to 90 cases per million. It has 2 incidence peaks: 1 in childhood (age 5–15) and another in adult midlife (age 30–50). Women are affected 2 to 3 times more often than men, with black women most commonly affected.
Myositis is traditionally classified as follows:
- Adult polymyositis
- Adult dermatomyositis
- Juvenile myositis (dermatomyositis much more frequent than polymyositis)
- Malignancy-associated myositis (usually dermatomyositis)
- Myositis overlapping with another autoimmune disease
- Inclusion body myositis.
However, polymyositis is less common than we originally thought, and the term necrotizing myopathy is now used in many patients, as noted in the case studies below. Further, myositis overlap syndromes are being increasingly diagnosed, likely related to the emergence of autoantibodies and clinical “syndromes” associated with these autoantibody subsets (discussed in cases below).
Dermatomyositis
Dermatomyositis is characterized by muscle weakness and a rash that can be obvious or subtle. Classic skin lesions are Gottron papules, which are raised, flat-topped red or purplish lesions over the knuckles, elbows, or knees.
Lesions may be confused with those of psoriasis. There can also be a V-neck rash over the anterior chest or upper back (“shawl sign”) or a rash over the lateral thigh (“holster sign”). A facial rash may occur, but unlike lupus, dermatomyositis does not spare the nasolabial area. However, the V-neck rash can be similar to that seen in lupus.
Dermatomyositis may cause muscle pain, perhaps related to muscle ischemia, whereas polymyositis and necrotizing myopathy are often painless. However, pain is also associated with fibromyalgia, which may be seen in many autoimmune conditions. It is important not to overtreat rheumatologic diseases with immunosuppression to try to control pain if the pain is actually caused by fibromyalgia.
Polymyositis mimics

Hypothyroid myopathy can present as classic polymyositis. The serum CK may be elevated, and there may be myalgias, muscle hypertrophy with stiffness, weakness, cramps, and even features of a proximal myopathy, and rhabdomyolysis. The electromyogram can be normal or myopathic. Results of muscle biopsy are often normal but may show focal necrosis and mild inflammatory infiltrates, thus mimicking that seen with inflammatory myopathy.7
Drug-induced or toxic myopathies can also mimic polymyositis. Statins are among the most commonly prescribed drugs in the United States, with more than 35 million people taking them. Statins are generally well tolerated but have a broad spectrum of toxicity, ranging from myalgias to life-threatening rhabdomyolysis. Myalgias lead to about 5% to 10% of patients refusing to take a statin or stopping it on their own.
Myalgias affect up to 20% of statin users in clinical practice.8,9 A small cross-sectional study10 of 1,000 patients in a primary care setting found that the risk of muscle complaints in statin users was 1.5 times higher than in nonstatin users, similar to findings in other studies.

My strategy for managing a patient with possible statin-induced myopathy is illustrated in Figure 1.
CASE 3: WEAKNESS, VERY HIGH CK ON A STATIN
In March 2010, a 67-year-old woman presented with muscle weakness. She had a history of hypertension, hyperlipidemia, and, more than 10 years previously, uterine cancer. In 2004, she was given atorvastatin for dyslipidemia. Four years later, she developed lower-extremity weakness, which her doctor attributed to normal aging. A year after that, she found it difficult to walk up steps and lift her arms overhead. In June 2009, she stopped taking the atorvastatin on her own, but the weakness did not improve.
In September 2009, she returned to her doctor, who found her CK level was 6,473 U/L but believed it to be an error, so the test was repeated, with a result of 9,375 U/L. She had no rash or joint involvement.
She was admitted to the hospital and underwent muscle biopsy, which showed myonecrosis with no inflammation or vasculitis. She was treated with prednisone 60 mg/day, and her elevated CK level and weakness improved.
Immune-mediated necrotizing myopathy associated with statins
The hallmark of necrotizing myopathy is myonecrosis without significant inflammation.12 This pattern contrasts with that of polymyositis, which is characterized by lymphocytic inflammation.
Although statins became available in the United States in 1987, immune-mediated necrotizing myopathy associated with statins was first described only in 2010. In that report, Grable-Esposito et al13 described 25 patients from 2 neuromuscular centers seen between 2000 and 2008 who had elevated CK and proximal weakness during or after statin use, both of which persisted despite stopping the statin. Patients improved with immunosuppressive agents but had a relapse when steroids were stopped or tapered, a pattern typical in autoimmune disease.
Autoantibody defines subgroup of necrotizing myopathy
Also in 2010, Christopher-Stine et al14 reported an antibody associated with necrotizing myopathy. Of 38 patients with the condition, 16 were found to have an abnormal “doublet” autoantibody recognizing 200- and 100-kDa proteins. All patients had weakness and a high CK level, and 63% had statin exposure before the weakness (this percentage increased to 83% in patients older than 50). All responded to immunosuppressive therapy, and many had a relapse when it was withdrawn.
Statins lower cholesterol by inhibiting 3-hydroxy-3-methylglutaryl-Co A reductase (HMGCR), and paradoxically, they also upregulate it. HMGCR has a molecular weight of 97 kDa. Mammen et al15 identified HMGCR as the 100-kDa target of the identified antibody and developed an enzyme-linked immunosorbent assay for it. Of 750 patients presenting to one center, only 45 (6%) had anti-HMGCR autoantibodies, but all 16 patients who had the abnormal doublet antibody tested positive for anti-HMGCR. Regenerating muscle cells express high levels of HMGCR, which may sustain the immune response after statins are discontinued.
Case 3 continued: Intravenous immunoglobulin brings improvement
In March 2010, when the 67-year-old patient presented to our myositis center, her CK level was 5,800 U/L, which increased as prednisone was tapered. She still felt weak. On examination, her muscle strength findings were deltoids 4+/5, neck flexors 4/5, and iliopsoas 3+/5. She was treated with methotrexate and azathioprine without benefit. She was next treated with intravenous immunoglobulin, and after 3 months, her strength normalized for the first time in years. Her CK level decreased but did not normalize. Testing showed that she was positive for anti-HMGCR autoantibody, as this test had become commercially available.
In 2015, Mammen and Tiniakou16 suggested using intravenous immunoglobulin as first-line therapy for statin-associated autoimmune necrotizing myopathy, based on experience at a single center with 3 patients who declined glucocorticoid treatment.
Necrotizing myopathy: Bottom line

Myositis overlap syndromes
Heterogeneity is the rule in myositis, and it can present with a wide variety of signs and symptoms as outlined in Table 2.
CASE 4: FEVER, NEW ‘RHEUMATOID ARTHRITIS,’ AND LUNG DISEASE
A 52-year-old woman with knee osteoarthritis saw her primary care physician in November 2013 for dyspnea and low-grade fever. The next month, she presented with polyarthritis, muscle weakness, and Raynaud phenomenon.
In January 2014, she developed acrocyanosis of her fingers. Examination revealed hyperkeratotic, cracked areas of her fingers. Her oxygen saturation by pulse oximetry was low. She was admitted to the hospital. Her doctor suspected new onset of rheumatoid arthritis, but blood tests revealed a negative antinuclear antibody, so an autoimmune condition was deemed unlikely. Her CK was mildly elevated at 350 U/L.
Because of her dyspnea, an open-lung biopsy was performed. High-resolution computed tomography (CT) revealed infiltrates and ground-glass opacities, leading to the diagnosis of nonspecific interstitial pneumonia. A rheumatologist was consulted and recommended pulse methylprednisolone, followed by prednisone 60 mg/day and mycophenolate mofetil. Testing for Jo-1 antibodies was positive.
Antisynthetase syndrome
The antisynthetase syndrome is a clinically heterogeneous condition that can occur with any or all of the following:
- Fever
- Myositis
- Arthritis (often misdiagnosed as rheumatoid arthritis)
- Raynaud phenomenon
- Mechanic’s hands (hyperkeratotic roughness with fissures on the lateral aspects of the fingers and finger pads)
- Interstitial lung disease.
The skin rashes and myositis may be subtle, making the presentation “lung-dominant,” and nonrheumatologists should be aware of this syndrome. Although in our patient the condition developed in a classic manner, with all of the aforementioned features of the antisynthetase syndrome, some patients will manifest one or a few of the features.

Clinically, patients with the Jo-1 antisynthetase syndrome often present differently than those with non-Jo-1 antisynthetase autoantibodies. When we compared 122 patients with Jo-1 vs 80 patients with a non-Jo-1 antisynthetase autoantibody, patients with Jo-1 antibodies were more likely to have initially received a diagnosis of myositis (83%), while myositis was the original diagnosis in only 17% of those possessing non-Jo-1 antisynthetase autoantibodies. In fact, many patients (approximately 50%) were diagnosed as having undifferentiated connective tissue disease or an overlap syndrome, and 13% had scleroderma as their first diagnosis.17
We also found that the survival rate was higher in patients with Jo-1 syndrome compared with patients with non-Jo-1 antisynthetase syndromes. We attributed the difference in survival rates to a delayed diagnosis in the non-Jo-1 group, perhaps due to their “nonclassic” presentations of the antisynthetase syndrome, delaying appropriate treatment. Patients received a diagnosis of Jo-1 antibody syndrome after a mean of 0.4 year (range 0.2–0.8), while those with a non-Jo-1 antisynthetase autoantibody had a delay in diagnosis of 1.0 year (range 0.4–5.1) (P < .01).17
In nearly half the cases in this cohort, pulmonary fibrosis was the cause of death, with primary pulmonary hypertension being the second leading cause (11%).
Antisynthetase syndrome: Bottom line
Antisynthetase syndrome is an often fatal disease that does not always present in a typical fashion with symptoms of myositis, as lung disease may be the predominant feature. A negative antinuclear antibody test result does not imply antibody negativity, as the autoantigen in these diseases is not located in the nucleus. Prompt diagnosis and appropriate immunosuppressive therapy are critical to improving outcomes.
CASE 5: FEVER, UNDIAGNOSED LUNG DISEASE, NO MYOSITIS
In January 2001, a 39-year-old woman was admitted to the hospital after 5 weeks of fever (temperatures 103°–104°F) and myalgias. An extensive workup was negative except for low-titer antinuclear antibody and for mild basilar fibrosis noted on chest radiography. She left the hospital against medical advice because of frustration with a lack of a specific diagnosis (“fever of unknown origin”).
Two months later, at a follow-up rheumatology consult, she reported more myalgias and arthralgias, as well as fever. Chest radiography now showed pleural effusions. Her fingers had color changes consistent with Raynaud phenomenon. At that time, I diagnosed an undifferentiated connective tissue disease and told her that I suspected an autoimmune condition that would need time to reveal itself. In the meantime, I treated her empirically with prednisone.
In April, she returned, much more short of breath and with more prominent diffuse pulmonary infiltrates. Physical examination revealed subtle Gottron changes. Testing revealed poor pulmonary function: forced vital capacity (FVC) 56%, forced expiratory volume in 1 second (FEV1) 52%, and diffusing capacity for carbon monoxide (Dlco) 40%. Blood testing was positive for anti-PL-12 antibody, one of the non-Jo-1 antisynthetase antibodies. At this time, we treated her with glucocorticoids and tacrolimus.
More than 15 years later, this patient is doing well. Her skin rash, joint symptoms, and fever have not returned, and interestingly, she never developed myositis. Her Raynaud symptoms are mild. Her most recent pulmonary function test results (January 2018) were FVC 75%, FEV1 87%, and Dlco 78%. Although these results are not normal, they are much improved and allow her to be completely functional without supplemental oxygen. Echocardiography showed normal pulmonary artery systolic pressure (25 mm Hg). She was still taking tacrolimus and prednisone. When we tried to stop tacrolimus after she had done well for many years, her condition flared.
Non-Jo-1 antisynthetase syndrome: Bottom line
Patients with a non-Jo-1 antisynthetase syndrome often present without myositis symptoms and may never manifest myositis symptoms. Likely because of this presentation, diagnosis of a specific connective tissue disorder is delayed, perhaps leading to increased mortality risk from pulmonary disease. Chronic immunosuppression is often required for these autoimmune conditions.
CASE 6: DERMATOMYOSITIS, RAPIDLY PROGRESSIVE INTERSTITIAL LUNG DISEASE
A 58-year-old woman presented in the summer of 2012 with a photosensitive rash. The following January, she returned with polyarthritis, mild muscle weakness, and a dermatomyositis-pattern rash. Her CK level was normal, and her antinuclear antibody and Sjögren syndrome antibody test results were negative. She improved on low-dose prednisone and methotrexate.
She was originally referred to me in May of that year for worsening rash and mild weakness. She denied pulmonary symptoms, but examination revealed faint basilar crackles. I increased her prednisone dosage to 20 mg/day and started mycophenolate mofetil mainly for the mild cutaneous and myositis features. I also recommended high-resolution CT of the lungs and pulmonary function tests, which she underwent in early June. High-resolution CT showed nonspecific mild infiltrates with minimal ground-glass opacities.
On July 1, she presented to her local emergency department with severe shortness of breath, requiring oxygen 12 L/min. She had a palmar rash. Repeat high-resolution CT showed dramatic worsening compared with the scan the previous month. Because of continued inadequate oxygenation, she was transferred to our center. A blood test later was positive for antimelanoma differentiation-associated gene 5 (MDA-5) autoantibody, previously known as anticlinically amyopathic dermatomyositis (anti-CADM)-140 antibody (based on immunoprecipitation results).
She died on the third day after transfer, just 2 months after I had originally seen her, at which time she had had no pulmonary symptoms.
Clinically amyopathic dermatomyositis
Anti-CADM-140, first reported from Asia,18–20 is an autoantibody-associated disease but not an antisynthetase. It is associated with dermatomyositis; patients often have a “vasculopathy” with cutaneous ulcerations and palmar papules.
MDA-5 is a cytoplasmic protein that “senses” viral RNA and induces production of type 1 interferon. It is involved in the innate immune defense against viruses.
Anti-MDA-5 positivity is associated with a poor pulmonary outcome.21 In our cohort from the University of Pittsburgh, many patients died within 3 years, compared with about a 40% survival rate in patients with dermatomyositis who tested negative for this antibody. That being said, many patients with anti-MDA-5 do not develop rapidly progressive interstitial lung disease.
Autoimmune interstitial lung disease: Bottom line
Autoimmune interstitial lung disease is easy to miss, especially in the case of a non-Jo-1 syndrome, for 3 important reasons:
- The autoimmune features may initially be subtle (eg, Raynaud phenomena, mild dermatomyositis rash, undifferentiated connective tissue disease)
- Autoantibody testing is not often ordered, is not standardized, or may be unavailable
- Providers are mistakenly reassured that a patient who tests negative for antinuclear antibody does not have an autoimmune condition.
To emphasize the last point, in a cohort of 202 patients who tested positive for an antisynthetase antibody, only half were antinuclear antibody-positive, but nearly three-quarters demonstrated anticytoplasmic staining on indirect immunofluorescence (due to the location of the autoantigen in the cytoplasm), making the latter a better screening test for an antisynthetase antibody. For scleroderma, 99% were antinculear antibody-positive, but for myositis, this test is much less sensitive.22
- Felice KJ, North WA. Inclusion body myositis in Connecticut: observations in 35 patients during an 8-year period. Medicine (Baltimore) 2001; 80(5):320–327. doi:10.1097/00005792-200109000-00006
- Lev EI, Tur-Kaspa I, Ashkenazy I, et al. Distribution of serum creatine kinase activity in young healthy persons. Clin Chim Acta 1999; 279(1-2):107–115. doi:10.1016/S0009-8981(98)00180-6
- Lilleng H, Abeler K, Johnsen SH, et al. Variation of serum creatine kinase (CK) levels and prevalence of persistent hyperCKemia in a Norwegian normal population. The Tromsø Study. Neuromuscul Disord 2011; 21(7):494–500. doi:10.1016/j.nmd.2011.04.007
- Johnston JD, Lloyd M, Mathews JA, Hawthorne SW. Racial variation in serum creatine kinase levels. J R Soc Med 1996; 89(8):462-464. pmid:8795501
- Prelle A, Tancredi L, Sciacco M, et al. Retrospective study of a large population of patients with asymptomatic or minimally symptomatic raised serum creatine kinase levels. J Neurol 2002; 249(3):305–311. pmid:11993531
- D’Adda E, Sciacco M, Fruguglietti ME, et al. Follow-up of a large population of asymptomatic/oligosymptomatic hyperckemic subjects. J Neurol 2006; 253(11):1399–1403. doi:10.1007/s00415-006-0223-y
- Madariaga MG. Polymyositis-like syndrome in hypothyroidism: review of cases reported over the past twenty-five years. Thyroid 2002; 12(4):331–336. doi:10.1089/10507250252949478
- de Sauvage Nolting PR, Buirma RJ, Hutten BA, Kastelein JJ; Dutch ExPRESS Investigator Group. Two-year efficacy and safety of simvastatin 80 mg in familial hypercholesterolemia (the Examination of Probands and Relatives in Statin Studies With Familial Hypercholesterolemia [ExPRESS FH]). Am J Cardiol 2002; 90(2):181–184. doi:10.1016/s0002-9149(02)02449-9
- Bruckert E, Hayem G, Dejager S, Yau C, Bégaud B. Mild to moderate muscular symptoms with high-dosage statin therapy in hyperlipidemic patients--the PRIMO study. Cardiovasc Drugs Ther 2005; 19(6):403–414. doi:10.1007/s10557-005-5686-z
- Mosshammer D, Lorenz G, Meznaric S, Schwarz J, Muche R, Mörike K. Statin use and its association with musculoskeletal symptoms—a cross-sectional study in primary care settings. Fam Pract 2009; 26(2):88–95. doi:10.1093/fampra/cmp006
- Nichols GA, Koro CE. Does statin therapy initiation increase the risk for myopathy? An observational study of 32,225 diabetic and nondiabetic patients. Clin Ther 2007; 29(8):1761–1770. doi:10.1016/j.clinthera.2007.08.022
- Kassardjian CD, Lennon VA, Alfugham NB, Mahler M, Milone M. Clinical features and treatment outcomes of necrotizing autoimmune myopathy. JAMA Neurol 2015; 72(9):996–1003. doi:10.1001/jamaneurol.2015.1207
- Grable-Esposito P, Katzberg HD, Greenberg SA, Srinivasan J, Katz J, Amato AA. Immune-mediated necrotizing myopathy associated with statins. Muscle Nerve 2010; 41(2):185–190. doi:10.1002/mus.21486
- Christopher-Stine L, Casciola-Rosen LA, Hong G, Chung T, Corse AM, Mammen AL. A novel autoantibody recognizing 200-kd and 100-kd proteins is associated with an immune-mediated necrotizing myopathy. Arthritis Rheum 2010; 62(9):2757–2766. doi:10.1002/art.27572
- Mammen AL, Chung T, Christopher-Stine L, et al. Autoantibodies against 3-hydroxy-3-methylglutaryl-coenzyme A reductase in patients with statin-associated autoimmune myopathy. Arthritis Rheum 2011; 63(3):713–721. doi:10.1002/art.30156
- Mammen AL, Tiniakou E. Intravenous immune globulin for statin-triggered autoimmune myopathy. N Engl J Med 2015; 373(17):1680–1682. doi:10.1056/NEJMc1506163
- Aggarwal R, Cassidy E, Fertig N, et al. Patients with non-Jo-1 anti-tRNA-synthetase autoantibodies have worse survival than Jo-1 positive patients. Ann Rheum Dis 2014; 73(1):227–232. doi:10.1136/annrheumdis-2012-201800
- Sato S, Hirakata M, Kuwana M, et al. Autoantibodies to a 140-kd polypeptide, CADM-140, in Japanese patients with clinically amyopathic dermatomyositis. Arthritis Rheum 2005; 52(5):1571–1576. doi:10.1002/art.21023
- Sato S, Hoshino K, Satoh T, et al. RNA helicase encoded by melanoma differentiation-associated gene 5 is a major autoantigen in patients with clinically amyopathic dermatomyositis: association with rapidly progressive interstitial lung disease. Arthritis Rheum 2009; 60(7):2193–2200. doi:10.1002/art.24621
- Chen F, Wang D, Shu X, Nakashima R, Wang G. Anti-MDA5 antibody is associated with A/SIP and decreased T cells in peripheral blood and predicts poor prognosis of ILD in Chinese patients with dermatomyositis. Rheumatol Int 2012; 32(12):3909–3915. doi:10.1007/s00296-011-2323-y
- Moghadam-Kia S, Oddis CV, Sato S, Kuwana M, Aggarwal R. Anti-melanoma differentiation-associated gene 5 is associated with rapidly progressive lung disease and poor survival in US patients with amyopathic and myopathic dermatomyositis. Arthritis Care Res (Hoboken) 2016; 68(5):689–694. doi:10.1002/acr.22728
- Aggarwal R, Dhillon N, Fertig N, Koontz D, Qi Z, Oddis CV. A negative antinuclear antibody does not indicate autoantibody negativity in myositis: role of anticytoplasmic antibody as a screening test for antisynthetase syndrome. J Rheumatol 2017; 44(2):223–229. doi:10.3899/jrheum.160618
Myopathies can present with a wide variety of symptoms, so patients with muscle weakness are often seen initially by a general practitioner. Nonrheumatologists should be able to evaluate a patient presenting with muscle weakness or myalgia and be aware of red flags indicating potentially dangerous syndromes that require a prompt, thorough investigation.
This article reviews selected causes of muscle weakness, such as statin-induced and autoimmune disorders, and systemic features of inflammatory myopathies beyond myositis, such as dermatologic and pulmonary manifestations.
FOCUSING THE EVALUATION
The evaluation of a patient presenting with muscle weakness should include several assessments:
Temporal progression. Was the onset of symptoms rapid or insidious? Patterns of onset may give clues to etiology, including the possibility of an associated autoimmune condition.
Location of muscle weakness. Are symptoms global or localized? And if localized, are they proximal or distal? Proximal weakness can be manifested by difficulty rising from a chair (hip muscles) or combing one’s hair (shoulder muscles), whereas distal weakness can involve difficulty standing on toes (gastrocnemius and soleus muscles) or performing fine motor activities (intrinsic hand muscles).
Symmetry. A focal or asymmetric pattern often has a neurologic etiology, but this could also be consistent with inclusion body myositis.
Other symptoms. Arthritis, rash, and swallowing problems point to a possible underlying rheumatologic disease. Weight gain or loss may indicate a thyroid disorder.
Family history. Some patients report that others in their family have this pattern of weakness, indicating a likely genetic myopathy. If the patient reports a relative with multiple sclerosis, lupus erythematosus, rheumatoid arthritis, or another autoimmune disease, then an immune-mediated myopathy should be considered.
Medications should be reviewed, particularly statins.
CASE 1: SLOWLY PROGRESSIVE WEAKNESS
A 65-year-old man presented with the insidious onset of muscle weakness and episodes of falling. On review of his medical record, his serum creatine kinase (CK) levels were elevated at various periods at 2 to 4 times the upper limit of normal. Electromyography (EMG) previously showed a myopathic pattern, and a muscle biopsy was abnormal, consistent with endomysial inflammation (term is consistent with “polymyositis”). He was treated for polymyositis for several years with prednisone alone, with steroids plus methotrexate, and with combined immunosuppression including methotrexate and azathioprine, but with no improvement. Eventually, another muscle biopsy revealed inclusion bodies with rimmed vacuoles, consistent with inclusion body myositis.
Inclusion body myositis
Inclusion body myositis is the most common myopathy in middle-aged to elderly people, especially men. These patients are often told “You are just getting old,” but they have a defined condition. It should also be considered in patients failing to respond to treatment or with those with “refractory” polymyositis.
The onset of muscle weakness is insidious and painless, and the weakness progresses slowly. The pattern is distal and asymmetric (eg, foot drop), and muscle atrophy typically affects the forearm flexors, quadriceps, and intrinsic muscles of the hands.1
Magnetic resonance imaging may show marked muscle atrophy. Unfortunately, no treatment has shown efficacy, and most neuromuscular and rheumatology experts do not treat inclusion body myositis with immunosuppressive drugs.
CASE 2: MILD MYALGIA WITHOUT WEAKNESS
A black 52-year-old man was referred because of myalgia and a CK level of 862 U/L (reference range < 200). His physician wanted to start him on a statin but was hesitant to do so without first consulting a rheumatologist.
The patient had a long history of mild arthralgias and myalgias without muscle weakness. He had dyslipidemia and hypertension. He reported no family history of myopathy and no illicit drug use. He was formerly an athlete. Medications included a thiazide diuretic and a beta-blocker. On examination, his muscles were strong (rated 5 on a scale of 5) in the upper and lower extremities, without atrophy.
His records showed that his CK levels had risen and fallen repeatedly over the past few years, ranging from 600 to 1,100 U/L. On further questioning, he reported that when he had joined the army 30 years previously, a physician had recommended he undergo a liver biopsy in view of elevated liver function tests, but that he had refused because he felt fine.
Currently, his gamma-glutamyl transpeptidase levels were normal.
Idiopathic ‘hyperCKemia’
So-called idiopathic hyperCKemia is not a form of myositis but merely a laboratory result outside the “normal” range. Reference ranges are based predominantly on measurements in white people and on an assumption that the distribution is Gaussian (bell-shaped). A normal CK level is usually defined as less than 200 U/L. Using this standard, up to 20% of men and 5% of women have hyperCKemia.2
However, CK levels vary by sex and ethnicity, with mean levels highest in black men, followed by black women, white men, and white women. The mean level in black men is higher than the standard cutoff point for normal, and especially in this population, there is wide fluctuation around the mean, leading to hyperCKemia quite frequently in black men. Exercise and manual labor also drive up CK levels.3–5
Idiopathic hyperCKemia is benign. D’Adda et al6 followed 55 patients for a mean of 7.5 years. CK levels normalized in 12 patients or at least decreased in 24. Most remained symptom-free or had minimal symptoms.
Idiopathic hyperCKemia: Bottom line
Before prescribing a statin, determine the baseline CK level. If slightly elevated (ie, up to 3 to 5 times the upper limit of normal, or even higher) in the setting of normal muscle strength, there is no need for electromyography or muscle biopsy, and the patient can certainly receive a statin. Most of these patients do not need to see a rheumatologist but can simply have their CK and muscle strength monitored.
CLASSIFYING MYOSITIS
Myositis (idiopathic inflammatory myopathy) is a heterogeneous group of autoimmune syndromes of unknown cause characterized by chronic muscle weakness and inflammation of striated muscle. These syndromes likely arise as a result of genetic predisposition and an environmental or infectious “hit.”
Myositis is rare, with an incidence of 5 to 10 cases per million per year and an estimated prevalence of 50 to 90 cases per million. It has 2 incidence peaks: 1 in childhood (age 5–15) and another in adult midlife (age 30–50). Women are affected 2 to 3 times more often than men, with black women most commonly affected.
Myositis is traditionally classified as follows:
- Adult polymyositis
- Adult dermatomyositis
- Juvenile myositis (dermatomyositis much more frequent than polymyositis)
- Malignancy-associated myositis (usually dermatomyositis)
- Myositis overlapping with another autoimmune disease
- Inclusion body myositis.
However, polymyositis is less common than we originally thought, and the term necrotizing myopathy is now used in many patients, as noted in the case studies below. Further, myositis overlap syndromes are being increasingly diagnosed, likely related to the emergence of autoantibodies and clinical “syndromes” associated with these autoantibody subsets (discussed in cases below).
Dermatomyositis
Dermatomyositis is characterized by muscle weakness and a rash that can be obvious or subtle. Classic skin lesions are Gottron papules, which are raised, flat-topped red or purplish lesions over the knuckles, elbows, or knees.
Lesions may be confused with those of psoriasis. There can also be a V-neck rash over the anterior chest or upper back (“shawl sign”) or a rash over the lateral thigh (“holster sign”). A facial rash may occur, but unlike lupus, dermatomyositis does not spare the nasolabial area. However, the V-neck rash can be similar to that seen in lupus.
Dermatomyositis may cause muscle pain, perhaps related to muscle ischemia, whereas polymyositis and necrotizing myopathy are often painless. However, pain is also associated with fibromyalgia, which may be seen in many autoimmune conditions. It is important not to overtreat rheumatologic diseases with immunosuppression to try to control pain if the pain is actually caused by fibromyalgia.
Polymyositis mimics
Hypothyroid myopathy can present as classic polymyositis. The serum CK may be elevated, and there may be myalgias, muscle hypertrophy with stiffness, weakness, cramps, and even features of a proximal myopathy, and rhabdomyolysis. The electromyogram can be normal or myopathic. Results of muscle biopsy are often normal but may show focal necrosis and mild inflammatory infiltrates, thus mimicking that seen with inflammatory myopathy.7
Drug-induced or toxic myopathies can also mimic polymyositis. Statins are among the most commonly prescribed drugs in the United States, with more than 35 million people taking them. Statins are generally well tolerated but have a broad spectrum of toxicity, ranging from myalgias to life-threatening rhabdomyolysis. Myalgias lead to about 5% to 10% of patients refusing to take a statin or stopping it on their own.
Myalgias affect up to 20% of statin users in clinical practice.8,9 A small cross-sectional study10 of 1,000 patients in a primary care setting found that the risk of muscle complaints in statin users was 1.5 times higher than in nonstatin users, similar to findings in other studies.
My strategy for managing a patient with possible statin-induced myopathy is illustrated in Figure 1.
CASE 3: WEAKNESS, VERY HIGH CK ON A STATIN
In March 2010, a 67-year-old woman presented with muscle weakness. She had a history of hypertension, hyperlipidemia, and, more than 10 years previously, uterine cancer. In 2004, she was given atorvastatin for dyslipidemia. Four years later, she developed lower-extremity weakness, which her doctor attributed to normal aging. A year after that, she found it difficult to walk up steps and lift her arms overhead. In June 2009, she stopped taking the atorvastatin on her own, but the weakness did not improve.
In September 2009, she returned to her doctor, who found her CK level was 6,473 U/L but believed it to be an error, so the test was repeated, with a result of 9,375 U/L. She had no rash or joint involvement.
She was admitted to the hospital and underwent muscle biopsy, which showed myonecrosis with no inflammation or vasculitis. She was treated with prednisone 60 mg/day, and her elevated CK level and weakness improved.
Immune-mediated necrotizing myopathy associated with statins
The hallmark of necrotizing myopathy is myonecrosis without significant inflammation.12 This pattern contrasts with that of polymyositis, which is characterized by lymphocytic inflammation.
Although statins became available in the United States in 1987, immune-mediated necrotizing myopathy associated with statins was first described only in 2010. In that report, Grable-Esposito et al13 described 25 patients from 2 neuromuscular centers seen between 2000 and 2008 who had elevated CK and proximal weakness during or after statin use, both of which persisted despite stopping the statin. Patients improved with immunosuppressive agents but had a relapse when steroids were stopped or tapered, a pattern typical in autoimmune disease.
Autoantibody defines subgroup of necrotizing myopathy
Also in 2010, Christopher-Stine et al14 reported an antibody associated with necrotizing myopathy. Of 38 patients with the condition, 16 were found to have an abnormal “doublet” autoantibody recognizing 200- and 100-kDa proteins. All patients had weakness and a high CK level, and 63% had statin exposure before the weakness (this percentage increased to 83% in patients older than 50). All responded to immunosuppressive therapy, and many had a relapse when it was withdrawn.
Statins lower cholesterol by inhibiting 3-hydroxy-3-methylglutaryl-Co A reductase (HMGCR), and paradoxically, they also upregulate it. HMGCR has a molecular weight of 97 kDa. Mammen et al15 identified HMGCR as the 100-kDa target of the identified antibody and developed an enzyme-linked immunosorbent assay for it. Of 750 patients presenting to one center, only 45 (6%) had anti-HMGCR autoantibodies, but all 16 patients who had the abnormal doublet antibody tested positive for anti-HMGCR. Regenerating muscle cells express high levels of HMGCR, which may sustain the immune response after statins are discontinued.
Case 3 continued: Intravenous immunoglobulin brings improvement
In March 2010, when the 67-year-old patient presented to our myositis center, her CK level was 5,800 U/L, which increased as prednisone was tapered. She still felt weak. On examination, her muscle strength findings were deltoids 4+/5, neck flexors 4/5, and iliopsoas 3+/5. She was treated with methotrexate and azathioprine without benefit. She was next treated with intravenous immunoglobulin, and after 3 months, her strength normalized for the first time in years. Her CK level decreased but did not normalize. Testing showed that she was positive for anti-HMGCR autoantibody, as this test had become commercially available.
In 2015, Mammen and Tiniakou16 suggested using intravenous immunoglobulin as first-line therapy for statin-associated autoimmune necrotizing myopathy, based on experience at a single center with 3 patients who declined glucocorticoid treatment.
Necrotizing myopathy: Bottom line
Myositis overlap syndromes
Heterogeneity is the rule in myositis, and it can present with a wide variety of signs and symptoms as outlined in Table 2.
CASE 4: FEVER, NEW ‘RHEUMATOID ARTHRITIS,’ AND LUNG DISEASE
A 52-year-old woman with knee osteoarthritis saw her primary care physician in November 2013 for dyspnea and low-grade fever. The next month, she presented with polyarthritis, muscle weakness, and Raynaud phenomenon.
In January 2014, she developed acrocyanosis of her fingers. Examination revealed hyperkeratotic, cracked areas of her fingers. Her oxygen saturation by pulse oximetry was low. She was admitted to the hospital. Her doctor suspected new onset of rheumatoid arthritis, but blood tests revealed a negative antinuclear antibody, so an autoimmune condition was deemed unlikely. Her CK was mildly elevated at 350 U/L.
Because of her dyspnea, an open-lung biopsy was performed. High-resolution computed tomography (CT) revealed infiltrates and ground-glass opacities, leading to the diagnosis of nonspecific interstitial pneumonia. A rheumatologist was consulted and recommended pulse methylprednisolone, followed by prednisone 60 mg/day and mycophenolate mofetil. Testing for Jo-1 antibodies was positive.
Antisynthetase syndrome
The antisynthetase syndrome is a clinically heterogeneous condition that can occur with any or all of the following:
- Fever
- Myositis
- Arthritis (often misdiagnosed as rheumatoid arthritis)
- Raynaud phenomenon
- Mechanic’s hands (hyperkeratotic roughness with fissures on the lateral aspects of the fingers and finger pads)
- Interstitial lung disease.
The skin rashes and myositis may be subtle, making the presentation “lung-dominant,” and nonrheumatologists should be aware of this syndrome. Although in our patient the condition developed in a classic manner, with all of the aforementioned features of the antisynthetase syndrome, some patients will manifest one or a few of the features.
Clinically, patients with the Jo-1 antisynthetase syndrome often present differently than those with non-Jo-1 antisynthetase autoantibodies. When we compared 122 patients with Jo-1 vs 80 patients with a non-Jo-1 antisynthetase autoantibody, patients with Jo-1 antibodies were more likely to have initially received a diagnosis of myositis (83%), while myositis was the original diagnosis in only 17% of those possessing non-Jo-1 antisynthetase autoantibodies. In fact, many patients (approximately 50%) were diagnosed as having undifferentiated connective tissue disease or an overlap syndrome, and 13% had scleroderma as their first diagnosis.17
We also found that the survival rate was higher in patients with Jo-1 syndrome compared with patients with non-Jo-1 antisynthetase syndromes. We attributed the difference in survival rates to a delayed diagnosis in the non-Jo-1 group, perhaps due to their “nonclassic” presentations of the antisynthetase syndrome, delaying appropriate treatment. Patients received a diagnosis of Jo-1 antibody syndrome after a mean of 0.4 year (range 0.2–0.8), while those with a non-Jo-1 antisynthetase autoantibody had a delay in diagnosis of 1.0 year (range 0.4–5.1) (P < .01).17
In nearly half the cases in this cohort, pulmonary fibrosis was the cause of death, with primary pulmonary hypertension being the second leading cause (11%).
Antisynthetase syndrome: Bottom line
Antisynthetase syndrome is an often fatal disease that does not always present in a typical fashion with symptoms of myositis, as lung disease may be the predominant feature. A negative antinuclear antibody test result does not imply antibody negativity, as the autoantigen in these diseases is not located in the nucleus. Prompt diagnosis and appropriate immunosuppressive therapy are critical to improving outcomes.
CASE 5: FEVER, UNDIAGNOSED LUNG DISEASE, NO MYOSITIS
In January 2001, a 39-year-old woman was admitted to the hospital after 5 weeks of fever (temperatures 103°–104°F) and myalgias. An extensive workup was negative except for low-titer antinuclear antibody and for mild basilar fibrosis noted on chest radiography. She left the hospital against medical advice because of frustration with a lack of a specific diagnosis (“fever of unknown origin”).
Two months later, at a follow-up rheumatology consult, she reported more myalgias and arthralgias, as well as fever. Chest radiography now showed pleural effusions. Her fingers had color changes consistent with Raynaud phenomenon. At that time, I diagnosed an undifferentiated connective tissue disease and told her that I suspected an autoimmune condition that would need time to reveal itself. In the meantime, I treated her empirically with prednisone.
In April, she returned, much more short of breath and with more prominent diffuse pulmonary infiltrates. Physical examination revealed subtle Gottron changes. Testing revealed poor pulmonary function: forced vital capacity (FVC) 56%, forced expiratory volume in 1 second (FEV1) 52%, and diffusing capacity for carbon monoxide (Dlco) 40%. Blood testing was positive for anti-PL-12 antibody, one of the non-Jo-1 antisynthetase antibodies. At this time, we treated her with glucocorticoids and tacrolimus.
More than 15 years later, this patient is doing well. Her skin rash, joint symptoms, and fever have not returned, and interestingly, she never developed myositis. Her Raynaud symptoms are mild. Her most recent pulmonary function test results (January 2018) were FVC 75%, FEV1 87%, and Dlco 78%. Although these results are not normal, they are much improved and allow her to be completely functional without supplemental oxygen. Echocardiography showed normal pulmonary artery systolic pressure (25 mm Hg). She was still taking tacrolimus and prednisone. When we tried to stop tacrolimus after she had done well for many years, her condition flared.
Non-Jo-1 antisynthetase syndrome: Bottom line
Patients with a non-Jo-1 antisynthetase syndrome often present without myositis symptoms and may never manifest myositis symptoms. Likely because of this presentation, diagnosis of a specific connective tissue disorder is delayed, perhaps leading to increased mortality risk from pulmonary disease. Chronic immunosuppression is often required for these autoimmune conditions.
CASE 6: DERMATOMYOSITIS, RAPIDLY PROGRESSIVE INTERSTITIAL LUNG DISEASE
A 58-year-old woman presented in the summer of 2012 with a photosensitive rash. The following January, she returned with polyarthritis, mild muscle weakness, and a dermatomyositis-pattern rash. Her CK level was normal, and her antinuclear antibody and Sjögren syndrome antibody test results were negative. She improved on low-dose prednisone and methotrexate.
She was originally referred to me in May of that year for worsening rash and mild weakness. She denied pulmonary symptoms, but examination revealed faint basilar crackles. I increased her prednisone dosage to 20 mg/day and started mycophenolate mofetil mainly for the mild cutaneous and myositis features. I also recommended high-resolution CT of the lungs and pulmonary function tests, which she underwent in early June. High-resolution CT showed nonspecific mild infiltrates with minimal ground-glass opacities.
On July 1, she presented to her local emergency department with severe shortness of breath, requiring oxygen 12 L/min. She had a palmar rash. Repeat high-resolution CT showed dramatic worsening compared with the scan the previous month. Because of continued inadequate oxygenation, she was transferred to our center. A blood test later was positive for antimelanoma differentiation-associated gene 5 (MDA-5) autoantibody, previously known as anticlinically amyopathic dermatomyositis (anti-CADM)-140 antibody (based on immunoprecipitation results).
She died on the third day after transfer, just 2 months after I had originally seen her, at which time she had had no pulmonary symptoms.
Clinically amyopathic dermatomyositis
Anti-CADM-140, first reported from Asia,18–20 is an autoantibody-associated disease but not an antisynthetase. It is associated with dermatomyositis; patients often have a “vasculopathy” with cutaneous ulcerations and palmar papules.
MDA-5 is a cytoplasmic protein that “senses” viral RNA and induces production of type 1 interferon. It is involved in the innate immune defense against viruses.
Anti-MDA-5 positivity is associated with a poor pulmonary outcome.21 In our cohort from the University of Pittsburgh, many patients died within 3 years, compared with about a 40% survival rate in patients with dermatomyositis who tested negative for this antibody. That being said, many patients with anti-MDA-5 do not develop rapidly progressive interstitial lung disease.
Autoimmune interstitial lung disease: Bottom line
Autoimmune interstitial lung disease is easy to miss, especially in the case of a non-Jo-1 syndrome, for 3 important reasons:
- The autoimmune features may initially be subtle (eg, Raynaud phenomena, mild dermatomyositis rash, undifferentiated connective tissue disease)
- Autoantibody testing is not often ordered, is not standardized, or may be unavailable
- Providers are mistakenly reassured that a patient who tests negative for antinuclear antibody does not have an autoimmune condition.
To emphasize the last point, in a cohort of 202 patients who tested positive for an antisynthetase antibody, only half were antinuclear antibody-positive, but nearly three-quarters demonstrated anticytoplasmic staining on indirect immunofluorescence (due to the location of the autoantigen in the cytoplasm), making the latter a better screening test for an antisynthetase antibody. For scleroderma, 99% were antinculear antibody-positive, but for myositis, this test is much less sensitive.22
- Felice KJ, North WA. Inclusion body myositis in Connecticut: observations in 35 patients during an 8-year period. Medicine (Baltimore) 2001; 80(5):320–327. doi:10.1097/00005792-200109000-00006
- Lev EI, Tur-Kaspa I, Ashkenazy I, et al. Distribution of serum creatine kinase activity in young healthy persons. Clin Chim Acta 1999; 279(1-2):107–115. doi:10.1016/S0009-8981(98)00180-6
- Lilleng H, Abeler K, Johnsen SH, et al. Variation of serum creatine kinase (CK) levels and prevalence of persistent hyperCKemia in a Norwegian normal population. The Tromsø Study. Neuromuscul Disord 2011; 21(7):494–500. doi:10.1016/j.nmd.2011.04.007
- Johnston JD, Lloyd M, Mathews JA, Hawthorne SW. Racial variation in serum creatine kinase levels. J R Soc Med 1996; 89(8):462-464. pmid:8795501
- Prelle A, Tancredi L, Sciacco M, et al. Retrospective study of a large population of patients with asymptomatic or minimally symptomatic raised serum creatine kinase levels. J Neurol 2002; 249(3):305–311. pmid:11993531
- D’Adda E, Sciacco M, Fruguglietti ME, et al. Follow-up of a large population of asymptomatic/oligosymptomatic hyperckemic subjects. J Neurol 2006; 253(11):1399–1403. doi:10.1007/s00415-006-0223-y
- Madariaga MG. Polymyositis-like syndrome in hypothyroidism: review of cases reported over the past twenty-five years. Thyroid 2002; 12(4):331–336. doi:10.1089/10507250252949478
- de Sauvage Nolting PR, Buirma RJ, Hutten BA, Kastelein JJ; Dutch ExPRESS Investigator Group. Two-year efficacy and safety of simvastatin 80 mg in familial hypercholesterolemia (the Examination of Probands and Relatives in Statin Studies With Familial Hypercholesterolemia [ExPRESS FH]). Am J Cardiol 2002; 90(2):181–184. doi:10.1016/s0002-9149(02)02449-9
- Bruckert E, Hayem G, Dejager S, Yau C, Bégaud B. Mild to moderate muscular symptoms with high-dosage statin therapy in hyperlipidemic patients--the PRIMO study. Cardiovasc Drugs Ther 2005; 19(6):403–414. doi:10.1007/s10557-005-5686-z
- Mosshammer D, Lorenz G, Meznaric S, Schwarz J, Muche R, Mörike K. Statin use and its association with musculoskeletal symptoms—a cross-sectional study in primary care settings. Fam Pract 2009; 26(2):88–95. doi:10.1093/fampra/cmp006
- Nichols GA, Koro CE. Does statin therapy initiation increase the risk for myopathy? An observational study of 32,225 diabetic and nondiabetic patients. Clin Ther 2007; 29(8):1761–1770. doi:10.1016/j.clinthera.2007.08.022
- Kassardjian CD, Lennon VA, Alfugham NB, Mahler M, Milone M. Clinical features and treatment outcomes of necrotizing autoimmune myopathy. JAMA Neurol 2015; 72(9):996–1003. doi:10.1001/jamaneurol.2015.1207
- Grable-Esposito P, Katzberg HD, Greenberg SA, Srinivasan J, Katz J, Amato AA. Immune-mediated necrotizing myopathy associated with statins. Muscle Nerve 2010; 41(2):185–190. doi:10.1002/mus.21486
- Christopher-Stine L, Casciola-Rosen LA, Hong G, Chung T, Corse AM, Mammen AL. A novel autoantibody recognizing 200-kd and 100-kd proteins is associated with an immune-mediated necrotizing myopathy. Arthritis Rheum 2010; 62(9):2757–2766. doi:10.1002/art.27572
- Mammen AL, Chung T, Christopher-Stine L, et al. Autoantibodies against 3-hydroxy-3-methylglutaryl-coenzyme A reductase in patients with statin-associated autoimmune myopathy. Arthritis Rheum 2011; 63(3):713–721. doi:10.1002/art.30156
- Mammen AL, Tiniakou E. Intravenous immune globulin for statin-triggered autoimmune myopathy. N Engl J Med 2015; 373(17):1680–1682. doi:10.1056/NEJMc1506163
- Aggarwal R, Cassidy E, Fertig N, et al. Patients with non-Jo-1 anti-tRNA-synthetase autoantibodies have worse survival than Jo-1 positive patients. Ann Rheum Dis 2014; 73(1):227–232. doi:10.1136/annrheumdis-2012-201800
- Sato S, Hirakata M, Kuwana M, et al. Autoantibodies to a 140-kd polypeptide, CADM-140, in Japanese patients with clinically amyopathic dermatomyositis. Arthritis Rheum 2005; 52(5):1571–1576. doi:10.1002/art.21023
- Sato S, Hoshino K, Satoh T, et al. RNA helicase encoded by melanoma differentiation-associated gene 5 is a major autoantigen in patients with clinically amyopathic dermatomyositis: association with rapidly progressive interstitial lung disease. Arthritis Rheum 2009; 60(7):2193–2200. doi:10.1002/art.24621
- Chen F, Wang D, Shu X, Nakashima R, Wang G. Anti-MDA5 antibody is associated with A/SIP and decreased T cells in peripheral blood and predicts poor prognosis of ILD in Chinese patients with dermatomyositis. Rheumatol Int 2012; 32(12):3909–3915. doi:10.1007/s00296-011-2323-y
- Moghadam-Kia S, Oddis CV, Sato S, Kuwana M, Aggarwal R. Anti-melanoma differentiation-associated gene 5 is associated with rapidly progressive lung disease and poor survival in US patients with amyopathic and myopathic dermatomyositis. Arthritis Care Res (Hoboken) 2016; 68(5):689–694. doi:10.1002/acr.22728
- Aggarwal R, Dhillon N, Fertig N, Koontz D, Qi Z, Oddis CV. A negative antinuclear antibody does not indicate autoantibody negativity in myositis: role of anticytoplasmic antibody as a screening test for antisynthetase syndrome. J Rheumatol 2017; 44(2):223–229. doi:10.3899/jrheum.160618
KEY POINTS
- Inclusion body myositis affects older men more than women and is characterized by slowly progressive, asymmetric, distal and proximal weakness and atrophy.
- Statin-associated muscle complaints are common, whereas necrotizing myopathy, characterized by a very high CK plus weakness, is rare but must be recognized.
- Elevated CK does not necessarily indicate myositis, especially in African Americans or after heavy exercise.
- Dermatomyositis is characterized by muscle weakness and raised red or purple Gottron papules over the knuckles, elbows, or knees.
- Autoimmune interstitial lung disease may be caused by a variety of antibodies, the most common being anti-Jo-1 (directed against histidyl tRNA synthetase).
- The rarer non-Jo-1 antisynthetase autoantibodies may be associated with rapidly progressive interstitial lung disease, which is a challenge to recognize because associated rheumatologic symptoms may be minimal.
Hot Topics in Primary Care 2019
Click here to read Hot Topics in Primary Care.
This supplement includes 4 CME credits (scroll down for more information).
Topics include:
- Chronic Kidney Disease in Type 2 Diabetes
- Heart Failure in Type 2 Diabetes
- Diabetes Management
- Naproxen vs Opioids
- Statin Selection
- Insomnia in Alzheimer's Disease
- Cluster Headache
- Irritable Bowel Syndrome
This supplement offers the opportunity to earn a total of 4 CME credits.
Credit is awarded for scucesful completion of the online evaluations at the links below. These links may also be found within the supplement on the first page of each article.
- Chronic Kidney Disease in Type 2 Diabetes: Optimizing Glucose-Lowering Therapy
- To receive CME credit, please read the journal article and, upon completion, go to www.pceconsortium.org/DKD to complete the online post-test and receive your certificate of credit.
- Diabetes Management Update: Individualizing Treatment
- To receive CME credit, please read the journal article and, upon completion, go to www.pceconsortium.org/DM to complete the online post-test and receive your certificate of credit.
- Identification and Management of Insomnia in Alzheimer's Disease
- To receive CME credit, please read the journal article and, upon completion, go to www.pceconsortium.org/insomnia to complete the online post-test and receive your certificate of credit.
- Patient-Centric Care of Diarrhea-Predominant Irritable Bowel Syndrome
- To receive CME credit, please read the journal article and, upon completion, go to www.pceconsortium.org/IBSD to complete the online post-test and receive your certificate of credit.

Q&A: Drug costs and value in cancer
Skyrocketing drug costs are a key issue facing physicians, patients, and policymakers, but an even thornier problem may be determining a drug’s value.

In this Q&A, Richard L. Schilsky, MD, senior vice president and chief medical officer at the American Society of Clinical Oncology (ASCO), weighs in on the value proposition for cancer drugs and the implications for physicians.
Q: What tools exist for determining a drug’s value?
A: A number of organizations have developed tools to try to determine the value of cancer drug treatments. ASCO, the European Society for Medical Oncology (ESMO), the Institute for Clinical and Economic Review, Memorial Sloan Kettering Cancer Center, and the National Comprehensive Cancer Network have all developed tools for this purpose.
Our tool, the ASCO Value Framework, assesses the value of new cancer drug treatments based on clinical benefit, side effects, and improvements in patient symptoms or quality of life in the context of cost. While it’s hard to directly compare frameworks – given differences in methodology and the many nuances of evaluating clinical trial results – in 2018, ASCO and ESMO published a joint analysis of our value frameworks in the Journal of Clinical Oncology (2018; 37[4]:336-49).
The analysis found that the frameworks produce comparable measures of the clinical benefits of new therapies in approximately two-thirds of the more than 100 treatment comparisons that were examined. It also identified a number of factors that may contribute to the discordant scores, revealing potential ways for both of our organizations to refine our frameworks in the future.
That said, ASCO’s Value Framework is just one part of our broader, multifaceted effort to achieve high-quality, high-value care for all patients with cancer. Other efforts include ASCO’s proposed Patient-Centered Oncology Payment model, the Choosing Wisely campaign to identify low-value clinical strategies, and CancerLinQ and the Quality Oncology Practice Initiative to implement quality measurement and improvement.
Q: How can the issues around drug price and value be addressed earlier in the context of clinical trials?
A: The definition of value ultimately comes down to the price that must be paid to achieve meaningfully improved health outcomes for individual patients or the broader population of affected individuals. Optimizing the value of a new cancer drug treatment begins with an innovation to address an unmet medical need, followed by defining and achieving clinically meaningful improvements in health outcomes through well-designed and efficiently conducted clinical trials. Effectiveness research is also essential to determining how well new treatments perform compared with available alternatives and how they perform in more diverse populations than those typically included in the clinical trials used to establish efficacy.
Patient goals, preferences, and choices shape the real-world experience of a new product, and the direct and indirect costs of a treatment to patients and their families significantly affect whether it is adopted widely. Until their value is clearly established, new and costly products should be deployed judiciously and after careful consideration of the goals of treatment, available options, and the unique needs, preferences, and goals of individual patients.
More research is needed to improve how we assess the value of new cancer drug treatments. New clinical efficacy endpoints – both provider- and patient-reported ones – that accurately describe how a patient feels and functions must be developed and should reflect outcomes of value to patients other than survival, particularly in noncurative settings.
Better predictive biomarkers can transform a drug of modest efficacy in an unselected population to one of high efficacy in a biomarker-defined subgroup and thereby contribute to improving the value of a treatment.
Regulatory and policy initiatives such as adaptive licensing, value-based insurance, and indication-specific pricing that affect marketing approval, reimbursement, or price, respectively, based on treatment effectiveness, also deserve careful consideration and further research to determine their effects on aligning cost with benefit while ensuring patient access to potentially life-extending therapies and continued innovation in drug development.
Q: Aside from the policy options, what’s the role of the oncologist in discussing the value of drugs with patients when determining a treatment plan?
A: Since oncologists don’t control drug prices, our role in improving the value of cancer care involves appropriately managing how resources are used and guiding patients during discussions around the right treatment plan for their particular diagnosis, prognosis, and treatment goals.
Adopting and adhering to high-quality oncology clinical pathways is an important way to improve the quality, efficiency, and value of cancer care. High-quality oncology pathways are detailed, evidence-based treatment protocols for delivering cancer care to patients with specific disease types and stages. When properly designed and implemented, oncology pathways serve as an important tool in appropriately managing cancer care resources and improving the quality of care that patients with cancer receive, while also reducing costs.
Dr. Schilsky is the senior vice president and chief medical officer of ASCO. Formerly the chief of hematology/oncology in the department of medicine and deputy director of the University of Chicago Comprehensive Cancer Center, he is a leader in the field of clinical oncology, specializing in new drug development and the treatment of gastrointestinal cancers. Dr. Schilsky reported research funding from several pharmaceutical companies to ASCO for the Targeted Agent and Profiling Utilization Registry (TAPUR) clinical trial. He also reported travel/accommodation/expense support from Varian.
Skyrocketing drug costs are a key issue facing physicians, patients, and policymakers, but an even thornier problem may be determining a drug’s value.
In this Q&A, Richard L. Schilsky, MD, senior vice president and chief medical officer at the American Society of Clinical Oncology (ASCO), weighs in on the value proposition for cancer drugs and the implications for physicians.
Q: What tools exist for determining a drug’s value?
A: A number of organizations have developed tools to try to determine the value of cancer drug treatments. ASCO, the European Society for Medical Oncology (ESMO), the Institute for Clinical and Economic Review, Memorial Sloan Kettering Cancer Center, and the National Comprehensive Cancer Network have all developed tools for this purpose.
Our tool, the ASCO Value Framework, assesses the value of new cancer drug treatments based on clinical benefit, side effects, and improvements in patient symptoms or quality of life in the context of cost. While it’s hard to directly compare frameworks – given differences in methodology and the many nuances of evaluating clinical trial results – in 2018, ASCO and ESMO published a joint analysis of our value frameworks in the Journal of Clinical Oncology (2018; 37[4]:336-49).
The analysis found that the frameworks produce comparable measures of the clinical benefits of new therapies in approximately two-thirds of the more than 100 treatment comparisons that were examined. It also identified a number of factors that may contribute to the discordant scores, revealing potential ways for both of our organizations to refine our frameworks in the future.
That said, ASCO’s Value Framework is just one part of our broader, multifaceted effort to achieve high-quality, high-value care for all patients with cancer. Other efforts include ASCO’s proposed Patient-Centered Oncology Payment model, the Choosing Wisely campaign to identify low-value clinical strategies, and CancerLinQ and the Quality Oncology Practice Initiative to implement quality measurement and improvement.
Q: How can the issues around drug price and value be addressed earlier in the context of clinical trials?
A: The definition of value ultimately comes down to the price that must be paid to achieve meaningfully improved health outcomes for individual patients or the broader population of affected individuals. Optimizing the value of a new cancer drug treatment begins with an innovation to address an unmet medical need, followed by defining and achieving clinically meaningful improvements in health outcomes through well-designed and efficiently conducted clinical trials. Effectiveness research is also essential to determining how well new treatments perform compared with available alternatives and how they perform in more diverse populations than those typically included in the clinical trials used to establish efficacy.
Patient goals, preferences, and choices shape the real-world experience of a new product, and the direct and indirect costs of a treatment to patients and their families significantly affect whether it is adopted widely. Until their value is clearly established, new and costly products should be deployed judiciously and after careful consideration of the goals of treatment, available options, and the unique needs, preferences, and goals of individual patients.
More research is needed to improve how we assess the value of new cancer drug treatments. New clinical efficacy endpoints – both provider- and patient-reported ones – that accurately describe how a patient feels and functions must be developed and should reflect outcomes of value to patients other than survival, particularly in noncurative settings.
Better predictive biomarkers can transform a drug of modest efficacy in an unselected population to one of high efficacy in a biomarker-defined subgroup and thereby contribute to improving the value of a treatment.
Regulatory and policy initiatives such as adaptive licensing, value-based insurance, and indication-specific pricing that affect marketing approval, reimbursement, or price, respectively, based on treatment effectiveness, also deserve careful consideration and further research to determine their effects on aligning cost with benefit while ensuring patient access to potentially life-extending therapies and continued innovation in drug development.
Q: Aside from the policy options, what’s the role of the oncologist in discussing the value of drugs with patients when determining a treatment plan?
A: Since oncologists don’t control drug prices, our role in improving the value of cancer care involves appropriately managing how resources are used and guiding patients during discussions around the right treatment plan for their particular diagnosis, prognosis, and treatment goals.
Adopting and adhering to high-quality oncology clinical pathways is an important way to improve the quality, efficiency, and value of cancer care. High-quality oncology pathways are detailed, evidence-based treatment protocols for delivering cancer care to patients with specific disease types and stages. When properly designed and implemented, oncology pathways serve as an important tool in appropriately managing cancer care resources and improving the quality of care that patients with cancer receive, while also reducing costs.
Dr. Schilsky is the senior vice president and chief medical officer of ASCO. Formerly the chief of hematology/oncology in the department of medicine and deputy director of the University of Chicago Comprehensive Cancer Center, he is a leader in the field of clinical oncology, specializing in new drug development and the treatment of gastrointestinal cancers. Dr. Schilsky reported research funding from several pharmaceutical companies to ASCO for the Targeted Agent and Profiling Utilization Registry (TAPUR) clinical trial. He also reported travel/accommodation/expense support from Varian.
Are Pediatric Readmission Reduction Efforts Falling Flat?
In an effort to improve healthcare for Americans by linking hospital payments to quality of care, Medicare’s Hospital Readmission Reduction Program (HRRP) began penalizing hospitals with “excess” readmission rates in 2012. The decision sparked widespread debate about the definition of a preventable readmission and whether a patient’s socioeconomic status should be considered for risk adjustment. Although coming back to the hospital after an admission is an undesirable outcome for any patient, the suitability of readmission as a quality measure remains a hot and debated topic. Research on the subject skyrocketed; over 12000 articles about hospital readmissions have been indexed in PubMed since 2000, and the number of publications has steadily increased since 2010 (Figure).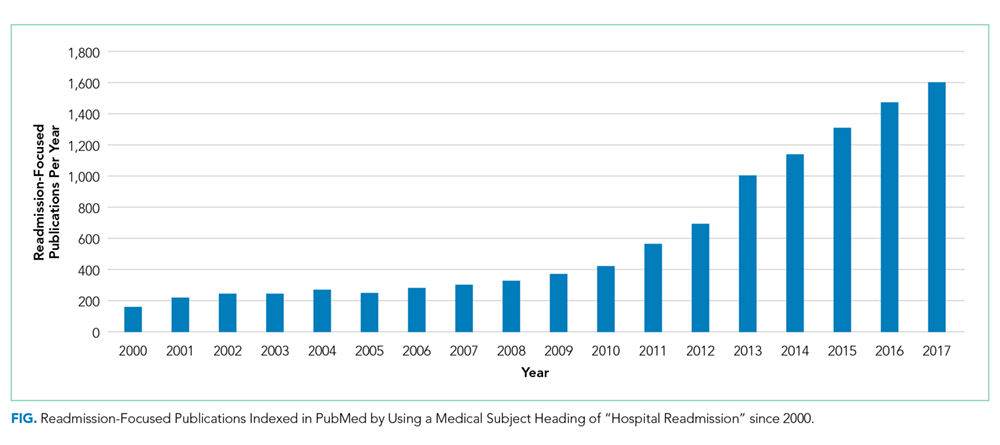
Although the HRRP is a Medicare initiative, there has been a substantial focus on readmissions in pediatrics as well. The National Quality Forum has endorsed three quality measures specific to readmission in children: (1) the rate of unplanned readmissions to the pediatric intensive care unit within 24 hours after discharge or transfer, (2) the pediatric lower respiratory infection readmission measure, defined as the percentage of admissions followed by one or more readmissions within 30 days of hospitalization for lower respiratory infection, and (3) the pediatric all-cause readmission measure, defined as the percentage of admissions followed by one or more readmissions within 30 days. These endorsements were preceded by studies showing that pediatric readmission rates varied substantially across hospitals and clinical conditions, and that children with chronic illnesses were at the highest risk.
Readmission is an attractive pediatric quality measure for a number of reasons. This measure is easy to apply to data at the hospital, health system, and payor levels at relatively low cost. Relatedly, the all-condition measure can be applied to all pediatric hospitalizations, overcoming the very real challenge in pediatric quality measurement of inadequate sample sizes to discern differences in healthcare quality at the hospital level for many disease-specific measures.1 In addition, this measure moves beyond process measurement to quantify an outcome relevant to families as well as healthcare systems. Finally, the measure is founded on a compelling conceptual framework (albeit one that remains challenging to prove) that efforts to improve a patient’s hospital-to-home transition and discharge readiness will reduce their likelihood of readmission.
In this issue of the Journal of Hospital Medicine, Katherine Auger and colleagues present their analysis of pediatric readmission rates from 2010 to 2016 across 66 children’s hospitals.2 They found that the median seven-day all-cause pediatric readmission rate was 5.1%, with no change in rates over the seven-year study period. Applying proprietary software to identify potentially preventable readmissions (PPR), they reported that approximately 40% of these readmissions may be preventable, a proportion that was also unchanged over time. Interestingly, 88% of the hospitals represented in their data were participating in the Solutions for Patient Safety national learning collaborative during the study period, making efforts to reduce seven-day readmission rates. Despite this, the figures presented in this paper of all-condition and potentially preventable readmission rates over time are very, very flat.
This work by Auger et al. contributes to our understanding about the preventability, or lack thereof, of pediatric all-condition readmissions. If 40% of these readmissions are indeed preventable, then why did Auger et al. not observe a declining proportion of PPR over time as a result of hospital participation in a national collaborative? Past quantitative and qualitative studies provide important context. First, the 40% rate of readmission preventability is twofold higher than that reported in past studies that relied on physician judgement to determine readmission preventability;3,4 the authors’ use of proprietary software to categorize the preventability of a readmission limits our ability to explain the differences in these rates. However, in these past studies, the rates of initial agreement between physician reviewers about readmission preventability were poor, highlighting the challenges associated with determining readmission preventability. Moreover, qualitative studies suggest that physicians and families lack a shared understanding of the preventability of readmissions.5 Finally, a systematic review of pediatric hospital discharge interventions did not identify any one intervention that was consistently effective in reducing hospital readmission rates.6 The following important questions remain: Were hospitals’ efforts to reduce PPR targeting the wrong patients? Were the interventions insufficient or ineffective? Or are readmission measures insufficiently sensitive to improved processes of care?
Recognizing that the majority of research on readmission as well as HRRP penalties focuses on adult populations, perhaps we can apply some lessons learned from the HRRP to pediatrics. Recent analyses by Medicare Payment Advisory Commission (MedPAC) suggest that raw and risk-adjusted readmission rates have declined for conditions covered by the HRRP, with readmission rates for HRRP target conditions declining more quickly than that for nontarget conditions.7 Just as the HRRP has focused on target conditions with relatively high readmission rates, analogous efforts to focus pediatric readmission reduction on children at greatest risk may enable measurement of change over time. For example, although children with complex chronic medical conditions represent a small proportion of the pediatric population, they account for 60% of all pediatric readmissions in the United States. However, similar to the above-described meta-analysis of readmission reduction efforts in children, at least one meta-analysis has demonstrated that there is no one intervention or even bundle of interventions that has consistently reduced readmissions in adults.8 Although the readmission rates for HRRP target conditions have decreased, the results of clinical trials evaluating readmission reduction efforts are difficult to translate into practice given substantial heterogeneity in study designs, interventions, and patient populations.
Does this study by Auger et al. suggest that pediatric readmission reduction efforts are misguided or futile? No. But it does provide compelling data that efforts to reduce all-cause readmissions for all children may not yield measureable changes using the current measures. A narrowed focus on children with chronic illnesses, who account for approximately half of all pediatric admissions, may be warranted. A number of studies have summarized families’ preferences regarding their hospital-to-home transitions; the results indicate that families of children with chronic illness have unique desires and needs.9,10 Perhaps it is time to take a step back from pediatric readmission reduction efforts, largely inspired by the HRRP, and redirect our resources to implement and evaluate processes and outcomes most valued by children and their families.
Disclosures
Drs. Lagu and Lindenauer have served as consultants for the Yale Center for Outcomes Research and Evaluation (under contract to the Centers for Medicare and Medicaid Services) providing clinical and methodological expertise and input on the development, reevaluation, and implementation of hospital outcome and efficiency measures.
Funding
Dr. Lagu is supported by the National Heart, Lung, and Blood Institute of the National Institutes of Health under Award R01 HL139985-01A1 and 1R01HL146884-01. Dr. Lindenauer was supported by the National Heart, Lung, and Blood Institute of the National Institutes of Health under Award Number K24HL132008.
Disclaimer
The views expressed in this manuscript do not necessarily reflect those of the Yale Center for Outcomes Research and Evaluation or the Centers for Medicare and Medicaid Services. The content is solely the responsibility of the authors and does not necessarily represent the official views of the NIH.
1. Berry JG, Zaslavsky AM, Toomey SL, et al. Recognizing differences in hospital quality performance for pediatric inpatient care. Pediatrics. 2015;136(2):251-262. https://doi.org/10.1542/peds.2014-3131.
2. Auger K, Harris M, Gay J, et al. Progress (?) towards reducing pediatric readmissions. J Hosp Med. 2019;14(10):618-621. https://doi.org/10.12788/jhm.3210
3. Hain PD, Gay JC, Berutti TW, Whitney GM, Wang W, Saville BR. Preventability of early readmissions at a children’s hospital. Pediatrics. 2013;131(1):e171-e181. https://doi.org/10.1542/peds.2012-0820.
4. Wallace SS, Keller SL, Falco CN, et al. An examination of physician-, caregiver-, and disease-related factors associated with readmission from a pediatric hospital medicine service. Hosp Pediatr. 2015;5(11):566-573. https://doi.org/10.1542/hpeds.2015-0015.
5. Brittan M, Albright K, Cifuentes M, Jimenez-Zambrano A, Kempe A. Parent and provider perspectives on pediatric readmissions: what can we learn about readiness for discharge?. Hosp Pediatr. 2015;5(11):559-565. https://doi.org/10.1542/hpeds.2015-0034.
6. Auger K, Kenyon CC, Feudtner C, Davis MM. Pediatric hospital discharge interventions to reduce subsequent utilization: a systematic review. J Hosp Med. 2014;9(4):251-260. https://doi.org/10.1002/jhm.2134.
7. NEJM Catalyst. Hospital Readmissions Reduction Program (HRRP). Available at: https://catalyst.nejm.org/hospital-readmissions-reduction-program-hrrp/. Accessed May 21, 2019.
8. Hansen L, Young R, Hinami K, Leung A, Williams M. Interventions to reduce 30-day rehospitalization: a systematic review. Ann Intern Med. 2011;155(8):520-528. https://doi.org/10.7326/0003-4819-155-8-201110180-00008.
9. Leyenaar J, O’Brien E, Leslie L, Lindenauer P, Mangione-Smith R. Families’ priorities regarding hospital-to-home transitions for children with medical complexity. Pediatrics. 2017;139(1): e20161581. https://doi.org/10.1542/peds.2016-1581.
10. Desai AD, Durkin LK, Jacob-Files EA, Mangione-Smith R. Caregiver perceptions of hospital to home transitions according to medical complexity: a qualitative study. Acad Pediatr. 2016;16(2):136-144. https://doi.org/10.1016/j.acap.2015.08.003.
In an effort to improve healthcare for Americans by linking hospital payments to quality of care, Medicare’s Hospital Readmission Reduction Program (HRRP) began penalizing hospitals with “excess” readmission rates in 2012. The decision sparked widespread debate about the definition of a preventable readmission and whether a patient’s socioeconomic status should be considered for risk adjustment. Although coming back to the hospital after an admission is an undesirable outcome for any patient, the suitability of readmission as a quality measure remains a hot and debated topic. Research on the subject skyrocketed; over 12000 articles about hospital readmissions have been indexed in PubMed since 2000, and the number of publications has steadily increased since 2010 (Figure).
Although the HRRP is a Medicare initiative, there has been a substantial focus on readmissions in pediatrics as well. The National Quality Forum has endorsed three quality measures specific to readmission in children: (1) the rate of unplanned readmissions to the pediatric intensive care unit within 24 hours after discharge or transfer, (2) the pediatric lower respiratory infection readmission measure, defined as the percentage of admissions followed by one or more readmissions within 30 days of hospitalization for lower respiratory infection, and (3) the pediatric all-cause readmission measure, defined as the percentage of admissions followed by one or more readmissions within 30 days. These endorsements were preceded by studies showing that pediatric readmission rates varied substantially across hospitals and clinical conditions, and that children with chronic illnesses were at the highest risk.
Readmission is an attractive pediatric quality measure for a number of reasons. This measure is easy to apply to data at the hospital, health system, and payor levels at relatively low cost. Relatedly, the all-condition measure can be applied to all pediatric hospitalizations, overcoming the very real challenge in pediatric quality measurement of inadequate sample sizes to discern differences in healthcare quality at the hospital level for many disease-specific measures.1 In addition, this measure moves beyond process measurement to quantify an outcome relevant to families as well as healthcare systems. Finally, the measure is founded on a compelling conceptual framework (albeit one that remains challenging to prove) that efforts to improve a patient’s hospital-to-home transition and discharge readiness will reduce their likelihood of readmission.
In this issue of the Journal of Hospital Medicine, Katherine Auger and colleagues present their analysis of pediatric readmission rates from 2010 to 2016 across 66 children’s hospitals.2 They found that the median seven-day all-cause pediatric readmission rate was 5.1%, with no change in rates over the seven-year study period. Applying proprietary software to identify potentially preventable readmissions (PPR), they reported that approximately 40% of these readmissions may be preventable, a proportion that was also unchanged over time. Interestingly, 88% of the hospitals represented in their data were participating in the Solutions for Patient Safety national learning collaborative during the study period, making efforts to reduce seven-day readmission rates. Despite this, the figures presented in this paper of all-condition and potentially preventable readmission rates over time are very, very flat.
This work by Auger et al. contributes to our understanding about the preventability, or lack thereof, of pediatric all-condition readmissions. If 40% of these readmissions are indeed preventable, then why did Auger et al. not observe a declining proportion of PPR over time as a result of hospital participation in a national collaborative? Past quantitative and qualitative studies provide important context. First, the 40% rate of readmission preventability is twofold higher than that reported in past studies that relied on physician judgement to determine readmission preventability;3,4 the authors’ use of proprietary software to categorize the preventability of a readmission limits our ability to explain the differences in these rates. However, in these past studies, the rates of initial agreement between physician reviewers about readmission preventability were poor, highlighting the challenges associated with determining readmission preventability. Moreover, qualitative studies suggest that physicians and families lack a shared understanding of the preventability of readmissions.5 Finally, a systematic review of pediatric hospital discharge interventions did not identify any one intervention that was consistently effective in reducing hospital readmission rates.6 The following important questions remain: Were hospitals’ efforts to reduce PPR targeting the wrong patients? Were the interventions insufficient or ineffective? Or are readmission measures insufficiently sensitive to improved processes of care?
Recognizing that the majority of research on readmission as well as HRRP penalties focuses on adult populations, perhaps we can apply some lessons learned from the HRRP to pediatrics. Recent analyses by Medicare Payment Advisory Commission (MedPAC) suggest that raw and risk-adjusted readmission rates have declined for conditions covered by the HRRP, with readmission rates for HRRP target conditions declining more quickly than that for nontarget conditions.7 Just as the HRRP has focused on target conditions with relatively high readmission rates, analogous efforts to focus pediatric readmission reduction on children at greatest risk may enable measurement of change over time. For example, although children with complex chronic medical conditions represent a small proportion of the pediatric population, they account for 60% of all pediatric readmissions in the United States. However, similar to the above-described meta-analysis of readmission reduction efforts in children, at least one meta-analysis has demonstrated that there is no one intervention or even bundle of interventions that has consistently reduced readmissions in adults.8 Although the readmission rates for HRRP target conditions have decreased, the results of clinical trials evaluating readmission reduction efforts are difficult to translate into practice given substantial heterogeneity in study designs, interventions, and patient populations.
Does this study by Auger et al. suggest that pediatric readmission reduction efforts are misguided or futile? No. But it does provide compelling data that efforts to reduce all-cause readmissions for all children may not yield measureable changes using the current measures. A narrowed focus on children with chronic illnesses, who account for approximately half of all pediatric admissions, may be warranted. A number of studies have summarized families’ preferences regarding their hospital-to-home transitions; the results indicate that families of children with chronic illness have unique desires and needs.9,10 Perhaps it is time to take a step back from pediatric readmission reduction efforts, largely inspired by the HRRP, and redirect our resources to implement and evaluate processes and outcomes most valued by children and their families.
Disclosures
Drs. Lagu and Lindenauer have served as consultants for the Yale Center for Outcomes Research and Evaluation (under contract to the Centers for Medicare and Medicaid Services) providing clinical and methodological expertise and input on the development, reevaluation, and implementation of hospital outcome and efficiency measures.
Funding
Dr. Lagu is supported by the National Heart, Lung, and Blood Institute of the National Institutes of Health under Award R01 HL139985-01A1 and 1R01HL146884-01. Dr. Lindenauer was supported by the National Heart, Lung, and Blood Institute of the National Institutes of Health under Award Number K24HL132008.
Disclaimer
The views expressed in this manuscript do not necessarily reflect those of the Yale Center for Outcomes Research and Evaluation or the Centers for Medicare and Medicaid Services. The content is solely the responsibility of the authors and does not necessarily represent the official views of the NIH.
1. Berry JG, Zaslavsky AM, Toomey SL, et al. Recognizing differences in hospital quality performance for pediatric inpatient care. Pediatrics. 2015;136(2):251-262. https://doi.org/10.1542/peds.2014-3131.
2. Auger K, Harris M, Gay J, et al. Progress (?) towards reducing pediatric readmissions. J Hosp Med. 2019;14(10):618-621. https://doi.org/10.12788/jhm.3210
3. Hain PD, Gay JC, Berutti TW, Whitney GM, Wang W, Saville BR. Preventability of early readmissions at a children’s hospital. Pediatrics. 2013;131(1):e171-e181. https://doi.org/10.1542/peds.2012-0820.
4. Wallace SS, Keller SL, Falco CN, et al. An examination of physician-, caregiver-, and disease-related factors associated with readmission from a pediatric hospital medicine service. Hosp Pediatr. 2015;5(11):566-573. https://doi.org/10.1542/hpeds.2015-0015.
5. Brittan M, Albright K, Cifuentes M, Jimenez-Zambrano A, Kempe A. Parent and provider perspectives on pediatric readmissions: what can we learn about readiness for discharge?. Hosp Pediatr. 2015;5(11):559-565. https://doi.org/10.1542/hpeds.2015-0034.
6. Auger K, Kenyon CC, Feudtner C, Davis MM. Pediatric hospital discharge interventions to reduce subsequent utilization: a systematic review. J Hosp Med. 2014;9(4):251-260. https://doi.org/10.1002/jhm.2134.
7. NEJM Catalyst. Hospital Readmissions Reduction Program (HRRP). Available at: https://catalyst.nejm.org/hospital-readmissions-reduction-program-hrrp/. Accessed May 21, 2019.
8. Hansen L, Young R, Hinami K, Leung A, Williams M. Interventions to reduce 30-day rehospitalization: a systematic review. Ann Intern Med. 2011;155(8):520-528. https://doi.org/10.7326/0003-4819-155-8-201110180-00008.
9. Leyenaar J, O’Brien E, Leslie L, Lindenauer P, Mangione-Smith R. Families’ priorities regarding hospital-to-home transitions for children with medical complexity. Pediatrics. 2017;139(1): e20161581. https://doi.org/10.1542/peds.2016-1581.
10. Desai AD, Durkin LK, Jacob-Files EA, Mangione-Smith R. Caregiver perceptions of hospital to home transitions according to medical complexity: a qualitative study. Acad Pediatr. 2016;16(2):136-144. https://doi.org/10.1016/j.acap.2015.08.003.
© 2019 Society of Hospital Medicine
The Best Laid Plans—Medication Reconciliation Optimization in Theory and Practice
Of all the errors that occur in modern healthcare, medication errors are among the most ubiquitous and consequential. Adverse drug events (ADEs) account for approximately 700,000 emergency department visits, 100,000 hospitalizations, and 1.3 million people are injured by medication errors annually.1 Among the most frequent causes of preventable ADEs are errors on the medication lists when patients are admitted to hospitals.2 Therefore, preventing discrepancies between medications the patient is prescribed (and actually taking) inside and outside the hospital—the so-called “medication reconciliation”—is an intense, ongoing area of focus for health systems, pharmacies, and numerous quality and safety organizations seeking to reduce ADEs.
Past studies of medication reconciliation interventions have suggested benefit from restricting medication reconciliation to admission or discharge, pharmacist or pharmacy technician-led medication reconciliation, and pharmacy-led interventions (ie, telephone follow-up/home visit, patient counseling) for ensuring an accurate medication list.3-5 Recent evidence suggests that pharmacist discharge medication reconciliation is associated with decreased readmission rates, decreased medication discrepancies, and adverse events associated with drug therapy issues.4 The successful interventions were promising, but disseminating such interventions can often be very complex.6
In this issue of the Journal of Hospital Medicine, Mixon et al. report the results of a subanalysis of the MARQUIS trial,7 wherein they individually examined the on-protocol effects of the interventions that MARQUIS recommended, comparing hospitals to their own running baseline data at the implementation of each intervention to data following the implementation. The authors found that only three of the nine interventions were associated with reducing potentially harmful discrepancies in the medication list—training existing staff to perform discharge medication reconciliation, hiring additional staff for this purpose, and defining roles and responsibilities and roles clearly—and that two were actually associated with harm—training existing staff to take best possible medication histories (BPMHs) and implementing a new Electronic Medical Record (EMR). MARQUIS is unique in not just attempting but in reporting “best case” real-world implementation using available literature to design mentored, practical approaches to those same interventions at sites not involved in their initial setup and validation.
EMR implementation should in theory improve accuracy (or at least legibility), but it can also contribute to new types of inaccuracy or, as the authors propose, deprioritize quality and safety as organizational goals during the rigors of digitization. Similarly, training staff to take a BPMH might create false confidence in the results or interact with medication reconciliation in other complex ways. Opting to add more work instead of hiring additional staff may have increased the burden of medication review and thus contributed to its inaccuracy.
On the contrary, certain interventions, such as having clear accountability for the medication list, hiring additional staff to construct that list, and clearly defining the roles of those involved in the reconciliation process, were associated with improved medication reconciliation. All these strategies require resource allocation, but at least the current study provides evidence that such resource allocation can be effective in new settings as they were in their original ones.
The study has important acknowledged limitations. The on-protocol analysis limited the authors to reporting associations rather than causality. Moreover, the original trial ran from 2011 to 2014, which was a time of rapid EMR implementation and new recognition of the problems posed by the same; several organizations are in a far more mature EMR context today. Conversely, newer technologies such as patient-facing medication reconciliation applications, cross-organization medication lists available from some EMR vendors, and health platforms that collect data from multiple EMRs were not evaluated because they did not exist at the time of the original trial. Another important trend in healthcare, the rise of Accountable Care Organizations and their focus on integration and defragmentation, may have an important part to play in medication list accuracy. All the above-mentioned aspects will be important avenues for ongoing research in real-world medication reconciliation.
Mixon’s findings come at a time when medication reconciliation is again a national health informatics priority, a key component of the Medicare Access and CHIP reauthorization Act of 2015 and Merit-based Incentive Payments System8 since 2019, with hospitals reporting medication reconciliation rates for financial in addition to quality and safety reasons. Hopefully, this study and others, in combination with the abovementioned incentives, will stimulate further research into impactful strategies for medication reconciliation and ideal ways to implement them. With luck, the end result will be more generalizable interventions, with a track record of success, that would help ensure that patients are prescribed, are reporting, are taking, and are noted to be taking the medications that they and their providers intended, both on presentation to the hospital and on discharge home.
Disclosures
Vicki Jue has no conflicts of interest to report. Raman Khanna reports developing CareWeb, a communication platform that has been licensed to Voalte, Inc. This work is unrelated to the current editorial. No other conflicts of interest to report.
1. Center for Drug Evaluation and Research. Medication Errors-Medication Error Reports. https://www.fda.gov/Drugs/DrugSafety/MedicationErrors/ucm080629.htm.Accessed June 14, 2019.
2. Cornish PL, Knowles SR, Marchesano R, et al. Unintended medication discrepancies at the time of hospital admission. Arch Intern Med. 2005;165(4):424-429. https://doi.org/ 10.1001/archinte.165.4.424.
3. Mekonnen AB, McLachlan AJ, Brien JE. Pharmacy-led medication reconciliation programmes at hospital transitions: a systematic review and meta-analysis. J Clin Pharm Ther. 2016;41(2):128-144. https://doi.org/ 10.1111/jcpt.12364.
4. Kilcup M, Schultz D, Carlson J, et al. Postdischarge pharmacist medication reconciliation: impact on readmission rates and financial savings. J Am Pharm Assoc. 2013;53(1):78-84. https://doi.org/ 10.1331/JAPhA.2013.11250.
5. Cater SW, Luzum M, Serra AE, et al. A prospective cohort study of medication reconciliation using pharmacy technicians in the emergency department to reduce medication errors among patients. J Emerg Med. 2015;48(2):230-238. https://doi.org/ 10.1016/j.jemermed.2014.09.065.
6. Horton TJ, Illingworth JH, Warburton WHP. Overcoming challenges in codifying and replicating complex health care interventions. Health Aff. 2018;37(2):191-197. https://doi.org/ 10.1377/hlthaff.2017.1161.
7. Mixon A, Kripalani S, Stein J, et al. An on-treatment analysis of the MARQUIS study: interventions to improve inpatient medication reconciliation. J Hosp Med. 2019;(10):614-617. https://doi.org/ 10.12788/jhm.3258
8. Centers for Medicare & Medicaid Services. https://www.cms.gov/Medicare/Quality-Initiatives-Patient-Assessment-Instruments/Value-Based-Programs/MACRA-MIPS-and-APMs/MACRA-MIPS-and-APMs.html.Accessed June 25, 2019.
Of all the errors that occur in modern healthcare, medication errors are among the most ubiquitous and consequential. Adverse drug events (ADEs) account for approximately 700,000 emergency department visits, 100,000 hospitalizations, and 1.3 million people are injured by medication errors annually.1 Among the most frequent causes of preventable ADEs are errors on the medication lists when patients are admitted to hospitals.2 Therefore, preventing discrepancies between medications the patient is prescribed (and actually taking) inside and outside the hospital—the so-called “medication reconciliation”—is an intense, ongoing area of focus for health systems, pharmacies, and numerous quality and safety organizations seeking to reduce ADEs.
Past studies of medication reconciliation interventions have suggested benefit from restricting medication reconciliation to admission or discharge, pharmacist or pharmacy technician-led medication reconciliation, and pharmacy-led interventions (ie, telephone follow-up/home visit, patient counseling) for ensuring an accurate medication list.3-5 Recent evidence suggests that pharmacist discharge medication reconciliation is associated with decreased readmission rates, decreased medication discrepancies, and adverse events associated with drug therapy issues.4 The successful interventions were promising, but disseminating such interventions can often be very complex.6
In this issue of the Journal of Hospital Medicine, Mixon et al. report the results of a subanalysis of the MARQUIS trial,7 wherein they individually examined the on-protocol effects of the interventions that MARQUIS recommended, comparing hospitals to their own running baseline data at the implementation of each intervention to data following the implementation. The authors found that only three of the nine interventions were associated with reducing potentially harmful discrepancies in the medication list—training existing staff to perform discharge medication reconciliation, hiring additional staff for this purpose, and defining roles and responsibilities and roles clearly—and that two were actually associated with harm—training existing staff to take best possible medication histories (BPMHs) and implementing a new Electronic Medical Record (EMR). MARQUIS is unique in not just attempting but in reporting “best case” real-world implementation using available literature to design mentored, practical approaches to those same interventions at sites not involved in their initial setup and validation.
EMR implementation should in theory improve accuracy (or at least legibility), but it can also contribute to new types of inaccuracy or, as the authors propose, deprioritize quality and safety as organizational goals during the rigors of digitization. Similarly, training staff to take a BPMH might create false confidence in the results or interact with medication reconciliation in other complex ways. Opting to add more work instead of hiring additional staff may have increased the burden of medication review and thus contributed to its inaccuracy.
On the contrary, certain interventions, such as having clear accountability for the medication list, hiring additional staff to construct that list, and clearly defining the roles of those involved in the reconciliation process, were associated with improved medication reconciliation. All these strategies require resource allocation, but at least the current study provides evidence that such resource allocation can be effective in new settings as they were in their original ones.
The study has important acknowledged limitations. The on-protocol analysis limited the authors to reporting associations rather than causality. Moreover, the original trial ran from 2011 to 2014, which was a time of rapid EMR implementation and new recognition of the problems posed by the same; several organizations are in a far more mature EMR context today. Conversely, newer technologies such as patient-facing medication reconciliation applications, cross-organization medication lists available from some EMR vendors, and health platforms that collect data from multiple EMRs were not evaluated because they did not exist at the time of the original trial. Another important trend in healthcare, the rise of Accountable Care Organizations and their focus on integration and defragmentation, may have an important part to play in medication list accuracy. All the above-mentioned aspects will be important avenues for ongoing research in real-world medication reconciliation.
Mixon’s findings come at a time when medication reconciliation is again a national health informatics priority, a key component of the Medicare Access and CHIP reauthorization Act of 2015 and Merit-based Incentive Payments System8 since 2019, with hospitals reporting medication reconciliation rates for financial in addition to quality and safety reasons. Hopefully, this study and others, in combination with the abovementioned incentives, will stimulate further research into impactful strategies for medication reconciliation and ideal ways to implement them. With luck, the end result will be more generalizable interventions, with a track record of success, that would help ensure that patients are prescribed, are reporting, are taking, and are noted to be taking the medications that they and their providers intended, both on presentation to the hospital and on discharge home.
Disclosures
Vicki Jue has no conflicts of interest to report. Raman Khanna reports developing CareWeb, a communication platform that has been licensed to Voalte, Inc. This work is unrelated to the current editorial. No other conflicts of interest to report.
1. Center for Drug Evaluation and Research. Medication Errors-Medication Error Reports. https://www.fda.gov/Drugs/DrugSafety/MedicationErrors/ucm080629.htm.Accessed June 14, 2019.
2. Cornish PL, Knowles SR, Marchesano R, et al. Unintended medication discrepancies at the time of hospital admission. Arch Intern Med. 2005;165(4):424-429. https://doi.org/ 10.1001/archinte.165.4.424.
3. Mekonnen AB, McLachlan AJ, Brien JE. Pharmacy-led medication reconciliation programmes at hospital transitions: a systematic review and meta-analysis. J Clin Pharm Ther. 2016;41(2):128-144. https://doi.org/ 10.1111/jcpt.12364.
4. Kilcup M, Schultz D, Carlson J, et al. Postdischarge pharmacist medication reconciliation: impact on readmission rates and financial savings. J Am Pharm Assoc. 2013;53(1):78-84. https://doi.org/ 10.1331/JAPhA.2013.11250.
5. Cater SW, Luzum M, Serra AE, et al. A prospective cohort study of medication reconciliation using pharmacy technicians in the emergency department to reduce medication errors among patients. J Emerg Med. 2015;48(2):230-238. https://doi.org/ 10.1016/j.jemermed.2014.09.065.
6. Horton TJ, Illingworth JH, Warburton WHP. Overcoming challenges in codifying and replicating complex health care interventions. Health Aff. 2018;37(2):191-197. https://doi.org/ 10.1377/hlthaff.2017.1161.
7. Mixon A, Kripalani S, Stein J, et al. An on-treatment analysis of the MARQUIS study: interventions to improve inpatient medication reconciliation. J Hosp Med. 2019;(10):614-617. https://doi.org/ 10.12788/jhm.3258
8. Centers for Medicare & Medicaid Services. https://www.cms.gov/Medicare/Quality-Initiatives-Patient-Assessment-Instruments/Value-Based-Programs/MACRA-MIPS-and-APMs/MACRA-MIPS-and-APMs.html.Accessed June 25, 2019.
© 2019 Society of Hospital Medicine
Inpatient Language Barriers: An Old Problem in Need of Novel Solutions
The 25 million people in the United States with limited English proficiency (LEP), which is defined as speaking English less than “very well”, are at increased risk for healthcare disparities that result in preventable harm and poor patient experiences compared with English-proficient patients.1,2 The use of trained professional interpreters is associated with improved communication, healthcare outcomes, safety, and experiences for LEP patients.3 However, underuse of professional interpreters remains common.4 Healthcare staff frequently use family members, friends, or minor children as interpreters or try to “get by” with the patient’s limited English skills or staff’s limited non-English skills.5 These practices regularly compromise patient safety and quality for LEP patients and their families.
In the article “Inpatient Communication Barriers and Drivers when Caring for Limited English Proficiency Children,” Dr. Choe and colleagues approach the problem of interpreter underuse by studying the barriers and facilitators that exist at their children’s hospital.6 The group conducted four sessions using Group Level Assessment, a structured, interactive approach to understanding a problem and identifying potential solutions. Sixty-four pediatric hospitalists and residents, bedside nurses, and staff interpreters participated. Participants identified four primary barriers to communicating effectively with LEP families: difficulty accessing interpreter services, uncertainty in communicating with LEP families, unclear roles and expectations of different team members, and unmet expectations related to family engagement. They also identified four drivers of effective communication: collaborative problem-solving between providers and interpreters, greater attention to cultural context, practicing empathy for patients and families, and using family centered communication strategies.
This study reinforces that myriad challenges remain in accessing and using an interpreter. The barriers identified fall into two major categories: systems for accessing interpretation and communication involving an interpreter. Both ultimately must be addressed to achieve equitable communication for LEP patients/families. As interpreter use is contingent upon access, optimizing delivery systems is an essential foundation. At this study site, key barriers were the opaque scheduling processes and inconsistent access to and unfamiliarity with interpreter-related technology (eg, for telephone or video interpretation). These barriers are likely generalizable to many other hospitals. Priority should be given to developing transparent, consistent, and reliable processes for interpreter access. Interventions to improve interpreter access, such as one-touch interpreter telephones at every hospital bedside, have been more successful in improving interpreter use than provider education or regulatory mandates.4
The challenges identified around communicating with LEP families via interpreter are also likely generalizable. In the current study, participants described a clear tension around the interpreters’ optimal role, in which the care team might want the interpreter to intervene or participate in the discussion more, while interpreter standards require that they remain a neutral conduit for information. This neutral-party approach, when taken to the extreme, can limit the bidirectional communication between clinical teams and interpreters necessary to address communication challenges. Fostering collaborative problem-solving between interpreters and clinicians, in both formal and informal settings, is critically needed to improve the quality of communication during encounters. In addition to the proposed presession meeting between the clinician and interpreter, incorporating a debriefing after an interpreter-mediated encounter could offer an opportunity for bidirectional feedback. Unfortunately, interpreter scheduling constraints, fueled by the lack of reimbursement for interpretation in most states, frequently limit the feasibility of such proposals.
Participating providers also reported decreased engagement with LEP families and that they spent less time with them. These observations also merit attention if we are to achieve equitable outcomes for LEP patients. A conversation via interpreter requires more time for the same content, given the time needed to interpret the message. The fact that participants reported spending less time with LEP families means that less communication occurs with those families, compared with others. There are well-established links between good communication and improved clinical outcomes, including everything from decreased glycosylated hemoglobin levels to lower inpatient narcotic use.7 Thus, it is not surprising that patients with fewer opportunities to communicate fully have worse clinical outcomes.8 Addressing this will require changing hospital culture and provider expectations. Healthcare systems could support this effort with interventions such as decreased nursing assignments, longer allocated rounding times, longer outpatient clinic visits, and additional “points” in resident patient caps, if they exist, for LEP patients. Such steps would be an important investment in improving outcomes and decreasing costs for these vulnerable patients.
For all the barriers identified by Choe and colleagues, solutions are needed. Some may be generalizable, some may be location-specific, and most will be somewhere in between, requiring context-specific tailoring. We recommend a quality improvement (QI) approach, as the evidence-based best practice for communicating with LEP patients and families is well-known, but the gap is in delivering care that meets that standard. Leveraging the growing QI expertise at many institutions to devise approaches that go beyond provider education to change the systems and culture around communicating with LEP patients holds our best promise for improving the safety and effectiveness of care for this population.
Disclosures
The authors have no financial relationships relevant to this article to disclose nor do they have any conflicts of interest relevant to this article to disclose.
Funding
Dr. Lion’s time was supported by the Eunice Kennedy Shriver National Institute of Child Health and Human Development, grant K23 HD078507 (PI Lion).
1. Divi C, Koss RG, Schmaltz SP, Loeb JM. Language proficiency and adverse events in US hospitals: A pilot study. Int J Qual Heal Care. 2007;19(2):60-67. https://doi.org/10.1093/intqhc/mzl069.
2. Yeheskel A, Rawal S. Exploring the “patient experience” of individuals with limited English proficiency: A scoping review. J Immigr Minor Heal. 2018. https://doi.org/10.1007/s10903-018-0816-4.
3. Karliner LS, Jacobs EA, Chen AH, Mutha S. Do professional interpreters improve clinical care for patients with limited English proficiency? A systematic review of the literature. Heal Serv Res. 2007;42(2):727-754. https://doi.org/10.1111/j.1475-6773.2006.00629.x.
4. Taira BR, Kim K, Mody N. Hospital and health system-level interventions to improve care for limited English proficiency patients: A systematic review. Jt Comm J Qual Patient Saf. 2019. https://doi.org/10.1016/j.jcjq.2019.02.005.
5. Diamond LC, Schenker Y, Curry L, Bradley EH, Fernandez A. Getting by: Underuse of interpreters by resident physicians. J Gen Intern Med. 2009;24(2):256-262. https://doi.org/10.1007/s11606-008-0875-7.
6. Choe A, Unaka N, Schondelmeyer A, Raglin Bignall W, Vilvens H, Thomson J. Inpatient communication barriers and drivers when caring for limited English proficiency children. J Hosp Med. 2019;14(10):607-613. https://doi.org/10.12788/jhm.3240.
7. Stewart MA. Effective physician-patient communication and health outcomes: A review. CMAJ. 1995;152(9):1423-1433. PubMed
8. Pérez-Stable EJ, El-Toukhy S. Communicating with diverse patients: How patient and clinician factors affect disparities. Patient Educ Couns. 2018;101(12):2186-2194. https://doi.org/10.1016/j.pec.2018.08.021.
The 25 million people in the United States with limited English proficiency (LEP), which is defined as speaking English less than “very well”, are at increased risk for healthcare disparities that result in preventable harm and poor patient experiences compared with English-proficient patients.1,2 The use of trained professional interpreters is associated with improved communication, healthcare outcomes, safety, and experiences for LEP patients.3 However, underuse of professional interpreters remains common.4 Healthcare staff frequently use family members, friends, or minor children as interpreters or try to “get by” with the patient’s limited English skills or staff’s limited non-English skills.5 These practices regularly compromise patient safety and quality for LEP patients and their families.
In the article “Inpatient Communication Barriers and Drivers when Caring for Limited English Proficiency Children,” Dr. Choe and colleagues approach the problem of interpreter underuse by studying the barriers and facilitators that exist at their children’s hospital.6 The group conducted four sessions using Group Level Assessment, a structured, interactive approach to understanding a problem and identifying potential solutions. Sixty-four pediatric hospitalists and residents, bedside nurses, and staff interpreters participated. Participants identified four primary barriers to communicating effectively with LEP families: difficulty accessing interpreter services, uncertainty in communicating with LEP families, unclear roles and expectations of different team members, and unmet expectations related to family engagement. They also identified four drivers of effective communication: collaborative problem-solving between providers and interpreters, greater attention to cultural context, practicing empathy for patients and families, and using family centered communication strategies.
This study reinforces that myriad challenges remain in accessing and using an interpreter. The barriers identified fall into two major categories: systems for accessing interpretation and communication involving an interpreter. Both ultimately must be addressed to achieve equitable communication for LEP patients/families. As interpreter use is contingent upon access, optimizing delivery systems is an essential foundation. At this study site, key barriers were the opaque scheduling processes and inconsistent access to and unfamiliarity with interpreter-related technology (eg, for telephone or video interpretation). These barriers are likely generalizable to many other hospitals. Priority should be given to developing transparent, consistent, and reliable processes for interpreter access. Interventions to improve interpreter access, such as one-touch interpreter telephones at every hospital bedside, have been more successful in improving interpreter use than provider education or regulatory mandates.4
The challenges identified around communicating with LEP families via interpreter are also likely generalizable. In the current study, participants described a clear tension around the interpreters’ optimal role, in which the care team might want the interpreter to intervene or participate in the discussion more, while interpreter standards require that they remain a neutral conduit for information. This neutral-party approach, when taken to the extreme, can limit the bidirectional communication between clinical teams and interpreters necessary to address communication challenges. Fostering collaborative problem-solving between interpreters and clinicians, in both formal and informal settings, is critically needed to improve the quality of communication during encounters. In addition to the proposed presession meeting between the clinician and interpreter, incorporating a debriefing after an interpreter-mediated encounter could offer an opportunity for bidirectional feedback. Unfortunately, interpreter scheduling constraints, fueled by the lack of reimbursement for interpretation in most states, frequently limit the feasibility of such proposals.
Participating providers also reported decreased engagement with LEP families and that they spent less time with them. These observations also merit attention if we are to achieve equitable outcomes for LEP patients. A conversation via interpreter requires more time for the same content, given the time needed to interpret the message. The fact that participants reported spending less time with LEP families means that less communication occurs with those families, compared with others. There are well-established links between good communication and improved clinical outcomes, including everything from decreased glycosylated hemoglobin levels to lower inpatient narcotic use.7 Thus, it is not surprising that patients with fewer opportunities to communicate fully have worse clinical outcomes.8 Addressing this will require changing hospital culture and provider expectations. Healthcare systems could support this effort with interventions such as decreased nursing assignments, longer allocated rounding times, longer outpatient clinic visits, and additional “points” in resident patient caps, if they exist, for LEP patients. Such steps would be an important investment in improving outcomes and decreasing costs for these vulnerable patients.
For all the barriers identified by Choe and colleagues, solutions are needed. Some may be generalizable, some may be location-specific, and most will be somewhere in between, requiring context-specific tailoring. We recommend a quality improvement (QI) approach, as the evidence-based best practice for communicating with LEP patients and families is well-known, but the gap is in delivering care that meets that standard. Leveraging the growing QI expertise at many institutions to devise approaches that go beyond provider education to change the systems and culture around communicating with LEP patients holds our best promise for improving the safety and effectiveness of care for this population.
Disclosures
The authors have no financial relationships relevant to this article to disclose nor do they have any conflicts of interest relevant to this article to disclose.
Funding
Dr. Lion’s time was supported by the Eunice Kennedy Shriver National Institute of Child Health and Human Development, grant K23 HD078507 (PI Lion).
1. Divi C, Koss RG, Schmaltz SP, Loeb JM. Language proficiency and adverse events in US hospitals: A pilot study. Int J Qual Heal Care. 2007;19(2):60-67. https://doi.org/10.1093/intqhc/mzl069.
2. Yeheskel A, Rawal S. Exploring the “patient experience” of individuals with limited English proficiency: A scoping review. J Immigr Minor Heal. 2018. https://doi.org/10.1007/s10903-018-0816-4.
3. Karliner LS, Jacobs EA, Chen AH, Mutha S. Do professional interpreters improve clinical care for patients with limited English proficiency? A systematic review of the literature. Heal Serv Res. 2007;42(2):727-754. https://doi.org/10.1111/j.1475-6773.2006.00629.x.
4. Taira BR, Kim K, Mody N. Hospital and health system-level interventions to improve care for limited English proficiency patients: A systematic review. Jt Comm J Qual Patient Saf. 2019. https://doi.org/10.1016/j.jcjq.2019.02.005.
5. Diamond LC, Schenker Y, Curry L, Bradley EH, Fernandez A. Getting by: Underuse of interpreters by resident physicians. J Gen Intern Med. 2009;24(2):256-262. https://doi.org/10.1007/s11606-008-0875-7.
6. Choe A, Unaka N, Schondelmeyer A, Raglin Bignall W, Vilvens H, Thomson J. Inpatient communication barriers and drivers when caring for limited English proficiency children. J Hosp Med. 2019;14(10):607-613. https://doi.org/10.12788/jhm.3240.
7. Stewart MA. Effective physician-patient communication and health outcomes: A review. CMAJ. 1995;152(9):1423-1433. PubMed
8. Pérez-Stable EJ, El-Toukhy S. Communicating with diverse patients: How patient and clinician factors affect disparities. Patient Educ Couns. 2018;101(12):2186-2194. https://doi.org/10.1016/j.pec.2018.08.021.
© 2019 Society of Hospital Medicine
Thinking Aloud: How Nurses Rationalize Responses to Monitor Alarms
In the past five years, it has become increasingly apparent that hospital physiologic monitoring systems are not functioning optimally for children. On pediatric wards, 26%-48% of children are continuously monitored, and these children generate between 42 and 155 alarms per day.1 Just 1% or fewer are considered actionable or informative, slowing nurses’ response times and placing patients at risk of delayed recognition of life-threatening events.2,3 While some factors associated with alarm response times have been elucidated,3 in order to design safe and effective monitoring systems, further work is needed to understand the complex decision-making process that nurses face when encountering alarms outside a patient’s room. It is in this area that Schondelmeyer and colleagues strive to enhance our understanding in this issue of the Journal of Hospital Medicine.4
Schondelmeyer et al. conducted a single-center, observational study using mixed methods in a general pediatric unit. Trained observers shadowed nine nurses one to four times each, during which nurses were asked to “think aloud” as they managed physiologic monitor alarms, rationalizing their decisions about how and why they might respond for the observer to document. Observers accumulated 61 patient-hours of observation before investigators halted data collection because new insights about alarm responses were no longer emerging from the data (thematic saturation).
Nurses thought aloud about 207 alarms during the study, which the investigators estimated comprised about one third of the alarms that occurred during observation periods. Most of the 207 occurred while the nurse was already in the patient’s room, where a response decision is uncomplicated. More interesting were the 45 alarms heard while outside the patient’s room, where nurses face the complex decision of whether to interrupt their current tasks and respond or delay their response and assume the associated risk of nonresponse to a potentially deteriorating patient. Of the 45 alarms, nurses went into the room to evaluate the patient 15 times and, after doing so, reported that five of the 15 warranted in-person responses to address technical issues with the monitor, clinical issues, or patients’ comfort. Reassuring clinical contexts—such as presence of the medical team or family in the room and recent patient assessments—were the reasons most commonly provided to explain alarm nonresponse.
This study has two key limitations. First, the authors designed the study to observe nurses’ responses until thematic saturation was achieved. However, the small sample size (nine nurses, 45 out-of-room alarms) could raise questions about whether sufficient data were captured to make broadly generalizable conclusions, given the diverse range of patients, families, and clinical scenarios nurses encounter on an inpatient unit. Second, by instructing nurse participants to verbalize their rationale for response or nonresponse, investigators essentially asked nurses to override the “Type 1”, heuristic-based reasoning5 that research suggests regulates nursing responses to alarms when adapting to circumstances requiring high cognitive demand or a heavy workload.3 While innovative, it is possible that this approach prevented the investigators from fully achieving their stated objective of describing how bedside nurses think about and act upon alarms.
Nonetheless, the findings by Schondelmeyer and colleagues extend our emerging understanding of why alarm responses are disconcertingly slow. Nursing staff’s dismissal of monitor alarms that are discordant with a reassuring patient evaluation underscores the imperative to reduce nuisance alarms. Furthermore, the explicit statements justifying alarm nonresponse because of the presence of family members build upon prior findings of longer response times when family members are at the bedside3 and invite a provocative question: how would family members feel if they knew that they were being entrusted as a foundational component of safety monitoring in the hospital? In their recently published study conducted at the same hospital,6 Schondelmeyer’s team elicited perceptions that families are deeply concerned about staff nonresponse to alarms—as one nurse stated, parents “wonder what’s going on when no one comes in.” While there is a valuable role for integrating families into efforts to overcome threats to patient safety, as has been achieved with family error reporting7 and communication on family-centered rounds,8 this must occur in a structured, explicit, and deliberate manner, with families engaged as key stakeholders.
In summary, while Schondelmeyer and colleagues may not have exposed the depth of implicit thinking that governs nurses’ responses to alarms, they have highlighted the high-stakes decisions that nurses confront on a daily basis in an environment with exceedingly high alarm rates and low alarm actionability. The authors cite staff education among potential solutions to improve the safety of continuous monitoring, but such an intervention cannot be effective in a system that places impossible burdens on nurses. An openly family centered and multidisciplinary approach to reengineering the system for monitoring hospitalized children is needed to enable nurses to respond quickly and accurately to patients at risk of clinical deterioration.
Disclosures
The authors report no conflicts of interest.
1. Schondelmeyer AC, Brady PW, Goel VV, et al. Physiologic monitor alarm rates at 5 children’s hospitals. J Hosp Med. 2018;13(6):396-398. https://doi.org/10.12788/jhm.2918.
2. Bonafide CP, Lin R, Zander M, et al. Association between exposure to nonactionable physiologic monitor alarms and response time in a children’s hospital. J Hosp Med. 2015;10(6):345-351. https://doi.org/10.1002/jhm.2331.
3. Bonafide CP, Localio AR, Holmes JH, et al. Video analysis of factors associated with response time to physiologic monitor alarms in a children’s hospital. JAMA Pediatr. 2017;171(6):524-531. https://doi.org/10.1001/jamapediatrics.2016.5123.
4. Schondelmeyer A, Daraiseh NM, Allison B, et al. Nurse responses to physiologic monitor alarms on a general pediatric unit. J Hosp Med. 2019;14(10):602-606. https://doi.org/10.12788/jhm.3234.
5. Croskerry P. A universal model of diagnostic reasoning. Acad Med. 2009;84(8):1022-1028. https://doi.org/10.1097/ACM.0b013e3181ace703.
6. Schondelmeyer AC, Jenkins AM, Allison B, et al. Factors influencing use of continuous physiologic monitors for hospitalized pediatric patients. Hosp Pediatr. 2019;9(6):423-428. https://doi.org/10.1542/hpeds.2019-0007.
7. Khan A, Coffey M, Litterer KP, et al. Families as partners in hospital error and adverse event surveillance. JAMA Pediatr. 2017;171(4):372-381. https://doi.org/10.1001/jamapediatrics.2016.4812.
8. Khan A, Spector ND, Baird JD, et al. Patient safety after implementation of a coproduced family centered communication programme: multicenter before and after intervention study. BMJ. 2018;363:k4764. https://doi.org/10.1136/bmj.k4764.
In the past five years, it has become increasingly apparent that hospital physiologic monitoring systems are not functioning optimally for children. On pediatric wards, 26%-48% of children are continuously monitored, and these children generate between 42 and 155 alarms per day.1 Just 1% or fewer are considered actionable or informative, slowing nurses’ response times and placing patients at risk of delayed recognition of life-threatening events.2,3 While some factors associated with alarm response times have been elucidated,3 in order to design safe and effective monitoring systems, further work is needed to understand the complex decision-making process that nurses face when encountering alarms outside a patient’s room. It is in this area that Schondelmeyer and colleagues strive to enhance our understanding in this issue of the Journal of Hospital Medicine.4
Schondelmeyer et al. conducted a single-center, observational study using mixed methods in a general pediatric unit. Trained observers shadowed nine nurses one to four times each, during which nurses were asked to “think aloud” as they managed physiologic monitor alarms, rationalizing their decisions about how and why they might respond for the observer to document. Observers accumulated 61 patient-hours of observation before investigators halted data collection because new insights about alarm responses were no longer emerging from the data (thematic saturation).
Nurses thought aloud about 207 alarms during the study, which the investigators estimated comprised about one third of the alarms that occurred during observation periods. Most of the 207 occurred while the nurse was already in the patient’s room, where a response decision is uncomplicated. More interesting were the 45 alarms heard while outside the patient’s room, where nurses face the complex decision of whether to interrupt their current tasks and respond or delay their response and assume the associated risk of nonresponse to a potentially deteriorating patient. Of the 45 alarms, nurses went into the room to evaluate the patient 15 times and, after doing so, reported that five of the 15 warranted in-person responses to address technical issues with the monitor, clinical issues, or patients’ comfort. Reassuring clinical contexts—such as presence of the medical team or family in the room and recent patient assessments—were the reasons most commonly provided to explain alarm nonresponse.
This study has two key limitations. First, the authors designed the study to observe nurses’ responses until thematic saturation was achieved. However, the small sample size (nine nurses, 45 out-of-room alarms) could raise questions about whether sufficient data were captured to make broadly generalizable conclusions, given the diverse range of patients, families, and clinical scenarios nurses encounter on an inpatient unit. Second, by instructing nurse participants to verbalize their rationale for response or nonresponse, investigators essentially asked nurses to override the “Type 1”, heuristic-based reasoning5 that research suggests regulates nursing responses to alarms when adapting to circumstances requiring high cognitive demand or a heavy workload.3 While innovative, it is possible that this approach prevented the investigators from fully achieving their stated objective of describing how bedside nurses think about and act upon alarms.
Nonetheless, the findings by Schondelmeyer and colleagues extend our emerging understanding of why alarm responses are disconcertingly slow. Nursing staff’s dismissal of monitor alarms that are discordant with a reassuring patient evaluation underscores the imperative to reduce nuisance alarms. Furthermore, the explicit statements justifying alarm nonresponse because of the presence of family members build upon prior findings of longer response times when family members are at the bedside3 and invite a provocative question: how would family members feel if they knew that they were being entrusted as a foundational component of safety monitoring in the hospital? In their recently published study conducted at the same hospital,6 Schondelmeyer’s team elicited perceptions that families are deeply concerned about staff nonresponse to alarms—as one nurse stated, parents “wonder what’s going on when no one comes in.” While there is a valuable role for integrating families into efforts to overcome threats to patient safety, as has been achieved with family error reporting7 and communication on family-centered rounds,8 this must occur in a structured, explicit, and deliberate manner, with families engaged as key stakeholders.
In summary, while Schondelmeyer and colleagues may not have exposed the depth of implicit thinking that governs nurses’ responses to alarms, they have highlighted the high-stakes decisions that nurses confront on a daily basis in an environment with exceedingly high alarm rates and low alarm actionability. The authors cite staff education among potential solutions to improve the safety of continuous monitoring, but such an intervention cannot be effective in a system that places impossible burdens on nurses. An openly family centered and multidisciplinary approach to reengineering the system for monitoring hospitalized children is needed to enable nurses to respond quickly and accurately to patients at risk of clinical deterioration.
Disclosures
The authors report no conflicts of interest.
1. Schondelmeyer AC, Brady PW, Goel VV, et al. Physiologic monitor alarm rates at 5 children’s hospitals. J Hosp Med. 2018;13(6):396-398. https://doi.org/10.12788/jhm.2918.
2. Bonafide CP, Lin R, Zander M, et al. Association between exposure to nonactionable physiologic monitor alarms and response time in a children’s hospital. J Hosp Med. 2015;10(6):345-351. https://doi.org/10.1002/jhm.2331.
3. Bonafide CP, Localio AR, Holmes JH, et al. Video analysis of factors associated with response time to physiologic monitor alarms in a children’s hospital. JAMA Pediatr. 2017;171(6):524-531. https://doi.org/10.1001/jamapediatrics.2016.5123.
4. Schondelmeyer A, Daraiseh NM, Allison B, et al. Nurse responses to physiologic monitor alarms on a general pediatric unit. J Hosp Med. 2019;14(10):602-606. https://doi.org/10.12788/jhm.3234.
5. Croskerry P. A universal model of diagnostic reasoning. Acad Med. 2009;84(8):1022-1028. https://doi.org/10.1097/ACM.0b013e3181ace703.
6. Schondelmeyer AC, Jenkins AM, Allison B, et al. Factors influencing use of continuous physiologic monitors for hospitalized pediatric patients. Hosp Pediatr. 2019;9(6):423-428. https://doi.org/10.1542/hpeds.2019-0007.
7. Khan A, Coffey M, Litterer KP, et al. Families as partners in hospital error and adverse event surveillance. JAMA Pediatr. 2017;171(4):372-381. https://doi.org/10.1001/jamapediatrics.2016.4812.
8. Khan A, Spector ND, Baird JD, et al. Patient safety after implementation of a coproduced family centered communication programme: multicenter before and after intervention study. BMJ. 2018;363:k4764. https://doi.org/10.1136/bmj.k4764.
© 2019 Society of Hospital Medicine
Collective Action and Effective Dialogue to Address Gender Bias in Medicine
In 2016, Pediatric Hospital Medicine (PHM) was recognized as a subspecialty under the American Board of Pediatrics (ABP), one of 24 certifying boards of the American Board of Medical Specialties. As with all new ABP subspecialty certification processes, a “practice pathway” with specific eligibility criteria allows individuals with expertise and sufficient practice experience within the discipline to take the certification examination. For PHM, certification via the practice pathway is permissible for the 2019, 2021, and 2023 certifying examinations.1 In this perspective, we provide an illustration of ABP leadership and the PHM community partnering to mitigate unintentional gender bias that surfaced after the practice pathway eligibility criteria were implemented. We also provide recommendations to revise these criteria to eliminate future gender bias and promote equity in medicine.
In July 2019, individuals within the PHM community began to share stories of being denied eligibility to sit for the 2019 exam.2 Some of the reported denials were due to an eligibility criterion related to “practice interruptions”, which stated that practice interruptions cannot exceed three months in the preceding four years or six months in the preceding five years. Notably, some women reported that their applications were denied because of practice interruptions due to maternity leave. These stories raised significant concerns of gender bias in the board certification process and sparked collective action to revise the board certification eligibility criteria. A petition was circulated within the PHM community and received 1,479 signatures in two weeks.
Given the magnitude of concern, leaders within the PHM community, with support from the American Academy of Pediatrics, collaboratively engaged with the ABP and members of the ABP PHM subboard to improve the transparency and equity of the eligibility process. As a result of this activism and effective dialogue, the ABP revised the PHM board certification eligibility criteria and removed the practice interruption criterion.1 Through this unique experience of advocacy and partner
Gender bias is defined as the unfair difference in the way men and women are treated.3 Maternal bias is further characterized as bias experienced by mothers related to motherhood, often involving discrimination based on pregnancy, maternity leave, or breastfeeding. Both are common in medicine. Two-thirds of physician mothers report experiencing gender bias and more than a third experience maternal bias.4 This bias may be explicit, or intentional, but often the bias is unintentional. This bias can occur even with equal representation of women and men on committees determining eligibility, and even when the committee believes it is not biased.5 Furthermore, gender or maternal bias negatively affects individuals in medicine in regards to future employment, career advancement, and compensation.6-11
Given these implications, we celebrate the removal of the practice interruptions criterion as it was unintentionally biased against women. Eligibility criteria that considered practice interruptions would have disproportionately affected women due to leaves related to pregnancy and due to discrepancies in the length of parental leave for mothers versus fathers. Though the ABP’s initial review of cases of denial did not demonstrate a significant difference in the proportion of men and women who were denied, these data may be misleading. Potential reasons why the ABP did not find significant differences in denial rates between women and men include: (1) some women who had recent maternity leaves chose not to apply because of concerns they may be denied; or (2) some women did not disclose maternity leaves on their application because they did not interpret maternity leave to be a practice interruption. This “self-censoring” may have resulted in incomplete data, making it difficult to fully understand the differential impact of this criterion on women versus men. Therefore, it is essential that we as a profession continue to identify any areas where gender bias exists in determining eligibility for certification, employment, or career advancement within medicine and eliminate it.
Despite the improvements made in the revised criteria, further revision is necessary to remove the criterion related to the “start date”, which will differentially affect women. This criterion states that an individual must have started their PHM practice on or before July of the first year of a four-year look-back period (eg, July 2015 for the 2019 cycle). We present three theoretical cases to illustrate gender bias with respect to this criterion (Table). Even though Applicants #2 and #3 accrue far more than the minimum number of hours in their first year—and more hours overall than Applicant #1—both of these women will remain ineligible under the revised criteria. While Applicant #2 could be eligible for the 2021 or 2023 cycle, Applicant #3, who is new to PHM practice in 2019 as a residency graduate, will not be eligible at all under the practice pathway due to delayed graduation from residency.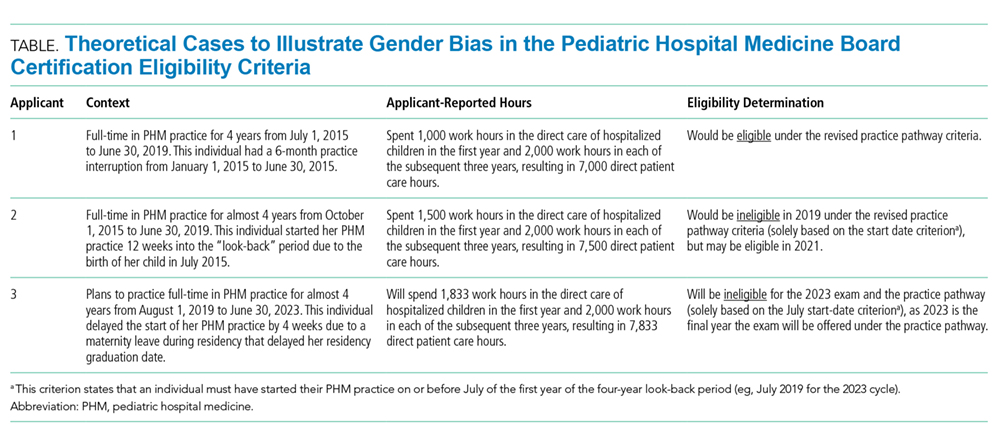
Parental leave during residency following birth of a child may result in the need to make up the time missed.12 This means that more women than men will experience delayed entry into the workforce due to late graduation from residency.13 Women who experience a gap in employment at the start of their PHM practice due to pregnancy or childbirth will also be differentially affected by this criterion. If this same type of gap were to occur later in the year, it would no longer impact a woman’s eligibility under the revised criteria. Therefore, we implore the ABP to reevaluate this criterion which results in a hidden “practice interruption” penalty. Removing eligibility criteria related to practice interruptions, wherever they may occur, will not only eliminate systematic bias against women, but may also encourage men to take paternity leave, for which the benefits to both men and women are well described.14,15
We support the ABP’s mission to maintain the public’s trust by ensuring PHM board certification is an indicator that individuals have met a high standard. We acknowledge that the ABP and PHM subboard had to draw a line to create minimum standards. The start date and four-year look-back criteria were informed by prior certification processes, and the PHM community was given the opportunity to comment on these criteria prior to final ABP approval. However, now that we have become aware of how the start date criteria can differentially impact women and men, we must reevaluate this line to ensure that women and men are treated equally. Similar to the removal of the practice interruptions criterion, we do not believe that removal of the start date criterion will in any way compromise these standards. A four-year look-back period will still be in place and individuals will still be required to accrue the minimum number of hours in the first year and each subsequent year of the four-year period.
Despite any change in the criteria, there will be individuals who remain ineligible for PHM board certification. We will need to rely on institutions and the societies that lead PHM to remember that not all individuals had the opportunity to certify as a pediatric hospitalist, and for some, this was due to maternity leave. No woman should have to worry about her future employment when considering motherhood.
We hope the lessons learned from this experience will be informative for other specialties considering a new certification. Committees designing new criteria should have proportional representation of women and men, inclusion of underrepresented minorities, and members with a range of ages, orientations, identities, and abilities. Criteria should be closely scrutinized to evaluate if a single group of people is more likely to be excluded. All application reviewers should undergo training in identifying implicit bias.16 Once eligibility criteria are determined, they should be transparent to all applicants, consistently applied, and decisions to applicants should clearly state which criteria were or were not met. Regular audits should be conducted to identify any bias. Finally, transparent and respectful dialogue between the certifying board and the physician community is paramount to ensuring continuous quality improvement in the process.
The PHM experience with this new board certification process highlights the positive impact that the PHM community had engaging with the ABP leadership, who listened to the concerns and revised the eligibility criteria. We are optimistic that this productive relationship will continue to eliminate any gender bias in the board certification process. In turn, PHM and the ABP can be leaders in ending gender inequity in medicine.
Disclosures
The authors have nothing to disclose.
1. Nichols DG, Woods SK. The American Board of Pediatrics response to the Pediatric Hospital Medicine petition. J Hosp Med. 2019;14(10):586-588. https://doi.org/10.12788/jhm.3322
2. Don’t make me choose between motherhood and my career. https://www.kevinmd.com/blog/2019/08/dont-make-me-choose-between-motherhood-and-my-career.html. Accessed September 16, 2019.
3. GENDER BIAS | definition in the Cambridge English Dictionary. April 2019. https://dictionary.cambridge.org/us/dictionary/english/gender-bias.
4. Adesoye T, Mangurian C, Choo EK, Girgis C, Sabry-Elnaggar H, Linos E. Perceived discrimination experienced by physician mothers and desired workplace changes: A cross-sectional survey. JAMA Intern Med. 2017;177(7):1033-1036. https://doi.org/10.1001/jamainternmed.2017.1394
5. Régner I, Thinus-Blanc C, Netter A, Schmader T, Huguet P. Committees with implicit biases promote fewer women when they do not believe gender bias exists. Nat Hum Behav. 2019. https://doi.org/10.1038/s41562-019-0686-3
6. Trix F, Psenka C. Exploring the color of glass: Letters of recommendation for female and male medical faculty. Discourse Soc. 2003;14(2):191-220. https://doi.org/10.1177/0957926503014002277
7. Correll SJ, Benard S, Paik I. Getting a job: Is there a motherhood penalty? Am J Sociol. 2007;112(5):1297-1339. https://doi.org/10.1086/511799
8. Aamc. Analysis in Brief - August 2009: Unconscious Bias in Faculty and Leadership Recruitment: A Literature Review; 2009. https://implicit.harvard.edu/. Accessed September 10, 2019.
9. Wright AL, Schwindt LA, Bassford TL, et al. Gender differences in academic advancement: patterns, causes, and potential solutions in one US College of Medicine. Acad Med. 2003;78(5):500-508. https://doi.org/10.1097/00001888-200305000-00015
10. Weaver AC, Wetterneck TB, Whelan CT, Hinami K. A matter of priorities? Exploring the persistent gender pay gap in hospital medicine. J Hosp Med. 2015;10(8):486-490. https://doi.org/10.1002/jhm.2400
11. Frintner MP, Sisk B, Byrne BJ, Freed GL, Starmer AJ, Olson LM. Gender differences in earnings of early- and midcareer pediatricians. Pediatrics. September 2019:e20183955. https://doi.org/10.1542/peds.2018-3955
12. Section on Medical Students, Residents and Fellowship Trainees, Committee on Early Childhood. Parental leave for residents and pediatric training programs. Pediatrics. 2013;131(2):387-390. https://doi.org/10.1542/peds.2012-3542
13. Jagsi R, Tarbell NJ, Weinstein DF. Becoming a doctor, starting a family — leaves of absence from graduate medical education. N Engl J Med. 2007;357(19):1889-1891. https://doi.org/10.1056/NEJMp078163
14. Nepomnyaschy L, Waldfogel J. Paternity leave and fathers’ involvement with their young children. Community Work Fam. 2007;10(4):427-453. https://doi.org/10.1080/13668800701575077
15. Andersen SH. Paternity leave and the motherhood penalty: New causal evidence. J Marriage Fam. 2018;80(5):1125-1143. https://doi.org/10.1111/jomf.12507.
16. Girod S, Fassiotto M, Grewal D, et al. Reducing Implicit Gender Leadership Bias in Academic Medicine With an Educational Intervention. Acad Med. 2016;91(8):1143-1150. https://doi.org/10.1097/ACM.0000000000001099
In 2016, Pediatric Hospital Medicine (PHM) was recognized as a subspecialty under the American Board of Pediatrics (ABP), one of 24 certifying boards of the American Board of Medical Specialties. As with all new ABP subspecialty certification processes, a “practice pathway” with specific eligibility criteria allows individuals with expertise and sufficient practice experience within the discipline to take the certification examination. For PHM, certification via the practice pathway is permissible for the 2019, 2021, and 2023 certifying examinations.1 In this perspective, we provide an illustration of ABP leadership and the PHM community partnering to mitigate unintentional gender bias that surfaced after the practice pathway eligibility criteria were implemented. We also provide recommendations to revise these criteria to eliminate future gender bias and promote equity in medicine.
In July 2019, individuals within the PHM community began to share stories of being denied eligibility to sit for the 2019 exam.2 Some of the reported denials were due to an eligibility criterion related to “practice interruptions”, which stated that practice interruptions cannot exceed three months in the preceding four years or six months in the preceding five years. Notably, some women reported that their applications were denied because of practice interruptions due to maternity leave. These stories raised significant concerns of gender bias in the board certification process and sparked collective action to revise the board certification eligibility criteria. A petition was circulated within the PHM community and received 1,479 signatures in two weeks.
Given the magnitude of concern, leaders within the PHM community, with support from the American Academy of Pediatrics, collaboratively engaged with the ABP and members of the ABP PHM subboard to improve the transparency and equity of the eligibility process. As a result of this activism and effective dialogue, the ABP revised the PHM board certification eligibility criteria and removed the practice interruption criterion.1 Through this unique experience of advocacy and partner
Gender bias is defined as the unfair difference in the way men and women are treated.3 Maternal bias is further characterized as bias experienced by mothers related to motherhood, often involving discrimination based on pregnancy, maternity leave, or breastfeeding. Both are common in medicine. Two-thirds of physician mothers report experiencing gender bias and more than a third experience maternal bias.4 This bias may be explicit, or intentional, but often the bias is unintentional. This bias can occur even with equal representation of women and men on committees determining eligibility, and even when the committee believes it is not biased.5 Furthermore, gender or maternal bias negatively affects individuals in medicine in regards to future employment, career advancement, and compensation.6-11
Given these implications, we celebrate the removal of the practice interruptions criterion as it was unintentionally biased against women. Eligibility criteria that considered practice interruptions would have disproportionately affected women due to leaves related to pregnancy and due to discrepancies in the length of parental leave for mothers versus fathers. Though the ABP’s initial review of cases of denial did not demonstrate a significant difference in the proportion of men and women who were denied, these data may be misleading. Potential reasons why the ABP did not find significant differences in denial rates between women and men include: (1) some women who had recent maternity leaves chose not to apply because of concerns they may be denied; or (2) some women did not disclose maternity leaves on their application because they did not interpret maternity leave to be a practice interruption. This “self-censoring” may have resulted in incomplete data, making it difficult to fully understand the differential impact of this criterion on women versus men. Therefore, it is essential that we as a profession continue to identify any areas where gender bias exists in determining eligibility for certification, employment, or career advancement within medicine and eliminate it.
Despite the improvements made in the revised criteria, further revision is necessary to remove the criterion related to the “start date”, which will differentially affect women. This criterion states that an individual must have started their PHM practice on or before July of the first year of a four-year look-back period (eg, July 2015 for the 2019 cycle). We present three theoretical cases to illustrate gender bias with respect to this criterion (Table). Even though Applicants #2 and #3 accrue far more than the minimum number of hours in their first year—and more hours overall than Applicant #1—both of these women will remain ineligible under the revised criteria. While Applicant #2 could be eligible for the 2021 or 2023 cycle, Applicant #3, who is new to PHM practice in 2019 as a residency graduate, will not be eligible at all under the practice pathway due to delayed graduation from residency.
Parental leave during residency following birth of a child may result in the need to make up the time missed.12 This means that more women than men will experience delayed entry into the workforce due to late graduation from residency.13 Women who experience a gap in employment at the start of their PHM practice due to pregnancy or childbirth will also be differentially affected by this criterion. If this same type of gap were to occur later in the year, it would no longer impact a woman’s eligibility under the revised criteria. Therefore, we implore the ABP to reevaluate this criterion which results in a hidden “practice interruption” penalty. Removing eligibility criteria related to practice interruptions, wherever they may occur, will not only eliminate systematic bias against women, but may also encourage men to take paternity leave, for which the benefits to both men and women are well described.14,15
We support the ABP’s mission to maintain the public’s trust by ensuring PHM board certification is an indicator that individuals have met a high standard. We acknowledge that the ABP and PHM subboard had to draw a line to create minimum standards. The start date and four-year look-back criteria were informed by prior certification processes, and the PHM community was given the opportunity to comment on these criteria prior to final ABP approval. However, now that we have become aware of how the start date criteria can differentially impact women and men, we must reevaluate this line to ensure that women and men are treated equally. Similar to the removal of the practice interruptions criterion, we do not believe that removal of the start date criterion will in any way compromise these standards. A four-year look-back period will still be in place and individuals will still be required to accrue the minimum number of hours in the first year and each subsequent year of the four-year period.
Despite any change in the criteria, there will be individuals who remain ineligible for PHM board certification. We will need to rely on institutions and the societies that lead PHM to remember that not all individuals had the opportunity to certify as a pediatric hospitalist, and for some, this was due to maternity leave. No woman should have to worry about her future employment when considering motherhood.
We hope the lessons learned from this experience will be informative for other specialties considering a new certification. Committees designing new criteria should have proportional representation of women and men, inclusion of underrepresented minorities, and members with a range of ages, orientations, identities, and abilities. Criteria should be closely scrutinized to evaluate if a single group of people is more likely to be excluded. All application reviewers should undergo training in identifying implicit bias.16 Once eligibility criteria are determined, they should be transparent to all applicants, consistently applied, and decisions to applicants should clearly state which criteria were or were not met. Regular audits should be conducted to identify any bias. Finally, transparent and respectful dialogue between the certifying board and the physician community is paramount to ensuring continuous quality improvement in the process.
The PHM experience with this new board certification process highlights the positive impact that the PHM community had engaging with the ABP leadership, who listened to the concerns and revised the eligibility criteria. We are optimistic that this productive relationship will continue to eliminate any gender bias in the board certification process. In turn, PHM and the ABP can be leaders in ending gender inequity in medicine.
Disclosures
The authors have nothing to disclose.
1. Nichols DG, Woods SK. The American Board of Pediatrics response to the Pediatric Hospital Medicine petition. J Hosp Med. 2019;14(10):586-588. https://doi.org/10.12788/jhm.3322
2. Don’t make me choose between motherhood and my career. https://www.kevinmd.com/blog/2019/08/dont-make-me-choose-between-motherhood-and-my-career.html. Accessed September 16, 2019.
3. GENDER BIAS | definition in the Cambridge English Dictionary. April 2019. https://dictionary.cambridge.org/us/dictionary/english/gender-bias.
4. Adesoye T, Mangurian C, Choo EK, Girgis C, Sabry-Elnaggar H, Linos E. Perceived discrimination experienced by physician mothers and desired workplace changes: A cross-sectional survey. JAMA Intern Med. 2017;177(7):1033-1036. https://doi.org/10.1001/jamainternmed.2017.1394
5. Régner I, Thinus-Blanc C, Netter A, Schmader T, Huguet P. Committees with implicit biases promote fewer women when they do not believe gender bias exists. Nat Hum Behav. 2019. https://doi.org/10.1038/s41562-019-0686-3
6. Trix F, Psenka C. Exploring the color of glass: Letters of recommendation for female and male medical faculty. Discourse Soc. 2003;14(2):191-220. https://doi.org/10.1177/0957926503014002277
7. Correll SJ, Benard S, Paik I. Getting a job: Is there a motherhood penalty? Am J Sociol. 2007;112(5):1297-1339. https://doi.org/10.1086/511799
8. Aamc. Analysis in Brief - August 2009: Unconscious Bias in Faculty and Leadership Recruitment: A Literature Review; 2009. https://implicit.harvard.edu/. Accessed September 10, 2019.
9. Wright AL, Schwindt LA, Bassford TL, et al. Gender differences in academic advancement: patterns, causes, and potential solutions in one US College of Medicine. Acad Med. 2003;78(5):500-508. https://doi.org/10.1097/00001888-200305000-00015
10. Weaver AC, Wetterneck TB, Whelan CT, Hinami K. A matter of priorities? Exploring the persistent gender pay gap in hospital medicine. J Hosp Med. 2015;10(8):486-490. https://doi.org/10.1002/jhm.2400
11. Frintner MP, Sisk B, Byrne BJ, Freed GL, Starmer AJ, Olson LM. Gender differences in earnings of early- and midcareer pediatricians. Pediatrics. September 2019:e20183955. https://doi.org/10.1542/peds.2018-3955
12. Section on Medical Students, Residents and Fellowship Trainees, Committee on Early Childhood. Parental leave for residents and pediatric training programs. Pediatrics. 2013;131(2):387-390. https://doi.org/10.1542/peds.2012-3542
13. Jagsi R, Tarbell NJ, Weinstein DF. Becoming a doctor, starting a family — leaves of absence from graduate medical education. N Engl J Med. 2007;357(19):1889-1891. https://doi.org/10.1056/NEJMp078163
14. Nepomnyaschy L, Waldfogel J. Paternity leave and fathers’ involvement with their young children. Community Work Fam. 2007;10(4):427-453. https://doi.org/10.1080/13668800701575077
15. Andersen SH. Paternity leave and the motherhood penalty: New causal evidence. J Marriage Fam. 2018;80(5):1125-1143. https://doi.org/10.1111/jomf.12507.
16. Girod S, Fassiotto M, Grewal D, et al. Reducing Implicit Gender Leadership Bias in Academic Medicine With an Educational Intervention. Acad Med. 2016;91(8):1143-1150. https://doi.org/10.1097/ACM.0000000000001099
© 2019 Society of Hospital Medicine