User login
Persistent posttraumatic headache risk factors confirmed
It also revealed a surprisingly high frequency of misdiagnosis. The original sample included 500 patients drawn from the Stanford Research Repository Cohort Discovery Tool, but a review found 200 records that were misdiagnosed and had to be excluded.
“It’s very easy to label someone who suffered a head injury and say this is the reason why they have this (headache),” said lead author Tommy Chan, MBBS, a headache fellow in the department of neurology at Stanford (Calif.) University, in an interview. Such patients are often seen by ED or primary care physicians who do not have a lot of experience with posttraumatic headache, and that can lead to negative consequences if a low-pressure headache is mistaken as stemming from a skull fracture. “It’s a very different treatment plan for one versus the other,” said Dr. Chan in an interview.
He noted that it can help to take a patient history that includes the preaccident headache frequency and determine if there was a change in frequency post injury.
Dr. Chan presented the results at the virtual annual meeting of the American Headache Society.
“The results are what one might expect, although we haven’t studied it enough to really know. We haven’t systematically characterized these risk factors for chronic posttraumatic headache very well, [so] it’s useful to have this information,” said Andrew Charles, MD, professor neurology at the University of California, Los Angeles, and director of the UCLA Goldberg Migraine Program, who was not involved in the study. However, Dr. Charles emphasized the need to confirm the results prospectively.
Defining risk factors
The analysis found that a history of migraines, medication overuse, psychological disorders, and new posttraumatic headache–associated comorbidities were all associated with a greater risk for persistent posttraumatic headache. None of those came as a surprise, “but we live in a world where medicine is practiced based on evidence, and providers want to see data to support that. I think that this will help with resource allocation. It’s important to address [a patient’s] overuse of medications, or if they’re having psychological symptoms,” said Dr. Chan.
A total of 150 patients in the analysis had acute posttraumatic headache (mean duration, 0.7 months) while 150 had persistent posttraumatic headache (mean duration, 24 months; P < .00001). Clinical factors associated with risk of persistent headache included a history migraine (relative risk, 2.4; P < .0001), a previous head injury (odds ratio, 5.8; P < .0001), medication overuse (RR, 2.6; P < .0001), preexisting psychological history (OR, 5; P < .0001), and new posttraumatic headache–associated comorbidities, such as vertigo or posttraumatic stress disorder (RR, 9.8; P < .0001).
Identifying patient subgroups
The researchers also identified four subcategories of patients with persistent posttraumatic headache, each with differing risk factors and clinical characteristics. It’s too soon to use these identifiers to make clinical recommendations, but Dr. Chan hopes that further study of these groups will be informative. “It might point us toward (the idea) that each patient population is actually different, even within the chronic persistent posttraumatic headache population, we can’t group them all under the same umbrella term. If we can tease out that a patient has truly had a head injury, but no history of migraine, no overuse of medication, no psychological history, and no other associated symptoms, this would be a very interesting population to study because they would help us understand the pathophysiology [of persistent posttraumatic headache].”
Although the study was conducted by defining persistent posttraumatic headache as lasting at least 3 months, Dr. Chan took issue with that commonly held definition. That choice is arbitrary, with no pathophysiological basis or data to support it, and is based more on clinical trials testing preventative treatments. But when it is used in clinical practice, it can muddy communication with patients. “When this timeline is told to a patient, and when it’s not achieved, they might become disappointed. We should not put too much emphasis on time. Everybody is different,” he said.
The study did not receive any funding. Dr. Chan had no relevant financial disclosures. Dr. Charles consults for consults for Amgen, BioHaven, Eli Lilly, Novartis, and Lundbeck.
FROM AHS 2020
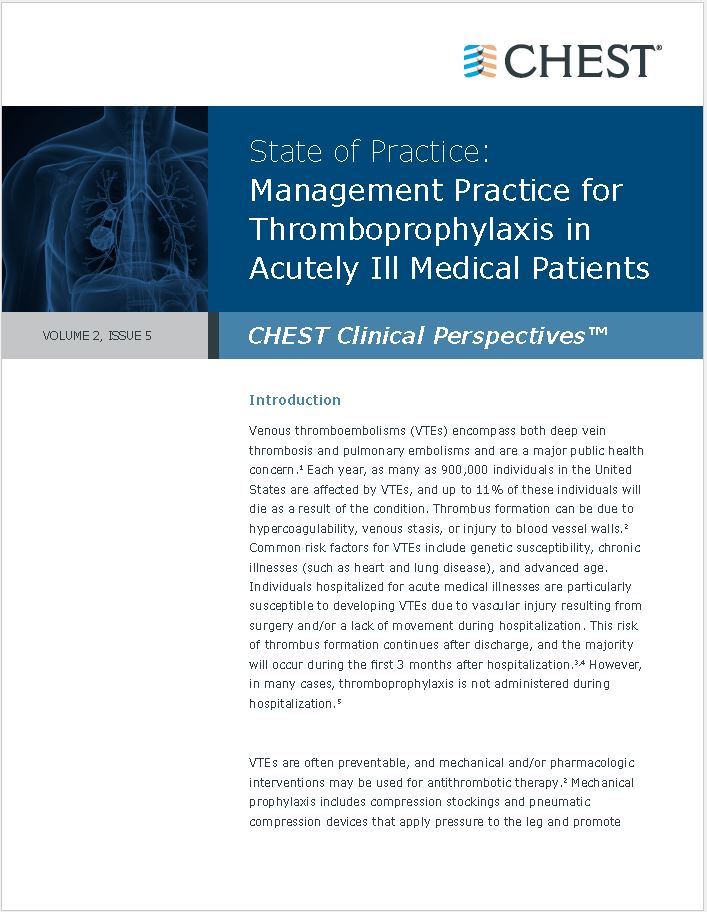
State of Practice: Management Practice for Thromboprophylaxis in Acutely Ill Medical Patients
In this issue of CHEST Clinical Perspectives, CHEST is undertaking primary research with pulmonologists and intensivists to understand their approach to ordering thromboprophylaxis in acutely ill medical patients for the purpose of reducing risk of VTE. Specifically, this issue focuses on the extent to which management practice has evolved given the introduction of novel anticoagulants. The objectives of this research are to:
- Understand current practice related to ordering thromboprophylaxis, as well as the therapies used with acutely ill medical patients.
- Understand the attitudes toward thromboprophylaxis from a risk and benefit standpoint that underlie decision-making related to deployment of therapy.
- Assess therapeutic, clinical, and administrative factors that impact management choices and the adoption of novel anticoagulants.
- Assess familiarity with and influence of the MAGELLAN study.
- Identify differences in management based on practice tenure and setting (academic vs community-based).
Preventive services coalition recommends routine anxiety screening for women
according to a new recommendation from the Women’s Preventive Services Initiative.
The lifetime prevalence of anxiety disorders in women in the United States is 40%, approximately twice that of men, and anxiety can be a manifestation of underlying issues including posttraumatic stress, sexual harassment, and assault, wrote Kimberly D. Gregory, MD, of Cedars-Sinai Medical Center, Los Angeles, and colleagues on behalf of the Women’s Preventive Services Initiative (WPSI), a national coalition of women’s health professional organizations and patient representatives.
“The WPSI based its rationale for anxiety screening on several considerations,” the researchers noted. “Anxiety disorders are the most prevalent mental health disorders in women, and the problems created by untreated anxiety can impair function in all areas of a woman’s life.”
“Effective screening may lead to earlier or timelier treatment (including behavioral and medical interventions) and result in improved clinical outcomes, such as symptoms, function, and quality of life. Screening may also lead to the detection of associated conditions, such as depression and posttraumatic stress disorder, which may also require treatment,” they wrote.
To support the recommendation, the researchers evaluated data from 33 studies and 2 systematic reviews for a total of 171 studies. Most studies included screening instruments that involved clinician- or patient-administered questionnaires designed for use in clinical practice. Although none of the studies evaluated the overall effectiveness versus harm of screening for anxiety, the strength of evidence for the effectiveness of anxiety treatment ranged from moderate to high, and the evidence of harms ranged from low for cognitive-behavioral therapy to moderate for anxiety medications.
“Overall, the WPSI determined that the balance of benefits and harms would likely be favorable on the basis of the high prevalence of anxiety in women; its substantial effect on health, function, and quality of life; and evidence on the accuracy of screening instruments in primary care settings and the effectiveness and harms of treatment,” the researchers wrote.
Although anxiety screening is not currently routine in clinical practice in the United States, such screening could be done quickly and efficiently as part of an intake visit in a primary care or obstetric setting, using a brief screening tool similar to those used for depression, the researchers wrote. The goal of anxiety screening, as with depression screening, is to identify those who need further evaluation to diagnose or rule out an anxiety disorder.
“A revised version [of the draft recommendation] was adopted by the Health Resources and Services Administration in December 2019; it will be incorporated into the summary of covered benefits for preventive services without cost sharing as required by the Patient Protection and Affordable Care Act immediately or no later than 1 January 2021, depending on individual coverage,” the researchers noted.
“Covered benefits apply to most group health plans and issuers of group and individual health insurance coverage, as well as to persons who qualify for Medicaid on the basis of Medicaid expansion under the Affordable Care Act,” they wrote.
“Because anxiety disorders can be successfully treated, early detection through the use of a brief questionnaire could prevent years of symptoms and impairment in the lives of women at every stage of life,” they concluded.
Aaron Sutton, LCSW, a behavioral health consultant at Abington (Pa.) Hospital–Jefferson Health, expressed support for the guidelines in an interview.
“With almost half of all women experiencing an anxiety disorder sometime in their life, effective recognition and treatment of anxiety disorders is needed,” he said.
Mr. Sutton described treatment as being “fairly benign” with the initial approach being cognitive-behavioral therapy, a form of psychological talk therapy, and first-line pharmacologic therapies being SSRIs and serotonin norepinephrine reuptake inhibitors.
Mr. Sutton also explained how he expects effective screening and treatment will benefit women with anxiety and the health care system.
“Women will see improvement in areas such as personal relationships, work, school, and social settings. The health care system will see benefits as costs related to anxiety disorders, be it direct or indirect, are in the billions of dollars,” he said.
Although screening for anxiety will increase the workload of primary care physicians, anxiety screening should be included and could perhaps be administered in conjunction with the routine depression screening already recommended as part of primary care visits, Mr. Sutton noted.
“Anxiety disorders can be successfully treated, and early detection can prevent years of symptoms and impairment,” he emphasized.
“Anxiety often occurs among adolescents and adult women and often becomes a chronic problem with impairments,” said Cynthia Pfeffer, MD, professor of psychiatry at Weill Cornell Medicine, New York, in an interview. “Screening for anxiety could identify and enable planning to decrease and prevent this impairing prevalent condition and its associated problems. For example, anxiety can impair adolescents’ academic and social functioning and if this is lasting also impair their success in work and future planning for families. There are successful treatments for anxiety and identification of individuals at an early time may prevent impairments in daily functioning.”
Dr. Pfeffer noted that steps to overcome barriers to prevention and treatment for anxiety include “educating health care professionals about the problems caused from anxiety, learning means to identify and diagnose anxiety, and developing proficiency in offering methods to prevent and intervene for women with symptoms of anxiety.”
The take-home message for clinicians is that anxiety is prevalent among females of all ages and often begins early and becomes chronic.
“There are excellent treatments including psychotherapy and medication that can decrease and prevent anxiety,” she emphasized. “Training practicing clinicians including MDs as well as other professionals in the health care system about anxiety will enhance the wellbeing of women.”
More research is needed to evaluate methods used during health care visits for anxiety screening and treatment in order to determine valid means of preventing the impairments associated with anxiety, Dr. Pfeffer said.
Mr. Sutton noted that no trials “have evaluated overall effectiveness or potential harms including labeling, misdiagnosis, and overdiagnosis.” Other areas in need of research include the changes in incidence and prevalence of anxiety over time, as well as specific risk factors including marriage, divorce, pregnancy, and childbirth, he added.
The research for the recommendation was supported by the Health Resources and Services Administration. The researchers had no financial conflicts to disclose. Mr. Sutton had no financial conflicts to disclose. Dr. Pfeffer has written extensively on depression and anxiety in children, adolescents, and adults. She had no financial conflicts to disclose.
SOURCE: Gregory KD et al. Ann Intern Med. 2020 June 9. doi: 10.7326/M20-0580.
FROM ANNALS OF INTERNAL MEDICINE
High-fat, high-sugar diet may promote adult acne
A diet higher in fat, sugar, and milk was associated with having acne in a cross-sectional study of approximately 24,000 adults in France.
Acne in adults has been associated with social, emotional, and psychological consequences similar to those found with chronic diseases such as asthma, arthritis, epilepsy, and diabetes, wrote Laetitia Penso, MSc, of the University of Paris in Bobigny, France, and colleagues.
Although acne patients may believe that eating certain foods exacerbates acne, data on the effects of nutrition on acne, including associations between acne and a high-glycemic diet, are limited and have produced conflicting results, they noted.
In their study, published in JAMA Dermatology, the researchers identified 24,452 adults who participated in the NutriNet-Santé study, an ongoing, web-based study in France. Approximately 75% of the participants were women, the average age was 57 years, and 46% reported past or current acne.
Participants responded to an 11-item questionnaire between November 2008 and July 2019. Questions were related to the occurrence and diagnosis of acne, as well as medical history. Based on their acne status, participants were identified as falling into the categories of never acne, past acne, or current acne, and their dietary intake was assessed at baseline and every 6 months using three nonconsecutive 24-hour dietary records for 2 weekdays and 1 weekend day.
In an analysis, after adjustment for confounders, current acne was significantly associated with consumption of fatty and sugary foods (per portion, adjusted odds ratio, 1.54; P = .01), as well as with consumption of sugary drinks (per glass, aOR, 1.18; P = .04) and milk (per glass, aOR, 1.12; P = .04). In addition, carbohydrate intake and saturated fatty acid intake were significantly associated with current acne (aOR, 1.43; P = .02; and aOR, 3.90; P = .048, respectively).
Three dietary patterns accounted for 42% of the total variability, the researchers said. A healthy pattern of higher fruit, vegetable, and fish intake accounted for 18%, a fatty and sugary pattern of higher fat and sugar intake (including chocolate) accounted for 13%, and an animal product and cereal pattern of higher intake of meat, milk, and refined cereals accounted for 11%, they explained.
“The results of our study appear to support the hypothesis that the Western diet (rich in animal products and fatty and sugary foods) is associated with the presence of acne in adulthood,” the researchers concluded. Possible explanations for the findings include the effects of a high glycemic-load diet on circulating IGF-1 and insulin, which ultimately increases both oxidative stress and inflammation that promotes the development of acne, they noted.
The study findings were limited by several factors including the use of relatively homogenous younger and female patient population and the reliance on self-reported acne, as well as the observational design, which did not allow for identification of direct, causal associations between diet and acne, the researchers noted. Larger studies are needed to examine the relationship between diet and adult acne to inform prevention and treatment, they wrote.
“Much of the previous literature on the role of diet in acne has focused on the association of milk consumption and high glycemic-load diet with acne,” John S. Barbieri, MD, of the department of dermatology at the University of Pennsylvania, Philadelphia, wrote in an accompanying editorial.
Dr. Barbieri acknowledged the inability to make causal associations given the study design and noted that dietary interventions should be implemented with caution because of the potential for other effects such as reduced calcium or vitamin D.
“Nevertheless, given the potential overall health benefits of a healthy or low glycemic-load diet, and 2 small trials supporting its effectiveness in acne, a low glycemic-load diet is a reasonable recommendation for patients looking for dietary modifications that may improve their acne,” he said.
Dr. Barbieri said that he was encouraged to see that the study findings reflected previous research identifying an association between acne and high-glycemic load foods, as well as milk consumption, but he emphasized that more research is needed before general recommendations about diet and acne can be made.
“Trials are needed to evaluate whether dietary interventions can improve or prevent acne and how the effect size of such interventions compares with other standard treatment modalities,” he emphasized.
The study received no outside funding. The researchers had no financial conflicts to disclose. Dr. Barbieri disclosed support from the National Institute of Arthritis and Musculoskeletal and Skin Diseases of the National Institutes of Health and from a Pfizer Fellowship grant to the Trustees of the University of Pennsylvania.
SOURCE: Penso L et al. JAMA Dermatol. 2020 June 10. doi: 10.1001/jamadermatol.2020.1602.
FROM JAMA DERMATOLOGY
Safe to skip radiotherapy with negative PET in Hodgkin lymphoma
and can skip the additional radiotherapy that is normally included in the combined modality treatment, say experts reporting the final results from an international phase 3 randomized trial dubbed HD17.
“Most patients with this disease will not need radiotherapy any longer,” concluded first author Peter Borchmann, MD, assistant medical director in the department of hematology/oncology at the University Hospital Cologne (Germany).
Dr. Borchmann was speaking online as part of the virtual edition of the European Hematology Association 25th Annual Congress 2020.
“Importantly, the mortality of patients with early-stage unfavorable Hodgkin lymphoma in the HD17 study did not differ from the normal healthy German population, and this is the first time we have had this finding in one of our studies,” he emphasized.
Dr. Borchmann added that positron emission tomography imaging is key in deciding which patients can skip radiation.
“We conclude from the HD17 trial that the combined modality concept can and should be replaced by a PET-guided omission of radiotherapy for patients with newly diagnosed early-stage unfavorable Hodgkin lymphoma,” he said.
“The vast majority of early-stage unfavorable Hodgkin lymphoma patients can be treated with the brief and highly effective 2+2 chemotherapy alone,” he added.
Therefore, he continued, “PET-guided 2+2 chemotherapy is the new standard of care for the German Hodgkin study group,” which conducted the trial.
The use of both chemotherapy and radiation has long been a standard approach to treatment, and this combined modality treatment is highly effective, Dr. Borchmann explained. But it can cause long-term damage, and the known longer-term negative effects of radiotherapy, such as cardiovascular disease and second malignancies, are a particular concern because patients with early-stage Hodgkin lymphoma are relatively young, with a median age of around 30 years at disease onset.
An expert approached for comment said that the momentum to skip radiotherapy when possible is an ongoing issue, and importantly, this study adds to those efforts.
“The treatment of Hodgkin lymphoma has moved for many years now to less radiation therapy, and this trend will continue with the results of this study,” commented John G. Gribben, MD, director of the Stem Cell Transplantation Program and medical director of the North East London Cancer Research Network Centre at Barts Cancer Center of Excellence and the London School of Medicine.
“We have moved to lower doses and involved fields with the intent of decreasing toxicity, and particularly long-term toxicity from radiotherapy,” he said in an interview.
HD17 study details
For the multicenter, phase 3 HD17 trial, Dr. Borchmann and colleagues turned to PET to identify patients who had and had not responded well to chemotherapy (PET negative and PET positive) and to determine if those who had responded well could safely avoid radiotherapy without compromising efficacy.
“We wanted to determine if we could reduce the treatment intensity by omission of radiotherapy in patients who respond very well to the systemic treatment, so who have a complete metabolic remission after the chemotherapy,” Dr. Borchmann said.
The 2+2 treatment approach includes two cycles of eBEACOPP (bleomycin, etoposide, doxorubicin, cyclophosphamide, vincristine, procarbazine, and prednisone) and two subsequent cycles of ABVD (doxorubicin, bleomycin, vinblastine, and dacarbazine).
The trial enrolled 1,100 patients with newly diagnosed Hodgkin lymphoma between January 2012 and March 2017. Of these, 979 patients had confirmed PET results, with 651 (66.5%) found to be PET negative, defined as having a Deauville score (DS) of less than 3 (DS3); 238 (24.3%) were DS3, and 90 (9.2%) were DS4.
The study met its primary endpoint of noninferiority in progression-free survival (PFS) at 5 years, with a PFS of 95.1% in the PET-guided group (n = 447), compared with 97.3% in the standard combined-modality treatment group (n = 428), over a median observation time of 45 months, for a difference of 2.2% (P = .12).
“We found that the survival levels were very high, and we can safely conclude the noninferiority of the PET-guided approach in PET-negative patients,” Dr. Borchmann said.
A further analysis showed that the 597 PET-negative patients who did not receive radiotherapy because of their PET status had 5-year PFS that was noninferior to the combined modality group (95.9% vs. 97.7%, respectively; P = .20).
And among 646 patients who received the 2+2 regimen plus radiotherapy, of those confirmed as PET positive (n = 328), the estimated 5-year PFS was significantly lower (94.2%), compared with those determined to be PET negative (n = 318; 97.6%; hazard ratio, 3.03).
A cut-off of DS4 for positivity was associated with a stronger effect, with a lower estimated 5-year PFS of 81.6% vs. 98.8% for DS3 patients and 97.6% for DS less than 3 (P < .0001).
“Only DS4 has a prognostic impact, but not DS3,” Dr. Borchmann said. “DS4 positivity indicates a relevant risk for treatment failure, however, there are few patients in this risk group (9.2% in this trial).”
The 5-year overall survival rates in an intent-to-treat analysis were 98.8% in the standard combined modality group and 98.4% in the PET-guided group.
With a median observation time of 47 months, there have been 10 fatal events in the trial out of 1,100 patients, including two Hodgkin lymphoma-related events and one treatment-related death.
“Overall, Hodgkin lymphoma or treatment-related mortality rates were extremely low,” Dr. Borchmann said.
The study was funded by Deutsche Krebshilfe. Dr. Borchmann and Dr. Gribben have reported no relevant financial relationships.
A version of this article originally appeared on Medscape.com.
A Fiery Pivot
A 62-year-old man with metastatic non–small cell lung cancer (NSCLC) presented to the Emergency Department with 3 days of progressive generalized weakness, anorexia, and nonbloody diarrhea. He denied fever, chills, nausea, vomiting, cough, shortness of breath, or abdominal pain. He had no sick contacts.
One diagnostic approach for patients with cancer who present with new symptoms is to consider diagnoses both related and unrelated to the cancer. Cancer-related diagnoses can include the broad categories of complications related to the tumor itself (such as mass effect), paraneoplastic phenomena, or treatment-related complications (such as infection from immunosuppression or chemotherapy toxicity).
For this patient with metastatic NSCLC, weakness, anorexia, and diarrhea are unlikely to be related to mass effect unless the patient has peritoneal metastases (an uncommon complication of NSCLC) with carcinomatosis-associated diarrhea.
Paraneoplastic phenomena, such as hypercalcemia or hyponatremia from the syndrome of inappropriate antidiuretic hormone (SIADH), are common with NSCLC and could both lead to weakness and anorexia. Hematologic consequences of NSCLC (or its treatment) include anemia, thrombosis, and thrombotic microangiopathy (TMA), though diarrhea, in the absence of abdominal pain or hematochezia, would be unexpected.
Weakness, anorexia, and diarrhea may also be symptoms of chemotherapy toxicity or an infection resulting from immunosuppression. It would be important to know what specific treatment the patient has received. Chemotherapy commonly causes neutropenia and predisposes to rapidly progressive infections, while immunotherapies have other toxicities. Diarrhea is a common toxicity of the checkpoint inhibitors and anaplastic lymphoma kinase (ALK) inhibitors that are frequently used to treat metastatic NSCLC. Checkpoint inhibitors also are known to cause a wide range of autoimmune phenomena including colitis.
Finally, the patient’s symptoms may be unrelated to the cancer. Weakness, anorexia, and nonbloody diarrhea could be signs of viral or bacterial gastroenteritis or Clostridioides difficile colitis particularly with frequent healthcare contact or antimicrobial use.
Two days prior, he had been diagnosed with nonsevere Clostridioides difficile colitis in an acute care clinic. He was started on oral metronidazole, but his diarrhea worsened over the next day and was accompanied by weakness and anorexia. Additional past medical history included untreated hepatitis C infection, chronic kidney disease stage 3, seizure disorder, and left lung NSCLC (adenocarcinoma). The lung cancer was diagnosed 8 months prior when he had presented with hemoptysis and 3 months of progressive constitutional symptoms. Imaging at that time revealed metastases to the contralateral lung and regional lymph nodes, as well as vertebrae, ribs, and pelvis. He had no abdominal metastases. He was initially treated with carboplatin and paclitaxel. After a partial response to initial chemotherapy, he developed peripheral neuropathy and was switched to gemcitabine 12 weeks ago. He received five cycles of gemcitabine over 10 weeks. He was last administered gemcitabine 2 weeks prior. He had not received any additional chemotherapy or immunotherapy. He had a 40 pack-year history of smoking, but quit when diagnosed with cancer. He did not drink alcohol. He had no recent travel or sick contacts. He was not on any medications. He was homeless but staying with family members in the area. Additional review of systems was negative for recent bleeding, bruising, hemoptysis, melena, hematochezia, or hematuria.
Recent treatment with gemcitabine could contribute to the presentation in a number of ways. First, gemcitabine is associated with myelosuppression and neutropenia that could predispose him to infectious colitis. Second, gemcitabine is known to cause anemia, anorexia, diarrhea, and fatigue. Third, gemcitabine may also cause renal injury that can contribute to worsening anemia. He may be at greater risk of anemia and renal toxicity because of preexisting chronic kidney disease. Finally, gemcitabine can rarely cause TMA with characteristics that mimic the hemolytic-uremic syndrome with microangiopathic hemolytic anemia, mild thrombocytopenia, and severe acute kidney injury (AKI).

In addition, worsening infectious colitis could certainly explain his presenting symptoms. At this point, local mass effect seems unlikely despite his metastatic disease. Lastly, it should be noted that, in an immunosuppressed cancer patient, multiple problems could be present at the same time. Laboratory testing should evaluate for hypercalcemia, SIADH, hematologic indexes, and renal function. If initial laboratory evaluation is unrevealing, abdominal imaging may be needed to assess for carcinomatosis, complications from colitis, typhlitis, abscess, or perforation.

On physical examination, the patient appeared fatigued. His temperature was 36.8°C, blood pressure 158/72 mm Hg, pulse 88 beats per minute, respiratory rate 16 breaths per minute, and oxygen saturation was 96% while breathing ambient air. There was neither scleral icterus nor conjunctival injection but he had mild conjunctival pallor. Cardiovascular and lung examinations were normal. Abdominal exam revealed normal bowel sounds without tenderness or organomegaly. He had no supraclavicular, axillary, or inguinal lymphadenopathy. He was alert and oriented. Cranial nerves II through XII were intact. He had decreased muscle bulk in his extremities without focal weakness. Gait and reflexes were not tested.
Initial laboratory testing revealed a white blood cell count of 5.5 K/mm3, hemoglobin of 5 g/dL (hemoglobin 1 month prior was 10.1 g/dL), and platelet count of 20 K/mm3 (platelet count 1 month prior was 246 K/mm3). Creatinine was 3.9 mg/dL (compared with a baseline of 1.8 mg/dL), and blood urea nitrogen was 39 mg/dL. His sodium was 137 mEq/L, potassium 4.2 mEq/L, chloride 105 mEq/L, bicarbonate 22 mEq/L, and thyroid stimulating hormone 0.9 mU/L. His total protein was 4.9 g/dL, albumin 2.1 g/dL, alkaline phosphatase 60 IU/L, alanine aminotransferase 17 IU/L, aspartate aminotransferase 60 IU/L, direct bilirubin 0.2 mg/dL, and total bilirubin 0.5 mg/dL. A chest x-ray showed no infiltrates.
The patient’s laboratory tests reveal several important new findings, including severe acute on chronic anemia, acute thrombocytopenia, and AKI, without clinical evidence of acute blood loss. These changes could be parts of a syndrome or multiple independent disorders. The most urgent priority is to evaluate for TMAs, many of which are fatal if not diagnosed and treated expeditiously. This includes thrombotic thrombocytopenic purpura (TTP), disseminated intravascular hemolysis (DIC), and atypical hemolytic uremic syndrome (aHUS). A manual review of a peripheral blood smear is required to evaluate for fragmented red blood cells (schistocytes). Thereafter, ancillary testing to confirm intravascular hemolysis would include measuring free plasma hemoglobin and lactate dehydrogenase (LDH). Additionally, in intravascular hemolysis, haptoglobin should be depleted and urinalysis should show heme-positive urine without RBCs. In this case the patient’s normal bilirubin studies argue against hemolysis; however, elevated bilirubin is variably present in hemolytic anemias depending on the liver’s ability to conjugate and excrete bilirubin, the relative degree of RBC turnover, and type of hemolysis. Patients with intravascular hemolysis lose hemoglobin directly into the urine leaving relatively little hemoglobin to be incorporated into bile once it has reached the reticuloendothelial system. This results in relatively normal bilirubin levels. More specific indicators of intravascular hemolysis include pink colored plasma on visual inspection (commonly done in the blood bank as part of assessing for hemolytic transfusion reactions), measuring plasma free hemoglobin, or by detecting hemoglobin in the urine.
If microangiopathic hemolytic anemia (MAHA) is excluded, then other causes of these laboratory abnormalities should be considered. Bleeding is the most common cause for anemia, and thrombocytopenia predisposes patients to bleeding. However, there is no evidence of bleeding in this patient, and such a rapid acute anemia is unlikely to be caused by occult blood loss alone. Concurrent anemia and thrombocytopenia could be evidence of bone marrow toxicity from chemotherapy or neoplastic infiltration. With marrow infiltration, there are typically signs on the peripheral smear of leukoerythroblastosis, with circulating nucleated red blood cells and early myeloid forms. Concurrent immune thrombocytopenia (ITP) and autoimmune hemolytic anemia (AIHA), or Evans’ Syndrome, should also be considered. AIHA would be suggested by spherocytes on the peripheral smear, elevated LDH and a positive direct antibody test (DAT).

Regarding the AKI, the patient has diarrhea, which could lead to prerenal azotemia and acute tubular necrosis. A formal urinalysis would evaluate for prerenal and intrinsic kidney disease. TMA can cause intrinsic kidney injury with a benign urinary sediment. The blood urea nitrogen-to-creatinine ratio is not elevated, but in a patient with malnutrition this may not indicate prerenal azotemia. In summary, to differentiate potential TMAs from other causes, the patient needs a blood smear, coagulation studies, and an evaluation for hemolysis, including a urinalysis for free heme and any evidence of intrinsic kidney disease.
Urinalysis showed amber-colored, dilute urine with no white blood cells, red blood cells, protein, or casts. It was positive for blood and negative for bilirubin and hemosiderin. LDH was 1,382 IU/L (reference range 135-225 IU/L), and haptoglobin was unmeasurably low. His ferritin was 2,267 ng/mL, serum iron was 57 mcg/dL, total iron-binding capacity was 241 mcg/dL, and transferrin was 162 mcg/dL. Reticulocyte count was 6% (reticulocyte index of 0.86). Vitamin B12 level was normal. DAT was negative; INR and aPTT were normal. Fibrinogen was 287 mg/dL (reference range 200-400 mg/dL), and D-dimer was 5,095 ng/mL (reference range 0-229 ng/mL).
The urinalysis shows no active sediment to suggest vasculitis or glomerulonephritis. The kidney injury could be the result of renal toxicity from free hemoglobin or as part of TMA caused by microvascular thrombosis. The dilute urine makes prerenal azotemia less likely.
There is clearly acute intravascular hemolysis occurring as evidenced by hemoglobinuria, very high LDH, and undetectable serum haptoglobin. The hemolysis is acute because chronic intravascular hemolysis would lead to positive urine hemosiderin via deposition in the renal tubules. Autoimmune hemolytic anemia is much less likely, but not ruled out, by a negative DAT.
This syndrome can be further refined from acute anemia to acute anemia with likely nonimmune intravascular hemolysis, acute thrombocytopenia, and AKI with hemoglobinuria and a bland urinary sediment. At this point, intravascular hemolysis and kidney injury could be part of a unifying diagnosis. However, this does not account for the patient’s thrombocytopenia, and TMA remains the best explanation for the constellation of findings. Review of the peripheral blood smear is urgent because evidence of MAHA would prompt urgent plasma exchange based on presumptive diagnosis of acquired TTP to later be confirmed with ADAMTS13 activity testing. Most TMAs are treated with supportive care only; TTP and aHUS have specific interventions that change the natural history of the disease (plasma exchange and anticomplement therapy, respectively). Given both the deadly natural history and opportunity to intervene with plasma exchange, patients with TMA should be treated with urgent plasma exchange until ADAMTS13 deficiency is confirmed or refuted. One TMA that can be excluded at this point is DIC. DIC in its acute and chronic forms nearly universally causes MAHA, thrombocytopenia, and consumptive coagulopathy including hypofibrinogenemia.
If MAHA is excluded, then other causes of intravascular hemolysis should be considered, along with causes of thrombocytopenia that might be occurring concurrently. Intravascular hemolysis can be further differentiated by etiologies primarily related to the RBC or whether the RBC is the innocent bystander amidst a systemic illness. RBC disorders include syndromes affecting RBC fragility like hereditary spherocytosis or RBC enzymopathies (G6PD deficiency), but these do not cause thrombocytopenia. One exception is an acquired membrane defect, paroxysmal nocturnal hemoglobinuria (PNH), in which RBCs and other blood cells become susceptible to complement-mediated lysis. Testing for PNH by peripheral blood flow cytometry should be considered if the blood film lacks schistocytes. Systemic disorders that cause intravascular hemolysis include severe burns (heat damage to RBCs), RBC trauma from “march hemoglobinuria” or mechanical heart valves, immune (antibody-mediated) hemolysis from Rh immune globulin administration, cold agglutinin disease or ABO mismatched transfusion, and infections including the intraerythrocyte parasites malaria, Bartonellosis, and Babesiosis, as well as organisms that induce RBC fragility such as Leishmaniasis, Clostridium perfringens, and Haemophilus influenzae B.
On review of additional history, the patient had not recently received blood products. He had received heparin during prior hospitalizations, but had no prior history of thrombosis. He had no history of tick exposure. Peripheral blood smear was obtained and reviewed by a
The blood smear helps narrow the differential further. The lack of schistocytes makes TMA far less likely and so plasma exchange is not urgently indicated. The differential still includes drug-induced TMA (gemcitabine being a well-known cause for TMA) and cancer-associated TMA could still cause these findings, but plasma exchange does not improve outcomes. Acquired (immune) TTP is very unlikely unless the patient did not improve with supportive care or developed neurologic symptoms. Similarly, atypical (complement-driven) HUS would only be considered if renal failure did not improve with supportive care.
The blood smear does show a surprising finding of pyropoikilocytosis. Pyropoikilocytosis refers to changes in RBC shape (poikilocytosis) typically seen with thermal injury or rare RBC membrane structural defects. Hereditary pyropoikilocytosis, a very rare disease, is characterized by chronic hyperproliferative, compensated anemia, and occasional hemolytic crises. These crises are associated with splenomegaly, reticulocytosis, and elevated bilirubin with jaundice. As the patient has no history of similar episodes, the blood smear changes are not due to a hereditary cause and obviously not due to thermal injury (ie, severe burns). Pyropoikilocytosis has been rarely reported in drug-induced TMA and in severe bacterial bloodstream infections (most commonly Gram-negative bacilli). This patient has received gemcitabine (a known cause of drug-induced TMA) and has a recently diagnosed infection (C difficile colitis), either of which could be linked to this rare blood smear finding. Both of these syndromes would be treated with supportive care plus avoidance of future gemcitabine.
Transfusion of packed RBCs is indicated given his profound anemia and symptoms of fatigue. One should obtain further testing for cold agglutinins, PNH, and echocardiography to exclude endocarditis. If he were to become critically ill, anuric, or encephalopathic, then one could consider plasma exchange for treatment of TMA and hemoglobin-mediated AKI. Pyropoikilocytosis should be considered the result of drug-induced TMA, severe C difficile colitis, or an occult infection.
The patient was transfused packed RBCs. Because of a concern for an acute TMA such as TTP, both a hematopathologist and the consulting hematology/oncology team reviewed the peripheral blood morphology emergently. He was given aggressive fluid resuscitation and received 3 L of IV lactated ringers’ solution. An echocardiogram did not show valvular abnormalities. A renal biopsy was contraindicated because of the severe thrombocytopenia.
Given the recently confirmed C difficile colitis along with the findings of pyropoikilocytosis on the peripheral smear, toxin-mediated intravascular hemolysis from systemic C difficile infection became the leading diagnosis. Positing that the C difficile colitis was inadequately treated with oral metronidazole, aggressive treatment for C difficile was initiated with oral vancomycin in addition to intravenous metronidazole. Intravenous metronidazole was included given his elevated creatinine, presence of severe colitis on imaging, and concern he may be at risk for translocation of colonic C difficile or exotoxin into the bloodstream.
Over the course of the next 3 days, the patient’s platelet count normalized and his hemoglobin, creatinine, and symptoms of fatigue improved. Blood cultures remained negative. The patient’s rapid improvement with antibiotics supported our final diagnosis of toxin-mediated hemolysis caused by a systemic C difficile infection. On follow-up testing after hospital discharge, hemoglobin had returned to prior baseline and there was no recurrent hemolysis. Gemcitabine was considered to be a possible cause of his hemolytic anemia and was not continued in further treatment for his NSCLC.
COMMENTARY
When evaluating patients with cancer who present with fatigue, hospitalists should consider a broad list of potential causes. The differential should include etiologies directly related to the malignancy, paraneoplastic phenomena, treatment-related complications, and diseases unrelated to cancer. In addition, as the number of medications used for cancer proliferates, hospitalists must take a detailed history of the agents used and be aware of major side effects. Using this information, hospitalists may undertake a targeted approach to diagnostics while searching for a cause of fatigue.
When lab testing reveals profound anemia, hospitalists must consider syndromes that may require emergent management. Anemia can be caused by decreased RBC production, and acute anemia in the absence of clear blood loss suggests hemolysis. Moreover, the combination of elevated LDH and low haptoglobin is quite specific of hemolytic anemia.1,2 Once hemolytic anemia is identified, DIC and TMA syndromes (such as TTP) need to be considered. The combination of hemolytic anemia and AKI may indicate a medical emergency and should prompt hospitalists to obtain an urgent peripheral blood smear to help narrow the differential.3
The absence of schistocytes on a blood smear does not rule out TTP or HUS, but does argue strongly against these diagnoses.4,5 Of note, consultation with a hematopathologist and hematology subspecialist should be done to ensure appropriate and timely review of the peripheral blood smear.
In this case, the blood smear led to a very rare finding of pyropoikilocytosis. The unexpected result should prompt a broader review of the medical history particularly as it relates to the patient’s broader symptoms and laboratory abnormalities. Acquired pyropoikilocytosis is a very specific finding known to be associated only with hyperthermal injury (seen in burn patients), drug-induced TMA, and bacterial bloodstream infections, mainly Gram-negative toxins and Clostridioidal infections.6-8 In this case, both drug-induced TMA and C difficile infection were considered.
Gemcitabine-induced TMA can occur with either short or long term use of the medication and can be difficult to distinguish from TTP. While both TTP and gemcitabine-induced TMA can cause thrombocytopenia, hemolytic anemia, and schistocytes on a blood smear, the latter causes acute kidney injury more frequently than TTP. In addition, gemcitabine-induced TMA may not lead to severe decrease in ADAMTS13 activity. A kidney biopsy could confirm drug-induced TMA but was contraindicated in this case because of the thrombocytopenia. Gemcitabine should not be restarted if this side effect is suspected.
Given the continued rise in C difficile incidence, hospitalists should be aware that C difficile infection can cause extraintestinal illness.9,10 Although uncommon, these extraintestinal complications are associated with high risk of mortality and frequently occur in those with a history of intestinal injury or inflammation and a concomitant bloodstream infection.10 Regarding the possibility of C difficile contributing to hemolysis in this case, the patient’s low blood counts and hemolysis improved concomitantly with more aggressive treatment of C difficile infection. Although his blood cultures were sterile, C difficile is notoriously difficult to culture. Prior case reports have associated C difficile with intravascular hemolysis, which leads to the possibility that the patient did have a very rare manifestation of this unfortunately common infection.11
This case provides an excellent example of a diagnostic pivot point
KEY TEACHING POINTS
- In evaluating symptomatic cancer patients, providers must consider sequelae of the tumor, paraneoplastic phenomena, and treatment-related complications.
- Hemolytic anemia may represent a life-threatening emergency particularly when accompanied by AKI and requires urgent peripheral blood smear evaluation.
- Acquired pyropoikilocytosis is a specific finding known to be associated only with thermal injury, drug-induced TMA, and bacterial toxin–mediated hemolysis.
Disclosures
The authors have nothing to disclose.
1. Weinzierl EP, Arber DA. The differential diagnosis and bone marrow evaluation of new-onset pancytopenia. Am J Clin Pathol. 2013:139(1):9-29. https://doi.org/10.1309/AJCP50AEEYGREWUZ.
2. Marchand A, Galen RS, Van Lente F. The predictive value of serum haptoglobin in hemolytic disease. JAMA.1980;243(19):1909-1911. https://doi:10.1001/jama.1980.03300450023014.
3. Dhaliwal G, Cornett PA, Tierney LM Jr. Hemolytic anemia. Am Fam Physician. 2004;69(11):2599-2606.
4. Joly BS, Coppo P, Veyradier A. Thrombotic thrombocytopenic purpura. Blood. 2017;129(21):2836-2846. https://doi.org/10.1182/blood-2016-10-709857.
5. Jokiranta TS. HUS and atypical HUS. Blood. 2017;129(21):2847-2856. https://doi.org/10.1182/blood-2016-11-709865.
6. Baar S, Arrowsmith DJ. Thermal damage to red cells. J Clin Path. 1970;23(7):572-576. https://doi.org/10.1136/jcp.23.7.572.
7. Meinders AJ, Dijkstra I. Massive hemolysis and erythrophagocytosis in severe sepsis. Blood. 2014;124(6):841. https://doi.org/10.1182/blood-2014-04-565663.
8. McIlwaine K, Leach MT. Clostridium perfringens septicaemia. Br J Haematol. 2013;163(5):549. https://doi.org/10.1111/bjh.12551.
9. Evans CT, Safdar N. Current trends in the epidemiology and outcomes of Clostridium difficile infection. Clin Infect Dis. 2015;60 (Supp 2):S66-71. https://doi.org/10.1093/cid/civ140.
10. Gupta A, Patel R, Baddour LM, Pardi DS, Khanna S. Extraintestinal Clostridium difficile infections: a single-center experience. Mayo Clin Proc. 2014;89(11):1525-36. https://doi.org/10.1016/j.mayocp.2014.07.012.
11. Alvarado AS, Brodsky SV, Nadasdy T, Singh N. Hemolytic uremic syndrome associated with Clostridium difficile infection. Clin Nephrol. 2014;81(4):302-6. https://doi.org/10.5414/CN107691.
A 62-year-old man with metastatic non–small cell lung cancer (NSCLC) presented to the Emergency Department with 3 days of progressive generalized weakness, anorexia, and nonbloody diarrhea. He denied fever, chills, nausea, vomiting, cough, shortness of breath, or abdominal pain. He had no sick contacts.
One diagnostic approach for patients with cancer who present with new symptoms is to consider diagnoses both related and unrelated to the cancer. Cancer-related diagnoses can include the broad categories of complications related to the tumor itself (such as mass effect), paraneoplastic phenomena, or treatment-related complications (such as infection from immunosuppression or chemotherapy toxicity).
For this patient with metastatic NSCLC, weakness, anorexia, and diarrhea are unlikely to be related to mass effect unless the patient has peritoneal metastases (an uncommon complication of NSCLC) with carcinomatosis-associated diarrhea.
Paraneoplastic phenomena, such as hypercalcemia or hyponatremia from the syndrome of inappropriate antidiuretic hormone (SIADH), are common with NSCLC and could both lead to weakness and anorexia. Hematologic consequences of NSCLC (or its treatment) include anemia, thrombosis, and thrombotic microangiopathy (TMA), though diarrhea, in the absence of abdominal pain or hematochezia, would be unexpected.
Weakness, anorexia, and diarrhea may also be symptoms of chemotherapy toxicity or an infection resulting from immunosuppression. It would be important to know what specific treatment the patient has received. Chemotherapy commonly causes neutropenia and predisposes to rapidly progressive infections, while immunotherapies have other toxicities. Diarrhea is a common toxicity of the checkpoint inhibitors and anaplastic lymphoma kinase (ALK) inhibitors that are frequently used to treat metastatic NSCLC. Checkpoint inhibitors also are known to cause a wide range of autoimmune phenomena including colitis.
Finally, the patient’s symptoms may be unrelated to the cancer. Weakness, anorexia, and nonbloody diarrhea could be signs of viral or bacterial gastroenteritis or Clostridioides difficile colitis particularly with frequent healthcare contact or antimicrobial use.
Two days prior, he had been diagnosed with nonsevere Clostridioides difficile colitis in an acute care clinic. He was started on oral metronidazole, but his diarrhea worsened over the next day and was accompanied by weakness and anorexia. Additional past medical history included untreated hepatitis C infection, chronic kidney disease stage 3, seizure disorder, and left lung NSCLC (adenocarcinoma). The lung cancer was diagnosed 8 months prior when he had presented with hemoptysis and 3 months of progressive constitutional symptoms. Imaging at that time revealed metastases to the contralateral lung and regional lymph nodes, as well as vertebrae, ribs, and pelvis. He had no abdominal metastases. He was initially treated with carboplatin and paclitaxel. After a partial response to initial chemotherapy, he developed peripheral neuropathy and was switched to gemcitabine 12 weeks ago. He received five cycles of gemcitabine over 10 weeks. He was last administered gemcitabine 2 weeks prior. He had not received any additional chemotherapy or immunotherapy. He had a 40 pack-year history of smoking, but quit when diagnosed with cancer. He did not drink alcohol. He had no recent travel or sick contacts. He was not on any medications. He was homeless but staying with family members in the area. Additional review of systems was negative for recent bleeding, bruising, hemoptysis, melena, hematochezia, or hematuria.
Recent treatment with gemcitabine could contribute to the presentation in a number of ways. First, gemcitabine is associated with myelosuppression and neutropenia that could predispose him to infectious colitis. Second, gemcitabine is known to cause anemia, anorexia, diarrhea, and fatigue. Third, gemcitabine may also cause renal injury that can contribute to worsening anemia. He may be at greater risk of anemia and renal toxicity because of preexisting chronic kidney disease. Finally, gemcitabine can rarely cause TMA with characteristics that mimic the hemolytic-uremic syndrome with microangiopathic hemolytic anemia, mild thrombocytopenia, and severe acute kidney injury (AKI).
In addition, worsening infectious colitis could certainly explain his presenting symptoms. At this point, local mass effect seems unlikely despite his metastatic disease. Lastly, it should be noted that, in an immunosuppressed cancer patient, multiple problems could be present at the same time. Laboratory testing should evaluate for hypercalcemia, SIADH, hematologic indexes, and renal function. If initial laboratory evaluation is unrevealing, abdominal imaging may be needed to assess for carcinomatosis, complications from colitis, typhlitis, abscess, or perforation.
On physical examination, the patient appeared fatigued. His temperature was 36.8°C, blood pressure 158/72 mm Hg, pulse 88 beats per minute, respiratory rate 16 breaths per minute, and oxygen saturation was 96% while breathing ambient air. There was neither scleral icterus nor conjunctival injection but he had mild conjunctival pallor. Cardiovascular and lung examinations were normal. Abdominal exam revealed normal bowel sounds without tenderness or organomegaly. He had no supraclavicular, axillary, or inguinal lymphadenopathy. He was alert and oriented. Cranial nerves II through XII were intact. He had decreased muscle bulk in his extremities without focal weakness. Gait and reflexes were not tested.
Initial laboratory testing revealed a white blood cell count of 5.5 K/mm3, hemoglobin of 5 g/dL (hemoglobin 1 month prior was 10.1 g/dL), and platelet count of 20 K/mm3 (platelet count 1 month prior was 246 K/mm3). Creatinine was 3.9 mg/dL (compared with a baseline of 1.8 mg/dL), and blood urea nitrogen was 39 mg/dL. His sodium was 137 mEq/L, potassium 4.2 mEq/L, chloride 105 mEq/L, bicarbonate 22 mEq/L, and thyroid stimulating hormone 0.9 mU/L. His total protein was 4.9 g/dL, albumin 2.1 g/dL, alkaline phosphatase 60 IU/L, alanine aminotransferase 17 IU/L, aspartate aminotransferase 60 IU/L, direct bilirubin 0.2 mg/dL, and total bilirubin 0.5 mg/dL. A chest x-ray showed no infiltrates.
The patient’s laboratory tests reveal several important new findings, including severe acute on chronic anemia, acute thrombocytopenia, and AKI, without clinical evidence of acute blood loss. These changes could be parts of a syndrome or multiple independent disorders. The most urgent priority is to evaluate for TMAs, many of which are fatal if not diagnosed and treated expeditiously. This includes thrombotic thrombocytopenic purpura (TTP), disseminated intravascular hemolysis (DIC), and atypical hemolytic uremic syndrome (aHUS). A manual review of a peripheral blood smear is required to evaluate for fragmented red blood cells (schistocytes). Thereafter, ancillary testing to confirm intravascular hemolysis would include measuring free plasma hemoglobin and lactate dehydrogenase (LDH). Additionally, in intravascular hemolysis, haptoglobin should be depleted and urinalysis should show heme-positive urine without RBCs. In this case the patient’s normal bilirubin studies argue against hemolysis; however, elevated bilirubin is variably present in hemolytic anemias depending on the liver’s ability to conjugate and excrete bilirubin, the relative degree of RBC turnover, and type of hemolysis. Patients with intravascular hemolysis lose hemoglobin directly into the urine leaving relatively little hemoglobin to be incorporated into bile once it has reached the reticuloendothelial system. This results in relatively normal bilirubin levels. More specific indicators of intravascular hemolysis include pink colored plasma on visual inspection (commonly done in the blood bank as part of assessing for hemolytic transfusion reactions), measuring plasma free hemoglobin, or by detecting hemoglobin in the urine.
If microangiopathic hemolytic anemia (MAHA) is excluded, then other causes of these laboratory abnormalities should be considered. Bleeding is the most common cause for anemia, and thrombocytopenia predisposes patients to bleeding. However, there is no evidence of bleeding in this patient, and such a rapid acute anemia is unlikely to be caused by occult blood loss alone. Concurrent anemia and thrombocytopenia could be evidence of bone marrow toxicity from chemotherapy or neoplastic infiltration. With marrow infiltration, there are typically signs on the peripheral smear of leukoerythroblastosis, with circulating nucleated red blood cells and early myeloid forms. Concurrent immune thrombocytopenia (ITP) and autoimmune hemolytic anemia (AIHA), or Evans’ Syndrome, should also be considered. AIHA would be suggested by spherocytes on the peripheral smear, elevated LDH and a positive direct antibody test (DAT).
Regarding the AKI, the patient has diarrhea, which could lead to prerenal azotemia and acute tubular necrosis. A formal urinalysis would evaluate for prerenal and intrinsic kidney disease. TMA can cause intrinsic kidney injury with a benign urinary sediment. The blood urea nitrogen-to-creatinine ratio is not elevated, but in a patient with malnutrition this may not indicate prerenal azotemia. In summary, to differentiate potential TMAs from other causes, the patient needs a blood smear, coagulation studies, and an evaluation for hemolysis, including a urinalysis for free heme and any evidence of intrinsic kidney disease.
Urinalysis showed amber-colored, dilute urine with no white blood cells, red blood cells, protein, or casts. It was positive for blood and negative for bilirubin and hemosiderin. LDH was 1,382 IU/L (reference range 135-225 IU/L), and haptoglobin was unmeasurably low. His ferritin was 2,267 ng/mL, serum iron was 57 mcg/dL, total iron-binding capacity was 241 mcg/dL, and transferrin was 162 mcg/dL. Reticulocyte count was 6% (reticulocyte index of 0.86). Vitamin B12 level was normal. DAT was negative; INR and aPTT were normal. Fibrinogen was 287 mg/dL (reference range 200-400 mg/dL), and D-dimer was 5,095 ng/mL (reference range 0-229 ng/mL).
The urinalysis shows no active sediment to suggest vasculitis or glomerulonephritis. The kidney injury could be the result of renal toxicity from free hemoglobin or as part of TMA caused by microvascular thrombosis. The dilute urine makes prerenal azotemia less likely.
There is clearly acute intravascular hemolysis occurring as evidenced by hemoglobinuria, very high LDH, and undetectable serum haptoglobin. The hemolysis is acute because chronic intravascular hemolysis would lead to positive urine hemosiderin via deposition in the renal tubules. Autoimmune hemolytic anemia is much less likely, but not ruled out, by a negative DAT.
This syndrome can be further refined from acute anemia to acute anemia with likely nonimmune intravascular hemolysis, acute thrombocytopenia, and AKI with hemoglobinuria and a bland urinary sediment. At this point, intravascular hemolysis and kidney injury could be part of a unifying diagnosis. However, this does not account for the patient’s thrombocytopenia, and TMA remains the best explanation for the constellation of findings. Review of the peripheral blood smear is urgent because evidence of MAHA would prompt urgent plasma exchange based on presumptive diagnosis of acquired TTP to later be confirmed with ADAMTS13 activity testing. Most TMAs are treated with supportive care only; TTP and aHUS have specific interventions that change the natural history of the disease (plasma exchange and anticomplement therapy, respectively). Given both the deadly natural history and opportunity to intervene with plasma exchange, patients with TMA should be treated with urgent plasma exchange until ADAMTS13 deficiency is confirmed or refuted. One TMA that can be excluded at this point is DIC. DIC in its acute and chronic forms nearly universally causes MAHA, thrombocytopenia, and consumptive coagulopathy including hypofibrinogenemia.
If MAHA is excluded, then other causes of intravascular hemolysis should be considered, along with causes of thrombocytopenia that might be occurring concurrently. Intravascular hemolysis can be further differentiated by etiologies primarily related to the RBC or whether the RBC is the innocent bystander amidst a systemic illness. RBC disorders include syndromes affecting RBC fragility like hereditary spherocytosis or RBC enzymopathies (G6PD deficiency), but these do not cause thrombocytopenia. One exception is an acquired membrane defect, paroxysmal nocturnal hemoglobinuria (PNH), in which RBCs and other blood cells become susceptible to complement-mediated lysis. Testing for PNH by peripheral blood flow cytometry should be considered if the blood film lacks schistocytes. Systemic disorders that cause intravascular hemolysis include severe burns (heat damage to RBCs), RBC trauma from “march hemoglobinuria” or mechanical heart valves, immune (antibody-mediated) hemolysis from Rh immune globulin administration, cold agglutinin disease or ABO mismatched transfusion, and infections including the intraerythrocyte parasites malaria, Bartonellosis, and Babesiosis, as well as organisms that induce RBC fragility such as Leishmaniasis, Clostridium perfringens, and Haemophilus influenzae B.
On review of additional history, the patient had not recently received blood products. He had received heparin during prior hospitalizations, but had no prior history of thrombosis. He had no history of tick exposure. Peripheral blood smear was obtained and reviewed by a
The blood smear helps narrow the differential further. The lack of schistocytes makes TMA far less likely and so plasma exchange is not urgently indicated. The differential still includes drug-induced TMA (gemcitabine being a well-known cause for TMA) and cancer-associated TMA could still cause these findings, but plasma exchange does not improve outcomes. Acquired (immune) TTP is very unlikely unless the patient did not improve with supportive care or developed neurologic symptoms. Similarly, atypical (complement-driven) HUS would only be considered if renal failure did not improve with supportive care.
The blood smear does show a surprising finding of pyropoikilocytosis. Pyropoikilocytosis refers to changes in RBC shape (poikilocytosis) typically seen with thermal injury or rare RBC membrane structural defects. Hereditary pyropoikilocytosis, a very rare disease, is characterized by chronic hyperproliferative, compensated anemia, and occasional hemolytic crises. These crises are associated with splenomegaly, reticulocytosis, and elevated bilirubin with jaundice. As the patient has no history of similar episodes, the blood smear changes are not due to a hereditary cause and obviously not due to thermal injury (ie, severe burns). Pyropoikilocytosis has been rarely reported in drug-induced TMA and in severe bacterial bloodstream infections (most commonly Gram-negative bacilli). This patient has received gemcitabine (a known cause of drug-induced TMA) and has a recently diagnosed infection (C difficile colitis), either of which could be linked to this rare blood smear finding. Both of these syndromes would be treated with supportive care plus avoidance of future gemcitabine.
Transfusion of packed RBCs is indicated given his profound anemia and symptoms of fatigue. One should obtain further testing for cold agglutinins, PNH, and echocardiography to exclude endocarditis. If he were to become critically ill, anuric, or encephalopathic, then one could consider plasma exchange for treatment of TMA and hemoglobin-mediated AKI. Pyropoikilocytosis should be considered the result of drug-induced TMA, severe C difficile colitis, or an occult infection.
The patient was transfused packed RBCs. Because of a concern for an acute TMA such as TTP, both a hematopathologist and the consulting hematology/oncology team reviewed the peripheral blood morphology emergently. He was given aggressive fluid resuscitation and received 3 L of IV lactated ringers’ solution. An echocardiogram did not show valvular abnormalities. A renal biopsy was contraindicated because of the severe thrombocytopenia.
Given the recently confirmed C difficile colitis along with the findings of pyropoikilocytosis on the peripheral smear, toxin-mediated intravascular hemolysis from systemic C difficile infection became the leading diagnosis. Positing that the C difficile colitis was inadequately treated with oral metronidazole, aggressive treatment for C difficile was initiated with oral vancomycin in addition to intravenous metronidazole. Intravenous metronidazole was included given his elevated creatinine, presence of severe colitis on imaging, and concern he may be at risk for translocation of colonic C difficile or exotoxin into the bloodstream.
Over the course of the next 3 days, the patient’s platelet count normalized and his hemoglobin, creatinine, and symptoms of fatigue improved. Blood cultures remained negative. The patient’s rapid improvement with antibiotics supported our final diagnosis of toxin-mediated hemolysis caused by a systemic C difficile infection. On follow-up testing after hospital discharge, hemoglobin had returned to prior baseline and there was no recurrent hemolysis. Gemcitabine was considered to be a possible cause of his hemolytic anemia and was not continued in further treatment for his NSCLC.
COMMENTARY
When evaluating patients with cancer who present with fatigue, hospitalists should consider a broad list of potential causes. The differential should include etiologies directly related to the malignancy, paraneoplastic phenomena, treatment-related complications, and diseases unrelated to cancer. In addition, as the number of medications used for cancer proliferates, hospitalists must take a detailed history of the agents used and be aware of major side effects. Using this information, hospitalists may undertake a targeted approach to diagnostics while searching for a cause of fatigue.
When lab testing reveals profound anemia, hospitalists must consider syndromes that may require emergent management. Anemia can be caused by decreased RBC production, and acute anemia in the absence of clear blood loss suggests hemolysis. Moreover, the combination of elevated LDH and low haptoglobin is quite specific of hemolytic anemia.1,2 Once hemolytic anemia is identified, DIC and TMA syndromes (such as TTP) need to be considered. The combination of hemolytic anemia and AKI may indicate a medical emergency and should prompt hospitalists to obtain an urgent peripheral blood smear to help narrow the differential.3
The absence of schistocytes on a blood smear does not rule out TTP or HUS, but does argue strongly against these diagnoses.4,5 Of note, consultation with a hematopathologist and hematology subspecialist should be done to ensure appropriate and timely review of the peripheral blood smear.
In this case, the blood smear led to a very rare finding of pyropoikilocytosis. The unexpected result should prompt a broader review of the medical history particularly as it relates to the patient’s broader symptoms and laboratory abnormalities. Acquired pyropoikilocytosis is a very specific finding known to be associated only with hyperthermal injury (seen in burn patients), drug-induced TMA, and bacterial bloodstream infections, mainly Gram-negative toxins and Clostridioidal infections.6-8 In this case, both drug-induced TMA and C difficile infection were considered.
Gemcitabine-induced TMA can occur with either short or long term use of the medication and can be difficult to distinguish from TTP. While both TTP and gemcitabine-induced TMA can cause thrombocytopenia, hemolytic anemia, and schistocytes on a blood smear, the latter causes acute kidney injury more frequently than TTP. In addition, gemcitabine-induced TMA may not lead to severe decrease in ADAMTS13 activity. A kidney biopsy could confirm drug-induced TMA but was contraindicated in this case because of the thrombocytopenia. Gemcitabine should not be restarted if this side effect is suspected.
Given the continued rise in C difficile incidence, hospitalists should be aware that C difficile infection can cause extraintestinal illness.9,10 Although uncommon, these extraintestinal complications are associated with high risk of mortality and frequently occur in those with a history of intestinal injury or inflammation and a concomitant bloodstream infection.10 Regarding the possibility of C difficile contributing to hemolysis in this case, the patient’s low blood counts and hemolysis improved concomitantly with more aggressive treatment of C difficile infection. Although his blood cultures were sterile, C difficile is notoriously difficult to culture. Prior case reports have associated C difficile with intravascular hemolysis, which leads to the possibility that the patient did have a very rare manifestation of this unfortunately common infection.11
This case provides an excellent example of a diagnostic pivot point
KEY TEACHING POINTS
- In evaluating symptomatic cancer patients, providers must consider sequelae of the tumor, paraneoplastic phenomena, and treatment-related complications.
- Hemolytic anemia may represent a life-threatening emergency particularly when accompanied by AKI and requires urgent peripheral blood smear evaluation.
- Acquired pyropoikilocytosis is a specific finding known to be associated only with thermal injury, drug-induced TMA, and bacterial toxin–mediated hemolysis.
Disclosures
The authors have nothing to disclose.
1. Weinzierl EP, Arber DA. The differential diagnosis and bone marrow evaluation of new-onset pancytopenia. Am J Clin Pathol. 2013:139(1):9-29. https://doi.org/10.1309/AJCP50AEEYGREWUZ.
2. Marchand A, Galen RS, Van Lente F. The predictive value of serum haptoglobin in hemolytic disease. JAMA.1980;243(19):1909-1911. https://doi:10.1001/jama.1980.03300450023014.
3. Dhaliwal G, Cornett PA, Tierney LM Jr. Hemolytic anemia. Am Fam Physician. 2004;69(11):2599-2606.
4. Joly BS, Coppo P, Veyradier A. Thrombotic thrombocytopenic purpura. Blood. 2017;129(21):2836-2846. https://doi.org/10.1182/blood-2016-10-709857.
5. Jokiranta TS. HUS and atypical HUS. Blood. 2017;129(21):2847-2856. https://doi.org/10.1182/blood-2016-11-709865.
6. Baar S, Arrowsmith DJ. Thermal damage to red cells. J Clin Path. 1970;23(7):572-576. https://doi.org/10.1136/jcp.23.7.572.
7. Meinders AJ, Dijkstra I. Massive hemolysis and erythrophagocytosis in severe sepsis. Blood. 2014;124(6):841. https://doi.org/10.1182/blood-2014-04-565663.
8. McIlwaine K, Leach MT. Clostridium perfringens septicaemia. Br J Haematol. 2013;163(5):549. https://doi.org/10.1111/bjh.12551.
9. Evans CT, Safdar N. Current trends in the epidemiology and outcomes of Clostridium difficile infection. Clin Infect Dis. 2015;60 (Supp 2):S66-71. https://doi.org/10.1093/cid/civ140.
10. Gupta A, Patel R, Baddour LM, Pardi DS, Khanna S. Extraintestinal Clostridium difficile infections: a single-center experience. Mayo Clin Proc. 2014;89(11):1525-36. https://doi.org/10.1016/j.mayocp.2014.07.012.
11. Alvarado AS, Brodsky SV, Nadasdy T, Singh N. Hemolytic uremic syndrome associated with Clostridium difficile infection. Clin Nephrol. 2014;81(4):302-6. https://doi.org/10.5414/CN107691.
© 2020 Society of Hospital Medicine
Clinical Progress Note: Myocardial Injury After Noncardiac Surgery
More than 200 million patients worldwide undergo major noncardiac surgery each year. Of these, more than 10 million patients suffer a major adverse cardiovascular event (MACE) within 30 days of surgery.1 Elevated troponins after noncardiac surgery have been associated with increased mortality, but the management of these patients and the indications for screening remain unclear. The nomenclature around myocardial injury also remains confusing. In this Progress Note, we aim to define myocardial injury after noncardiac surgery (MINS) and discuss the key questions on MINS and postoperative troponin elevation.
A PubMed search for medical subject headings and the terms “myocardial injury after noncardiac surgery,” “perioperative troponin,” and “postoperative troponin” restricted to humans, English language, and published in the past 5 years resulted in 144 articles. Articles most relevant to this progress note were included. Guidelines from major societies on perioperative cardiovascular assessment and management were also reviewed.
DEFINITION OF MYOCARDIAL INJURY AND MINS
The Fourth Universal Definition of Myocardial Infarction ( UDMI 4) defines myocardial injury as detection of an elevated cardiac troponin above the 99th percentile upper reference limit (URL).2 Different troponin assays are not comparable and institutions set their own thresholds for abnormal troponin. Per UDMI 4, myocardial injury is classified as (Figure)2-4:
- Acute Myocardial Infarction (MI): This is defined as “detection of a rise and/or fall of cardiac troponin with ≥1 value above the 99th percentile URL and ≥1 of the following: symptoms of acute myocardial ischemia, new ischemic electrocardiographic changes, development of pathological Q waves, or imaging evidence of new loss of viable myocardium or new regional wall motion abnormality in a pattern consistent with an ischemic etiology.” If these patients have an acute atherosclerotic plaque rupture, they are classified as Type 1 MI (T1MI), and if they have a mismatch between oxygen supply/demand, they are classified as Type 2 MI (T2MI).
- Acute Nonischemic Myocardial Injury (NIMI): This is defined as detection of both a rise and/or fall of cardiac troponin and one or more cardiac troponin values above the 99th percentile URL, but no overt clinical evidence of myocardial ischemia.
- Chronic Myocardial Injury: This is defined as one or more cardiac troponin values above the 99th percentile URL but without a rise and/or fall pattern.
MINS is defined as a rise and/or fall of cardiac biomarkers of presumed ischemic etiology within 30 days of noncardiac surgery that may occur with or without the clinical criteria necessary to fulfill the universal definition of MI (Figure).5-8

EPIDEMIOLOGY AND OUTCOMES
A meta-analysis of 169 studies reported the overall incidence of MINS to be 17.9%; the incidence was 19.6% when systematic troponin screening was done versus 9.9% when troponins were ordered selectively based on the clinical context.5
That meta-analysis found that patients with MINS were more likely to be older, male, undergoing nonelective surgeries, and have hypertension, coronary artery disease (CAD), prior MI, heart failure, or kidney disease.5 Intraoperative hypotension (defined as systolic blood pressure <100 mm Hg or mean arterial pressure <55 mm Hg for up to 5 minutes or <60 mm Hg for 30 minutes or more) and intraoperative tachycardia (defined as heart rate >100 beats per minute) have been associated with MINS.5,9 The relationship between anesthesia type and MINS is uncertain.
MINS is associated with an increased risk of 30-day mortality, nonfatal cardiac arrest, heart failure, and stroke.In the Vascular Events In Noncardiac Surgery Patients Cohort Evaluation (VISION) studies, the majority of patients did not have ischemic symptoms.6,7 In this study, 30-day mortality rates were 8.5% to 13.5% in patients with ischemic symptoms or electrocardiographic changes and 2.9% to 7.7% in patients with asymptomatic troponin elevations. Among the patients without MINS, 30-day mortality was 0.6% to 1.1%. Higher levels of cardiac troponin were associated with higher mortality rates and shorter time to death.
SCREENING GUIDELINES
The recommendations for perioperative screening for MINS vary from society to society. Although MINS is associated with worse outcomes, and most patients with MINS are asymptomatic, perioperative screening for MINS in the absence of clinical signs or symptoms is currently not recommended by the American College of Cardiology/American Heart Association (ACC/AHA).10
ACC/AHA
“The usefulness of postoperative screening with troponin levels in patients at high risk for perioperative MI, but without signs or symptoms suggestive of myocardial ischemia or MI, is uncertain in the absence of established risks and benefits of a defined management strategy (Class IIb; level of evidence [LOE]–B).”10
European Society of Cardiology
“Measurement of B-type natriuretic peptides (BNP) and high-sensitivity troponins (hsTn) after surgery may be considered in high-risk patients to improve risk stratification (Class IIb; LOE-B). Preoperatively and postoperatively, patients who could most benefit from BNP or hsTn measurements are those with metabolic equivalents (METs) ≤4 or those with a revised cardiac risk index (RCRI) score >1 for vascular surgery and >2 for nonvascular surgery. Postoperatively, patients with a surgical Apgar score <7 should also be monitored with BNP or hsTn to detect complications early, independent of their RCRI values.”11
Canadian Cardiovascular Society
“We recommend obtaining daily troponins for 48-72 hours after noncardiac surgery in patients with a baseline risk of >5% for cardiovascular death or nonfatal MI at 30 days after surgery (ie, patients with an elevated N-terminal-proBNP (NT-proBNP)/BNP before surgery or, if there is no NT-proBNP/BNP before surgery, in those who have an RCRI score ≥1, age 45-64 years with significant cardiovascular disease, or age ≥65 years) (Strong recommendation; Moderate quality evidence).”1
MANAGEMENT OF MINS
Currently, evidence-based therapies are well established only for T1MI. However, it is often challenging to differentiate T1MI from other causes of troponin elevation in the perioperative setting in which anesthesia, sedation, or analgesia may mask ischemic symptoms that typically prompt further investigation. While peak troponin levels may be higher in T1MI than they are in T2MI, the initial or delta change in the troponin may provide poor discrimination between T1MI and T2MI.2 Management is complicated not only by the uncertainty about the underlying diagnosis (T1MI, T2MI, or NIMI) but also by the heterogeneity in the underlying pathophysiology of troponin elevation in patients with T2MI and NIMI. Patients with T2MI are generally sicker and have higher mortality than patients with T1MI, and management typically involves treating the underlying reason for oxygen supply/demand mismatch. Mortality in T2MI is more commonly caused by noncardiovascular causes, but underlying CAD is an independent predictor of cardiovascular death or recurrent MI in these patients.
The MANAGE trial (Management of Myocardial Injury After Noncardiac Surgery) had several methodological limitations to inform clinical practice but showed potential benefit of dabigatran in patients with MINS.12 In this trial, patients on dabigatran had significantly lower rates of the primary efficacy outcome (composite of vascular mortality and nonfatal MI, nonhemorrhagic stroke, peripheral arterial thrombosis, amputation, and symptomatic venous thromboembolism) without a significant increase in life-threatening, major, or critical organ bleeding. Of the secondary efficacy outcomes, only nonhemorrhagic stroke was significantly reduced with dabigatran, but the event rate was low. In the subgroup analysis, patients randomized to dabigatran within 5 days of MINS and those meeting the criteria for MI had significantly lower rates of the primary efficacy outcome.
Patients with T2MI with known CAD may benefit from long-term risk reduction strategies for secondary prevention. There are no definitive management strategies in the literature for T2MI with unknown or no CAD. The SWEDEHEART registry (Swedish Web-System for Enhancement and Development of Evidence-Based Care in Heart Disease Evaluated According to Recommended Therapy) enrolled 9,136 patients with MI with nonobstructive coronary arteries (MINOCA).13 Though MINOCA may include T1MI patients, the majority of these patients are classified as T2MI under UDMI 4. Therefore, it has been proposed that data from this registry may inform management on T2MI.14 Data from this registry showed that statins and angiotensin-converting enzyme inhibitors or angiotensin II receptor blockers were associated with lower incidence of MACE over a mean follow-up of 4.1 years. Dual-antiplatelet therapy or beta blockers did not significantly lower the incidence of MACE.13 In another study assessing 2-year mortality in patients with T2MI, beta blockers were beneficial.15
KEY QUESTIONS AND RECOMMENDATIONS
Who should be screened?
Screening can be performed if further risk stratification of high-risk patients or patients with poor functional status is desired. European Society of Cardiology and Canadian Cardiovascular Society guidelines provide guidance on the screening criteria. Troponin elevation in a low-risk group is associated with a low mortality rate, and many of these troponin elevations may be secondary to causes other than myocardial ischemia.
How should screening be conducted?
If planning to obtain postoperative troponins, then preoperative troponin should be obtained because 35% of the patients may have a chronic troponin elevation.
What is the risk if postoperative troponin screening is not performed?
Most patients with MINS are asymptomatic. Systematic screening with troponins (compared with selective screening based on clinical signs or symptoms) can detect T1MI that would otherwise remain occult and undiagnosed.
What is the risk if postoperative troponin screening is performed?
Detecting asymptomatic troponin elevations could lead to potentially harmful treatments (eg, increased risk of bleeding with antithrombotics in the postoperative setting, increased use of cardiac angiography, or addition of new medications such as statins and beta-blockers in the postoperative setting with the potential for adverse effects).
How should MINS be documented?
ST-elevation and non–ST elevation MI (STEMI and NSTEMI) should be reserved for T1MI only. T1MI should be documented when acute plaque rupture is strongly suspected. T2MI should be documented when oxygen supply/demand mismatch is strongly suspected as the etiology of acute MI (eg, T2MI secondary to tachyarrhythmia, hypertensive emergency, or septic shock). Documenting as “demand ischemia” or “unlikely acute coronary syndrome” for T2MI or NIMI should be avoided. Troponin elevations not meeting the criteria for acute MI should be documented as “non-MI troponin elevation” (eg, non-MI troponin elevation secondary to chronic kidney disease or left ventricular hypertrophy). Terms like “troponinitis” or “troponinemia” should be avoided.3
Can MINS be prevented?
There are no well-defined strategies for prevention of MINS, but cardiovascular risk factors should be optimized preoperatively for all patients. In a meta-analysis, preoperative aspirin was not associated with reduced incidence of MINS, and the role of preoperative statins remains speculative; however, nonacute initiation of beta-blockers preoperatively was associated with a lower incidence of MINS.5 Withholding angiotensin-converting enzyme inhibitors or angiotensin II receptor blockers in the 24 hours prior to surgery has been associated with a lower incidence of MINS. Intraoperative hypotension or tachycardia should be avoided.
CONCLUSION
While MINS has been associated with increased 30-day mortality, there are currently no definitive evidence-based management strategies for these patients. Institutions should consider creating decision-support tools if considering screening for MINS based on patient- and surgery-specific risk factors.
Disclosures
The authors have nothing to disclose.
1. Duceppe E, Parlow J, MacDonald P, et al. Canadian Cardiovascular Society guidelines on perioperative cardiac risk assessment and management for patients who undergo noncardiac surgery. Can J Cardiol. 2017;33(1):17-32. https://doi.org/10.1016/j.cjca.2016.09.008.
2. Thygesen K, Alpert JS, Jaffe AS, et al. Fourth universal definition of myocardial infarction. J Am Coll Cardiol. 2018;72(18):2231-2264. https://doi.org/10.1016/j.jacc.2018.08.1038.
3. Goyal A, Gluckman TJ, Levy A, et al. Translating the fourth universal definition of myocardial infarction into clinical documentation: ten pearls for frontline clinicians. Cardiology Magazine. 2018. https://www.acc.org/latest-in-cardiology/articles/2018/11/06/12/42/translating-the-fourth-universal-definition-of-myocardial-infarction-into-clinical-documentation-ten-pearls-for-frontline-clinicians. Accessed February 20, 2020.
4. King CJ, Levy AE, Trost JC. Clinical progress notes: updates from the 4th universal definition of myocardial infarction. J Hosp Med. 2019;14(9):555-557. https://doi.org/10.12788/jhm.3283.
5. Smilowitz NR, Redel-Traub G, Hausvater A, et al. Myocardial injury after noncardiac surgery: a systematic review and meta-analysis. Cardiol Rev. 2019;27(6):267-273. https://doi.org/10.1097/crd.0000000000000254.
6. Botto F, Alonso-Coello P, Chan MT, et al. Myocardial injury after noncardiac surgery: a large, international, prospective cohort study establishing diagnostic criteria, characteristics, predictors, and 30-day outcomes. Anesthesiology. 2014;120(3):564-578. https://doi.org/10.1097/aln.0000000000000113.
7. Writing Committee for the VISION Study Investigators, Devereaux PJ, Biccard BM, et al. Association of postoperative high-sensitivity troponin levels with myocardial injury and 30-day mortality among patients undergoing noncardiac surgery. JAMA. 2017;317(16):1642-1651. https://doi.org/10.1001/jama.2017.4360.
8. Puelacher C, Lurati Buse G, Seeberger D, et al. Perioperative myocardial injury after noncardiac surgery: incidence, mortality, and characterization. Circulation. 2018;137(12):1221-1232. https://doi.org/10.1161/circulationaha.117.030114.
9. Abbott TEF, Pearse RM, Archbold RA, et al. A prospective international multicentre cohort study of intraoperative heart rate and systolic blood pressure and myocardial injury after noncardiac surgery: results of the VISION study. Anesth Analg. 2018;126(6):1936-1945. https://doi.org/10.1213/ane.0000000000002560.
10. Fleisher LA, Fleischmann KE, Auerbach AD, et al. 2014 ACC/AHA guideline on perioperative cardiovascular evaluation and management of patients undergoing noncardiac surgery: a report of the American College of Cardiology/American Heart Association Task Force on practice guidelines. J Am Coll Cardiol. 2014;64(22):e77-e137. https://doi.org/10.1016/j.jacc.2014.07.944.
11. Kristensen SD, Knuuti J, Saraste A, et al. 2014 ESC/ESA Guidelines on non-cardiac surgery: cardiovascular assessment and management: the joint task force on non-cardiac surgery: cardiovascular assessment and management of the European Society of Cardiology (ESC) and the European Society of Anaesthesiology (ESA). Eur Heart J. 2014;35(35):2383-2431. https://doi.org/10.1093/eurheartj/ehu282.
12. Devereaux PJ, Duceppe E, Guyatt G, et al. Dabigatran in patients with myocardial injury after non-cardiac surgery (MANAGE): an international, randomised, placebo-controlled trial. Lancet. 2018;391(10137):2325-2334. https://doi.org/10.1016/s0140-6736(18)30832-8.
13. Lindahl B, Baron T, Erlinge D, et al. Medical therapy for secondary prevention and long-term outcome in patients with myocardial infarction with nonobstructive coronary artery disease. Circulation. 2017;135(16):1481-1489. https://doi.org/10.1161/circulationaha.116.026336.
14. DeFilippis AP, Chapman AR, Mills NL, et al. Assessment and treatment of patients with type 2 myocardial infarction and acute nonischemic myocardial injury. Circulation. 2019;140(20):1661-1678. https://doi.org/10.1161/circulationaha.119.040631.
15. Sandoval Y, Smith SW, Sexter A, et al. Type 1 and 2 myocardial infarction and myocardial injury: clinical transition to high-sensitivity cardiac troponin I. Am J Med. 2017;130(12):1431-1439.e4. https://doi.org/10.1016/j.amjmed.2017.05.049.
More than 200 million patients worldwide undergo major noncardiac surgery each year. Of these, more than 10 million patients suffer a major adverse cardiovascular event (MACE) within 30 days of surgery.1 Elevated troponins after noncardiac surgery have been associated with increased mortality, but the management of these patients and the indications for screening remain unclear. The nomenclature around myocardial injury also remains confusing. In this Progress Note, we aim to define myocardial injury after noncardiac surgery (MINS) and discuss the key questions on MINS and postoperative troponin elevation.
A PubMed search for medical subject headings and the terms “myocardial injury after noncardiac surgery,” “perioperative troponin,” and “postoperative troponin” restricted to humans, English language, and published in the past 5 years resulted in 144 articles. Articles most relevant to this progress note were included. Guidelines from major societies on perioperative cardiovascular assessment and management were also reviewed.
DEFINITION OF MYOCARDIAL INJURY AND MINS
The Fourth Universal Definition of Myocardial Infarction ( UDMI 4) defines myocardial injury as detection of an elevated cardiac troponin above the 99th percentile upper reference limit (URL).2 Different troponin assays are not comparable and institutions set their own thresholds for abnormal troponin. Per UDMI 4, myocardial injury is classified as (Figure)2-4:
- Acute Myocardial Infarction (MI): This is defined as “detection of a rise and/or fall of cardiac troponin with ≥1 value above the 99th percentile URL and ≥1 of the following: symptoms of acute myocardial ischemia, new ischemic electrocardiographic changes, development of pathological Q waves, or imaging evidence of new loss of viable myocardium or new regional wall motion abnormality in a pattern consistent with an ischemic etiology.” If these patients have an acute atherosclerotic plaque rupture, they are classified as Type 1 MI (T1MI), and if they have a mismatch between oxygen supply/demand, they are classified as Type 2 MI (T2MI).
- Acute Nonischemic Myocardial Injury (NIMI): This is defined as detection of both a rise and/or fall of cardiac troponin and one or more cardiac troponin values above the 99th percentile URL, but no overt clinical evidence of myocardial ischemia.
- Chronic Myocardial Injury: This is defined as one or more cardiac troponin values above the 99th percentile URL but without a rise and/or fall pattern.
MINS is defined as a rise and/or fall of cardiac biomarkers of presumed ischemic etiology within 30 days of noncardiac surgery that may occur with or without the clinical criteria necessary to fulfill the universal definition of MI (Figure).5-8
EPIDEMIOLOGY AND OUTCOMES
A meta-analysis of 169 studies reported the overall incidence of MINS to be 17.9%; the incidence was 19.6% when systematic troponin screening was done versus 9.9% when troponins were ordered selectively based on the clinical context.5
That meta-analysis found that patients with MINS were more likely to be older, male, undergoing nonelective surgeries, and have hypertension, coronary artery disease (CAD), prior MI, heart failure, or kidney disease.5 Intraoperative hypotension (defined as systolic blood pressure <100 mm Hg or mean arterial pressure <55 mm Hg for up to 5 minutes or <60 mm Hg for 30 minutes or more) and intraoperative tachycardia (defined as heart rate >100 beats per minute) have been associated with MINS.5,9 The relationship between anesthesia type and MINS is uncertain.
MINS is associated with an increased risk of 30-day mortality, nonfatal cardiac arrest, heart failure, and stroke.In the Vascular Events In Noncardiac Surgery Patients Cohort Evaluation (VISION) studies, the majority of patients did not have ischemic symptoms.6,7 In this study, 30-day mortality rates were 8.5% to 13.5% in patients with ischemic symptoms or electrocardiographic changes and 2.9% to 7.7% in patients with asymptomatic troponin elevations. Among the patients without MINS, 30-day mortality was 0.6% to 1.1%. Higher levels of cardiac troponin were associated with higher mortality rates and shorter time to death.
SCREENING GUIDELINES
The recommendations for perioperative screening for MINS vary from society to society. Although MINS is associated with worse outcomes, and most patients with MINS are asymptomatic, perioperative screening for MINS in the absence of clinical signs or symptoms is currently not recommended by the American College of Cardiology/American Heart Association (ACC/AHA).10
ACC/AHA
“The usefulness of postoperative screening with troponin levels in patients at high risk for perioperative MI, but without signs or symptoms suggestive of myocardial ischemia or MI, is uncertain in the absence of established risks and benefits of a defined management strategy (Class IIb; level of evidence [LOE]–B).”10
European Society of Cardiology
“Measurement of B-type natriuretic peptides (BNP) and high-sensitivity troponins (hsTn) after surgery may be considered in high-risk patients to improve risk stratification (Class IIb; LOE-B). Preoperatively and postoperatively, patients who could most benefit from BNP or hsTn measurements are those with metabolic equivalents (METs) ≤4 or those with a revised cardiac risk index (RCRI) score >1 for vascular surgery and >2 for nonvascular surgery. Postoperatively, patients with a surgical Apgar score <7 should also be monitored with BNP or hsTn to detect complications early, independent of their RCRI values.”11
Canadian Cardiovascular Society
“We recommend obtaining daily troponins for 48-72 hours after noncardiac surgery in patients with a baseline risk of >5% for cardiovascular death or nonfatal MI at 30 days after surgery (ie, patients with an elevated N-terminal-proBNP (NT-proBNP)/BNP before surgery or, if there is no NT-proBNP/BNP before surgery, in those who have an RCRI score ≥1, age 45-64 years with significant cardiovascular disease, or age ≥65 years) (Strong recommendation; Moderate quality evidence).”1
MANAGEMENT OF MINS
Currently, evidence-based therapies are well established only for T1MI. However, it is often challenging to differentiate T1MI from other causes of troponin elevation in the perioperative setting in which anesthesia, sedation, or analgesia may mask ischemic symptoms that typically prompt further investigation. While peak troponin levels may be higher in T1MI than they are in T2MI, the initial or delta change in the troponin may provide poor discrimination between T1MI and T2MI.2 Management is complicated not only by the uncertainty about the underlying diagnosis (T1MI, T2MI, or NIMI) but also by the heterogeneity in the underlying pathophysiology of troponin elevation in patients with T2MI and NIMI. Patients with T2MI are generally sicker and have higher mortality than patients with T1MI, and management typically involves treating the underlying reason for oxygen supply/demand mismatch. Mortality in T2MI is more commonly caused by noncardiovascular causes, but underlying CAD is an independent predictor of cardiovascular death or recurrent MI in these patients.
The MANAGE trial (Management of Myocardial Injury After Noncardiac Surgery) had several methodological limitations to inform clinical practice but showed potential benefit of dabigatran in patients with MINS.12 In this trial, patients on dabigatran had significantly lower rates of the primary efficacy outcome (composite of vascular mortality and nonfatal MI, nonhemorrhagic stroke, peripheral arterial thrombosis, amputation, and symptomatic venous thromboembolism) without a significant increase in life-threatening, major, or critical organ bleeding. Of the secondary efficacy outcomes, only nonhemorrhagic stroke was significantly reduced with dabigatran, but the event rate was low. In the subgroup analysis, patients randomized to dabigatran within 5 days of MINS and those meeting the criteria for MI had significantly lower rates of the primary efficacy outcome.
Patients with T2MI with known CAD may benefit from long-term risk reduction strategies for secondary prevention. There are no definitive management strategies in the literature for T2MI with unknown or no CAD. The SWEDEHEART registry (Swedish Web-System for Enhancement and Development of Evidence-Based Care in Heart Disease Evaluated According to Recommended Therapy) enrolled 9,136 patients with MI with nonobstructive coronary arteries (MINOCA).13 Though MINOCA may include T1MI patients, the majority of these patients are classified as T2MI under UDMI 4. Therefore, it has been proposed that data from this registry may inform management on T2MI.14 Data from this registry showed that statins and angiotensin-converting enzyme inhibitors or angiotensin II receptor blockers were associated with lower incidence of MACE over a mean follow-up of 4.1 years. Dual-antiplatelet therapy or beta blockers did not significantly lower the incidence of MACE.13 In another study assessing 2-year mortality in patients with T2MI, beta blockers were beneficial.15
KEY QUESTIONS AND RECOMMENDATIONS
Who should be screened?
Screening can be performed if further risk stratification of high-risk patients or patients with poor functional status is desired. European Society of Cardiology and Canadian Cardiovascular Society guidelines provide guidance on the screening criteria. Troponin elevation in a low-risk group is associated with a low mortality rate, and many of these troponin elevations may be secondary to causes other than myocardial ischemia.
How should screening be conducted?
If planning to obtain postoperative troponins, then preoperative troponin should be obtained because 35% of the patients may have a chronic troponin elevation.
What is the risk if postoperative troponin screening is not performed?
Most patients with MINS are asymptomatic. Systematic screening with troponins (compared with selective screening based on clinical signs or symptoms) can detect T1MI that would otherwise remain occult and undiagnosed.
What is the risk if postoperative troponin screening is performed?
Detecting asymptomatic troponin elevations could lead to potentially harmful treatments (eg, increased risk of bleeding with antithrombotics in the postoperative setting, increased use of cardiac angiography, or addition of new medications such as statins and beta-blockers in the postoperative setting with the potential for adverse effects).
How should MINS be documented?
ST-elevation and non–ST elevation MI (STEMI and NSTEMI) should be reserved for T1MI only. T1MI should be documented when acute plaque rupture is strongly suspected. T2MI should be documented when oxygen supply/demand mismatch is strongly suspected as the etiology of acute MI (eg, T2MI secondary to tachyarrhythmia, hypertensive emergency, or septic shock). Documenting as “demand ischemia” or “unlikely acute coronary syndrome” for T2MI or NIMI should be avoided. Troponin elevations not meeting the criteria for acute MI should be documented as “non-MI troponin elevation” (eg, non-MI troponin elevation secondary to chronic kidney disease or left ventricular hypertrophy). Terms like “troponinitis” or “troponinemia” should be avoided.3
Can MINS be prevented?
There are no well-defined strategies for prevention of MINS, but cardiovascular risk factors should be optimized preoperatively for all patients. In a meta-analysis, preoperative aspirin was not associated with reduced incidence of MINS, and the role of preoperative statins remains speculative; however, nonacute initiation of beta-blockers preoperatively was associated with a lower incidence of MINS.5 Withholding angiotensin-converting enzyme inhibitors or angiotensin II receptor blockers in the 24 hours prior to surgery has been associated with a lower incidence of MINS. Intraoperative hypotension or tachycardia should be avoided.
CONCLUSION
While MINS has been associated with increased 30-day mortality, there are currently no definitive evidence-based management strategies for these patients. Institutions should consider creating decision-support tools if considering screening for MINS based on patient- and surgery-specific risk factors.
Disclosures
The authors have nothing to disclose.
1. Duceppe E, Parlow J, MacDonald P, et al. Canadian Cardiovascular Society guidelines on perioperative cardiac risk assessment and management for patients who undergo noncardiac surgery. Can J Cardiol. 2017;33(1):17-32. https://doi.org/10.1016/j.cjca.2016.09.008.
2. Thygesen K, Alpert JS, Jaffe AS, et al. Fourth universal definition of myocardial infarction. J Am Coll Cardiol. 2018;72(18):2231-2264. https://doi.org/10.1016/j.jacc.2018.08.1038.
3. Goyal A, Gluckman TJ, Levy A, et al. Translating the fourth universal definition of myocardial infarction into clinical documentation: ten pearls for frontline clinicians. Cardiology Magazine. 2018. https://www.acc.org/latest-in-cardiology/articles/2018/11/06/12/42/translating-the-fourth-universal-definition-of-myocardial-infarction-into-clinical-documentation-ten-pearls-for-frontline-clinicians. Accessed February 20, 2020.
4. King CJ, Levy AE, Trost JC. Clinical progress notes: updates from the 4th universal definition of myocardial infarction. J Hosp Med. 2019;14(9):555-557. https://doi.org/10.12788/jhm.3283.
5. Smilowitz NR, Redel-Traub G, Hausvater A, et al. Myocardial injury after noncardiac surgery: a systematic review and meta-analysis. Cardiol Rev. 2019;27(6):267-273. https://doi.org/10.1097/crd.0000000000000254.
6. Botto F, Alonso-Coello P, Chan MT, et al. Myocardial injury after noncardiac surgery: a large, international, prospective cohort study establishing diagnostic criteria, characteristics, predictors, and 30-day outcomes. Anesthesiology. 2014;120(3):564-578. https://doi.org/10.1097/aln.0000000000000113.
7. Writing Committee for the VISION Study Investigators, Devereaux PJ, Biccard BM, et al. Association of postoperative high-sensitivity troponin levels with myocardial injury and 30-day mortality among patients undergoing noncardiac surgery. JAMA. 2017;317(16):1642-1651. https://doi.org/10.1001/jama.2017.4360.
8. Puelacher C, Lurati Buse G, Seeberger D, et al. Perioperative myocardial injury after noncardiac surgery: incidence, mortality, and characterization. Circulation. 2018;137(12):1221-1232. https://doi.org/10.1161/circulationaha.117.030114.
9. Abbott TEF, Pearse RM, Archbold RA, et al. A prospective international multicentre cohort study of intraoperative heart rate and systolic blood pressure and myocardial injury after noncardiac surgery: results of the VISION study. Anesth Analg. 2018;126(6):1936-1945. https://doi.org/10.1213/ane.0000000000002560.
10. Fleisher LA, Fleischmann KE, Auerbach AD, et al. 2014 ACC/AHA guideline on perioperative cardiovascular evaluation and management of patients undergoing noncardiac surgery: a report of the American College of Cardiology/American Heart Association Task Force on practice guidelines. J Am Coll Cardiol. 2014;64(22):e77-e137. https://doi.org/10.1016/j.jacc.2014.07.944.
11. Kristensen SD, Knuuti J, Saraste A, et al. 2014 ESC/ESA Guidelines on non-cardiac surgery: cardiovascular assessment and management: the joint task force on non-cardiac surgery: cardiovascular assessment and management of the European Society of Cardiology (ESC) and the European Society of Anaesthesiology (ESA). Eur Heart J. 2014;35(35):2383-2431. https://doi.org/10.1093/eurheartj/ehu282.
12. Devereaux PJ, Duceppe E, Guyatt G, et al. Dabigatran in patients with myocardial injury after non-cardiac surgery (MANAGE): an international, randomised, placebo-controlled trial. Lancet. 2018;391(10137):2325-2334. https://doi.org/10.1016/s0140-6736(18)30832-8.
13. Lindahl B, Baron T, Erlinge D, et al. Medical therapy for secondary prevention and long-term outcome in patients with myocardial infarction with nonobstructive coronary artery disease. Circulation. 2017;135(16):1481-1489. https://doi.org/10.1161/circulationaha.116.026336.
14. DeFilippis AP, Chapman AR, Mills NL, et al. Assessment and treatment of patients with type 2 myocardial infarction and acute nonischemic myocardial injury. Circulation. 2019;140(20):1661-1678. https://doi.org/10.1161/circulationaha.119.040631.
15. Sandoval Y, Smith SW, Sexter A, et al. Type 1 and 2 myocardial infarction and myocardial injury: clinical transition to high-sensitivity cardiac troponin I. Am J Med. 2017;130(12):1431-1439.e4. https://doi.org/10.1016/j.amjmed.2017.05.049.
© 2020 Society of Hospital Medicine
Performance of Multihospital Health Systems’ Flagship Hospitals in the CMS Star Rating Program
The Centers for Medicare & Medicaid Services (CMS) Hospital Compare overall hospital ratings was originally released in 2016 and was recently updated in February 2019.1,2 The program is designed to provide a consumer-friendly global rating system for hospitals, with hospitals rated on a scale from one star (worst) to five stars (best). The ratings are based on a formula that combines scores on 57 performance measures into seven groups, with the groups of mortality, safety, readmission, and patient experience given weights of 22% each in the overall scoring, and groups of effectiveness of care, timeliness of care, and efficient use of medical imaging equally contributing to the rest of the score.
Concerns have been raised since the introduction of the program regarding the methodology and possible unfairly high or low star ratings for certain types of hospitals.3,4 It has been noted that five-star hospitals are disproportionately small, specialty-focused hospitals that may not have Emergency Departments or significant volumes of Medicaid patients.5 Hospitals that report fewer measures and thus receive scores for fewer measure groups (in general, smaller or specialty hospitals) are more likely to receive higher star ratings than are hospitals that receive scores for all measure groups.6,7 Teaching hospitals, on average, have received lower star ratings than nonteaching hospitals.8,9
Multihospital systems generally designate one of their hospitals as a “flagship” hospital and often use the name of that hospital to identify the system as a whole (eg, Mayo Clinic Health System, University of Pittsburgh Medical Center). There is not a set of objective criteria to designate a “flagship” hospital of a multihospital health system. Flagships could be the founding hospitals of the systems or the largest hospitals in the systems, and they are usually (although not always) large teaching hospitals. There is therefore a potential paradox in which a set of hospitals that tend to get lower ratings in the CMS star rating system may also be the set frequently identified as system flagship hospitals and whose reputation is used as a brand identity for multihospital systems.
It is possible, though, that the hospitals designated as flagship hospitals in multihospital systems are exceptions to the general rule of lower star ratings for major teaching hospitals. The flagship designation may reflect excellence that is then reflected in the star rating system, or it may reflect some other kind of excellence (eg, reputation for research or teaching, diverse medical services provided) that is not reflected in the star rating system. The primary aim of this study was to compare the average star ratings and hospital characteristics of designated flagship hospitals in multihospital systems with those of (1) major teaching hospitals generally and (2) “nonflagship” hospitals across and within the same systems specifically. We sought to determine whether a flagship designation would be associated with higher star ratings than those of major teaching hospitals in general and with higher star ratings than other, nonflagship hospitals in the same system.
The use of a prestigious flagship hospital name to identify a multihospital system suggests that some aspects of high quality in the flagship are extended in some way to other hospitals in the system. If that is so, then the star ratings of hospitals in organized multihospital systems with a flagship may be more similar to each other than those of sets of hospitals selected at random. As a secondary aim, to determine whether this type of consistent quality throughout a system could be identified in the CMS hospital star rating system, we compared the variation in star ratings between organized multihospital systems with flagship hospitals to those of artificially created “pseudo systems” of unaffiliated hospitals.
METHODS
We used the Agency for Healthcare Research and Quality (AHRQ) Compendium of U.S. Health Systems, 2016, database and hospital file to identify multihospital health systems and their member hospitals.10 The database also provides information about health system characteristics such as systemwide teaching intensity and total number of acute care hospitals. We linked the AHRQ files to the CMS Hospital Compare datasets and Hospital Inpatient Prospective Payment System (IPPS) 2018 Final Rule Impact File to obtain star ratings and other information about specific hospitals (eg, resident to bed ratio, uncompensated care payment). Throughout the study, we followed the AHRQ’s definition of “major teaching hospitals” as hospitals with a high resident to bed ratio (≥0.25).
For purposes of this study, the primary criterion for identification of flagship hospitals was an explicit designation by the parent health systems on their websites, in the systems’ official documents, or in press releases or through major media reports. In the few cases in which parent systems did not designate their flagships, we searched reliable online sources such as major newspapers and hospital reviews to see if there was an agreement among sources on the flagship status. If we could not unambiguously identify a flagship hospital in a multihospital system using these methods, the system was not included in the study. A health system could have more than one flagship hospital.
Because the concept of “flagship” often involves a role as a referral center for complex cases in a regional area small enough to have referrals from hospital to hospital within the same system, we excluded multistate national health systems (eg, Catholic Health Initiatives, Community Health Systems, Inc.) and health systems with no major teaching hospitals or no flagship(s) identified by the systems themselves. Non-acute care and stand-alone hospitals, hospitals with missing CMS Certification Numbers (CCNs) or unmatched CCNs or hospital types across different data files, and hospitals without a star rating, were excluded.
Our analyses were performed at both hospital and health system levels. In the hospital-level analysis, we grouped hospitals into “1-2 star,” “3 star,” and “4-5 star” rating categories. We first compared star ratings of flagship hospitals with those of major teaching hospitals in general (ie, hospitals in the CMS Hospital Compare database with resident to bed ratios ≥0.25 that were not designated as system flagship hospitals). We then compared the average flagship hospital and average nonflagship hospital star ratings pooled across all the health systems. To explore hospital-level characteristics that might be associated with flagship hospitals’ performance on star ratings, we compared hospitals’ teaching intensity, bed size, charity care, and disproportionate share hospital (DSH) patient percentage between flagship and major teaching hospitals and between flagship and nonflagship hospitals. Differences were tested using two-sample t test with equal variances. We also compared hospital characteristics among hospitals with 1-2 stars, 3 stars, and 4-5 stars with use of one-way analysis of variance (ANOVA) with Bonferroni adjustment for multiple comparisons.
In the system-level analysis, we examined flagship hospitals’ star ratings relative to the star ratings for other member hospitals in the same system. We assigned health systems to the following three groups according to their flagship hospitals’ star ratings in comparison to other hospitals within their own systems: health systems in which flagship hospitals were rated the lowest among all member hospitals, health systems in which flagship hospitals were rated neither highest nor lowest or all hospitals within the system had the same star rating, and health systems in which flagship hospitals were rated the highest among all member hospitals. We compared system-level characteristics of the three groups. We calculated the average differences in uncompensated care payment, resident to bed ratio, DSH patient percentage, and total beds between flagship hospitals and nonflagship hospitals of the same health systems, and we also compared the differences across the three health system groups defined previously. We conducted an analysis of covariance (ANCOVA) to take system-level factors into consideration, including system size (total number of acute care hospitals in the system), systemwide teaching intensity, and systemwide charity care. The Bonferroni correction was used to adjust for potential problems of multiple comparisons.
Finally, to compare the diversity of star ratings within health systems and the diversity of star ratings nationwide, we generated a set of 100 pseudo systems each comprising six member hospitals (corresponding to the average number of member hospitals per “true” health system included in the study) that were randomly selected from all hospitals excluded from this study. We calculated and compared the average standard deviations of star ratings between the true health systems and this set of pseudo systems. Differences were tested using two-sample t test with equal variances.
Data management and statistical analyses were conducted using Stata SE, version 13.0 (StataCorp LLC, College Station, Texas).
RESULTS
Our final analysis included 599 hospitals in 113 health systems; 119 hospitals were flagships (four health systems each had two flagship hospitals, and one health system had three flagship hospitals). All other hospitals (n = 480) were designated as nonflaghips. On average, each health system had 6 member hospitals with star ratings, with a range from 2 to 22.
Flagship hospitals did have higher average star ratings than major teaching hospitals (mean star rating, 2.8 vs 2.3, respectively; P < .01; Figure). A larger proportion of flagship hospitals received four or five stars than did major teaching hospitals (29% vs 20%, respectively), and a smaller proportion of them received one or two stars (44% vs 59%, respectively; P < .05).

Flagship hospitals had lower star ratings on average, across all systems, than did nonflagship hospitals (mean star rating, 2.8 vs 3.3, respectively; P < .001). A smaller proportion of flagships received four or five stars than did nonflagships (29% vs 44%, respectively), and a larger proportion of them received one or two stars (44% vs 23%, respectively; P < .001).
As expected, flagship hospitals had significantly higher teaching intensity, larger bed size, higher DSH patient percentage, and higher value of uncompensated care payments than did nonflagship hospitals (P < .001 for all). On average, flagship hospitals were significantly larger but had lower DSH patient percentage and lower value of uncompensated care payments than did major teaching hospitals in general (P < .01 for all). In all types of hospitals, four- or five-star hospitals consistently had significantly lower DSH patient percentage (P < .001) and lower value of uncompensated care payment per claim (P < .05) than did other hospitals (Table).

In half of all health systems (n = 56), flagship hospitals were rated the lowest of all hospitals within that system; in approximately 20% of all health systems (n = 22), flagship hospitals were rated the highest. Flagship hospitals were more likely to have the lowest star rating in the system if the within-system difference in DSH patient percentage between flagship and nonflagship hospitals was relatively large. Within-system DSH patient percentage differences between flagship and nonflagship hospitals were 12.4%, 5.4%, and 3.5% in “flagship rated lowest,” “flagship rated middle,” and “flagship rated highest” systems, respectively (P < .05).
Average standardized deviations of star ratings for the 113 true health systems and 100 randomly generated pseudo health systems were 0.86 and 0.97, respectively (P < .05).
DISCUSSION
System-designated flagship hospitals did not generally have higher star ratings than did the other, smaller, community hospitals, either on average or within their own systems. In fact, the most common pattern observed was the system-designated flagship hospitals had the lowest star rating in their system. Flagship hospitals in multihospital systems were, however, rated higher than major teaching hospitals in general. The safety-net role of many of the system flagship hospitals, as captured by relative DSH percentage, was the most important determinant of low star ratings. A high bed number and teaching status were not as strongly associated with low star ratings.
It is already well established that the CMS star rating system does not correspond to other global hospital ratings systems like those of US News & World Report, Healthgrades, or the Leapfrog Group.11 Each global rating system uses a unique set of measures and weighting systems for those measures, so discrepancies among these systems are inevitable. Multihospital systems may feel that the positive reputation for tertiary care excellence held by a flagship hospital is captured in a rating system like US News that has an explicit reputation component12 and that the US News rankings are more prominent in the public eye than are those of CMS. To the extent that the CMS star ratings do become more widely used by the public or by payers to establish narrow provider networks, the relatively low ratings of multisystem flagship hospitals may become a cause for concern for those hospitals and systems.
System-designated flagship hospitals are typically large teaching hospitals with higher levels of technology, more highly specialized services and medical staff, more extensive research programs and active clinical trials programs, and the ability to treat cases that are difficult or complex or instances of rare conditions. They are not generally, as it turns out, the hospitals in a given system that the CMS star rating system identifies as “best.” In a number of multihospital systems, the system name is derived from the name of the flagship hospital (eg, Yale New Haven Health System and Montefiore Health System), which suggests that the system finds a marketing or branding advantage in being publicly identified with the name and positive reputation of the flagship hospital. Flagship hospitals may be designated as such because they have other attributes that patients, the community, and the system value, which may not be represented by the CMS quality metrics summarized by star ratings.
We did find a somewhat lower level of variation in star ratings in actual multihospital systems than in a set of randomly created “pseudo systems,” suggesting the presence of some mechanism for quality management in those systems leading to a more similar set of star ratings than one would find in hospitals selected at random.
Our study has a few limitations. First, we excluded multihospital health systems without any major teaching member hospital, which was based on our observation that they do not usually designate their flagship hospitals or they do not have any identifiable flagship hospitals. There may be a small number of such health systems that have designated their flagship hospitals and were excluded from the study, but we do not believe it will change our key findings. Second, it was possible that multiple hospitals in the same health system reported under the same CCN (multicampuses will often use the flagship facility’s IDs for the purposes of claims processing or cost and measure reporting), and therefore, the star ratings for the flagship hospitals reflected the performance of both the flagship hospital and the other member hospitals sharing the same CCN. We cannot fix the underlying reporting issue, and as a result, part of our analysis was probably more of a comparison of the “financial” flagship with other more loosely associated hospitals in the system. We could have in fact overestimated the flagships’ star rating performance by including data of other better performing nonflagship hospitals.
CONCLUSION
System-designated flagship hospitals tended to have lower CMS Hospital Compare overall hospital quality star ratings than did nonflagship hospitals in the same multihospital systems. The characteristics of hospitals identified as system flagships do not seem well aligned with those associated with better performance in the star rating system.
Disclosures
The authors declared no conflicts of interest.
1. Centers for Medicare & Medicaid Services. CMS updates website to compare hospital quality. December 21, 2017. https://www.cms.gov/newsroom/press-releases/cms-updates-website-compare-hospital-quality. Accessed October 28, 2019.
2. Centers for Medicare & Medicaid Services. CMS Updates Consumer Resources For Comparing Hospital Quality. February 28, 2019. https://www.cms.gov/newsroom/press-releases/cms-updates-consumer-resources-comparing-hospital-quality. Accessed October 28, 2019.
3. DeLancey JO, Softcheck J, Chung JW, Barnard C, Dahlke AR, Bilimoria KY. Associations between hospital characteristics, measure reporting, and the Centers for Medicare & Medicaid Services overall hospital quality star ratings. JAMA. 2017;317(19):2015-2017. https://doi.org/10.1001/jama.2017.3148.
4. Wan W, Liang CJ, Duszak R, Lee CI. Impact of teaching intensity and sociodemographic characteristics on CMS hospital compare quality ratings. J Gen Intern Med. 2018;33(8):1221-1223. https://doi.org/10.1007/s11606-018-4442-6.
5. Bilimoria KY, Barnard C. The new CMS hospital quality star ratings: the stars are not aligned. JAMA. 2016;316(17):1761-1762. https://doi.org/10.1001/jama.2016.13679.
6. Chatterjee P, Maddox KJ. Patterns of performance and improvement in US Medicare’s hospital star ratings, 2016–2017. BMJ Qual Saf. 2019;28(6):486-494. https://doi.org/10.1136/bmjqs-2018-008384.
7. Chung JW, Dahlke AR, Barnard C, DeLancey JO, Merkow RP, Bilimoria KY. The Centers for Medicare and Medicaid Services hospital ratings: pitfalls of grading on a single curve. Health Aff (Millwood). 2019;38(9):1523-1529. https://doi.org/10.1377/hlthaff.2018.05345.
8. Castellucci M. CMS star ratings disproportionately benefit specialty hospitals, data show. Modern Healthcare. 2018. http://www.modernhealthcare.com/article/20180314/NEWS/180319952. Accessed October 28, 2019.
9. Joynt KE, Jha AK. Characteristics of hospitals receiving penalties under the Hospital Readmissions Reduction Program. JAMA. 2013;309(4):342-343. https://doi.org/10.1001/jama.2012.94856.
10. Agency for Healthcare Research and Quality. Compendium of U.S. Health Systems, 2016. 2019. https://www.ahrq.gov/chsp/data-resources/compendium.html. Accessed October 28, 2019.
11. Bilimoria KY, Birkmeyer JD, Burstin H, et al. Rating the raters: an evaluation of publicly reported hospital quality rating systems. NEJM Catalyst. August 14, 2019. https://catalyst.nejm.org/evaluation-hospital-quality-rating-systems/. Accessed February 19, 2020.
12. Olmstead MG, Powell R, Murphy J, Bell D, Morley M, Stanley M. Methodology U.S. News & World Report 2019-20 Best Hospitals: Specialty Rankings. 2019. https://media.beam.usnews.com/8c/7b/6e1535d141bb9329e23413577d99/190709-bh-methodology-report-2019.pdf. Accessed February 20, 2020.
The Centers for Medicare & Medicaid Services (CMS) Hospital Compare overall hospital ratings was originally released in 2016 and was recently updated in February 2019.1,2 The program is designed to provide a consumer-friendly global rating system for hospitals, with hospitals rated on a scale from one star (worst) to five stars (best). The ratings are based on a formula that combines scores on 57 performance measures into seven groups, with the groups of mortality, safety, readmission, and patient experience given weights of 22% each in the overall scoring, and groups of effectiveness of care, timeliness of care, and efficient use of medical imaging equally contributing to the rest of the score.
Concerns have been raised since the introduction of the program regarding the methodology and possible unfairly high or low star ratings for certain types of hospitals.3,4 It has been noted that five-star hospitals are disproportionately small, specialty-focused hospitals that may not have Emergency Departments or significant volumes of Medicaid patients.5 Hospitals that report fewer measures and thus receive scores for fewer measure groups (in general, smaller or specialty hospitals) are more likely to receive higher star ratings than are hospitals that receive scores for all measure groups.6,7 Teaching hospitals, on average, have received lower star ratings than nonteaching hospitals.8,9
Multihospital systems generally designate one of their hospitals as a “flagship” hospital and often use the name of that hospital to identify the system as a whole (eg, Mayo Clinic Health System, University of Pittsburgh Medical Center). There is not a set of objective criteria to designate a “flagship” hospital of a multihospital health system. Flagships could be the founding hospitals of the systems or the largest hospitals in the systems, and they are usually (although not always) large teaching hospitals. There is therefore a potential paradox in which a set of hospitals that tend to get lower ratings in the CMS star rating system may also be the set frequently identified as system flagship hospitals and whose reputation is used as a brand identity for multihospital systems.
It is possible, though, that the hospitals designated as flagship hospitals in multihospital systems are exceptions to the general rule of lower star ratings for major teaching hospitals. The flagship designation may reflect excellence that is then reflected in the star rating system, or it may reflect some other kind of excellence (eg, reputation for research or teaching, diverse medical services provided) that is not reflected in the star rating system. The primary aim of this study was to compare the average star ratings and hospital characteristics of designated flagship hospitals in multihospital systems with those of (1) major teaching hospitals generally and (2) “nonflagship” hospitals across and within the same systems specifically. We sought to determine whether a flagship designation would be associated with higher star ratings than those of major teaching hospitals in general and with higher star ratings than other, nonflagship hospitals in the same system.
The use of a prestigious flagship hospital name to identify a multihospital system suggests that some aspects of high quality in the flagship are extended in some way to other hospitals in the system. If that is so, then the star ratings of hospitals in organized multihospital systems with a flagship may be more similar to each other than those of sets of hospitals selected at random. As a secondary aim, to determine whether this type of consistent quality throughout a system could be identified in the CMS hospital star rating system, we compared the variation in star ratings between organized multihospital systems with flagship hospitals to those of artificially created “pseudo systems” of unaffiliated hospitals.
METHODS
We used the Agency for Healthcare Research and Quality (AHRQ) Compendium of U.S. Health Systems, 2016, database and hospital file to identify multihospital health systems and their member hospitals.10 The database also provides information about health system characteristics such as systemwide teaching intensity and total number of acute care hospitals. We linked the AHRQ files to the CMS Hospital Compare datasets and Hospital Inpatient Prospective Payment System (IPPS) 2018 Final Rule Impact File to obtain star ratings and other information about specific hospitals (eg, resident to bed ratio, uncompensated care payment). Throughout the study, we followed the AHRQ’s definition of “major teaching hospitals” as hospitals with a high resident to bed ratio (≥0.25).
For purposes of this study, the primary criterion for identification of flagship hospitals was an explicit designation by the parent health systems on their websites, in the systems’ official documents, or in press releases or through major media reports. In the few cases in which parent systems did not designate their flagships, we searched reliable online sources such as major newspapers and hospital reviews to see if there was an agreement among sources on the flagship status. If we could not unambiguously identify a flagship hospital in a multihospital system using these methods, the system was not included in the study. A health system could have more than one flagship hospital.
Because the concept of “flagship” often involves a role as a referral center for complex cases in a regional area small enough to have referrals from hospital to hospital within the same system, we excluded multistate national health systems (eg, Catholic Health Initiatives, Community Health Systems, Inc.) and health systems with no major teaching hospitals or no flagship(s) identified by the systems themselves. Non-acute care and stand-alone hospitals, hospitals with missing CMS Certification Numbers (CCNs) or unmatched CCNs or hospital types across different data files, and hospitals without a star rating, were excluded.
Our analyses were performed at both hospital and health system levels. In the hospital-level analysis, we grouped hospitals into “1-2 star,” “3 star,” and “4-5 star” rating categories. We first compared star ratings of flagship hospitals with those of major teaching hospitals in general (ie, hospitals in the CMS Hospital Compare database with resident to bed ratios ≥0.25 that were not designated as system flagship hospitals). We then compared the average flagship hospital and average nonflagship hospital star ratings pooled across all the health systems. To explore hospital-level characteristics that might be associated with flagship hospitals’ performance on star ratings, we compared hospitals’ teaching intensity, bed size, charity care, and disproportionate share hospital (DSH) patient percentage between flagship and major teaching hospitals and between flagship and nonflagship hospitals. Differences were tested using two-sample t test with equal variances. We also compared hospital characteristics among hospitals with 1-2 stars, 3 stars, and 4-5 stars with use of one-way analysis of variance (ANOVA) with Bonferroni adjustment for multiple comparisons.
In the system-level analysis, we examined flagship hospitals’ star ratings relative to the star ratings for other member hospitals in the same system. We assigned health systems to the following three groups according to their flagship hospitals’ star ratings in comparison to other hospitals within their own systems: health systems in which flagship hospitals were rated the lowest among all member hospitals, health systems in which flagship hospitals were rated neither highest nor lowest or all hospitals within the system had the same star rating, and health systems in which flagship hospitals were rated the highest among all member hospitals. We compared system-level characteristics of the three groups. We calculated the average differences in uncompensated care payment, resident to bed ratio, DSH patient percentage, and total beds between flagship hospitals and nonflagship hospitals of the same health systems, and we also compared the differences across the three health system groups defined previously. We conducted an analysis of covariance (ANCOVA) to take system-level factors into consideration, including system size (total number of acute care hospitals in the system), systemwide teaching intensity, and systemwide charity care. The Bonferroni correction was used to adjust for potential problems of multiple comparisons.
Finally, to compare the diversity of star ratings within health systems and the diversity of star ratings nationwide, we generated a set of 100 pseudo systems each comprising six member hospitals (corresponding to the average number of member hospitals per “true” health system included in the study) that were randomly selected from all hospitals excluded from this study. We calculated and compared the average standard deviations of star ratings between the true health systems and this set of pseudo systems. Differences were tested using two-sample t test with equal variances.
Data management and statistical analyses were conducted using Stata SE, version 13.0 (StataCorp LLC, College Station, Texas).
RESULTS
Our final analysis included 599 hospitals in 113 health systems; 119 hospitals were flagships (four health systems each had two flagship hospitals, and one health system had three flagship hospitals). All other hospitals (n = 480) were designated as nonflaghips. On average, each health system had 6 member hospitals with star ratings, with a range from 2 to 22.
Flagship hospitals did have higher average star ratings than major teaching hospitals (mean star rating, 2.8 vs 2.3, respectively; P < .01; Figure). A larger proportion of flagship hospitals received four or five stars than did major teaching hospitals (29% vs 20%, respectively), and a smaller proportion of them received one or two stars (44% vs 59%, respectively; P < .05).
Flagship hospitals had lower star ratings on average, across all systems, than did nonflagship hospitals (mean star rating, 2.8 vs 3.3, respectively; P < .001). A smaller proportion of flagships received four or five stars than did nonflagships (29% vs 44%, respectively), and a larger proportion of them received one or two stars (44% vs 23%, respectively; P < .001).
As expected, flagship hospitals had significantly higher teaching intensity, larger bed size, higher DSH patient percentage, and higher value of uncompensated care payments than did nonflagship hospitals (P < .001 for all). On average, flagship hospitals were significantly larger but had lower DSH patient percentage and lower value of uncompensated care payments than did major teaching hospitals in general (P < .01 for all). In all types of hospitals, four- or five-star hospitals consistently had significantly lower DSH patient percentage (P < .001) and lower value of uncompensated care payment per claim (P < .05) than did other hospitals (Table).
In half of all health systems (n = 56), flagship hospitals were rated the lowest of all hospitals within that system; in approximately 20% of all health systems (n = 22), flagship hospitals were rated the highest. Flagship hospitals were more likely to have the lowest star rating in the system if the within-system difference in DSH patient percentage between flagship and nonflagship hospitals was relatively large. Within-system DSH patient percentage differences between flagship and nonflagship hospitals were 12.4%, 5.4%, and 3.5% in “flagship rated lowest,” “flagship rated middle,” and “flagship rated highest” systems, respectively (P < .05).
Average standardized deviations of star ratings for the 113 true health systems and 100 randomly generated pseudo health systems were 0.86 and 0.97, respectively (P < .05).
DISCUSSION
System-designated flagship hospitals did not generally have higher star ratings than did the other, smaller, community hospitals, either on average or within their own systems. In fact, the most common pattern observed was the system-designated flagship hospitals had the lowest star rating in their system. Flagship hospitals in multihospital systems were, however, rated higher than major teaching hospitals in general. The safety-net role of many of the system flagship hospitals, as captured by relative DSH percentage, was the most important determinant of low star ratings. A high bed number and teaching status were not as strongly associated with low star ratings.
It is already well established that the CMS star rating system does not correspond to other global hospital ratings systems like those of US News & World Report, Healthgrades, or the Leapfrog Group.11 Each global rating system uses a unique set of measures and weighting systems for those measures, so discrepancies among these systems are inevitable. Multihospital systems may feel that the positive reputation for tertiary care excellence held by a flagship hospital is captured in a rating system like US News that has an explicit reputation component12 and that the US News rankings are more prominent in the public eye than are those of CMS. To the extent that the CMS star ratings do become more widely used by the public or by payers to establish narrow provider networks, the relatively low ratings of multisystem flagship hospitals may become a cause for concern for those hospitals and systems.
System-designated flagship hospitals are typically large teaching hospitals with higher levels of technology, more highly specialized services and medical staff, more extensive research programs and active clinical trials programs, and the ability to treat cases that are difficult or complex or instances of rare conditions. They are not generally, as it turns out, the hospitals in a given system that the CMS star rating system identifies as “best.” In a number of multihospital systems, the system name is derived from the name of the flagship hospital (eg, Yale New Haven Health System and Montefiore Health System), which suggests that the system finds a marketing or branding advantage in being publicly identified with the name and positive reputation of the flagship hospital. Flagship hospitals may be designated as such because they have other attributes that patients, the community, and the system value, which may not be represented by the CMS quality metrics summarized by star ratings.
We did find a somewhat lower level of variation in star ratings in actual multihospital systems than in a set of randomly created “pseudo systems,” suggesting the presence of some mechanism for quality management in those systems leading to a more similar set of star ratings than one would find in hospitals selected at random.
Our study has a few limitations. First, we excluded multihospital health systems without any major teaching member hospital, which was based on our observation that they do not usually designate their flagship hospitals or they do not have any identifiable flagship hospitals. There may be a small number of such health systems that have designated their flagship hospitals and were excluded from the study, but we do not believe it will change our key findings. Second, it was possible that multiple hospitals in the same health system reported under the same CCN (multicampuses will often use the flagship facility’s IDs for the purposes of claims processing or cost and measure reporting), and therefore, the star ratings for the flagship hospitals reflected the performance of both the flagship hospital and the other member hospitals sharing the same CCN. We cannot fix the underlying reporting issue, and as a result, part of our analysis was probably more of a comparison of the “financial” flagship with other more loosely associated hospitals in the system. We could have in fact overestimated the flagships’ star rating performance by including data of other better performing nonflagship hospitals.
CONCLUSION
System-designated flagship hospitals tended to have lower CMS Hospital Compare overall hospital quality star ratings than did nonflagship hospitals in the same multihospital systems. The characteristics of hospitals identified as system flagships do not seem well aligned with those associated with better performance in the star rating system.
Disclosures
The authors declared no conflicts of interest.
1. Centers for Medicare & Medicaid Services. CMS updates website to compare hospital quality. December 21, 2017. https://www.cms.gov/newsroom/press-releases/cms-updates-website-compare-hospital-quality. Accessed October 28, 2019.
2. Centers for Medicare & Medicaid Services. CMS Updates Consumer Resources For Comparing Hospital Quality. February 28, 2019. https://www.cms.gov/newsroom/press-releases/cms-updates-consumer-resources-comparing-hospital-quality. Accessed October 28, 2019.
3. DeLancey JO, Softcheck J, Chung JW, Barnard C, Dahlke AR, Bilimoria KY. Associations between hospital characteristics, measure reporting, and the Centers for Medicare & Medicaid Services overall hospital quality star ratings. JAMA. 2017;317(19):2015-2017. https://doi.org/10.1001/jama.2017.3148.
4. Wan W, Liang CJ, Duszak R, Lee CI. Impact of teaching intensity and sociodemographic characteristics on CMS hospital compare quality ratings. J Gen Intern Med. 2018;33(8):1221-1223. https://doi.org/10.1007/s11606-018-4442-6.
5. Bilimoria KY, Barnard C. The new CMS hospital quality star ratings: the stars are not aligned. JAMA. 2016;316(17):1761-1762. https://doi.org/10.1001/jama.2016.13679.
6. Chatterjee P, Maddox KJ. Patterns of performance and improvement in US Medicare’s hospital star ratings, 2016–2017. BMJ Qual Saf. 2019;28(6):486-494. https://doi.org/10.1136/bmjqs-2018-008384.
7. Chung JW, Dahlke AR, Barnard C, DeLancey JO, Merkow RP, Bilimoria KY. The Centers for Medicare and Medicaid Services hospital ratings: pitfalls of grading on a single curve. Health Aff (Millwood). 2019;38(9):1523-1529. https://doi.org/10.1377/hlthaff.2018.05345.
8. Castellucci M. CMS star ratings disproportionately benefit specialty hospitals, data show. Modern Healthcare. 2018. http://www.modernhealthcare.com/article/20180314/NEWS/180319952. Accessed October 28, 2019.
9. Joynt KE, Jha AK. Characteristics of hospitals receiving penalties under the Hospital Readmissions Reduction Program. JAMA. 2013;309(4):342-343. https://doi.org/10.1001/jama.2012.94856.
10. Agency for Healthcare Research and Quality. Compendium of U.S. Health Systems, 2016. 2019. https://www.ahrq.gov/chsp/data-resources/compendium.html. Accessed October 28, 2019.
11. Bilimoria KY, Birkmeyer JD, Burstin H, et al. Rating the raters: an evaluation of publicly reported hospital quality rating systems. NEJM Catalyst. August 14, 2019. https://catalyst.nejm.org/evaluation-hospital-quality-rating-systems/. Accessed February 19, 2020.
12. Olmstead MG, Powell R, Murphy J, Bell D, Morley M, Stanley M. Methodology U.S. News & World Report 2019-20 Best Hospitals: Specialty Rankings. 2019. https://media.beam.usnews.com/8c/7b/6e1535d141bb9329e23413577d99/190709-bh-methodology-report-2019.pdf. Accessed February 20, 2020.
© 2020 Society of Hospital Medicine
Trends in Intravenous Magnesium Use and Outcomes for Status Asthmaticus in Children’s Hospitals from 2010 to 2017
For severe asthma exacerbations unresponsive to initial treatment, expert consensus guidelines from 2007 recommend consideration for adjunct treatments (magnesium or heliox) to decrease the likelihood of intubation.1 Over the last decade, data have emerged suggesting that intravenous (IV) magnesium may be more effective for reduction of hospital admission rates.2 Pooled meta-analyses have demonstrated improved pulmonary function and reduction of hospital admission by as much as 68% in children when IV magnesium is administered in the emergency department (ED), although the evidence is extremely limited because of a small number of studies (three) and small sample size (115 children).2-5
Though these data suggest that use of IV magnesium may reduce admission rates, a study of pediatric emergency medicine (PEM) physicians in US and Canada reported reluctance regarding use for this purpose. While PEM physicians reported awareness of the literature on admission prevention, they estimated that fewer than 5% of their patients receiving IV magnesium were discharged home.6 Their practice was generally limited to using IV magnesium in children with impending respiratory failure for the purpose of reducing intensive care unit (ICU) admission and not hospitalization.6 PEM physicians’ reluctance to use IV magnesium was related to the lack of strong available evidence supporting the impact of IV magnesium on outcomes, such as admission, and gaps in the literature about its dosing and safety profile.
The goal of this study was to assess the prevailing trends in IV magnesium use across US children’s hospitals and to assess the relationship of IV magnesium use to admission rate, length of stay (LOS), readmission rate, and ICU admission rate. We hypothesized that IV magnesium use might have increased following publication of studies demonstrating an association between IV magnesium use and fewer admissions.
METHODS
Study Design, Setting, and Participants
This is a retrospective cohort study of asthma (All Patient Refined Diagnosis Related Group 141) hospitalizations for patients less than 18 years old presenting to 35 tertiary care children’s hospitals from January 1, 2010, to December 31, 2017, included in the Pediatric Health Information System (PHIS; Children’s Hospital Association, Lenexa, Kansas) database. The PHIS database is an administrative database that contains demographics, International Classification of Diseases 9th and 10th Revision diagnoses and procedures, and daily billing records for all inpatient, observation, ED, and ambulatory surgery encounters. All data were deidentified prior to inclusion in the database and tracking of patients across ED and inpatient visits was achieved through an encrypted and unique patient identifier. Children transferred from other hospitals were excluded because we could not verify IV magnesium use prior to transfer. For hospitals to be included, they were required to provide continuous data throughout the study period.
Main Outcome Measure
The main outcome was exposure to IV magnesium as determined by billing information available in the PHIS database.
Patient Demographics
We assessed patients’ demographic characteristics, including age (younger than 5 years, 5-11 years, and 12-17 years), sex, race/ethnicity, and insurance status.
Healthcare Utilization and Hospital Characteristics
We assessed healthcare utilization using geometric mean LOS, proportion of patients admitted to the hospital and to the ICU, and the proportion of patients with a 7-day all-cause readmission. In addition, we divided hospitals into three equal groups based on their annual inpatient asthma volume (<300, 300-850, >850 cases per year).
Statistical Analysis
We compared demographic and clinical characteristics across patients receiving IV magnesium with those who did not receive it with use of chi-square tests for categorical variables and Wilcoxon rank sum test for continuous variables. We calculated annual IV magnesium use rates for each hospital and modeled the average annual rate with a general linear model in order to assess change over time. We used Pearson product moment correlation to compare the annual proportion of magnesium use and healthcare utilization measures, including geometric mean LOS, the proportion of patients using the inpatient wards or the ICU, and the proportion of cases with a 7-day all-cause readmission. Geometric mean LOS was used to normalize the compounding effect of non–normally distributed arithmetic mean LOS. A sensitivity analysis was performed stratifying IV magnesium use over time by hospital inpatient volume. Data were analyzed using SAS version 9.4 (SAS Institute, Cary, North Carolina), and P values < .05 were considered statistically significant.
RESULTS
Study Population
A total of 878,188 encounters with acute asthma exacerbation met the inclusion criteria, with 65,558 (7.5%) receiving IV magnesium (Table). Of those receiving IV magnesium, 90% were admitted to the hospital. There were statistically significant differences in IV magnesium use when compared by age, race/ethnicity, and payer type, but not gender. IV magnesium use was significantly associated with older age (more than 5 years old), non-Hispanic black race, ED visit in the year prior to admission, longer hospital LOS, and higher ICU admission rate.

Trends in Intravenous Magnesium Use
IV magnesium use among hospitalized children more than doubled from 2010 to 2017 (17% vs 36%). Low-volume hospitals had a lower frequency of IV magnesium use, compared with the moderate- and high-volume hospitals. The growth rate per year of IV magnesium use was greater in high- and moderate-volume hospitals (3.4% and 2.9% per year, respectively), compared with the low-volume hospitals (1.2% per year; P = .04).
Trends in Intravenous Magnesium Use and Hospital Outcomes
The trend in IV magnesium use was not associated with a statistically significant change in the inpatient and ICU admission rate or in the 7-day all-cause readmission rate (Figure and Appendix Figure). Although IV magnesium use increased over time, LOS decreased significantly during the same period (1.6 days in 2010 vs 1.4 days in 2017; P < .001). When analyzed by hospital volume, no significant associations were found in the inpatient admission, ICU admission, and 7-day readmission rate.

DISCUSSION
The use of IV magnesium has significantly increased in US children’s hospitals over the last 8 years, especially among those hospitalized following an ED evaluation. Over this interval, trends in inpatient and ICU admission rate, as well as 7-day all-cause readmission rate, for asthma did not change, while LOS decreased. These findings contrast with a recent Cochrane review that summarized the efficacy of IV magnesium for reducing admission rate in few small trials.2
Our study findings are more consistent with prior survey findings that IV magnesium does not reduce hospitalization and that ED physicians tend to use IV magnesium in severe asthma exacerbation for its potential therapeutic benefits because of bronchodilator and anti-inflammatory effect.6,7 Similar to PEM physicians’ estimates, only 10% of patients receiving IV magnesium were discharged home in our study.
IV magnesium use is higher in high-volume hospitals than in moderate- and low-volume ones. One potential explanation is that high- and moderate-volume hospitals may see a higher volume of children with severe or impending respiratory failure and, therefore, are more likely to use IV magnesium than the low-volume hospitals are. Alternatively, physician adoption of magnesium use for lower-acuity asthma exacerbations could vary by hospital volume.
Trend analyses of outcomes suggest that increase in IV magnesium use was not associated with an increase in inpatient and ICU admission rate or with 7-day all-cause readmission rate, although LOS reduced. LOS might be reduced because of various quality improvement initiatives (eg, discharging patients after every 3 hours albuterol treatments or respiratory therapist–driven protocols) and might not be related to IV magnesium use.8,9 To this point, a recent study of a respiratory assessment score–matched cohort did not find any therapeutic benefit of IV magnesium with severe asthma exacerbation when receiving continuous albuterol therapy on a pediatric ward.5 Perhaps future studies could explore estimating the outcome by performing comparative effectiveness studies between those with severe asthma exacerbation who did or did not receive IV magnesium. Additionally, randomized controlled trials comparing IV magnesium and standard therapy and its effects on outcomes, such as hospitalization, LOS, association with asthma chronicity, and previous oral steroid use, might provide further insight to inform clinical practice.
Certain study limitations should be noted. The study cohort included children’s hospitals only, and it is possible that care at nonchildren’s hospitals for asthma differs. PHIS dataset used in this study does not allow determination of where and when IV magnesium was given, the severity of asthma exacerbation, or the chronicity of baseline disease. Moreover, PHIS hospitals include centers in large cities, and other competing children’s hospitals may provide other tertiary care that could affect the readmission data calculation. Lastly, the temporal associations between IV magnesium use and outcomes reported in this study should not be used as evidence or lack of evidence for the effectiveness of magnesium given the limitations of the observational study design and dataset used.
In conclusion, IV magnesium use in management of asthma exacerbation in children across the United States has significantly increased. The increase occurred disproportionately in high-volume hospitals and was not associated with changes in admission rate, ICU admission rate, or 7-day all-cause readmission rate, although LOS has decreased over time.
Disclosures
The authors have no financial relationships relevant to this article or conflicts of interest to disclose.
This paper was a platform presentation at annual meetings of Pediatric Academic Societies 2019; accepted for presentation at annual meeting of Pediatric Hospital Medicine, July 2019.
Funding Source
No funding was secured for this study.
1. National Asthma Education and Prevention Program, Third Expert Panel on the Diagnosis and Management of Asthma. Expert Panel Report 3: Guidelines for the Diagnosis and Management of Asthma. Bethesda, Maryland: National Heart, Lung, and Blood Institute; 2007. https://www.ncbi.nlm.nih.gov/books/NBK7232/.
2. Griffiths B, Kew KM. Intravenous magnesium sulfate for treating children with acute asthma in the emergency department. Cochrane Database Syst Rev. 2016;4(4):CD011050. https://doi.org/10.1002/14651858.CD011050.pub2.
3. Shan Z, Rong Y, Yang W, et al. Intravenous and nebulized magnesium sulfate for treating acute asthma in adults and children: a systematic review and meta-analysis. Respir Med. 2013;107(3):321-330. https://doi.org/10.1016/j.med.2012.12.001.
4. Rower J, Liu X, Yu T, Mundorff M, Sherwin C, Johnson M. Clinical pharmacokinetics of magnesium sulfate in treatment of children with severe acute asthma. Eur J Clin Pharmacol. 2017;73(3):325-331. https://doi.org/10.1007/s00228-016-2165-3.
5. Desanti R, Agasthya N, Hunter K, Hussain M. The effectiveness of magnesium sulfate for status asthmaticus outside intensive care unit. Pediatric Pulmonol. 2018;53(7):866-871. https://doi.org/10.1002/ppul.24013.Epub 2018.
6. Schuh S, Macias C, Freedman S, et al. North American practice patterns of intravenous magnesium sulfate in severe acute asthma exacerbations. Acad Emerg Med. 2010;17(11):1189-1196. https://doi.org/10.1111/j.1553-2712.2010.00913.x.
7. Cheuk DK, Chau TC, Lee SL. A meta-analysis on intravenous magnesium sulphate for treating acute asthma. Arch Dis Child. 2005;90(1):74-77. https://doi.org/10.1136/adc.2004.050005.
8. Lo HY, Messer A, Loveless J, et al. Discharging asthma patients on 3-hour β-agonist treatments: a quality improvement project. Hosp Pediatr. 2018;8(12):733-739. https://doi.org/10.1542/hpeds.2018-0072.
9. Magruder TG, Narayanan S, Walley S, et al. Improving inpatient asthma management: the implementation and evaluation of pediatric asthma clinical pathway. Pediatr Qual Saf. 2017;2(5);e041. https://doi.org/10.1097/pq9.0000000000000041.
For severe asthma exacerbations unresponsive to initial treatment, expert consensus guidelines from 2007 recommend consideration for adjunct treatments (magnesium or heliox) to decrease the likelihood of intubation.1 Over the last decade, data have emerged suggesting that intravenous (IV) magnesium may be more effective for reduction of hospital admission rates.2 Pooled meta-analyses have demonstrated improved pulmonary function and reduction of hospital admission by as much as 68% in children when IV magnesium is administered in the emergency department (ED), although the evidence is extremely limited because of a small number of studies (three) and small sample size (115 children).2-5
Though these data suggest that use of IV magnesium may reduce admission rates, a study of pediatric emergency medicine (PEM) physicians in US and Canada reported reluctance regarding use for this purpose. While PEM physicians reported awareness of the literature on admission prevention, they estimated that fewer than 5% of their patients receiving IV magnesium were discharged home.6 Their practice was generally limited to using IV magnesium in children with impending respiratory failure for the purpose of reducing intensive care unit (ICU) admission and not hospitalization.6 PEM physicians’ reluctance to use IV magnesium was related to the lack of strong available evidence supporting the impact of IV magnesium on outcomes, such as admission, and gaps in the literature about its dosing and safety profile.
The goal of this study was to assess the prevailing trends in IV magnesium use across US children’s hospitals and to assess the relationship of IV magnesium use to admission rate, length of stay (LOS), readmission rate, and ICU admission rate. We hypothesized that IV magnesium use might have increased following publication of studies demonstrating an association between IV magnesium use and fewer admissions.
METHODS
Study Design, Setting, and Participants
This is a retrospective cohort study of asthma (All Patient Refined Diagnosis Related Group 141) hospitalizations for patients less than 18 years old presenting to 35 tertiary care children’s hospitals from January 1, 2010, to December 31, 2017, included in the Pediatric Health Information System (PHIS; Children’s Hospital Association, Lenexa, Kansas) database. The PHIS database is an administrative database that contains demographics, International Classification of Diseases 9th and 10th Revision diagnoses and procedures, and daily billing records for all inpatient, observation, ED, and ambulatory surgery encounters. All data were deidentified prior to inclusion in the database and tracking of patients across ED and inpatient visits was achieved through an encrypted and unique patient identifier. Children transferred from other hospitals were excluded because we could not verify IV magnesium use prior to transfer. For hospitals to be included, they were required to provide continuous data throughout the study period.
Main Outcome Measure
The main outcome was exposure to IV magnesium as determined by billing information available in the PHIS database.
Patient Demographics
We assessed patients’ demographic characteristics, including age (younger than 5 years, 5-11 years, and 12-17 years), sex, race/ethnicity, and insurance status.
Healthcare Utilization and Hospital Characteristics
We assessed healthcare utilization using geometric mean LOS, proportion of patients admitted to the hospital and to the ICU, and the proportion of patients with a 7-day all-cause readmission. In addition, we divided hospitals into three equal groups based on their annual inpatient asthma volume (<300, 300-850, >850 cases per year).
Statistical Analysis
We compared demographic and clinical characteristics across patients receiving IV magnesium with those who did not receive it with use of chi-square tests for categorical variables and Wilcoxon rank sum test for continuous variables. We calculated annual IV magnesium use rates for each hospital and modeled the average annual rate with a general linear model in order to assess change over time. We used Pearson product moment correlation to compare the annual proportion of magnesium use and healthcare utilization measures, including geometric mean LOS, the proportion of patients using the inpatient wards or the ICU, and the proportion of cases with a 7-day all-cause readmission. Geometric mean LOS was used to normalize the compounding effect of non–normally distributed arithmetic mean LOS. A sensitivity analysis was performed stratifying IV magnesium use over time by hospital inpatient volume. Data were analyzed using SAS version 9.4 (SAS Institute, Cary, North Carolina), and P values < .05 were considered statistically significant.
RESULTS
Study Population
A total of 878,188 encounters with acute asthma exacerbation met the inclusion criteria, with 65,558 (7.5%) receiving IV magnesium (Table). Of those receiving IV magnesium, 90% were admitted to the hospital. There were statistically significant differences in IV magnesium use when compared by age, race/ethnicity, and payer type, but not gender. IV magnesium use was significantly associated with older age (more than 5 years old), non-Hispanic black race, ED visit in the year prior to admission, longer hospital LOS, and higher ICU admission rate.
Trends in Intravenous Magnesium Use
IV magnesium use among hospitalized children more than doubled from 2010 to 2017 (17% vs 36%). Low-volume hospitals had a lower frequency of IV magnesium use, compared with the moderate- and high-volume hospitals. The growth rate per year of IV magnesium use was greater in high- and moderate-volume hospitals (3.4% and 2.9% per year, respectively), compared with the low-volume hospitals (1.2% per year; P = .04).
Trends in Intravenous Magnesium Use and Hospital Outcomes
The trend in IV magnesium use was not associated with a statistically significant change in the inpatient and ICU admission rate or in the 7-day all-cause readmission rate (Figure and Appendix Figure). Although IV magnesium use increased over time, LOS decreased significantly during the same period (1.6 days in 2010 vs 1.4 days in 2017; P < .001). When analyzed by hospital volume, no significant associations were found in the inpatient admission, ICU admission, and 7-day readmission rate.
DISCUSSION
The use of IV magnesium has significantly increased in US children’s hospitals over the last 8 years, especially among those hospitalized following an ED evaluation. Over this interval, trends in inpatient and ICU admission rate, as well as 7-day all-cause readmission rate, for asthma did not change, while LOS decreased. These findings contrast with a recent Cochrane review that summarized the efficacy of IV magnesium for reducing admission rate in few small trials.2
Our study findings are more consistent with prior survey findings that IV magnesium does not reduce hospitalization and that ED physicians tend to use IV magnesium in severe asthma exacerbation for its potential therapeutic benefits because of bronchodilator and anti-inflammatory effect.6,7 Similar to PEM physicians’ estimates, only 10% of patients receiving IV magnesium were discharged home in our study.
IV magnesium use is higher in high-volume hospitals than in moderate- and low-volume ones. One potential explanation is that high- and moderate-volume hospitals may see a higher volume of children with severe or impending respiratory failure and, therefore, are more likely to use IV magnesium than the low-volume hospitals are. Alternatively, physician adoption of magnesium use for lower-acuity asthma exacerbations could vary by hospital volume.
Trend analyses of outcomes suggest that increase in IV magnesium use was not associated with an increase in inpatient and ICU admission rate or with 7-day all-cause readmission rate, although LOS reduced. LOS might be reduced because of various quality improvement initiatives (eg, discharging patients after every 3 hours albuterol treatments or respiratory therapist–driven protocols) and might not be related to IV magnesium use.8,9 To this point, a recent study of a respiratory assessment score–matched cohort did not find any therapeutic benefit of IV magnesium with severe asthma exacerbation when receiving continuous albuterol therapy on a pediatric ward.5 Perhaps future studies could explore estimating the outcome by performing comparative effectiveness studies between those with severe asthma exacerbation who did or did not receive IV magnesium. Additionally, randomized controlled trials comparing IV magnesium and standard therapy and its effects on outcomes, such as hospitalization, LOS, association with asthma chronicity, and previous oral steroid use, might provide further insight to inform clinical practice.
Certain study limitations should be noted. The study cohort included children’s hospitals only, and it is possible that care at nonchildren’s hospitals for asthma differs. PHIS dataset used in this study does not allow determination of where and when IV magnesium was given, the severity of asthma exacerbation, or the chronicity of baseline disease. Moreover, PHIS hospitals include centers in large cities, and other competing children’s hospitals may provide other tertiary care that could affect the readmission data calculation. Lastly, the temporal associations between IV magnesium use and outcomes reported in this study should not be used as evidence or lack of evidence for the effectiveness of magnesium given the limitations of the observational study design and dataset used.
In conclusion, IV magnesium use in management of asthma exacerbation in children across the United States has significantly increased. The increase occurred disproportionately in high-volume hospitals and was not associated with changes in admission rate, ICU admission rate, or 7-day all-cause readmission rate, although LOS has decreased over time.
Disclosures
The authors have no financial relationships relevant to this article or conflicts of interest to disclose.
This paper was a platform presentation at annual meetings of Pediatric Academic Societies 2019; accepted for presentation at annual meeting of Pediatric Hospital Medicine, July 2019.
Funding Source
No funding was secured for this study.
1. National Asthma Education and Prevention Program, Third Expert Panel on the Diagnosis and Management of Asthma. Expert Panel Report 3: Guidelines for the Diagnosis and Management of Asthma. Bethesda, Maryland: National Heart, Lung, and Blood Institute; 2007. https://www.ncbi.nlm.nih.gov/books/NBK7232/.
2. Griffiths B, Kew KM. Intravenous magnesium sulfate for treating children with acute asthma in the emergency department. Cochrane Database Syst Rev. 2016;4(4):CD011050. https://doi.org/10.1002/14651858.CD011050.pub2.
3. Shan Z, Rong Y, Yang W, et al. Intravenous and nebulized magnesium sulfate for treating acute asthma in adults and children: a systematic review and meta-analysis. Respir Med. 2013;107(3):321-330. https://doi.org/10.1016/j.med.2012.12.001.
4. Rower J, Liu X, Yu T, Mundorff M, Sherwin C, Johnson M. Clinical pharmacokinetics of magnesium sulfate in treatment of children with severe acute asthma. Eur J Clin Pharmacol. 2017;73(3):325-331. https://doi.org/10.1007/s00228-016-2165-3.
5. Desanti R, Agasthya N, Hunter K, Hussain M. The effectiveness of magnesium sulfate for status asthmaticus outside intensive care unit. Pediatric Pulmonol. 2018;53(7):866-871. https://doi.org/10.1002/ppul.24013.Epub 2018.
6. Schuh S, Macias C, Freedman S, et al. North American practice patterns of intravenous magnesium sulfate in severe acute asthma exacerbations. Acad Emerg Med. 2010;17(11):1189-1196. https://doi.org/10.1111/j.1553-2712.2010.00913.x.
7. Cheuk DK, Chau TC, Lee SL. A meta-analysis on intravenous magnesium sulphate for treating acute asthma. Arch Dis Child. 2005;90(1):74-77. https://doi.org/10.1136/adc.2004.050005.
8. Lo HY, Messer A, Loveless J, et al. Discharging asthma patients on 3-hour β-agonist treatments: a quality improvement project. Hosp Pediatr. 2018;8(12):733-739. https://doi.org/10.1542/hpeds.2018-0072.
9. Magruder TG, Narayanan S, Walley S, et al. Improving inpatient asthma management: the implementation and evaluation of pediatric asthma clinical pathway. Pediatr Qual Saf. 2017;2(5);e041. https://doi.org/10.1097/pq9.0000000000000041.
©2020 Society of Hospital Medicine
Communicating Effectively With Hospitalized Patients and Families During the COVID-19 Pandemic
For parents of children with medical complexity (CMC), bringing a child to the hospital for needed expertise, equipment, and support is necessarily accompanied by a loss of power, freedom, and control. Two of our authors (K.L., P.M.) are parents of CMC—patients affectionately known as “frequent flyers” at their local hospitals. When health needs present, these experienced parents quickly identify what can be managed at home and what needs a higher level of care. The autonomy and security that accompany this parental expertise have been mitigated by, and in some cases even lost in, the COVID-19 pandemic. In particular, one of the most obvious changes to patients’ and families’ roles in inpatient care has been in communication practices, including changes to patient- and family-centered rounding that result from current isolation procedures and visitation policies. Over the past few months, we’ve learned a tremendous amount from providers and caregivers of hospitalized patients; in this article, we share some of what they’ve taught us.
Before we continue, we take a humble pause. The process of writing this piece spanned weeks during which certain areas of the world were overwhelmed. Our perspective has been informed by others who shared their experiences, and as a result, our health systems are more prepared. We offer this perspective recognizing the importance of learning from others and feeling a sense of gratitude to the providers and patients on the front lines.
CHANGING CIRCUMSTANCES OF CARE
As a group of parents, nurses, physicians, educators, and researchers who have spent the last 10 years studying how to communicate more effectively in the healthcare setting,1,2 we find ourselves in uncharted territory. Even now, we are engaged in an ongoing mentored implementation program examining the effects of a communication bundle on patient- and family- centered rounds (PFCRs) at 21 teaching hospitals across North America (the SHM I-PASS SCORE Study).3 COVID-19 has put that study on hold, and we have taken a step back to reassess the most basic communication needs of patients and families under any circumstance.
Even among our study group, our family advisors have also been on the front lines as patients and caregivers. One author (P.M.), shared a recent experience that she and her son, John Michael had:
“My son [who has autoimmune hepatitis and associated conditions] began coughing and had an intense sinus headache. As his symptoms continued, our concern steadily grew: Could we push through at home or would we have to go in [to the hospital] to seek care? My mind raced. We faced this decision many times, but never with the overwhelming threat of COVID-19 in the equation. My son, who is able to recognize troublesome symptoms, was afraid his sinuses were infected and decided that we should go in. My heart sank.”
Now, amid the COVID-19 pandemic, we have heard that patients like John Michael, who are accustomed to the healthcare setting, are “terrified with this additional concern of just being safe in the hospital,” reported a member of our Family Advisory Council. One of our members added, “We recognize this extends to the providers as well, who maintain great care despite their own family and personal safety concerns.” Although families affirmed the necessity of the enhanced isolation procedures and strict visitation policies, they also highlighted the effects of these changes on usual communication practices, including PFCRs.
CORE VALUES DURING COVID-19
In response to these sentiments, we reached out to all of our family advisors, as well as other team members, for suggestions on how healthcare teams could help patients and families best manage their hospital experiences in the setting of COVID-19. Additionally, we asked our physician and nursing colleagues across health systems about current inpatient unit adaptations. Their suggestions and adaptations reinforced and directly aligned with some of the core values of family engagement and patient- and family-centered care,4 namely, (1) prioritizing communication, (2) maintaining active engagement with patients and families, and (3) enhancing communication with technology.
Prioritizing Communication
Timely and clear communication can help providers manage the expectations of patients and families, build patient and family feelings of confidence, and reduce their feelings of anxiety and vulnerability. Almost universally, families acknowledged the importance of infection control and physical distancing measures while fearing that decreased entry into rooms would lead to decreased communication. “Since COVID-19 is contagious, families will want to see every precaution taken … but in a way that doesn’t cut off communication and leave an already sick and scared child and their family feeling emotionally isolated in a scary situation,” an Advisory Council member recounted. Importantly, one parent shared that hearing about personal protective equipment conservation could amplify stress because of fear their child wouldn’t be protected. These perspectives remind us that families may be experiencing heightened sensitivity and vulnerability during this pandemic.
Maintaining Active Engagement With Patients and Families
PFCRs continue to be an ideal setting for providers, patients, and families to communicate and build shared understanding, as well as build rapport and connection through human interactions. Maintaining rounding structures, when possible, reinforces familiarity with roles and expectations, among both patients who have been hospitalized in the past and those hospitalized for the first time. Adapting rounds may be as simple as opening the door during walk-rounds to invite caregiver participation while being aware of distancing. With large rounding teams, more substantial workflow changes may be necessary.
Beyond PFCRs, patients and family members can be further engaged through tasks/responsibilities for the time in between rounding communication. Examples include recording patient symptoms (eg, work of breathing) or actions (eg, how much water their child drinks). By doing this, patients and caregivers who feel helpless and anxious may be given a greater sense of control while at the same time making helpful contributions to medical care.
Parents also expressed value in reinforcing the message that patients and families are experts about themselves/their loved ones. Healthcare teams can invite their insights, questions, and concerns to show respect for their expertise and value. This builds trust and leads to a feeling of togetherness and teamwork. Across the board, families stressed the value of family engagement and communication in ideal conditions, and even more so in this time of upheaval.
Enhancing Communication With Technology
Many hospitals are leveraging technology to promote communication by integrating workstations on wheels & tablets with video-conferencing software (eg, Zoom, Skype) and even by adding communication via email and phone. While fewer team members are entering rooms, rounding teams are still including the voices of pharmacists, nutritionists, social workers, primary care physicians, and caregivers who are unable to be at the bedside.
These alternative communication methods may actually provide patients with more comfortable avenues for participating in their own care even beyond the pandemic. Children, in particular, may have strong opinions about their care but may not be comfortable speaking up in front of providers whom they don’t know very well. Telehealth, whiteboards, email, and limiting the number of providers in the room might actually create a more approachable environment for these patients even under routine conditions.
CONCLUSION
Patients, families, nurses, physicians, and other team members all feel the current stress on our healthcare system. As we continue to change workflows, alignment with principles of family engagement and patient- and family-centered care4 remain a priority for all involved. Prioritizing effective communication, maintaining engagement with patients and families, and using technology in new ways will all help us maintain high standards of care in both typical and completely atypical settings, such as during this pandemic. Nothing captures the benefits of effective communication better than P.M.’s description of John Michael’s experience during his hospitalization:
“Although usually an expedited triage patient, we spent hours in the ER among other ill and anxious patients. Ultimately, John Michael tested positive for influenza A. We spent 5 days in the hospital on droplet protection.
“The staff was amazing! The doctors and nurses communicated with us every step of the way. They made us aware of extra precautions and explained limitations, like not being able to go in the nutrition room or only having the doctors come in once midday. Whenever they did use [personal protective equipment] and come in, the nurses and team kept a safe distance but made sure to connect with John Michael, talking about what was on TV, what his favorite teams are, asking about his sisters, and always asking if we needed anything or if there was anything they could do. I am grateful for the kind, compassionate, and professional people who continue to care for our children under the intense danger and overwhelming magnitude of COVID-19.”
Disclosures
Dr Landrigan has served as a paid consultant to the Midwest Lighting Institute to help study the effect of blue light on health care provider performance and safety. He has consulted with and holds equity in the I-PASS Institute, which seeks to train institutions in best handoff practices and aid in their implementation. Dr Landrigan has received consulting fees from the Missouri Hospital Association/Executive Speakers Bureau for consulting on I-PASS. In addition, he has received monetary awards, honoraria, and travel reimbursement from multiple academic and professional organizations for teaching and consulting on sleep deprivation, physician performance, handoffs, and safety and has served as an expert witness in cases regarding patient safety and sleep deprivation. Drs Spector and Baird have also consulted with and hold equity in the I-PASS Institute. Dr Baird has consulted with the I-PASS Patient Safety Institute. Dr Patel holds equity/stock options in and has consulted for the I-PASS Patient Safety Institute. Dr Rosenbluth previously consulted with the I-PASS Patient Safety Institute, but not within the past 36 months. The other authors have no conflicts of interest or external support other than the existing PCORI funding for the Society of Hospital Medicine I-PASS SCORE study.
Disclaimer
The I-PASS Patient Safety Institute did not provide support to any authors for this work.
1. Starmer AJ, Spector ND, Srivastava R, et al. Changes in medical errors after implementation of a handoff program. N Engl J Med. 2014;371(19):1803-1812. https://doi.org/10.1056/nejmsa1405556.
2. Khan A, Spector ND, Baird JD, et al. Patient safety after implementation of a coproduced family centered communication programme: multicenter before and after intervention study. BMJ. 2018;363:k4764. https://doi.org/10.1136/bmj.k4764.
3. Patient-Centered Outcomes Research Institute. Helping Children’s Hospitals Use a Program to Improve Communication with Families. December 27, 2019. https://www.pcori.org/research-results/2018/helping-childrens-hospitals-use-program-improve-communication-families. Accessed March 26, 2020.
4. Institute for Patient- and Family-Centered Care (IPFCC). PFCC and COVID-19. https://www.ipfcc.org/bestpractices/covid-19/index.html. Accessed April 10, 2020.
For parents of children with medical complexity (CMC), bringing a child to the hospital for needed expertise, equipment, and support is necessarily accompanied by a loss of power, freedom, and control. Two of our authors (K.L., P.M.) are parents of CMC—patients affectionately known as “frequent flyers” at their local hospitals. When health needs present, these experienced parents quickly identify what can be managed at home and what needs a higher level of care. The autonomy and security that accompany this parental expertise have been mitigated by, and in some cases even lost in, the COVID-19 pandemic. In particular, one of the most obvious changes to patients’ and families’ roles in inpatient care has been in communication practices, including changes to patient- and family-centered rounding that result from current isolation procedures and visitation policies. Over the past few months, we’ve learned a tremendous amount from providers and caregivers of hospitalized patients; in this article, we share some of what they’ve taught us.
Before we continue, we take a humble pause. The process of writing this piece spanned weeks during which certain areas of the world were overwhelmed. Our perspective has been informed by others who shared their experiences, and as a result, our health systems are more prepared. We offer this perspective recognizing the importance of learning from others and feeling a sense of gratitude to the providers and patients on the front lines.
CHANGING CIRCUMSTANCES OF CARE
As a group of parents, nurses, physicians, educators, and researchers who have spent the last 10 years studying how to communicate more effectively in the healthcare setting,1,2 we find ourselves in uncharted territory. Even now, we are engaged in an ongoing mentored implementation program examining the effects of a communication bundle on patient- and family- centered rounds (PFCRs) at 21 teaching hospitals across North America (the SHM I-PASS SCORE Study).3 COVID-19 has put that study on hold, and we have taken a step back to reassess the most basic communication needs of patients and families under any circumstance.
Even among our study group, our family advisors have also been on the front lines as patients and caregivers. One author (P.M.), shared a recent experience that she and her son, John Michael had:
“My son [who has autoimmune hepatitis and associated conditions] began coughing and had an intense sinus headache. As his symptoms continued, our concern steadily grew: Could we push through at home or would we have to go in [to the hospital] to seek care? My mind raced. We faced this decision many times, but never with the overwhelming threat of COVID-19 in the equation. My son, who is able to recognize troublesome symptoms, was afraid his sinuses were infected and decided that we should go in. My heart sank.”
Now, amid the COVID-19 pandemic, we have heard that patients like John Michael, who are accustomed to the healthcare setting, are “terrified with this additional concern of just being safe in the hospital,” reported a member of our Family Advisory Council. One of our members added, “We recognize this extends to the providers as well, who maintain great care despite their own family and personal safety concerns.” Although families affirmed the necessity of the enhanced isolation procedures and strict visitation policies, they also highlighted the effects of these changes on usual communication practices, including PFCRs.
CORE VALUES DURING COVID-19
In response to these sentiments, we reached out to all of our family advisors, as well as other team members, for suggestions on how healthcare teams could help patients and families best manage their hospital experiences in the setting of COVID-19. Additionally, we asked our physician and nursing colleagues across health systems about current inpatient unit adaptations. Their suggestions and adaptations reinforced and directly aligned with some of the core values of family engagement and patient- and family-centered care,4 namely, (1) prioritizing communication, (2) maintaining active engagement with patients and families, and (3) enhancing communication with technology.
Prioritizing Communication
Timely and clear communication can help providers manage the expectations of patients and families, build patient and family feelings of confidence, and reduce their feelings of anxiety and vulnerability. Almost universally, families acknowledged the importance of infection control and physical distancing measures while fearing that decreased entry into rooms would lead to decreased communication. “Since COVID-19 is contagious, families will want to see every precaution taken … but in a way that doesn’t cut off communication and leave an already sick and scared child and their family feeling emotionally isolated in a scary situation,” an Advisory Council member recounted. Importantly, one parent shared that hearing about personal protective equipment conservation could amplify stress because of fear their child wouldn’t be protected. These perspectives remind us that families may be experiencing heightened sensitivity and vulnerability during this pandemic.
Maintaining Active Engagement With Patients and Families
PFCRs continue to be an ideal setting for providers, patients, and families to communicate and build shared understanding, as well as build rapport and connection through human interactions. Maintaining rounding structures, when possible, reinforces familiarity with roles and expectations, among both patients who have been hospitalized in the past and those hospitalized for the first time. Adapting rounds may be as simple as opening the door during walk-rounds to invite caregiver participation while being aware of distancing. With large rounding teams, more substantial workflow changes may be necessary.
Beyond PFCRs, patients and family members can be further engaged through tasks/responsibilities for the time in between rounding communication. Examples include recording patient symptoms (eg, work of breathing) or actions (eg, how much water their child drinks). By doing this, patients and caregivers who feel helpless and anxious may be given a greater sense of control while at the same time making helpful contributions to medical care.
Parents also expressed value in reinforcing the message that patients and families are experts about themselves/their loved ones. Healthcare teams can invite their insights, questions, and concerns to show respect for their expertise and value. This builds trust and leads to a feeling of togetherness and teamwork. Across the board, families stressed the value of family engagement and communication in ideal conditions, and even more so in this time of upheaval.
Enhancing Communication With Technology
Many hospitals are leveraging technology to promote communication by integrating workstations on wheels & tablets with video-conferencing software (eg, Zoom, Skype) and even by adding communication via email and phone. While fewer team members are entering rooms, rounding teams are still including the voices of pharmacists, nutritionists, social workers, primary care physicians, and caregivers who are unable to be at the bedside.
These alternative communication methods may actually provide patients with more comfortable avenues for participating in their own care even beyond the pandemic. Children, in particular, may have strong opinions about their care but may not be comfortable speaking up in front of providers whom they don’t know very well. Telehealth, whiteboards, email, and limiting the number of providers in the room might actually create a more approachable environment for these patients even under routine conditions.
CONCLUSION
Patients, families, nurses, physicians, and other team members all feel the current stress on our healthcare system. As we continue to change workflows, alignment with principles of family engagement and patient- and family-centered care4 remain a priority for all involved. Prioritizing effective communication, maintaining engagement with patients and families, and using technology in new ways will all help us maintain high standards of care in both typical and completely atypical settings, such as during this pandemic. Nothing captures the benefits of effective communication better than P.M.’s description of John Michael’s experience during his hospitalization:
“Although usually an expedited triage patient, we spent hours in the ER among other ill and anxious patients. Ultimately, John Michael tested positive for influenza A. We spent 5 days in the hospital on droplet protection.
“The staff was amazing! The doctors and nurses communicated with us every step of the way. They made us aware of extra precautions and explained limitations, like not being able to go in the nutrition room or only having the doctors come in once midday. Whenever they did use [personal protective equipment] and come in, the nurses and team kept a safe distance but made sure to connect with John Michael, talking about what was on TV, what his favorite teams are, asking about his sisters, and always asking if we needed anything or if there was anything they could do. I am grateful for the kind, compassionate, and professional people who continue to care for our children under the intense danger and overwhelming magnitude of COVID-19.”
Disclosures
Dr Landrigan has served as a paid consultant to the Midwest Lighting Institute to help study the effect of blue light on health care provider performance and safety. He has consulted with and holds equity in the I-PASS Institute, which seeks to train institutions in best handoff practices and aid in their implementation. Dr Landrigan has received consulting fees from the Missouri Hospital Association/Executive Speakers Bureau for consulting on I-PASS. In addition, he has received monetary awards, honoraria, and travel reimbursement from multiple academic and professional organizations for teaching and consulting on sleep deprivation, physician performance, handoffs, and safety and has served as an expert witness in cases regarding patient safety and sleep deprivation. Drs Spector and Baird have also consulted with and hold equity in the I-PASS Institute. Dr Baird has consulted with the I-PASS Patient Safety Institute. Dr Patel holds equity/stock options in and has consulted for the I-PASS Patient Safety Institute. Dr Rosenbluth previously consulted with the I-PASS Patient Safety Institute, but not within the past 36 months. The other authors have no conflicts of interest or external support other than the existing PCORI funding for the Society of Hospital Medicine I-PASS SCORE study.
Disclaimer
The I-PASS Patient Safety Institute did not provide support to any authors for this work.
1. Starmer AJ, Spector ND, Srivastava R, et al. Changes in medical errors after implementation of a handoff program. N Engl J Med. 2014;371(19):1803-1812. https://doi.org/10.1056/nejmsa1405556.
2. Khan A, Spector ND, Baird JD, et al. Patient safety after implementation of a coproduced family centered communication programme: multicenter before and after intervention study. BMJ. 2018;363:k4764. https://doi.org/10.1136/bmj.k4764.
3. Patient-Centered Outcomes Research Institute. Helping Children’s Hospitals Use a Program to Improve Communication with Families. December 27, 2019. https://www.pcori.org/research-results/2018/helping-childrens-hospitals-use-program-improve-communication-families. Accessed March 26, 2020.
4. Institute for Patient- and Family-Centered Care (IPFCC). PFCC and COVID-19. https://www.ipfcc.org/bestpractices/covid-19/index.html. Accessed April 10, 2020.
© 2020 Society of Hospital Medicine