User login
An On-Treatment Analysis of the MARQUIS Study: Interventions to Improve Inpatient Medication Reconciliation
Unintentional medication discrepancies in the hospital setting are common and contribute to adverse drug events, resulting in patient harm.1 Discrepancies can be resolved by implementing high-quality medication reconciliation, but there are insufficient data to guide hospitals as to which interventions are most effective at improving medication reconciliation processes and reducing harm.2 We recently reported that implementation of a best practices toolkit reduced total medication discrepancies in the Multi-Center Medication Reconciliation Quality Improvement Study (MARQUIS).3 This report describes the effect of individual toolkit components on rates of medication discrepancies with the potential for patient harm.
METHODS
Detailed descriptions of the intervention toolkit and study design of MARQUIS are published.4,5 Briefly, MARQUIS was a pragmatic, mentored, quality improvement (QI) study in which five hospitals in the United States implemented interventions from a best practices toolkit to improve medication reconciliation on noncritical care medical and surgical units from September 2011 to July 2014. We used a mentored implementation approach, in which each site identified the leaders of their local quality improvement team (ie, mentees) who received mentorship from a trained physician with QI and medication safety experience.6 Mentors conducted monthly calls with their mentees and two site visits. Sites adapted and implemented one or more components from the MARQUIS toolkit, a compilation of evidence-based best practices in medication reconciliation.5,7
The primary outcome was unintentional medication discrepancies in admission and discharge orders with the potential for causing harm, as previously described.4 Trained study pharmacists at each site took “gold standard” medication histories on a random sample of up to 22 patients per month. These medications were then compared with admission and discharge medication orders, and all unintentional discrepancies were identified. The discrepancies were then adjudicated by physicians blinded to the treatment arm, who confirmed whether discrepancies were unintentional and carried the potential for patient harm.
We employed a modification of a stepped wedge methodology to measure the incremental effect of implementing nine different intervention components, introduced at different sites over the course of the study, on the number of potentially harmful discrepancies per patient. These analyses were restricted to the postimplementation period on hospital units that implemented at least one intervention. All interventions conducted at each site were categorized by component, including dates of implementation. Each intervention component could be applied more than once per site (eg, when involving a new group of providers) or implemented on a new hospital unit or service, in which case, all dates were included in the analysis. We conducted a multivariable Poisson regression (with time divided into months) adjusted for patient factors, season, and site, with the number of potentially harmful discrepancies as the dependent variable, and the total number of gold standard medications as a model offset. The model was designed to analyze changes in the y-intercept each time an intervention component was either implemented or spread and assumed the change in the y-intercept was the same for each of these events for any given component. The model also assumes that combinations of interventions had independent additive effects.
RESULTS
Across the five participating sites, 1,648 patients were enrolled from September 2011 to July 2014. This number included 613 patients during the preimplementation period and 1,035 patients during the postimplementation period, of which 791 were on intervention units and comprised the study population. Table 1 displays the intervention components implemented by site. Sites implemented between one and seven components. The most frequently implemented intervention component was training existing staff to take the best possible medication histories (BPMHs), implemented at four sites. The regression results are displayed in Table 2. Three interventions were associated with significant decreases in potentially harmful discrepancy rates: (1) clearly defining roles and responsibilities and communicating this with clinical staff (hazard ratio [HR] 0.53, 95% CI: 0.32–0.87); (2) training existing staff to perform discharge medication reconciliation and patient counseling (HR 0.64, 95% CI: 0.46–0.89); and (3) hiring additional staff to perform discharge medication reconciliation and patient counseling (HR 0.48, 95% CI: 0.31–0.77). Two interventions were associated with significant increases in potentially harmful discrepancy rates: training existing staff to take BPMHs (HR 1.38, 95% CI: 1.21–1.57) and implementing a new electronic health record (EHR; HR 2.21, 95% CI: 1.64–2.97).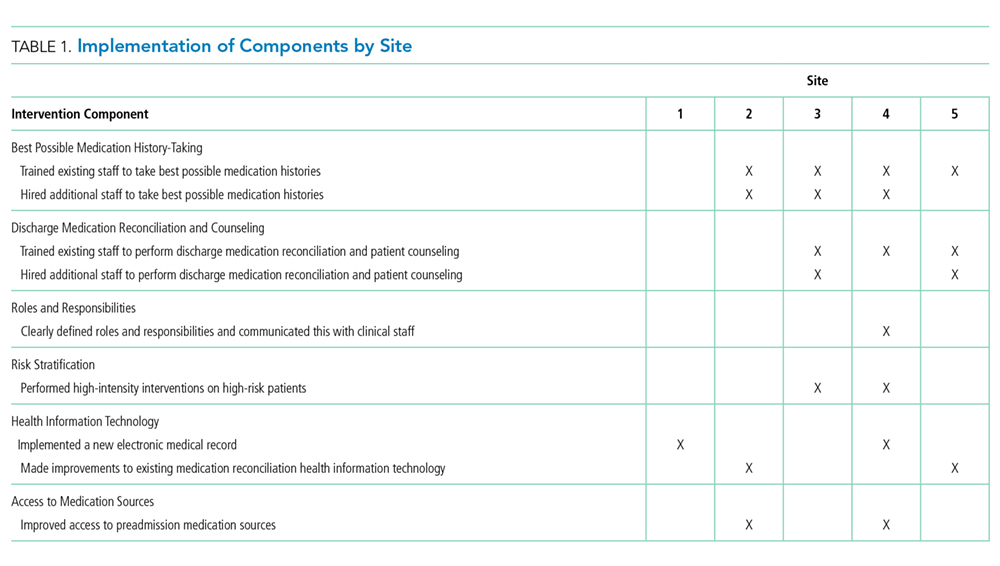
DISCUSSION
We noted that three intervention components were associated with decreased rates of unintentional medication discrepancies with potential for harm, whereas two were associated with increased rates. The components with a beneficial effect were not surprising. A prior qualitative study demonstrated the confusion related to clinicians’ roles and responsibilities during medication reconciliation; therefore, clear delineations should reduce rework and improve the medication reconciliation process.8 Other studies have shown the benefits of pharmacist involvement in the inpatient setting, particularly in reducing errors at discharge.9 However, we did not anticipate that training staff to take BPMHs would be detrimental. Possible reasons for this finding that are based on direct observations by mentors at site visits or noted during monthly calls include (1) training personnel on this task without certification of competency may not sufficiently improve their skills, leading instead to diffusion of responsibility; (2) training personnel without sufficient time to perform the task well (eg, frontline nurses with many other responsibilities) may be counterproductive compared with training a few personnel with time dedicated to this task; and (3) training existing personnel in history-taking may have been used to delay the necessary hiring of more staff to take BPMHs. Future studies could address several of these shortcomings in both the design and implementation of medication history-training intervention components.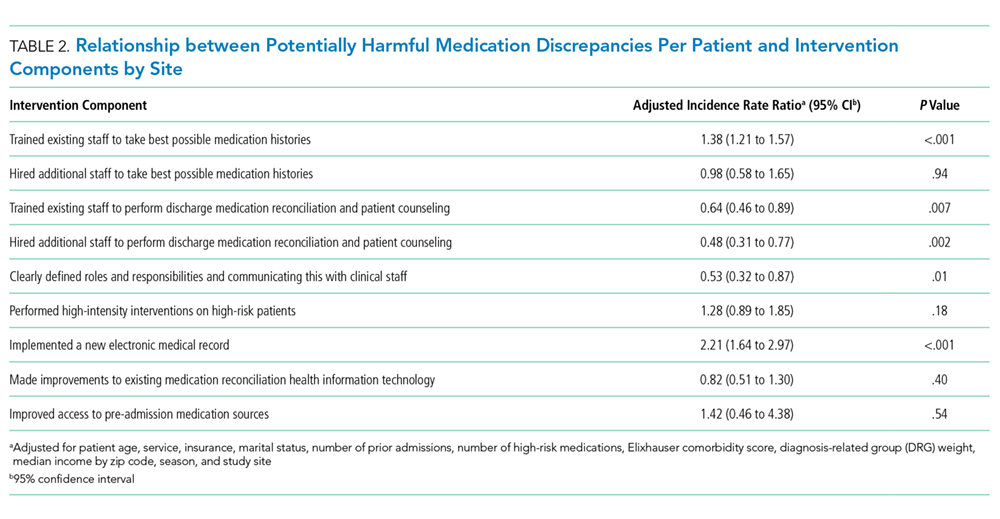
Several reasons may explain the association we found between implementing a new EHR and increased rates of discrepancies. Based on mentors’ experiences, we suspect it is because sitewide EHR implementation requires significant resources, time, and effort. Therefore, sitewide EHR implementation pulls attention away from a focus on medication safety
Our study has several limitations. We conducted an on-treatment analysis, which may be confounded by characteristics of sites that chose to implement different intervention components; however, we adjusted for sites in the analysis. Some results are based on a limited number of sites implementing an intervention component (eg, defining roles and responsibilities). Although this was a longitudinal study, and we adjusted for seasonal effects, it is possible that temporal trends and cointerventions confounded our results. The adjudication of discrepancies for the potential for harm was somewhat subjective, although we used a rigorous process to ensure the reliability of adjudication, as in prior studies.3,14 As in the main analysis of the MARQUIS study, this analysis did not measure intervention fidelity.
Based on these analyses and the literature base, we recommend that hospitals focus first on hiring and training dedicated staff (usually pharmacists) to assist with medication reconciliation at discharge.7 Hospitals should also be aware of potential increases in medication discrepancies when implementing a large vendor EHR across their institution. Further work is needed on the best ways to mitigate these adverse effects, at both the design and local site levels. Finally, the effect of medication history training on discrepancies warrants further study.
Disclosures
SK has served as a consultant to Verustat, a remote health monitoring company. All other authors have no disclosures or conflicts of interests.
Funding
This study was supported by the Agency for Healthcare Research and Quality (grant number: R18 HS019598). JLS has received funding from (1) Mallinckrodt Pharmaceuticals for an investigator-initiated study of opioid-related adverse drug events in postsurgical patients; (2) Horizon Blue Cross Blue Shield for an honorarium and travel expenses for workshop on medication reconciliation; (3) Island Peer Review Organization for honorarium and travel expenses for workshop on medication reconciliation; and, (4) Portola Pharmaceuticals for investigator-initiated study of inpatients who decline subcutaneous medications for venous thromboembolism prophylaxis. ASM was funded by a VA HSR&D Career Development Award (12-168).
Trial Registration
ClinicalTrials.gov NCT01337063
1. Cornish PL, Knowles SR, Marchesano R, et al. Unintended medication discrepancies at the time of hospital admission. Arch Intern Med. 2005;165(4):424-429. https://doi.org/10.1001/archinte.165.4.424.
2. Kaboli PJ, Fernandes O. Medication reconciliation: moving forward. Arch Intern Med. 2012;172(14):1069-1070. https://doi.org/10.1001/archinternmed.2012.2667. PubMed
3. Schnipper JL, Mixon A, Stein J, et al. Effects of a multifaceted medication reconciliation quality improvement intervention on patient safety: final results of the MARQUIS study. BMJ Qual Saf. 2018;27(12):954-964. https://doi.org/10.1136/bmjqs-2018-008233.
4. Salanitro AH, Kripalani S, Resnic J, et al. Rational and design of the Multicenter Medication Reconciliation Quality Improvement Study (MARQUIS). BMC Health Serv Res. 2013;13:230. https://doi.org/10.1186/1472-6963-13-230.
5. Mueller SK, Kripalani S, Stein J, et al. Development of a toolkit to disseminate best practices in inpatient medication reconciliation. Jt Comm J Qual Patient Saf. 2013;39(8):371-382. https://10.1016/S1553-7250(13)39051-5.
6. Maynard GA, Budnitz TL, Nickel WK, et al. 2011 John M. Eisenberg patient safety and quality awards. Mentored implementation: building leaders and achieving results through a collaborative improvement model. Innovation in patient safety and quality at the national level. Jt Comm J Qual Patient Saf. 2012;38(7):301-310. https://doi.org/10.1016/S1553-7250(12)38040-9.
7. Mueller SK, Sponsler KC, Kripalani S, Schnipper JL. Hospital-based medication reconciliation practices: a systematic review. Arch Intern Med. 2012;172(14):1057-1069. https://doi.org/10.1001/archinternmed.2012.2246.
8. Vogelsmeier A, Pepper GA, Oderda L, Weir C. Medication reconciliation: a qualitative analysis of clinicians’ perceptions. Res Social Adm Pharm. 2013;9(4):419-430. https://doi.org/10.1016/j.sapharm.2012.08.002.
9. Kaboli PJ, Hoth AB, McClimon BJ, Schnipper JL. Clinical pharmacists and inpatient medical care: a systematic review. Arch Intern Med. 2006;166(9):955-964. https://doi.org/10.1001/archinte.166.9.955.
10. Plaisant C, Wu J, Hettinger AZ, Powsner S, Shneiderman B. Novel user interface design for medication reconciliation: an evaluation of Twinlist. J Am Med Inform Assoc. 2015;22(2):340-349. https://doi.org/10.1093/jamia/ocu021.
11. Bassi J, Lau F, Bardal S. Use of information technology in medication reconciliation: a scoping review. Ann Pharmacother. 2010;44(5):885-897. https://doi.org/10.1345/aph.1M699.
12. Marien S, Krug B, Spinewine A. Electronic tools to support medication reconciliation: a systematic review. J Am Med Inform Assoc. 2017;24(1):227-240. https://doi.org/10.1093/jamia/ocw068.
13. Agrawal A. Medication errors: prevention using information technology systems. Br J Clin Pharmacol. 2009;67(6):681-686. https://doi.org/10.1111/j.1365-2125.2009.03427.x.
14. Pippins JR, Gandhi TK, Hamann C, et al. Classifying and predicting errors of inpatient medication reconciliation. J Gen Intern Med. 2008;23(9):1414-1422. https://doi.org/10.1007/s11606-008-0687-9.
Unintentional medication discrepancies in the hospital setting are common and contribute to adverse drug events, resulting in patient harm.1 Discrepancies can be resolved by implementing high-quality medication reconciliation, but there are insufficient data to guide hospitals as to which interventions are most effective at improving medication reconciliation processes and reducing harm.2 We recently reported that implementation of a best practices toolkit reduced total medication discrepancies in the Multi-Center Medication Reconciliation Quality Improvement Study (MARQUIS).3 This report describes the effect of individual toolkit components on rates of medication discrepancies with the potential for patient harm.
METHODS
Detailed descriptions of the intervention toolkit and study design of MARQUIS are published.4,5 Briefly, MARQUIS was a pragmatic, mentored, quality improvement (QI) study in which five hospitals in the United States implemented interventions from a best practices toolkit to improve medication reconciliation on noncritical care medical and surgical units from September 2011 to July 2014. We used a mentored implementation approach, in which each site identified the leaders of their local quality improvement team (ie, mentees) who received mentorship from a trained physician with QI and medication safety experience.6 Mentors conducted monthly calls with their mentees and two site visits. Sites adapted and implemented one or more components from the MARQUIS toolkit, a compilation of evidence-based best practices in medication reconciliation.5,7
The primary outcome was unintentional medication discrepancies in admission and discharge orders with the potential for causing harm, as previously described.4 Trained study pharmacists at each site took “gold standard” medication histories on a random sample of up to 22 patients per month. These medications were then compared with admission and discharge medication orders, and all unintentional discrepancies were identified. The discrepancies were then adjudicated by physicians blinded to the treatment arm, who confirmed whether discrepancies were unintentional and carried the potential for patient harm.
We employed a modification of a stepped wedge methodology to measure the incremental effect of implementing nine different intervention components, introduced at different sites over the course of the study, on the number of potentially harmful discrepancies per patient. These analyses were restricted to the postimplementation period on hospital units that implemented at least one intervention. All interventions conducted at each site were categorized by component, including dates of implementation. Each intervention component could be applied more than once per site (eg, when involving a new group of providers) or implemented on a new hospital unit or service, in which case, all dates were included in the analysis. We conducted a multivariable Poisson regression (with time divided into months) adjusted for patient factors, season, and site, with the number of potentially harmful discrepancies as the dependent variable, and the total number of gold standard medications as a model offset. The model was designed to analyze changes in the y-intercept each time an intervention component was either implemented or spread and assumed the change in the y-intercept was the same for each of these events for any given component. The model also assumes that combinations of interventions had independent additive effects.
RESULTS
Across the five participating sites, 1,648 patients were enrolled from September 2011 to July 2014. This number included 613 patients during the preimplementation period and 1,035 patients during the postimplementation period, of which 791 were on intervention units and comprised the study population. Table 1 displays the intervention components implemented by site. Sites implemented between one and seven components. The most frequently implemented intervention component was training existing staff to take the best possible medication histories (BPMHs), implemented at four sites. The regression results are displayed in Table 2. Three interventions were associated with significant decreases in potentially harmful discrepancy rates: (1) clearly defining roles and responsibilities and communicating this with clinical staff (hazard ratio [HR] 0.53, 95% CI: 0.32–0.87); (2) training existing staff to perform discharge medication reconciliation and patient counseling (HR 0.64, 95% CI: 0.46–0.89); and (3) hiring additional staff to perform discharge medication reconciliation and patient counseling (HR 0.48, 95% CI: 0.31–0.77). Two interventions were associated with significant increases in potentially harmful discrepancy rates: training existing staff to take BPMHs (HR 1.38, 95% CI: 1.21–1.57) and implementing a new electronic health record (EHR; HR 2.21, 95% CI: 1.64–2.97).
DISCUSSION
We noted that three intervention components were associated with decreased rates of unintentional medication discrepancies with potential for harm, whereas two were associated with increased rates. The components with a beneficial effect were not surprising. A prior qualitative study demonstrated the confusion related to clinicians’ roles and responsibilities during medication reconciliation; therefore, clear delineations should reduce rework and improve the medication reconciliation process.8 Other studies have shown the benefits of pharmacist involvement in the inpatient setting, particularly in reducing errors at discharge.9 However, we did not anticipate that training staff to take BPMHs would be detrimental. Possible reasons for this finding that are based on direct observations by mentors at site visits or noted during monthly calls include (1) training personnel on this task without certification of competency may not sufficiently improve their skills, leading instead to diffusion of responsibility; (2) training personnel without sufficient time to perform the task well (eg, frontline nurses with many other responsibilities) may be counterproductive compared with training a few personnel with time dedicated to this task; and (3) training existing personnel in history-taking may have been used to delay the necessary hiring of more staff to take BPMHs. Future studies could address several of these shortcomings in both the design and implementation of medication history-training intervention components.
Several reasons may explain the association we found between implementing a new EHR and increased rates of discrepancies. Based on mentors’ experiences, we suspect it is because sitewide EHR implementation requires significant resources, time, and effort. Therefore, sitewide EHR implementation pulls attention away from a focus on medication safety
Our study has several limitations. We conducted an on-treatment analysis, which may be confounded by characteristics of sites that chose to implement different intervention components; however, we adjusted for sites in the analysis. Some results are based on a limited number of sites implementing an intervention component (eg, defining roles and responsibilities). Although this was a longitudinal study, and we adjusted for seasonal effects, it is possible that temporal trends and cointerventions confounded our results. The adjudication of discrepancies for the potential for harm was somewhat subjective, although we used a rigorous process to ensure the reliability of adjudication, as in prior studies.3,14 As in the main analysis of the MARQUIS study, this analysis did not measure intervention fidelity.
Based on these analyses and the literature base, we recommend that hospitals focus first on hiring and training dedicated staff (usually pharmacists) to assist with medication reconciliation at discharge.7 Hospitals should also be aware of potential increases in medication discrepancies when implementing a large vendor EHR across their institution. Further work is needed on the best ways to mitigate these adverse effects, at both the design and local site levels. Finally, the effect of medication history training on discrepancies warrants further study.
Disclosures
SK has served as a consultant to Verustat, a remote health monitoring company. All other authors have no disclosures or conflicts of interests.
Funding
This study was supported by the Agency for Healthcare Research and Quality (grant number: R18 HS019598). JLS has received funding from (1) Mallinckrodt Pharmaceuticals for an investigator-initiated study of opioid-related adverse drug events in postsurgical patients; (2) Horizon Blue Cross Blue Shield for an honorarium and travel expenses for workshop on medication reconciliation; (3) Island Peer Review Organization for honorarium and travel expenses for workshop on medication reconciliation; and, (4) Portola Pharmaceuticals for investigator-initiated study of inpatients who decline subcutaneous medications for venous thromboembolism prophylaxis. ASM was funded by a VA HSR&D Career Development Award (12-168).
Trial Registration
ClinicalTrials.gov NCT01337063
1. Cornish PL, Knowles SR, Marchesano R, et al. Unintended medication discrepancies at the time of hospital admission. Arch Intern Med. 2005;165(4):424-429. https://doi.org/10.1001/archinte.165.4.424.
2. Kaboli PJ, Fernandes O. Medication reconciliation: moving forward. Arch Intern Med. 2012;172(14):1069-1070. https://doi.org/10.1001/archinternmed.2012.2667. PubMed
3. Schnipper JL, Mixon A, Stein J, et al. Effects of a multifaceted medication reconciliation quality improvement intervention on patient safety: final results of the MARQUIS study. BMJ Qual Saf. 2018;27(12):954-964. https://doi.org/10.1136/bmjqs-2018-008233.
4. Salanitro AH, Kripalani S, Resnic J, et al. Rational and design of the Multicenter Medication Reconciliation Quality Improvement Study (MARQUIS). BMC Health Serv Res. 2013;13:230. https://doi.org/10.1186/1472-6963-13-230.
5. Mueller SK, Kripalani S, Stein J, et al. Development of a toolkit to disseminate best practices in inpatient medication reconciliation. Jt Comm J Qual Patient Saf. 2013;39(8):371-382. https://10.1016/S1553-7250(13)39051-5.
6. Maynard GA, Budnitz TL, Nickel WK, et al. 2011 John M. Eisenberg patient safety and quality awards. Mentored implementation: building leaders and achieving results through a collaborative improvement model. Innovation in patient safety and quality at the national level. Jt Comm J Qual Patient Saf. 2012;38(7):301-310. https://doi.org/10.1016/S1553-7250(12)38040-9.
7. Mueller SK, Sponsler KC, Kripalani S, Schnipper JL. Hospital-based medication reconciliation practices: a systematic review. Arch Intern Med. 2012;172(14):1057-1069. https://doi.org/10.1001/archinternmed.2012.2246.
8. Vogelsmeier A, Pepper GA, Oderda L, Weir C. Medication reconciliation: a qualitative analysis of clinicians’ perceptions. Res Social Adm Pharm. 2013;9(4):419-430. https://doi.org/10.1016/j.sapharm.2012.08.002.
9. Kaboli PJ, Hoth AB, McClimon BJ, Schnipper JL. Clinical pharmacists and inpatient medical care: a systematic review. Arch Intern Med. 2006;166(9):955-964. https://doi.org/10.1001/archinte.166.9.955.
10. Plaisant C, Wu J, Hettinger AZ, Powsner S, Shneiderman B. Novel user interface design for medication reconciliation: an evaluation of Twinlist. J Am Med Inform Assoc. 2015;22(2):340-349. https://doi.org/10.1093/jamia/ocu021.
11. Bassi J, Lau F, Bardal S. Use of information technology in medication reconciliation: a scoping review. Ann Pharmacother. 2010;44(5):885-897. https://doi.org/10.1345/aph.1M699.
12. Marien S, Krug B, Spinewine A. Electronic tools to support medication reconciliation: a systematic review. J Am Med Inform Assoc. 2017;24(1):227-240. https://doi.org/10.1093/jamia/ocw068.
13. Agrawal A. Medication errors: prevention using information technology systems. Br J Clin Pharmacol. 2009;67(6):681-686. https://doi.org/10.1111/j.1365-2125.2009.03427.x.
14. Pippins JR, Gandhi TK, Hamann C, et al. Classifying and predicting errors of inpatient medication reconciliation. J Gen Intern Med. 2008;23(9):1414-1422. https://doi.org/10.1007/s11606-008-0687-9.
© 2019 Society of Hospital Medicine
Night Call in a Teaching Hospital: 1979 and 2019
N o matter the era, few aspects of residency are more defining or memorable than overnight call. Nights can be a time of growth and learning but also of fear and uncertainty, as residents take on the responsibility of managing sick patients on their own. One of us (ASD) started his residency in 1978 at the Massachusetts General Hospital in Boston; the other two (ST and BCY) started theirs in 2016 and 2017, respectively, at the University of Toronto. In this essay, we reflect on our experiences of night call separated by 40 years, highlighting what has changed and what has stayed the same.
1979
At 6
We carried one pager that was about 7 inches long and 2 inches wide clipped to the waist of our pants. It could only make a beep; we then had to call the page operator to find out who wanted us. However, the pages were relatively few. Nurses called only when a patient was unstable, and other residents called only when a new patient was ready in the emergency department. At 9
Gathering data about patients prior to the current hospitalization required reviewing the “old chart,” which had to be delivered from patient records but was generally available when the patient was still in the ED. It contained typed discharge summaries and progress notes often handwritten by coresidents whom we knew. The handwriting was often difficult to read, outpatient notes were not included, and information from other hospitals was absent—but despite these deficiencies, we somehow managed just fine.
The patients on the inpatient ward were mostly stable, but more importantly, we had very few medications and tests to order. I recall prescribing fewer than 20 drugs—furosemide, hydrochlorothiazide, penicillins, cephalosporins, gentamicin, isoniazid, lidocaine, nitroglycerin, aminophylline, alpha-methyldopa, clonidine, propranolol, digoxin, hydralazine, indomethacin, steroids, and morphine. Orders for tests and imaging had to be physically written in the chart and could not be inputted remotely, which was a nuisance when we were away from the ward. However, we rarely ordered any imaging beyond plain radiographs at night. We did draw arterial blood gases and venous blood, administer oxygen, insert intravenous and central lines, take electrocardiograms, and perform urinalyses by microscopy. We did all these tasks ourselves for patients on the “ward service” (as opposed to the “private service”, which had to do with the type of insurance the patients possessed). As a result, we became experts in both blood drawing and intravenous line insertion—skills that might be less familiar to today’s residents.
Of course, patients did get acutely ill during the night. I recall intubating, cardioverting, performing phlebotomy to alleviate pulmonary edema, sending patients to surgery, and pronouncing death. Nevertheless, we often got sleep, and sometimes, several hours in a row. I had a rule; I always took a shower the next morning and put on clean clothes (we stayed until 5
We were often frightened by the responsibility of managing sick patients alone. On particularly challenging nights, we would record our fears and feelings in a “night call diary” in one of the conference rooms—generally at 4
There was definitely competitiveness to the work. Those who responded quickly to deteriorating patients were applauded; those who did not really know what to do were subtly disdained. However, over time, we all got the hang of it, and this led to a growing confidence that we were indeed doctors. The graded autonomy afforded by night call was a crucial part of that journey.
2019
At 6
To enable rapid remote responses, we each carry an assortment of devices on our waists or lanyards and in our pockets, such as a personal pager, ED consult pager, code blue pager, and hospital-issued smartphones capable of receiving pages, text messages, phone calls, and e-mails. Nurses, pharmacists, and other consultants communicate with us through all of these channels. Few of these interactions occur face-to-face. To our frustration, encounters with patients are frequently interrupted by a stream of beeps, rings, and vibrations—irrespective of whether we are having a difficult discussion about goals of care or performing a delicate procedure.
The ED contains a work space dedicated for residents to enter electronic orders, type notes, and review new admissions. Between consults, we try to discuss exciting cases and provide teaching to the medical students and interns, which we enjoy. Dinner is generally devoured while inputting orders. In exceptional circumstances, a brief reprieve from pages may allow the on-call team to share a meal. Depending on our role, sleep may be possible on certain nights but is never guaranteed. Moments spent with the on-call team—all of us learning, commiserating, and growing together—are some of the most memorable of residency, and many of us become close friends by the end of the rotation.
However, apart from these few familiar faces, we rarely get acquainted with the nurses or residents from other services. Many often refer to themselves by specialty rather than name and phone calls that begin with “Are you Medicine?” can end with “You should really call Orthopedics.” Meanwhile, “Medicine” and “Orthopedics” may pass each other in the hallway without recognition beyond a vague familiarity of a voice heard on the phone.
Every 10 minutes spent with a new patient is accompanied by approximately one hour of “electronic” time, which includes reading through previous medical records, reviewing laboratory data and imaging, and creating an admission note. Interns might groan as they pull up a patient’s electronic health record (EHR); irrelevant details often arise with each click of the mouse, and the cursed “copy-paste” function means that new notes often duplicate older ones. However, with time, we learn to look past the EHR’s shortcomings and appreciate several of its advantages. For example, we are now able to access test results performed outside our hospital and thus limit our repetition of investigations. We can also use the EHR to rapidly glean salient information about a patient in time-critical scenarios. This is always a satisfying process, and it makes us wonder how physicians ever practiced in the era before computers.
Today’s patients are older and sicker than ever before. Many are receiving treatments that did not exist even a decade ago. As residents, we must recognize a seemingly endless variety of drugs—a challenging but intellectually satisfying responsibility. We must also decide whether the patient’s current health state permits their continuation, or whether safer alternatives exist. Some of these decisions cannot wait until the morning.
During handover at 8
No doubt, being on call is difficult. The next day brings a feeling of relief and accomplishment, knowing that we got through it—whether by floundering or flourishing—in one piece.
CONCLUSION
The two passages described here are personal descriptions of a typical night on-call in two different eras. Readers around the world may have a very different recollection of their own experience. Nevertheless, several aspects of being on call remain constant, such as anxiety about caring for sick patients alone, fond recollections of friends made, and relief when the morning comes. Most important, however, might be the tremendous satisfaction at the opportunity to learn and grow—to become a competent physician by testing one’s physical and intellectual limits through graded autonomy
On the other hand, certain elements of night call have undeniably changed—partly a consequence of the increased number of people involved in patient care and changing communication technology. Residents today encounter a greater number of interruptions to their work flow. Tasks that require long, continuous periods of full attention are now punctuated by texts, e-mails, calls, and pages. The EHR is often clumsy to navigate, but it can also be a veritable mine of information. Finally, although residents from the same specialty may be close friends, duty hour restrictions and remote asynchronous communication may reduce familiarity with residents from other programs.
Do these descriptions resonate with your experience of night call? Keeping in mind that the 1979 vignette is described through the rose-colored lens of nostalgia, both eras have their advantages and disadvantages. We leave it to the reader to decide what has changed (plus ça change) and what has stayed the same (plus c’est la même chose).
Acknowledgments
The authors thank Micheal A. Fifer, MD (Massachusetts General Hospital), and Timothy J. Judson, MD (UCSF), for their comments on an earlier draft of this essay.
Disclosures
The authors have nothing to disclose.
© 2019 Society of Hospital Medicine
Methodological Progress Note: Group Level Assessment
Group Level Assessment (GLA) is a qualitative research methodology designed to enable groups of stakeholders to generate and evaluate data in participatory sessions.1 It has been used in diverse health-related settings for multiple research purposes, including needs/resource assessment, program evaluation, quality improvement, intervention development, feasibility/acceptability testing, knowledge generation, and prioritization.2-6 Unlike traditional qualitative research methods in which participants provide data and researchers analyze it, GLA uses a seven-step structured process (Table) that actively involves a large group of stakeholders in the generation, interpretation, and synthesis of data and allows salient themes to be identified from stakeholders’ perspectives.7 GLA deliverables include a set of action items that are relevant to the target issue and representative of the collective view of stakeholders. In this issue of the Journal of Hospital Medicine, Choe and colleagues used GLA methodology to identify the perspectives of pediatric medical providers and interpreters with regard to the use of interpreter services for hospitalized children having limited English proficiency (LEP).8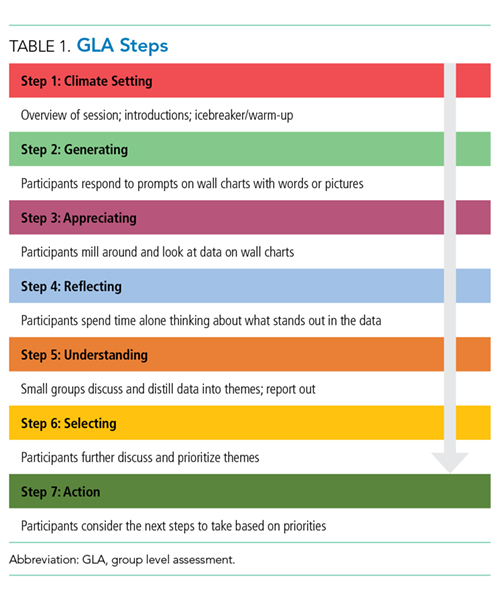
Each individual GLA session is intended for a group of 15-60 stakeholders. Ideally, a GLA session is scheduled for approximately three hours with a skilled facilitator guiding the group through the steps of the session.1 Depending on the study scope and research questions, modifications to GLA can be made when engaging fewer stakeholders, conducting the GLA across several shorter sessions with the same group, or conducting multiple sessions with different stakeholder groups wherein results are integrated across the groups.1
APPLICATION OF GLA
Stakeholder Recruitment
GLAs are designed to bring diverse groups together to be able to generate and evaluate ideas collectively, which in turn helps to reduce potential power differentials between or among participants. Depending on the research question(s), relevant stakeholders may include local community residents, patients, caregivers, community leaders, practitioners, providers, community-based organizations, and even CEOs. The use of purposeful sampling techniques can obtain a diverse group of stakeholders, thus helping ensure a wide range of ideas and perspectives. Choe and colleagues used flyers and announcements at staff meetings to recruit physicians, nursing staff, and interpreters who were subsequently assigned to GLA sessions to ensure engagement from a range of stakeholder roles at each session.8
Session Logistics
Strategies to create an open, equitable atmosphere in GLA sessions include role-based assigning of individuals to specific groups, avoiding introductions that emphasize status, pre-education for any leaders and supervisors about the participatory and equitable nature of GLA, and minimizing cliques and overly dominant voices throughout the session. Stakeholders who take part in activities in a GLA session typically receive an incentive for participating. Additional supports such as food and childcare may be considered. GLA sessions involving children may require providing the young participants assistance in writing their responses and/or the use of additional facilitators to keep the small groups on track.5 Interpreters and facilitators can be incorporated into GLA sessions to assist stakeholders who may need assistance with understanding and responding to prompts, such as language interpretation and translation services.
Prompt Development
Similar to the development of questions for interview and focus group guides, creating effective prompts is a critical component of data collection in GLA. Prompts are statements worded as incomplete or fill-in-the-blank sentences that should be open ended to allow participants to respond with their own thoughts and experiences. Prompts that resemble the beginning of a sentence (eg, “The biggest challenge we face is…”) encourage honest reflection rather than questions that can make participants feel like they are being evaluated. We recommend varying the number of prompts based on the group size: approximately one chart and prompt per person attending, with a maximum of 35 prompts at one session.1 This allows for sufficient variability in the responses generated without being overwhelming or too time-consuming. For example, Choe et al. developed a pool of 51 unique prompts addressing their research questions and then used 15-32 prompts in each GLA session, depending on the number of participants. 8 Prompts should be written with some purposeful redundancy, targeting the research question from several angles. The emphasis should be on the content’s alignment with the research questions rather than the actual wording of the prompts as a way of ensuring that the generated data is both valid and useful.
Prompts should also vary in format, style (eg, different color markers, pictures, fonts, etc.), and placement on each flip chart page. An individual flip chart can include multiple related prompts: for example, “split-halves” in two columns or rows (ie, the best part/worst part). Taken as a whole, the flip charts and accompanying prompts create different lenses for gathering participant perspectives on the research questions. See Appendix Table for suggested prompt characteristics and examples from a hypothetical study related to pediatric healthcare.
GLA prompt development will ideally occur in collaboration with an advisory team comprised of representative members from each of the stakeholder groups. Using a participatory research approach in the research design and preparation phases ensures that GLA prompts are understandable and relevant to participants and are able to appropriately capture the underlying purpose of the study.
Description of the Seven Steps in GLA
In step one, climate setting, the facilitator provides an overview of the session, including a description of the GLA rationale and process. Typically, an icebreaker or brief introduction activity is conducted. Step two, generating, is a hallmark step of GLA in which participants walk around and respond to prompts prewritten on flip charts hung on walls in a large room. Participants use markers and respond to each prompt by either providing a unique comment and/or corroborating an existing comment by adding a checkmark or star. During this step, organizers typically play music and encourage participants to enjoy food, chat with fellow participants, and leisurely move from prompt to prompt in any order. Step three, appreciating, is a brief interim step where participants take a “gallery walk” and view responses written on the charts.
In step four, reflecting, participants reflect on the data and briefly write down their thoughts about the responses generated in the session. In step five, understanding, smaller groups synthesize responses across a subset of charts and report their findings to the larger group. Depending on the size and composition of the larger group, small groups of four to seven people are formed or assigned. Each small group is assigned a subset of approximately four to six charts. Using thematic analysis, participants look for relationships among the responses on their assigned charts, referring to individual responses as evidence for the main findings. Groups will take notes on the charts, circle key phrases, or draw arrows to show relationships in the data and thereafter develop themes. As each small group reports their findings, the facilitator will keep a running list of generated themes, ideally in the participants’ own words. Step six, selecting, involves participants discussing, further synthesizing, and prioritizing data. Step six can occur as a facilitated large group discussion or in a form in which participants can remain in the same small groups from step five and work together to complete this further step. Themes across all of the small groups are consolidated and developed into overarching themes. Step seven, action, includes planning the next steps to address priorities.
Data Analysis
Analyzing the data generated through a GLA is an iterative process incorporated into steps three to seven as described above and often continues after the GLA session is complete. Step seven can be scheduled as a separate action-planning session depending on time constraints and the study goals. This final step moves the group toward interpretation and dissemination as themes are prioritized and used to drive action steps toward a programmatic, policy, or community change. In some studies, themes will be aggregated across multiple GLAs to integrate the findings from several sessions. This step is sometimes completed with a smaller group of stakeholders, an advisory board, or the research team.
Complementary Data and Synthesis
Research teams often collect additional sources of data that are later used to analyze and interpret the initial stakeholder-developed findings (ie, demographic surveys) and to identify priority areas. Field notes, photographs of completed charts, and recorded participant quotes can also be incorporated into the thematic analysis. Small and large group discussions could be audio recorded and transcribed to capture participants’ individual comments and interpretations. In Choe et al. the team recorded detailed notes, including quotations from participants, and collected a demographic survey. After each GLA session, Choe and colleagues compiled all of the stakeholder-driven findings to develop an overarching set of themes related to communication with LEP families and priority areas that could inform subsequent action. Similar to the qualitative validation strategy of member checking, the authors shared and revised this overarching set of themes in discussion with stakeholders to ensure that participant ideas were adequately and accurately represented.8
STRENGTHS OF GLA
Compared to traditional qualitative methods such as one-on-one interviews and focus groups, GLA is designed for large groups and is used to promote active engagement of diverse stakeholders in the participatory process. Unlike many other qualitative methods, GLA provides a stakeholder-driven, structured format to elicit diverse stakeholder viewpoints in the moment and build consensus in a participatory manner about priorities and subsequent actions. The progression of the GLA process is collaborative, with stakeholders generating, analyzing, and prioritizing data from their own perspectives. In a focus group or one-on-one interviews, researchers would conduct the analysis after the audio recordings were transcribed. In GLA, stakeholders conduct a thematic analysis in real time, an aspect that adds the stakeholder perspective to analysis of the findings, interpretation, and implications. GLA offers a fun and interactive experience that can build a sense of community among participants (eg, walking around, impromptu conversation, working in small groups, sharing perspectives on the same issue from different vantage points, etc.). GLA is a versatile, flexible methodology that can be used to address different research objectives, be modified for use with various size groups, and be adapted based on the needs and characteristics of stakeholders (eg, children, people with disabilities, etc.).1 When used in recruitment, GLA is designed to include stakeholders representing different roles and levels of a system. GLA can be particularly useful when engaging underserved communities in research because the process is nonthreatening and promotive of shared perspectives and decision-making. Importantly, the final step of GLA provides interested stakeholders with a way to stay involved in the research through prioritization and action.
LIMITATIONS OF GLA
Like other self-report research methods, GLA relies on stakeholder comfort and willingness to share “public data.”1 Thus, controversial or sensitive issues may not be brought forth. Since the final themes of GLA are consensus based in terms of what the group of stakeholders finds to be most important, nuances and outlier data can be missed. Successfully conducting a GLA requires a skilled, flexible facilitator who can manage group dynamics while also balancing the structure of the seven-step process, promoting an open and equitable environment, and ensuring the research process remains rigorous. Large groups can be more difficult for facilitators to manage especially when there are power differentials, conflict, and hidden agendas among stakeholders. The large group design, multiple steps of GLA, and participatory atmosphere with music and food can be off-putting for some stakeholders who find the process too noisy, overwhelming, or unstructured. In addition, large groups can be challenging to schedule at times and to find locations that are convenient for stakeholders.
WHY DID THE AUTHORS USE GLA?
Compared to researcher-driven qualitative methods that can be resource-intensive and are limited by researcher perspective, GLA emphasizes the contextual, “lived” expertise of stakeholders and relies on them in real time to identify and prioritize matters relevant to the participants. The participatory process of GLA promotes stakeholder buy-in and builds on the collective wisdom of the stakeholder group. This is ideally seen in Choe et al.’s study where GLA offered the researchers a structured qualitative methodology that engaged a large number of medical providers and interpreters to identify effective practices that should ultimately enhance communication with families of hospitalized LEP children.
Disclosures
The authors have nothing to disclose.
1. Vaughn LM, Lohmueller M. Calling all stakeholders: group-level assessment (GLA)—a qualitative and participatory method for large groups. Eval Rev. 2014;38(4):336-355. https:// doi.org/10.1177/0193841X14544903.
2. Gosdin CH, Vaughn L. Perceptions of physician bedside handoff with nurse and family involvement. Hosp Pediatr. 2012;2(1):34-38. https://doi.org/10.1542/hpeds.2011-0008-2
3. Graham KE, Schellinger AR, Vaughn LM. Developing strategies for positive change: transitioning foster youth to adulthood. Child Youth Serv Rev. 2015;54:71-79. https://doi.org/10.1016/j.childyouth.2015.04.014
4. Schondelmeyer AC, Jenkins AM, Allison B, et al. Factors influencing use of continuous physiologic monitors for hospitalized pediatric patients. Hosp Pediatr. 2019;9(6):423-428. https://doi.org/10.1542/hpeds.2019-0007
5. Vaughn LM, Jacquez F, Zhao J, Lang M. Partnering with students to explore the health needs of an ethnically diverse, low-resource school: an innovative large group assessment approach. Fam Community Health. 2011;34(1):72-84. https://doi.org/10.1097/FCH.0b013e3181fded12
6. Vaughn LM. Group level assessment: a large group method for identifying primary issues and needs within a community. Sage Journals. 2014;38:336-355. https://doi.org/10.4135/978144627305014541626
7. Vaughn LM. Psychology and culture: thinking, feeling and behaving in a global context. 2nd ed. New York, NY: Taylor & Francis; 2019.
8. Choe A, Unaka N, Schondelmeyer AC, Bignall, RW, Vilvens H, Thomson J. Inpatient communication barriers and drivers when caring for children with limited English proficiency [published online ahead of print July 24, 2019]. J Hosp Med. https://doi.org/10.12788/jhm.3240.
Group Level Assessment (GLA) is a qualitative research methodology designed to enable groups of stakeholders to generate and evaluate data in participatory sessions.1 It has been used in diverse health-related settings for multiple research purposes, including needs/resource assessment, program evaluation, quality improvement, intervention development, feasibility/acceptability testing, knowledge generation, and prioritization.2-6 Unlike traditional qualitative research methods in which participants provide data and researchers analyze it, GLA uses a seven-step structured process (Table) that actively involves a large group of stakeholders in the generation, interpretation, and synthesis of data and allows salient themes to be identified from stakeholders’ perspectives.7 GLA deliverables include a set of action items that are relevant to the target issue and representative of the collective view of stakeholders. In this issue of the Journal of Hospital Medicine, Choe and colleagues used GLA methodology to identify the perspectives of pediatric medical providers and interpreters with regard to the use of interpreter services for hospitalized children having limited English proficiency (LEP).8
Each individual GLA session is intended for a group of 15-60 stakeholders. Ideally, a GLA session is scheduled for approximately three hours with a skilled facilitator guiding the group through the steps of the session.1 Depending on the study scope and research questions, modifications to GLA can be made when engaging fewer stakeholders, conducting the GLA across several shorter sessions with the same group, or conducting multiple sessions with different stakeholder groups wherein results are integrated across the groups.1
APPLICATION OF GLA
Stakeholder Recruitment
GLAs are designed to bring diverse groups together to be able to generate and evaluate ideas collectively, which in turn helps to reduce potential power differentials between or among participants. Depending on the research question(s), relevant stakeholders may include local community residents, patients, caregivers, community leaders, practitioners, providers, community-based organizations, and even CEOs. The use of purposeful sampling techniques can obtain a diverse group of stakeholders, thus helping ensure a wide range of ideas and perspectives. Choe and colleagues used flyers and announcements at staff meetings to recruit physicians, nursing staff, and interpreters who were subsequently assigned to GLA sessions to ensure engagement from a range of stakeholder roles at each session.8
Session Logistics
Strategies to create an open, equitable atmosphere in GLA sessions include role-based assigning of individuals to specific groups, avoiding introductions that emphasize status, pre-education for any leaders and supervisors about the participatory and equitable nature of GLA, and minimizing cliques and overly dominant voices throughout the session. Stakeholders who take part in activities in a GLA session typically receive an incentive for participating. Additional supports such as food and childcare may be considered. GLA sessions involving children may require providing the young participants assistance in writing their responses and/or the use of additional facilitators to keep the small groups on track.5 Interpreters and facilitators can be incorporated into GLA sessions to assist stakeholders who may need assistance with understanding and responding to prompts, such as language interpretation and translation services.
Prompt Development
Similar to the development of questions for interview and focus group guides, creating effective prompts is a critical component of data collection in GLA. Prompts are statements worded as incomplete or fill-in-the-blank sentences that should be open ended to allow participants to respond with their own thoughts and experiences. Prompts that resemble the beginning of a sentence (eg, “The biggest challenge we face is…”) encourage honest reflection rather than questions that can make participants feel like they are being evaluated. We recommend varying the number of prompts based on the group size: approximately one chart and prompt per person attending, with a maximum of 35 prompts at one session.1 This allows for sufficient variability in the responses generated without being overwhelming or too time-consuming. For example, Choe et al. developed a pool of 51 unique prompts addressing their research questions and then used 15-32 prompts in each GLA session, depending on the number of participants. 8 Prompts should be written with some purposeful redundancy, targeting the research question from several angles. The emphasis should be on the content’s alignment with the research questions rather than the actual wording of the prompts as a way of ensuring that the generated data is both valid and useful.
Prompts should also vary in format, style (eg, different color markers, pictures, fonts, etc.), and placement on each flip chart page. An individual flip chart can include multiple related prompts: for example, “split-halves” in two columns or rows (ie, the best part/worst part). Taken as a whole, the flip charts and accompanying prompts create different lenses for gathering participant perspectives on the research questions. See Appendix Table for suggested prompt characteristics and examples from a hypothetical study related to pediatric healthcare.
GLA prompt development will ideally occur in collaboration with an advisory team comprised of representative members from each of the stakeholder groups. Using a participatory research approach in the research design and preparation phases ensures that GLA prompts are understandable and relevant to participants and are able to appropriately capture the underlying purpose of the study.
Description of the Seven Steps in GLA
In step one, climate setting, the facilitator provides an overview of the session, including a description of the GLA rationale and process. Typically, an icebreaker or brief introduction activity is conducted. Step two, generating, is a hallmark step of GLA in which participants walk around and respond to prompts prewritten on flip charts hung on walls in a large room. Participants use markers and respond to each prompt by either providing a unique comment and/or corroborating an existing comment by adding a checkmark or star. During this step, organizers typically play music and encourage participants to enjoy food, chat with fellow participants, and leisurely move from prompt to prompt in any order. Step three, appreciating, is a brief interim step where participants take a “gallery walk” and view responses written on the charts.
In step four, reflecting, participants reflect on the data and briefly write down their thoughts about the responses generated in the session. In step five, understanding, smaller groups synthesize responses across a subset of charts and report their findings to the larger group. Depending on the size and composition of the larger group, small groups of four to seven people are formed or assigned. Each small group is assigned a subset of approximately four to six charts. Using thematic analysis, participants look for relationships among the responses on their assigned charts, referring to individual responses as evidence for the main findings. Groups will take notes on the charts, circle key phrases, or draw arrows to show relationships in the data and thereafter develop themes. As each small group reports their findings, the facilitator will keep a running list of generated themes, ideally in the participants’ own words. Step six, selecting, involves participants discussing, further synthesizing, and prioritizing data. Step six can occur as a facilitated large group discussion or in a form in which participants can remain in the same small groups from step five and work together to complete this further step. Themes across all of the small groups are consolidated and developed into overarching themes. Step seven, action, includes planning the next steps to address priorities.
Data Analysis
Analyzing the data generated through a GLA is an iterative process incorporated into steps three to seven as described above and often continues after the GLA session is complete. Step seven can be scheduled as a separate action-planning session depending on time constraints and the study goals. This final step moves the group toward interpretation and dissemination as themes are prioritized and used to drive action steps toward a programmatic, policy, or community change. In some studies, themes will be aggregated across multiple GLAs to integrate the findings from several sessions. This step is sometimes completed with a smaller group of stakeholders, an advisory board, or the research team.
Complementary Data and Synthesis
Research teams often collect additional sources of data that are later used to analyze and interpret the initial stakeholder-developed findings (ie, demographic surveys) and to identify priority areas. Field notes, photographs of completed charts, and recorded participant quotes can also be incorporated into the thematic analysis. Small and large group discussions could be audio recorded and transcribed to capture participants’ individual comments and interpretations. In Choe et al. the team recorded detailed notes, including quotations from participants, and collected a demographic survey. After each GLA session, Choe and colleagues compiled all of the stakeholder-driven findings to develop an overarching set of themes related to communication with LEP families and priority areas that could inform subsequent action. Similar to the qualitative validation strategy of member checking, the authors shared and revised this overarching set of themes in discussion with stakeholders to ensure that participant ideas were adequately and accurately represented.8
STRENGTHS OF GLA
Compared to traditional qualitative methods such as one-on-one interviews and focus groups, GLA is designed for large groups and is used to promote active engagement of diverse stakeholders in the participatory process. Unlike many other qualitative methods, GLA provides a stakeholder-driven, structured format to elicit diverse stakeholder viewpoints in the moment and build consensus in a participatory manner about priorities and subsequent actions. The progression of the GLA process is collaborative, with stakeholders generating, analyzing, and prioritizing data from their own perspectives. In a focus group or one-on-one interviews, researchers would conduct the analysis after the audio recordings were transcribed. In GLA, stakeholders conduct a thematic analysis in real time, an aspect that adds the stakeholder perspective to analysis of the findings, interpretation, and implications. GLA offers a fun and interactive experience that can build a sense of community among participants (eg, walking around, impromptu conversation, working in small groups, sharing perspectives on the same issue from different vantage points, etc.). GLA is a versatile, flexible methodology that can be used to address different research objectives, be modified for use with various size groups, and be adapted based on the needs and characteristics of stakeholders (eg, children, people with disabilities, etc.).1 When used in recruitment, GLA is designed to include stakeholders representing different roles and levels of a system. GLA can be particularly useful when engaging underserved communities in research because the process is nonthreatening and promotive of shared perspectives and decision-making. Importantly, the final step of GLA provides interested stakeholders with a way to stay involved in the research through prioritization and action.
LIMITATIONS OF GLA
Like other self-report research methods, GLA relies on stakeholder comfort and willingness to share “public data.”1 Thus, controversial or sensitive issues may not be brought forth. Since the final themes of GLA are consensus based in terms of what the group of stakeholders finds to be most important, nuances and outlier data can be missed. Successfully conducting a GLA requires a skilled, flexible facilitator who can manage group dynamics while also balancing the structure of the seven-step process, promoting an open and equitable environment, and ensuring the research process remains rigorous. Large groups can be more difficult for facilitators to manage especially when there are power differentials, conflict, and hidden agendas among stakeholders. The large group design, multiple steps of GLA, and participatory atmosphere with music and food can be off-putting for some stakeholders who find the process too noisy, overwhelming, or unstructured. In addition, large groups can be challenging to schedule at times and to find locations that are convenient for stakeholders.
WHY DID THE AUTHORS USE GLA?
Compared to researcher-driven qualitative methods that can be resource-intensive and are limited by researcher perspective, GLA emphasizes the contextual, “lived” expertise of stakeholders and relies on them in real time to identify and prioritize matters relevant to the participants. The participatory process of GLA promotes stakeholder buy-in and builds on the collective wisdom of the stakeholder group. This is ideally seen in Choe et al.’s study where GLA offered the researchers a structured qualitative methodology that engaged a large number of medical providers and interpreters to identify effective practices that should ultimately enhance communication with families of hospitalized LEP children.
Disclosures
The authors have nothing to disclose.
1. Vaughn LM, Lohmueller M. Calling all stakeholders: group-level assessment (GLA)—a qualitative and participatory method for large groups. Eval Rev. 2014;38(4):336-355. https:// doi.org/10.1177/0193841X14544903.
2. Gosdin CH, Vaughn L. Perceptions of physician bedside handoff with nurse and family involvement. Hosp Pediatr. 2012;2(1):34-38. https://doi.org/10.1542/hpeds.2011-0008-2
3. Graham KE, Schellinger AR, Vaughn LM. Developing strategies for positive change: transitioning foster youth to adulthood. Child Youth Serv Rev. 2015;54:71-79. https://doi.org/10.1016/j.childyouth.2015.04.014
4. Schondelmeyer AC, Jenkins AM, Allison B, et al. Factors influencing use of continuous physiologic monitors for hospitalized pediatric patients. Hosp Pediatr. 2019;9(6):423-428. https://doi.org/10.1542/hpeds.2019-0007
5. Vaughn LM, Jacquez F, Zhao J, Lang M. Partnering with students to explore the health needs of an ethnically diverse, low-resource school: an innovative large group assessment approach. Fam Community Health. 2011;34(1):72-84. https://doi.org/10.1097/FCH.0b013e3181fded12
6. Vaughn LM. Group level assessment: a large group method for identifying primary issues and needs within a community. Sage Journals. 2014;38:336-355. https://doi.org/10.4135/978144627305014541626
7. Vaughn LM. Psychology and culture: thinking, feeling and behaving in a global context. 2nd ed. New York, NY: Taylor & Francis; 2019.
8. Choe A, Unaka N, Schondelmeyer AC, Bignall, RW, Vilvens H, Thomson J. Inpatient communication barriers and drivers when caring for children with limited English proficiency [published online ahead of print July 24, 2019]. J Hosp Med. https://doi.org/10.12788/jhm.3240.
© 2019 Society of Hospital Medicine
Clinical Progress Note: Pediatric Acute Kidney Injury
Acute kidney injury (AKI) occurs in 5%-30% of noncritically ill hospitalized children.1 Initially thought to be simply a symptom of more severe pathologies, it is now recognized that AKI independently increases mortality and is associated with the development of chronic kidney disease (CKD), even in children.2 The wide acceptance of the Kidney Disease Improving Global Outcome (KDIGO) diagnostic criteria has enabled a more uniform definition of AKI from both clinical and research perspectives.2 A better understanding of the pathophysiology and risk factors for AKI has led to new methods for early detection and prevention efforts. While serum creatinine (SCr) was historically one of the sole markers of AKI, novel biomarkers can facilitate earlier diagnosis of AKI, identify subclinical AKI, and guide clinical management. This clinical practice update addresses the latest clinical advances in risk assessment, diagnosis, and prevention of pediatric AKI, with a focus on AKI biomarkers.
DIAGNOSIS, BIOMARKERS, AND DEFINITION
Several sets of criteria have been used to diagnose AKI. The KDIGO classification, based on a systematic review of the literature and developed through expert consensus, is the current recommended definition.3 Increasing AKI stage, as defined by the KDIGO classification, is associated with increased mortality, the need for renal replacement therapy, length of stay, and CKD, thus underscoring the importance of accurate classification.3 Stage 1 AKI is defined by a rise in SCr of ≥0.3 mg/dL,1.5-1.9 times the baseline SCr, or urine output <0.5 ml/kg/h for six to 12 hours; stage 2 by a rise of ≥2.0-2.9 times the baseline SCr or urine output <0.5 ml/kg/h for >12 hours; and stage 3 by a rise of ≥4.0 mg/dL, ≥three times the baseline SCr, initiation of renal replacement therapy, urine output <0.3 ml/kg/h for ≥24 hours, or anuria ≥12 hours. However, these criteria rely on SCr, which is a suboptimal marker of renal dysfunction, as it rises only once the glomerular filtration rate (GFR) has already decreased, in some cases by as much as 50%. Additionally, interpretation of SCr in the diagnosis of AKI requires a prior Scr measurement to determine the magnitude of change from the baseline value, which is often lacking in children. To mitigate this limitation, different formulas exist to estimate a baseline SCr value based on height or age, an approach that assumes patients have preexisting normal renal function.
The limitations of SCr have led to interest in identifying more accurate biomarkers of AKI. Although many candidates have been identified, we will limit our discussion to those currently available for clinical use: serum cystatin C, urine neutrophil gelatinase-associated lipocalin (NGAL), urine TIMP-2, and urine IGFBP7 (Table).4-8 While urine NGAL and cystatin C are measured individually, TIMP-2 and IGFBP7 are measured on the same panel and the product of their multiplied values is used for clinical guidance. While each of these biomarkers have good predictive accuracy for AKI when used independently, their combined use increases the accuracy of AKI diagnosis. These biomarkers can be divided into broad categories based on their utility as either functional markers or markers of injury.6 Serum cystatin C is a functional marker and as such can be used to estimate GFR more accurately than SCr.9 Comparatively, urine NGAL is a marker of renal injury, while TIMP2 and IGFBP7 are markers of renal stress. These markers are not useful in estimating GFR, but rather aid in the prediction and diagnosis of AKI (Figure). Despite the limitations of SCr, these biomarkers have yet to be incorporated into the diagnostic criteria. They have, however, helped to refine our understanding of the pathophysiology of AKI.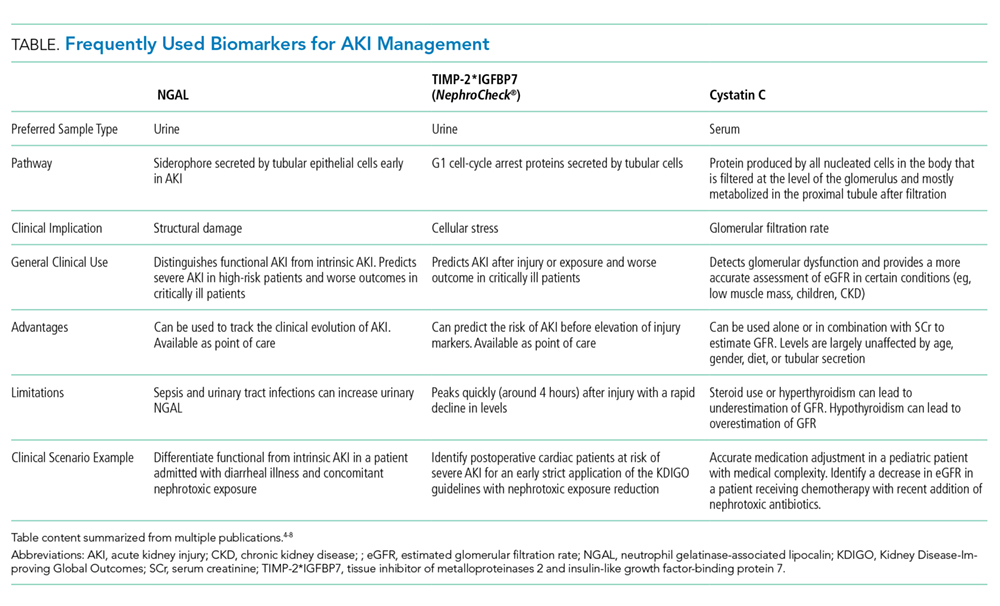
AKI has classically been divided into three categories based on the etiology of injury, namely prerenal azotemia, intrinsic renal disease, and postrenal causes. The discovery of new biomarkers adds nuance to the classification of AKI. Two groups of biomarkers are particularly helpful in this regard: markers of structural injury (eg, NGAL) and functional markers (eg, cystatin C). The combination of these biomarkers with SCr has refined the categories of AKI (Figure). For example, NGAL can accurately distinguish between a rise in SCr due to functional AKI, previously referred to as prerenal azotemia, and a rise in SCr due to intrinsic kidney injury. An elevation of structural injury biomarkers in the absence of a significant rise in SCr is referred to as subclinical AKI. Patients with subclinical AKI have worse outcomes than those without AKI but better outcomes than patients with AKI with elevation of both SCr and NGAL (Figure).2,6 Time to resolution of AKI further refines our ability to predict prognosis and outcomes. Transient AKI, defined as resolution within 48 hours, is associated with a better prognosis than persistent AKI. Renal dysfunction lasting more than seven days but less than 90 days is referred to as acute kidney disease (AKD). While both transient AKI and AKD represent different entities on the continuum between AKI and CKD, further research is needed to better elucidate these classifications.2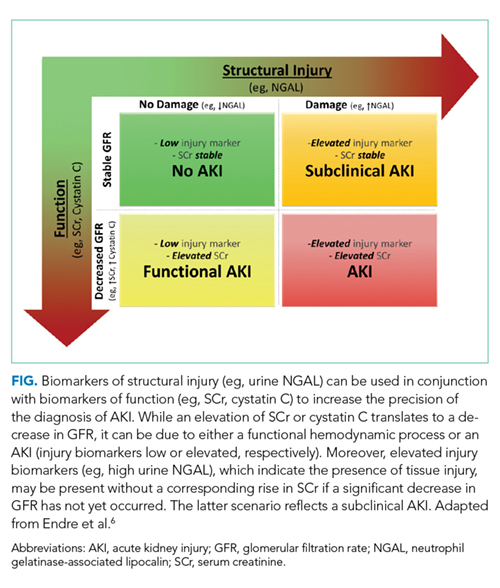
RISK STRATIFICATION
The renal angina index (RAI) identifies critically ill children at high risk for AKI. The RAI combines traditional markers of AKI, such as a change in estimated creatinine clearance and fluid overload, with patient factors, including need for ventilation, inotropic support, and history of transplantation (solid organ or bone marrow) to identify those patients who are at high risk for severe AKI. Patients identified as high risk by the patient factors component of the RAI have a much lower threshold for both a decrease in creatinine clearance and fluid overload to be considered at risk for severe AKI, as these early signs are more likely to reflect an early impending severe AKI in this high-risk group. Conversely, patients that do not meet these patient factors are more likely to simply have a transient or functional AKI, and therefore have a higher threshold for both a change in creatinine clearance and fluid overload in order to be considered at high risk for severe AKI.
The RAI has been validated in the critical care setting as a method to predict severe AKI at day three of admission to the pediatric intensive care unit, with a negative predictive value of 92%-99% when the score is negative in the first 12 hours.10 In selected high-risk patients (RAI ≥ 8), biomarkers become even more reliable for AKI prediction (eg, injury markers have an excellent area under the receiver operating characteristic curve (AUC) of 0.97 for severe AKI prediction in this high-risk group).11 While only validated for critically ill patients, the concept of renal angina is still applicable in the complex populations managed by hospitalists who practice outside of the intensive care unit setting. Early signs of renal dysfunction (eg, rising SCr, fluid overload ≥5%) in patients with risk factors (see below) should prompt a thorough evaluation, including urinalysis, daily SCr, nephrotoxin avoidance, and tissue injury biomarkers, if available.
The risk factors for AKI are numerous and tend to potentiate one another. The most frequent predisposing comorbidities include CKD, heart failure or congenital heart diseases, transplantation (bone marrow or solid organs), and diabetes. Disease-related factors include sepsis, cardiac surgery, cardio-pulmonary bypass, mechanical ventilation, and vasopressor use. Potentially modifiable factors include hypovolemia and multiple nephrotoxic exposures. 2,3
Nephrotoxic medications are now among the most common causes of AKI in hospitalized children.12 Approximately 80% of children are exposed to at least one nephrotoxin during an inpatient admission.12 Exposure to a single nephrotoxic medication is sufficient to place a child at risk of AKI, and each additional nephrotoxin further increases the risk.12 While some drugs are routinely recognized to be nephrotoxic (eg, ibuprofen), others are commonly overlooked, notably certain antibiotics (eg, cefotaxime, ceftazidime, cefuroxime, nafcillin, and piperacillin) and anticonvulsants (eg, zonisamide).12 Furthermore, the combination of multiple nephrotoxins can potentiate the risk of AKI. For example, the combination of vancomycin and piperacillin/tazobactam increases the risk of AKI by 3.4 times compared with the combination of vancomycin with another antipseudomonal beta-lactam antibiotic.13
Adequate monitoring, including daily SCr measurements and risk awareness, are critical as nephrotoxin-associated AKI can be easily missed in the absence of routine SCr monitoring, especially since these children are typically nonoliguric12. Quality improvement efforts focused on obtaining daily SCr in patients exposed to either three or more nephrotoxins or three days of either aminoglycoside or vancomycin, even without concomitant exposure to other nephrotoxins, have shown success in decreasing both the number of nephrotoxins and the rate of nephrotoxin-associated AKI.12
While a significant injury cannot always be avoided, a mindful clinical approach and management can help to prevent some complications of AKI. An awareness of fluid status is critical, as fluid overload greater than 10% of the patient’s weight independently increases the risk of mortality in both adults and children.14 To assess the risk of AKI progression and potential failure of conservative management with diuretics, a furosemide stress test (FST) is an easy, safe, and accessible functional assessment of tubular reserve in a patient without intravascular depletion.15 A growing body of literature in adults shows that FST-responders are less likely to progress to stage 3 AKI or need renal replacement therapy than nonresponders.15 The FST is currently being investigated and standardized in children.
CONCLUSION
Research in AKI has made significant strides over the last few years. Nevertheless, many areas of research remain to be explored (eg, the impact of IV fluid type in the pediatric population, AKD characterization and impact on CKD development). AKI is common, associated with significant morbidity and mortality and, in some instances, preventable. While no targeted therapeutic options are currently under investigation, recent advances allow for better identification of high-risk patients and offer opportunities for impactful preventive approaches. Thoughtful use of nephrotoxic medications, early identification of patients at high risk for AKI, and accurate diagnosis and appropriate management of AKI are the recommended best practice.
Disclosures
The authors have nothing to disclose.
1. McGregor TL, Jones DP, Wang L, et al. Acute kidney injury incidence in noncritically ill hospitalized children, adolescents, and young adults: a retrospective observational study. Am J Kidney Dis. 2016;67(3):384-390. https://doi.org/10.1053/j.ajkd.2015.07.019.
2. Chawla LS, Bellomo R, Bihorac A, et al. Acute kidney disease and renal recovery: consensus report of the Acute Disease Quality Initiative (ADQI) 16 Workgroup. Nat Rev Nephrol. 2017;13(4):241-257. https://doi.org/10.1038/nrneph.2017.2.
3. Khwaja A. KDIGO clinical practice guidelines for acute kidney injury. Nephron Clin Pract. 2012;120(4):179-184. https://doi.org/10.1159/000339789.
4. Filho LT, Grande AJ, Colonetti T, Della ÉSP, da Rosa MI. Accuracy of neutrophil gelatinase-associated lipocalin for acute kidney injury diagnosis in children: systematic review and meta-analysis. Pediatr Nephrol. 2017;32(10):1979-1988. https://doi.org/10.1007/s00467-017-3704-6.
5. Levey AS, Inker LA. Assessment of glomerular filtration rate in health and disease: a state of the art review. Clin Pharmacol Ther. 2017;102(3):405-419. https://doi.org/10.1002/cpt.729.
6. Endre ZH, Kellum JA, Di Somma S, et al. Differential diagnosis of AKI in clinical practice by functional and damage biomarkers: workgroup statements from the tenth Acute Dialysis Quality Initiative Consensus Conference. Contrib Nephrol. 2013;182:30-44. https://doi.org/10.1159/000349964.
7. Su LJ, Li YM, Kellum JA, Peng ZY. Predictive value of cell cycle arrest biomarkers for cardiac surgery-associated acute kidney injury: a meta-analysis. Br J Anaesth. 2018;121(2):350-357. https://doi.org/10.1016/j.bja.2018.02.069.
8. Westhoff JH, Tönshoff B, Waldherr S, et al. Urinary tissue inhibitor of metalloproteinase-2 (TIMP-2) · insulin-like growth factor-binding protein 7 (IGFBP7) predicts adverse outcome in pediatric acute kidney injury. PLoS One. 2015;10(11):1-16. https://doi.org/10.1371/journal.pone.0143628.
9. Berg UB, Nyman U, Bäck R, et al. New standardized cystatin C and creatinine GFR equations in children validated with inulin clearance. Pediatr Nephrol. 2015;30(8):1317-1326. https://doi.org/10.1007/s00467-015-3060-3.
10. Chawla LS, Goldstein SL, Kellum JA, Ronco C. Renal angina: concept and development of pretest probability assessment in acute kidney injury. Crit Care. 2015;19(1):93. https://doi.org/10.1186/s13054-015-0779-y.
11. Menon S, Goldstein SL, Mottes T, et al. Urinary biomarker incorporation into the renal angina index early in intensive care unit admission optimizes acute kidney injury prediction in critically ill children: a prospective cohort study. Nephrol Dial Transplant. 2016;31(4):586-594. https://doi.org/10.1093/ndt/gfv457.
12. Goldstein SL, Mottes T, Simpson K, et al. A sustained quality improvement program reduces nephrotoxic medication-associated acute kidney injury. Kidney Int. 2016;90(1):212-221. https://doi.org/10.1016/j.kint.2016.03.031.
13. Downes KJ, Cowden C, Laskin BL, et al. Association of acute kidney injury with concomitant vancomycin and piperacillin/tazobactam treatment among hospitalized children. JAMA Pediatr. 2017;19146:e173219-e173219. https://doi.org/10.1001/JAMAPEDIATRICS.2017.3219.
14. Naipaul A, Jefferson LS, Goldstein SL, Loftis LL, Zappitelli M, Arikan AA. Fluid overload is associated with impaired oxygenation and morbidity in critically ill children*. Pediatr Crit Care Med. 2011;13(3):253-258. https://doi.org/10.1097/pcc.0b013e31822882a3.
15. Lumlertgul N, Peerapornratana S, Trakarnvanich T, et al. Early versus standard initiation of renal replacement therapy in furosemide stress test non-responsive acute kidney injury patients (the FST trial). Crit Care. 2018;22(1):1-9. https://doi.org/10.1186/s13054-018-2021-1.
Acute kidney injury (AKI) occurs in 5%-30% of noncritically ill hospitalized children.1 Initially thought to be simply a symptom of more severe pathologies, it is now recognized that AKI independently increases mortality and is associated with the development of chronic kidney disease (CKD), even in children.2 The wide acceptance of the Kidney Disease Improving Global Outcome (KDIGO) diagnostic criteria has enabled a more uniform definition of AKI from both clinical and research perspectives.2 A better understanding of the pathophysiology and risk factors for AKI has led to new methods for early detection and prevention efforts. While serum creatinine (SCr) was historically one of the sole markers of AKI, novel biomarkers can facilitate earlier diagnosis of AKI, identify subclinical AKI, and guide clinical management. This clinical practice update addresses the latest clinical advances in risk assessment, diagnosis, and prevention of pediatric AKI, with a focus on AKI biomarkers.
DIAGNOSIS, BIOMARKERS, AND DEFINITION
Several sets of criteria have been used to diagnose AKI. The KDIGO classification, based on a systematic review of the literature and developed through expert consensus, is the current recommended definition.3 Increasing AKI stage, as defined by the KDIGO classification, is associated with increased mortality, the need for renal replacement therapy, length of stay, and CKD, thus underscoring the importance of accurate classification.3 Stage 1 AKI is defined by a rise in SCr of ≥0.3 mg/dL,1.5-1.9 times the baseline SCr, or urine output <0.5 ml/kg/h for six to 12 hours; stage 2 by a rise of ≥2.0-2.9 times the baseline SCr or urine output <0.5 ml/kg/h for >12 hours; and stage 3 by a rise of ≥4.0 mg/dL, ≥three times the baseline SCr, initiation of renal replacement therapy, urine output <0.3 ml/kg/h for ≥24 hours, or anuria ≥12 hours. However, these criteria rely on SCr, which is a suboptimal marker of renal dysfunction, as it rises only once the glomerular filtration rate (GFR) has already decreased, in some cases by as much as 50%. Additionally, interpretation of SCr in the diagnosis of AKI requires a prior Scr measurement to determine the magnitude of change from the baseline value, which is often lacking in children. To mitigate this limitation, different formulas exist to estimate a baseline SCr value based on height or age, an approach that assumes patients have preexisting normal renal function.
The limitations of SCr have led to interest in identifying more accurate biomarkers of AKI. Although many candidates have been identified, we will limit our discussion to those currently available for clinical use: serum cystatin C, urine neutrophil gelatinase-associated lipocalin (NGAL), urine TIMP-2, and urine IGFBP7 (Table).4-8 While urine NGAL and cystatin C are measured individually, TIMP-2 and IGFBP7 are measured on the same panel and the product of their multiplied values is used for clinical guidance. While each of these biomarkers have good predictive accuracy for AKI when used independently, their combined use increases the accuracy of AKI diagnosis. These biomarkers can be divided into broad categories based on their utility as either functional markers or markers of injury.6 Serum cystatin C is a functional marker and as such can be used to estimate GFR more accurately than SCr.9 Comparatively, urine NGAL is a marker of renal injury, while TIMP2 and IGFBP7 are markers of renal stress. These markers are not useful in estimating GFR, but rather aid in the prediction and diagnosis of AKI (Figure). Despite the limitations of SCr, these biomarkers have yet to be incorporated into the diagnostic criteria. They have, however, helped to refine our understanding of the pathophysiology of AKI.
AKI has classically been divided into three categories based on the etiology of injury, namely prerenal azotemia, intrinsic renal disease, and postrenal causes. The discovery of new biomarkers adds nuance to the classification of AKI. Two groups of biomarkers are particularly helpful in this regard: markers of structural injury (eg, NGAL) and functional markers (eg, cystatin C). The combination of these biomarkers with SCr has refined the categories of AKI (Figure). For example, NGAL can accurately distinguish between a rise in SCr due to functional AKI, previously referred to as prerenal azotemia, and a rise in SCr due to intrinsic kidney injury. An elevation of structural injury biomarkers in the absence of a significant rise in SCr is referred to as subclinical AKI. Patients with subclinical AKI have worse outcomes than those without AKI but better outcomes than patients with AKI with elevation of both SCr and NGAL (Figure).2,6 Time to resolution of AKI further refines our ability to predict prognosis and outcomes. Transient AKI, defined as resolution within 48 hours, is associated with a better prognosis than persistent AKI. Renal dysfunction lasting more than seven days but less than 90 days is referred to as acute kidney disease (AKD). While both transient AKI and AKD represent different entities on the continuum between AKI and CKD, further research is needed to better elucidate these classifications.2
RISK STRATIFICATION
The renal angina index (RAI) identifies critically ill children at high risk for AKI. The RAI combines traditional markers of AKI, such as a change in estimated creatinine clearance and fluid overload, with patient factors, including need for ventilation, inotropic support, and history of transplantation (solid organ or bone marrow) to identify those patients who are at high risk for severe AKI. Patients identified as high risk by the patient factors component of the RAI have a much lower threshold for both a decrease in creatinine clearance and fluid overload to be considered at risk for severe AKI, as these early signs are more likely to reflect an early impending severe AKI in this high-risk group. Conversely, patients that do not meet these patient factors are more likely to simply have a transient or functional AKI, and therefore have a higher threshold for both a change in creatinine clearance and fluid overload in order to be considered at high risk for severe AKI.
The RAI has been validated in the critical care setting as a method to predict severe AKI at day three of admission to the pediatric intensive care unit, with a negative predictive value of 92%-99% when the score is negative in the first 12 hours.10 In selected high-risk patients (RAI ≥ 8), biomarkers become even more reliable for AKI prediction (eg, injury markers have an excellent area under the receiver operating characteristic curve (AUC) of 0.97 for severe AKI prediction in this high-risk group).11 While only validated for critically ill patients, the concept of renal angina is still applicable in the complex populations managed by hospitalists who practice outside of the intensive care unit setting. Early signs of renal dysfunction (eg, rising SCr, fluid overload ≥5%) in patients with risk factors (see below) should prompt a thorough evaluation, including urinalysis, daily SCr, nephrotoxin avoidance, and tissue injury biomarkers, if available.
The risk factors for AKI are numerous and tend to potentiate one another. The most frequent predisposing comorbidities include CKD, heart failure or congenital heart diseases, transplantation (bone marrow or solid organs), and diabetes. Disease-related factors include sepsis, cardiac surgery, cardio-pulmonary bypass, mechanical ventilation, and vasopressor use. Potentially modifiable factors include hypovolemia and multiple nephrotoxic exposures. 2,3
Nephrotoxic medications are now among the most common causes of AKI in hospitalized children.12 Approximately 80% of children are exposed to at least one nephrotoxin during an inpatient admission.12 Exposure to a single nephrotoxic medication is sufficient to place a child at risk of AKI, and each additional nephrotoxin further increases the risk.12 While some drugs are routinely recognized to be nephrotoxic (eg, ibuprofen), others are commonly overlooked, notably certain antibiotics (eg, cefotaxime, ceftazidime, cefuroxime, nafcillin, and piperacillin) and anticonvulsants (eg, zonisamide).12 Furthermore, the combination of multiple nephrotoxins can potentiate the risk of AKI. For example, the combination of vancomycin and piperacillin/tazobactam increases the risk of AKI by 3.4 times compared with the combination of vancomycin with another antipseudomonal beta-lactam antibiotic.13
Adequate monitoring, including daily SCr measurements and risk awareness, are critical as nephrotoxin-associated AKI can be easily missed in the absence of routine SCr monitoring, especially since these children are typically nonoliguric12. Quality improvement efforts focused on obtaining daily SCr in patients exposed to either three or more nephrotoxins or three days of either aminoglycoside or vancomycin, even without concomitant exposure to other nephrotoxins, have shown success in decreasing both the number of nephrotoxins and the rate of nephrotoxin-associated AKI.12
While a significant injury cannot always be avoided, a mindful clinical approach and management can help to prevent some complications of AKI. An awareness of fluid status is critical, as fluid overload greater than 10% of the patient’s weight independently increases the risk of mortality in both adults and children.14 To assess the risk of AKI progression and potential failure of conservative management with diuretics, a furosemide stress test (FST) is an easy, safe, and accessible functional assessment of tubular reserve in a patient without intravascular depletion.15 A growing body of literature in adults shows that FST-responders are less likely to progress to stage 3 AKI or need renal replacement therapy than nonresponders.15 The FST is currently being investigated and standardized in children.
CONCLUSION
Research in AKI has made significant strides over the last few years. Nevertheless, many areas of research remain to be explored (eg, the impact of IV fluid type in the pediatric population, AKD characterization and impact on CKD development). AKI is common, associated with significant morbidity and mortality and, in some instances, preventable. While no targeted therapeutic options are currently under investigation, recent advances allow for better identification of high-risk patients and offer opportunities for impactful preventive approaches. Thoughtful use of nephrotoxic medications, early identification of patients at high risk for AKI, and accurate diagnosis and appropriate management of AKI are the recommended best practice.
Disclosures
The authors have nothing to disclose.
1. McGregor TL, Jones DP, Wang L, et al. Acute kidney injury incidence in noncritically ill hospitalized children, adolescents, and young adults: a retrospective observational study. Am J Kidney Dis. 2016;67(3):384-390. https://doi.org/10.1053/j.ajkd.2015.07.019.
2. Chawla LS, Bellomo R, Bihorac A, et al. Acute kidney disease and renal recovery: consensus report of the Acute Disease Quality Initiative (ADQI) 16 Workgroup. Nat Rev Nephrol. 2017;13(4):241-257. https://doi.org/10.1038/nrneph.2017.2.
3. Khwaja A. KDIGO clinical practice guidelines for acute kidney injury. Nephron Clin Pract. 2012;120(4):179-184. https://doi.org/10.1159/000339789.
4. Filho LT, Grande AJ, Colonetti T, Della ÉSP, da Rosa MI. Accuracy of neutrophil gelatinase-associated lipocalin for acute kidney injury diagnosis in children: systematic review and meta-analysis. Pediatr Nephrol. 2017;32(10):1979-1988. https://doi.org/10.1007/s00467-017-3704-6.
5. Levey AS, Inker LA. Assessment of glomerular filtration rate in health and disease: a state of the art review. Clin Pharmacol Ther. 2017;102(3):405-419. https://doi.org/10.1002/cpt.729.
6. Endre ZH, Kellum JA, Di Somma S, et al. Differential diagnosis of AKI in clinical practice by functional and damage biomarkers: workgroup statements from the tenth Acute Dialysis Quality Initiative Consensus Conference. Contrib Nephrol. 2013;182:30-44. https://doi.org/10.1159/000349964.
7. Su LJ, Li YM, Kellum JA, Peng ZY. Predictive value of cell cycle arrest biomarkers for cardiac surgery-associated acute kidney injury: a meta-analysis. Br J Anaesth. 2018;121(2):350-357. https://doi.org/10.1016/j.bja.2018.02.069.
8. Westhoff JH, Tönshoff B, Waldherr S, et al. Urinary tissue inhibitor of metalloproteinase-2 (TIMP-2) · insulin-like growth factor-binding protein 7 (IGFBP7) predicts adverse outcome in pediatric acute kidney injury. PLoS One. 2015;10(11):1-16. https://doi.org/10.1371/journal.pone.0143628.
9. Berg UB, Nyman U, Bäck R, et al. New standardized cystatin C and creatinine GFR equations in children validated with inulin clearance. Pediatr Nephrol. 2015;30(8):1317-1326. https://doi.org/10.1007/s00467-015-3060-3.
10. Chawla LS, Goldstein SL, Kellum JA, Ronco C. Renal angina: concept and development of pretest probability assessment in acute kidney injury. Crit Care. 2015;19(1):93. https://doi.org/10.1186/s13054-015-0779-y.
11. Menon S, Goldstein SL, Mottes T, et al. Urinary biomarker incorporation into the renal angina index early in intensive care unit admission optimizes acute kidney injury prediction in critically ill children: a prospective cohort study. Nephrol Dial Transplant. 2016;31(4):586-594. https://doi.org/10.1093/ndt/gfv457.
12. Goldstein SL, Mottes T, Simpson K, et al. A sustained quality improvement program reduces nephrotoxic medication-associated acute kidney injury. Kidney Int. 2016;90(1):212-221. https://doi.org/10.1016/j.kint.2016.03.031.
13. Downes KJ, Cowden C, Laskin BL, et al. Association of acute kidney injury with concomitant vancomycin and piperacillin/tazobactam treatment among hospitalized children. JAMA Pediatr. 2017;19146:e173219-e173219. https://doi.org/10.1001/JAMAPEDIATRICS.2017.3219.
14. Naipaul A, Jefferson LS, Goldstein SL, Loftis LL, Zappitelli M, Arikan AA. Fluid overload is associated with impaired oxygenation and morbidity in critically ill children*. Pediatr Crit Care Med. 2011;13(3):253-258. https://doi.org/10.1097/pcc.0b013e31822882a3.
15. Lumlertgul N, Peerapornratana S, Trakarnvanich T, et al. Early versus standard initiation of renal replacement therapy in furosemide stress test non-responsive acute kidney injury patients (the FST trial). Crit Care. 2018;22(1):1-9. https://doi.org/10.1186/s13054-018-2021-1.
© 2019 Society of Hospital Medicine
Nurturing Sustainability in a Growing Community Pediatric Hospital Medicine Workforce
Systematic efforts to measure and compare work hours emerged in the 19th century as laborers shifted from artisanal shops to factories, sparking debate over the appropriate length and intensity of work.1 Two centuries of unionization and regulation defined work hours for many United States employees, including graduate medical trainees, but left attending physicians largely untouched. Instead, the medical workforce has long relied on survey data to shape jobs that balance professional norms with local market demands. Leaders in young, dynamic specialties, such as pediatric hospital medicine (PHM), particularly require such data to recruit and retain talent.
PHM progressed swiftly from acknowledgment as a “distinct area of practice” in 1999 to a subspecialty recognition.2 Currently, at least 3,000 pediatric hospitalists3 practice in more than 800 US sites (Snow C, Personal communication regarding community PHM workforce survey). Approximately half of them work at community hospitals, where PHM groups often comprise fewer than five full-time equivalents (FTEs) and face unique challenges. Community PHM practices may assume broader responsibilities than university/children’s hospital colleagues, including advocacy for the needs of children in predominantly adult-oriented hospitals.4 Although data regarding academic PHM work demands are available,5 there is little information pertaining to community hospitalists regarding typical workloads or other characteristics of thriving practices.
In this issue of the Journal of Hospital Medicine, Alvarez et al. present the findings of structured interviews with 70 community PHM group leaders.6 Each participant answered 12 questions about their group, addressing the definition of a full-time workload and hours, the design of backup systems, and the respondent’s perception of the program’s sustainability. The sample is robust, with the caveats that it disproportionately represents the Midwest and West (34.3% each) and more than half of the groups were employed by an academic institution. The authors found a median work expectation per FTE of 1,882 hours/year and 21 weekends per year, although they noted significant variability in employers’ demands and services provided. The majority of hospitalist groups lacked census caps, formal backup systems, or processes to expand coverage during busy seasons. Among the site leaders, 63% perceived their program as sustainable, but no program design or employer characteristic was clearly associated with this perception.
The importance of this study derives from aggregating data about the largest cross section of community PHM groups yet reported. For many PHM group leaders, this will offer a new point of reference for key practice characteristics. Furthermore, the authors should be commended for attempting to distinguish how program sustainability manifests in community PHM, where hospitalists shoulder longer patient care hours and many of them sustain academic endeavors. It is concerning that more than a third of leaders do not perceive their program as sustainable, but the implications for the field are unclear. Perhaps part of this uncertainty arises from the terminology, as sustainability lacks a technical or a consensus definition and the authors purposefully did not define the term for the respondents. While many respondents probably worried about physician burnout, others might have channeled fears about group finances or competition with adult service lines for beds. In addition, leaders’ fears about sustainability may not exactly represent the concerns of front-line employees.
Sustainable work environments are complex constructs with several inputs. For example, supportive leaders, efficient delivery systems, optimized EHRs, competitive pay, and confidence about service line stability might all mitigate higher workloads. Ultimately, this complexity underscores an important caution about all workplace surveys in medicine; ie, average values can inform practice design, but hospitalists and administrators should always consider the local context. Blindly applying medians as benchmarks and ignoring the myriad other contributors to sustainable practice risk disrupting successful PHM programs. In other words, surveys describe how the world is, not how it should be. The spectrum of academic work and norms permeating community PHM groups instead call for a nuanced approach.
How does the field build upon this useful paper? First, the Society of Hospital Medicine (SHM) should engage PHM leaders to increase participation in regular remeasurement, a critical endeavor for this dynamic field. SHM’s State of Hospital Medicine Report queries about a wider variety of practice characteristics, but it has a smaller sample size that must grow to fill this void.7 As the work of repeated surveys transitions from academic inquiry to professional society service, SHM’s Practice Analysis Committee can meet the needs of PHM through relevant questions and efforts to foster adequate participation. Second, all practice leaders should follow the ballooning bodies of literature about burnout and healthcare value. Just as labor leaders had discovered in the industrial revolution, sustainable careers require not only measuring work hours but also advocating for safe, meaningful, and engaging work conditions. By continuously creating value for patients, families, and hospitals, we can strengthen our claim to the resources needed to optimize the work environment.
Disclosure
Andrew White is Chair of the Society of Hospital Medicine’s Practice Analysis Committee, an unpaid position. Dr. Marek serves on the American Academy of Pediatrics Section on Hospital Medicine Executive Committee which is a voluntary, unpaid, elected position.
1. Whaples R. Hours of Work in U.S. History. EH Net Encyclopedia. 2001. http://eh.net/encyclopedia/hours-of-work-in-u-s-history/. Accessed June 25, 2019.
2. Pediatric Hospital Medicine Certification. The American Board of Pediatrics.
https://www.abp.org/content/pediatric-hospital-medicine-certification.
Accessed 28 February, 2018.
3. Harbuck SM, Follmer AD, Dill MJ, Erikson C. Estimating the number and characteristics
of hospitalist physicians in the United States and their possible workforce
implications. Association of Medical Colleges. 2012. www.aamc.org/download/
300620/data/aibvol12_no3-hospitalist.pdf. Accessed June 25, 2019.
4. Roberts KB, Brown J, Quinonez RA, Percelay JM. Institutions and individuals:
what makes a hospitalist “academic”? Hosp Pediatr. 2014;4(5);326-327.
https://doi.org/10.1542/hpeds.2014-00.
5. Fromme HB, Chen CO, Fine BR, Gosdin C, Shaughnessy EE. Pediatric hospitalist
workload and sustainability in university-based programs: results from a
national interview-based survey. J Hosp Med. 2018;13(10):702-705. https://doi.
org/10.12788/jhm.2977.
6. Alvarez, F, McDaniel CE, Birnie K, et al. Community pediatric hospitalist
workload: results from a national survey. J Hosp Med. 2019; 14(11):682-685. https://
doi.org/10.12788/jhm.3263.
7. 2018 State of Hospital Medicine Report. Society of Hospital Medicine: Philadelphia,
Pennsylvania; 2019. https://www.hospitalmedicine.org/practice-management/
shms-state-of-hospital-medicine/. Accessed July 27, 2019.
Systematic efforts to measure and compare work hours emerged in the 19th century as laborers shifted from artisanal shops to factories, sparking debate over the appropriate length and intensity of work.1 Two centuries of unionization and regulation defined work hours for many United States employees, including graduate medical trainees, but left attending physicians largely untouched. Instead, the medical workforce has long relied on survey data to shape jobs that balance professional norms with local market demands. Leaders in young, dynamic specialties, such as pediatric hospital medicine (PHM), particularly require such data to recruit and retain talent.
PHM progressed swiftly from acknowledgment as a “distinct area of practice” in 1999 to a subspecialty recognition.2 Currently, at least 3,000 pediatric hospitalists3 practice in more than 800 US sites (Snow C, Personal communication regarding community PHM workforce survey). Approximately half of them work at community hospitals, where PHM groups often comprise fewer than five full-time equivalents (FTEs) and face unique challenges. Community PHM practices may assume broader responsibilities than university/children’s hospital colleagues, including advocacy for the needs of children in predominantly adult-oriented hospitals.4 Although data regarding academic PHM work demands are available,5 there is little information pertaining to community hospitalists regarding typical workloads or other characteristics of thriving practices.
In this issue of the Journal of Hospital Medicine, Alvarez et al. present the findings of structured interviews with 70 community PHM group leaders.6 Each participant answered 12 questions about their group, addressing the definition of a full-time workload and hours, the design of backup systems, and the respondent’s perception of the program’s sustainability. The sample is robust, with the caveats that it disproportionately represents the Midwest and West (34.3% each) and more than half of the groups were employed by an academic institution. The authors found a median work expectation per FTE of 1,882 hours/year and 21 weekends per year, although they noted significant variability in employers’ demands and services provided. The majority of hospitalist groups lacked census caps, formal backup systems, or processes to expand coverage during busy seasons. Among the site leaders, 63% perceived their program as sustainable, but no program design or employer characteristic was clearly associated with this perception.
The importance of this study derives from aggregating data about the largest cross section of community PHM groups yet reported. For many PHM group leaders, this will offer a new point of reference for key practice characteristics. Furthermore, the authors should be commended for attempting to distinguish how program sustainability manifests in community PHM, where hospitalists shoulder longer patient care hours and many of them sustain academic endeavors. It is concerning that more than a third of leaders do not perceive their program as sustainable, but the implications for the field are unclear. Perhaps part of this uncertainty arises from the terminology, as sustainability lacks a technical or a consensus definition and the authors purposefully did not define the term for the respondents. While many respondents probably worried about physician burnout, others might have channeled fears about group finances or competition with adult service lines for beds. In addition, leaders’ fears about sustainability may not exactly represent the concerns of front-line employees.
Sustainable work environments are complex constructs with several inputs. For example, supportive leaders, efficient delivery systems, optimized EHRs, competitive pay, and confidence about service line stability might all mitigate higher workloads. Ultimately, this complexity underscores an important caution about all workplace surveys in medicine; ie, average values can inform practice design, but hospitalists and administrators should always consider the local context. Blindly applying medians as benchmarks and ignoring the myriad other contributors to sustainable practice risk disrupting successful PHM programs. In other words, surveys describe how the world is, not how it should be. The spectrum of academic work and norms permeating community PHM groups instead call for a nuanced approach.
How does the field build upon this useful paper? First, the Society of Hospital Medicine (SHM) should engage PHM leaders to increase participation in regular remeasurement, a critical endeavor for this dynamic field. SHM’s State of Hospital Medicine Report queries about a wider variety of practice characteristics, but it has a smaller sample size that must grow to fill this void.7 As the work of repeated surveys transitions from academic inquiry to professional society service, SHM’s Practice Analysis Committee can meet the needs of PHM through relevant questions and efforts to foster adequate participation. Second, all practice leaders should follow the ballooning bodies of literature about burnout and healthcare value. Just as labor leaders had discovered in the industrial revolution, sustainable careers require not only measuring work hours but also advocating for safe, meaningful, and engaging work conditions. By continuously creating value for patients, families, and hospitals, we can strengthen our claim to the resources needed to optimize the work environment.
Disclosure
Andrew White is Chair of the Society of Hospital Medicine’s Practice Analysis Committee, an unpaid position. Dr. Marek serves on the American Academy of Pediatrics Section on Hospital Medicine Executive Committee which is a voluntary, unpaid, elected position.
1. Whaples R. Hours of Work in U.S. History. EH Net Encyclopedia. 2001. http://eh.net/encyclopedia/hours-of-work-in-u-s-history/. Accessed June 25, 2019.
2. Pediatric Hospital Medicine Certification. The American Board of Pediatrics.
https://www.abp.org/content/pediatric-hospital-medicine-certification.
Accessed 28 February, 2018.
3. Harbuck SM, Follmer AD, Dill MJ, Erikson C. Estimating the number and characteristics
of hospitalist physicians in the United States and their possible workforce
implications. Association of Medical Colleges. 2012. www.aamc.org/download/
300620/data/aibvol12_no3-hospitalist.pdf. Accessed June 25, 2019.
4. Roberts KB, Brown J, Quinonez RA, Percelay JM. Institutions and individuals:
what makes a hospitalist “academic”? Hosp Pediatr. 2014;4(5);326-327.
https://doi.org/10.1542/hpeds.2014-00.
5. Fromme HB, Chen CO, Fine BR, Gosdin C, Shaughnessy EE. Pediatric hospitalist
workload and sustainability in university-based programs: results from a
national interview-based survey. J Hosp Med. 2018;13(10):702-705. https://doi.
org/10.12788/jhm.2977.
6. Alvarez, F, McDaniel CE, Birnie K, et al. Community pediatric hospitalist
workload: results from a national survey. J Hosp Med. 2019; 14(11):682-685. https://
doi.org/10.12788/jhm.3263.
7. 2018 State of Hospital Medicine Report. Society of Hospital Medicine: Philadelphia,
Pennsylvania; 2019. https://www.hospitalmedicine.org/practice-management/
shms-state-of-hospital-medicine/. Accessed July 27, 2019.
© 2019 Society of Hospital Medicine
Brentuximab vedotin plus nivolumab shows positive outcomes in PMBL
Combination brentuximab vedotin and nivolumab showed manageable safety and high activity in patients with relapsed/refractory primary mediastinal B-cell lymphoma (PMBL), according to results from a phase 2 trial.
“We evaluated whether the combination of nivolumab and [brentuximab vedotin] was safe and synergistically effective in patients with [relapsed/refractory] PMBL,” Pier Luigi Zinzani, MD, PhD, of the University of Bologna (Italy), and colleagues wrote in the Journal of Clinical Oncology.
The CheckMate 436 study is a multicenter, open-label, phase 1-2 study that included patients with relapsed/refractory disease who had previously received autologous stem cell transplantation (ASCT) or had two or more previous chemotherapy regimens for those ineligible for ASCT.
The phase 2 component evaluated the safety and efficacy of the two-drug combo in an expansion cohort of 30 patients. Study participants received intravenous brentuximab vedotin at 1.8 mg/kg and nivolumab at 240 mg every 3 weeks until cancer progression or intolerable adverse effects.
The primary outcomes were the investigator-evaluated objective response rate and safety. Secondary outcomes included progression-free survival, complete remission rate, overall duration of response, among other measures.
After analysis, the researchers reported that 53% of patients had grade 3 or 4 treatment-related toxicities following a median of five treatment cycles. The most common treatment-related toxicities were neutropenia (30%) and peripheral neuropathy (27%).
Five patients died during the study follow-up, four because of disease progression and one as a result of sepsis that was not considered related to treatment.
At a median follow-up of 11.1 months, the objective response rate was 73% in study participants, including 11 patients (37%) who achieved a complete response and 11 patients (37%) who had a partial response. An additional three patients had stable disease.
The median progression-free survival, duration of response, and overall survival were not reached in this study.
“The combination of nivolumab and [brentuximab vedotin] may be synergistic and is highly active in patients with [relapsed/refractory] PMBL, serving as a potential bridge to other consolidative therapies of curative intent,” the researchers wrote.
The study was funded by Bristol-Myers Squibb and Seattle Genetics. The authors reported financial affiliations with the study sponsors and several other companies.
SOURCE: Zinzani PL et al. J Clin Oncol. 2019 Aug 9. doi: 10.1200/JCO.19.01492.
FROM THE JOURNAL OF CLINICAL ONCOLOGY
Key clinical point: Brentuximab vedotin plus nivolumab showed manageable safety and positive activity in patients with relapsed/refractory primary mediastinal B-cell lymphoma (PMBL).
Major finding: At 11.1 months, the objective response rate was 73% in study participants, including 37% of patients who achieved a complete response and 37% who had a partial response.
Study details: A phase 2 study of 30 patients with relapsed/refractory PMBL.
Disclosures: The study was funded by Bristol-Myers Squibb and Seattle Genetics. The authors reported financial affiliations with the study sponsors and several other companies.
Source: Zinzani PL et al. J Clin Oncol. 2019 Aug 9. doi: 10.1200/JCO.19.01492.
Unsubsidized enrollees leaving insurance exchanges
Both overall and unsubsidized enrollment in the various state and federal health insurance exchanges dropped in 2018, but new data on payments for those policies show that more people paid their premiums in 2019, according to the Centers for Medicare & Medicaid Services.
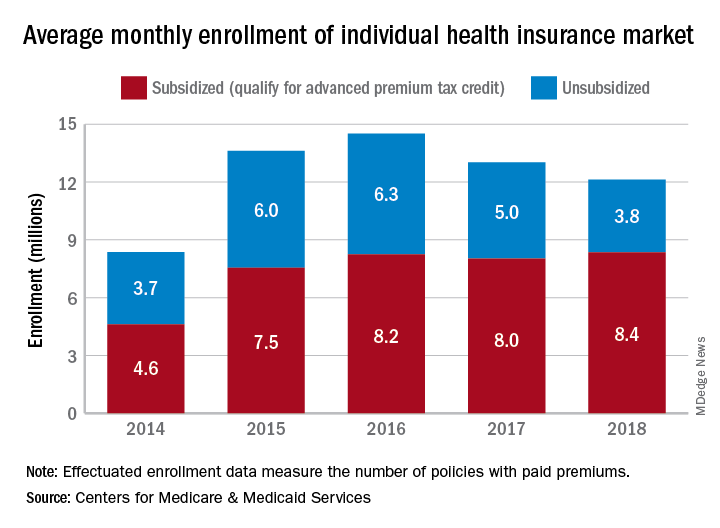
The number of policies selected with the individual insurance exchanges in late 2018 for which premiums were paid in February 2019 (termed the effectuated enrollment) was almost 10.6 million, or more than 92% of the 11.4 million plans selected during open enrollment, CMS reported. For February 2018, effectuated enrollment was just over 10.5 million, which represented 89.5% of the nearly 11.8 million policies selected during the previous open enrollment.
Over the longer term, the trend has been a rise and a fall as average monthly effectuated enrollment peaked in 2016 and dropped 16.5% by 2018, CMS data show.
A look at the advance premium tax credit (APTC) provides some insight into that decline. The population subsidized by the APTC has been fairly stable since 2016 – effectuated enrollment rose by just over 1% – but the number of unsubsidized enrollees has dropped 40% as 2.5 million people who did not qualify for the APTC left the market, the CMS said.
From 2017 to 2018, there were 47 states with declines in unsubsidized enrollment, with 9 states losing more than 40% of such enrollees. The largest drop in the unsubsidized population (85%) came in Iowa, while Alaska’s 7% gain was the largest increase, the CMS reported.
“As President Trump predicted, people are fleeing the individual market. Obamacare is failing the American people, and the ongoing exodus of the unsubsidized population from the market proves that Obamacare’s sky-high premiums are unaffordable,” CMS Administrator Seema Verma said in a written statement.
Both overall and unsubsidized enrollment in the various state and federal health insurance exchanges dropped in 2018, but new data on payments for those policies show that more people paid their premiums in 2019, according to the Centers for Medicare & Medicaid Services.
The number of policies selected with the individual insurance exchanges in late 2018 for which premiums were paid in February 2019 (termed the effectuated enrollment) was almost 10.6 million, or more than 92% of the 11.4 million plans selected during open enrollment, CMS reported. For February 2018, effectuated enrollment was just over 10.5 million, which represented 89.5% of the nearly 11.8 million policies selected during the previous open enrollment.
Over the longer term, the trend has been a rise and a fall as average monthly effectuated enrollment peaked in 2016 and dropped 16.5% by 2018, CMS data show.
A look at the advance premium tax credit (APTC) provides some insight into that decline. The population subsidized by the APTC has been fairly stable since 2016 – effectuated enrollment rose by just over 1% – but the number of unsubsidized enrollees has dropped 40% as 2.5 million people who did not qualify for the APTC left the market, the CMS said.
From 2017 to 2018, there were 47 states with declines in unsubsidized enrollment, with 9 states losing more than 40% of such enrollees. The largest drop in the unsubsidized population (85%) came in Iowa, while Alaska’s 7% gain was the largest increase, the CMS reported.
“As President Trump predicted, people are fleeing the individual market. Obamacare is failing the American people, and the ongoing exodus of the unsubsidized population from the market proves that Obamacare’s sky-high premiums are unaffordable,” CMS Administrator Seema Verma said in a written statement.
Bimatoprost-Induced Iris Hyperpigmentation: Beauty in the Darkened Eye of the Beholder
To the Editor:
Long, dark, and thick eyelashes have been a focal point of society’s perception of beauty for thousands of years,1 and the use of makeup products such as mascaras, eyeliners, and eye shadows has further increased the perception of attractiveness of the eyes.2 Many eyelash enhancement methods have been developed or in some instances have been serendipitously discovered. Bimatoprost ophthalmic solution 0.03% originally was developed as an eye drop that was approved by the US Food and Drug Association (FDA) in 2001 for the reduction of elevated intraocular pressure in patients with open-angle glaucoma or ocular hypertension. An unexpected side effect of this product was eyelash hypertrichosis.3,4 As a result, the FDA approved
Because all follicular development occurs during embryogenesis, the number of eyelash follicles does not increase over time.6 Bitmatoprost eyelash solution works by prolonging the anagen (growth) phase of the eyelashes and stimulating the transition from the telogen (dormant) phase to the anagen phase. It also has been shown to increase the hair bulb diameter of follicles undergoing the anagen phase, resulting in thicker eyelashes.7 Although many patients have enjoyed this unexpected indication, prostaglandin (PG) analogues such as bimatoprost and latanoprost have a well-documented history of ocular side effects when applied directly to the eye. The most common adverse reactions include eye pruritus, conjunctival hyperemia, and eyelid pigmentation.3 The product safety information indicates that eyelid pigmentation typically is reversible.3,5 Iris pigmentation is perhaps the least desirable side effect of PG analogues and was first noted in latanoprost studies on primates.8 The underlying mechanism appears to be due to an increase in melanogenesis that results in an increase in melanin granules without concomitant proliferation of melanocytes, cellular atypia, or evidence of inflammatory reaction. Unfortunately, this pigmentation typically is permanent.3,5,9
Studies have shown that
An otherwise healthy 63-year-old woman presented to our clinic for an annual skin examination. She noted that she had worsening dark pigmentation of the bilateral irises. The patient did not have any personal or family history of melanoma or ocular nevi, and there were no associated symptoms of eye tearing, pruritus, burning, or discharge. No prior surgical procedures had been performed on or around the eyes, and the patient never used contact lenses. She had been intermittently using bimatoprost eyelash solution prescribed by an outside physician for approximately 3 years to enhance her eyelashes. Although she never applied the product directly into her eyes, she noted that she often was unmethodical in application of the product and that runoff from the product may have occasionally leaked into the eyes. Physical examination revealed bilateral blue irises with ink spot–like, grayish black patches encircling the bilateral pupils (Figure).
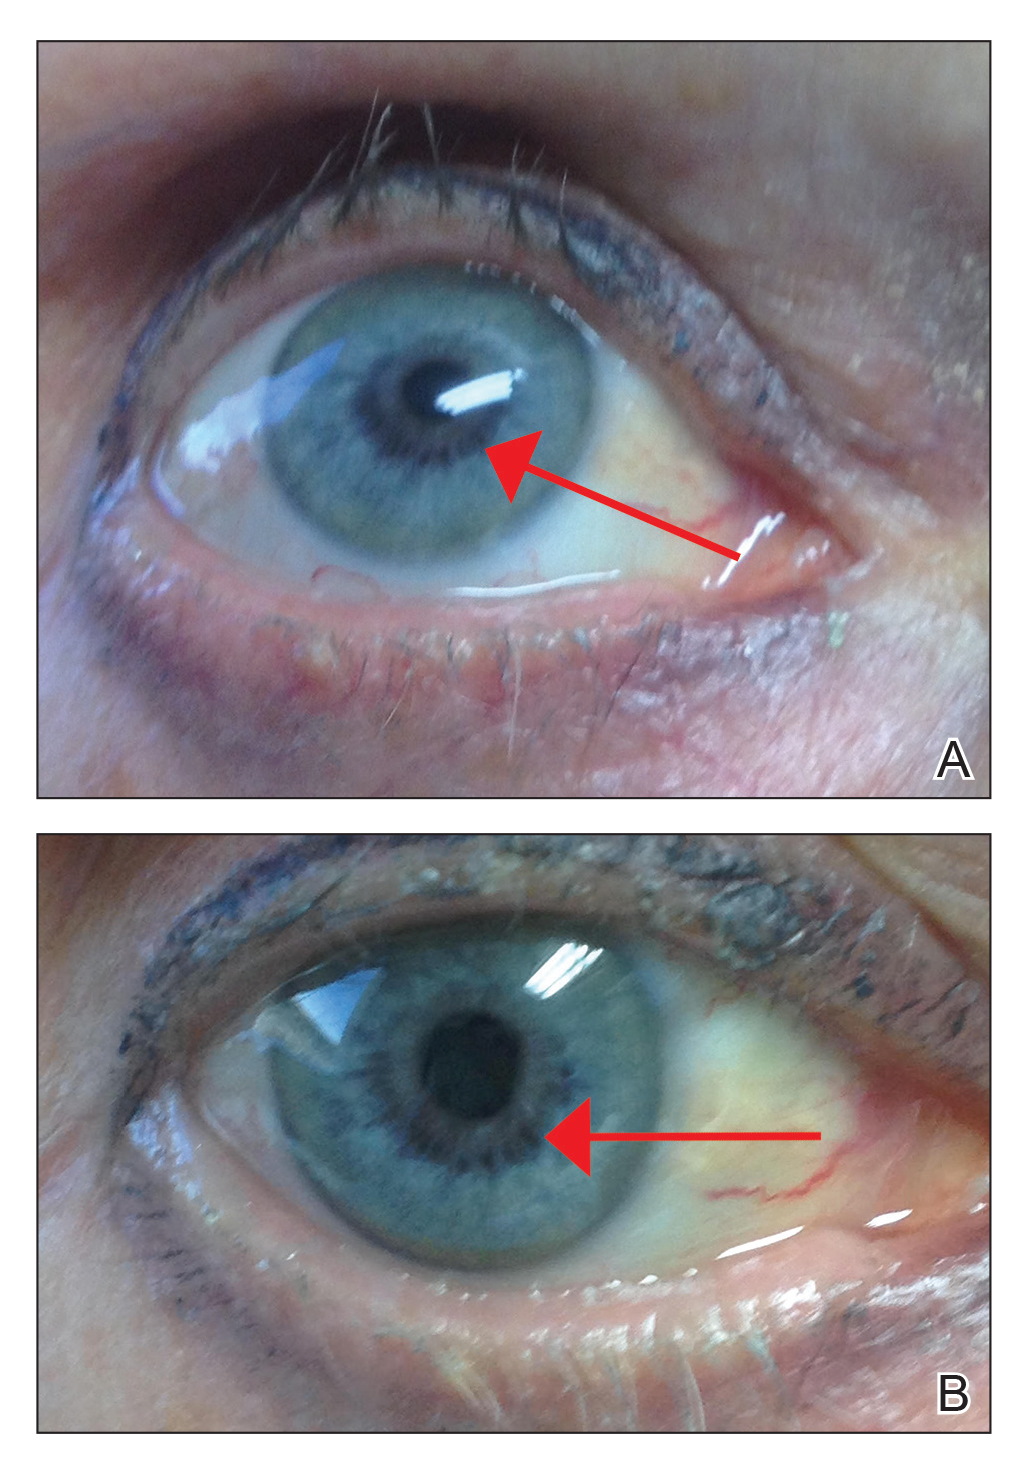
The patient was advised to stop using the product, but no improvement of the iris hyperpigmentation was appreciated at 6-month follow-up. The patient declined referral to ophthalmology for evaluation to confirm a diagnosis and discuss treatment because the hyperpigmentation did not bother her.
There have been several studies of iris hyperpigmentation with use of PG analogues in the treatment of glaucoma. In a phase 3 clinical trial of the safety and efficacy of latanoprost for treatment of ocular hypertension, it was noted that 24 (12%) of 198 patients experienced iris hyperpigmentation and that patients with heterogeneous pigmentation (ie, hazel irises and mixed coloring) were at an increased risk.11 Other studies also have shown an increased risk of iris hyperpigmentation due to heterogeneous phenotype12 as well as older age.13
Reports of bimatoprost eye drops used for treatment of glaucoma have shown a high incidence of iris hyperpigmentation with long-term use. A prospective study conducted in 2012 investigated the adverse events of bimatoprost eye drops in 52 Japanese patients with glaucoma or ocular hypertension. Clinical photographs of the irises, eyelids, and eyelashes were taken at baseline and after 6 months of treatment. It was noted that 50% (26/52) of participants experienced iris hyperpigmentation upon completion of treatment.10
In our patient, bimatoprost eyelash solution was applied to the top eyelid margins using an applicator; our patient did not use the eye drop formulation, which is directed for use in ocular hypertension or glaucoma. A PubMed search of articles indexed for MEDLINE using the terms bimatoprost and iris hyperpigmentation yielded no published peer-reviewed studies or case reports of iris hyperpigmentation caused by bimatoprost eyelash solution for treatment of eyelid hypotrichosis, which makes this case report novel. With that said, the package insert states iris hyperpigmentation as a side effect in the prescribing information for both a bimatoprost eye drop formulation used to treat ocular hypertension3 as well as a formulation for topical application on the eyelids/eyelashes.5 A 2014 retrospective review of long-term safety with bimatoprost eyelash solution for eyelash hypotrichosis reported 4 instances (0.7%) of documented adverse events after 12 months of use in 585 patients, including dry eye, eyelid erythema, ocular pruritus, and low ocular pressure. Iris hyperpigmentation was not reported.14
The method of bimatoprost application likely is a determining factor in the number of reported adverse events. Studies with similar treatment periods have demonstrated more adverse events associated with bimatoprost eye drops vs eyelash solution.15,16 When bimatoprost is used in the eye drop formulation for treatment of glaucoma, iris hyperpigmentation has been estimated to occur in 1.5%4 to 50%9 of cases. To our knowledge, there are no documented cases when bimatoprost eyelash solution is applied with a dermal applicator for treatment of eyelash hypotrichosis.15,17 These results may be explained using an ocular splash test. In one study using lissamine green dye, decreased delivery of bimatoprost eyelash solution with the dermal applicator was noted vs eye drop application. Additionally, it has been demonstrated that approximately 5% (based on weight) of a one-drop dose of bimatoprost eyelash solution applied to the dermal applicator is actually delivered to the patient.18 The rest of the solution remains on the applicator.
It is important that patients use bimatoprost eyelash solution as instructed in the prescribing information (eg, clean the face, remove makeup and contact lenses prior to applying the product). The eyelid should not be rinsed after application, which limits the possibility of the bimatoprost solution from contacting or pooling in the eye. One drop of bimatoprost eyelash solution should be applied to the applicator supplied by the manufacturer and distributed evenly along the skin of the upper eyelid margin at the base of the eyelashes. It is important to blot any excess solution runoff outside the upper eyelid margin.5 Of note, our patient admitted to not always doing this step, which may have contributed to her susceptibility to this rare side effect.
Prostaglandin analogues have been observed to cause iris hyperpigmentation when applied directly to the eye for use in the treatment of glaucoma.19 Theoretically, the same side-effect profile should apply in their use as a dermal application on the eyelids. For this reason, one manufacturer includes iris hyperpigmentation as an adverse side effect in the prescribing information.5 It is important for physicians who prescribe bimatoprost eyelash solution to inform patients of this rare yet possible side effect and to instruct patients on proper application to minimize hyperpigmentation.
Our literature review did not demonstrate previous cases of iris hyperpigmentation associated with bimatoprost eyelash solution. One study suggested that 2 patients experienced hypopigmentation; however, this was not clinically significant and was not consistent with the proposed iris pigmentation thought to be caused by bimatoprost eyelash solution.20
Potential future applications and off-label uses of bimatoprost include treatment of eyelash hypotrichosis on the lower eyelid margin and eyebrow hypertrichosis, as well as androgenic alopecia, alopecia areata, chemotherapy-induced alopecia, vitiligo, and hypopigmented scarring.21 Currently, investigational studies are looking at bimatoprost ophthalmic solution 0.03% for chemotherapy-induced eyelash hypotrichosis with positive results.22 In the future, bimatoprost may be used for other off-label and possibly FDA-approved uses.
- Draelos ZD. Special considerations in eye cosmetics. Clin Dermatol. 2001;19:424-430.
- Mulhern R, Fieldman G, Hussey T, et al. Do cosmetics enhance female Caucasian facial attractiveness? Int J Cosmet Sci. 2003;25:199-205.
- Lumigan [package insert]. Irvine, CA: Allergan, Inc; 2012.
- Higginbotham EJ, Schuman JS, Goldberg I, et al; Bimatoprost Study Groups 1 and 2. one-year, randomized study comparing bimatoprost and timolol in glaucoma and ocular hypertension. Arch Ophthalmol. 2002;120:1286-1293.
- Latisse [package insert]. Irvine, CA: Allergan, Inc; 2014.
- Hair diseases. In: Habif TP, ed. Clinical Dermatology: A Color Guide to Diagnosis and Treatment. 4th ed. St. Louis, MO: C.V. Mosby Company; 2003. 7. Fagien S. Management of hypotrichosis of the eyelashes: focus on bimatoprost. Clin Cosmet Investig Dermatol. 2010;2:29-48.
- Selen G, Stjernschantz J, Resul B. Prostaglandin-induced iridial pigmentation in primates. Surv Opthalmol. 1997;41(suppl 2):S125-128.
- Stjernschantz JW, Albert DM, Hu D-N, et al. Mechanism and clinical significance of prostaglandin-induced iris pigmentation. Surv Ophthalmol. 2002;47(suppl 1):162S-S175S.
- Inoue K, Shiokawa M, Sugahara M, et al. Iris and periocular adverse reactions to bimatoprost in Japanese patients with glaucoma or ocular hypertension. Clin Ophthalmol. 2012;6:111-116.
- Alm A, Camras C, Watson P. Phase III latanoprost studies in Scandinavia, the United Kingdom and the United States. Surv Ophthalmol. 1997;41(suppl 2):S105-S110.
- Wistrand PJ, Stjernschantz J, Olsson K. The incidence and time-course of latanoprost-induced iridial pigmentation as a function of eye color. Surv Ophthalmol. 1997;41(suppl 2):S129-S138.
- Arranz-Marquez E, Teus MA. Effect of age on the development of a latanoprost-induced increase in iris pigmentation. Ophthalmology. 2007;114:1255-1258.
- Yoelin S, Fagien S, Cox S, et al. A retrospective review and observational study of outcomes and safety of bimatoprost ophthalmic solution 0.03% for treating eyelash hypotrichosis. Dermatol Surg. 2014;40:1118-1124.
- Brandt JD, VanDenburgh AM, Chen K, et al; Bimatoprost Study Group. Comparison of once- or twice-daily bimatoprost with twice-daily timolol in patients with elevated IOP: a 3-month clinical trial. Ophthalmology. 2001;108:1023-1031; discussion 1032.
- Fagien S, Walt JG, Carruthers J, et al. Patient-reported outcomes of bimatoprost for eyelash growth: results from a randomized, double-masked, vehicle-controlled, parallel-group study. Aesthet Surg J. 2013;33:789-798.
- Yoelin S, Walt JG, Earl M. Safety, effectiveness, and subjective experience with topical bimatoprost 0.03% for eyelash growth. Dermatol Surg. 2010;36:638-649.
- Fagien S. Management of hypotrichosis of the eyelashes: focus on bimatoprost. Clin Cosmet Investig Dermatol. 2010;2:29-48.
- Rodríguez-Agramonte F, Jiménez JC, Montes JR. Periorbital changes associated with topical prostaglandins analogues in a Hispanic population. P R Health Sci J. 2017;36:218-222.
- Wirta D, Baumann L, Bruce S, et al. Safety and efficacy of bimatoprost for eyelash growth in postchemotherapy subjects. J Clin Aesthet Dermatol. 2015;8:11-20.
- Choi YM, Diehl J, Levins PC. Promising alternative clinical uses of prostaglandin F2α analogs: beyond the eyelashes [published online January 16, 2015]. J Am Acad Dermatol. 2015;72:712-716.
- Ahluwalia GS. Safety and efficacy of bimatoprost solution 0.03% topical application in patients with chemotherapy-induced eyelash loss. J Investig Dermatol Symp Proc. 2013;16:S73-S76.
To the Editor:
Long, dark, and thick eyelashes have been a focal point of society’s perception of beauty for thousands of years,1 and the use of makeup products such as mascaras, eyeliners, and eye shadows has further increased the perception of attractiveness of the eyes.2 Many eyelash enhancement methods have been developed or in some instances have been serendipitously discovered. Bimatoprost ophthalmic solution 0.03% originally was developed as an eye drop that was approved by the US Food and Drug Association (FDA) in 2001 for the reduction of elevated intraocular pressure in patients with open-angle glaucoma or ocular hypertension. An unexpected side effect of this product was eyelash hypertrichosis.3,4 As a result, the FDA approved
Because all follicular development occurs during embryogenesis, the number of eyelash follicles does not increase over time.6 Bitmatoprost eyelash solution works by prolonging the anagen (growth) phase of the eyelashes and stimulating the transition from the telogen (dormant) phase to the anagen phase. It also has been shown to increase the hair bulb diameter of follicles undergoing the anagen phase, resulting in thicker eyelashes.7 Although many patients have enjoyed this unexpected indication, prostaglandin (PG) analogues such as bimatoprost and latanoprost have a well-documented history of ocular side effects when applied directly to the eye. The most common adverse reactions include eye pruritus, conjunctival hyperemia, and eyelid pigmentation.3 The product safety information indicates that eyelid pigmentation typically is reversible.3,5 Iris pigmentation is perhaps the least desirable side effect of PG analogues and was first noted in latanoprost studies on primates.8 The underlying mechanism appears to be due to an increase in melanogenesis that results in an increase in melanin granules without concomitant proliferation of melanocytes, cellular atypia, or evidence of inflammatory reaction. Unfortunately, this pigmentation typically is permanent.3,5,9
Studies have shown that
An otherwise healthy 63-year-old woman presented to our clinic for an annual skin examination. She noted that she had worsening dark pigmentation of the bilateral irises. The patient did not have any personal or family history of melanoma or ocular nevi, and there were no associated symptoms of eye tearing, pruritus, burning, or discharge. No prior surgical procedures had been performed on or around the eyes, and the patient never used contact lenses. She had been intermittently using bimatoprost eyelash solution prescribed by an outside physician for approximately 3 years to enhance her eyelashes. Although she never applied the product directly into her eyes, she noted that she often was unmethodical in application of the product and that runoff from the product may have occasionally leaked into the eyes. Physical examination revealed bilateral blue irises with ink spot–like, grayish black patches encircling the bilateral pupils (Figure).
The patient was advised to stop using the product, but no improvement of the iris hyperpigmentation was appreciated at 6-month follow-up. The patient declined referral to ophthalmology for evaluation to confirm a diagnosis and discuss treatment because the hyperpigmentation did not bother her.
There have been several studies of iris hyperpigmentation with use of PG analogues in the treatment of glaucoma. In a phase 3 clinical trial of the safety and efficacy of latanoprost for treatment of ocular hypertension, it was noted that 24 (12%) of 198 patients experienced iris hyperpigmentation and that patients with heterogeneous pigmentation (ie, hazel irises and mixed coloring) were at an increased risk.11 Other studies also have shown an increased risk of iris hyperpigmentation due to heterogeneous phenotype12 as well as older age.13
Reports of bimatoprost eye drops used for treatment of glaucoma have shown a high incidence of iris hyperpigmentation with long-term use. A prospective study conducted in 2012 investigated the adverse events of bimatoprost eye drops in 52 Japanese patients with glaucoma or ocular hypertension. Clinical photographs of the irises, eyelids, and eyelashes were taken at baseline and after 6 months of treatment. It was noted that 50% (26/52) of participants experienced iris hyperpigmentation upon completion of treatment.10
In our patient, bimatoprost eyelash solution was applied to the top eyelid margins using an applicator; our patient did not use the eye drop formulation, which is directed for use in ocular hypertension or glaucoma. A PubMed search of articles indexed for MEDLINE using the terms bimatoprost and iris hyperpigmentation yielded no published peer-reviewed studies or case reports of iris hyperpigmentation caused by bimatoprost eyelash solution for treatment of eyelid hypotrichosis, which makes this case report novel. With that said, the package insert states iris hyperpigmentation as a side effect in the prescribing information for both a bimatoprost eye drop formulation used to treat ocular hypertension3 as well as a formulation for topical application on the eyelids/eyelashes.5 A 2014 retrospective review of long-term safety with bimatoprost eyelash solution for eyelash hypotrichosis reported 4 instances (0.7%) of documented adverse events after 12 months of use in 585 patients, including dry eye, eyelid erythema, ocular pruritus, and low ocular pressure. Iris hyperpigmentation was not reported.14
The method of bimatoprost application likely is a determining factor in the number of reported adverse events. Studies with similar treatment periods have demonstrated more adverse events associated with bimatoprost eye drops vs eyelash solution.15,16 When bimatoprost is used in the eye drop formulation for treatment of glaucoma, iris hyperpigmentation has been estimated to occur in 1.5%4 to 50%9 of cases. To our knowledge, there are no documented cases when bimatoprost eyelash solution is applied with a dermal applicator for treatment of eyelash hypotrichosis.15,17 These results may be explained using an ocular splash test. In one study using lissamine green dye, decreased delivery of bimatoprost eyelash solution with the dermal applicator was noted vs eye drop application. Additionally, it has been demonstrated that approximately 5% (based on weight) of a one-drop dose of bimatoprost eyelash solution applied to the dermal applicator is actually delivered to the patient.18 The rest of the solution remains on the applicator.
It is important that patients use bimatoprost eyelash solution as instructed in the prescribing information (eg, clean the face, remove makeup and contact lenses prior to applying the product). The eyelid should not be rinsed after application, which limits the possibility of the bimatoprost solution from contacting or pooling in the eye. One drop of bimatoprost eyelash solution should be applied to the applicator supplied by the manufacturer and distributed evenly along the skin of the upper eyelid margin at the base of the eyelashes. It is important to blot any excess solution runoff outside the upper eyelid margin.5 Of note, our patient admitted to not always doing this step, which may have contributed to her susceptibility to this rare side effect.
Prostaglandin analogues have been observed to cause iris hyperpigmentation when applied directly to the eye for use in the treatment of glaucoma.19 Theoretically, the same side-effect profile should apply in their use as a dermal application on the eyelids. For this reason, one manufacturer includes iris hyperpigmentation as an adverse side effect in the prescribing information.5 It is important for physicians who prescribe bimatoprost eyelash solution to inform patients of this rare yet possible side effect and to instruct patients on proper application to minimize hyperpigmentation.
Our literature review did not demonstrate previous cases of iris hyperpigmentation associated with bimatoprost eyelash solution. One study suggested that 2 patients experienced hypopigmentation; however, this was not clinically significant and was not consistent with the proposed iris pigmentation thought to be caused by bimatoprost eyelash solution.20
Potential future applications and off-label uses of bimatoprost include treatment of eyelash hypotrichosis on the lower eyelid margin and eyebrow hypertrichosis, as well as androgenic alopecia, alopecia areata, chemotherapy-induced alopecia, vitiligo, and hypopigmented scarring.21 Currently, investigational studies are looking at bimatoprost ophthalmic solution 0.03% for chemotherapy-induced eyelash hypotrichosis with positive results.22 In the future, bimatoprost may be used for other off-label and possibly FDA-approved uses.
- Draelos ZD. Special considerations in eye cosmetics. Clin Dermatol. 2001;19:424-430.
- Mulhern R, Fieldman G, Hussey T, et al. Do cosmetics enhance female Caucasian facial attractiveness? Int J Cosmet Sci. 2003;25:199-205.
- Lumigan [package insert]. Irvine, CA: Allergan, Inc; 2012.
- Higginbotham EJ, Schuman JS, Goldberg I, et al; Bimatoprost Study Groups 1 and 2. one-year, randomized study comparing bimatoprost and timolol in glaucoma and ocular hypertension. Arch Ophthalmol. 2002;120:1286-1293.
- Latisse [package insert]. Irvine, CA: Allergan, Inc; 2014.
- Hair diseases. In: Habif TP, ed. Clinical Dermatology: A Color Guide to Diagnosis and Treatment. 4th ed. St. Louis, MO: C.V. Mosby Company; 2003. 7. Fagien S. Management of hypotrichosis of the eyelashes: focus on bimatoprost. Clin Cosmet Investig Dermatol. 2010;2:29-48.
- Selen G, Stjernschantz J, Resul B. Prostaglandin-induced iridial pigmentation in primates. Surv Opthalmol. 1997;41(suppl 2):S125-128.
- Stjernschantz JW, Albert DM, Hu D-N, et al. Mechanism and clinical significance of prostaglandin-induced iris pigmentation. Surv Ophthalmol. 2002;47(suppl 1):162S-S175S.
- Inoue K, Shiokawa M, Sugahara M, et al. Iris and periocular adverse reactions to bimatoprost in Japanese patients with glaucoma or ocular hypertension. Clin Ophthalmol. 2012;6:111-116.
- Alm A, Camras C, Watson P. Phase III latanoprost studies in Scandinavia, the United Kingdom and the United States. Surv Ophthalmol. 1997;41(suppl 2):S105-S110.
- Wistrand PJ, Stjernschantz J, Olsson K. The incidence and time-course of latanoprost-induced iridial pigmentation as a function of eye color. Surv Ophthalmol. 1997;41(suppl 2):S129-S138.
- Arranz-Marquez E, Teus MA. Effect of age on the development of a latanoprost-induced increase in iris pigmentation. Ophthalmology. 2007;114:1255-1258.
- Yoelin S, Fagien S, Cox S, et al. A retrospective review and observational study of outcomes and safety of bimatoprost ophthalmic solution 0.03% for treating eyelash hypotrichosis. Dermatol Surg. 2014;40:1118-1124.
- Brandt JD, VanDenburgh AM, Chen K, et al; Bimatoprost Study Group. Comparison of once- or twice-daily bimatoprost with twice-daily timolol in patients with elevated IOP: a 3-month clinical trial. Ophthalmology. 2001;108:1023-1031; discussion 1032.
- Fagien S, Walt JG, Carruthers J, et al. Patient-reported outcomes of bimatoprost for eyelash growth: results from a randomized, double-masked, vehicle-controlled, parallel-group study. Aesthet Surg J. 2013;33:789-798.
- Yoelin S, Walt JG, Earl M. Safety, effectiveness, and subjective experience with topical bimatoprost 0.03% for eyelash growth. Dermatol Surg. 2010;36:638-649.
- Fagien S. Management of hypotrichosis of the eyelashes: focus on bimatoprost. Clin Cosmet Investig Dermatol. 2010;2:29-48.
- Rodríguez-Agramonte F, Jiménez JC, Montes JR. Periorbital changes associated with topical prostaglandins analogues in a Hispanic population. P R Health Sci J. 2017;36:218-222.
- Wirta D, Baumann L, Bruce S, et al. Safety and efficacy of bimatoprost for eyelash growth in postchemotherapy subjects. J Clin Aesthet Dermatol. 2015;8:11-20.
- Choi YM, Diehl J, Levins PC. Promising alternative clinical uses of prostaglandin F2α analogs: beyond the eyelashes [published online January 16, 2015]. J Am Acad Dermatol. 2015;72:712-716.
- Ahluwalia GS. Safety and efficacy of bimatoprost solution 0.03% topical application in patients with chemotherapy-induced eyelash loss. J Investig Dermatol Symp Proc. 2013;16:S73-S76.
Practice Points
- Bimatoprost ophthalmic solution 0.03% was approved by the US Food and Drug Administration in 2008 as an eyelash solution with an eyelid applicator for treatment of eyelash hypotrichosis.
- Iris hyperpigmentation can occur when bimatoprost eye drops are applied to the eyes for treatment of ocular hypertension and glaucoma, but reports associated with bimatoprost eyelash solution are rare.
- It is important that patients use bimatoprost eyelash solution as instructed in the prescribing information to avoid potential adverse events. The eyelid should not be rinsed after application, which limits the possibility of the bimatoprost solution from contacting or pooling in the eye.
Am I still a hospitalist?
HM as a force for change
I wear a suit every day to work. I count the time between shifts in months, not days. Rather than looking for subtle diagnostic clues hidden in clinical information, I find myself up to my elbows in performance and financial data. Instead of meetings complicated by challenging family dynamics, I spend my time calming the waters between clinical departments that each feel slighted.

And yet, when people ask me what I do, I do not say I am a health system CEO. Rather, I am a hospitalist. I say it, not out of habit, but with pride and clear intention. Almost 20 years ago, I had to explain to my parents what a hospitalist was as I made the transition from primary care doctor to hospitalist. I told them that hospitalists take care of sick people who are in the hospital, but also are charged with making the hospital a better place to take care of people. I hope that in some small way, in every role I have had over the past 20 years as a hospitalist, I have been able to do that.
While the small changes we can all make every day are important, massive changes to health care, hospitals, and providers are coming. The forces driving these changes are manifold, complex, and powerful. Individual hospitalists, hospital groups, and hospitals will be challenged to keep up with responding to these changes. I hope, though, that our field, hospital medicine, will not be sitting there, waiting for the changes to come, but will instead be one of the forces for change.
I also believe that hospital medicine and health care delivery systems should drive the change in a coordinated and collaborative partnership. A partnership not built on self-advocacy but one in which we remember why we exist – to take care of people. A force for change that preserves the essential, evolves what needs improvement, and revolutionizes the archaic.
Partnerships between hospitalist groups and health care administration will always face the day-to-day challenges of balancing the need for resources with the ability to provide them, agreeing on how to measure and assess quality, and aligning rewards with priorities. However, by working together in venues that allow us to think beyond the day-to-day issues, we in hospital medicine will be leaders in the change that is coming. I believe that today, the Society of Hospital Medicine must be one of those venues. Through its committees, meetings, advocacy, publications, and most importantly, members, SHM will continue to shape the future of care delivery in this country and beyond.
SHM has been my professional home for almost 20 years, helping me think about how to make the hospital a better place to take care of people. Recent examples of SHM and its members partnering in this area include advocacy work to improve alternative payment models, such as Medicare Access and CHIP Reauthorization Act of 2015 (MACRA), as well as educational efforts for its members on how to navigate the current rules around MACRA.
For many years, SHM has been the leader in professional organizations for leading the way on quality improvement. Through the Center for Quality Improvement, SHM not only offers robust educational tools to better enable members to lead efforts at their home institutions but also has led multi-institutional efforts to reduce harm that have been recognized nationally for their impact.
As we move further down the path from volume to value toward population health, the SHM Board will be sure that the society continues to be a leader for both its members and the health system at large as we face these changes. We have the opportunity in front of us to collectively embrace and create the changes coming toward us with that shared purpose of making wherever it is that we care for people better places to provide that care. How could one not be proud to say, with intent, “I am a hospitalist,” regardless of what it is that brings each of us to SHM.
Dr. Whelan is CEO of Banner–University Medical Center Tucson (Ariz.) and a member of the SHM Board of Directors.
HM as a force for change
HM as a force for change
I wear a suit every day to work. I count the time between shifts in months, not days. Rather than looking for subtle diagnostic clues hidden in clinical information, I find myself up to my elbows in performance and financial data. Instead of meetings complicated by challenging family dynamics, I spend my time calming the waters between clinical departments that each feel slighted.
And yet, when people ask me what I do, I do not say I am a health system CEO. Rather, I am a hospitalist. I say it, not out of habit, but with pride and clear intention. Almost 20 years ago, I had to explain to my parents what a hospitalist was as I made the transition from primary care doctor to hospitalist. I told them that hospitalists take care of sick people who are in the hospital, but also are charged with making the hospital a better place to take care of people. I hope that in some small way, in every role I have had over the past 20 years as a hospitalist, I have been able to do that.
While the small changes we can all make every day are important, massive changes to health care, hospitals, and providers are coming. The forces driving these changes are manifold, complex, and powerful. Individual hospitalists, hospital groups, and hospitals will be challenged to keep up with responding to these changes. I hope, though, that our field, hospital medicine, will not be sitting there, waiting for the changes to come, but will instead be one of the forces for change.
I also believe that hospital medicine and health care delivery systems should drive the change in a coordinated and collaborative partnership. A partnership not built on self-advocacy but one in which we remember why we exist – to take care of people. A force for change that preserves the essential, evolves what needs improvement, and revolutionizes the archaic.
Partnerships between hospitalist groups and health care administration will always face the day-to-day challenges of balancing the need for resources with the ability to provide them, agreeing on how to measure and assess quality, and aligning rewards with priorities. However, by working together in venues that allow us to think beyond the day-to-day issues, we in hospital medicine will be leaders in the change that is coming. I believe that today, the Society of Hospital Medicine must be one of those venues. Through its committees, meetings, advocacy, publications, and most importantly, members, SHM will continue to shape the future of care delivery in this country and beyond.
SHM has been my professional home for almost 20 years, helping me think about how to make the hospital a better place to take care of people. Recent examples of SHM and its members partnering in this area include advocacy work to improve alternative payment models, such as Medicare Access and CHIP Reauthorization Act of 2015 (MACRA), as well as educational efforts for its members on how to navigate the current rules around MACRA.
For many years, SHM has been the leader in professional organizations for leading the way on quality improvement. Through the Center for Quality Improvement, SHM not only offers robust educational tools to better enable members to lead efforts at their home institutions but also has led multi-institutional efforts to reduce harm that have been recognized nationally for their impact.
As we move further down the path from volume to value toward population health, the SHM Board will be sure that the society continues to be a leader for both its members and the health system at large as we face these changes. We have the opportunity in front of us to collectively embrace and create the changes coming toward us with that shared purpose of making wherever it is that we care for people better places to provide that care. How could one not be proud to say, with intent, “I am a hospitalist,” regardless of what it is that brings each of us to SHM.
Dr. Whelan is CEO of Banner–University Medical Center Tucson (Ariz.) and a member of the SHM Board of Directors.
Erythematous Papules and Pustules on the Nose
The Diagnosis: Granulosis Rubra Nasi
A history of prominent nasal sweating was later elicited and the patient was subsequently diagnosed with granulosis rubra nasi. She was instructed to continue daily use of topical pimecrolimus with the addition of topical atropine, resulting in complete resolution of the eruption at 6-week follow-up (Figure, A). She was then maintained on topical atropine monotherapy, only noting recurrence with cessation of the atropine (Figure, B).
Other successful treatment regimens of granulosis rubra nasi include injection of botulinum toxin into the nose,1 monotherapy with topical tacrolimus,2 topical indomethacin, steroids, and cryotherapy, among other modalities.1 Topical atropine and pimecrolimus were selected as first-line agents for treating our pediatric patient due to tolerability and their anti-inflammatory and anticholinergic properties.
Granulosis rubra nasi is a form of focal hyperhidrosis that presents as erythematous papules, pustules, and vesicles of the midface, especially the nose.3 It is a fairly rare condition that can mimic many other common clinical entities, including comedonal acne, nevus comedonicus, periorificial dermatitis, and tinea faciei, but is resistant to treatments aimed at these disorders. It was first described as a "peculiar disease of the skin of the nose in children" in a case report by Jadassohn4 in 1901. It is most common in children aged 7 to 12 years and typically resolves at puberty; adults rarely are affected. Although the etiology has not yet been elucidated, autosomal-dominant transmission has been described, and the cutaneous changes are hypothesized to be secondary to hyperhidrosis.5 This postulation is further corroborated by a case report of a pheochromocytoma-associated granulosis rubra nasi that resolved with surgical excision of the pheochromocytoma.6 It is not uncommon for patients to have concomitant palmoplantar hyperhidrosis and acrocyanosis.5 Histopathologic examination is not necessary for diagnosis, but when performed, it discloses a mononuclear cellular infiltrate surrounding eccrine sweat ducts, blood vessels, and lymphatics without other abnormalities of the epidermis or pilosebaceous unit.1-3,7
- Grazziotin TC, Buffon RB, Da Silva Manzoni AP, et al. Treatment of granulosis rubra nasi with botulinum toxin. Dermatol Surg. 2009;35:1298-1299.
- Kumar P, Gosai A, Mondal AK, et al. Granulosis rubra nasi: a rare condition treated successfully with topical tacrolimus. Dermatol Reports. 2012;4:E5.
- Sargunam C, Thomas J, Ahmed NA. Granulosis rubra nasi. Indian Dermatol Online J. 2013;4:208-209.
- Jadassohn J. Ueber eine eigenartige erkrankung der nasenhaut bei kindern. Arch Derm Syph. 1901;58:145-158.
- Hellier FF. Granulosis rubra nasi in a mother and daughter. Br Med J. 1937;2:1068.
- Heid E, Samain F, Jelen G, et al. Granulosis rubra nasi and pheochromocytoma. Ann Dermatol Venereol. 1996;123:106-108.
- Akhdari N. Granulosis rubra nasi. Int J Dermatol. 2007;46:396.
The Diagnosis: Granulosis Rubra Nasi
A history of prominent nasal sweating was later elicited and the patient was subsequently diagnosed with granulosis rubra nasi. She was instructed to continue daily use of topical pimecrolimus with the addition of topical atropine, resulting in complete resolution of the eruption at 6-week follow-up (Figure, A). She was then maintained on topical atropine monotherapy, only noting recurrence with cessation of the atropine (Figure, B).
Other successful treatment regimens of granulosis rubra nasi include injection of botulinum toxin into the nose,1 monotherapy with topical tacrolimus,2 topical indomethacin, steroids, and cryotherapy, among other modalities.1 Topical atropine and pimecrolimus were selected as first-line agents for treating our pediatric patient due to tolerability and their anti-inflammatory and anticholinergic properties.
Granulosis rubra nasi is a form of focal hyperhidrosis that presents as erythematous papules, pustules, and vesicles of the midface, especially the nose.3 It is a fairly rare condition that can mimic many other common clinical entities, including comedonal acne, nevus comedonicus, periorificial dermatitis, and tinea faciei, but is resistant to treatments aimed at these disorders. It was first described as a "peculiar disease of the skin of the nose in children" in a case report by Jadassohn4 in 1901. It is most common in children aged 7 to 12 years and typically resolves at puberty; adults rarely are affected. Although the etiology has not yet been elucidated, autosomal-dominant transmission has been described, and the cutaneous changes are hypothesized to be secondary to hyperhidrosis.5 This postulation is further corroborated by a case report of a pheochromocytoma-associated granulosis rubra nasi that resolved with surgical excision of the pheochromocytoma.6 It is not uncommon for patients to have concomitant palmoplantar hyperhidrosis and acrocyanosis.5 Histopathologic examination is not necessary for diagnosis, but when performed, it discloses a mononuclear cellular infiltrate surrounding eccrine sweat ducts, blood vessels, and lymphatics without other abnormalities of the epidermis or pilosebaceous unit.1-3,7
- Grazziotin TC, Buffon RB, Da Silva Manzoni AP, et al. Treatment of granulosis rubra nasi with botulinum toxin. Dermatol Surg. 2009;35:1298-1299.
- Kumar P, Gosai A, Mondal AK, et al. Granulosis rubra nasi: a rare condition treated successfully with topical tacrolimus. Dermatol Reports. 2012;4:E5.
- Sargunam C, Thomas J, Ahmed NA. Granulosis rubra nasi. Indian Dermatol Online J. 2013;4:208-209.
- Jadassohn J. Ueber eine eigenartige erkrankung der nasenhaut bei kindern. Arch Derm Syph. 1901;58:145-158.
- Hellier FF. Granulosis rubra nasi in a mother and daughter. Br Med J. 1937;2:1068.
- Heid E, Samain F, Jelen G, et al. Granulosis rubra nasi and pheochromocytoma. Ann Dermatol Venereol. 1996;123:106-108.
- Akhdari N. Granulosis rubra nasi. Int J Dermatol. 2007;46:396.
A healthy 9-year-old girl presented with a 2-year history of erythematous papules and pustules on the nose. There was no involvement of the rest of the face or body. At the time of presentation, she had been treated with several topical therapies including steroids, calcineurin inhibitors, antibiotics, and retinoids without improvement. A potassium hydroxide preparation from a pustule was performed and revealed only normal keratinocytes.