User login
Colorectal cancer screening: How to help patients comply
- Be more assertive about the need for screening with patients at risk, and do not rely solely on patient-education materials to communicate the message.
- Address key issues such as fear of pain from colonoscopy, costs and comparative benefits of different tests, and safety of procedures—even if patients don’t raise these issues.
Purpose: We elicited patient opinions about how physicians can improve communications about colorectal cancer (CRC) screening.
Methods: We recruited 15 patients, ages 50 years and older, from an urban family medicine teaching clinic. All patients in the initial pool of candidates had been seen at the university of Arkansas for Medical Sciences Family Medical Center within the past 12 months. The recruits participated in 1 of 3 focus groups to discuss how to enhance the rate of CRC screening.
Participants watched a videotape that described the different approaches to CRC screening. We then asked them to comment on how patients could be encouraged to undergo CRC screening.
Results: using a qualitative analysis of focus group data, we determined the most common reasons participants had not undergone CRC screening: fear, lack of information, and failure of the physician to strongly recommend CRC screening. Participants offered 7 recommendations for how physicians could address their concerns. Participants emphasized the importance of strong physician endorsement of screening, of frank and informative dialogue about patient’s concerns, and of using educational materials to supplement personal advice.
Conclusion: A physician’s recommendation for screening is the most powerful motivator in patients’ decisions. However, other sources of information such as videotapes, written materials, and even endorsement of CRC screening by the clinic’s office staff can help patients decide to undergo screening.
It’s well known that patients may avoid colorectal cancer (CRC) screening for fear of pain, embarrassment, lack of awareness of the importance of CRC screening, misperceptions about screening effectiveness, or lack of resources.1-5 But how well do physicians address these concerns and misgivings to help patients make a different choice? Equipped with an understanding of patients’ perspectives, physicians could reframe their counsel and likely increase the rate of CRC screening in their practices.
We conducted 3 in-depth focus group sessions to draw out details of patients’ concerns regarding CRC screening and to solicit their thoughts on how physicians could address and even resolve these issues.
Methods
Patients randomly selected for focus groups
Our initial pool of candidates was approximately 500 patients who were at least 50 years old and had been seen at our Family Medicine Center during the prior 12 months. We stratified this population into 4 ethnic/gender groups: African American males, African American females, Caucasian males, and Caucasian females. Sixty percent of the patients were female; 50% were African American, 48% were Caucasian, and 2% were Latino.
After creating a database that listed these patients by number and concealed their identities except for race and gender, we sequentially selected participants for groups of 8 patients (2 drawn from each of the ethnic/gender groups). Our random selection process avoided such biases as choosing patients by name or age or whether they had been seen more recently.
The first group of 8 patients received a letter asking them to participate in the project. The invitation included the offer of an honorarium. Invitations were mailed every 10 days until we had recruited 4 to 6 volunteers from each ethnic/gender group. After enlisting 20 participants, we were finally able to assemble 15 of them into 3 groups roughly balanced by gender and race. We also had 4 stand-by groups of 8 patients, in case any of the original participants chose to leave the study. All patients who volunteered were assured that if they chose not to participate, their continuing care would be unaffected.
Sessions thoroughly explored patients’ issues
The same experienced focus group leader (Caucasian, female) led all 3 sessions, adhering to a widely accepted structure for focus groups.6 This facilitator was familiar with the common barriers to CRC screening, as cited in the medical literature.1,7-9 She first asked an open-ended question and then probed specifically to determine why some participants or their family members had not received CRC screening. She solicited input from all attendees, sought clarification on points of view, and polled participants about their reactions to statements made by other members of the group. Participants were encouraged to discuss their experiences and their talks with family physicians about CRC screening.
How the sessions unfolded
After receiving instruction about the purpose of the session, participants viewed 2 patient-education videotapes that discussed CRC screening in an average-risk population. They also read a brief patient-education booklet about CRC screening before the facilitator engaged them in dialogue.
The videotapes—”Colon Cancer Screening: What You Need to Know,” produced by Harris and Pignone10; and “Screening for Colorectal Cancer: An Easy Step to Save Your Life,” produced by the Foundation for Digestive Health and Nutrition11—gave all focus group members a common understanding of the rationale and importance of CRC screening. We chose these 2 tapes because of their widespread use in clinical practice, complementary messages, easy-to-read graphics, content aimed at a lay audience, good sound quality, and recommendations that followed the American Cancer Society guidelines for average-risk patients.12
After participants contemplated the information they had viewed and read, the facilitator asked, “What suggestions would you give to a doctor to encourage a patient to be screened for colorectal cancer?” This began approximately 1 hour of feedback from the focus group members.
All 3 sessions were videotaped, but due to technical problems, video was available for only 2 groups. All 3 sessions were audiotaped.
Data analyzed promptly and rigorously
We systematically gathered and analyzed the qualitative data. The focus group leader and Dr. Goldsmith (principle investigator) together categorized the data by themes, which were structured so as to reduce overlapping. Disagreements on categorization were resolved by referring to transcripts and videos. We reassembled this information using an axial coding approach.
Though body language, gestures, and voice tone are important indicators of intent in communication, we did not classify data according to these non-verbal cues. However, we did note such cues during review of the videotapes, and also took into account the frequency and extensiveness of remarks (eg, how many people made a similar comment). Rapid transcription of the sessions and prompt review of the transcripts minimized the inaccurate interpretation of data that can occur when review is delayed.
We used 2 means of assessing the educational level of attendees. Patients in the first 2 focus groups were given the Rapid Estimate of Adult Literacy in Medicine (REALM) test,13 and members of the third group were asked for the highest grade level they completed in school.
Results
The average age of participants was 56 years. Few men volunteered to begin with. So to replace patients who dropped out on short notice, only women were immediately available from the standby groups. Thus, 13 participants were women and 2 were men. Two were covered by Medicaid, 6 by Medicare, 5 had private insurance, and 2 had no insurance. Eleven of the insured participants reported their insurance would pay for CRC screening.
Seven participants were African American, 7 were Caucasian, and 1 was Latino. Each focus group had approximately an equal mix of subjects by ethnic group, but only 2 groups had an uninsured subject. One man was part of each of the first 2 groups.
Reasons for low screening rate
Of the 15 subjects, 5 (at least 1 in each group) had undergone some type of CRC screening: colonoscopy (3), flexible sigmoidoscopy (1), or fecal occult blood testing (1).
Of the 10 subjects not screened, medical records lacked evidence that their family physicians had discussed CRC screening. The facilitator asked them why they had not been screened. The primary reason given was failure of their physicians to recommend screening; although on further inquiry, 1 patient said, “If the doctor did mention it [CRC screening], it was done in a fashion that didn’t impress me enough to remember.” Several other unscreened patients nodded in agreement. Other reasons given were costs, psychological issues (fear and embarrassment), belief that screening was unnecessary, and difficult logistics (time off and transportation) (TABLE).
Patients offered 7 suggestions for physicians
Our focus-group participants offered 7 recommendations for addressing issues that can hinder patients’ decisions to be screened.
- Do not rely on educational materials alone. Though participants thought videotapes and written information were important, all of them strongly stated that the primary endorsement for CRC screening must come from their physicians. All 3 groups agreed that videos and written materials were helpful supplements to a physician’s advice.
- Address fear of pain. Anticipate patients’ fear of pain from colonoscopy, and explain what is done to minimize discomfort.
- Cite costs of tests. A common theme was the lack of knowledge about the costs of the CRC screening options. Let patients know they can opt for less expensive screening.
- Discuss pros and cons of each test. A strongly held belief was that colonoscopy is the best, if not the only, test to have. If a physician had frankly discussed both costs and benefits of the options, patients might have been reassured enough to proceed with a screening procedure, even if it was not colonoscopy.
- Challenge the “worst case” mindset. Focus group participants feared that if cancer is found, it may not be curable. They urged physicians to expect this apprehension and to counter it with a realistic assessment.
- Emphasize safety of testing. Several participants who had not been screened feared being disabled by the test itself and said physicians should spend time to counter this belief.
- Elicit concerns about logistics. Some group members had avoided colonoscopy because it required taking time off from work, which they could not afford to do. The solution is to match the screening test to a patient’s needs and preferences.
Find a way to address the above concerns. Participants suggested that if a doctor’s time is limited, then someone else in the office (a nurse or even a clinic staff member) ought to speak with patients—preferably someone who has undergone endoscopy screening and can talk about what it was like in “real terms we can understand.”
TABLE
How to improve CRC screening rates—focus group recommendations by theme
| Strategies, other than physician communications, that could improve CRC screening rates |
Most common responses in order of frequency:
|
| Family physician communications that could improve CRC screening |
Most common responses in order of frequency (and typical comments):
|
| Preferred communication strategy for learning about the importance of CRC screening |
Most common responses based on frequency (and typical comments):
|
Discussion
Many factors keep the CRC screening rate lower than it ought to be. Physicians do not uniformly follow screening guidelines.7,14 Limited practice time, difficulty in identifying patients needing preventive services, and little financial incentive to provide preventive care in the ambulatory setting all hinder the effort to increase screening. And even when CRC screening is advised, patients are often reluctant to comply because of the reasons already discussed.
Effective communication between patients and physicians therefore becomes ever more important.15 Informed decision making about cancer screening is difficult for many patients to grasp, as evidenced by inaccuracies, distortions, and oversimplification of cancer-related beliefs.16 Patient-centered communications can give the physician a clearer understanding of the patient’s perspective and influence health-seeking behavior.17
The suggestions offered by this study’s participants can help family physicians improve communication about CRC screening, which should encourage more patients to opt for screening.
Participants unanimously recommended that physicians speak directly to well-known patient concerns about endoscopy, even if the patient does not bring them up during a visit.
Though participants spoke mainly about ways physicians could improve doctor/patient communications about CRC screening, they also expressed high regard for videotapes in patient education. The videos they watched taught them that CRC could be prevented or cured if discovered early, and they felt this message was not conveyed by their physicians. The value of video-based patient education observed in our study is consistent with the results of other studies.18,19 Given that primary care physicians often have insufficient time to educate patients fully, using a videotape may be well received by patients and prove an efficient way to augment advice about CRC screening.
Shared decision making has many advocates these days, but the focus group population in this context preferred that physicians be more assertive in promoting CRC screening. Patients may more readily comply with screening recommendations if physicians convey a message that is persuasive rather than factual but emotionally neutral.
This study confirmed the findings of others: fear, lack of information, cost of testing, and the physician’s failure to recommend CRC screening are all potential barriers to increasing screening rates.1,2,20,21 The study also showed the importance of physicians asking patients to clarify the origin of their fears about CRC testing.
Of the 10 focus group members who had not been screened for CRC, fully half said they would now consider screening given what they learned in the focus group. This encouraging finding implies that giving patients accurate information can improve screening rates. The remaining members of the focus group were still uncertain as to whether they would accept CRC screening if offered, and they did not give reasons for their indecision.
Limitations
The focus group participants may have been more assertive than most of the general population, given their willingness to freely express their feelings in front of others.
A sample of convenience was selected and most participants were women, despite efforts to recruit an equal number of men and women. Thus, our findings should be interpreted with caution for the male population.
The education level was higher than that of our urban, family practice clinic population. Thirteen of the 15 attendees had some type of insurance (Medicare, Medicaid, or private insurance). Of the insured, 11 had insurance coverage for CRC screening. Lack of availability of insurance coverage for CRC screening undoubtedly affects purchasing behavior for CRC screening, but we did not specifically separate comments of the insured from the uninsured. We do not have data on response of the subjects by ethnic group or sex.
Although the sample size was small, comments about the inadequacy of doctor/patient communications that emerged in each of the focus groups were remarkably similar.
Acknowledgements
This study is part of ongoing research at the university of Arkansas for Medical Sciences (UAMS), Department of Family and Preventive Medicine, and the uAMS, Arkansas Cancer Research Center, Division of Cancer Control. We thank the Division of Cancer Control for its technical support. We are also grateful for the assistance of Diane Metzler, university of Arkansas at little Rock, Institute for Economic Advancement, Division of Survey Research, who led the focus groups.
Correspondence
Geoffrey Goldsmith, MD, MPH, uAMS Department of Family and Preventive Medicine, 4301 W. Markham St., #530, little Rock, AR 72205-7199; ggoldsmith@uams.edu
1. Myers RE, Ross EA, Wolf FA, et al. Behavioral interventions to increase adherence in colorectal cancer screening. Med Care. 1991;29:1039-1050.
2. Weitzman ER, Zapka J, Estabrook B, et al. Risk and reluctance: understanding impediments to colorectal cancer screening. Prev Med. 2001;32:502-513.
3. Codori AM, Petersen GM, Miglioretti DL, et al. Health beliefs and endoscopic screening for colorectal cancer: potential for cancer prevention. Prev Med. 2001;33:128-136.
4. Coronado G, Thompson B. Rural Mexican American men’s attitudes and beliefs about cancer screening. J Cancer Educ. 2000;15:41-45.
5. Borum ML. Childhood sexual trauma as a potential factor for noncompliance with endoscopic procedures. Gen Hosp Psychiatry. 1998;20:381-382.
6. Morgan DL, Krueger RA. The Focus Group Kit. Thousand Oaks, CA: Sage Press; 1998.
7. Resnicow KA, Schorow M, Bloom HG, et al. Obstacles to family practitioners’ use of screening tests: determinants of practice? Prev Med. 1989-18:101-112.
8. Baier M, Calonge N, Cutter G, et al. Validity of self-reported colorectal cancer screening behavior. Cancer Epidemiol Biomarkers Prev. 2000;9:229-232.
9. Leider HL. Influencing physicians: the three critical elements of a successful strategy. Am J Manag Care. 1998;4:583-588.
10. Harris R, Pignone M. Colorectal Cancer Screening videotape. University of North Carolina, 1998.
11. Screening for Colon Cancer: An Easy Step to Save Your Life. Bethesda, Md: Foundation for Digestive Health and Nutrition; 1999.
12. American Cancer Society. Screening Guidelines for Colorectal Cancer Screening, ACS. 2005.
13. Davis TC, Crouch MA, Long SW, et al. Rapid assessment of literacy levels of adult primary care patients. Fam Med. 1991;23:433-435.
14. Leider HL. Influencing physicians: the three critical elements of a successful strategy. Am J Manag Care. 1998;4:583-588.
15. Clark N, Becker MH. Theoretical models and strategies for improving adherence and disease management. In Shumaker SA, Schron EB, Ockene JK, McBee WL, eds. The Handbook of Health Behavior Change. New York, NY: Springer Publishing Co; 1998:5-32.
16. Denberg TD, Wong S, Beattie A. Women’s misconceptions about cancer screening: implications for informed decision making. Patient Educ Counsel. 2005;57:280-285.
17. Stewart M. What is a successful doctor-patient interview? A study of interactions and outcomes. Soc Sci Med. 1984;19:167-175.
18. Meade CD, McKinney WP, Barnas GP. Educating patients with limited literacy skills: the effectiveness of printed and videotaped materials about colon cancer. Am J Public Health. 1994;84:119-121.
19. Pignone M, Harris R, Kinsinger L. Videotape-based decision aid for colon cancer screening. A randomized, controlled trial. Ann Intern Med. 2000;;133:761-769.
20. Green LW, Eriksen MP, Schor EL. Preventive practices by physicians: behavioral determinants and potential interventions. Am J Prev Med. 1988;4(suppl):101-107.
21. Brenes GA, Paskett ED. Predictors of stage of adoption for colorectal cancer screening. Prev Med. 2000;31:410-416.
- Be more assertive about the need for screening with patients at risk, and do not rely solely on patient-education materials to communicate the message.
- Address key issues such as fear of pain from colonoscopy, costs and comparative benefits of different tests, and safety of procedures—even if patients don’t raise these issues.
Purpose: We elicited patient opinions about how physicians can improve communications about colorectal cancer (CRC) screening.
Methods: We recruited 15 patients, ages 50 years and older, from an urban family medicine teaching clinic. All patients in the initial pool of candidates had been seen at the university of Arkansas for Medical Sciences Family Medical Center within the past 12 months. The recruits participated in 1 of 3 focus groups to discuss how to enhance the rate of CRC screening.
Participants watched a videotape that described the different approaches to CRC screening. We then asked them to comment on how patients could be encouraged to undergo CRC screening.
Results: using a qualitative analysis of focus group data, we determined the most common reasons participants had not undergone CRC screening: fear, lack of information, and failure of the physician to strongly recommend CRC screening. Participants offered 7 recommendations for how physicians could address their concerns. Participants emphasized the importance of strong physician endorsement of screening, of frank and informative dialogue about patient’s concerns, and of using educational materials to supplement personal advice.
Conclusion: A physician’s recommendation for screening is the most powerful motivator in patients’ decisions. However, other sources of information such as videotapes, written materials, and even endorsement of CRC screening by the clinic’s office staff can help patients decide to undergo screening.
It’s well known that patients may avoid colorectal cancer (CRC) screening for fear of pain, embarrassment, lack of awareness of the importance of CRC screening, misperceptions about screening effectiveness, or lack of resources.1-5 But how well do physicians address these concerns and misgivings to help patients make a different choice? Equipped with an understanding of patients’ perspectives, physicians could reframe their counsel and likely increase the rate of CRC screening in their practices.
We conducted 3 in-depth focus group sessions to draw out details of patients’ concerns regarding CRC screening and to solicit their thoughts on how physicians could address and even resolve these issues.
Methods
Patients randomly selected for focus groups
Our initial pool of candidates was approximately 500 patients who were at least 50 years old and had been seen at our Family Medicine Center during the prior 12 months. We stratified this population into 4 ethnic/gender groups: African American males, African American females, Caucasian males, and Caucasian females. Sixty percent of the patients were female; 50% were African American, 48% were Caucasian, and 2% were Latino.
After creating a database that listed these patients by number and concealed their identities except for race and gender, we sequentially selected participants for groups of 8 patients (2 drawn from each of the ethnic/gender groups). Our random selection process avoided such biases as choosing patients by name or age or whether they had been seen more recently.
The first group of 8 patients received a letter asking them to participate in the project. The invitation included the offer of an honorarium. Invitations were mailed every 10 days until we had recruited 4 to 6 volunteers from each ethnic/gender group. After enlisting 20 participants, we were finally able to assemble 15 of them into 3 groups roughly balanced by gender and race. We also had 4 stand-by groups of 8 patients, in case any of the original participants chose to leave the study. All patients who volunteered were assured that if they chose not to participate, their continuing care would be unaffected.
Sessions thoroughly explored patients’ issues
The same experienced focus group leader (Caucasian, female) led all 3 sessions, adhering to a widely accepted structure for focus groups.6 This facilitator was familiar with the common barriers to CRC screening, as cited in the medical literature.1,7-9 She first asked an open-ended question and then probed specifically to determine why some participants or their family members had not received CRC screening. She solicited input from all attendees, sought clarification on points of view, and polled participants about their reactions to statements made by other members of the group. Participants were encouraged to discuss their experiences and their talks with family physicians about CRC screening.
How the sessions unfolded
After receiving instruction about the purpose of the session, participants viewed 2 patient-education videotapes that discussed CRC screening in an average-risk population. They also read a brief patient-education booklet about CRC screening before the facilitator engaged them in dialogue.
The videotapes—”Colon Cancer Screening: What You Need to Know,” produced by Harris and Pignone10; and “Screening for Colorectal Cancer: An Easy Step to Save Your Life,” produced by the Foundation for Digestive Health and Nutrition11—gave all focus group members a common understanding of the rationale and importance of CRC screening. We chose these 2 tapes because of their widespread use in clinical practice, complementary messages, easy-to-read graphics, content aimed at a lay audience, good sound quality, and recommendations that followed the American Cancer Society guidelines for average-risk patients.12
After participants contemplated the information they had viewed and read, the facilitator asked, “What suggestions would you give to a doctor to encourage a patient to be screened for colorectal cancer?” This began approximately 1 hour of feedback from the focus group members.
All 3 sessions were videotaped, but due to technical problems, video was available for only 2 groups. All 3 sessions were audiotaped.
Data analyzed promptly and rigorously
We systematically gathered and analyzed the qualitative data. The focus group leader and Dr. Goldsmith (principle investigator) together categorized the data by themes, which were structured so as to reduce overlapping. Disagreements on categorization were resolved by referring to transcripts and videos. We reassembled this information using an axial coding approach.
Though body language, gestures, and voice tone are important indicators of intent in communication, we did not classify data according to these non-verbal cues. However, we did note such cues during review of the videotapes, and also took into account the frequency and extensiveness of remarks (eg, how many people made a similar comment). Rapid transcription of the sessions and prompt review of the transcripts minimized the inaccurate interpretation of data that can occur when review is delayed.
We used 2 means of assessing the educational level of attendees. Patients in the first 2 focus groups were given the Rapid Estimate of Adult Literacy in Medicine (REALM) test,13 and members of the third group were asked for the highest grade level they completed in school.
Results
The average age of participants was 56 years. Few men volunteered to begin with. So to replace patients who dropped out on short notice, only women were immediately available from the standby groups. Thus, 13 participants were women and 2 were men. Two were covered by Medicaid, 6 by Medicare, 5 had private insurance, and 2 had no insurance. Eleven of the insured participants reported their insurance would pay for CRC screening.
Seven participants were African American, 7 were Caucasian, and 1 was Latino. Each focus group had approximately an equal mix of subjects by ethnic group, but only 2 groups had an uninsured subject. One man was part of each of the first 2 groups.
Reasons for low screening rate
Of the 15 subjects, 5 (at least 1 in each group) had undergone some type of CRC screening: colonoscopy (3), flexible sigmoidoscopy (1), or fecal occult blood testing (1).
Of the 10 subjects not screened, medical records lacked evidence that their family physicians had discussed CRC screening. The facilitator asked them why they had not been screened. The primary reason given was failure of their physicians to recommend screening; although on further inquiry, 1 patient said, “If the doctor did mention it [CRC screening], it was done in a fashion that didn’t impress me enough to remember.” Several other unscreened patients nodded in agreement. Other reasons given were costs, psychological issues (fear and embarrassment), belief that screening was unnecessary, and difficult logistics (time off and transportation) (TABLE).
Patients offered 7 suggestions for physicians
Our focus-group participants offered 7 recommendations for addressing issues that can hinder patients’ decisions to be screened.
- Do not rely on educational materials alone. Though participants thought videotapes and written information were important, all of them strongly stated that the primary endorsement for CRC screening must come from their physicians. All 3 groups agreed that videos and written materials were helpful supplements to a physician’s advice.
- Address fear of pain. Anticipate patients’ fear of pain from colonoscopy, and explain what is done to minimize discomfort.
- Cite costs of tests. A common theme was the lack of knowledge about the costs of the CRC screening options. Let patients know they can opt for less expensive screening.
- Discuss pros and cons of each test. A strongly held belief was that colonoscopy is the best, if not the only, test to have. If a physician had frankly discussed both costs and benefits of the options, patients might have been reassured enough to proceed with a screening procedure, even if it was not colonoscopy.
- Challenge the “worst case” mindset. Focus group participants feared that if cancer is found, it may not be curable. They urged physicians to expect this apprehension and to counter it with a realistic assessment.
- Emphasize safety of testing. Several participants who had not been screened feared being disabled by the test itself and said physicians should spend time to counter this belief.
- Elicit concerns about logistics. Some group members had avoided colonoscopy because it required taking time off from work, which they could not afford to do. The solution is to match the screening test to a patient’s needs and preferences.
Find a way to address the above concerns. Participants suggested that if a doctor’s time is limited, then someone else in the office (a nurse or even a clinic staff member) ought to speak with patients—preferably someone who has undergone endoscopy screening and can talk about what it was like in “real terms we can understand.”
TABLE
How to improve CRC screening rates—focus group recommendations by theme
| Strategies, other than physician communications, that could improve CRC screening rates |
Most common responses in order of frequency:
|
| Family physician communications that could improve CRC screening |
Most common responses in order of frequency (and typical comments):
|
| Preferred communication strategy for learning about the importance of CRC screening |
Most common responses based on frequency (and typical comments):
|
Discussion
Many factors keep the CRC screening rate lower than it ought to be. Physicians do not uniformly follow screening guidelines.7,14 Limited practice time, difficulty in identifying patients needing preventive services, and little financial incentive to provide preventive care in the ambulatory setting all hinder the effort to increase screening. And even when CRC screening is advised, patients are often reluctant to comply because of the reasons already discussed.
Effective communication between patients and physicians therefore becomes ever more important.15 Informed decision making about cancer screening is difficult for many patients to grasp, as evidenced by inaccuracies, distortions, and oversimplification of cancer-related beliefs.16 Patient-centered communications can give the physician a clearer understanding of the patient’s perspective and influence health-seeking behavior.17
The suggestions offered by this study’s participants can help family physicians improve communication about CRC screening, which should encourage more patients to opt for screening.
Participants unanimously recommended that physicians speak directly to well-known patient concerns about endoscopy, even if the patient does not bring them up during a visit.
Though participants spoke mainly about ways physicians could improve doctor/patient communications about CRC screening, they also expressed high regard for videotapes in patient education. The videos they watched taught them that CRC could be prevented or cured if discovered early, and they felt this message was not conveyed by their physicians. The value of video-based patient education observed in our study is consistent with the results of other studies.18,19 Given that primary care physicians often have insufficient time to educate patients fully, using a videotape may be well received by patients and prove an efficient way to augment advice about CRC screening.
Shared decision making has many advocates these days, but the focus group population in this context preferred that physicians be more assertive in promoting CRC screening. Patients may more readily comply with screening recommendations if physicians convey a message that is persuasive rather than factual but emotionally neutral.
This study confirmed the findings of others: fear, lack of information, cost of testing, and the physician’s failure to recommend CRC screening are all potential barriers to increasing screening rates.1,2,20,21 The study also showed the importance of physicians asking patients to clarify the origin of their fears about CRC testing.
Of the 10 focus group members who had not been screened for CRC, fully half said they would now consider screening given what they learned in the focus group. This encouraging finding implies that giving patients accurate information can improve screening rates. The remaining members of the focus group were still uncertain as to whether they would accept CRC screening if offered, and they did not give reasons for their indecision.
Limitations
The focus group participants may have been more assertive than most of the general population, given their willingness to freely express their feelings in front of others.
A sample of convenience was selected and most participants were women, despite efforts to recruit an equal number of men and women. Thus, our findings should be interpreted with caution for the male population.
The education level was higher than that of our urban, family practice clinic population. Thirteen of the 15 attendees had some type of insurance (Medicare, Medicaid, or private insurance). Of the insured, 11 had insurance coverage for CRC screening. Lack of availability of insurance coverage for CRC screening undoubtedly affects purchasing behavior for CRC screening, but we did not specifically separate comments of the insured from the uninsured. We do not have data on response of the subjects by ethnic group or sex.
Although the sample size was small, comments about the inadequacy of doctor/patient communications that emerged in each of the focus groups were remarkably similar.
Acknowledgements
This study is part of ongoing research at the university of Arkansas for Medical Sciences (UAMS), Department of Family and Preventive Medicine, and the uAMS, Arkansas Cancer Research Center, Division of Cancer Control. We thank the Division of Cancer Control for its technical support. We are also grateful for the assistance of Diane Metzler, university of Arkansas at little Rock, Institute for Economic Advancement, Division of Survey Research, who led the focus groups.
Correspondence
Geoffrey Goldsmith, MD, MPH, uAMS Department of Family and Preventive Medicine, 4301 W. Markham St., #530, little Rock, AR 72205-7199; ggoldsmith@uams.edu
1. Myers RE, Ross EA, Wolf FA, et al. Behavioral interventions to increase adherence in colorectal cancer screening. Med Care. 1991;29:1039-1050.
2. Weitzman ER, Zapka J, Estabrook B, et al. Risk and reluctance: understanding impediments to colorectal cancer screening. Prev Med. 2001;32:502-513.
3. Codori AM, Petersen GM, Miglioretti DL, et al. Health beliefs and endoscopic screening for colorectal cancer: potential for cancer prevention. Prev Med. 2001;33:128-136.
4. Coronado G, Thompson B. Rural Mexican American men’s attitudes and beliefs about cancer screening. J Cancer Educ. 2000;15:41-45.
5. Borum ML. Childhood sexual trauma as a potential factor for noncompliance with endoscopic procedures. Gen Hosp Psychiatry. 1998;20:381-382.
6. Morgan DL, Krueger RA. The Focus Group Kit. Thousand Oaks, CA: Sage Press; 1998.
7. Resnicow KA, Schorow M, Bloom HG, et al. Obstacles to family practitioners’ use of screening tests: determinants of practice? Prev Med. 1989-18:101-112.
8. Baier M, Calonge N, Cutter G, et al. Validity of self-reported colorectal cancer screening behavior. Cancer Epidemiol Biomarkers Prev. 2000;9:229-232.
9. Leider HL. Influencing physicians: the three critical elements of a successful strategy. Am J Manag Care. 1998;4:583-588.
10. Harris R, Pignone M. Colorectal Cancer Screening videotape. University of North Carolina, 1998.
11. Screening for Colon Cancer: An Easy Step to Save Your Life. Bethesda, Md: Foundation for Digestive Health and Nutrition; 1999.
12. American Cancer Society. Screening Guidelines for Colorectal Cancer Screening, ACS. 2005.
13. Davis TC, Crouch MA, Long SW, et al. Rapid assessment of literacy levels of adult primary care patients. Fam Med. 1991;23:433-435.
14. Leider HL. Influencing physicians: the three critical elements of a successful strategy. Am J Manag Care. 1998;4:583-588.
15. Clark N, Becker MH. Theoretical models and strategies for improving adherence and disease management. In Shumaker SA, Schron EB, Ockene JK, McBee WL, eds. The Handbook of Health Behavior Change. New York, NY: Springer Publishing Co; 1998:5-32.
16. Denberg TD, Wong S, Beattie A. Women’s misconceptions about cancer screening: implications for informed decision making. Patient Educ Counsel. 2005;57:280-285.
17. Stewart M. What is a successful doctor-patient interview? A study of interactions and outcomes. Soc Sci Med. 1984;19:167-175.
18. Meade CD, McKinney WP, Barnas GP. Educating patients with limited literacy skills: the effectiveness of printed and videotaped materials about colon cancer. Am J Public Health. 1994;84:119-121.
19. Pignone M, Harris R, Kinsinger L. Videotape-based decision aid for colon cancer screening. A randomized, controlled trial. Ann Intern Med. 2000;;133:761-769.
20. Green LW, Eriksen MP, Schor EL. Preventive practices by physicians: behavioral determinants and potential interventions. Am J Prev Med. 1988;4(suppl):101-107.
21. Brenes GA, Paskett ED. Predictors of stage of adoption for colorectal cancer screening. Prev Med. 2000;31:410-416.
Should you screen—or not? The latest recommendations
Not enough time and too many potential tests to do. This is the problem faced daily by family physicians. We want to practice up-to-date preventive medicine, but there’s little time to analyze the latest studies. Thankfully, we can rely on the United States Preventive Services Task Force, the organization with the most rigorous evidence-based approach, to do the legwork for us.1
Last year, and in the early part of this year, the Task Force issued a number of recommendations on topics ranging from hypertension screening to screening for illicit drug use. (See TABLE 1 for a breakdown of the 5 categories of recommendations.)
While some of these recommendations (TABLE 2) were reaffirmations of past recommendations, others included some changes.
The Task Force has:
- dropped the age for routine screening for Chlamydia in sexually active women from 25 years and younger to 24 and younger.
- added a recommendation against the use of aspirin or other nonsteroidal anti-inflammatory drugs (NSAIDs) to prevent colorectal cancer (CRC).
- changed its recommendation on screening for carotid artery stenosis. In 1996, the Task Force noted that the evidence was insufficient to make a recommendation; in 2007 it recommended against such routine screening.
- added recommendations on counseling patients about drinking and driving, as well as on screening for illicit drug use. In both cases, the Task Force says the evidence is insufficient to recommend for or against.
TABLE 1
USPSTF recommendation categories
| A Recommendation: The Task Force recommends the service. There is a high certainty that the net benefit is substantial. |
| B Recommendation: The Task Force recommends the service. There is high certainty that the net benefit is moderate or there is moderate certainty that the net benefit is moderate to substantial. |
| C Recommendation: The Task Force recommends against routinely providing the service. There may be considerations that support providing the service in an individual patient. There is at least moderate certainty that the net benefit is small. |
| D Recommendation: The Task Force recommends against the service. There is moderate or high certainty that the service has no net benefit or that the harms outweigh the benefits. |
| I Recommendation: The Task Force concludes that the current evidence is insufficient to assess the balance of benefits and harms of the service. Evidence is lacking, of poor quality, or conflicting, and the balance of benefits and harms cannot be determined. |
TABLE 2
Summary of new USPSTF recommendations
| A RECOMMENDATIONS |
The USPSTF recommends routinely:
|
| B RECOMMENDATIONS |
The USPSTF recommends routinely:
|
| C RECOMMENDATIONS |
The USPSTF recommends against routine:
|
| D RECOMMENDATIONS |
The USPSTF recommends against routine:
|
| I RECOMMENDATIONS |
The USPSTF concludes that the current evidence is insufficient to recommend for or against routine:
|
Continue to screen for HTN, sickle cell, Chlamydia
The latest A and B recommendations from the Task Force largely reaffirm previous recommendations. These recommendations cover hypertension, sickle cell disease, and Chlamydia.
Hypertension. Screening and treatment of hypertension in adults leads to lower morbidity and mortality from cardiovascular disease and is still recommended.2
Sickle cell disease. Screening newborns for sickle cell disease and treating those affected with oral prophylactic penicillin prevents serious bacterial infections. It also remains a recommended service.3
Chlamydia. Following a review of the evidence, the Task Force reconfirms the benefits of screening for Chlamydia in sexually active young women, but it has changed the age cutoff. In 2001, the Task Force indicated that sexually active women who were 25 years of age and younger should be screened. In 2007, the Task Force dropped the age to 24 and younger.
The latest recommendation reaffirms the need to screen women (above the cutoff) who are at risk—that is, women who have previously had a sexually transmitted infection (STI), those who have a new or multiple sex partners, and those who exchange sex for money or drugs.4 Screening is recommended annually; nucleic acid amplification tests are acceptable, allowing testing of urine or vaginal swabs.
Screening during pregnancy is recommended for the same groups—women who are 24 and younger and older women at risk—at the first prenatal visit and again in the third trimester if risk continues. Chlamydia is the most common bacterial STI, and screening and treatment prevents pelvic inflammatory disease in women and leads to improved pregnancy outcomes.
Interventions that are not recommended
Chemopreventon of colorectal cancer. For the first time, the Task Force issued a recommendation on the use of aspirin or other NSAIDs to prevent CRC. The Task Force does not recommend the routine use of these agents.5 The dosage needed to prevent CRC is higher than that which prevents cardiovascular disease and can cause significant harm.
Aspirin use is associated with gastrointestinal bleeding and hemorrhagic stroke; NSAID use is associated with gastrointestinal bleeding and renal impairment. The Task Force concludes that in the general adult population, potential harms exceed potential benefits.
Screening for carotid artery stenosis. In 1996, the Task Force found insufficient evidence to recommend for or against routine screening for carotid artery stenosis. In 2007, the Task Force made a recommendation against routine screening for carotid artery stenosis.6 Screening with duplex ultrasonography results in frequent false positives. Confirmatory testing with angiography is associated with a 1% rate of stroke. Endarterectomy itself has a death or stroke rate of about 3%.
In the general population, close to 8700 adults would need to be screened to prevent 1 disabling stroke. The Task Force indicates that primary care physicians would have better outcomes by concentrating on optimal management of risk factors for cerebral artery disease.
Screening for bacterial vaginosis among low-risk pregnant women. The final D recommendation pertains to screening for bacterial vaginosis during pregnancy to prevent preterm delivery.7 Pregnant women who have not had a previous preterm delivery are considered at low risk for preterm delivery and there is good evidence that this group does not benefit from screening for, or treatment of, asymptomatic bacterial vaginosis. (A similar recommendation was made in 2001, but it referred to women of “average” risk.)
Insufficient evidence to make a recommendation
Routinely screening men for Chlamydia. While it makes clinical sense to test and treat male partners of women with Chlamydia infection, the Task Force could not find evidence of the effectiveness of routinely screening men as a way to prevent infection in women.4 That said, the Task Force points out that screening men is relatively inexpensive and has negligible harms.
Screening for hyperlipidemia in children. While 50% of children with hyperlipidemia continue to have this disorder as adults, the long-term benefits and harms of early detection and treatment with medications and lipid-lowering diets have not been studied.8 This echoes the position the Task Force took in 1996, when it commented on children as part of an adult hyperlipidemia recommendation.
Physician counseling on drinking and driving. Motor vehicle crashes result in significant morbidity and mortality—especially among adolescents and young adults. Improved car and road design, as well as public health safety efforts, have led to significant improvements in motor vehicle safety. While avoidance of driving under the influence and proper use of occupant restraints are important public health goals, the Task Force, in this first recommendation on the subject, could find no evidence that physician counseling added benefit above those provided by community-wide efforts.9
Screening for bacterial vaginosis in pregnant women at high risk for preterm birth. As mentioned previously, screening low-risk pregnant women for bacterial vaginosis results in no benefit. The issue is less clear cut among women at high risk for a preterm delivery—that is, those who have had one previously.
The evidence regarding screening and treating asymptomatic bacterial vaginosis as a means of preventing preterm delivery in these women is mixed and the Task Force was unable to recommend for or against this practice.7 This reaffirms the Task Force’s 2001 recommendation.
Screening for illicit drug use. The Task Force recognizes that illicit drug use is a major cause of illness and social problems. It would appear to have great potential for early detection and intervention. However, the Task Force, in this first-time recommendation, found that screening tools have not been well studied, nor have the long-term effects of different treatment strategies.10 These are high priority areas for future research.
Correspondence
Doug Campos-Outcalt, MD, MPA, 550 E. Van Buren, Phoenix, AZ 85004; dougco@u.arizona.edu
1. Agency for Healthcare Quality and Research. USPSTF. Available at: http://www.ahrq.gov/clinic/uspstfix.htm. Accessed May 5, 2008.
2. USPSTF. Screening for High Blood Pressure. Available at: http://www.ahrq.gov/clinic/uspstf/uspshype.htm. Accessed May 5, 2008.
3. USPSTF. Screening for Sickle Cell Disease in Newborns. Available at: http://www.ahrq.gov/clinic/uspstf/uspshemo.htm. Accessed May 5, 2008.
4. USPSTF. Screening for Chlamydia Infection. Available at: http://www.ahrq.gov/clinic/uspstf/uspschlm.htm. Accessed May 5, 2008.
5. USPSTF. Aspirin or Nonsteroidal Anti-inflamatory Drugs for the Primary Prevention of Colorectal Cancer. Available at: http://www.ahrq.gov/clinic/uspstf/uspsasco.htm. Accessed May 5, 2008.
6. USPSTF. Screening for Carotid Artery Stenosis. Available at: http://www.ahrq.gov/clinic/uspstf/uspsacas.htm. Accessed May 5, 2008.
7. USPSTF. Screening for Bacterial Vaginosis in Pregnancy. Available at: http://www.ahrq.gov/clinic/uspstf/uspsbvag.htm. Accessed May 5, 2008.
8. USPSTF. Screening for Lipid Disorders in Children. Available at: http://www.ahrq.gov/clinic/uspstf/uspschlip.htm. Accessed May 5, 2008.
9. USPSTF. Counseling About Proper Use of Motor Vehicle Occupant Restraints and Avoidance of Alcohol Use While Driving. Available at: http://www.ahrq.gov/clinic/uspstf/uspsmvin.htm. Accessed May 5, 2008.
10. USPSTF. Screening for Illicit Drug Use. Available at: http://www.ahrq.gov/clinic/uspstf/uspsdrug.htm. Accessed May 5, 2008.
Not enough time and too many potential tests to do. This is the problem faced daily by family physicians. We want to practice up-to-date preventive medicine, but there’s little time to analyze the latest studies. Thankfully, we can rely on the United States Preventive Services Task Force, the organization with the most rigorous evidence-based approach, to do the legwork for us.1
Last year, and in the early part of this year, the Task Force issued a number of recommendations on topics ranging from hypertension screening to screening for illicit drug use. (See TABLE 1 for a breakdown of the 5 categories of recommendations.)
While some of these recommendations (TABLE 2) were reaffirmations of past recommendations, others included some changes.
The Task Force has:
- dropped the age for routine screening for Chlamydia in sexually active women from 25 years and younger to 24 and younger.
- added a recommendation against the use of aspirin or other nonsteroidal anti-inflammatory drugs (NSAIDs) to prevent colorectal cancer (CRC).
- changed its recommendation on screening for carotid artery stenosis. In 1996, the Task Force noted that the evidence was insufficient to make a recommendation; in 2007 it recommended against such routine screening.
- added recommendations on counseling patients about drinking and driving, as well as on screening for illicit drug use. In both cases, the Task Force says the evidence is insufficient to recommend for or against.
TABLE 1
USPSTF recommendation categories
| A Recommendation: The Task Force recommends the service. There is a high certainty that the net benefit is substantial. |
| B Recommendation: The Task Force recommends the service. There is high certainty that the net benefit is moderate or there is moderate certainty that the net benefit is moderate to substantial. |
| C Recommendation: The Task Force recommends against routinely providing the service. There may be considerations that support providing the service in an individual patient. There is at least moderate certainty that the net benefit is small. |
| D Recommendation: The Task Force recommends against the service. There is moderate or high certainty that the service has no net benefit or that the harms outweigh the benefits. |
| I Recommendation: The Task Force concludes that the current evidence is insufficient to assess the balance of benefits and harms of the service. Evidence is lacking, of poor quality, or conflicting, and the balance of benefits and harms cannot be determined. |
TABLE 2
Summary of new USPSTF recommendations
| A RECOMMENDATIONS |
The USPSTF recommends routinely:
|
| B RECOMMENDATIONS |
The USPSTF recommends routinely:
|
| C RECOMMENDATIONS |
The USPSTF recommends against routine:
|
| D RECOMMENDATIONS |
The USPSTF recommends against routine:
|
| I RECOMMENDATIONS |
The USPSTF concludes that the current evidence is insufficient to recommend for or against routine:
|
Continue to screen for HTN, sickle cell, Chlamydia
The latest A and B recommendations from the Task Force largely reaffirm previous recommendations. These recommendations cover hypertension, sickle cell disease, and Chlamydia.
Hypertension. Screening and treatment of hypertension in adults leads to lower morbidity and mortality from cardiovascular disease and is still recommended.2
Sickle cell disease. Screening newborns for sickle cell disease and treating those affected with oral prophylactic penicillin prevents serious bacterial infections. It also remains a recommended service.3
Chlamydia. Following a review of the evidence, the Task Force reconfirms the benefits of screening for Chlamydia in sexually active young women, but it has changed the age cutoff. In 2001, the Task Force indicated that sexually active women who were 25 years of age and younger should be screened. In 2007, the Task Force dropped the age to 24 and younger.
The latest recommendation reaffirms the need to screen women (above the cutoff) who are at risk—that is, women who have previously had a sexually transmitted infection (STI), those who have a new or multiple sex partners, and those who exchange sex for money or drugs.4 Screening is recommended annually; nucleic acid amplification tests are acceptable, allowing testing of urine or vaginal swabs.
Screening during pregnancy is recommended for the same groups—women who are 24 and younger and older women at risk—at the first prenatal visit and again in the third trimester if risk continues. Chlamydia is the most common bacterial STI, and screening and treatment prevents pelvic inflammatory disease in women and leads to improved pregnancy outcomes.
Interventions that are not recommended
Chemopreventon of colorectal cancer. For the first time, the Task Force issued a recommendation on the use of aspirin or other NSAIDs to prevent CRC. The Task Force does not recommend the routine use of these agents.5 The dosage needed to prevent CRC is higher than that which prevents cardiovascular disease and can cause significant harm.
Aspirin use is associated with gastrointestinal bleeding and hemorrhagic stroke; NSAID use is associated with gastrointestinal bleeding and renal impairment. The Task Force concludes that in the general adult population, potential harms exceed potential benefits.
Screening for carotid artery stenosis. In 1996, the Task Force found insufficient evidence to recommend for or against routine screening for carotid artery stenosis. In 2007, the Task Force made a recommendation against routine screening for carotid artery stenosis.6 Screening with duplex ultrasonography results in frequent false positives. Confirmatory testing with angiography is associated with a 1% rate of stroke. Endarterectomy itself has a death or stroke rate of about 3%.
In the general population, close to 8700 adults would need to be screened to prevent 1 disabling stroke. The Task Force indicates that primary care physicians would have better outcomes by concentrating on optimal management of risk factors for cerebral artery disease.
Screening for bacterial vaginosis among low-risk pregnant women. The final D recommendation pertains to screening for bacterial vaginosis during pregnancy to prevent preterm delivery.7 Pregnant women who have not had a previous preterm delivery are considered at low risk for preterm delivery and there is good evidence that this group does not benefit from screening for, or treatment of, asymptomatic bacterial vaginosis. (A similar recommendation was made in 2001, but it referred to women of “average” risk.)
Insufficient evidence to make a recommendation
Routinely screening men for Chlamydia. While it makes clinical sense to test and treat male partners of women with Chlamydia infection, the Task Force could not find evidence of the effectiveness of routinely screening men as a way to prevent infection in women.4 That said, the Task Force points out that screening men is relatively inexpensive and has negligible harms.
Screening for hyperlipidemia in children. While 50% of children with hyperlipidemia continue to have this disorder as adults, the long-term benefits and harms of early detection and treatment with medications and lipid-lowering diets have not been studied.8 This echoes the position the Task Force took in 1996, when it commented on children as part of an adult hyperlipidemia recommendation.
Physician counseling on drinking and driving. Motor vehicle crashes result in significant morbidity and mortality—especially among adolescents and young adults. Improved car and road design, as well as public health safety efforts, have led to significant improvements in motor vehicle safety. While avoidance of driving under the influence and proper use of occupant restraints are important public health goals, the Task Force, in this first recommendation on the subject, could find no evidence that physician counseling added benefit above those provided by community-wide efforts.9
Screening for bacterial vaginosis in pregnant women at high risk for preterm birth. As mentioned previously, screening low-risk pregnant women for bacterial vaginosis results in no benefit. The issue is less clear cut among women at high risk for a preterm delivery—that is, those who have had one previously.
The evidence regarding screening and treating asymptomatic bacterial vaginosis as a means of preventing preterm delivery in these women is mixed and the Task Force was unable to recommend for or against this practice.7 This reaffirms the Task Force’s 2001 recommendation.
Screening for illicit drug use. The Task Force recognizes that illicit drug use is a major cause of illness and social problems. It would appear to have great potential for early detection and intervention. However, the Task Force, in this first-time recommendation, found that screening tools have not been well studied, nor have the long-term effects of different treatment strategies.10 These are high priority areas for future research.
Correspondence
Doug Campos-Outcalt, MD, MPA, 550 E. Van Buren, Phoenix, AZ 85004; dougco@u.arizona.edu
1. Agency for Healthcare Quality and Research. USPSTF. Available at: http://www.ahrq.gov/clinic/uspstfix.htm. Accessed May 5, 2008.
2. USPSTF. Screening for High Blood Pressure. Available at: http://www.ahrq.gov/clinic/uspstf/uspshype.htm. Accessed May 5, 2008.
3. USPSTF. Screening for Sickle Cell Disease in Newborns. Available at: http://www.ahrq.gov/clinic/uspstf/uspshemo.htm. Accessed May 5, 2008.
4. USPSTF. Screening for Chlamydia Infection. Available at: http://www.ahrq.gov/clinic/uspstf/uspschlm.htm. Accessed May 5, 2008.
5. USPSTF. Aspirin or Nonsteroidal Anti-inflamatory Drugs for the Primary Prevention of Colorectal Cancer. Available at: http://www.ahrq.gov/clinic/uspstf/uspsasco.htm. Accessed May 5, 2008.
6. USPSTF. Screening for Carotid Artery Stenosis. Available at: http://www.ahrq.gov/clinic/uspstf/uspsacas.htm. Accessed May 5, 2008.
7. USPSTF. Screening for Bacterial Vaginosis in Pregnancy. Available at: http://www.ahrq.gov/clinic/uspstf/uspsbvag.htm. Accessed May 5, 2008.
8. USPSTF. Screening for Lipid Disorders in Children. Available at: http://www.ahrq.gov/clinic/uspstf/uspschlip.htm. Accessed May 5, 2008.
9. USPSTF. Counseling About Proper Use of Motor Vehicle Occupant Restraints and Avoidance of Alcohol Use While Driving. Available at: http://www.ahrq.gov/clinic/uspstf/uspsmvin.htm. Accessed May 5, 2008.
10. USPSTF. Screening for Illicit Drug Use. Available at: http://www.ahrq.gov/clinic/uspstf/uspsdrug.htm. Accessed May 5, 2008.
Extended-release fluvoxamine for social anxiety disorder and OCD
Fluvoxamine extended-release formulation was FDA-approved to treat generalized social anxiety disorder (GSAD) and obsessive-compulsive disorder (OCD) because it demonstrated efficacy in reducing anxiety symptoms of these disorders in 3 clinical trials. The new formulation may benefit patients unable to tolerate the existing immediate-release form.
Clinical implications
Like other selective serotonin reuptake inhibitors (SSRIs), fluvoxamine alleviates symptoms of GSAD and OCD. The extended-release formulation allows the medication to be administered once daily (Table 1) and, according to the manufacturer, may reduce side effects and improve tolerability.
Many clinicians have prescribed immediate-release fluvoxamine once daily, and the efficacy and tolerability of the immediate- and extended-release formulations have not been compared in head-to-head trials. In addition, no studies have examined the efficacy of extended-release fluvoxamine in treating other psychiatric conditions.
Table 1
Extended-release fluvoxamine: Fast facts
| Brand name: Luvox CR |
| Class: Selective serotonin reuptake inhibitor |
| Indication: Generalized social anxiety disorder and obsessive-compulsive disorder |
| Approval date: February 29, 2008 |
| Availability date: March 2008 |
| Manufacturer: Jazz Pharmaceuticals |
| Dosing forms: 100 mg and 150 mg extended-release capsules |
| Recommended dose: Starting dose: 100 mg/d. Titrate in 50-mg/week increments until maximum therapeutic benefit is achieved. Maximum recommended dose: 300 mg/d |
How it works
Decreased serotonin levels are associated with GSAD and OCD. Fluvoxamine’s therapeutic effect is thought to be mediated through its specific serotonin reuptake inhibition in the CNS.1
The drug acts primarily on serotonin 2C receptors, with no reported significant affinity for histaminergic, adrenergic, muscarinic, or dopaminergic receptors.1 Fluvoxamine’s 1-sigma receptor antagonism is unique among SSRIs, and researchers have suggested that this may make fluvoxamine more effective than other SSRIs in treating anxious or delusional depression.2
The extended-release formulation uses a spheroidal oral drug absorption system, a proprietary technology that limits peak-to-trough variance for 24 hours.1 The manufacturer postulates that decreased plasma concentration variability will improve fluvoxamine’s tolerability.1
Pharmacokinetics
In a single-dose crossover study of 28 healthy subjects, the mean maximum concentration of drug (Cmax) for extended-release fluvoxamine was 38% lower than that of the immediate-release formulation, which may reduce the risk of adverse effects.1 Its relative bioavailability was 84%, and mean plasma half-life was 16.3 hours in male and female volunteers.1
Fluvoxamine is extensively metabolized in the liver, primarily through oxidative demethylation and deamination.1 Nine metabolites constitute 85% of the urinary excretion product; the main metabolite is fluvoxamine acid.1 Approximately 2% of fluvoxamine is excreted unchanged in urine. Administering extended-release fluvoxamine capsules with food does not appear to affect the drug’s absorption.1
Fluvoxamine is a potent inhibitor of the cytochrome P450 (CYP) 1A2 isoenzyme and also is believed to significantly inhibit CYP3A4, CYP2C9, CYP3A4, and CYP2C19. It is a relatively weak inhibitor of CYP2D6.1
Efficacy
The FDA based its approval of extended-release fluvoxamine on data from 3 clinical trials with positive outcomes: 2 for GSAD and 1 for OCD (Table 2).1,3-6
GSAD trials. In the first GSAD study—a randomized, double-blind, placebo-controlled, multicenter trial of 300 subjects with GSAD—participants were randomly assigned to receive extended-release fluvoxamine or placebo for 12 weeks.3 The extended-release fluvoxamine group started at 100 mg administered at night, with dosages titrated at 50 mg/week based on efficacy and tolerability to a maximum of 300 mg/d.1 Subjects in the extended-release fluvoxamine group demonstrated a statistically significant change in Liebowitz Social Anxiety Scale (LSAS) scores from baseline compared with those receiving placebo (P=0.02). Researchers observed similar results in secondary measures.
In an extension of this study, 112 subjects who demonstrated at least minimal improvement from extended-release fluvoxamine by week 12 continued the same dosing regimen for an additional 12 weeks. Investigators found the drug’s beneficial effects persisted to 24 weeks, although the magnitude of the effect decreased.4
A separate study using the same dosing regimen enrolled 279 adult patients in a 12-week, multicenter, randomized, placebo-controlled trial.5 The fluvoxamine-treated group showed statistically and clinically significant improvement:
- by week 4 on the LSAS and the Clinical Global Impression-Improvement (CGI-I) scale
- by week 6 on the Sheehan Disability Scale, Clinical Global Impression-Severity scale (CGI-S) and Patient Global Impression of Improvement (PGI) scale.5
OCD trial. Hollander et al6 conducted a 12-week, double-blind, placebo-controlled, flexible-dose, parallel multicenter trial of 253 adult patients with OCD.6 Compared with those receiving placebo, subjects treated with extended-release fluvoxamine, 100 to 300 mg/d, showed a statistically significant decrease in score on the Yale-Brown Obsessive Compulsive Scale (P=0.001).6 Analysis of the CGIS and CGI-I also revealed statistically significant improvement compared with placebo. The effect appeared to begin at week 2.
As did the GSAD studies, this study compared extended-release fluvoxamine with placebo and not with the immediate-release formulation. Although no additional studies have examined the efficacy of extended-release fluvoxamine in treating OCD and the drug has not been evaluated in pediatric patients, the manufacturer notes that the immediate-release formulation has been evaluated in 2 studies with adult OCD patients and 1 pediatric OCD study, all of which had positive results.1
Table 2
Fluvoxamine extended-release: What the evidence says
| Study | Measures used | Results |
|---|---|---|
| Generalized social anxiety disorder | ||
| Westenberg et al (2004)3 | LSAS, CGI-S, CGI-I, SDS, PGI | Fluvoxamine was significantly more effective than placebo in decreasing LSAS total score (primary measure) starting at week 4 and in improving SDS, CGI-S, and CGI-I (secondary measures) |
| Stein et al (2003)4 | LSAS, CGI-S, CGI-I, SDS, PGI | Severity of illness on the CGI-S scale and disability on the SDS were significantly lower in the fluvoxamine group than in the placebo group; fluvoxamine-treated subjects had a numerically greater decrease in LSAS total scores than subjects treated with placebo |
| Davidson et al (2004)5 | LSAS, CGI-G, SDS, CGI-S, PGI | Fluvoxamine produced statistically and clinically significant improvements in symptoms starting at week 4 on the LSAS and CGI-I and at week 6 on the SDS, CGI-S, and PGI |
| Obsessive-compulsive disorder | ||
| Hollander et al (2003)6 | YBOCS, CGI-S, CGI-I | Fluvoxamine was significantly more effective than placebo in decreasing YBOCS total score beginning at week 2 and in improving CGI-S and CGI-I scores |
| LSAS: Liebowitz Social Anxiety Scale; SDS: Sheehan Disability Scale; CGI-S: Clinical Global Impression-Severity of illness; CGI-I: Clinical Global Impression-Improvement; PGI: Patient Global Impression of Improvement; YBOCS: Yale-Brown Obsessive Compulsive Scale | ||
Tolerability
In the 3 published trials of extended-release fluvoxamine, adverse event rates were similar and consistent with earlier studies of the immediate-release formulation. 1 The manufacturer considered adverse events likely to be drug-related if they had an incidence ≥5% and at least twice that of placebo (Table 3). 1, 3- 6
Adverse events caused 26% of patients in the GSAD studies and 19% in the OCD trial to discontinue treatment. No deaths, life-threatening adverse events, or suicide attempts were reported.3-6 No statistically significant differences in weight gain or loss, vital signs, laboratory findings, or ECG changes were found between patients treated with extended-release fluvoxamine and those receiving placebo.1
Table 3
Extended-release fluvoxamine: Adverse events*
| Study | Adverse events |
|---|---|
| Both GSAD and OCD studies | Abnormal ejaculation, anorexia, anorgasmia, asthenia, diarrhea, nausea, somnolence, sweating, tremor |
| GSAD studies only | Dyspepsia, dizziness, insomnia, yawning |
| OCD study only | Accidental injury, anxiety, decreased libido, myalgia, pharyngitis, emesis |
| * Includes events with an incidence ≥5% and at least twice that of placebo GSAD: generalized social anxiety disorder; OCD: obsessive-compulsive disorder | |
| Source: References 3-6 | |
Contraindications
Immediate- and extended-release fluvoxamine have the same active ingredient and therefore the same contraindications. Coadministration of alosetron, pimozide, thioridazine, or tizanidine, is contraindicated, as is using monoamine oxidase (MAO) inhibitors with extended-release fluvoxamine or within 14 days of discontinuing fluvoxamine treatment. Extended-release fluvoxamine has the same warnings that all SSRIs share regarding clinical worsening and suicide risk, administration to bipolar patients, neuroleptic malignant syndrome, serotonin syndrome, and possible increases in coagulation.1,2
The FDA classifies extended-release fluvoxamine as pregnancy category C.1 The drug is not contraindicated for lactating mothers, but because fluvoxamine is secreted in breast milk discuss with breast-feeding patients the benefits and risks of continuing fluvoxamine therapy.1 Infants exposed to immediate-release fluvoxamine in late pregnancy have developed serious adverse reactions, including respiratory distress, cyanosis, apnea, and seizures.1
Dosing
The recommended starting dose of extended-release fluvoxamine is 100 mg once daily, with or without food.1 The dose can be titrated in 50-mg/week increments as tolerated to achieve maximum therapeutic benefit, to the maximum recommended dose of 300 mg/d. Unlike immediate-release fluvoxamine, which is occasionally split into twice-daily doses, extended-release fluvoxamine must be administered only once daily, even at high doses.1,2
Related resource
- Luvox CR prescribing information. www.jazzpharmaceuticals.com/content/news/documents/LUVOX_CR.pdf.
Drug brand names
- Alosetron • Lotronex
- Fluvoxamine • Luvox
- Fluvoxamine extended-release • Luvox CR
- Pimozide • Orap
- Thioridazine • Mellaril
- Tizanidine • Zanaflex
Disclosures
Dr. Kuzma reports no financial relationship with any company whose products are mentioned in this article or with manufacturers of competing products.
Dr. Black receives research/grant support from Forest Laboratories and is a consultant to Jazz Pharmaceuticals.
1. Luvox CR [package insert]. Palo Alto, CA: Jazz Pharmaceuticals; 2008.
2. Stahl SM. Essential psychopharmacology: the prescriber’s guide. Revised and updated edition. New York, NY: Cambridge University Press; 2006.
3. Westenberg HG, Stein DJ, Yang H, et al. A double-blind placebo-controlled study of controlled release fluvoxamine for the treatment of generalized social anxiety disorder. J Clin Psychopharmacol 2004;24(1):49-55.
4. Stein DJ, Westenberg HG, Yang H, et al. Fluvoxamine CR in the long-term treatment of social anxiety disorder: the 12- to 24-week extension phase of a multicentre, randomized, placebo-controlled trial. Int J Neuropsychopharmacol 2003;6(4):317-23.
5. Davidson J, Yaryura-Tobias J, DuPont R, et al. Fluvoxamine-controlled release formulation for the treatment of generalized social anxiety disorder. J Clin Psychopharmacol 2004;24(2):118-25.
6. Hollander E, Koran LM, Goodman WK, et al. A double-blind, placebo-controlled study of the efficacy and safety of controlled-release fluvoxamine in patients with obsessive-compulsive disorder. J Clin Psychiatry 2003;64(6):640-7.
Fluvoxamine extended-release formulation was FDA-approved to treat generalized social anxiety disorder (GSAD) and obsessive-compulsive disorder (OCD) because it demonstrated efficacy in reducing anxiety symptoms of these disorders in 3 clinical trials. The new formulation may benefit patients unable to tolerate the existing immediate-release form.
Clinical implications
Like other selective serotonin reuptake inhibitors (SSRIs), fluvoxamine alleviates symptoms of GSAD and OCD. The extended-release formulation allows the medication to be administered once daily (Table 1) and, according to the manufacturer, may reduce side effects and improve tolerability.
Many clinicians have prescribed immediate-release fluvoxamine once daily, and the efficacy and tolerability of the immediate- and extended-release formulations have not been compared in head-to-head trials. In addition, no studies have examined the efficacy of extended-release fluvoxamine in treating other psychiatric conditions.
Table 1
Extended-release fluvoxamine: Fast facts
| Brand name: Luvox CR |
| Class: Selective serotonin reuptake inhibitor |
| Indication: Generalized social anxiety disorder and obsessive-compulsive disorder |
| Approval date: February 29, 2008 |
| Availability date: March 2008 |
| Manufacturer: Jazz Pharmaceuticals |
| Dosing forms: 100 mg and 150 mg extended-release capsules |
| Recommended dose: Starting dose: 100 mg/d. Titrate in 50-mg/week increments until maximum therapeutic benefit is achieved. Maximum recommended dose: 300 mg/d |
How it works
Decreased serotonin levels are associated with GSAD and OCD. Fluvoxamine’s therapeutic effect is thought to be mediated through its specific serotonin reuptake inhibition in the CNS.1
The drug acts primarily on serotonin 2C receptors, with no reported significant affinity for histaminergic, adrenergic, muscarinic, or dopaminergic receptors.1 Fluvoxamine’s 1-sigma receptor antagonism is unique among SSRIs, and researchers have suggested that this may make fluvoxamine more effective than other SSRIs in treating anxious or delusional depression.2
The extended-release formulation uses a spheroidal oral drug absorption system, a proprietary technology that limits peak-to-trough variance for 24 hours.1 The manufacturer postulates that decreased plasma concentration variability will improve fluvoxamine’s tolerability.1
Pharmacokinetics
In a single-dose crossover study of 28 healthy subjects, the mean maximum concentration of drug (Cmax) for extended-release fluvoxamine was 38% lower than that of the immediate-release formulation, which may reduce the risk of adverse effects.1 Its relative bioavailability was 84%, and mean plasma half-life was 16.3 hours in male and female volunteers.1
Fluvoxamine is extensively metabolized in the liver, primarily through oxidative demethylation and deamination.1 Nine metabolites constitute 85% of the urinary excretion product; the main metabolite is fluvoxamine acid.1 Approximately 2% of fluvoxamine is excreted unchanged in urine. Administering extended-release fluvoxamine capsules with food does not appear to affect the drug’s absorption.1
Fluvoxamine is a potent inhibitor of the cytochrome P450 (CYP) 1A2 isoenzyme and also is believed to significantly inhibit CYP3A4, CYP2C9, CYP3A4, and CYP2C19. It is a relatively weak inhibitor of CYP2D6.1
Efficacy
The FDA based its approval of extended-release fluvoxamine on data from 3 clinical trials with positive outcomes: 2 for GSAD and 1 for OCD (Table 2).1,3-6
GSAD trials. In the first GSAD study—a randomized, double-blind, placebo-controlled, multicenter trial of 300 subjects with GSAD—participants were randomly assigned to receive extended-release fluvoxamine or placebo for 12 weeks.3 The extended-release fluvoxamine group started at 100 mg administered at night, with dosages titrated at 50 mg/week based on efficacy and tolerability to a maximum of 300 mg/d.1 Subjects in the extended-release fluvoxamine group demonstrated a statistically significant change in Liebowitz Social Anxiety Scale (LSAS) scores from baseline compared with those receiving placebo (P=0.02). Researchers observed similar results in secondary measures.
In an extension of this study, 112 subjects who demonstrated at least minimal improvement from extended-release fluvoxamine by week 12 continued the same dosing regimen for an additional 12 weeks. Investigators found the drug’s beneficial effects persisted to 24 weeks, although the magnitude of the effect decreased.4
A separate study using the same dosing regimen enrolled 279 adult patients in a 12-week, multicenter, randomized, placebo-controlled trial.5 The fluvoxamine-treated group showed statistically and clinically significant improvement:
- by week 4 on the LSAS and the Clinical Global Impression-Improvement (CGI-I) scale
- by week 6 on the Sheehan Disability Scale, Clinical Global Impression-Severity scale (CGI-S) and Patient Global Impression of Improvement (PGI) scale.5
OCD trial. Hollander et al6 conducted a 12-week, double-blind, placebo-controlled, flexible-dose, parallel multicenter trial of 253 adult patients with OCD.6 Compared with those receiving placebo, subjects treated with extended-release fluvoxamine, 100 to 300 mg/d, showed a statistically significant decrease in score on the Yale-Brown Obsessive Compulsive Scale (P=0.001).6 Analysis of the CGIS and CGI-I also revealed statistically significant improvement compared with placebo. The effect appeared to begin at week 2.
As did the GSAD studies, this study compared extended-release fluvoxamine with placebo and not with the immediate-release formulation. Although no additional studies have examined the efficacy of extended-release fluvoxamine in treating OCD and the drug has not been evaluated in pediatric patients, the manufacturer notes that the immediate-release formulation has been evaluated in 2 studies with adult OCD patients and 1 pediatric OCD study, all of which had positive results.1
Table 2
Fluvoxamine extended-release: What the evidence says
| Study | Measures used | Results |
|---|---|---|
| Generalized social anxiety disorder | ||
| Westenberg et al (2004)3 | LSAS, CGI-S, CGI-I, SDS, PGI | Fluvoxamine was significantly more effective than placebo in decreasing LSAS total score (primary measure) starting at week 4 and in improving SDS, CGI-S, and CGI-I (secondary measures) |
| Stein et al (2003)4 | LSAS, CGI-S, CGI-I, SDS, PGI | Severity of illness on the CGI-S scale and disability on the SDS were significantly lower in the fluvoxamine group than in the placebo group; fluvoxamine-treated subjects had a numerically greater decrease in LSAS total scores than subjects treated with placebo |
| Davidson et al (2004)5 | LSAS, CGI-G, SDS, CGI-S, PGI | Fluvoxamine produced statistically and clinically significant improvements in symptoms starting at week 4 on the LSAS and CGI-I and at week 6 on the SDS, CGI-S, and PGI |
| Obsessive-compulsive disorder | ||
| Hollander et al (2003)6 | YBOCS, CGI-S, CGI-I | Fluvoxamine was significantly more effective than placebo in decreasing YBOCS total score beginning at week 2 and in improving CGI-S and CGI-I scores |
| LSAS: Liebowitz Social Anxiety Scale; SDS: Sheehan Disability Scale; CGI-S: Clinical Global Impression-Severity of illness; CGI-I: Clinical Global Impression-Improvement; PGI: Patient Global Impression of Improvement; YBOCS: Yale-Brown Obsessive Compulsive Scale | ||
Tolerability
In the 3 published trials of extended-release fluvoxamine, adverse event rates were similar and consistent with earlier studies of the immediate-release formulation. 1 The manufacturer considered adverse events likely to be drug-related if they had an incidence ≥5% and at least twice that of placebo (Table 3). 1, 3- 6
Adverse events caused 26% of patients in the GSAD studies and 19% in the OCD trial to discontinue treatment. No deaths, life-threatening adverse events, or suicide attempts were reported.3-6 No statistically significant differences in weight gain or loss, vital signs, laboratory findings, or ECG changes were found between patients treated with extended-release fluvoxamine and those receiving placebo.1
Table 3
Extended-release fluvoxamine: Adverse events*
| Study | Adverse events |
|---|---|
| Both GSAD and OCD studies | Abnormal ejaculation, anorexia, anorgasmia, asthenia, diarrhea, nausea, somnolence, sweating, tremor |
| GSAD studies only | Dyspepsia, dizziness, insomnia, yawning |
| OCD study only | Accidental injury, anxiety, decreased libido, myalgia, pharyngitis, emesis |
| * Includes events with an incidence ≥5% and at least twice that of placebo GSAD: generalized social anxiety disorder; OCD: obsessive-compulsive disorder | |
| Source: References 3-6 | |
Contraindications
Immediate- and extended-release fluvoxamine have the same active ingredient and therefore the same contraindications. Coadministration of alosetron, pimozide, thioridazine, or tizanidine, is contraindicated, as is using monoamine oxidase (MAO) inhibitors with extended-release fluvoxamine or within 14 days of discontinuing fluvoxamine treatment. Extended-release fluvoxamine has the same warnings that all SSRIs share regarding clinical worsening and suicide risk, administration to bipolar patients, neuroleptic malignant syndrome, serotonin syndrome, and possible increases in coagulation.1,2
The FDA classifies extended-release fluvoxamine as pregnancy category C.1 The drug is not contraindicated for lactating mothers, but because fluvoxamine is secreted in breast milk discuss with breast-feeding patients the benefits and risks of continuing fluvoxamine therapy.1 Infants exposed to immediate-release fluvoxamine in late pregnancy have developed serious adverse reactions, including respiratory distress, cyanosis, apnea, and seizures.1
Dosing
The recommended starting dose of extended-release fluvoxamine is 100 mg once daily, with or without food.1 The dose can be titrated in 50-mg/week increments as tolerated to achieve maximum therapeutic benefit, to the maximum recommended dose of 300 mg/d. Unlike immediate-release fluvoxamine, which is occasionally split into twice-daily doses, extended-release fluvoxamine must be administered only once daily, even at high doses.1,2
Related resource
- Luvox CR prescribing information. www.jazzpharmaceuticals.com/content/news/documents/LUVOX_CR.pdf.
Drug brand names
- Alosetron • Lotronex
- Fluvoxamine • Luvox
- Fluvoxamine extended-release • Luvox CR
- Pimozide • Orap
- Thioridazine • Mellaril
- Tizanidine • Zanaflex
Disclosures
Dr. Kuzma reports no financial relationship with any company whose products are mentioned in this article or with manufacturers of competing products.
Dr. Black receives research/grant support from Forest Laboratories and is a consultant to Jazz Pharmaceuticals.
1. Luvox CR [package insert]. Palo Alto, CA: Jazz Pharmaceuticals; 2008.
2. Stahl SM. Essential psychopharmacology: the prescriber’s guide. Revised and updated edition. New York, NY: Cambridge University Press; 2006.
3. Westenberg HG, Stein DJ, Yang H, et al. A double-blind placebo-controlled study of controlled release fluvoxamine for the treatment of generalized social anxiety disorder. J Clin Psychopharmacol 2004;24(1):49-55.
4. Stein DJ, Westenberg HG, Yang H, et al. Fluvoxamine CR in the long-term treatment of social anxiety disorder: the 12- to 24-week extension phase of a multicentre, randomized, placebo-controlled trial. Int J Neuropsychopharmacol 2003;6(4):317-23.
5. Davidson J, Yaryura-Tobias J, DuPont R, et al. Fluvoxamine-controlled release formulation for the treatment of generalized social anxiety disorder. J Clin Psychopharmacol 2004;24(2):118-25.
6. Hollander E, Koran LM, Goodman WK, et al. A double-blind, placebo-controlled study of the efficacy and safety of controlled-release fluvoxamine in patients with obsessive-compulsive disorder. J Clin Psychiatry 2003;64(6):640-7.
Newly identified NHP2 biallelic mutation can cause dyskeratosis congenita

Copenhagen— Researchers have identified a new biallelic mutation in the telomerase component NHP2, which can cause the premature aging syndrome dyskeratosis congenita.
Thomas J. Vulliamy, PhD, MRCPath, from Barts and the London School of Medicine and Dentistry, presented this finding at the 13th Congress of the European Hematology Association.
Dyskeratosis congenita is a genetically heterogeneous, multisystem disorder. The unifying feature of dyskeratosis congenita is that all mutations identified thus far affect molecules involved in telomere maintenance. Defective telomerase leads to premature aging, bone marrow failure, and a predisposition to 32 cancers.
Investigators analyzed the proteins NHP2 and GAR1 using high performance liquid chromatography screening followed by direct DNA sequencing. NHP2 and GAR1 are key components of telomerase, along with dyskerin and NOP10, and small nucleolar ribonucleoprotein (snoRNP) complexes.
Investigators measured telomere lengths by Southern blot analysis and assessed TERC levels and the effects of siRNA knockdown of gene transcripts using quantitative real-time PCR.
Dr Vulliamy and colleagues found that mutations in NHP2 can cause autosomal recessive dyskeratosis congenita. Patients with NHP2, dyskerin, and NOP10 mutations have short telomeres and low TERC levels.
Investigators concluded that this provided direct evidence of their role in telomere maintenance in humans. They did not find any GAR1 mutations, suggesting that GAR1 has a different impact on the accumulation of TERC.
This abstract was chosen as one of the 5 best of the Congress. ![]()
Acute paraplegia in a patient with AIDS and a normal CSF examination
A 35‐year‐old Zimbabwean woman living in London, England, presented to the local accident and emergency department with a history of cough, shortness of breath, nausea, vomiting, diarrhea, and weight loss of 3 months' duration. Her chest X‐ray showed miliary shadowing. She was admitted to the hospital and commenced on antituberculous medications and offered an HIV test. Two weeks later, her sputum grew acid‐fast bacilli (AFB) and her HIV‐1 test came back positive. Her baseline T‐lymphocyte CD4 cell count was 6 cells/mm3 (reference range 4551320), and her HIV‐1 RNA viral load (VL) was 4,760,000 copies/mL. However, because of her multiple symptoms, her antiretroviral therapy was postponed. Four weeks later the patient's general condition improved, but she started to experience pain in her right thigh, followed by progressive right leg weakness without sensory loss. This new change affected her mobility, and she fell while walking. Within a week the patient developed progressive flaccid paraparesis with radicular sensory disturbance. This was followed by acute onset of flaccid paraplegia, extensor plantars, sensory loss to T10, and urinary incontinence. Her cerebrospinal fluid (CSF) examination revealed normal protein, glucose, and white cell count and no AFB or malignant cells, A second CSF after 3 weeks was abnormal, with protein of 0.79 g/L, normal glucose, 7 white cells (no malignant cells), and positive oligoclonal bands. The CSF screening for AFB‐PCR, treponemes, toxoplasma, cryptococcal antigen Epstein‐Barr virus, cytomegalovirus (CMV), herpes simplex virus, human T‐lymphotropic virus, and JC virus was negative. Neurophysiological studies confirmed the presence of severe multilevel radiculopathy. The MRI scan of her head and spine showed multiple intraparenchymal cerebral tuberculomata and cavitation at T 911 that enhanced postgadolinium (see Fig. 1). She was commenced on highly active antiretroviral therapy (HAART) and steroids. Ten weeks later her HIV‐1 RNA VL became undetectable in the ultrasensitive assay (cutoff 50 copies/mL), and she regained sensation in both legs and was able to stand with support. Posttreatment MRI appearances demonstrated improvement, and 14 months after treatment the MRI brain was normal (see Fig. 1).

DISCUSSION
Tuberculous myeloradiculitis is a rarely reported manifestation of tuberculosis, and there are no accurate figures for its incidence.13 It may arise as a primary manifestation of the infection, by downward extension of tuberculous meningitis, or by spread from a vertebral osteomyelitis.3 It is not uncommon for it to develop during treatment for a primary infection elsewhere.4 The clinical features of this patient were those of radiculitis followed by rapid flaccid paraparesis. The acute onset of the paraplegia with a normal CSF could be mistakenly interpreted as purely peripheral HIV‐related conditions such as CMV or PML. The extensor plantars and acute development of a paraplegia and sensory level (a combination of radiculopathy, myelopathy, and spinal shock) betrayed the central involvement of the thoracolumbar region.2 In many cases there is a copious leptomeningeal exudate, which helps to explain the fairly typical clinical presentation. This case was unusual in that there was no visible imaging evidence of exudate. The presentation should be differentiated from the vacuolar myelopathy seen with HIV infection alone.1, 5 A further unusual and unique feature was the normality of the CSF examination. Although in cases of tuberculous abscess, the CSF may be normal until rupture occurs into the subarachnoid space, a lymhocytosis, raised protein and possibly hypoglycorrachia would have been expected even in a treated and sterile CSF.3 A normal CSF examination was reported in a previous study.6 This case strongly emphasizes that the diagnosis of opportunistic tuberculosis in the setting of HIV infection can be elusive. Immune reconstruction inflammatory syndrome is an unlikely cause of her neurological symptoms, as she developed these symptoms before HAART. Antituberculous medications and antimycobacterial treatment must be modified to take into account the altered pharmacokinetics as a result of HAART and steroids. There are no published guidelines on how long steroids should be maintained despite their efficacy as an adjunct in TB meningitis.7 There is no evidence to guide their use in patients with coexistent HIV. Treatment until significant improvement or a 6‐month tailed trial of steroids (in the absence of other contraindications) is probably acceptable. Even though the consequences of a well‐placed mycobacterial lesion may be devastating, appropriate treatment may lead to partial and clinically important reversal of disability.
- ,,, et al.Spectrum of myelopathies in HIV seropositive South African patients.Neurology.2001;57:348–351.
- ,.Diagnosis and management of tuberculous paraplegia with special reference to tuberculous radiculomyelitis.J Neurol Neurosurg Psychiatry.1979;42:12–18.
- ,,, et al.Tuberculous radiculomyelitis complicating tuberculous meningitis: case report and review.Clin Infect Dis.2000;30:915–921.
- ,,.Symptomatic intracranial tuberculoma developing during treatment of tuberculosis: a report of 10 patients and review of the literature.Q J Med.1987;63:449–460.
- ,.Infectious myelopathies.Semin Neurol.2002;22:133–141.
- ,,,,,, et al.Tuberculous meningitis in patients infected with the human immunodeficiency virus.New Engl J Med.1992;326:668–672.
- ,,, et al.Dexamethasone for the treatment of tuberculous meningitis in adolescents and adults.N Engl J Med.2004;351:1741–1751.
A 35‐year‐old Zimbabwean woman living in London, England, presented to the local accident and emergency department with a history of cough, shortness of breath, nausea, vomiting, diarrhea, and weight loss of 3 months' duration. Her chest X‐ray showed miliary shadowing. She was admitted to the hospital and commenced on antituberculous medications and offered an HIV test. Two weeks later, her sputum grew acid‐fast bacilli (AFB) and her HIV‐1 test came back positive. Her baseline T‐lymphocyte CD4 cell count was 6 cells/mm3 (reference range 4551320), and her HIV‐1 RNA viral load (VL) was 4,760,000 copies/mL. However, because of her multiple symptoms, her antiretroviral therapy was postponed. Four weeks later the patient's general condition improved, but she started to experience pain in her right thigh, followed by progressive right leg weakness without sensory loss. This new change affected her mobility, and she fell while walking. Within a week the patient developed progressive flaccid paraparesis with radicular sensory disturbance. This was followed by acute onset of flaccid paraplegia, extensor plantars, sensory loss to T10, and urinary incontinence. Her cerebrospinal fluid (CSF) examination revealed normal protein, glucose, and white cell count and no AFB or malignant cells, A second CSF after 3 weeks was abnormal, with protein of 0.79 g/L, normal glucose, 7 white cells (no malignant cells), and positive oligoclonal bands. The CSF screening for AFB‐PCR, treponemes, toxoplasma, cryptococcal antigen Epstein‐Barr virus, cytomegalovirus (CMV), herpes simplex virus, human T‐lymphotropic virus, and JC virus was negative. Neurophysiological studies confirmed the presence of severe multilevel radiculopathy. The MRI scan of her head and spine showed multiple intraparenchymal cerebral tuberculomata and cavitation at T 911 that enhanced postgadolinium (see Fig. 1). She was commenced on highly active antiretroviral therapy (HAART) and steroids. Ten weeks later her HIV‐1 RNA VL became undetectable in the ultrasensitive assay (cutoff 50 copies/mL), and she regained sensation in both legs and was able to stand with support. Posttreatment MRI appearances demonstrated improvement, and 14 months after treatment the MRI brain was normal (see Fig. 1).
DISCUSSION
Tuberculous myeloradiculitis is a rarely reported manifestation of tuberculosis, and there are no accurate figures for its incidence.13 It may arise as a primary manifestation of the infection, by downward extension of tuberculous meningitis, or by spread from a vertebral osteomyelitis.3 It is not uncommon for it to develop during treatment for a primary infection elsewhere.4 The clinical features of this patient were those of radiculitis followed by rapid flaccid paraparesis. The acute onset of the paraplegia with a normal CSF could be mistakenly interpreted as purely peripheral HIV‐related conditions such as CMV or PML. The extensor plantars and acute development of a paraplegia and sensory level (a combination of radiculopathy, myelopathy, and spinal shock) betrayed the central involvement of the thoracolumbar region.2 In many cases there is a copious leptomeningeal exudate, which helps to explain the fairly typical clinical presentation. This case was unusual in that there was no visible imaging evidence of exudate. The presentation should be differentiated from the vacuolar myelopathy seen with HIV infection alone.1, 5 A further unusual and unique feature was the normality of the CSF examination. Although in cases of tuberculous abscess, the CSF may be normal until rupture occurs into the subarachnoid space, a lymhocytosis, raised protein and possibly hypoglycorrachia would have been expected even in a treated and sterile CSF.3 A normal CSF examination was reported in a previous study.6 This case strongly emphasizes that the diagnosis of opportunistic tuberculosis in the setting of HIV infection can be elusive. Immune reconstruction inflammatory syndrome is an unlikely cause of her neurological symptoms, as she developed these symptoms before HAART. Antituberculous medications and antimycobacterial treatment must be modified to take into account the altered pharmacokinetics as a result of HAART and steroids. There are no published guidelines on how long steroids should be maintained despite their efficacy as an adjunct in TB meningitis.7 There is no evidence to guide their use in patients with coexistent HIV. Treatment until significant improvement or a 6‐month tailed trial of steroids (in the absence of other contraindications) is probably acceptable. Even though the consequences of a well‐placed mycobacterial lesion may be devastating, appropriate treatment may lead to partial and clinically important reversal of disability.
- ,,, et al.Spectrum of myelopathies in HIV seropositive South African patients.Neurology.2001;57:348–351.
- ,.Diagnosis and management of tuberculous paraplegia with special reference to tuberculous radiculomyelitis.J Neurol Neurosurg Psychiatry.1979;42:12–18.
- ,,, et al.Tuberculous radiculomyelitis complicating tuberculous meningitis: case report and review.Clin Infect Dis.2000;30:915–921.
- ,,.Symptomatic intracranial tuberculoma developing during treatment of tuberculosis: a report of 10 patients and review of the literature.Q J Med.1987;63:449–460.
- ,.Infectious myelopathies.Semin Neurol.2002;22:133–141.
- ,,,,,, et al.Tuberculous meningitis in patients infected with the human immunodeficiency virus.New Engl J Med.1992;326:668–672.
- ,,, et al.Dexamethasone for the treatment of tuberculous meningitis in adolescents and adults.N Engl J Med.2004;351:1741–1751.
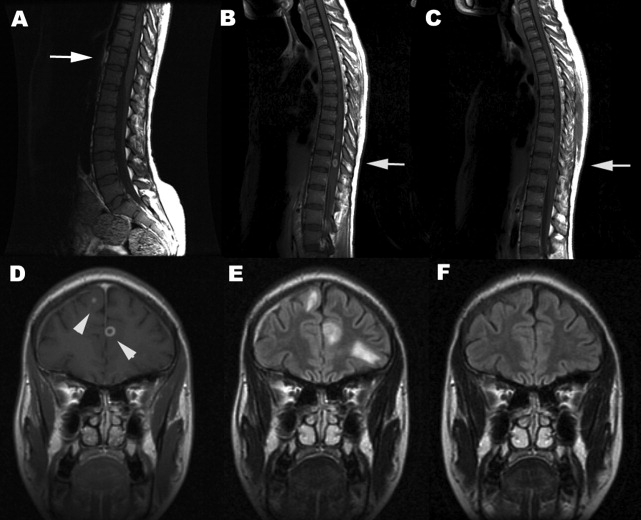
Cullen's sign associated with metastatic esophageal carcinoma
Examination of the abdomen is an important element of the physical examination, especially in patients with known or suspected cancer. Patients with intraabdominal malignancy occasionally manifest unusual ominous findings on abdominal examination that may portend a poor prognosis: periumbilical adenopathy (Sister Mary Joseph sign),1 hepatic pulsations,2 or a hepatic friction rub or bruit.3 An uncommonly reported, and likely under‐appreciated, sign of intraabdominal cancer is periumbilical ecchymosis, also known as Cullen's sign.4 Reported below is a case of Cullen's sign associated with metastatic esophageal carcinoma.
CASE REPORT
An 80‐year‐old man with recently diagnosed esophageal adenocarcinoma presented with fever, cough, lassitude, and abdominal distention. Several weeks earlier, the patient underwent esophagogastroduodenoscopy for dysphagia and weight loss and was found to have a partially obstructing, ulcerated distal esophageal mass. Biopsy revealed poorly differentiated adenocarcinoma. At that time, computed tomography showed mediastinal adenopathy Subsequently, the patient developed increasing dysphagia with a cough, painful abdominal distention, and profound weight loss and was admitted to the hospital for further evaluation.
The patient was tachycardic and hypotensive. Physical examination revealed muscle wasting, anasarca, and abdominal distention with diffuse tenderness. An area of periumbilical ecchymosis measuring approximately 10 cm in diameter was noted. The patient had not sustained any obvious abdominal trauma or received any injections in the periumbilical area. There were no other significant ecchymoses on the abdominal wall, including the flanks. Computed tomography revealed pulmonary infiltrates compatible with pneumonia, mediastinal adenopathy, thickening of the distal esophagus, and ascites; there were no obvious liver lesions, pancreatic or retroperitoneal hemorrhage, or evidence of pancreatitis. Liver enzymes, bilirubin, and alkaline phosphatase were normal, but anemia and leukocytosis were noted. Prothombin time and partial thromboplastin time were 20 and 28 seconds, respectively. Platelet count was normal. Broad‐spectrum antimicrobials were administered for pneumonia. Because of abdominal discomfort, paracentesis was performed. Approximately 2000 cc of opaque yellow fluid was removed. The ascitic fluid was positive for erythrocytes and adenocarcinoma cells, consistent with his known diagnosis of esophageal carcinoma. The patient developed acute renal failure, and his condition continue to decline. He subsequently was discharged to hospice care and died several days later; an autopsy was not performed.
DISCUSSION
Cullen's signecchymosis surrounding the umbilicusis classically associated with hemorrhagic pancreatitis, often occurring in conjunction with ecchymosis of the flank (Grey‐Turner sign).4 Cullen's sign, however, has been reported with other abdominal pathologies such as ruptured ectopic pregnancy, leaking aortic aneurysm, splenic rupture, and retroperitoneal hemorrhage.4, 5 Hemoperitoneum from any of these processes leads to diffusion of blood along fascial planes, resulting in flank staining (Grey‐Turner sign) or periumbilical staining (Cullen's sign). Cullen's sign, however, is traditionally not attributed to malignant disease in standard medical and surgical texts.6, 7 However, the results of a Medline literature search, which revealed only a handful of case reports, suggests an association between advanced malignancy and Cullen's sign (Table 1). All previous reports oc‐curred in patients with advanced terminal malignancy, although no firm conclusions regarding specific malignancies or other risk factors can be surmised from such a small number of cases.5, 8, 9
| Reference | Sex | Age | Cancer | Outcome |
|---|---|---|---|---|
| Present study | M | 80 | Esophageal | Died |
| 5 | M | 55 | Thyroid | Died |
| 8 | M | 62 | Lymphoma | Died |
| 9 | M | 32 | Hepatoma | Died |
| 9 | M | 64 | Hepatoma | Died |
Our patient had stage IV esophageal carcinoma with malignant ascites associated with periumbilical ecchymosis. Unfortunately, serum amylase and lipase were not obtained, but acute pancreatitis‐induced Cullen's sign is unlikely because the patient did not have symptoms of pancreatitis and computed tomography did not reveal pancreatic inflammation or hemorrhage. It is well known that patients with disseminated visceral adenocarcinoma can develop coagulopathy, and that cannot be excluded in our patient. The likely mechanism of periumbilical blood collection is unclear but could relate to subclinical hemoperitoneum from mesenteric and peritoneal carcinomatosus, abdominal wall trauma, or coagulopathy from cancer and acute renal failure. Nonetheless, it is evident from this and previously reported cases that Cullen's sign complicating cancer has a dismal prognosis and is a premorbid sign. Clinicians should consider occult or metastatic visceral malignancy in patients with unexplained abdominal wall ecchymosis.
- ,.Gastric cancer. In:Clinical Hematology and Oncology: Presentation, Diagnosis, and Treatment.Philadelphia:Churchill‐Livingstone,2003;887–898.
- ,.Hepatic pulsations in a patient with cholangiocarcinoma.Arch Intern Med.1996;157:133–134.
- The Abdomen. In:.The Art and Science of Bedside Diagnosis.Baltimore, MD:Williams and Wilkins,1990;371–390.
- .Cullen's sign.Hosp Physician.1999;35:35–36.
- .Cullen's sign associated with metastatic thyroid cancer.N Engl J Med.1999;340:149–150.
- Acute Pancreatitis. In:.Cope's Early Diagnosis of the Acute Abdomen.18th ed.New York:Oxford University Press;1991:123–131.
- ,.Acute and chronic pancreatitis. In:Braunwald E,Fauci AS,Kasper EL, et al., eds.Harrison's Principles of Internal Medicine.15th ed.New York:McGraw‐Hill;2001:1792–1804.
- ,,, et al.Cullen's sign secondary to intraabdominal non‐Hodgkin's lymphoma.Am J Gastroenterol.1996;91:1040–1041.
- ,.Cullen's sign, a feature in liver disease.BMJ.1974;1:493–494.
Examination of the abdomen is an important element of the physical examination, especially in patients with known or suspected cancer. Patients with intraabdominal malignancy occasionally manifest unusual ominous findings on abdominal examination that may portend a poor prognosis: periumbilical adenopathy (Sister Mary Joseph sign),1 hepatic pulsations,2 or a hepatic friction rub or bruit.3 An uncommonly reported, and likely under‐appreciated, sign of intraabdominal cancer is periumbilical ecchymosis, also known as Cullen's sign.4 Reported below is a case of Cullen's sign associated with metastatic esophageal carcinoma.
CASE REPORT
An 80‐year‐old man with recently diagnosed esophageal adenocarcinoma presented with fever, cough, lassitude, and abdominal distention. Several weeks earlier, the patient underwent esophagogastroduodenoscopy for dysphagia and weight loss and was found to have a partially obstructing, ulcerated distal esophageal mass. Biopsy revealed poorly differentiated adenocarcinoma. At that time, computed tomography showed mediastinal adenopathy Subsequently, the patient developed increasing dysphagia with a cough, painful abdominal distention, and profound weight loss and was admitted to the hospital for further evaluation.
The patient was tachycardic and hypotensive. Physical examination revealed muscle wasting, anasarca, and abdominal distention with diffuse tenderness. An area of periumbilical ecchymosis measuring approximately 10 cm in diameter was noted. The patient had not sustained any obvious abdominal trauma or received any injections in the periumbilical area. There were no other significant ecchymoses on the abdominal wall, including the flanks. Computed tomography revealed pulmonary infiltrates compatible with pneumonia, mediastinal adenopathy, thickening of the distal esophagus, and ascites; there were no obvious liver lesions, pancreatic or retroperitoneal hemorrhage, or evidence of pancreatitis. Liver enzymes, bilirubin, and alkaline phosphatase were normal, but anemia and leukocytosis were noted. Prothombin time and partial thromboplastin time were 20 and 28 seconds, respectively. Platelet count was normal. Broad‐spectrum antimicrobials were administered for pneumonia. Because of abdominal discomfort, paracentesis was performed. Approximately 2000 cc of opaque yellow fluid was removed. The ascitic fluid was positive for erythrocytes and adenocarcinoma cells, consistent with his known diagnosis of esophageal carcinoma. The patient developed acute renal failure, and his condition continue to decline. He subsequently was discharged to hospice care and died several days later; an autopsy was not performed.
DISCUSSION
Cullen's signecchymosis surrounding the umbilicusis classically associated with hemorrhagic pancreatitis, often occurring in conjunction with ecchymosis of the flank (Grey‐Turner sign).4 Cullen's sign, however, has been reported with other abdominal pathologies such as ruptured ectopic pregnancy, leaking aortic aneurysm, splenic rupture, and retroperitoneal hemorrhage.4, 5 Hemoperitoneum from any of these processes leads to diffusion of blood along fascial planes, resulting in flank staining (Grey‐Turner sign) or periumbilical staining (Cullen's sign). Cullen's sign, however, is traditionally not attributed to malignant disease in standard medical and surgical texts.6, 7 However, the results of a Medline literature search, which revealed only a handful of case reports, suggests an association between advanced malignancy and Cullen's sign (Table 1). All previous reports oc‐curred in patients with advanced terminal malignancy, although no firm conclusions regarding specific malignancies or other risk factors can be surmised from such a small number of cases.5, 8, 9
| Reference | Sex | Age | Cancer | Outcome |
|---|---|---|---|---|
| Present study | M | 80 | Esophageal | Died |
| 5 | M | 55 | Thyroid | Died |
| 8 | M | 62 | Lymphoma | Died |
| 9 | M | 32 | Hepatoma | Died |
| 9 | M | 64 | Hepatoma | Died |
Our patient had stage IV esophageal carcinoma with malignant ascites associated with periumbilical ecchymosis. Unfortunately, serum amylase and lipase were not obtained, but acute pancreatitis‐induced Cullen's sign is unlikely because the patient did not have symptoms of pancreatitis and computed tomography did not reveal pancreatic inflammation or hemorrhage. It is well known that patients with disseminated visceral adenocarcinoma can develop coagulopathy, and that cannot be excluded in our patient. The likely mechanism of periumbilical blood collection is unclear but could relate to subclinical hemoperitoneum from mesenteric and peritoneal carcinomatosus, abdominal wall trauma, or coagulopathy from cancer and acute renal failure. Nonetheless, it is evident from this and previously reported cases that Cullen's sign complicating cancer has a dismal prognosis and is a premorbid sign. Clinicians should consider occult or metastatic visceral malignancy in patients with unexplained abdominal wall ecchymosis.
- ,.Gastric cancer. In:Clinical Hematology and Oncology: Presentation, Diagnosis, and Treatment.Philadelphia:Churchill‐Livingstone,2003;887–898.
- ,.Hepatic pulsations in a patient with cholangiocarcinoma.Arch Intern Med.1996;157:133–134.
- The Abdomen. In:.The Art and Science of Bedside Diagnosis.Baltimore, MD:Williams and Wilkins,1990;371–390.
- .Cullen's sign.Hosp Physician.1999;35:35–36.
- .Cullen's sign associated with metastatic thyroid cancer.N Engl J Med.1999;340:149–150.
- Acute Pancreatitis. In:.Cope's Early Diagnosis of the Acute Abdomen.18th ed.New York:Oxford University Press;1991:123–131.
- ,.Acute and chronic pancreatitis. In:Braunwald E,Fauci AS,Kasper EL, et al., eds.Harrison's Principles of Internal Medicine.15th ed.New York:McGraw‐Hill;2001:1792–1804.
- ,,, et al.Cullen's sign secondary to intraabdominal non‐Hodgkin's lymphoma.Am J Gastroenterol.1996;91:1040–1041.
- ,.Cullen's sign, a feature in liver disease.BMJ.1974;1:493–494.
Nurse Staffing Ratio Trends and Implications
Many studies have reported associations between higher nurse‐to‐patient ratios and decreased mortality and complications. These studies coupled with increasing concern about patient safety, nursing shortages, and nurse burnout have spurred many state legislatures to discuss mandating minimum nurse staffing ratios.15 The California legislature passed law AB394 in 1999, mandating minimum nurse staffing ratios in order to improve patient safety and the nurse work environment. The original implementation date, January 1, 2001, was delayed to allow the California Department of Health Services more time to develop minimum nurse ratios for each unit type.6, 7 California implemented a ratio of at least 1 licensed nurse (RN+LVN) for every 6 patients on general adult medical‐surgical floors on January 1, 2004. This was subsequently increased, on January 1, 2005, to at least 1 licensed nurse for every 5 patients, a ratio that was upheld by the California Supreme Court on March 14, 2005.8
Additional laws regarding nurse staffing are being considered in at least 25 states.9 States have taken 3 main approaches to legislation: mandating nurse staffing ratios for each hospital unit type, requiring hospitals to establish and report nurse staffing plans that typically include ratios, or a combination of mandated ratios and staffing plans.10 This type of legislation would have a major impact on hospitalists, nurses, other health care personnel, hospital administrators, and patients. However, little is known about trends in nurse staffing, how staffing levels vary among hospitals overall, in different markets, and by ownership type and location, and consequently how implementing nurse staffing ratios will affect different types of hospitals, including those that make up the safety net.11
California nurse staffing data are better than many other sources because the state provides nurse staffing hours by unit types in hospitals as opposed to aggregate numbers of nurse hours across an entire hospital or medical center.12 California is also at the forefront of mandated minimum nurse staffing legislation, as it is the only state to have enacted nurse staffing ratio legislation. Examining nurse staffing trends and hospital types currently under mandated or proposed nurse staffing ratios is integral to informing the debate on nurse staffing legislation and its effect on hospitalists. We hypothesized that nurse staffing would increase in California after the legislation was passed in 1999 but that safety‐net hospitals such as those that are urban, government owned, and serving a high percentage of Medicaid and uninsured patients would be more likely to be below minimum ratios.13
MATERIALS AND METHODS
We used hospital financial panel data for 1993 through 2004, the most recent year with complete data, from California's Office of Statewide Health Planning and Development (OSHPD). We included only short‐term acute‐care general hospitals and excluded other hospital types such as long‐term care, children's, and psychiatric hospitals. We investigated staffing of adult general medical‐surgical units and not of other types of units such as intensive care units. The numerator of the staffing variables for each hospital was the combined medical‐surgical productive hours for registered nurses (RNs) and licensed vocational nurses (LVNs), as California allows up to 50% of staffing hours to be LVN hours. Staffing hours of the adult general medical‐surgical units of each hospital are reported on an annual basis. The denominator was total patient days on the acute adult medical‐surgical units of each hospital in a given year. We calculated the number of patients per one nurse by dividing 24 by the nurse hours per patient day (eg, 4.0 nurse hours per patient day is equivalent to a nurse‐to‐patient ratio of 1:6). We did not adjust staffing ratios by the hospital case mix or other factors because the ratio legislation did not take these factors into account.
We further evaluated staffing ratios in 2003 and 2004 based on 5 hospital characteristics: hospital ownership, market competitiveness, teaching status, urban versus rural location, and safety‐net hospitals, using 2 common definitions for the latter. The Institute of Medicine report defines safety‐net providers as those with a substantial share of their patient mix from uninsured and Medicaid populations.13 Safety‐net hospitals have been more specifically defined as short‐term general hospitals whose percentage of Medicaid and uninsured patients is greater than 1 standard deviation above the mean.14 Using this definition, hospitals in California where more than 36% of patients had Medicaid or no insurance in 2004 would be considered safety‐net hospitals. A more comprehensive definition of the hospital safety net that has been used includes urban nonprofit and government hospitals and hospitals with a high percentage of Medicaid/uninsured patients.10, 11, 15 We analyzed nurse staffing ratios using both these definitions. Hospital ownership was designated as for profit, nonprofit, or government owned. Hospital competitiveness was measured using the Hirschman‐Herfindahl Index (HHI), or the sum of squared market shares, a standard approach to defining hospital market competition. Market boundaries were defined as those zip codes from which each hospital draws most of its patients.16 We then dichotomized hospitals into a high‐ or low‐competition category based on the approximate median HHI cut point of 0.34. Teaching status was based on intern/resident‐to‐bed ratio (ie, 0 = nonteaching, 0.010.25 = minor teaching, and >0.25 = major teaching). Location was defined by county location as either urban or nonurban medical service area.
We then analyzed the percentage of hospitals in 2003 and 2004 below the mandated minimum ratios of (1) at least 1 licensed nurse (RN+LVN) per 6 patients effective in 2004, (2) the ratio of 1 (RN+LVN) nurse per 5 patients to be implemented in 2005, (3) the ratio of at least 1 registered nurse (RN only) per 5 patients, and (4) at least 1 nurse (RN+LVN) per 4 patients, as these ratios are under consideration in other states.9, 17 Finally, we examined the trend in nurse staffing ratios from 2003, the pre‐implementation year, to 2004, the post‐implementation year. Data analysis was performed using STATA SE 9.1 (College Station, TX).
RESULTS
Nurse Staffing Trends
The trend in nurse staffing ratios based on licensed nurses (RN + LVN) from 1993 to 2004 is shown in Figure 1, with lines representing the 10th, 25th, 50th (median), and 75th percentiles of hospital nurse staffing ratios. The nurse staffing ratios were essentially flat from 1993 to 1999 without any significant trend. After nurse staffing legislation was passed in 1999, median nurse‐to‐patient ratio rose, with the largest increase from 2003 to the implementation year for staffing ratios, 2004. From 2003 to 2004, the median hospital staffing ratio increased from fewer than 1 nurse per 4 patients to a ratio of more than 1 nurse per 4 patients. The first year that fewer than 25% of hospitals were below the minimum of at least 1 nurse per 5 patients was 2003.

Trends in Nurse Staffing Mix
The legislation in California and the proposed legislation in some other states allow hospitals to meet mandated ratios with both RNs and LVNs or LPNs, that is, with licensed nursing staff. Specifically, California allows up to 50% of nurse staffing ratios to be met by LVN hours. Therefore, we analyzed the overall trend in percentage of nurse staffing hours attributable to LVNs. In 1993, LVNs accounted for 27% of nurse staffing hours. Because of a steady decrease in the proportion of LVNs staffing relative to RNs staffing, LVNs accounted for only 13% of the nurse staffing hours by 2004.
Hospitals Below Implemented and Proposed Ratios
The first column of Table 1 shows the percentage of hospitals of each type in 2003 and 2004 below the mandated ratio of at least 1 licensed nurse (RN+LVN) per 6 patients, which went into effect January 1, 2004. The next column represents the hospitals below the ratio of at least 1 licensed nurse per 5 patients, which was implemented in 2005. The final 2 columns represent ratios that have been considered in other states of at least 1 RN per 5 patients and at least 1 licensed nurse per 4 patients.9, 17 In 2004, only 2.4% of hospitals were below a minimum ratio of at least 1 nurse (RN+LVN) per 6 patients, but 11.4% were below 1:5, 29.5% were below 1 RN per 5 patients, and 40.4% were below at least 1 nurse (RN+LVN) per 4 patients. This demonstrates the substantial increase in the proportion of hospitals that are below minimum ratios as the number of nurses or required training level of nurses is increased.
| <1 Nurse per 6 patients (RN+LVN)* | <1 Nurse per 5 patients (RN+LVN)* | <1 Nurse per 5 patients (RN only)* | <1 Nurse per 4 patients (RN+LVN)* | |||||
|---|---|---|---|---|---|---|---|---|
| 2003 (%) | 2004 (%) | 2003 (%) | 2004 (%) | 2003 (%) | 2004 (%) | 2003 (%) | 2004 (%) | |
| ||||||||
| All hospitals (2003, n = 342; 2004, n = 332) | 5.0% | 2.4% | 19.6% | 11.4% | 39.8 | 29.5% | 53.2% | 40.4% |
| Hospital ownership‖ | ||||||||
| For‐profit (2003, n = 87; 2004, n = 82) | 2.3% | 1.2% | 25.3% | 9.8% | 54.0 | 32.9% | 63.2% | 40.2% |
| Nonprofit (2003, n = 234; 2004, n = 231) | 5.6% | 3.0% | 16.7% | 11.3% | 34.6 | 28.1% | 49.6% | 40.7% |
| Government (2003, n = 21; 2004, n = 19) | 9.5% | 0% | 28.6% | 21.1% | 38.1 | 31.6% | 52.4% | 36.8% |
| More competitive versus less competitive markets‖ | ||||||||
| More competitive (2003, n = 168; 2004, n = 163) | 6.0% | 2.6% | 25.0% | 11.7% | 46.4 | 33.8% | 59.3% | 42.2% |
| Less competitive (2003, n = 174; 2004, n = 169) | 4.0% | 2.2% | 14.4% | 11.2% | 33.3 | 25.8% | 48.3% | 38.8% |
| Teaching status‖ | ||||||||
| No teaching (2003 n = 250; 2004 n = 251) | 5.6% | 2.4% | 20.4% | 12.0% | 42.0% | 30.7% | 56.0% | 41.0% |
| Minor teaching (2003 n = 72; 2004 n = 60) | 2.8% | 3.3% | 18.1% | 10.0% | 36.5% | 28.3% | 48.6% | 41.7% |
| Major teaching (2003 n = 20; 2004 n = 21) | 5.0% | 0% | 15.0% | 9.5% | 20.0% | 19.0% | 35.0% | 28.6% |
| Urban versus nonurban‖ | ||||||||
| Urban (2003 n = 306; 2004 n = 294) | 4.9% | 2.4% | 20.9% | 11.9% | 41.2% | 30.6% | 55.6% | 42.5% |
| Nonurban (2003 n = 36; 2004 n = 38) | 5.6% | 2.6% | 8.3% | 7.9% | 27.8% | 21.1% | 33.3% | 23.7% |
| High versus low Medicaid/uninsured patient population‖ | ||||||||
| High (36%; 2003, n = 65; 2004, n = 60) | 6.2% | 5.0% | 30.8% | 21.7% | 50.8% | 43.3% | 64.6% | 48.7% |
| Low (<36%; 2003, n = 276; 2004, n = 270) | 4.7% | 1.9% | 17.0% | 9.3% | 37.3% | 26.7% | 50.7% | 39.3% |
Nurse Staffing Ratio Changes in First Year of Implementation of Legislation
From 2003 to 2004, there was a decrease in the percentage of hospitals below all the ratios. The absolute decrease was least in the actual mandated ratio in 2004 of at least 1 nurse per 6 patients (5.0% of hospitals below the ratio in 2003 versus 2.4% of hospitals in 2004), and the decrease was greatest in the highest ratio of at least 1 nurse per 4 patients (53.2% versus 40.4%). Although there was a decrease in the percentage of hospitals of all types below the minimum ratios from 2003 to 2004, some hospital types had larger reductions in hospitals below ratios than others. The types of hospitals with the most significant decreases in the percentage below minimum ratios were for‐profit hospitals, hospitals in more competitive markets, nonteaching hospitals, urban hospitals, and non‐safety‐net hospitals with a low percentage of Medicaid/uninsured patients.
Types of Hospitals Below Minimum Ratios
One of the most important considerations is the type of hospital in 2004 below the minimum ratio of at least 1 nurse (RN+LVN) per 5 patients implemented January 1, 2005. The hospital types with the highest percentage of hospitals below the 1:5 ratio were those with a high proportion of Medicaid/uninsured (21.7%), government owned (21.1%), nonteaching (12.0%), urban (11.9%), and in more competitive markets (11.7%). Of note, hospitals with a high proportion of Medicaid/uninsured patients were significantly more likely than hospitals with a low proportion of Medicaid patients to be below minimum ratios. These safety net hospitals also failed to achieve the significant decrease in percentage of hospitals below minimum ratios from 2003 to 2004 that hospitals with a low Medicaid population achieved. There were a total of 38 of 332 hospitals (11.4%) whose ratios were below the minimum of at least 1 nurse (RN+LVN) per 5 patients in 2004 (Table 1). Using the broader definition of hospital safety net, which includes urban nonprofit and government hospitals in addition to those hospitals with a high percentage of Medicaid/uninsured patients, the vast majority of hospitals (84%)32 of 38below the minimum ratio of 1:5 in 2004 were part of the hospital safety net.
DISCUSSION
These data demonstrate that nurse staffing ratios in California were relatively stable from 1993 to 1999. In 1999, law AB 394 with its focus on nurse staffing levels passed, and subsequently, from 1999 to 2004, nurse staffing levels increased significantly, with the largest increase in 2004, the year of implementation. Although multiple factors could account for this trend, a likely cause for the statewide increase in nurse staffing was the anticipation and then implementation of legislation to achieve minimum ratios.
This study had several limitations. The OSHPD data capture nurse staffing on an annual basis, but the California legislation mandated minimum nurse staffing ratios be kept at all times; these data do not capture how often a given hospital was below the minimum ratio on a monthly or shift‐by‐shift basis. These data may overreport nurse staffing hours if they include hours not spent in direct patient care, or they could misrepresent nurse staffing ratios because of poor reporting.
Certain hospitals are more likely to be below mandated ratios. These hospitals are often government owned, in urban areas, and serve a high percentage of Medicaid/uninsured patients. Hospitals with these characteristics are typically considered part of the safety net. These are the hospitals that serve our nation's most vulnerable populations and are likely to struggle disproportionately to meet minimum mandated ratios. As evidence of these precarious finances, 67% of hospitals defined as safety‐net hospitals based on a high percentage of Medicaid/uninsured patients in 2004 had a negative operating margin versus 40% of hospitals not considered to be safety‐net hospitals (P < .001).18 The question remains how hospitals will meet minimum nurse staffing ratios given these tenuous operating margins, as some of the approaches might result in restricted access, reduced services, reduced expenditures on new equipment or technology, or other decisions that might adversely affect quality. These potential tradeoffs will directly affect hospitalists, nurses, and other health care personnel working in hospitals. Because legislation generally does not provide funds or mechanisms to help hospitals meet proposed staffing ratios and there is a national nursing shortage, hospitals may struggle to meet minimum ratios. Cross‐sectional studies have demonstrated a potential link between increased nurse staffing and better patient outcomes,15 but if a financially constrained hospital makes tradeoffs by restricting access to care and services or by diverting funds from other beneficial uses, on balance, mandated nurse staffing ratios may not be beneficial to patients. The potential for unintended but serious negative consequences exists if hospitals in the safety net are mandated to meet minimum nurse staffing ratios without adequate resources.
At all types of hospitals, hospitalists are increasingly becoming responsible for quality improvement programs and outcomes measurement. However, the outcomes of these programs may be strongly influenced by nurse staffing. For example, cross‐sectional studies have demonstrated that increased nurse staffing was associated with decreased mortality, length of stay, failure to rescue from complications, catheter‐associated bloodstream infections, catheter‐associated urinary tract infections, gastrointestinal bleeding, ventilator‐acquired pneumonia, and shock or cardiac arrest.1, 4, 19 These types of quality and patient safety outcomes are likely to be the focus of many hospitalist‐led quality improvement programs and may even be linked to hospitalist compensation. Therefore, hospitals and their hospitalists must take into account the effect that inadequate nurse staffing could have on their patient outcomes while balancing the investment in nurse staffing with other quality improvement investments. An interaction between nurse staffing level and hospitalist staffing may exist, but we are unaware of any published studies investigating this interaction. The nurse burnout documented to be associated with inadequate nurse staffing certainly could affect hospitalists if it increases nurse turnover or inhibits effective communication.1 Additional research is needed to better delineate the effects of nurse staffing, particularly in regard to hospitalists and hospital‐based quality and safety initiatives.
Finally, these data highlight the need for policymakers and hospital administrators to consider whether the aim is to establish a minimal floor or an optimal ratio. California first opted for what many would consider a minimal floor of at least 1 nurse per 6 patients, as only 5% of hospitals were below this ratio in 2003. California then increased the ratio to a 1:5 nurse‐to‐patient ratio, which affected a larger percentage of hospitals, presumably because of a belief that this higher ratio would lead to better outcomes. In addition, some states such as Massachusetts have considered a minimum ratio of 1:4.17 A ratio of 1:4 would require a significant proportion of hospitals to hire more nurses if staffing levels are similar to California. Only a few studies have estimated the cost effectiveness of staffing changes. Based on cross‐sectional data, Needleman et al. estimated that it would cost $8.5 billion nationally to raise all hospitals to the 75th percentile of RN and overall nurse staffing but that this would prevent 70,000 adverse patient outcomes (eg, hospital‐acquired pneumonia). Rothberg et al. estimated that the incremental cost per life saved as a hospital moved from 1 nurse per 8 patients to 1 nurse per 5 patients was $48,100. However, these estimates based on cross‐sectional data fail to inform the debate on optimal nurse staffing ratios. The effect on patient outcomes when hospitals move from 1:6 to 1:5 or 1:4 nurse staffing levels needs to be determined in a longitudinal study. Thus, legislators and hospitals have little to guide them in establishing optimal nurse staffing ratios, and consideration of specific mandated minimum ratios would benefit greatly from comparative information on the cost and quality tradeoffs.
Hospitals, policy makers, health care providers, and researchers are struggling to improve the health care delivered in our hospitals; fortunately, there has been an increased focus on the importance of nurses who deliver medical care on the front lines and are responsible for many aspects of quality. Mandating minimum nurse staffing ratios may seem like an easy fix of the problem; however, we must consider how these ratios can be met, the potential difficulty for hospitals to meet these ratios in the fraying safety net20, and possible unintended negative consequences. Without a mechanism for hospitals to meet ratios, simply mandating a minimum ratio will not necessarily improve care. Hospitalists should be leaders in better understanding the effects of nurse staffing on patient outcomes and quality initiatives in hospitals.
Acknowledgements
We acknowledge the California Office of Statewide Health Planning and Development (OSHPD) for providing the data for this study.
- ,,,,.Hospital nurse staffing and patient mortality, nurse burnout, and job dissatisfaction.JAMA.2002;288:1987–1993.
- ,.Working conditions that support patient safety.J Nurs Care Qual.2005;20:289–292.
- ,,,,.Nurse‐patient ratios: a systematic review on the effects of nurse staffing on patient, nurse employee, and hospital outcomes.J Nurs Adm.2004;34:326–337.
- ,,,,.Nurse‐staffing levels and the quality of care in hospitals.N Engl J Med.2002;346:1715–1722.
- ,,,,.Making health care safer: a critical analysis of patient safety practices.Evid Rep Technol Assess (Summ).2001;43:i–x,1–668.
- Implementation of California's Nurse Staffing Law: History of the Law. Available at: http://www.calhealth.org/public/press/Article%5C113%5CImplementation%20of%20CA%20Nurse%20Ratio%20Law,%20History%20of%20 the%20Law.pdf. Accessed September 5,2007.
- AB 394: California and the Demand for Safe and Effective Nurse to Patient Ratios. Available at: http://www.calnurses.org/research/pdfs/IHSP_AB394_staffing_ratios.pdf. Accessed September 5,2007.
- . Information regarding R‐01‐04E: Licensed Nurse‐to‐Patient Ratio. Available at: http://www.dhs.ca.gov/lnc/pubnotice/NTPR/DADMmemoSupCourtDecision.pdf. Accessed December 3,2006.
- Nationwide State Legislative Agenda: Nurse Staffing Plans and Ratios. Available at: http://www.nursingworld.org/GOVA/state.htm. Accessed April 10,2007.
- Staffing Plans and Ratios. Available at: http://nursingworld.org/MainMenuCategories/ThePracticeofProfessionalNursing/workplace/Workforce/ShortageStaffing/Staffing/staffing12765.aspx. Accessed September 5,2007.
- .California's minimum nurse‐to‐patient ratios: the first few months.J Nurs Adm.2004;34:571–578.
- ,.Addressing measurement error bias in nurse staffing research.Health Serv Res.2006;41:2006–2024.
- Institute of Medicine.America's Health Care Safety Net. Washington, DC;2000.
- ,.Population characteristics of markets of safety‐net and non‐safety‐net hospitals.J Urban Health.1999;76:351–370.
- ,.The evolution of support for safety‐net hospitals.Health Aff (Millwood).1997;16:30–47.
- ,.The effects of hospital competition and the Medicare PPS program on hospital cost behavior in California.J Health Econ.1988;7:301–320.
- Massachusetts Nursing Association. Specific RN‐to‐Patient Ratios. Available at: http://www.massnurses.org/safe_care/ratios.htm. Accessed April 1,2007.
- Office of Statewide Health Planning and Development. Available at: http://www.oshpd.state.ca.us/HQAD/Hospital/financial/hospAF.htm. Accessed May 6,2007.
- ,,, et al.Nurse working conditions and patient safety outcomes.Med Care.2007;45:571–578.
- .By a thread—a fragile, fraying safety net is everybody's problem.Hosp Health Netw.2002;76:32,34–40.
Many studies have reported associations between higher nurse‐to‐patient ratios and decreased mortality and complications. These studies coupled with increasing concern about patient safety, nursing shortages, and nurse burnout have spurred many state legislatures to discuss mandating minimum nurse staffing ratios.15 The California legislature passed law AB394 in 1999, mandating minimum nurse staffing ratios in order to improve patient safety and the nurse work environment. The original implementation date, January 1, 2001, was delayed to allow the California Department of Health Services more time to develop minimum nurse ratios for each unit type.6, 7 California implemented a ratio of at least 1 licensed nurse (RN+LVN) for every 6 patients on general adult medical‐surgical floors on January 1, 2004. This was subsequently increased, on January 1, 2005, to at least 1 licensed nurse for every 5 patients, a ratio that was upheld by the California Supreme Court on March 14, 2005.8
Additional laws regarding nurse staffing are being considered in at least 25 states.9 States have taken 3 main approaches to legislation: mandating nurse staffing ratios for each hospital unit type, requiring hospitals to establish and report nurse staffing plans that typically include ratios, or a combination of mandated ratios and staffing plans.10 This type of legislation would have a major impact on hospitalists, nurses, other health care personnel, hospital administrators, and patients. However, little is known about trends in nurse staffing, how staffing levels vary among hospitals overall, in different markets, and by ownership type and location, and consequently how implementing nurse staffing ratios will affect different types of hospitals, including those that make up the safety net.11
California nurse staffing data are better than many other sources because the state provides nurse staffing hours by unit types in hospitals as opposed to aggregate numbers of nurse hours across an entire hospital or medical center.12 California is also at the forefront of mandated minimum nurse staffing legislation, as it is the only state to have enacted nurse staffing ratio legislation. Examining nurse staffing trends and hospital types currently under mandated or proposed nurse staffing ratios is integral to informing the debate on nurse staffing legislation and its effect on hospitalists. We hypothesized that nurse staffing would increase in California after the legislation was passed in 1999 but that safety‐net hospitals such as those that are urban, government owned, and serving a high percentage of Medicaid and uninsured patients would be more likely to be below minimum ratios.13
MATERIALS AND METHODS
We used hospital financial panel data for 1993 through 2004, the most recent year with complete data, from California's Office of Statewide Health Planning and Development (OSHPD). We included only short‐term acute‐care general hospitals and excluded other hospital types such as long‐term care, children's, and psychiatric hospitals. We investigated staffing of adult general medical‐surgical units and not of other types of units such as intensive care units. The numerator of the staffing variables for each hospital was the combined medical‐surgical productive hours for registered nurses (RNs) and licensed vocational nurses (LVNs), as California allows up to 50% of staffing hours to be LVN hours. Staffing hours of the adult general medical‐surgical units of each hospital are reported on an annual basis. The denominator was total patient days on the acute adult medical‐surgical units of each hospital in a given year. We calculated the number of patients per one nurse by dividing 24 by the nurse hours per patient day (eg, 4.0 nurse hours per patient day is equivalent to a nurse‐to‐patient ratio of 1:6). We did not adjust staffing ratios by the hospital case mix or other factors because the ratio legislation did not take these factors into account.
We further evaluated staffing ratios in 2003 and 2004 based on 5 hospital characteristics: hospital ownership, market competitiveness, teaching status, urban versus rural location, and safety‐net hospitals, using 2 common definitions for the latter. The Institute of Medicine report defines safety‐net providers as those with a substantial share of their patient mix from uninsured and Medicaid populations.13 Safety‐net hospitals have been more specifically defined as short‐term general hospitals whose percentage of Medicaid and uninsured patients is greater than 1 standard deviation above the mean.14 Using this definition, hospitals in California where more than 36% of patients had Medicaid or no insurance in 2004 would be considered safety‐net hospitals. A more comprehensive definition of the hospital safety net that has been used includes urban nonprofit and government hospitals and hospitals with a high percentage of Medicaid/uninsured patients.10, 11, 15 We analyzed nurse staffing ratios using both these definitions. Hospital ownership was designated as for profit, nonprofit, or government owned. Hospital competitiveness was measured using the Hirschman‐Herfindahl Index (HHI), or the sum of squared market shares, a standard approach to defining hospital market competition. Market boundaries were defined as those zip codes from which each hospital draws most of its patients.16 We then dichotomized hospitals into a high‐ or low‐competition category based on the approximate median HHI cut point of 0.34. Teaching status was based on intern/resident‐to‐bed ratio (ie, 0 = nonteaching, 0.010.25 = minor teaching, and >0.25 = major teaching). Location was defined by county location as either urban or nonurban medical service area.
We then analyzed the percentage of hospitals in 2003 and 2004 below the mandated minimum ratios of (1) at least 1 licensed nurse (RN+LVN) per 6 patients effective in 2004, (2) the ratio of 1 (RN+LVN) nurse per 5 patients to be implemented in 2005, (3) the ratio of at least 1 registered nurse (RN only) per 5 patients, and (4) at least 1 nurse (RN+LVN) per 4 patients, as these ratios are under consideration in other states.9, 17 Finally, we examined the trend in nurse staffing ratios from 2003, the pre‐implementation year, to 2004, the post‐implementation year. Data analysis was performed using STATA SE 9.1 (College Station, TX).
RESULTS
Nurse Staffing Trends
The trend in nurse staffing ratios based on licensed nurses (RN + LVN) from 1993 to 2004 is shown in Figure 1, with lines representing the 10th, 25th, 50th (median), and 75th percentiles of hospital nurse staffing ratios. The nurse staffing ratios were essentially flat from 1993 to 1999 without any significant trend. After nurse staffing legislation was passed in 1999, median nurse‐to‐patient ratio rose, with the largest increase from 2003 to the implementation year for staffing ratios, 2004. From 2003 to 2004, the median hospital staffing ratio increased from fewer than 1 nurse per 4 patients to a ratio of more than 1 nurse per 4 patients. The first year that fewer than 25% of hospitals were below the minimum of at least 1 nurse per 5 patients was 2003.
Trends in Nurse Staffing Mix
The legislation in California and the proposed legislation in some other states allow hospitals to meet mandated ratios with both RNs and LVNs or LPNs, that is, with licensed nursing staff. Specifically, California allows up to 50% of nurse staffing ratios to be met by LVN hours. Therefore, we analyzed the overall trend in percentage of nurse staffing hours attributable to LVNs. In 1993, LVNs accounted for 27% of nurse staffing hours. Because of a steady decrease in the proportion of LVNs staffing relative to RNs staffing, LVNs accounted for only 13% of the nurse staffing hours by 2004.
Hospitals Below Implemented and Proposed Ratios
The first column of Table 1 shows the percentage of hospitals of each type in 2003 and 2004 below the mandated ratio of at least 1 licensed nurse (RN+LVN) per 6 patients, which went into effect January 1, 2004. The next column represents the hospitals below the ratio of at least 1 licensed nurse per 5 patients, which was implemented in 2005. The final 2 columns represent ratios that have been considered in other states of at least 1 RN per 5 patients and at least 1 licensed nurse per 4 patients.9, 17 In 2004, only 2.4% of hospitals were below a minimum ratio of at least 1 nurse (RN+LVN) per 6 patients, but 11.4% were below 1:5, 29.5% were below 1 RN per 5 patients, and 40.4% were below at least 1 nurse (RN+LVN) per 4 patients. This demonstrates the substantial increase in the proportion of hospitals that are below minimum ratios as the number of nurses or required training level of nurses is increased.
| <1 Nurse per 6 patients (RN+LVN)* | <1 Nurse per 5 patients (RN+LVN)* | <1 Nurse per 5 patients (RN only)* | <1 Nurse per 4 patients (RN+LVN)* | |||||
|---|---|---|---|---|---|---|---|---|
| 2003 (%) | 2004 (%) | 2003 (%) | 2004 (%) | 2003 (%) | 2004 (%) | 2003 (%) | 2004 (%) | |
| ||||||||
| All hospitals (2003, n = 342; 2004, n = 332) | 5.0% | 2.4% | 19.6% | 11.4% | 39.8 | 29.5% | 53.2% | 40.4% |
| Hospital ownership‖ | ||||||||
| For‐profit (2003, n = 87; 2004, n = 82) | 2.3% | 1.2% | 25.3% | 9.8% | 54.0 | 32.9% | 63.2% | 40.2% |
| Nonprofit (2003, n = 234; 2004, n = 231) | 5.6% | 3.0% | 16.7% | 11.3% | 34.6 | 28.1% | 49.6% | 40.7% |
| Government (2003, n = 21; 2004, n = 19) | 9.5% | 0% | 28.6% | 21.1% | 38.1 | 31.6% | 52.4% | 36.8% |
| More competitive versus less competitive markets‖ | ||||||||
| More competitive (2003, n = 168; 2004, n = 163) | 6.0% | 2.6% | 25.0% | 11.7% | 46.4 | 33.8% | 59.3% | 42.2% |
| Less competitive (2003, n = 174; 2004, n = 169) | 4.0% | 2.2% | 14.4% | 11.2% | 33.3 | 25.8% | 48.3% | 38.8% |
| Teaching status‖ | ||||||||
| No teaching (2003 n = 250; 2004 n = 251) | 5.6% | 2.4% | 20.4% | 12.0% | 42.0% | 30.7% | 56.0% | 41.0% |
| Minor teaching (2003 n = 72; 2004 n = 60) | 2.8% | 3.3% | 18.1% | 10.0% | 36.5% | 28.3% | 48.6% | 41.7% |
| Major teaching (2003 n = 20; 2004 n = 21) | 5.0% | 0% | 15.0% | 9.5% | 20.0% | 19.0% | 35.0% | 28.6% |
| Urban versus nonurban‖ | ||||||||
| Urban (2003 n = 306; 2004 n = 294) | 4.9% | 2.4% | 20.9% | 11.9% | 41.2% | 30.6% | 55.6% | 42.5% |
| Nonurban (2003 n = 36; 2004 n = 38) | 5.6% | 2.6% | 8.3% | 7.9% | 27.8% | 21.1% | 33.3% | 23.7% |
| High versus low Medicaid/uninsured patient population‖ | ||||||||
| High (36%; 2003, n = 65; 2004, n = 60) | 6.2% | 5.0% | 30.8% | 21.7% | 50.8% | 43.3% | 64.6% | 48.7% |
| Low (<36%; 2003, n = 276; 2004, n = 270) | 4.7% | 1.9% | 17.0% | 9.3% | 37.3% | 26.7% | 50.7% | 39.3% |
Nurse Staffing Ratio Changes in First Year of Implementation of Legislation
From 2003 to 2004, there was a decrease in the percentage of hospitals below all the ratios. The absolute decrease was least in the actual mandated ratio in 2004 of at least 1 nurse per 6 patients (5.0% of hospitals below the ratio in 2003 versus 2.4% of hospitals in 2004), and the decrease was greatest in the highest ratio of at least 1 nurse per 4 patients (53.2% versus 40.4%). Although there was a decrease in the percentage of hospitals of all types below the minimum ratios from 2003 to 2004, some hospital types had larger reductions in hospitals below ratios than others. The types of hospitals with the most significant decreases in the percentage below minimum ratios were for‐profit hospitals, hospitals in more competitive markets, nonteaching hospitals, urban hospitals, and non‐safety‐net hospitals with a low percentage of Medicaid/uninsured patients.
Types of Hospitals Below Minimum Ratios
One of the most important considerations is the type of hospital in 2004 below the minimum ratio of at least 1 nurse (RN+LVN) per 5 patients implemented January 1, 2005. The hospital types with the highest percentage of hospitals below the 1:5 ratio were those with a high proportion of Medicaid/uninsured (21.7%), government owned (21.1%), nonteaching (12.0%), urban (11.9%), and in more competitive markets (11.7%). Of note, hospitals with a high proportion of Medicaid/uninsured patients were significantly more likely than hospitals with a low proportion of Medicaid patients to be below minimum ratios. These safety net hospitals also failed to achieve the significant decrease in percentage of hospitals below minimum ratios from 2003 to 2004 that hospitals with a low Medicaid population achieved. There were a total of 38 of 332 hospitals (11.4%) whose ratios were below the minimum of at least 1 nurse (RN+LVN) per 5 patients in 2004 (Table 1). Using the broader definition of hospital safety net, which includes urban nonprofit and government hospitals in addition to those hospitals with a high percentage of Medicaid/uninsured patients, the vast majority of hospitals (84%)32 of 38below the minimum ratio of 1:5 in 2004 were part of the hospital safety net.
DISCUSSION
These data demonstrate that nurse staffing ratios in California were relatively stable from 1993 to 1999. In 1999, law AB 394 with its focus on nurse staffing levels passed, and subsequently, from 1999 to 2004, nurse staffing levels increased significantly, with the largest increase in 2004, the year of implementation. Although multiple factors could account for this trend, a likely cause for the statewide increase in nurse staffing was the anticipation and then implementation of legislation to achieve minimum ratios.
This study had several limitations. The OSHPD data capture nurse staffing on an annual basis, but the California legislation mandated minimum nurse staffing ratios be kept at all times; these data do not capture how often a given hospital was below the minimum ratio on a monthly or shift‐by‐shift basis. These data may overreport nurse staffing hours if they include hours not spent in direct patient care, or they could misrepresent nurse staffing ratios because of poor reporting.
Certain hospitals are more likely to be below mandated ratios. These hospitals are often government owned, in urban areas, and serve a high percentage of Medicaid/uninsured patients. Hospitals with these characteristics are typically considered part of the safety net. These are the hospitals that serve our nation's most vulnerable populations and are likely to struggle disproportionately to meet minimum mandated ratios. As evidence of these precarious finances, 67% of hospitals defined as safety‐net hospitals based on a high percentage of Medicaid/uninsured patients in 2004 had a negative operating margin versus 40% of hospitals not considered to be safety‐net hospitals (P < .001).18 The question remains how hospitals will meet minimum nurse staffing ratios given these tenuous operating margins, as some of the approaches might result in restricted access, reduced services, reduced expenditures on new equipment or technology, or other decisions that might adversely affect quality. These potential tradeoffs will directly affect hospitalists, nurses, and other health care personnel working in hospitals. Because legislation generally does not provide funds or mechanisms to help hospitals meet proposed staffing ratios and there is a national nursing shortage, hospitals may struggle to meet minimum ratios. Cross‐sectional studies have demonstrated a potential link between increased nurse staffing and better patient outcomes,15 but if a financially constrained hospital makes tradeoffs by restricting access to care and services or by diverting funds from other beneficial uses, on balance, mandated nurse staffing ratios may not be beneficial to patients. The potential for unintended but serious negative consequences exists if hospitals in the safety net are mandated to meet minimum nurse staffing ratios without adequate resources.
At all types of hospitals, hospitalists are increasingly becoming responsible for quality improvement programs and outcomes measurement. However, the outcomes of these programs may be strongly influenced by nurse staffing. For example, cross‐sectional studies have demonstrated that increased nurse staffing was associated with decreased mortality, length of stay, failure to rescue from complications, catheter‐associated bloodstream infections, catheter‐associated urinary tract infections, gastrointestinal bleeding, ventilator‐acquired pneumonia, and shock or cardiac arrest.1, 4, 19 These types of quality and patient safety outcomes are likely to be the focus of many hospitalist‐led quality improvement programs and may even be linked to hospitalist compensation. Therefore, hospitals and their hospitalists must take into account the effect that inadequate nurse staffing could have on their patient outcomes while balancing the investment in nurse staffing with other quality improvement investments. An interaction between nurse staffing level and hospitalist staffing may exist, but we are unaware of any published studies investigating this interaction. The nurse burnout documented to be associated with inadequate nurse staffing certainly could affect hospitalists if it increases nurse turnover or inhibits effective communication.1 Additional research is needed to better delineate the effects of nurse staffing, particularly in regard to hospitalists and hospital‐based quality and safety initiatives.
Finally, these data highlight the need for policymakers and hospital administrators to consider whether the aim is to establish a minimal floor or an optimal ratio. California first opted for what many would consider a minimal floor of at least 1 nurse per 6 patients, as only 5% of hospitals were below this ratio in 2003. California then increased the ratio to a 1:5 nurse‐to‐patient ratio, which affected a larger percentage of hospitals, presumably because of a belief that this higher ratio would lead to better outcomes. In addition, some states such as Massachusetts have considered a minimum ratio of 1:4.17 A ratio of 1:4 would require a significant proportion of hospitals to hire more nurses if staffing levels are similar to California. Only a few studies have estimated the cost effectiveness of staffing changes. Based on cross‐sectional data, Needleman et al. estimated that it would cost $8.5 billion nationally to raise all hospitals to the 75th percentile of RN and overall nurse staffing but that this would prevent 70,000 adverse patient outcomes (eg, hospital‐acquired pneumonia). Rothberg et al. estimated that the incremental cost per life saved as a hospital moved from 1 nurse per 8 patients to 1 nurse per 5 patients was $48,100. However, these estimates based on cross‐sectional data fail to inform the debate on optimal nurse staffing ratios. The effect on patient outcomes when hospitals move from 1:6 to 1:5 or 1:4 nurse staffing levels needs to be determined in a longitudinal study. Thus, legislators and hospitals have little to guide them in establishing optimal nurse staffing ratios, and consideration of specific mandated minimum ratios would benefit greatly from comparative information on the cost and quality tradeoffs.
Hospitals, policy makers, health care providers, and researchers are struggling to improve the health care delivered in our hospitals; fortunately, there has been an increased focus on the importance of nurses who deliver medical care on the front lines and are responsible for many aspects of quality. Mandating minimum nurse staffing ratios may seem like an easy fix of the problem; however, we must consider how these ratios can be met, the potential difficulty for hospitals to meet these ratios in the fraying safety net20, and possible unintended negative consequences. Without a mechanism for hospitals to meet ratios, simply mandating a minimum ratio will not necessarily improve care. Hospitalists should be leaders in better understanding the effects of nurse staffing on patient outcomes and quality initiatives in hospitals.
Acknowledgements
We acknowledge the California Office of Statewide Health Planning and Development (OSHPD) for providing the data for this study.
- ,,,,.Hospital nurse staffing and patient mortality, nurse burnout, and job dissatisfaction.JAMA.2002;288:1987–1993.
- ,.Working conditions that support patient safety.J Nurs Care Qual.2005;20:289–292.
- ,,,,.Nurse‐patient ratios: a systematic review on the effects of nurse staffing on patient, nurse employee, and hospital outcomes.J Nurs Adm.2004;34:326–337.
- ,,,,.Nurse‐staffing levels and the quality of care in hospitals.N Engl J Med.2002;346:1715–1722.
- ,,,,.Making health care safer: a critical analysis of patient safety practices.Evid Rep Technol Assess (Summ).2001;43:i–x,1–668.
- Implementation of California's Nurse Staffing Law: History of the Law. Available at: http://www.calhealth.org/public/press/Article%5C113%5CImplementation%20of%20CA%20Nurse%20Ratio%20Law,%20History%20of%20 the%20Law.pdf. Accessed September 5,2007.
- AB 394: California and the Demand for Safe and Effective Nurse to Patient Ratios. Available at: http://www.calnurses.org/research/pdfs/IHSP_AB394_staffing_ratios.pdf. Accessed September 5,2007.
- . Information regarding R‐01‐04E: Licensed Nurse‐to‐Patient Ratio. Available at: http://www.dhs.ca.gov/lnc/pubnotice/NTPR/DADMmemoSupCourtDecision.pdf. Accessed December 3,2006.
- Nationwide State Legislative Agenda: Nurse Staffing Plans and Ratios. Available at: http://www.nursingworld.org/GOVA/state.htm. Accessed April 10,2007.
- Staffing Plans and Ratios. Available at: http://nursingworld.org/MainMenuCategories/ThePracticeofProfessionalNursing/workplace/Workforce/ShortageStaffing/Staffing/staffing12765.aspx. Accessed September 5,2007.
- .California's minimum nurse‐to‐patient ratios: the first few months.J Nurs Adm.2004;34:571–578.
- ,.Addressing measurement error bias in nurse staffing research.Health Serv Res.2006;41:2006–2024.
- Institute of Medicine.America's Health Care Safety Net. Washington, DC;2000.
- ,.Population characteristics of markets of safety‐net and non‐safety‐net hospitals.J Urban Health.1999;76:351–370.
- ,.The evolution of support for safety‐net hospitals.Health Aff (Millwood).1997;16:30–47.
- ,.The effects of hospital competition and the Medicare PPS program on hospital cost behavior in California.J Health Econ.1988;7:301–320.
- Massachusetts Nursing Association. Specific RN‐to‐Patient Ratios. Available at: http://www.massnurses.org/safe_care/ratios.htm. Accessed April 1,2007.
- Office of Statewide Health Planning and Development. Available at: http://www.oshpd.state.ca.us/HQAD/Hospital/financial/hospAF.htm. Accessed May 6,2007.
- ,,, et al.Nurse working conditions and patient safety outcomes.Med Care.2007;45:571–578.
- .By a thread—a fragile, fraying safety net is everybody's problem.Hosp Health Netw.2002;76:32,34–40.
Copyright © 2008 Society of Hospital Medicine
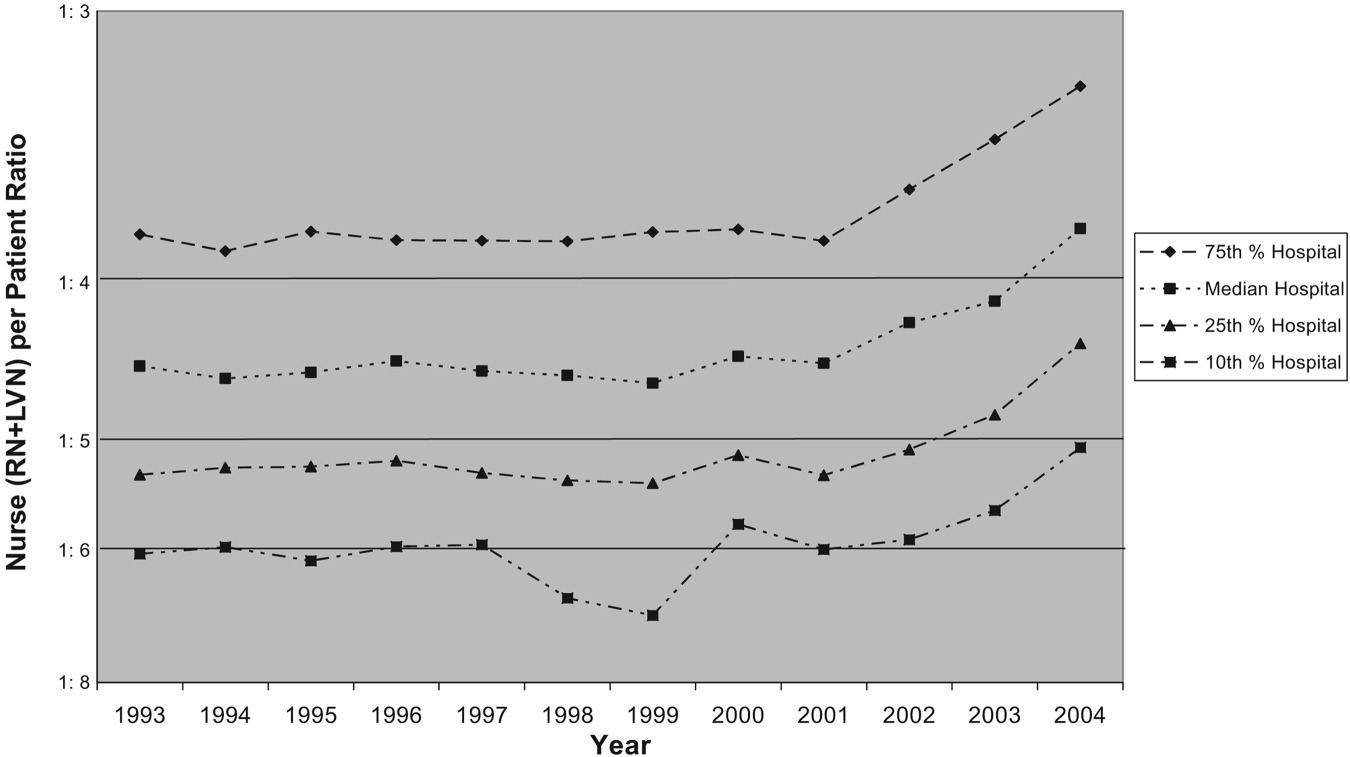
Parapneumonic Effusions in Pediatrics
Pneumonia complicated by lung necrosis and pleural disease consisting of parapneumonic effusion or empyema is a cause of significant morbidity among pediatric inpatients. Current practice in caring for these patients is highly variable, even within single institutions. Medical management of hospitalized children with complex pneumonias includes an attempt to isolate the offending organism, tailored antibiotic therapy, and adequate pain management in association with pleural catheter drainage of large effusions. Thrombolytic agents are frequently trialed in an attempt to lyse loculated effusions without surgical intervention. Surgical drainage or decortication of walled‐off infections is employed when there is poor response to more conservative treatment with pleural catheter drainage. The major therapeutic goal for this patient population is promotion of clinical recovery despite residual pleural abnormality at time of hospital discharge, with the knowledge that complete disease resolution is almost universal.
Variability in management as well as unpredictable patient response to differing therapeutic modalities has hindered the development of clear practice guidelines. Additionally, studies have suggested a shift in bacterial causative pathogens since the early 1990s, particularly after the heptavalent pneumococcal vaccine was added to routine childhood immunization schedules in 2000, and have warned of the growing prevalence of methicillin‐resistant Staphylococcus aureus (MRSA).1
This article reviews the management of pediatric patients hospitalized with complex parapneumonic effusions and summarizes current diagnostic and therapeutic modalities to offer an updated approach to clinical practice.
METHODS
This review was constructed after careful appraisal of data from recent pediatric studies on parapneumonic effusions. The subheadings in the Results section summarize the findings from these published studies and address the changing epidemiology, diagnostic techniques, and management options for this patient population. Finally, the author's impressions of management challenges related to the existing variation in clinical practice and the absence of strong evidenced‐based guidelines are presented.
RESULTS
Changing Epidemiology?
In the recent past, an increase in the incidence of complicated pneumonia among pediatric patients has been reported, from 1993 to 2000, along with an increasing rate of drug‐resistant pathogens.14 In the early 1990s Streptococcus pneumoniae (S. pneumoniae) was by far the most common etiologic agent of pneumonia with complicated parapneumonic effusions in the US, with most strains (7075%) susceptible to penicillins.1, 3, 5 However, after the widespread use of the pneumococcal conjugate vaccine in 2000, studies began to report an increasing proportion of patients with complicated parapneumonic effusions resulting from Staphylococcus aureus (S. aureus), with a concerning increase in community‐acquired methicillin‐resistant strains (CA‐MRSA).1 S. pneumoniae remains the most common causative bacterial pathogen in pediatric pneumonia as well as in complicated cases with pleural disease; however, a shift in trend toward more cases of S. aureus seems likely as more cases of CA‐MRSA are reported among pediatric patients.
Historically, patients with more complex pleural disease tend to be slightly older (mean age 46 years), have a longer duration of fever prior to presentation (35 days), and are more likely to complain of chest pain on initial presentation compared with patients with uncomplicated pneumonia.2 There does not seem to be a sex preference for complex disease. Despite increasing concern about drug‐resistant bacterial pathogens, patients with disease caused by drug‐resistant organisms have been found to not have significantly worse disease on presentation or in clinical course compared with patients infected with drug‐susceptible organisms.2, 3, 5
Initial Evaluation
A careful history can provide valuable clues to a patient's diagnosis of parapneumonic effusion. After initial assessment of airway, breathing, and circulation, focusing on a further workup for pulmonary processes and pleural disease is indicated (Table 1). Infectious signs and symptoms, often with localization to the chest, are present in the early stages of disease and become more obvious with larger effusions. Fever, increased work of breathing, cough, and shortness of breath as well as decreased breath sounds on the affected side and dullness to percussion are present in most cases once disease has progressed. A posteroanterior and lateral chest radiograph generally reveals either pneumonia with associated effusion or opacification of the hemithorax consistent with a large effusion with associated parenchymal infiltrate. A lateral chest radiograph can help to distinguish pleural disease from parenchymal disease, and a lateral decubitus film can help in the determination of whether pleural fluid is mobile. The volume of pleural fluid necessary for detection of an effusion in a posteroanterior radiograph is at least approximately 200 mL compared with only 10 to 50 mL in a lateral decubitus radiograph.
| Chest radiographposterioranterior, lateral, and lateral decubitus |
| Chest ultrasound |
| Blood culture |
| Complete blood count (with differential) |
| Serum electrolytesBUN, creatinine, gluocose protein, albumin, and lactate dehydrogenase |
| C‐reactive protein |
| Mycoplasma IgM and IgG titers |
| Nasopharyngeal swab for viral studies |
Once a plain radiograph detects an effusion of significant size or there is concern about loculation based on the lateral decubitus views, ultrasound is the subsequent diagnostic study of choice. Ultrasound has the ability to detect loculations in the pleural collection as well as solid lesions in the pleural space and can be used simultaneously as guidance for thoracentesis. Importantly, ultrasound is actually superior diagnostically to computed tomography (CT) in visualizing pleural loculations. However, CT is the preferred modality for imaging lung parenchyma and is indicated when a lung abscess is suggested by the initial imaging. Additionally, if malignancy is suspected, a CT is indicated.
As with other diagnoses in pediatrics, excluding other (noninfectious) causes of pleural effusion is important during evaluation. A history of renal or cardiac disease should raise concern for fluid overload situations. Signs or symptoms to suggest a more indolent progression of disease may indicate underlying malignancy or atypical infectious agents such as tuberculosis. Associated rheumatologic symptoms such as rashes or joint symptoms should also bring a diagnosis of primary infectious effusion into question. Similarly, a lack of parenchymal disease associated with an effusion, assessed by either plain radiograph or, in patients who have CT, as part of their evaluation, is unusual, and therefore other potential causes of pleural effusions should be considered.
In addition to chest imaging, other laboratory tests should include a blood culture (including anaerobes), sputum culture when attainable, a complete blood count and electrolytes (to evaluate for inappropriate antidiuretic hormone secretion syndrome), serum albumin, and C‐reactive protein (helpful to follow serially in assessing response to therapy). Mycoplasma IgM and IgG titers are appropriate for patients in higher‐risk age groups. An anterior nasal swab for methicillin‐resistant S. aureus colonization and a nasopharyngeal swab for viral studies may also reveal potential disease pathogens.
Staging of Pleural Effusions
Pleural fluid associated with pneumonia progresses through stages related to the inflammatory process triggering its accumulation. The initial staging of pleural disease is important in guiding management decisions on admission.
-
Stage 1exudative stage: pleural fluid that is inflammatory in nature by definition and generally has a higher white blood cell (WBC) count, lactate dehydrogenase (LDH), and protein level with lower pH and glucose values than a transudative fluid.
-
Stage 2fibropurulant stage: fibrin deposition in the pleural space that causes septation in the pleural fluid (loculations). The WBC count is higher than in a simple exudative effusion with the fluid having a thicker gross appearance, progressing to frank pus (empyema).
-
Stage 3organizing stage: the intrapleural strands of fibrin (loculations) thicken to become a solid peel. Depending on their size and location in the pleural space, these solid areas of fibrinous peel may lead to significantly impaired lung function because of entrapment or create new pleural potential spaces that can wall off infection. At this final stage of pleural disease, spontaneous resolution often occurs with time. However, chronic empyema can also ensue.
Ultrasound Staging
Ultrasound can also be used effectively to stage pleural effusions.6
-
Stage 1: echogenic fluid without septation.
-
Stage 2: fibrinous septation of pleural fluid without the presence of a homogenous loculation.
-
Stage 3: visualization of an organized, multiloculated empyema surrounded by a thick parietal rind with associated lung entrapment.
Pleural Fluid Analysis
Pleural fluid analysis has long been used to classify pleural effusions. The light criteria were developed for adults with pleural effusions to distinguish infectious fluid from noninfectious fluid,7 but their application to pediatric effusions has not been formally validated. There is little indication for routine aspiration of pleural fluid in pediatrics solely for laboratory analysis. Unlike in adults, nearly all effusions in children are parapneumonic and are managed with pleural catheter drainage once a patient is symptomatic. Therefore, in most cases, pleural fluid should be sent for analysis only after a decision is made to place a drainage catheter. Nevertheless, once the decision is made to place a pleural drain, collection of pleural fluid for analysis should be performed simultaneously and may be helpful in staging an effusion. Attempting to aspirate pleural fluid from a catheter after it has been placed is not recommended and is likely to yield inaccurate results.
A complete diagnostic evaluation from pleural fluid sampling is summarized in Table 2 and includes sending a gram stain and aerobic and anaerobic bacterial cultures as well as a differential cell count. The utility of biochemical analysis in distinguishing effusion from empyema for guidance in the management of uncomplicated parapneumonic effusions has been disputed.3, 8 Nevertheless, pH, glucose, protein, albumin, and LDH are generally sent from the pleural fluid to gain a clearer picture of pleural disease stage. An additional infectious workup may include sending fluid for acid‐fast bacilli culture, mycoplasma PCR, and KOH prep. If noninfectious etiologies are suspected, a triglyceride level, cytology, amylase, ANA, and creatinine may be performed on pleural fluid as well.
| Gram stain |
| Bacterial culture (aerobic and anaerobic) |
| Cell count (with differential) |
| Acid‐fast bacilli culture |
| Mycoplasma PCR |
| pH |
| Glucose |
| Protein |
| Albumin |
| Lactase dehydrogenase |
| 23 mL additional fluid on ice to be held in lab for potential further analysis |
| Other studies might include: triglyceride, KOH prep, cytology, amylase, ANA, creatinine |
Disease Management
The initial management of complicated parapneumonic effusions is summarized in Table 3 and includes oxygen delivery for hypoxia, intravenous fluid hydration, and empirical antibiotic therapy, as well as consultation with an interventional radiology or surgical team to discuss possible drainage methods. A management algorithm is also provided in Figure 1.
| Oxygen delivery as indicated |
| Empiric antibiotic therapy |
| Intravenous fluid therapy as indicated |
| Analgesia |
| Antipyretics |
| Consultation with service to perform pleural drainage |
Antibiotic Therapy
The patterns of prevalence of infectious agents that lead to pneumonia and pleural disease changes over time. As mentioned earlier, in the early 1990s Streptococcus pneumoniae was far and away the most common etiologic agent of pneumonia with complicated parapneumonic effusions in the United States, with most strains (70%75%) susceptible to penicillins.1, 3, 5 After the introduction of the pneumococcal conjugate vaccine, an increase in parapneumonic effusions resulting from Staphylococcus aureus (S. aureus) with a concerning increase in community‐acquired methicillin‐resistant strains was reported in 1 study from Tennessee.1 In addition to these 2 major causative organisms, Hemophilus influenzae, group A Streptococcus, S. pyogenes, and mycoplasma should be considered potential etiologic agents. A more complete list of potential pathogens is provided in Table 4.
| Streptococcus pneumoniae |
| Staphylococcus aureus |
| Streptococcus pyogenes (group A streptococcus) |
| Haemophilus influenzae |
| Mycoplasma pneumoniae |
| Mycobacterium tuberculosis |
| Klebsiella pneumoniae |
| Pseudomonas aeruginosa |
| Escherichia coli |
| Anaerobes |
| Histoplasma capsulatum |
| Aspergillus |
| Nocardia asteroides |
| Coccidioides immitus |
| Legionella pneumophila |
Selecting empirical antimicrobial therapy in a hospitalized child with complicated pneumonia ideally takes into consideration local epidemiological data. In general, antibiotics active against S. pneumoniae, S. pyogenes, and S. aureus should be employed initially. It is prudent in areas where the rate of community‐acquired methicillin‐resistant S. aureus is high to strongly consider the use of clindamycin, understanding that some strains of S. aureus will initially show susceptibility to clindamycin but possess mutations that enable inducible clindamycin resistance. The generalized use of vancomycin should be avoided and reserved only for patients who are significantly ill or possess life‐threatening allergies to other antibiotics. Ideally, antibiotic therapy is tailored appropriately based on positive blood or pleural fluid culture results after sensitivity testing is performed. Newer polymerase chain reaction (PCR) tests aimed at isolating disease pathogens from pleural fluid are on the horizon and may improve the ability to tailor antibiotic therapy during hospitalization.
Antibiotic therapy should be delivered intravenously until the patient shows clinical improvement and ideally until the patient is afebrile. At this point, an additional 1‐ to 3‐week course of oral antibiotics is generally given, depending on the length of the intravenous course.
Management Challenges
There is considerable controversy regarding the initial inpatient procedural management of complex parapneumonic effusions. Simple pleural catheter drainage is likely to be adequate for treatment of exudative effusions without significant loculations. The effectiveness of fibrinolytic agents administered through pleural catheters in complex pleural effusions has been disputed. Published studies have not yielded consistent results and have all had limitations related to sample size or methods used for disease staging.912 Adverse reactions have been reported with intrapleural fibrinolytic use, including chest pain, fever, and occasionally bleeding from the catheter site.13, 14 A less invasive method of surgical intervention, termed video‐assisted thoracoscopic surgery (VATS), has been employed for complex pleural effusions that have progressed to the organizational stage. This procedure enables direct visualization of the pleural space with the ability to lyse adhesions and drain fluid collections to afford optimal drainage. Thickened, hard pleural peels that cannot be removed using VATS require conversion to open thoracotomy.
Once a pleural catheter is placed and drainage begins to diminish with persistent radiographic evidence of effusion, fibrinolytic therapy can be administered in an attempt to break apart fibrin deposition to obtain free‐flowing pleural fluid. The first randomized prospective trial comparing pleural catheter drainage with intrapleural urokinase to primary VATS for treatment of empyema in pediatric patients was recently carried out in London, United Kingdom, by Sonnappa et al.15 Among 60 hospitalized children with empyema, no significant difference in length of stay after intervention was found between the urokinase and VATS groups. Other secondary outcome measures were also found to be equivalent between the groups, including duration of pleural catheter drainage, total hospital length of stay, initial treatment failure, and resolution of disease by radiograph at 6‐month follow‐up. Urokinase is no longer available in the United States because of concerns related to viral contamination. Streptokinase is avoided because of its association with chest pain and fever.16 Most centers now employ tissue plasminogen activator (alteplase), a recombinant fibrinolytic with similar properties. A recent retrospective study of hospitalized children with parapneumonic effusions demonstrated slightly improved pleural drainage using alteplase compared with urokinase, with no systemic side effects or major complications.17 Alteplase can be administered once every 24 hours for a maximum of 3 doses.
Mobilization and ambulation are highly encouraged to prevent atelectasis and increase pleural catheter drainage. This necessitates adequate analgesia, often in the form of continuous infusions while a pleural catheter is in place. Chest physiotherapy is more likely to cause discomfort than to be beneficial to lung expansion in patients with complex pleural disease and therefore is not recommended.
Traditionally, clinical practice and earlier data have supported initial management of complex parapneumonic effusions with smaller‐diameter pleural catheter (pigtail) drainage.18 However, subsequent data suggested significantly shorter hospital length of stay and faster clinical improvement among patients treated more aggressively on admission with surgical procedures without reporting an increase in risk related to surgery or other complications.1923 These studies had relatively small numbers of study subjects, and most did not control for disease stage at presentation. However, in cases of failed pleural catheter drainage, particularly after fibrinolytics have been attempted, surgery should be strongly considered in a persistently symptomatic patient. A chest CT scan is almost always performed prior to surgery to further evaluate the lung parenchyma and rule out lung abscesses, which generally should not be accessed because of the risk of introducing a fistulous tract. In an era in which hospital length of stay is a high priority and an important outcome measure, it is tempting to accept early surgical intervention as the new clinical practice standard based on existing studies. However, more information still needs to be gathered from larger‐scale studies in order to draw this conclusion with confidence when there is a clear difference in the degree of invasiveness between these 2 management practices. In many centers sedation without general anesthesia is now used for pleural catheter placement, further delineating the difference in risk between simple pleural catheter drainage and surgical intervention.
Outcome and Follow‐up after Discharge
Fortunately, most patients with complicated parapneumonic effusions have complete resolution of their disease with time. In the short term, disease‐related complications include the development of lung abscess and bronchopleural fistula. Secondary scoliosis is commonly seen as well but is transient and resolves with resolution of the patient's underlying pulmonary process.24 Long‐term complications are uncommon and related to persistent, mild restrictive lung defects. Even this complication is generally not clinically significant to cause limitations to activity and is only detected using pulmonary function tests. Essentially all radiographs are normal approximately 36 months after discharge. Follow‐up with a pediatric pulmonologist is indicated whenever possible, particularly for severe cases. Patients with a remarkable history of past illnesses prior to hospitalization or with a protracted disease course should be evaluated for an underlying diagnosis affecting the immune system. This may include ruling out conditions capable of causing primary or secondary immune system impairment and cystic fibrosis.
CONCLUSIONS
Children with complicated parapneumonic effusions raise a challenge to pediatric hospitalists in choosing an initial management plan that is likely to be successful for their pleural disease stage on admission and to prevent the need for unnecessary intervention. Ultrasound is generally sufficient in diagnosing the stage of pleural disease and avoids both sedation and radiation exposure. It can also be used for guidance to access the pleural space effectively and position pleural catheters in the optimal location for maximum fluid drainage.
Clinicians must appreciate the degree of inflammation possible leading to pleural disease and the length of time necessary for complete disease resolution. Measures to keep patients comfortable and as mobile as possible during hospitalization, especially with pleural drains in place, coupled with proactive assessment of clinical response to initial therapy, are essential management goals.
Studies to compare hospital outcomes among patients receiving conservative medical management with antibiotics and pleural catheter drainage versus those undergoing early surgical debridement and drainage should be interpreted cautiously until larger studies are performed with attention to initial disease staging. Until that time, there is likely to be continued variability in practice even in an individual center because of factors related to hospitalist staff and surgical consultant staff impressions of initial illness and institutional resources to perform various procedures under conscious sedation versus general anesthesia at the time of admission.
Finally, it should be emphasized that disease pathogens should be restudied nationally to guide empirical antibiotic therapy because the treatment duration is longer than in most pediatric illnesses and patients may be at higher risk for adverse events related to prolonged antibiotic exposure. Further studies using large numbers of subjects from geographically diverse regions with more current epidemiological data are our best chance at defining the present picture of bacterial pathogens causing complicated pediatric pneumonia.
- ,,.Incidence and etiologies of complicated parapneumonic effusions in children, 1996 to 2001.Pediatr Infect Dis J.2003;22:449–504.
- ,,, et al.An epidemiological investigation of a sustained high rate of pediatric parapneumonic empyema: risk factors and microbiological associations.Clin Infect Dis.2002;34:434–440.
- ,,, et al.Clinical characteristics of children with complicated pneumonia caused by Streptococcus pneumoniae.Pediatrics.2002;110:1–6.
- ,,, et al.The changing face of pleural empyemas in children: epidemiology and management.Pediatrics.2004;113:1735–1740.
- ,,,.complicated parapneumonic effusions in children caused by penicillin‐nonsusceptible Streptococcus pneumoniae.Pediatrics.1998;101:338–392.
- .A new classification of parapneumonic effusions and empyema.Chest.1995;108:299–301.
- ,,,.Pleural effusions: the diagnostic separation of transudates and exudates.Ann Intern Med.1972;77:507–513.
- ,,.Medical management of parapneumonic pleural disease.Pediatr Pulmonol.2005;39:127–134.
- ,,,.Intrapleural fibrinolytic treatment of multiloculated postpneumonic pediatric empyemas.Ann Thorac Surg.2003;76:1849–1853.
- ,,, et al.U.K. controlled trial of intrapleural streptokinase for pleural infection.N Engl J Med.2005;352:865–874.
- ,,,.Intrapleural fibrinolytic agents for empyema and complicated parapneumonic effusions: a meta‐analysis.Chest.2006;129:783–790.
- ,,,,,.Effectiveness and safety of tissue plasminogen activator in the management of complicated parapneumonic effusions.Pediatrics.2004;113:182–185.
- ,,,,,.Treatment of complicated parapneumonic pleural effusion with intrapleural streptokinase in children.Chest.2004;125:566–571.
- ,,,,.Randomized trial of intrapleural urokinase in the treatment of childhood empyema.Thorax.2002;57:343–347.
- ,,, et al.Comparison of urokinase and video‐assisted thoracoscopic surgery for treatment of childhood empyema.Am J Respir Crit Care Med.2006;174:221–227.
- ,,.Use of purified streptokinase in empyema and hemothorax.Am J Surg.1991;161:560–562.
- ,.Intrapleural fibrinolysis for parapneumonic effusion and empyema in children.Radiology.2003;228:370–378.
- ,,,,,.Empyema in children: clinical course and long‐term follow‐up.Pediatrics.1984;73:587–593.
- ,,,.Primary operative versus nonoperative therapy for pediatric empyema: a meta‐analysis.Pediatrics.2005;115:1652–1659.
- ,,,,.Experience with video‐assisted thoracoscopic surgery in the management of complicated pneumonia in children.J Pediatr Surg.2001;36:316–319.
- ,,,.Thoracoscopic decortication as first‐line therapy for pediatric parapneumonic empyema: a case series.Chest.2000;118:24–27.
- ,,,,.Thoracoscopy in the management of pediatric empyema.J Pediatr Surg.1995;30:1211–1215.
- ,,, et al.Thoracoscopy in pediatric pleural empyema: a prospective study of prognostic factors.J Pediatr Surg.2006;41:1732–1737.
- ,,,.Incidence and outcome of scoliosis in children with pleural infection.Pediatr Pulmonol.2007;42:221–224.
Pneumonia complicated by lung necrosis and pleural disease consisting of parapneumonic effusion or empyema is a cause of significant morbidity among pediatric inpatients. Current practice in caring for these patients is highly variable, even within single institutions. Medical management of hospitalized children with complex pneumonias includes an attempt to isolate the offending organism, tailored antibiotic therapy, and adequate pain management in association with pleural catheter drainage of large effusions. Thrombolytic agents are frequently trialed in an attempt to lyse loculated effusions without surgical intervention. Surgical drainage or decortication of walled‐off infections is employed when there is poor response to more conservative treatment with pleural catheter drainage. The major therapeutic goal for this patient population is promotion of clinical recovery despite residual pleural abnormality at time of hospital discharge, with the knowledge that complete disease resolution is almost universal.
Variability in management as well as unpredictable patient response to differing therapeutic modalities has hindered the development of clear practice guidelines. Additionally, studies have suggested a shift in bacterial causative pathogens since the early 1990s, particularly after the heptavalent pneumococcal vaccine was added to routine childhood immunization schedules in 2000, and have warned of the growing prevalence of methicillin‐resistant Staphylococcus aureus (MRSA).1
This article reviews the management of pediatric patients hospitalized with complex parapneumonic effusions and summarizes current diagnostic and therapeutic modalities to offer an updated approach to clinical practice.
METHODS
This review was constructed after careful appraisal of data from recent pediatric studies on parapneumonic effusions. The subheadings in the Results section summarize the findings from these published studies and address the changing epidemiology, diagnostic techniques, and management options for this patient population. Finally, the author's impressions of management challenges related to the existing variation in clinical practice and the absence of strong evidenced‐based guidelines are presented.
RESULTS
Changing Epidemiology?
In the recent past, an increase in the incidence of complicated pneumonia among pediatric patients has been reported, from 1993 to 2000, along with an increasing rate of drug‐resistant pathogens.14 In the early 1990s Streptococcus pneumoniae (S. pneumoniae) was by far the most common etiologic agent of pneumonia with complicated parapneumonic effusions in the US, with most strains (7075%) susceptible to penicillins.1, 3, 5 However, after the widespread use of the pneumococcal conjugate vaccine in 2000, studies began to report an increasing proportion of patients with complicated parapneumonic effusions resulting from Staphylococcus aureus (S. aureus), with a concerning increase in community‐acquired methicillin‐resistant strains (CA‐MRSA).1 S. pneumoniae remains the most common causative bacterial pathogen in pediatric pneumonia as well as in complicated cases with pleural disease; however, a shift in trend toward more cases of S. aureus seems likely as more cases of CA‐MRSA are reported among pediatric patients.
Historically, patients with more complex pleural disease tend to be slightly older (mean age 46 years), have a longer duration of fever prior to presentation (35 days), and are more likely to complain of chest pain on initial presentation compared with patients with uncomplicated pneumonia.2 There does not seem to be a sex preference for complex disease. Despite increasing concern about drug‐resistant bacterial pathogens, patients with disease caused by drug‐resistant organisms have been found to not have significantly worse disease on presentation or in clinical course compared with patients infected with drug‐susceptible organisms.2, 3, 5
Initial Evaluation
A careful history can provide valuable clues to a patient's diagnosis of parapneumonic effusion. After initial assessment of airway, breathing, and circulation, focusing on a further workup for pulmonary processes and pleural disease is indicated (Table 1). Infectious signs and symptoms, often with localization to the chest, are present in the early stages of disease and become more obvious with larger effusions. Fever, increased work of breathing, cough, and shortness of breath as well as decreased breath sounds on the affected side and dullness to percussion are present in most cases once disease has progressed. A posteroanterior and lateral chest radiograph generally reveals either pneumonia with associated effusion or opacification of the hemithorax consistent with a large effusion with associated parenchymal infiltrate. A lateral chest radiograph can help to distinguish pleural disease from parenchymal disease, and a lateral decubitus film can help in the determination of whether pleural fluid is mobile. The volume of pleural fluid necessary for detection of an effusion in a posteroanterior radiograph is at least approximately 200 mL compared with only 10 to 50 mL in a lateral decubitus radiograph.
| Chest radiographposterioranterior, lateral, and lateral decubitus |
| Chest ultrasound |
| Blood culture |
| Complete blood count (with differential) |
| Serum electrolytesBUN, creatinine, gluocose protein, albumin, and lactate dehydrogenase |
| C‐reactive protein |
| Mycoplasma IgM and IgG titers |
| Nasopharyngeal swab for viral studies |
Once a plain radiograph detects an effusion of significant size or there is concern about loculation based on the lateral decubitus views, ultrasound is the subsequent diagnostic study of choice. Ultrasound has the ability to detect loculations in the pleural collection as well as solid lesions in the pleural space and can be used simultaneously as guidance for thoracentesis. Importantly, ultrasound is actually superior diagnostically to computed tomography (CT) in visualizing pleural loculations. However, CT is the preferred modality for imaging lung parenchyma and is indicated when a lung abscess is suggested by the initial imaging. Additionally, if malignancy is suspected, a CT is indicated.
As with other diagnoses in pediatrics, excluding other (noninfectious) causes of pleural effusion is important during evaluation. A history of renal or cardiac disease should raise concern for fluid overload situations. Signs or symptoms to suggest a more indolent progression of disease may indicate underlying malignancy or atypical infectious agents such as tuberculosis. Associated rheumatologic symptoms such as rashes or joint symptoms should also bring a diagnosis of primary infectious effusion into question. Similarly, a lack of parenchymal disease associated with an effusion, assessed by either plain radiograph or, in patients who have CT, as part of their evaluation, is unusual, and therefore other potential causes of pleural effusions should be considered.
In addition to chest imaging, other laboratory tests should include a blood culture (including anaerobes), sputum culture when attainable, a complete blood count and electrolytes (to evaluate for inappropriate antidiuretic hormone secretion syndrome), serum albumin, and C‐reactive protein (helpful to follow serially in assessing response to therapy). Mycoplasma IgM and IgG titers are appropriate for patients in higher‐risk age groups. An anterior nasal swab for methicillin‐resistant S. aureus colonization and a nasopharyngeal swab for viral studies may also reveal potential disease pathogens.
Staging of Pleural Effusions
Pleural fluid associated with pneumonia progresses through stages related to the inflammatory process triggering its accumulation. The initial staging of pleural disease is important in guiding management decisions on admission.
-
Stage 1exudative stage: pleural fluid that is inflammatory in nature by definition and generally has a higher white blood cell (WBC) count, lactate dehydrogenase (LDH), and protein level with lower pH and glucose values than a transudative fluid.
-
Stage 2fibropurulant stage: fibrin deposition in the pleural space that causes septation in the pleural fluid (loculations). The WBC count is higher than in a simple exudative effusion with the fluid having a thicker gross appearance, progressing to frank pus (empyema).
-
Stage 3organizing stage: the intrapleural strands of fibrin (loculations) thicken to become a solid peel. Depending on their size and location in the pleural space, these solid areas of fibrinous peel may lead to significantly impaired lung function because of entrapment or create new pleural potential spaces that can wall off infection. At this final stage of pleural disease, spontaneous resolution often occurs with time. However, chronic empyema can also ensue.
Ultrasound Staging
Ultrasound can also be used effectively to stage pleural effusions.6
-
Stage 1: echogenic fluid without septation.
-
Stage 2: fibrinous septation of pleural fluid without the presence of a homogenous loculation.
-
Stage 3: visualization of an organized, multiloculated empyema surrounded by a thick parietal rind with associated lung entrapment.
Pleural Fluid Analysis
Pleural fluid analysis has long been used to classify pleural effusions. The light criteria were developed for adults with pleural effusions to distinguish infectious fluid from noninfectious fluid,7 but their application to pediatric effusions has not been formally validated. There is little indication for routine aspiration of pleural fluid in pediatrics solely for laboratory analysis. Unlike in adults, nearly all effusions in children are parapneumonic and are managed with pleural catheter drainage once a patient is symptomatic. Therefore, in most cases, pleural fluid should be sent for analysis only after a decision is made to place a drainage catheter. Nevertheless, once the decision is made to place a pleural drain, collection of pleural fluid for analysis should be performed simultaneously and may be helpful in staging an effusion. Attempting to aspirate pleural fluid from a catheter after it has been placed is not recommended and is likely to yield inaccurate results.
A complete diagnostic evaluation from pleural fluid sampling is summarized in Table 2 and includes sending a gram stain and aerobic and anaerobic bacterial cultures as well as a differential cell count. The utility of biochemical analysis in distinguishing effusion from empyema for guidance in the management of uncomplicated parapneumonic effusions has been disputed.3, 8 Nevertheless, pH, glucose, protein, albumin, and LDH are generally sent from the pleural fluid to gain a clearer picture of pleural disease stage. An additional infectious workup may include sending fluid for acid‐fast bacilli culture, mycoplasma PCR, and KOH prep. If noninfectious etiologies are suspected, a triglyceride level, cytology, amylase, ANA, and creatinine may be performed on pleural fluid as well.
| Gram stain |
| Bacterial culture (aerobic and anaerobic) |
| Cell count (with differential) |
| Acid‐fast bacilli culture |
| Mycoplasma PCR |
| pH |
| Glucose |
| Protein |
| Albumin |
| Lactase dehydrogenase |
| 23 mL additional fluid on ice to be held in lab for potential further analysis |
| Other studies might include: triglyceride, KOH prep, cytology, amylase, ANA, creatinine |
Disease Management
The initial management of complicated parapneumonic effusions is summarized in Table 3 and includes oxygen delivery for hypoxia, intravenous fluid hydration, and empirical antibiotic therapy, as well as consultation with an interventional radiology or surgical team to discuss possible drainage methods. A management algorithm is also provided in Figure 1.
| Oxygen delivery as indicated |
| Empiric antibiotic therapy |
| Intravenous fluid therapy as indicated |
| Analgesia |
| Antipyretics |
| Consultation with service to perform pleural drainage |
Antibiotic Therapy
The patterns of prevalence of infectious agents that lead to pneumonia and pleural disease changes over time. As mentioned earlier, in the early 1990s Streptococcus pneumoniae was far and away the most common etiologic agent of pneumonia with complicated parapneumonic effusions in the United States, with most strains (70%75%) susceptible to penicillins.1, 3, 5 After the introduction of the pneumococcal conjugate vaccine, an increase in parapneumonic effusions resulting from Staphylococcus aureus (S. aureus) with a concerning increase in community‐acquired methicillin‐resistant strains was reported in 1 study from Tennessee.1 In addition to these 2 major causative organisms, Hemophilus influenzae, group A Streptococcus, S. pyogenes, and mycoplasma should be considered potential etiologic agents. A more complete list of potential pathogens is provided in Table 4.
| Streptococcus pneumoniae |
| Staphylococcus aureus |
| Streptococcus pyogenes (group A streptococcus) |
| Haemophilus influenzae |
| Mycoplasma pneumoniae |
| Mycobacterium tuberculosis |
| Klebsiella pneumoniae |
| Pseudomonas aeruginosa |
| Escherichia coli |
| Anaerobes |
| Histoplasma capsulatum |
| Aspergillus |
| Nocardia asteroides |
| Coccidioides immitus |
| Legionella pneumophila |
Selecting empirical antimicrobial therapy in a hospitalized child with complicated pneumonia ideally takes into consideration local epidemiological data. In general, antibiotics active against S. pneumoniae, S. pyogenes, and S. aureus should be employed initially. It is prudent in areas where the rate of community‐acquired methicillin‐resistant S. aureus is high to strongly consider the use of clindamycin, understanding that some strains of S. aureus will initially show susceptibility to clindamycin but possess mutations that enable inducible clindamycin resistance. The generalized use of vancomycin should be avoided and reserved only for patients who are significantly ill or possess life‐threatening allergies to other antibiotics. Ideally, antibiotic therapy is tailored appropriately based on positive blood or pleural fluid culture results after sensitivity testing is performed. Newer polymerase chain reaction (PCR) tests aimed at isolating disease pathogens from pleural fluid are on the horizon and may improve the ability to tailor antibiotic therapy during hospitalization.
Antibiotic therapy should be delivered intravenously until the patient shows clinical improvement and ideally until the patient is afebrile. At this point, an additional 1‐ to 3‐week course of oral antibiotics is generally given, depending on the length of the intravenous course.
Management Challenges
There is considerable controversy regarding the initial inpatient procedural management of complex parapneumonic effusions. Simple pleural catheter drainage is likely to be adequate for treatment of exudative effusions without significant loculations. The effectiveness of fibrinolytic agents administered through pleural catheters in complex pleural effusions has been disputed. Published studies have not yielded consistent results and have all had limitations related to sample size or methods used for disease staging.912 Adverse reactions have been reported with intrapleural fibrinolytic use, including chest pain, fever, and occasionally bleeding from the catheter site.13, 14 A less invasive method of surgical intervention, termed video‐assisted thoracoscopic surgery (VATS), has been employed for complex pleural effusions that have progressed to the organizational stage. This procedure enables direct visualization of the pleural space with the ability to lyse adhesions and drain fluid collections to afford optimal drainage. Thickened, hard pleural peels that cannot be removed using VATS require conversion to open thoracotomy.
Once a pleural catheter is placed and drainage begins to diminish with persistent radiographic evidence of effusion, fibrinolytic therapy can be administered in an attempt to break apart fibrin deposition to obtain free‐flowing pleural fluid. The first randomized prospective trial comparing pleural catheter drainage with intrapleural urokinase to primary VATS for treatment of empyema in pediatric patients was recently carried out in London, United Kingdom, by Sonnappa et al.15 Among 60 hospitalized children with empyema, no significant difference in length of stay after intervention was found between the urokinase and VATS groups. Other secondary outcome measures were also found to be equivalent between the groups, including duration of pleural catheter drainage, total hospital length of stay, initial treatment failure, and resolution of disease by radiograph at 6‐month follow‐up. Urokinase is no longer available in the United States because of concerns related to viral contamination. Streptokinase is avoided because of its association with chest pain and fever.16 Most centers now employ tissue plasminogen activator (alteplase), a recombinant fibrinolytic with similar properties. A recent retrospective study of hospitalized children with parapneumonic effusions demonstrated slightly improved pleural drainage using alteplase compared with urokinase, with no systemic side effects or major complications.17 Alteplase can be administered once every 24 hours for a maximum of 3 doses.
Mobilization and ambulation are highly encouraged to prevent atelectasis and increase pleural catheter drainage. This necessitates adequate analgesia, often in the form of continuous infusions while a pleural catheter is in place. Chest physiotherapy is more likely to cause discomfort than to be beneficial to lung expansion in patients with complex pleural disease and therefore is not recommended.
Traditionally, clinical practice and earlier data have supported initial management of complex parapneumonic effusions with smaller‐diameter pleural catheter (pigtail) drainage.18 However, subsequent data suggested significantly shorter hospital length of stay and faster clinical improvement among patients treated more aggressively on admission with surgical procedures without reporting an increase in risk related to surgery or other complications.1923 These studies had relatively small numbers of study subjects, and most did not control for disease stage at presentation. However, in cases of failed pleural catheter drainage, particularly after fibrinolytics have been attempted, surgery should be strongly considered in a persistently symptomatic patient. A chest CT scan is almost always performed prior to surgery to further evaluate the lung parenchyma and rule out lung abscesses, which generally should not be accessed because of the risk of introducing a fistulous tract. In an era in which hospital length of stay is a high priority and an important outcome measure, it is tempting to accept early surgical intervention as the new clinical practice standard based on existing studies. However, more information still needs to be gathered from larger‐scale studies in order to draw this conclusion with confidence when there is a clear difference in the degree of invasiveness between these 2 management practices. In many centers sedation without general anesthesia is now used for pleural catheter placement, further delineating the difference in risk between simple pleural catheter drainage and surgical intervention.
Outcome and Follow‐up after Discharge
Fortunately, most patients with complicated parapneumonic effusions have complete resolution of their disease with time. In the short term, disease‐related complications include the development of lung abscess and bronchopleural fistula. Secondary scoliosis is commonly seen as well but is transient and resolves with resolution of the patient's underlying pulmonary process.24 Long‐term complications are uncommon and related to persistent, mild restrictive lung defects. Even this complication is generally not clinically significant to cause limitations to activity and is only detected using pulmonary function tests. Essentially all radiographs are normal approximately 36 months after discharge. Follow‐up with a pediatric pulmonologist is indicated whenever possible, particularly for severe cases. Patients with a remarkable history of past illnesses prior to hospitalization or with a protracted disease course should be evaluated for an underlying diagnosis affecting the immune system. This may include ruling out conditions capable of causing primary or secondary immune system impairment and cystic fibrosis.
CONCLUSIONS
Children with complicated parapneumonic effusions raise a challenge to pediatric hospitalists in choosing an initial management plan that is likely to be successful for their pleural disease stage on admission and to prevent the need for unnecessary intervention. Ultrasound is generally sufficient in diagnosing the stage of pleural disease and avoids both sedation and radiation exposure. It can also be used for guidance to access the pleural space effectively and position pleural catheters in the optimal location for maximum fluid drainage.
Clinicians must appreciate the degree of inflammation possible leading to pleural disease and the length of time necessary for complete disease resolution. Measures to keep patients comfortable and as mobile as possible during hospitalization, especially with pleural drains in place, coupled with proactive assessment of clinical response to initial therapy, are essential management goals.
Studies to compare hospital outcomes among patients receiving conservative medical management with antibiotics and pleural catheter drainage versus those undergoing early surgical debridement and drainage should be interpreted cautiously until larger studies are performed with attention to initial disease staging. Until that time, there is likely to be continued variability in practice even in an individual center because of factors related to hospitalist staff and surgical consultant staff impressions of initial illness and institutional resources to perform various procedures under conscious sedation versus general anesthesia at the time of admission.
Finally, it should be emphasized that disease pathogens should be restudied nationally to guide empirical antibiotic therapy because the treatment duration is longer than in most pediatric illnesses and patients may be at higher risk for adverse events related to prolonged antibiotic exposure. Further studies using large numbers of subjects from geographically diverse regions with more current epidemiological data are our best chance at defining the present picture of bacterial pathogens causing complicated pediatric pneumonia.
- ,,.Incidence and etiologies of complicated parapneumonic effusions in children, 1996 to 2001.Pediatr Infect Dis J.2003;22:449–504.
- ,,, et al.An epidemiological investigation of a sustained high rate of pediatric parapneumonic empyema: risk factors and microbiological associations.Clin Infect Dis.2002;34:434–440.
- ,,, et al.Clinical characteristics of children with complicated pneumonia caused by Streptococcus pneumoniae.Pediatrics.2002;110:1–6.
- ,,, et al.The changing face of pleural empyemas in children: epidemiology and management.Pediatrics.2004;113:1735–1740.
- ,,,.complicated parapneumonic effusions in children caused by penicillin‐nonsusceptible Streptococcus pneumoniae.Pediatrics.1998;101:338–392.
- .A new classification of parapneumonic effusions and empyema.Chest.1995;108:299–301.
- ,,,.Pleural effusions: the diagnostic separation of transudates and exudates.Ann Intern Med.1972;77:507–513.
- ,,.Medical management of parapneumonic pleural disease.Pediatr Pulmonol.2005;39:127–134.
- ,,,.Intrapleural fibrinolytic treatment of multiloculated postpneumonic pediatric empyemas.Ann Thorac Surg.2003;76:1849–1853.
- ,,, et al.U.K. controlled trial of intrapleural streptokinase for pleural infection.N Engl J Med.2005;352:865–874.
- ,,,.Intrapleural fibrinolytic agents for empyema and complicated parapneumonic effusions: a meta‐analysis.Chest.2006;129:783–790.
- ,,,,,.Effectiveness and safety of tissue plasminogen activator in the management of complicated parapneumonic effusions.Pediatrics.2004;113:182–185.
- ,,,,,.Treatment of complicated parapneumonic pleural effusion with intrapleural streptokinase in children.Chest.2004;125:566–571.
- ,,,,.Randomized trial of intrapleural urokinase in the treatment of childhood empyema.Thorax.2002;57:343–347.
- ,,, et al.Comparison of urokinase and video‐assisted thoracoscopic surgery for treatment of childhood empyema.Am J Respir Crit Care Med.2006;174:221–227.
- ,,.Use of purified streptokinase in empyema and hemothorax.Am J Surg.1991;161:560–562.
- ,.Intrapleural fibrinolysis for parapneumonic effusion and empyema in children.Radiology.2003;228:370–378.
- ,,,,,.Empyema in children: clinical course and long‐term follow‐up.Pediatrics.1984;73:587–593.
- ,,,.Primary operative versus nonoperative therapy for pediatric empyema: a meta‐analysis.Pediatrics.2005;115:1652–1659.
- ,,,,.Experience with video‐assisted thoracoscopic surgery in the management of complicated pneumonia in children.J Pediatr Surg.2001;36:316–319.
- ,,,.Thoracoscopic decortication as first‐line therapy for pediatric parapneumonic empyema: a case series.Chest.2000;118:24–27.
- ,,,,.Thoracoscopy in the management of pediatric empyema.J Pediatr Surg.1995;30:1211–1215.
- ,,, et al.Thoracoscopy in pediatric pleural empyema: a prospective study of prognostic factors.J Pediatr Surg.2006;41:1732–1737.
- ,,,.Incidence and outcome of scoliosis in children with pleural infection.Pediatr Pulmonol.2007;42:221–224.

Contributors to Patient Care Mistakes
Patient safety can be understood in terms of the Swiss cheese model of systems accidents. This model implies that many holes must align before an adverse event occurs.1 The limitations on work hours instituted by the Accreditation Council for Graduate Medical Education (ACGME)2 sought to close one hole by reducing fatigue in residents. As programs comply with these regulations, new interventions are being implemented to limit resident hours. This has resulted in more handoffs of care and therefore less continuity. The ultimate result may be to increase patient care errors by opening up new holes, the opposite of the stated goal of this reform.
Some residency programs have reported on their experience with hour reductions, giving insight into residents' perceptions on the benefits and drawbacks of such interventions. Residents have reported concern about continuity of care after such interventions.37 However, some residents believed they provided better patient care after the interventions to reduce hours.8, 9 Few studies have actually documented changes in the incidence of adverse events or errors as a result of work hour limitations.10 One study conducted prior to implementation of the ACGME work hour rules demonstrated more complications in internal medicine patients after New York's Code 405 (a state regulation that limited resident work hours, similar to the ACGME rules) was implemented.11 In contrast, another study showed that errors committed by interns were reduced with scheduling changes that resulted in shorter shifts and reduced hours.12
Because residents are on the front lines of patient care, they are uniquely positioned to provide insight into the impact of the work hour rules on patient safety. We conducted this study to more fully understand the effect of the ACGME work hour limitations and other possible factors on patient care errors from the perspectives of internal medicine residents.
METHODS
Participants and Sites
All internal medicine residents and interns from 3 residency programs were recruited to participate in focus groups. We purposely chose programs based at diverse health care organizations. The first program was based at a university and had approximately 160 residents, who rotated at both the university hospital and the affiliated Veterans Affairs Medical Center (VAMC). The second program was based at a community teaching hospital and had approximately 65 residents. The third program was affiliated with a freestanding medical college and had approximately 95 residents, who rotated at a large, private tertiary‐care hospital and also at the affiliated VAMC. Each program had a different call structure (Table 1).
| Site | Call system on general medicine services |
|---|---|
| Community | Four teams, each with 1 attending, 1 junior or senior resident, 2 interns. |
| Teams take call every fourth day. Interns stay overnight and leave on the postcall day by 1 PM. Junior or senior resident on team admits patients until 9 PM on call and returns at 7 AM postcall. Night float resident admits patients with on‐call interns from 9 PM until 7 AM. | |
| On postcall day team resident stays the entire day, addressing all postcall clinical issues and follow‐up. | |
| University | At primary teaching hospital and VA: |
| Four teams, each with 1 attending, 1 junior or senior resident, 2 interns. | |
| Teams take call every fourth day. Interns stay overnight, whereas residents leave at 9 PM on call and return at 7 AM postcall. Night‐float resident admits with interns from 9 PMto midnight, and then interns admit by themselves after midnight. | |
| Day‐float resident present on postcall days to help team's senior resident finish the work. | |
| Freestanding medical college | At primary teaching hospital: |
| Six teams, each with 1 attending, 1 junior or senior resident, and 1 or 2 interns. | |
| Call is not as a team and is approximately every fifth day. Two residents and 3 interns take call overnight together. At VA hospital: | |
| Four teams, each with 1 attending, 1 junior or senior resident, 2 interns. | |
| Teams take call every fourth day. One intern leaves at 9 PM on call and returns at 7 AM postcall; stays until 4 PM to cover team. |
Potential participants were recruited via E‐mail, which explained that the study was about common scenarios for patient care errors and how the ACGME work hour rules affected patient care and errors.
Design
We conducted 4 focus groups in total (Appendix 1). The first 3 focus groups followed the same focus group guide, developed after a literature review. Focus groups 1 and 2 were conducted at the university‐based program. Focus group 3 was conducted at the community teaching hospitalaffiliated program. The first 3 focus groups were analyzed before the fourth focus group was conducted. A new focus group guide was developed for the fourth focus group to further explore themes identified in the first 3 focus groups (Fig. 1 and Appendix 2). The fourth focus group was conducted at the program affiliated with a freestanding medical college. All focus groups were audiotaped and transcribed verbatim. Each lasted approximately 90‐120 minutes.

Intervention
The focus group guide for the first 3 focus groups consisted of main questions and follow‐up prompts (Appendix 1). The focus group guide for the fourth focus group (Appendix 2) was developed based on themes from the first 3 focus groups, consistent with the iterative approach of grounded theory.13 Some of the questions were the same as in the first focus group guide; others were added to better understand the roles of faculty, teamwork, and inexperience in patient care errors.
Written informed consent was obtained before the focus groups began. Participants were paid $20 and given dinner. All internal medicine residents at the institutions included were eligible. The focus groups were held after work. Each focus group comprised participants from a single institution. The investigators who were the moderators were all junior faculty. They did not moderate the focus group at their own institution so as to minimize barriers to the residents' ability to speak freely about their experiences. The moderators prepared for their roles through discussion and assigned reading.14 The investigators used the focus group guide to ask questions of the group as a whole and facilitated the discussion that arose as a result. After each focus group, the moderator and assistant moderator debriefed each other about the important themes from the session.
Ethics
The institutional review boards at all sites approved this study.
Analysis
We used grounded theory to analyze the transcripts.15 Grounded theory is an iterative process that allows for themes to arise from the data.16 After the first 3 focus groups were completed, 5 of the investigators read all 3 transcripts at least twice and noted themes of interest in the text in a process of open coding.13 These investigators met in August 2004 to discuss the transcripts and the themes that had been identified by the individual investigators. A coding scheme of 33 codes was devised based on this meeting and the notes of individual investigators about the process of reading the transcripts. The need to conduct a fourth focus group to further explore certain issues was also identified. Two investigators (K.F., V.P.) independently coded the first 3 transcripts using the agreed‐on coding scheme. One investigator used NVivo (QSR International, Doncaster, Australia), an appropriate software package, and the other investigator coded by hand. During this process, 2 additional themes were identified. The 2 coders agreed on the need to add them, and they were incorporated into the coding scheme, yielding a total of 35 codes. Three of the investigators met again to begin constructing a model to represent the relationships among the themes. The model was developed iteratively over the following year by considering the most important themes, their relationships to one another, unifying concepts identified during the textual analysis, and team meetings. To provide additional validity, peer checking occurred. Specifically, iterations of the model were discussed by the team of investigators, in local research‐in‐progress sessions, with groups of residents at 2 of the participating institutions, and at national meetings. The fourth focus group was conducted at the third site in March 2005. The same 2 investigators applied the 35‐code scheme and determined that thematic saturation had occurred; that is, no new themes were identified.
Agreement between the 2 coders was evaluated by reviewing 15% of each transcript and dividing the number of agreed‐on codes by the total number of codes assigned to each section of text. The starting point of the text checked for agreement was chosen randomly. Agreement between the 2 coders for the first 3 focus groups was 43%, 48%, and 56%, respectively. The fourth focus group was analyzed a year later, and the initial agreement between the coders was 23%. After comparison and discussion, it was clear that 1 coder had coded many passages with more than 1 code, whereas the second coder had tried to choose the most pertinent code. The second coder recoded the transcript, and a new section was compared, resulting in agreement in 45% of that section. Discrepancies between the coders were resolved by consensus. None represented major differences of opinion; rather, they usually indicated the difficulty in choosing 1 primary code to fit an utterance that could be represented by several codes.
RESULTS
Twenty‐eight residents participated. Some of these residents had experience in the prework hour era, and some did not. Average age was 28 years (range 26‐33 years); 18 were women, and 11 were interns (Table 2). The focus groups ranged in size from 5 to 9. A sample of the codes and their definitions can be found in Table 3.
| Number of participants by site | |
| Community | 9 |
| University | 13 |
| Freestanding medical college | 6 |
| Age (years), mean | 28.5 |
| Sex (female), n (%) | 18 (64%) |
| Postgraduate year, n (%) | |
| Intern | 11 (39%) |
| Second year and above | 17 (61%) |
| Type of resident, n (%) | |
| Categorical | 23 (82%) |
| Codes | Definitions |
|---|---|
| Fatigue | How fatigue contributes to patient care problems. |
| How not being fatigued contributes to improved patient care. | |
| Workload | How workload issues (eg, patient complexity) may contribute to patient care problems. |
| Descriptions of times that workload was overwhelming: overextendedHave to be in 4 places at once. | |
| Entropy | Residents' descriptions of too much of everything (information, interruptions); house of cards. |
| How this chaos contributes to patient care problems. | |
| Being overwhelmed may be a facet. | |
| Not knowing own patients | Contributors to not knowing patients. |
| How not knowing patients affects patient care. | |
| Sign‐out/cross‐cover | Description of sign‐out practices, problems, and solutions. |
| Inexperience/lack of knowledge | How inexperience can contribute to patient care problems. |
| Challenges and attributes of delivering patient care in the setting of learning to deliver patient care. | |
| Personal well‐being | Discussions about residents lives, spouses, homes. |
| How this affects patient care. | |
| Continuity of doctor care | Examples of discontinuity. |
| How continuity and discontinuity contribute to patient care problems. | |
| Other aspects or attributes of continuity or discontinuity. | |
| Work hour rules as a goal | Examples of compliance with ACGME rules becoming a goal in itself and its impact on patient care |
The Model
The model (Fig. 2) illustrates resident‐perceived contributors to patient care mistakes related to the ACGME work hour rules. These contributors are in the center circle. They include fatigue, inexperience, sign‐out, not knowing their own patients well enough, entropy (which we defined as the amount of chaos in the system), and workload. They are not listed in order of importance. The boxes outside the circle are consequences of the ACGME work hour rules and their perceived impact on the contributors to patient care mistakes. At the top are the intended consequences, that is the specific goals of the ACGME: less resident time in the hospital (ie, reduced hours) and improved well‐being.17 At the bottom are the unintended consequences: more patient care discontinuity and compliance with the work hour rules becoming a goal equally important to providing high‐quality patient care. Of these 4 consequences, only improved well‐being was viewed by the residents as decreasing patient care mistakes. The other consequences were cited by residents as sometimes increasing patient care errors. Because of the complexity of the model, several factors not directly related to resident work hours were identified in the analysis but are not shown in the model. They include faculty involvement and team work (usually positive influences), nurses and information technology (could be positive or negative), and late‐night/early‐morning hours (negative).
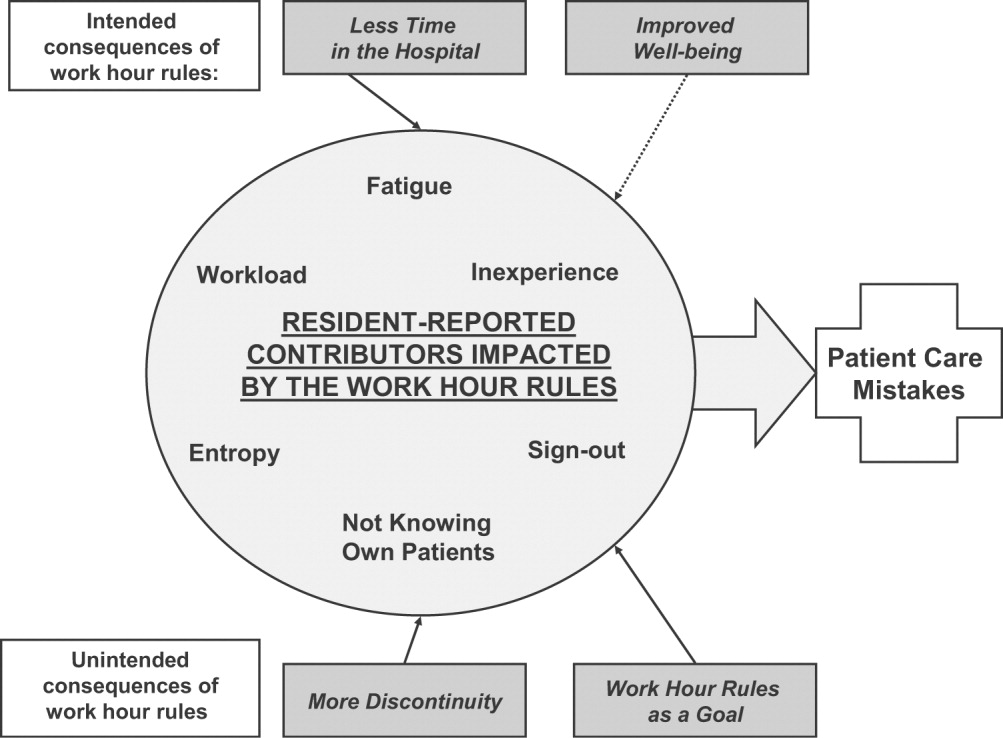
The quotations below illustrate the relationships between the consequences of the work hour rules, resident‐perceived contributors to patient care mistakes, and actual patient care.
Impact of Improved Well‐Being
Residents noted that improved well‐being resulting from the work hour rules could mitigate the impact of fatigue on patient care, as described by this resident who discussed late‐night admissions when on night float as opposed to on a regular call night. When I was night float, though, I was refreshed and more energized, and the patientI think got better care because I wasn't as tired andbasically could function better. So I think that's a good part about this year is that I'm not as toxic, and I think I can think betterand care more when I'm not so tired, and my own needs have been met, in terms of sleep and rest and being home and stuff
Residents often described tension between the benefits of being well rested and the benefits of continuity: I don't know how it affects patient care unless you sort of make a leap and say that people whohave better well‐being perform better. I don't know if that's true. Certainly, you could make the other argument and say if you're here all the time and miserable, and that's all you do, well, that's all you do. I'm not sure if maybe that's better. But I think for the physician when you compare them to lawyersany other field, engineers, architectsI think they sort of have a more well‐balanced life. So I think it is good for physician safety or their marriage safety. I'm not sure what it does with patient care.
Impact of Having Less Time in the Hospital
Having less time contributed to at least 2 factors, entropy and workload, as described in this passage: I think with the80‐hour system there is a total of at least 1 less senior in house, if not more at times, and I know that when I was doing the night float thing and then even when I was doing senior call once, all it takes is one sick patient that is too much for the intern alone to deal with,and it's all of a sudden 6 in the morning, and there are 3 other admissions that the other intern has done that the senior hasn't seen yet, and that happened to me more than once. One resident discussed the workload on inpatient services: I feel like I end up doing the same amount of work, but I have that much more pressure to do it all, and the notes are shorter, and you can't think through everything, and I actually find myself avoiding going in and talking to a family because I know that it is going to end up being a half‐hour conversation when all I really wanted to do was to communicate what the plan was, but I don't have a chance to because I know it is going to turn into a longer conversation, and I know I don't have time to do that and get out on time.
Impact of More Discontinuity
Discontinuity could also exacerbate contributors to patient care mistakes, especially through sign‐out/cross‐cover: I think continuity of care is very important, obviously, whenever there is transition of caring for a patient from one physician to another physicianthat information that gets transmitted from each other needs to be very well emphasized and clearly explained to the subsequent caretaker. And if that continuity of care is disrupted in some way, either through poor communication or lack of communication or a lot of different people having different responses to specific situations, that it can lead to [an] adverse event or medical errors like we just talked about.
Discontinuity also led to team members feeling they did not know their own patients well enough, which in turn could lead to mistakes in patient care. For example, residents described discharging patients on the wrong medications, overlooking important secondary problems, and failing to anticipate drug interactions. As a resident said: I feel you almost have to [do] another H and P [history and physical] on the people that came in overnight, especially if they're going to be in the hospital some time becausethe initial H and P and differentials oftentimes is going to change, and you have to be able to adjust to that.I would say there's definitely errors there, coming on and making decisions without knowing the nuances of the history and physical.So you essentially are making important decisions on patients you really don't know that well Another resident explained that the real problem with discontinuity was having inadequate time to get to know the patient: The thing I always think about as far as continuity isif you get a patient [transferred] to your care, how much time do you have which is allotted to you to get to know that patient? And actually, sometimes, I think that the continuity change in care is a good thing because you look at it through different eyes than the person before. So it really depends whether you have enough time to get to know them. On the other hand if you don't, then that's of course where errors I think occur.
Some also noted a sense of loss about not knowing their patients well: You have a sick patient at 1 o'clock, andyou have to turn their care over to your resident or the next intern who's on, and you know this patient best, they know you best, and you've got a relationship, and who knows? That patient might die in the next 12 hours, and you feel some sort of responsibility, but you're not allowed to stay and take care of them, and that kind of takes away a little bit of your autonomy and just like your spirit, I guess.
Impact of Having Compliance with Work Hour Rules Be a Goal
Some residents reported problems when the work hour rules became the primary goal of team members. I certainly have had some interns that I was supervising who made it clear that to them, the most important thing was getting out, and patient care maybe didn't even hit the list, explained one resident. That bothers me a lot because I think that then that focus has become too strict, and the rules have become too importantI mean, if patient care has to happen for whatever reasonthe patient's really sickthen there's enough flexibility to stay the half hour, hour; and I had an intern tell me that if she stayed the extra half hour that she would be over her 80 hours, and so she wasn't going to do it.
Having the rules as a goal affects the process of sign‐out, as explained by a resident, because they want us to track time in and time out and are really strict about sticking particularly to the 30‐hour portion of the rule, the 10 hours off between shifts, and I find that affecting patient care more than anything else because you feel like you can't stay that extra half an hour to wrap things up with a patient who you've been taking care of all night or to sit and talk with the family about something that came up overnight orto do accurate and adequate documentation of things in order to hand that off to the next team because you got to get out of there
DISCUSSION
We conducted this study to better understand why internal medicine residents thought patient care mistakes occurred; we were particularly interested in how they perceived the impact of certain aspects of the ACGME work hour rules on patient care mistakes. Designing systems that achieve compliance with the work hour rules while minimizing patient risk can best be accomplished by fully understanding why errors occur.
Our study revealed that in the opinion of some interns and residents, the work hour rules had consequences for patient care. Like any intervention, this one had both intended and unintended consequences.18 The ACGME has stated that improvement in residents' quality of life was an intended consequence,17 and the participants in our study reported that this had occurred. Despite uncertainty about the overall impact on patient outcomes, residents were glad to have more time away from the hospital.
Our respondents reported that not knowing patients well was a factor that contributed to patient care errors. It is intuitive that working fewer hours often results in more handoffs of care,19 a situation characterized by not knowing patients well. However, residents also identified not getting to know their own patients well as a factor that led to patient care mistakes because of (1) incomplete knowledge of a patient's status, (2) delays in diagnosis, and (3) errors in management. They also described feelings of professional disappointment and frustration at not being able to perform certain aspects of patient care (eg, family meetings) because of the hour limits and the inflexibility of the rules. As we strive to redefine professionalism in the setting of reduced work hours,20 this phenomenon should be addressed.
Sign‐out was identified as another contributor to patient care errors. The effectiveness of sign‐outs is a concern across medicine, and the Joint Commission on Accreditation of Healthcare Organizations made sign‐out procedures one of its priority areas in 2006.21 Much has been written about resident sign‐out, emphasizing the relationship between poor‐quality sign‐outs and patient safety.19, 22 However, barriers to effective sign‐out processes persist,23 even though standardized sign‐out strategies have been described.24, 25 Even in a rigorous study of work hours and patient safety, the computerized sign‐out template for the residents was rarely used.12 Cross‐coverage, or the patient care that occurs after sign‐out is complete, has also been linked to a greater likelihood of adverse events.26
Several factors not related to resident work hours were noted to often mitigate patient care mistakes. Physician teamwork, nursing, information technology (eg, computerized medical records), and faculty supervision were the most prominent. For example, the information technology available at the VA hospitals often helped to facilitate patient care, but it also provided an overwhelming amount of information to sift through. It was clear that the influence of some of these factors varied from institution to institution, reflecting the cultures of different programs.
Our results are consistent with those reported from previous studies. Striking a balance between preventing resident fatigue and preserving continuity of care has been debated since the ACGME announced changes to resident work hour limits.27 Resident quality of life generally improves and fatigue decreases with work hour limits in place,28 but patient safety remains a concern.10 Our findings corroborate the benefits of improved resident well‐being and the persistent concerns about patient safety, identified in a recently published study at a different institution.29 However, our findings expand on those reported in the literature by offering additional empirical evidence, albeit qualitative, about the way that residents see the relationships among the consequences of work hour rules, resident‐reported contributors to patient care mistakes, and the mistakes themselves.
Our study should be interpreted in the context of several limitations. First, the use of qualitative methods did not allow us to generalize or quantify our findings. However, we purposely included 3 diverse institutions with differing responses to the work hour rules to enhance the external validity of our findings. Second, the last focus group was conducted a year after the first 3; by that point, the work hour rules had been in place for 20 months. We believe that this was both a strength and a limitation because it allowed us to gain a perspective after some of the initial growing pains were over. This time lag also allowed for analysis of the first 3 transcripts so we could revise the focus group guide and ultimately determine that thematic saturation had occurred. In addition, few of our questions were phrased to evaluate the ACGME rules; instead, they asked about links among discontinuity, scheduling, fatigue, and patient care. We therefore believe that even residents who were not in the programs before the work hour rules began were still able to knowledgeably participate in the conversation. One question directly referable to the ACGME rules asked residents to reflect on problems arising from them. This could have led residents to only reflect on the problems associated with the rules. However, in all 4 focus groups, residents commented on the positive impact of improved well‐being resulting from the work hour rules. This led us to believe the respondents felt they could voice their favorable feelings as well as their unfavorable feelings about the rules. An additional limitation is that the agreement between coders was only 45%. It is important to realize that assessing coding agreement in qualitative work is quite difficult because it is often difficult to assign a single code to a section of text. When the coders discussed a disagreement, it was almost always the case that the difference was subtle and that the coding of either investigator would made sense for that text. Finally, our results are based on the participation of 28 residents. To be certain we were not representing the opinions of only a few people, we presented iterations of this model to faculty and resident groups for their feedback. Importantly, the residents offered no substantial changes or criticisms of the model.
Limitations notwithstanding, we believe our findings have important policy implications. First, despite work hours successfully being reduced, residents perceived no decrease in the amount of work they did. This resulted in higher workload and more entropy, suggesting that residency programs may need to carefully evaluate the patient care responsibility carried by residents. Second, continued effort to educate residents to provide effective sign‐out is needed. As one participant pointed out, residency offers a unique opportunity to learn to manage discontinuity in a controlled setting. Another educational opportunity is the chance to teach physician teamwork. Participants believed that effective teamwork could ameliorate some of the discontinuity in patient care. This teamwork training should include faculty as well, although further work is needed to define how faculty can best add to patient continuity while still fostering resident autonomy. Finally, the impact of work hour rules on the professional development of residents should be further explored.
In conclusion, we have proposed a model to explain the major resident‐reported contributors to patient care mistakes with respect to resident work hour rules. Our results help to clarify the next steps needed: testing the proposed relationships between the factors and patient care mistakes and rigorously evaluating solutions that minimize the impact of these factors. Returning to the Swiss cheese framework for describing systems accidents, our results suggest that although resident work hour reductions may have sufficiently filled the hole caused by resident fatigue, other gaps may have actually widened as a result of the systems put into place to achieve compliance. Continued vigilance is therefore necessary to both identify the additional holes likely to appear and, more importantly, effectively close those holes before patient harm occurs.
Appendix
APPENDIX 1.
INITIAL FOCUS GROUP GUIDE (FOCUS GROUPS 13)
How would you define the following:
A medical error?
An adverse patient event?
The IOM definition of a medical error is the failure of a planned action to be completed as intended or the use of a wrong plan to achieve an aim (IOM report summary). From this point on, let us try to use this definition when we refer to errors.
What is the impact of continuity of care on medical errors, mistakes, or adverse outcomes?
Team versus individual continuity.
What are some settings at the hospitals where you work in which you have seen mistakes, errors, or bad outcomes in patient care?
Time of day?
Day in call cycle?
Other factors?
What types of mistakes, errors, or bad outcomes do you notice with patient care at the hospitals where you work? Please describe.
What are the things that contribute to patient‐related mistakes, errors, or bad outcomes at the hospitals where you work? (If needed, some prompts include)
How does fatigue contribute?
How do days off or lack of days off contribute?
What are the effects of nurses?
What types of mistakes, errors, or bad outcomes have you noticed with transitions in care (eg, sign‐outs, cross‐coverage) in your patients at the hospitals where you work? Please describe.
How has technology impacted errors, mistakes, and adverse outcomes?
PDA.
Computer access.
Computer‐order entry (if applicable).
What problems have you seen with the new ACGME regulations on work hours at the hospitals where you work?
What are some possible solutions?
Appendix
APPENDIX 2.
FOCUS GROUP GUIDE (4TH FOCUS GROUP)
The IOM definition of a medical error is the failure of a planned action to be completed as intended or the use of a wrong plan to achieve an aim.
Please describe the call structure at each institution where you do ward months (eg, non‐ICU months).
What are some settings at the hospitals where you work where you have seen medical errors, mistakes, or adverse outcomes?
How do you think that other nurses influence the occurrence of medical errors, mistakes, or adverse outcomes?
Clerks?
Other ancillary staff?
How would you describe the responsibilities of a cross‐covering resident or intern?
How do you think continuity of care impacts patient care in terms of medical errors, mistakes, or adverse outcomes?
What role do sign‐outs have?
How do you think that fatigue impacts patient care in terms of medical errors, mistakes, or adverse outcomes?
How do you think that technology such as computerized physician order entry impacts patient care in terms of medical errors, mistakes, or adverse outcomes?
Electronic medical records?
Palm pilots?
Is there such a thing as too much information?
How do you think that experience (or inexperience) impacts patient care in terms of medical errors, mistakes, or adverse outcomes?
Please describe how attendings supervise you when you are on a ward team. How do you think that attending supervision impacts patient care in terms of medical errors, mistakes, or adverse outcomes?
What about resident supervision of interns?
What is the ideal role of an attending on a team?
Can you think of a time when having attending input changed the plans or the course of a patient in a major way, good, bad, or neutral?
How do you think that time of day impacts patient care in terms of in terms of medical errors, mistakes, or adverse outcomes?
How comfortable do you feel calling for help at night? What makes you more or less likely to do it (personal attributes of person to be called, situation, etc.)?
What do you think is an ideal workload? (eg, How many complex patients are typical of your hospitals?) Does that vary from the VA to St. Joe's to Froedtert? How many patients should be admitted in 1 night by an intern? How many should an intern have ongoing responsibility for? Is there such a thing as too few patients?
If one of your family members were to admitted to your hospital at night with a life‐threatening condition, which situation would you prefer for their care (all other things being equal): admission by night float with handoff to a new but well‐rested resident or admission by a resident who then continues to care for that family member the next day but has been awake for 24 hours, admitting and cross‐covering other patients? Why?
What do you think was the intent of the ACGME rules? Do you think that those goals have been accomplished? Why or why not? How have they affected you as residents? How do you think that the ACGME work hour rules have influenced patient care?
- .Human error: Models and management.Br Med J.2000;320:768–770.
- ,,,ACGME Work Group on Resident Duty Hours,Accreditation Council for Graduate Medical Education.New requirements for resident duty hours.JAMA.2002;288:1112–1114.
- ,,,.The effect of the New York State restrictions on resident work hours.Obstet Gynecol.1991;78(3 Pt 1):468–473.
- ,,,.Impact of a night float system on internal medicine residency programs.Acad Med.1991;66:370.
- .Coping with pressures in acute medicine. The Royal College of Physicians Consultant Questionnaire Survey.J R Coll Physicians Lond.1998;32:211–218.
- ,,.New York regulation of residents' working conditions. 1 year's experience.Am J Dis Child.1990;144:799–802.
- ,,,,.Senior house officers in medicine: Postal survey of training and work experience.Br Med J.1997;314:740–743.
- ,,,.Resident and faculty evaluations of a psychiatry night‐float system.Acad Psychiatry.1996;20(1):26–34.
- ,,,.Doctors as workers: work‐hour regulations and interns' perceptions of responsibility, quality of care, and training.J Gen Intern Med.1993;8:429–435.
- ,,,,,.Systematic review: effects of resident work hours on patient safety [review] [39 refs].Ann Intern Med.2004;141:851–857.
- ,,,.The impact of a regulation restricting medical house staff working hours on the quality of patient care.JAMA.1993;269:374–378.
- ,,, et al.Effect of reducing interns' work hours on serious medical errors in intensive care units [see comment].N Engl J Med.2004;351:1838–1848.
- .Qualitative Inquiry and Research Design: Choosing among Five Traditions.Thousand Oaks, CA:Sage Publications, Inc.;1998.
- .Moderating Focus Groups.Thousand Oaks, CA:Sage Publications;1998.
- ,.The Discovery of Grounded Theory: Strategies for Qualitative Research.Chicago, IL:Aldine Publishing Company;1967.
- ,. Basics of Qualitative Research: Techniques and Procedures for Developing Grounded Theory. Vol.2.Thousand Oaks, CA:Sage Publications;1998.
- ACGME. Statement of Justification/Impact for the Final Approval of Common Standards Related to Resident Duty Hours. Available at: http://www.acgme.org/DutyHours/impactStatement.pdf.Accessed February 21,2003.
- ,.Program Evaluation: Alternative Approaches and Practical Guidelines.New York, NY:Longman;1997.
- . Fumbled handoff. Web M117:846–850.
- Helpful solutions for meeting the 2006 national patient safety goals.Jt Comm Perspect Patient Saf.2005;5(8):1–20.
- .Fumbled handoffs: one dropped ball after another.Ann Intern Med.2005;142:352–358.
- ,,,.Lost in translation: challenges and opportunities in physician‐to‐physician communication during patient handoffs.Acad Med.2005;80:1094–1099.
- .Handling handoffs safely.Am J Matern Child Nurs.2005;30(2):152.
- ,,,,.Handoff strategies in settings with high consequences for failure: lessons for health care operations.Int J Qual Health Care.2004;16(2):125–132.
- ,,,,.Does housestaff discontinuity of care increase the risk for preventable adverse events?Ann Intern Med.1994;121:866–872.
- ,,.Balancing continuity of care with residents' limited work hours: defining the implications.Acad Med.2005;80(1):39–43.
- ,,,,,.Effects of work hour reduction on residents' lives: a systematic review.JAMA.2005;294:1088–1100.
- ,,.Residents' perceptions of the effects of work hour limitations at a large teaching hospital.Acad Med.2006;81(1):63–67.
Patient safety can be understood in terms of the Swiss cheese model of systems accidents. This model implies that many holes must align before an adverse event occurs.1 The limitations on work hours instituted by the Accreditation Council for Graduate Medical Education (ACGME)2 sought to close one hole by reducing fatigue in residents. As programs comply with these regulations, new interventions are being implemented to limit resident hours. This has resulted in more handoffs of care and therefore less continuity. The ultimate result may be to increase patient care errors by opening up new holes, the opposite of the stated goal of this reform.
Some residency programs have reported on their experience with hour reductions, giving insight into residents' perceptions on the benefits and drawbacks of such interventions. Residents have reported concern about continuity of care after such interventions.37 However, some residents believed they provided better patient care after the interventions to reduce hours.8, 9 Few studies have actually documented changes in the incidence of adverse events or errors as a result of work hour limitations.10 One study conducted prior to implementation of the ACGME work hour rules demonstrated more complications in internal medicine patients after New York's Code 405 (a state regulation that limited resident work hours, similar to the ACGME rules) was implemented.11 In contrast, another study showed that errors committed by interns were reduced with scheduling changes that resulted in shorter shifts and reduced hours.12
Because residents are on the front lines of patient care, they are uniquely positioned to provide insight into the impact of the work hour rules on patient safety. We conducted this study to more fully understand the effect of the ACGME work hour limitations and other possible factors on patient care errors from the perspectives of internal medicine residents.
METHODS
Participants and Sites
All internal medicine residents and interns from 3 residency programs were recruited to participate in focus groups. We purposely chose programs based at diverse health care organizations. The first program was based at a university and had approximately 160 residents, who rotated at both the university hospital and the affiliated Veterans Affairs Medical Center (VAMC). The second program was based at a community teaching hospital and had approximately 65 residents. The third program was affiliated with a freestanding medical college and had approximately 95 residents, who rotated at a large, private tertiary‐care hospital and also at the affiliated VAMC. Each program had a different call structure (Table 1).
| Site | Call system on general medicine services |
|---|---|
| Community | Four teams, each with 1 attending, 1 junior or senior resident, 2 interns. |
| Teams take call every fourth day. Interns stay overnight and leave on the postcall day by 1 PM. Junior or senior resident on team admits patients until 9 PM on call and returns at 7 AM postcall. Night float resident admits patients with on‐call interns from 9 PM until 7 AM. | |
| On postcall day team resident stays the entire day, addressing all postcall clinical issues and follow‐up. | |
| University | At primary teaching hospital and VA: |
| Four teams, each with 1 attending, 1 junior or senior resident, 2 interns. | |
| Teams take call every fourth day. Interns stay overnight, whereas residents leave at 9 PM on call and return at 7 AM postcall. Night‐float resident admits with interns from 9 PMto midnight, and then interns admit by themselves after midnight. | |
| Day‐float resident present on postcall days to help team's senior resident finish the work. | |
| Freestanding medical college | At primary teaching hospital: |
| Six teams, each with 1 attending, 1 junior or senior resident, and 1 or 2 interns. | |
| Call is not as a team and is approximately every fifth day. Two residents and 3 interns take call overnight together. At VA hospital: | |
| Four teams, each with 1 attending, 1 junior or senior resident, 2 interns. | |
| Teams take call every fourth day. One intern leaves at 9 PM on call and returns at 7 AM postcall; stays until 4 PM to cover team. |
Potential participants were recruited via E‐mail, which explained that the study was about common scenarios for patient care errors and how the ACGME work hour rules affected patient care and errors.
Design
We conducted 4 focus groups in total (Appendix 1). The first 3 focus groups followed the same focus group guide, developed after a literature review. Focus groups 1 and 2 were conducted at the university‐based program. Focus group 3 was conducted at the community teaching hospitalaffiliated program. The first 3 focus groups were analyzed before the fourth focus group was conducted. A new focus group guide was developed for the fourth focus group to further explore themes identified in the first 3 focus groups (Fig. 1 and Appendix 2). The fourth focus group was conducted at the program affiliated with a freestanding medical college. All focus groups were audiotaped and transcribed verbatim. Each lasted approximately 90‐120 minutes.
Intervention
The focus group guide for the first 3 focus groups consisted of main questions and follow‐up prompts (Appendix 1). The focus group guide for the fourth focus group (Appendix 2) was developed based on themes from the first 3 focus groups, consistent with the iterative approach of grounded theory.13 Some of the questions were the same as in the first focus group guide; others were added to better understand the roles of faculty, teamwork, and inexperience in patient care errors.
Written informed consent was obtained before the focus groups began. Participants were paid $20 and given dinner. All internal medicine residents at the institutions included were eligible. The focus groups were held after work. Each focus group comprised participants from a single institution. The investigators who were the moderators were all junior faculty. They did not moderate the focus group at their own institution so as to minimize barriers to the residents' ability to speak freely about their experiences. The moderators prepared for their roles through discussion and assigned reading.14 The investigators used the focus group guide to ask questions of the group as a whole and facilitated the discussion that arose as a result. After each focus group, the moderator and assistant moderator debriefed each other about the important themes from the session.
Ethics
The institutional review boards at all sites approved this study.
Analysis
We used grounded theory to analyze the transcripts.15 Grounded theory is an iterative process that allows for themes to arise from the data.16 After the first 3 focus groups were completed, 5 of the investigators read all 3 transcripts at least twice and noted themes of interest in the text in a process of open coding.13 These investigators met in August 2004 to discuss the transcripts and the themes that had been identified by the individual investigators. A coding scheme of 33 codes was devised based on this meeting and the notes of individual investigators about the process of reading the transcripts. The need to conduct a fourth focus group to further explore certain issues was also identified. Two investigators (K.F., V.P.) independently coded the first 3 transcripts using the agreed‐on coding scheme. One investigator used NVivo (QSR International, Doncaster, Australia), an appropriate software package, and the other investigator coded by hand. During this process, 2 additional themes were identified. The 2 coders agreed on the need to add them, and they were incorporated into the coding scheme, yielding a total of 35 codes. Three of the investigators met again to begin constructing a model to represent the relationships among the themes. The model was developed iteratively over the following year by considering the most important themes, their relationships to one another, unifying concepts identified during the textual analysis, and team meetings. To provide additional validity, peer checking occurred. Specifically, iterations of the model were discussed by the team of investigators, in local research‐in‐progress sessions, with groups of residents at 2 of the participating institutions, and at national meetings. The fourth focus group was conducted at the third site in March 2005. The same 2 investigators applied the 35‐code scheme and determined that thematic saturation had occurred; that is, no new themes were identified.
Agreement between the 2 coders was evaluated by reviewing 15% of each transcript and dividing the number of agreed‐on codes by the total number of codes assigned to each section of text. The starting point of the text checked for agreement was chosen randomly. Agreement between the 2 coders for the first 3 focus groups was 43%, 48%, and 56%, respectively. The fourth focus group was analyzed a year later, and the initial agreement between the coders was 23%. After comparison and discussion, it was clear that 1 coder had coded many passages with more than 1 code, whereas the second coder had tried to choose the most pertinent code. The second coder recoded the transcript, and a new section was compared, resulting in agreement in 45% of that section. Discrepancies between the coders were resolved by consensus. None represented major differences of opinion; rather, they usually indicated the difficulty in choosing 1 primary code to fit an utterance that could be represented by several codes.
RESULTS
Twenty‐eight residents participated. Some of these residents had experience in the prework hour era, and some did not. Average age was 28 years (range 26‐33 years); 18 were women, and 11 were interns (Table 2). The focus groups ranged in size from 5 to 9. A sample of the codes and their definitions can be found in Table 3.
| Number of participants by site | |
| Community | 9 |
| University | 13 |
| Freestanding medical college | 6 |
| Age (years), mean | 28.5 |
| Sex (female), n (%) | 18 (64%) |
| Postgraduate year, n (%) | |
| Intern | 11 (39%) |
| Second year and above | 17 (61%) |
| Type of resident, n (%) | |
| Categorical | 23 (82%) |
| Codes | Definitions |
|---|---|
| Fatigue | How fatigue contributes to patient care problems. |
| How not being fatigued contributes to improved patient care. | |
| Workload | How workload issues (eg, patient complexity) may contribute to patient care problems. |
| Descriptions of times that workload was overwhelming: overextendedHave to be in 4 places at once. | |
| Entropy | Residents' descriptions of too much of everything (information, interruptions); house of cards. |
| How this chaos contributes to patient care problems. | |
| Being overwhelmed may be a facet. | |
| Not knowing own patients | Contributors to not knowing patients. |
| How not knowing patients affects patient care. | |
| Sign‐out/cross‐cover | Description of sign‐out practices, problems, and solutions. |
| Inexperience/lack of knowledge | How inexperience can contribute to patient care problems. |
| Challenges and attributes of delivering patient care in the setting of learning to deliver patient care. | |
| Personal well‐being | Discussions about residents lives, spouses, homes. |
| How this affects patient care. | |
| Continuity of doctor care | Examples of discontinuity. |
| How continuity and discontinuity contribute to patient care problems. | |
| Other aspects or attributes of continuity or discontinuity. | |
| Work hour rules as a goal | Examples of compliance with ACGME rules becoming a goal in itself and its impact on patient care |
The Model
The model (Fig. 2) illustrates resident‐perceived contributors to patient care mistakes related to the ACGME work hour rules. These contributors are in the center circle. They include fatigue, inexperience, sign‐out, not knowing their own patients well enough, entropy (which we defined as the amount of chaos in the system), and workload. They are not listed in order of importance. The boxes outside the circle are consequences of the ACGME work hour rules and their perceived impact on the contributors to patient care mistakes. At the top are the intended consequences, that is the specific goals of the ACGME: less resident time in the hospital (ie, reduced hours) and improved well‐being.17 At the bottom are the unintended consequences: more patient care discontinuity and compliance with the work hour rules becoming a goal equally important to providing high‐quality patient care. Of these 4 consequences, only improved well‐being was viewed by the residents as decreasing patient care mistakes. The other consequences were cited by residents as sometimes increasing patient care errors. Because of the complexity of the model, several factors not directly related to resident work hours were identified in the analysis but are not shown in the model. They include faculty involvement and team work (usually positive influences), nurses and information technology (could be positive or negative), and late‐night/early‐morning hours (negative).
The quotations below illustrate the relationships between the consequences of the work hour rules, resident‐perceived contributors to patient care mistakes, and actual patient care.
Impact of Improved Well‐Being
Residents noted that improved well‐being resulting from the work hour rules could mitigate the impact of fatigue on patient care, as described by this resident who discussed late‐night admissions when on night float as opposed to on a regular call night. When I was night float, though, I was refreshed and more energized, and the patientI think got better care because I wasn't as tired andbasically could function better. So I think that's a good part about this year is that I'm not as toxic, and I think I can think betterand care more when I'm not so tired, and my own needs have been met, in terms of sleep and rest and being home and stuff
Residents often described tension between the benefits of being well rested and the benefits of continuity: I don't know how it affects patient care unless you sort of make a leap and say that people whohave better well‐being perform better. I don't know if that's true. Certainly, you could make the other argument and say if you're here all the time and miserable, and that's all you do, well, that's all you do. I'm not sure if maybe that's better. But I think for the physician when you compare them to lawyersany other field, engineers, architectsI think they sort of have a more well‐balanced life. So I think it is good for physician safety or their marriage safety. I'm not sure what it does with patient care.
Impact of Having Less Time in the Hospital
Having less time contributed to at least 2 factors, entropy and workload, as described in this passage: I think with the80‐hour system there is a total of at least 1 less senior in house, if not more at times, and I know that when I was doing the night float thing and then even when I was doing senior call once, all it takes is one sick patient that is too much for the intern alone to deal with,and it's all of a sudden 6 in the morning, and there are 3 other admissions that the other intern has done that the senior hasn't seen yet, and that happened to me more than once. One resident discussed the workload on inpatient services: I feel like I end up doing the same amount of work, but I have that much more pressure to do it all, and the notes are shorter, and you can't think through everything, and I actually find myself avoiding going in and talking to a family because I know that it is going to end up being a half‐hour conversation when all I really wanted to do was to communicate what the plan was, but I don't have a chance to because I know it is going to turn into a longer conversation, and I know I don't have time to do that and get out on time.
Impact of More Discontinuity
Discontinuity could also exacerbate contributors to patient care mistakes, especially through sign‐out/cross‐cover: I think continuity of care is very important, obviously, whenever there is transition of caring for a patient from one physician to another physicianthat information that gets transmitted from each other needs to be very well emphasized and clearly explained to the subsequent caretaker. And if that continuity of care is disrupted in some way, either through poor communication or lack of communication or a lot of different people having different responses to specific situations, that it can lead to [an] adverse event or medical errors like we just talked about.
Discontinuity also led to team members feeling they did not know their own patients well enough, which in turn could lead to mistakes in patient care. For example, residents described discharging patients on the wrong medications, overlooking important secondary problems, and failing to anticipate drug interactions. As a resident said: I feel you almost have to [do] another H and P [history and physical] on the people that came in overnight, especially if they're going to be in the hospital some time becausethe initial H and P and differentials oftentimes is going to change, and you have to be able to adjust to that.I would say there's definitely errors there, coming on and making decisions without knowing the nuances of the history and physical.So you essentially are making important decisions on patients you really don't know that well Another resident explained that the real problem with discontinuity was having inadequate time to get to know the patient: The thing I always think about as far as continuity isif you get a patient [transferred] to your care, how much time do you have which is allotted to you to get to know that patient? And actually, sometimes, I think that the continuity change in care is a good thing because you look at it through different eyes than the person before. So it really depends whether you have enough time to get to know them. On the other hand if you don't, then that's of course where errors I think occur.
Some also noted a sense of loss about not knowing their patients well: You have a sick patient at 1 o'clock, andyou have to turn their care over to your resident or the next intern who's on, and you know this patient best, they know you best, and you've got a relationship, and who knows? That patient might die in the next 12 hours, and you feel some sort of responsibility, but you're not allowed to stay and take care of them, and that kind of takes away a little bit of your autonomy and just like your spirit, I guess.
Impact of Having Compliance with Work Hour Rules Be a Goal
Some residents reported problems when the work hour rules became the primary goal of team members. I certainly have had some interns that I was supervising who made it clear that to them, the most important thing was getting out, and patient care maybe didn't even hit the list, explained one resident. That bothers me a lot because I think that then that focus has become too strict, and the rules have become too importantI mean, if patient care has to happen for whatever reasonthe patient's really sickthen there's enough flexibility to stay the half hour, hour; and I had an intern tell me that if she stayed the extra half hour that she would be over her 80 hours, and so she wasn't going to do it.
Having the rules as a goal affects the process of sign‐out, as explained by a resident, because they want us to track time in and time out and are really strict about sticking particularly to the 30‐hour portion of the rule, the 10 hours off between shifts, and I find that affecting patient care more than anything else because you feel like you can't stay that extra half an hour to wrap things up with a patient who you've been taking care of all night or to sit and talk with the family about something that came up overnight orto do accurate and adequate documentation of things in order to hand that off to the next team because you got to get out of there
DISCUSSION
We conducted this study to better understand why internal medicine residents thought patient care mistakes occurred; we were particularly interested in how they perceived the impact of certain aspects of the ACGME work hour rules on patient care mistakes. Designing systems that achieve compliance with the work hour rules while minimizing patient risk can best be accomplished by fully understanding why errors occur.
Our study revealed that in the opinion of some interns and residents, the work hour rules had consequences for patient care. Like any intervention, this one had both intended and unintended consequences.18 The ACGME has stated that improvement in residents' quality of life was an intended consequence,17 and the participants in our study reported that this had occurred. Despite uncertainty about the overall impact on patient outcomes, residents were glad to have more time away from the hospital.
Our respondents reported that not knowing patients well was a factor that contributed to patient care errors. It is intuitive that working fewer hours often results in more handoffs of care,19 a situation characterized by not knowing patients well. However, residents also identified not getting to know their own patients well as a factor that led to patient care mistakes because of (1) incomplete knowledge of a patient's status, (2) delays in diagnosis, and (3) errors in management. They also described feelings of professional disappointment and frustration at not being able to perform certain aspects of patient care (eg, family meetings) because of the hour limits and the inflexibility of the rules. As we strive to redefine professionalism in the setting of reduced work hours,20 this phenomenon should be addressed.
Sign‐out was identified as another contributor to patient care errors. The effectiveness of sign‐outs is a concern across medicine, and the Joint Commission on Accreditation of Healthcare Organizations made sign‐out procedures one of its priority areas in 2006.21 Much has been written about resident sign‐out, emphasizing the relationship between poor‐quality sign‐outs and patient safety.19, 22 However, barriers to effective sign‐out processes persist,23 even though standardized sign‐out strategies have been described.24, 25 Even in a rigorous study of work hours and patient safety, the computerized sign‐out template for the residents was rarely used.12 Cross‐coverage, or the patient care that occurs after sign‐out is complete, has also been linked to a greater likelihood of adverse events.26
Several factors not related to resident work hours were noted to often mitigate patient care mistakes. Physician teamwork, nursing, information technology (eg, computerized medical records), and faculty supervision were the most prominent. For example, the information technology available at the VA hospitals often helped to facilitate patient care, but it also provided an overwhelming amount of information to sift through. It was clear that the influence of some of these factors varied from institution to institution, reflecting the cultures of different programs.
Our results are consistent with those reported from previous studies. Striking a balance between preventing resident fatigue and preserving continuity of care has been debated since the ACGME announced changes to resident work hour limits.27 Resident quality of life generally improves and fatigue decreases with work hour limits in place,28 but patient safety remains a concern.10 Our findings corroborate the benefits of improved resident well‐being and the persistent concerns about patient safety, identified in a recently published study at a different institution.29 However, our findings expand on those reported in the literature by offering additional empirical evidence, albeit qualitative, about the way that residents see the relationships among the consequences of work hour rules, resident‐reported contributors to patient care mistakes, and the mistakes themselves.
Our study should be interpreted in the context of several limitations. First, the use of qualitative methods did not allow us to generalize or quantify our findings. However, we purposely included 3 diverse institutions with differing responses to the work hour rules to enhance the external validity of our findings. Second, the last focus group was conducted a year after the first 3; by that point, the work hour rules had been in place for 20 months. We believe that this was both a strength and a limitation because it allowed us to gain a perspective after some of the initial growing pains were over. This time lag also allowed for analysis of the first 3 transcripts so we could revise the focus group guide and ultimately determine that thematic saturation had occurred. In addition, few of our questions were phrased to evaluate the ACGME rules; instead, they asked about links among discontinuity, scheduling, fatigue, and patient care. We therefore believe that even residents who were not in the programs before the work hour rules began were still able to knowledgeably participate in the conversation. One question directly referable to the ACGME rules asked residents to reflect on problems arising from them. This could have led residents to only reflect on the problems associated with the rules. However, in all 4 focus groups, residents commented on the positive impact of improved well‐being resulting from the work hour rules. This led us to believe the respondents felt they could voice their favorable feelings as well as their unfavorable feelings about the rules. An additional limitation is that the agreement between coders was only 45%. It is important to realize that assessing coding agreement in qualitative work is quite difficult because it is often difficult to assign a single code to a section of text. When the coders discussed a disagreement, it was almost always the case that the difference was subtle and that the coding of either investigator would made sense for that text. Finally, our results are based on the participation of 28 residents. To be certain we were not representing the opinions of only a few people, we presented iterations of this model to faculty and resident groups for their feedback. Importantly, the residents offered no substantial changes or criticisms of the model.
Limitations notwithstanding, we believe our findings have important policy implications. First, despite work hours successfully being reduced, residents perceived no decrease in the amount of work they did. This resulted in higher workload and more entropy, suggesting that residency programs may need to carefully evaluate the patient care responsibility carried by residents. Second, continued effort to educate residents to provide effective sign‐out is needed. As one participant pointed out, residency offers a unique opportunity to learn to manage discontinuity in a controlled setting. Another educational opportunity is the chance to teach physician teamwork. Participants believed that effective teamwork could ameliorate some of the discontinuity in patient care. This teamwork training should include faculty as well, although further work is needed to define how faculty can best add to patient continuity while still fostering resident autonomy. Finally, the impact of work hour rules on the professional development of residents should be further explored.
In conclusion, we have proposed a model to explain the major resident‐reported contributors to patient care mistakes with respect to resident work hour rules. Our results help to clarify the next steps needed: testing the proposed relationships between the factors and patient care mistakes and rigorously evaluating solutions that minimize the impact of these factors. Returning to the Swiss cheese framework for describing systems accidents, our results suggest that although resident work hour reductions may have sufficiently filled the hole caused by resident fatigue, other gaps may have actually widened as a result of the systems put into place to achieve compliance. Continued vigilance is therefore necessary to both identify the additional holes likely to appear and, more importantly, effectively close those holes before patient harm occurs.
Appendix
APPENDIX 1.
INITIAL FOCUS GROUP GUIDE (FOCUS GROUPS 13)
How would you define the following:
A medical error?
An adverse patient event?
The IOM definition of a medical error is the failure of a planned action to be completed as intended or the use of a wrong plan to achieve an aim (IOM report summary). From this point on, let us try to use this definition when we refer to errors.
What is the impact of continuity of care on medical errors, mistakes, or adverse outcomes?
Team versus individual continuity.
What are some settings at the hospitals where you work in which you have seen mistakes, errors, or bad outcomes in patient care?
Time of day?
Day in call cycle?
Other factors?
What types of mistakes, errors, or bad outcomes do you notice with patient care at the hospitals where you work? Please describe.
What are the things that contribute to patient‐related mistakes, errors, or bad outcomes at the hospitals where you work? (If needed, some prompts include)
How does fatigue contribute?
How do days off or lack of days off contribute?
What are the effects of nurses?
What types of mistakes, errors, or bad outcomes have you noticed with transitions in care (eg, sign‐outs, cross‐coverage) in your patients at the hospitals where you work? Please describe.
How has technology impacted errors, mistakes, and adverse outcomes?
PDA.
Computer access.
Computer‐order entry (if applicable).
What problems have you seen with the new ACGME regulations on work hours at the hospitals where you work?
What are some possible solutions?
Appendix
APPENDIX 2.
FOCUS GROUP GUIDE (4TH FOCUS GROUP)
The IOM definition of a medical error is the failure of a planned action to be completed as intended or the use of a wrong plan to achieve an aim.
Please describe the call structure at each institution where you do ward months (eg, non‐ICU months).
What are some settings at the hospitals where you work where you have seen medical errors, mistakes, or adverse outcomes?
How do you think that other nurses influence the occurrence of medical errors, mistakes, or adverse outcomes?
Clerks?
Other ancillary staff?
How would you describe the responsibilities of a cross‐covering resident or intern?
How do you think continuity of care impacts patient care in terms of medical errors, mistakes, or adverse outcomes?
What role do sign‐outs have?
How do you think that fatigue impacts patient care in terms of medical errors, mistakes, or adverse outcomes?
How do you think that technology such as computerized physician order entry impacts patient care in terms of medical errors, mistakes, or adverse outcomes?
Electronic medical records?
Palm pilots?
Is there such a thing as too much information?
How do you think that experience (or inexperience) impacts patient care in terms of medical errors, mistakes, or adverse outcomes?
Please describe how attendings supervise you when you are on a ward team. How do you think that attending supervision impacts patient care in terms of medical errors, mistakes, or adverse outcomes?
What about resident supervision of interns?
What is the ideal role of an attending on a team?
Can you think of a time when having attending input changed the plans or the course of a patient in a major way, good, bad, or neutral?
How do you think that time of day impacts patient care in terms of in terms of medical errors, mistakes, or adverse outcomes?
How comfortable do you feel calling for help at night? What makes you more or less likely to do it (personal attributes of person to be called, situation, etc.)?
What do you think is an ideal workload? (eg, How many complex patients are typical of your hospitals?) Does that vary from the VA to St. Joe's to Froedtert? How many patients should be admitted in 1 night by an intern? How many should an intern have ongoing responsibility for? Is there such a thing as too few patients?
If one of your family members were to admitted to your hospital at night with a life‐threatening condition, which situation would you prefer for their care (all other things being equal): admission by night float with handoff to a new but well‐rested resident or admission by a resident who then continues to care for that family member the next day but has been awake for 24 hours, admitting and cross‐covering other patients? Why?
What do you think was the intent of the ACGME rules? Do you think that those goals have been accomplished? Why or why not? How have they affected you as residents? How do you think that the ACGME work hour rules have influenced patient care?
- .Human error: Models and management.Br Med J.2000;320:768–770.
- ,,,ACGME Work Group on Resident Duty Hours,Accreditation Council for Graduate Medical Education.New requirements for resident duty hours.JAMA.2002;288:1112–1114.
- ,,,.The effect of the New York State restrictions on resident work hours.Obstet Gynecol.1991;78(3 Pt 1):468–473.
- ,,,.Impact of a night float system on internal medicine residency programs.Acad Med.1991;66:370.
- .Coping with pressures in acute medicine. The Royal College of Physicians Consultant Questionnaire Survey.J R Coll Physicians Lond.1998;32:211–218.
- ,,.New York regulation of residents' working conditions. 1 year's experience.Am J Dis Child.1990;144:799–802.
- ,,,,.Senior house officers in medicine: Postal survey of training and work experience.Br Med J.1997;314:740–743.
- ,,,.Resident and faculty evaluations of a psychiatry night‐float system.Acad Psychiatry.1996;20(1):26–34.
- ,,,.Doctors as workers: work‐hour regulations and interns' perceptions of responsibility, quality of care, and training.J Gen Intern Med.1993;8:429–435.
- ,,,,,.Systematic review: effects of resident work hours on patient safety [review] [39 refs].Ann Intern Med.2004;141:851–857.
- ,,,.The impact of a regulation restricting medical house staff working hours on the quality of patient care.JAMA.1993;269:374–378.
- ,,, et al.Effect of reducing interns' work hours on serious medical errors in intensive care units [see comment].N Engl J Med.2004;351:1838–1848.
- .Qualitative Inquiry and Research Design: Choosing among Five Traditions.Thousand Oaks, CA:Sage Publications, Inc.;1998.
- .Moderating Focus Groups.Thousand Oaks, CA:Sage Publications;1998.
- ,.The Discovery of Grounded Theory: Strategies for Qualitative Research.Chicago, IL:Aldine Publishing Company;1967.
- ,. Basics of Qualitative Research: Techniques and Procedures for Developing Grounded Theory. Vol.2.Thousand Oaks, CA:Sage Publications;1998.
- ACGME. Statement of Justification/Impact for the Final Approval of Common Standards Related to Resident Duty Hours. Available at: http://www.acgme.org/DutyHours/impactStatement.pdf.Accessed February 21,2003.
- ,.Program Evaluation: Alternative Approaches and Practical Guidelines.New York, NY:Longman;1997.
- . Fumbled handoff. Web M117:846–850.
- Helpful solutions for meeting the 2006 national patient safety goals.Jt Comm Perspect Patient Saf.2005;5(8):1–20.
- .Fumbled handoffs: one dropped ball after another.Ann Intern Med.2005;142:352–358.
- ,,,.Lost in translation: challenges and opportunities in physician‐to‐physician communication during patient handoffs.Acad Med.2005;80:1094–1099.
- .Handling handoffs safely.Am J Matern Child Nurs.2005;30(2):152.
- ,,,,.Handoff strategies in settings with high consequences for failure: lessons for health care operations.Int J Qual Health Care.2004;16(2):125–132.
- ,,,,.Does housestaff discontinuity of care increase the risk for preventable adverse events?Ann Intern Med.1994;121:866–872.
- ,,.Balancing continuity of care with residents' limited work hours: defining the implications.Acad Med.2005;80(1):39–43.
- ,,,,,.Effects of work hour reduction on residents' lives: a systematic review.JAMA.2005;294:1088–1100.
- ,,.Residents' perceptions of the effects of work hour limitations at a large teaching hospital.Acad Med.2006;81(1):63–67.
Copyright © 2008 Society of Hospital Medicine
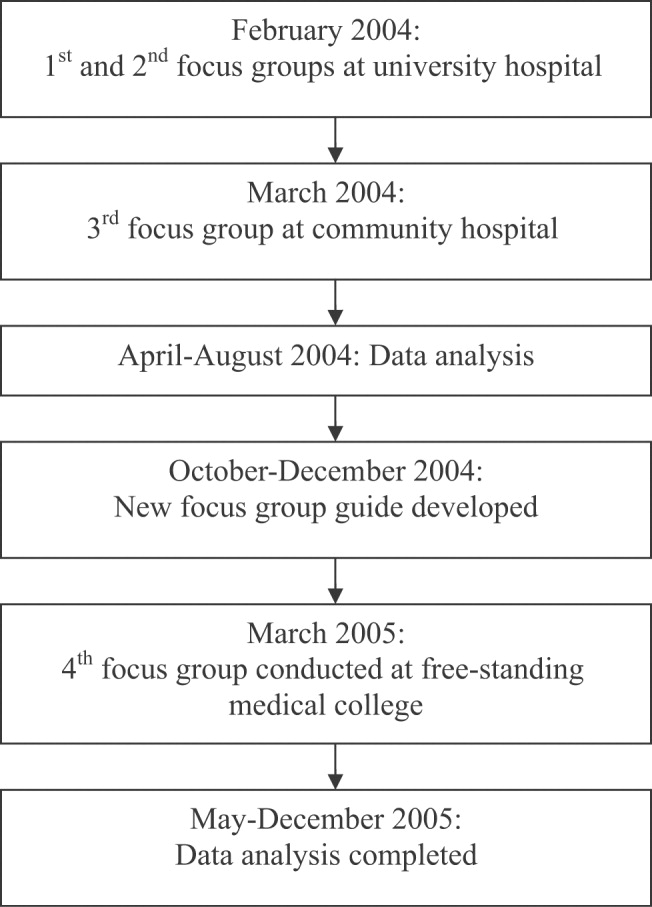
Who do you want taking care of your parent?
Specialist or generalist? The question of which physicians are best suited to treat patients with a single condition or in a particular care setting has been the subject of study and debate for decades.13 Investigators have asked whether cardiologists provide better care for patients with acute myocardial infarction1 or whether intensivists achieve superior outcomes in critical care settings.2 One implication of these studies is that a hospital or health plan armed with this knowledge would be capable of improving outcomes by directing a greater proportion of patients to the superior physician group. In fact, much of the literature reporting on the effect of hospitalists is simply a new variation on this old theme.48 Of course, to realize any potential gains, there must be an adequate number of specialists or the ability to increase the supply quickly. Neither option tends to be especially realistic. Further, these studies have a tendency to create false dilemmas because consultation and comanagement are more common than single‐handed care.
Because studies comparing the outcomes of physician groups are generally not randomized trials, minimizing the threat of selection bias (ie, patient prognosis influencing treatment assignment) is of paramount importance. For example, one can imagine how patients with a particularly poor prognosis in the setting of acute myocardial infarction (perhaps related to age or the presence of multiple comorbidities) might be preferentially directed toward a general medicine service, especially when remunerative cardiac intervention is unlikely. In such instances, comparing simple mortality rates would erroneously lead to the conclusion that patients cared for by cardiologists had better outcomes.
Multivariable modeling techniques like logistic and liner regression and more recently, propensity‐based methods, are the standard approaches used to adjust for differences in patient characteristics stemming from nonrandom assignment. When propensity methods are used, a multivariable model is created to predict the likelihood, or propensity, of a patient receiving treatment. Because it is not necessary to be parsimonious in the development of propensity models, they can include many factors and interaction terms that might be left out of a standard multivariable logistic regression. Then, the outcomes of patients with a similar treatment propensity who did receive the intervention can be compared to the outcomes of those who did not. Some have gone so far as to use the term pseudorandomized trial to describe this approach because it is often capable balancing covariates between the treated and nontreated patients. However, as sophisticated as this form of modeling may be, these techniques at best are only capable of reducing bias related to measured confounders. Residual bias from confounders that go unmeasured remains a threatand is particularly common when relying on administrative data sources.
In this issue of the Journal of Hospital Medicine, Gillum and Johnston9 apply a version of instrumental variable analysis, a technique borrowed from econometrics, to address the issue of unmeasured confounding head‐on. The approach, called group‐treatment analysis, is based on the relatively simple notion that if neurologist care is superior to that provided by generalists, all other things being equal, hospitals that admit a large proportion of their patients to neurologists should have better outcomes than those admitting a smaller proportion. This approach has theoretical advantages over propensity adjustment because it does not attempt to control for differences between treated and untreated patients at the individual hospital level, where, presumably, the problem of selection bias is more potent. Although their standard multivariable models suggested that patients admitted to a neurologist were 40% less likely to die while hospitalized than patients admitted to generalists, Gillum and Johnston found that after adjusting for the institutional rate of neurologist admission, any apparent benefit had disappeared. Similar results were observed in their analyses of length of stay and cost.
In some ways, the findings of this study are more startling for the questions they raise about the presence of residual bias in observational studies using conventional multivariable methods than for the fact that generalist care was found to be as safe as neurologist care and add to a growing body of evidence suggesting that stronger methods are required to deal with residual bias in observational studies.10
Although the results largely speak for themselves and should be reassuring given that most patients with ischemic stroke in the United States are and will continue to be cared for by generalists, a number of important questions remain unanswered. First, the focus of this study was on short‐term outcomes. Because functional status and quality of life probably matter as much or more to stroke patients than in‐hospital mortality and certainly length of stay or cost, we can only hope that it is safe to extrapolate from the authors' mortality findings. Second, this study relied on data from the late 1990s, before the widespread availability of hospitalists. How generalizable the findings would be in today's environment is uncertain. On a more practical level, the authors were unable to assess the impact of formal or informal consultation by a neurologist. If this played a significant role (a reasonable assumption, I think), this would have blurred any distinction between the 2 physician groups. For this reason one cannot draw any conclusions about a more pragmatic questionthe necessity or benefit of neurologist consultation in patients with ischemic stroke.
Looking ahead, researchers hoping to improve the outcomes of patients with acute ischemic stroke should focus on developing novel models of collaboration between hospitalists and neurologists, instead of simply trying to prove that a neurologist should take care of a patient suffering a stroke alone versus a hospitalist without help from a neurologist. We also should recognize that the use of protocols and checklists or leveraging information technology investments may provide clinical decision support that improves care more than just consulting a specialist or having them care for the patient.
- ,,,.Treatment and outcomes of acute myocardial infarction among patients of cardiologists and generalist physicians.Arch Intern Med.1997;157:2570–2576.
- ,,,,,.Physician staffing patterns and clinical outcomes in critically ill patients: a systematic review.JAMA.2002;288:2151–2162.
- ,,, et al.A comparison of outcomes resulting from generalist vs specialist care for a single discrete medical condition: a systematic review and methodologic critique.Arch Intern Med.2007;167:10–20.
- ,,, et al.Implementation of a voluntary hospitalist service at a community teaching hospital: improved clinical efficiency and patient outcomes.Ann Intern Med.2002;137:859–865.
- ,,, et al.A comparison of two hospitalist models with traditional care in a community teaching hospital.Am J Med.2005;118:536–543.
- ,,,,,.Associations with reduced length of stay and costs on an academic hospitalist service.Am J Manag Care.2004;10:561–568.
- ,,,,,.Outcomes of care by hospitalists, general internists, and family physicians. [see comment].N Engl J Med.2007;357:2589–2600.
- ,,, et al.Reorganizing an academic medical service: impact on cost, quality, patient satisfaction, and education.JAMA.1998;279:1560–1565.
- ,.Influence of physician specialty on outcomes after acute ischemic stroke.J Hosp Med2008;3:184–192.
- ,,,,,.Analysis of observational studies in the presence of treatment selection bias: effects of invasive cardiac management on AMI survival using propensity score and instrumental variable methods.JAMA.2007;297:278–285.
Specialist or generalist? The question of which physicians are best suited to treat patients with a single condition or in a particular care setting has been the subject of study and debate for decades.13 Investigators have asked whether cardiologists provide better care for patients with acute myocardial infarction1 or whether intensivists achieve superior outcomes in critical care settings.2 One implication of these studies is that a hospital or health plan armed with this knowledge would be capable of improving outcomes by directing a greater proportion of patients to the superior physician group. In fact, much of the literature reporting on the effect of hospitalists is simply a new variation on this old theme.48 Of course, to realize any potential gains, there must be an adequate number of specialists or the ability to increase the supply quickly. Neither option tends to be especially realistic. Further, these studies have a tendency to create false dilemmas because consultation and comanagement are more common than single‐handed care.
Because studies comparing the outcomes of physician groups are generally not randomized trials, minimizing the threat of selection bias (ie, patient prognosis influencing treatment assignment) is of paramount importance. For example, one can imagine how patients with a particularly poor prognosis in the setting of acute myocardial infarction (perhaps related to age or the presence of multiple comorbidities) might be preferentially directed toward a general medicine service, especially when remunerative cardiac intervention is unlikely. In such instances, comparing simple mortality rates would erroneously lead to the conclusion that patients cared for by cardiologists had better outcomes.
Multivariable modeling techniques like logistic and liner regression and more recently, propensity‐based methods, are the standard approaches used to adjust for differences in patient characteristics stemming from nonrandom assignment. When propensity methods are used, a multivariable model is created to predict the likelihood, or propensity, of a patient receiving treatment. Because it is not necessary to be parsimonious in the development of propensity models, they can include many factors and interaction terms that might be left out of a standard multivariable logistic regression. Then, the outcomes of patients with a similar treatment propensity who did receive the intervention can be compared to the outcomes of those who did not. Some have gone so far as to use the term pseudorandomized trial to describe this approach because it is often capable balancing covariates between the treated and nontreated patients. However, as sophisticated as this form of modeling may be, these techniques at best are only capable of reducing bias related to measured confounders. Residual bias from confounders that go unmeasured remains a threatand is particularly common when relying on administrative data sources.
In this issue of the Journal of Hospital Medicine, Gillum and Johnston9 apply a version of instrumental variable analysis, a technique borrowed from econometrics, to address the issue of unmeasured confounding head‐on. The approach, called group‐treatment analysis, is based on the relatively simple notion that if neurologist care is superior to that provided by generalists, all other things being equal, hospitals that admit a large proportion of their patients to neurologists should have better outcomes than those admitting a smaller proportion. This approach has theoretical advantages over propensity adjustment because it does not attempt to control for differences between treated and untreated patients at the individual hospital level, where, presumably, the problem of selection bias is more potent. Although their standard multivariable models suggested that patients admitted to a neurologist were 40% less likely to die while hospitalized than patients admitted to generalists, Gillum and Johnston found that after adjusting for the institutional rate of neurologist admission, any apparent benefit had disappeared. Similar results were observed in their analyses of length of stay and cost.
In some ways, the findings of this study are more startling for the questions they raise about the presence of residual bias in observational studies using conventional multivariable methods than for the fact that generalist care was found to be as safe as neurologist care and add to a growing body of evidence suggesting that stronger methods are required to deal with residual bias in observational studies.10
Although the results largely speak for themselves and should be reassuring given that most patients with ischemic stroke in the United States are and will continue to be cared for by generalists, a number of important questions remain unanswered. First, the focus of this study was on short‐term outcomes. Because functional status and quality of life probably matter as much or more to stroke patients than in‐hospital mortality and certainly length of stay or cost, we can only hope that it is safe to extrapolate from the authors' mortality findings. Second, this study relied on data from the late 1990s, before the widespread availability of hospitalists. How generalizable the findings would be in today's environment is uncertain. On a more practical level, the authors were unable to assess the impact of formal or informal consultation by a neurologist. If this played a significant role (a reasonable assumption, I think), this would have blurred any distinction between the 2 physician groups. For this reason one cannot draw any conclusions about a more pragmatic questionthe necessity or benefit of neurologist consultation in patients with ischemic stroke.
Looking ahead, researchers hoping to improve the outcomes of patients with acute ischemic stroke should focus on developing novel models of collaboration between hospitalists and neurologists, instead of simply trying to prove that a neurologist should take care of a patient suffering a stroke alone versus a hospitalist without help from a neurologist. We also should recognize that the use of protocols and checklists or leveraging information technology investments may provide clinical decision support that improves care more than just consulting a specialist or having them care for the patient.
- ,,,.Treatment and outcomes of acute myocardial infarction among patients of cardiologists and generalist physicians.Arch Intern Med.1997;157:2570–2576.
- ,,,,,.Physician staffing patterns and clinical outcomes in critically ill patients: a systematic review.JAMA.2002;288:2151–2162.
- ,,, et al.A comparison of outcomes resulting from generalist vs specialist care for a single discrete medical condition: a systematic review and methodologic critique.Arch Intern Med.2007;167:10–20.
- ,,, et al.Implementation of a voluntary hospitalist service at a community teaching hospital: improved clinical efficiency and patient outcomes.Ann Intern Med.2002;137:859–865.
- ,,, et al.A comparison of two hospitalist models with traditional care in a community teaching hospital.Am J Med.2005;118:536–543.
- ,,,,,.Associations with reduced length of stay and costs on an academic hospitalist service.Am J Manag Care.2004;10:561–568.
- ,,,,,.Outcomes of care by hospitalists, general internists, and family physicians. [see comment].N Engl J Med.2007;357:2589–2600.
- ,,, et al.Reorganizing an academic medical service: impact on cost, quality, patient satisfaction, and education.JAMA.1998;279:1560–1565.
- ,.Influence of physician specialty on outcomes after acute ischemic stroke.J Hosp Med2008;3:184–192.
- ,,,,,.Analysis of observational studies in the presence of treatment selection bias: effects of invasive cardiac management on AMI survival using propensity score and instrumental variable methods.JAMA.2007;297:278–285.