User login
Case Report
A 26‐year‐old woman presented with a 1‐week history of epigastric and left upper quadrant pain associated with nausea and vomiting. She also described 3 weeks of constant substernal chest pain, dyspnea, and decreased exercise tolerance.
Her medical history was significant for a pituitary macroadenoma diagnosed 6 years previously that had been treated with cabergoline. She had a miscarriage 7 years ago but gave birth to a healthy child 5 months prior to admission. She had smoked 2 cigarettes per day for the last 7 years. She denied alcohol or illicit drug use. Her mother had sickle cell trait.
On admission, her heart rate was 112 beats/minute, blood pressure was 110/80 mm Hg, and respiratory rate was 26 per minute. Jugular venous distension was not appreciated. She had decreased breath sounds over the right lung base. The apical impulse was palpated in the left sixth intercostal space 1 cm lateral to the midclavicular line, and a 2/6 holosystolic murmur was auscultated at the left lower sternal border. No other murmurs or S3 or S4 gallop could be appreciated. There were no vascular or immunological phenomena suggestive of infective endocarditis. She had abdominal tenderness in the epigastrium and bilateral upper quadrants. There was no lower extremity edema, and the extremities were well perfused.
Complete blood count, electrolytes, and liver, renal, and coagulation profiles were normal. Her chest x‐ray revealed cardiomegaly and bilateral pleural effusions. EKG showed sinus tachycardia and nonspecific T‐wave changes. To further evaluate her abdominal pain, a CT scan of the abdomen and pelvis (Fig. 1) was ordered. This revealed a 3 by 1.8 cm splenic infarct. Because of her respiratory symptoms and tachycardia, a pulmonary embolism was suspected but was ruled out with a CT angiogram of the chest.
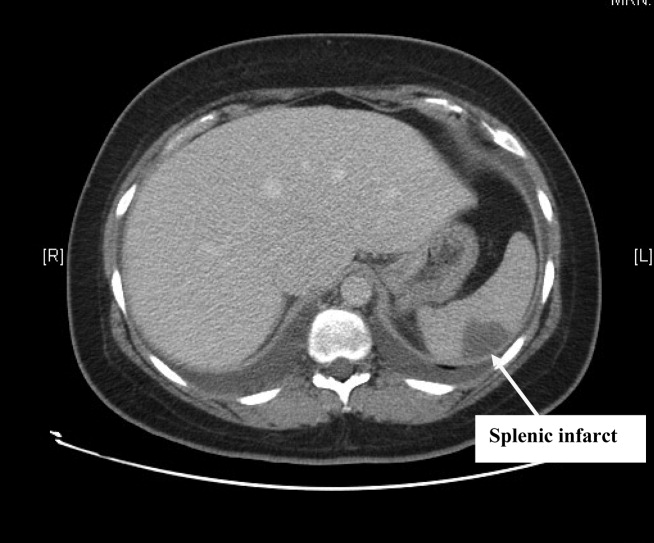
She was diagnosed with new‐onset heart failure and a splenic infarct. However, it was unclear if the 2 problems were linked. Possible etiologies of the splenic infarct included thrombus from hypercoagulable state (given her prior miscarriage, postpartum state), infarct from hemoglobinopathy (given her family history), septic emboli from infective endocarditis, and peripartum cardiomyopathy associated with embolism to the spleen.
Pain control, empiric antibiotics, and intravenous diuretics were started. Twelve hours later, the patient's dyspnea and chest pain resolved. Her blood culture results were negative, and hemoglobin electrophoresis was normal. Results of a hypercoagulable workup for an arterial thrombus that included lupus anticoagulant, anticardiolipin antibodies, and antibodies to 2‐glycoprotein‐I were negative. The echocardiogram (Fig. 2) showed a dilated left ventricle with an ejection fraction (EF) of 10%15%, normal valvular morphology without vegetations, moderate mitral and tricuspid regurgitation, and a 1‐cm left ventricular thrombus and 3 small adjacent thrombi.
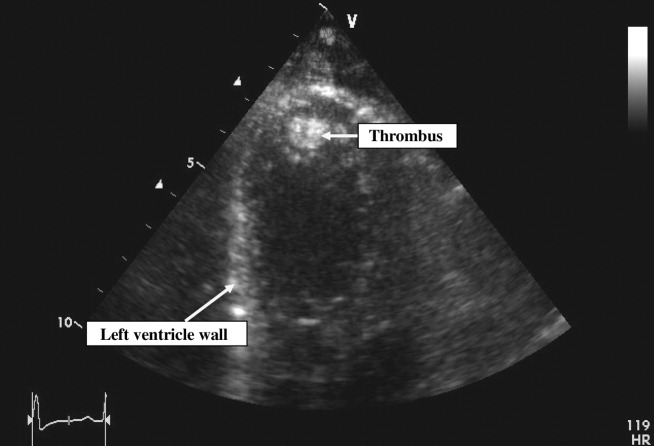
Based on the echocardiographic data, recent pregnancy, and absence of other risk factors for heart failure, a diagnosis was made of peripartum cardiomyopathy with left ventricular thrombi and subsequent embolization to the spleen.
Standard heart failure therapy including diuretics, beta‐blockers, and angiotensin‐converting enzyme inhibitors and anticoagulation with warfarin were started. Within 24 hours, the patient was asymptomatic except for minimal abdominal pain. The patient was discharged home in a stable condition the following day. At her outpatient follow‐up 3 months later, she was well compensated and asymptomatic.
DISCUSSION
Using the search terms peripartum cardiomyopathy, cardiomyopathy, thromboembolism, and postpartum period, we performed a MEDLINE search of the English literature from 1950 to 2007. We did not find any reported cases of splenic infarction complicating peripartum cardiomyopathy.
Peripartum cardiomyopathy (PPCM) is a form of dilated cardiomyopathy that occurs as a complication of pregnancy. It can present with heart failure in the last month of pregnancy or within 5 months after delivery.1, 2 The incidence of PPCM is unknown but has been estimated at 1 in 30004000 live births.3
Our patient met the criteria for PPCM as set forth by the National Heart, Lung, and Blood Institute (NHLBI), in conjunction with the Office of Rare Disease of the National Institutes of Health in April 1997.3 To establish a diagnosis of PPCM, 4 criteria have to be met:
-
Development of heart failure in the last month of pregnancy or within 5 months after delivery;
-
Absence of an identifiable cause of heart failure;
-
Absence of recognizable heart disease prior to the last month of pregnancy; and
-
Left ventricular systolic dysfunction demonstrated by echocardiographic variables such as depressed shortening fraction or left ventricular ejection fraction < 45%.
Thromboembolism has been reported with an incidence of 4% to 30% in peripartum cardiomyopathy.4 In our literature review, we found several case reports of thromboembolic phenomena complicating peripartum cardiomyopathy. These included lower extremity arterial thromboembolism with compromised circulation,5 cerebral embolism,6 and acute myocardial infarction secondary to coronary artery embolism.7 This is the first reported case of splenic artery embolization leading to splenic infarct as a complication of peripartum cardiomyopathy.
Because of the high risk of thromboembolism, the NHLBI recommends that anticoagulation be added to the standard heart failure treatment of PPCM patients with an ejection fraction of less than 35%,3 although there are no prospective randomized clinical trial data to support this recommendation. For anticoagulation, heparin is generally used in the antepartum period and warfarin in the postpartum period. It has been recommended that anticoagulation be continued for as long as the cardiomegaly persists.1
In addition to anticoagulation for PPCM patients with an EF < 35%, standard heart failure therapy includes salt restriction, diuretics, and beta‐blockers. Angiotensin‐converting enzyme inhibitors can be teratogenic during pregnancy but can be used after delivery. Hydralazine can be used safely during pregnancy as an alternative to angiotensin‐converting enzyme inhibitors. Patients failing maximal medical management may be candidates for cardiac transplantation.
Recommendations regarding subsequent pregnancies seem related to the return of ventricular size and function. Patients whose heart size does not return to normal should be strongly advised to avoid future pregnancies.2, 3 Patients who recover ventricular function may have deterioration of left ventricular function with future pregnancies.8 They should be counseled about the risk and closely monitored for development of heart failure if they become pregnant again.
- ,.Peripartum cardiomyopathy.Circulation.1971;44:964–968.
- ,,, et al.Natural course of peripartum cardiomyopathy.Circulation.1971;44:1053–1061.
- ,,, et al.Peripartum Cardiomyopathy. National Heart, Lung, and Blood Institute and Office of Rare Diseases (National Institutes of Health) Workshop Recommendations and Review.JAMA.2000;283:1183–1188.
- .Peripartum cardiomyopathy.N Engl J Med.1985;312:1432–1437.
- ,,, et al.Peripartum cardiomyopathy presenting as lower extremity arterial thromboembolism.J Reprod Med.2000;45:351–353.
- ,,, et al.Cerebral embolism as the initial manifestation of peripartum cardiomyopathy.Neurology.1982;32:668–671.
- ,,, et al.Peripartum cardiomyopathy presenting as an acute myocardial infarction.Mayo Clin Proc.2002;77:500–501.
- ,,, et al.Recurrent peripartum cardiomyopathy.Eur J Obstet Gynecol Reprod Biol.1998;76:29–30.
A 26‐year‐old woman presented with a 1‐week history of epigastric and left upper quadrant pain associated with nausea and vomiting. She also described 3 weeks of constant substernal chest pain, dyspnea, and decreased exercise tolerance.
Her medical history was significant for a pituitary macroadenoma diagnosed 6 years previously that had been treated with cabergoline. She had a miscarriage 7 years ago but gave birth to a healthy child 5 months prior to admission. She had smoked 2 cigarettes per day for the last 7 years. She denied alcohol or illicit drug use. Her mother had sickle cell trait.
On admission, her heart rate was 112 beats/minute, blood pressure was 110/80 mm Hg, and respiratory rate was 26 per minute. Jugular venous distension was not appreciated. She had decreased breath sounds over the right lung base. The apical impulse was palpated in the left sixth intercostal space 1 cm lateral to the midclavicular line, and a 2/6 holosystolic murmur was auscultated at the left lower sternal border. No other murmurs or S3 or S4 gallop could be appreciated. There were no vascular or immunological phenomena suggestive of infective endocarditis. She had abdominal tenderness in the epigastrium and bilateral upper quadrants. There was no lower extremity edema, and the extremities were well perfused.
Complete blood count, electrolytes, and liver, renal, and coagulation profiles were normal. Her chest x‐ray revealed cardiomegaly and bilateral pleural effusions. EKG showed sinus tachycardia and nonspecific T‐wave changes. To further evaluate her abdominal pain, a CT scan of the abdomen and pelvis (Fig. 1) was ordered. This revealed a 3 by 1.8 cm splenic infarct. Because of her respiratory symptoms and tachycardia, a pulmonary embolism was suspected but was ruled out with a CT angiogram of the chest.
She was diagnosed with new‐onset heart failure and a splenic infarct. However, it was unclear if the 2 problems were linked. Possible etiologies of the splenic infarct included thrombus from hypercoagulable state (given her prior miscarriage, postpartum state), infarct from hemoglobinopathy (given her family history), septic emboli from infective endocarditis, and peripartum cardiomyopathy associated with embolism to the spleen.
Pain control, empiric antibiotics, and intravenous diuretics were started. Twelve hours later, the patient's dyspnea and chest pain resolved. Her blood culture results were negative, and hemoglobin electrophoresis was normal. Results of a hypercoagulable workup for an arterial thrombus that included lupus anticoagulant, anticardiolipin antibodies, and antibodies to 2‐glycoprotein‐I were negative. The echocardiogram (Fig. 2) showed a dilated left ventricle with an ejection fraction (EF) of 10%15%, normal valvular morphology without vegetations, moderate mitral and tricuspid regurgitation, and a 1‐cm left ventricular thrombus and 3 small adjacent thrombi.
Based on the echocardiographic data, recent pregnancy, and absence of other risk factors for heart failure, a diagnosis was made of peripartum cardiomyopathy with left ventricular thrombi and subsequent embolization to the spleen.
Standard heart failure therapy including diuretics, beta‐blockers, and angiotensin‐converting enzyme inhibitors and anticoagulation with warfarin were started. Within 24 hours, the patient was asymptomatic except for minimal abdominal pain. The patient was discharged home in a stable condition the following day. At her outpatient follow‐up 3 months later, she was well compensated and asymptomatic.
DISCUSSION
Using the search terms peripartum cardiomyopathy, cardiomyopathy, thromboembolism, and postpartum period, we performed a MEDLINE search of the English literature from 1950 to 2007. We did not find any reported cases of splenic infarction complicating peripartum cardiomyopathy.
Peripartum cardiomyopathy (PPCM) is a form of dilated cardiomyopathy that occurs as a complication of pregnancy. It can present with heart failure in the last month of pregnancy or within 5 months after delivery.1, 2 The incidence of PPCM is unknown but has been estimated at 1 in 30004000 live births.3
Our patient met the criteria for PPCM as set forth by the National Heart, Lung, and Blood Institute (NHLBI), in conjunction with the Office of Rare Disease of the National Institutes of Health in April 1997.3 To establish a diagnosis of PPCM, 4 criteria have to be met:
-
Development of heart failure in the last month of pregnancy or within 5 months after delivery;
-
Absence of an identifiable cause of heart failure;
-
Absence of recognizable heart disease prior to the last month of pregnancy; and
-
Left ventricular systolic dysfunction demonstrated by echocardiographic variables such as depressed shortening fraction or left ventricular ejection fraction < 45%.
Thromboembolism has been reported with an incidence of 4% to 30% in peripartum cardiomyopathy.4 In our literature review, we found several case reports of thromboembolic phenomena complicating peripartum cardiomyopathy. These included lower extremity arterial thromboembolism with compromised circulation,5 cerebral embolism,6 and acute myocardial infarction secondary to coronary artery embolism.7 This is the first reported case of splenic artery embolization leading to splenic infarct as a complication of peripartum cardiomyopathy.
Because of the high risk of thromboembolism, the NHLBI recommends that anticoagulation be added to the standard heart failure treatment of PPCM patients with an ejection fraction of less than 35%,3 although there are no prospective randomized clinical trial data to support this recommendation. For anticoagulation, heparin is generally used in the antepartum period and warfarin in the postpartum period. It has been recommended that anticoagulation be continued for as long as the cardiomegaly persists.1
In addition to anticoagulation for PPCM patients with an EF < 35%, standard heart failure therapy includes salt restriction, diuretics, and beta‐blockers. Angiotensin‐converting enzyme inhibitors can be teratogenic during pregnancy but can be used after delivery. Hydralazine can be used safely during pregnancy as an alternative to angiotensin‐converting enzyme inhibitors. Patients failing maximal medical management may be candidates for cardiac transplantation.
Recommendations regarding subsequent pregnancies seem related to the return of ventricular size and function. Patients whose heart size does not return to normal should be strongly advised to avoid future pregnancies.2, 3 Patients who recover ventricular function may have deterioration of left ventricular function with future pregnancies.8 They should be counseled about the risk and closely monitored for development of heart failure if they become pregnant again.
- ,.Peripartum cardiomyopathy.Circulation.1971;44:964–968.
- ,,, et al.Natural course of peripartum cardiomyopathy.Circulation.1971;44:1053–1061.
- ,,, et al.Peripartum Cardiomyopathy. National Heart, Lung, and Blood Institute and Office of Rare Diseases (National Institutes of Health) Workshop Recommendations and Review.JAMA.2000;283:1183–1188.
- .Peripartum cardiomyopathy.N Engl J Med.1985;312:1432–1437.
- ,,, et al.Peripartum cardiomyopathy presenting as lower extremity arterial thromboembolism.J Reprod Med.2000;45:351–353.
- ,,, et al.Cerebral embolism as the initial manifestation of peripartum cardiomyopathy.Neurology.1982;32:668–671.
- ,,, et al.Peripartum cardiomyopathy presenting as an acute myocardial infarction.Mayo Clin Proc.2002;77:500–501.
- ,,, et al.Recurrent peripartum cardiomyopathy.Eur J Obstet Gynecol Reprod Biol.1998;76:29–30.

Increasing Severity of Status Asthmaticus
Status asthmaticus, although a relatively infrequent cause of admission to the intensive care unit, carries a significant risk of mortality and complications of critical care.1 Asthma prevalence has risen,2 and recent data have suggested an improvement in overall mortality.3 Yet there may remain a subgroup of patients with the most severe asthma in whom this outcome benefit may not be seen. Asthma severity and mortality may be concentrated in certain urban areas, and there may even be disparities within cities. One recent study found a trend toward fewer and less severe presentations of ICU patients with status asthmaticus.4 Our clinical experience in an urban hospital suggested otherwise, and we undertook an examination of status asthmaticus and compared these data with those of our previously published experience at this center.5
MATERIALS AND METHODS
A retrospective review was performed of all patients with status asthmaticus admitted to the medical intensive care unit (MICU) of St. Luke's Hospital during the 5‐year period January 2002 through December 2006. St. Luke's Hospital is a university‐affiliated hospital in New York City. Patients were identified by discharge diagnosis of status asthmaticus through a computerized medical record database. Demographic data, initial presentation data, MICU course, and outcome were collected. Results were compared to our previous study during the 5‐year period 19951999 at this institution.5 Data are presented as means standard deviations.
The means of the groups were compared using the Student t test.
RESULTS
There were 89 MICU admissions for status asthmaticus; the records of 84 patients were available for review. The hospital admission rate for asthma remained stable at 1.6% of admissions during the period 20022006, compared with 1.4% of hospital admissions during the previous study period of 19951999. In the current study, 3% of asthma admissions required MICU care compared with 5% in the prior era.
Between the 2 study periods, there were no changes in MICU admission criteria or new protocols for management of status asthmaticus in the emergency department. The only difference in ICU management of intubated patients is that in the most recent study period there was an emphasis on earlier identification of patients for extubation. A new sedative, propofol, was available for ICU sedation during the current study period.
Two patients were admitted to the MICU 4 times, and 9 patients were admitted twice. Each presentation was counted as a separate admission and was analyzed individually. Seven patients (8%) had sustained a cardiopulmonary arrest prior to MICU admission. All were intubated in the field by emergency medical services. Characteristics of the patients are shown in Table 1. African American and Hispanic patients constituted 96% of the group. Half the patients were current cigarette smokers, and 30% admitted to current use of illicit drug. Fifty‐five percent of patients reported allergies (dust, pollen, pets), and 59% had previously been intubated for asthma.
| n (%) | |
|---|---|
| |
| Age ( SD)* | 44 15 |
| Sex | |
| Men | 23 (27%) |
| Women (5 pregnant) | 61 (73%) |
| Race/ethnicity | |
| African American | 46 (55%) |
| Hispanic | 35 (42%) |
| Substance use | |
| Cigarettes | 40 (51%) |
| Illicit drugs | 22 (30%) |
Status asthmaticus was associated with an upper respiratory tract infection in 54%, illicit drug use in 15%, allergies in 12%, and a recent corticosteroid taper in 8% of exacerbations. Almost all patients had used a short‐acting beta‐2 agonist, and 78% had been prescribed inhaled corticosteroids either alone or in combination. Thirty‐six percent had used oral prednisone. Nonadherence was self‐reported by 45% of patients (Table 2).
| n (%) | |
|---|---|
| |
| Medications | |
| Albuterol | 72 (91%) |
| Inhaled steroids | 22 (27%) |
| Leukotriene antagonist | 29 (36%) |
| Inhaled combination* | 41 (51%) |
| Prednisone | 29 (36%) |
| Noncompliance | 20 (45%) |
| Arterial blood gas | |
| PaCO2 (mm Hg) | 12 5 |
| APACHE II score | 12 5 |
| Chest radiograph (NAPD) | 70 (83%) |
| NIV | 10 (12%) |
Emergency department management for all patients included inhaled beta‐2 agonist therapy administered continuously, intravenous corticosteroid therapy (methylprednisolone 125 mg once), and magnesium sulfate (2 g intravenously).
Noninvasive ventilation was initiated in 10 patients (Table 2).
MICU Management
All patients in the MICU initially received aerosolized bronchodilator therapy every 1 to 2 hours and high‐dose intravenous corticosteroid therapy (40125 mg methylprednisolone every 6 hours). The standard ventilator modality was assist control and permissive hypercapnia. The tidal volume averaged 8 1.5 mL/kg, and mean respiratory rate was 12 1.7 breaths/minute. Plateau pressure and intrinsic PEEP were inconsistently recorded.
The highest PaCO2 during the first 24 hours of ventilation averaged 67 27 mm Hg and exceeded 100 mm Hg in 8 episodes; neuromuscular blockade was used in 5 of these episodes. The highest PaCO2 recorded during controlled mechanical ventilation in a patient who survived was 159 mm Hg.
Of the 10 patients who were given a trial of noninvasive ventilation (NIV), 4 subsequently required intubation. The average time on NIV before intubation was 2 hours. Patients who were intubated after a trial of NIV had a significantly higher initial PaCO2 than those who were successfully managed with NIV (Table 3). There were no deaths among patients treated with NIV. Table 4 demonstrates the main differences between patients requiring invasive ventilation and those successfully managed with noninvasive ventilation.
| NIV successful | NIV required intubation | |
|---|---|---|
| Number of patients | 6 | 4 |
| Age | 52 20 | 52 5.6 |
| Admission PaCO2 (mean) | 50 13 | 76 17 P = 0.044 |
| Admission pH (mean) | 7.33 0.09 | 7.18 0.04 P = 0.007 |
| Intubated patients | Patients managed only with NIV | |
|---|---|---|
| Number of patients | 64 | 6 |
| Age | 45 16 | 52 20 |
| Admission PaCO2 (mean) | 64 22 | 50 13 P = 0.057 |
| Admission pH (mean) | 7.2 0.15 | 7.33 0.09 P = 0.021 |
| Length of MICU stay (days) | 5.8 4.4 | 3 4.2 P = 0.012 |
| Hospital mortality | 6 | 0 |
Sedation and Neuromuscular Blockade
Propofol was used for sedation in almost all patients (97%). The addition of lorazepam was required in 27 patients (42%). Neuromuscular blockade with cisatracurium was initiated in 6 episodes after high levels of 3 sedatives (propofol, opiates, and benzodiazepines) were used for continued respiratory efforts and evidence of severe dynamic hyperinflation. These patients were younger and manifested a significantly greater degree of respiratory acidosis while receiving mechanical ventilation (Table 5). Duration of neuromuscular blockade averaged 2 days, and their use was associated with significantly longer durations of mechanical ventilation and MICU stay and a greater risk of complications. However, none of these patients died (Table 5).
| () NMB | (+) NMB | P value | |
|---|---|---|---|
| Number of patients | 58 | 6 | |
| Age | 47 15 | 24 2 | |
| Highest PaCO2 (mean) | 68 21 | 119 35 | 0.015 |
| Lowest pH (mean) | 7.18 0.14 | 6.96 0.13 | 0.007 |
| Barotrauma | 1 (2%) | 2 (33%) | |
| Myopathy | 10 (17%) | 2 (33%) | |
| Duration of MV (days) | 4 3.7 | 7.5 1.2 | 0.0001 |
| Length of MICU stay (days) | 5.3 4.3 | 10 3 | 0.007 |
| Length of hospital stay (days) | 8 6 | 14 3.4 | 0.006 |
| Mortality | 6 (10%) | 0 (0%) |
The complications of status asthmaticus are shown in Table 6. Three patients suffered barotrauma (2 patients with pneumomediastinum and 1 with pneumothorax requiring chest tube placement). MICU complications, including suspected ventilator‐associated pneumonia and catheter‐related infection, were predominantly seen in patients who required mechanical ventilation for more than 5 days. Excessive sedation was noted in 7 patients, prompting additional investigations (brain imaging and electroencephalograms).
| n (%) | |
|---|---|
| Complication | |
| Ventilator‐associated pneumonia | 14 (21%) |
| Catheter‐related infection | 7 (11%) |
| Barotrauma | 3 (3.5%) |
| Myopathy | 12 (19%) |
| Outcome | |
| Duration of MV (days) | 4.4 3.7 |
| Length of hospital stay (days) | 7.78 5.7 |
| Discharge home | 69 (82%) |
| Mortality | 6 (7%) |
Outcomes
Table 6 shows the outcomes for the patients. Duration of mechanical ventilation averaged 4.4 3.7 days. Eighty‐four percent of patients were extubated successfully. Three patients required a tracheostomy for prolonged ventilatory support. Duration of MICU stay averaged 4.8 4.2 days. Following the MICU course, only 21% of patients were seen by pulmonary specialists in the hospital, and on hospital discharge, only 45% were referred to the outpatient pulmonary specialty clinic (Table 7). Most patients (82%) were discharged home.
| Years | 19951999 | 20022006 |
|---|---|---|
| Number of admissions | 88 | 89 |
| Sex (women) | 63 (72%) | 61 (73%) |
| Pregnancy | 3 | 5 |
| Age (mean) | 45 | 44 |
| Nonwhite | 78 (90%) | 81 (97%) |
| Smoker | 27 (31%) | 40 (51%) |
| Illicit drugs | 16 (18%) | 22 (30%) |
| Initial PaCO2 (mm Hg) | 54.9 | 61 |
| Cardiopulmonary arrest prior to MICU | 6 (7%) | 7 (8%) |
| Mechanical ventilation | 75 (87%) | 64 (76%) |
| NIV | 0 | 10 (12%) |
| Highest PaCO2 (mm Hg) | 60.2 | 67 |
| Duration of MV (days) | 3 | 4.4 |
| Sedatives: propofol | 0 (0%) | 62 (97%) |
| NMB | 1 (1%) | 6 (9%) |
| Barotrauma | 5 (6%) | 3 (4%) |
| Mortality | 2 (2.3%) | 6 (7%) |
| Discharge home | 83 (95.4%) | 69 (82%) |
There were 6 deaths (7%). Three patients sustained a prolonged cardiopulmonary arrest prior to MICU admission and were determined to be brain dead. One young patient who was intubated for status asthmaticus and lobar pneumonia rapidly developed hyperthermia, rhabdomyolysis, and multiorgan failure; in addition to antibiotics to treat sepsis, empiric treatment of malignant hyperthermia was initiated. Unfortunately, autopsy was declined. Two patients died after a prolonged hospital stay complicated by nosocomial infection and multiorgan failure.
Comparison to Prior 5‐Year Period
Table 7 compares the current study to the prior 5‐year period. Demographic features and ventilator management remained stable, but we noted more use of NIV, increased use of propofol and cisatracurium, increased severity of respiratory acidosis, increased duration of ventilation, and a higher mortality rate.
DISCUSSION
We identified greater severity of status asthmaticus among patients requiring admission to our urban intensive care unit. Despite reports of improvement in outcome3 and reduction in the severity and number of MICU admissions by other investigators4 in New York City, patients with status asthmaticus admitted to the MICU suffered significant mortality and morbidity. During the recent 5‐year period, compared with the period reported in our previous report,5 these patients had greater respiratory acidosis, more frequent need for neuromuscular blockade, longer duration of mechanical ventilation, increased complications, and higher unadjusted mortality.
There remain few large series of status asthmaticus. Episodes of life‐threatening asthma occur more frequently in specific high‐risk areas. We had the benefit of a prior study in our institution in order to compare trends in status asthmaticus. With greater attention to asthma severity, treatment, access to information, and medical care, a change in demographic features may have been expected. Yet we found that noncompliance with medications and smoking and illicit drug usage increased in this recent 5‐year period compared with the prior study period. Minority populations are also at particular risk for severe asthma.6
Noninvasive ventilation has been shown to be effective in acute hypercapnic respiratory failure in patients with chronic obstructive lung disease.7, 8 A small study of asthma found that NIV was associated with a reduction in PaCO2 during the early hours of use and that mortality and complications were not increased in those who subsequently required intubation.9 However, in another study of 27 patients managed with NIV, 2 of the 5 patients requiring intubation died.10 In the 1 randomized controlled study of NIV in severe asthma, Soroksky et al. found that NIV significantly improved lung function and decreased hospitalization rate compared with the use of conventional therapy alone. The average PaCO2 and pH of these patients were 33.59 mm Hg and 7.41, respectively.11 Meduri et al. reported a small series of 17 patients with severe asthma treated with NIV, 2 of whom were subsequently intubated. The initial pH and PaCO2 of these patients averaged 7.25 and 65 mm Hg, respectively.12 In our series, NIV was used in 10 patients, 4 of whom were subsequently intubated. The average time on NIV before intubation was 2 hours, and there were no deaths in this group. Patients who were intubated after NIV had a statistically significant lower pH (7.17) and higher PaCO2 (76 mm Hg) on admission than those who were successfully managed with NIV, with the pH and PaCO2 of the latter group 7.32 and 50 mm Hg, respectively.
Improvement in mortality of status asthmaticus over the past decades has been attributed to improved ventilatory strategy using permissive hypercapnia. This approach has been credited with a decrease in barotrauma, hemodynamic instability, and mortality.5, 13 The latter complications were mainly a result of the dynamic hyperinflation found in patients with severe asthma. Decreasing the respiratory rate and tidal volume as well as increasing the inspiratory flow rate will lead to an increase in expiratory time and will subsequently decrease the dynamic hyperinflation. With this approach, hypercapnia may occur. Hypercapnia (PaCO2 level up to 90 mm Hg) is generally well tolerated when oxygenation is maintained.14 Sedation is crucial to achieving optimal ventilation. Because of its short duration of action and bronchodilator effects,15, 16 propofol was the main sedative used in our MICU. Additional sedatives were required for half our patients. A prolonged sedative effect was noted in several cases, which prompted additional neurologic evaluation. It is conceivable that higher doses of sedatives are required for ventilatory control of young patients with a strong respiratory drive.
The administration of therapeutic paralysis is generally avoided in patients with status asthmaticus treated concurrently with corticosteroids. Myopathy may develop in the setting of neuromuscular blockade and corticosteroid administration and prolong ventilatory failure.17 In our earlier series, only 1 patient received a paralytic agent; in the current series, neuromuscular paralysis was needed in 6 episodes despite maximum sedative infusion. Patients requiring neuromuscular blockade were younger and had a significantly lower pH and higher PaCO2 than did those not receiving neuromuscular blockade. These patients developed more complications, including prolonged weakness, supporting the general approach of avoiding paralytic use unless absolutely necessary. It is noteworthy that despite this greater degree of respiratory failure and subsequent ICU complications, no patients in this group died.
The median duration of mechanical ventilation was 4.4 days. Complications included ventilator‐associated pneumonia, catheter‐related infection, excessive sedation, and prolonged weakness. These events occurred primarily in patients who received paralytics and patients whose mechanical ventilation was prolonged. The average duration of mechanical ventilation for patients who had ventilator‐associated pneumonia and catheter‐related infection was 22 and 31 days, respectively.
Status asthmaticus in pregnancy deserves special attention, and its course has not been well described in the literature. We report finding that in the current study period there were 5 pregnant patients requiring ICU management for status asthmaticus, all with dramatic degrees of hypercapnia and acidosis during controlled mechanical ventilation; the highest PaCO2 and lowest pH averaged 101 mm Hg and 7.06, respectively. Management of status asthmaticus in pregnancy is no different than in nonpregnant individuals, but there are concerns about the effects of hypercapnia and acidosis on the fetus.18 In all 4 patients who delivered, the pregnancies resulted in healthy babies. In the 1 patient who suffered a pneumomediastinum during early labor, the decision was made for cesarean delivery because of concerns about potential worsening of the barotrauma and maternal cardiopulmonary condition. This patient did not require intubation prior to or during the cesarean delivery. Collaboration with the obstetrician is essential in the management of these cases.
Despite advances in ventilator management and critical care, there remains a mortality risk in patients with status asthmaticus.17, 19, 20 In our study, 6 patients (7%) died; 3 patients died after suffering pre‐MICU cardiac arrest, and 3 patients died of multiorgan failure. Regular asthma clinic follow‐up, to include counseling about smoking cessation and illicit drugs, is essential. Unfortunately, only 45% of our patients had specialty clinic referral on discharge. Lack of patient understanding of their illness may also complicate their care, as demonstrated by nonadherence to medication and medical appointments. Five of our patients left against medical advice, 4 of them within a day of extubation.
Our study had several limitations. Patients were identified based on admission diagnosis by the attending physician; the coexistence of chronic obstructive pulmonary disease could not always be definitely excluded. However, all patients had a prior diagnosis of asthma and had been treated for asthma. The young age of the patient group is consistent with that reported in the literature.
It is difficult to compare studies of status asthmaticus, given the dynamic nature of the airways disease and individual clinician judgments about intubation and extubation. We believe that longer duration of ventilation reflects more severe asthma, especially in this time when clinicians attempt noninvasive ventilation and daily trials of spontaneous breathing for earlier extubation.
In conclusion, this report describes an increase in the severity of status asthmaticus in patients admitted to an urban MICU. The reason for the increase in severity compared to our previous study is uncertain. Possible factors include: cigarette and substance use, refractoriness to therapy because of environment or smoking, inadequate medical care, poor understanding of illness, and adherence to therapy. As the ICU management is supportive, the best approach is prevention, targeting at‐risk minority populations with education, counseling for smoking and drug cessation, and specialty care. Once status asthmaticus has developed, a careful, limited trial of NIV in selected patients may offer benefits in the management of ventilatory failure and avoidance of ICU complications.
- ,,, et al.Characteristics and outcome for admissions to adult, general critical care units with acute severe asthma: a secondary analysis of the ICNARC case mix programmed database.Crit Care.2004;8:R112–R121.
- ,,.The asthma epidemic.N Engl J Med.2006;355:2226–2235.
- ,,, et al.Clinical review: severe asthma.Crit Care.2002;6:30–44.
- ,.Evolving differences in the presentation of severe asthma requiring intensive care unit admission.Respiration.2004;71:458–462.
- ,.Status asthmaticus: a large MICU experience.Clin Intensive Care.2002;13:89–93.
- ,.Health care disparities in critical illness.Clin Chest Med.2006;27:473–486.
- ,,, et al.Randomized controlled trial of nasal ventilation in acute ventilatory failure due to chronic obstructive airways disease.Lancet.1993;341:1555–1557.
- ,,, et al.Randomized, prospective trial of noninvasive positive pressure ventilation in acute respiratory failure.Am J Respir Crit Care Med.1995;151:1799–806.
- ,.Acute asthma in adults.Chest.2004;125:1081–1102.
- ,,.Clinical course and outcomes of patients admitted to an ICU for status asthmaticus.Chest.2001;120:1616–1621.
- ,,.A pilot prospective, randomized, placebo‐controlled trial of bilevel positive airway pressure in acute asthma attack.Chest.2003;123:1018–1025.
- ,,, et al.Noninvasive positive pressure ventilation in status asthmaticus.Chest.1996;110:767–774.
- ,.Mechanical controlled hypoventilation in status asthmaticus.Am Rev Respir Dis.1984;129:385–387.
- .Permissive hypercapnic ventilation.Am J Respir Crit Care Med.1994;146:607–615.
- ,,.Anaesthetic management in asthma.Minerva Anestesiol.2006.
- ,,, et al.Propofol induces bronchodilation in a patient mechanically ventilated for status asthmaticus.Intensive Care Med.1993;19:305.
- .Intensive care management of status asthmaticus.Chest.2001;120:1439–1441.
- ,.Acute asthma in pregnancy.Crit Care Med.2005;33:S319–S324.
- ,,, et al.Mechanical ventilation in patients with acute severe asthma.Am J Med.1990;89:42–48.
- ,,, et al.Mortality in patients hospitalized for asthma exacerbations in the United States.Am J Respir Crit Care Med.2006;174:633–638.
Status asthmaticus, although a relatively infrequent cause of admission to the intensive care unit, carries a significant risk of mortality and complications of critical care.1 Asthma prevalence has risen,2 and recent data have suggested an improvement in overall mortality.3 Yet there may remain a subgroup of patients with the most severe asthma in whom this outcome benefit may not be seen. Asthma severity and mortality may be concentrated in certain urban areas, and there may even be disparities within cities. One recent study found a trend toward fewer and less severe presentations of ICU patients with status asthmaticus.4 Our clinical experience in an urban hospital suggested otherwise, and we undertook an examination of status asthmaticus and compared these data with those of our previously published experience at this center.5
MATERIALS AND METHODS
A retrospective review was performed of all patients with status asthmaticus admitted to the medical intensive care unit (MICU) of St. Luke's Hospital during the 5‐year period January 2002 through December 2006. St. Luke's Hospital is a university‐affiliated hospital in New York City. Patients were identified by discharge diagnosis of status asthmaticus through a computerized medical record database. Demographic data, initial presentation data, MICU course, and outcome were collected. Results were compared to our previous study during the 5‐year period 19951999 at this institution.5 Data are presented as means standard deviations.
The means of the groups were compared using the Student t test.
RESULTS
There were 89 MICU admissions for status asthmaticus; the records of 84 patients were available for review. The hospital admission rate for asthma remained stable at 1.6% of admissions during the period 20022006, compared with 1.4% of hospital admissions during the previous study period of 19951999. In the current study, 3% of asthma admissions required MICU care compared with 5% in the prior era.
Between the 2 study periods, there were no changes in MICU admission criteria or new protocols for management of status asthmaticus in the emergency department. The only difference in ICU management of intubated patients is that in the most recent study period there was an emphasis on earlier identification of patients for extubation. A new sedative, propofol, was available for ICU sedation during the current study period.
Two patients were admitted to the MICU 4 times, and 9 patients were admitted twice. Each presentation was counted as a separate admission and was analyzed individually. Seven patients (8%) had sustained a cardiopulmonary arrest prior to MICU admission. All were intubated in the field by emergency medical services. Characteristics of the patients are shown in Table 1. African American and Hispanic patients constituted 96% of the group. Half the patients were current cigarette smokers, and 30% admitted to current use of illicit drug. Fifty‐five percent of patients reported allergies (dust, pollen, pets), and 59% had previously been intubated for asthma.
| n (%) | |
|---|---|
| |
| Age ( SD)* | 44 15 |
| Sex | |
| Men | 23 (27%) |
| Women (5 pregnant) | 61 (73%) |
| Race/ethnicity | |
| African American | 46 (55%) |
| Hispanic | 35 (42%) |
| Substance use | |
| Cigarettes | 40 (51%) |
| Illicit drugs | 22 (30%) |
Status asthmaticus was associated with an upper respiratory tract infection in 54%, illicit drug use in 15%, allergies in 12%, and a recent corticosteroid taper in 8% of exacerbations. Almost all patients had used a short‐acting beta‐2 agonist, and 78% had been prescribed inhaled corticosteroids either alone or in combination. Thirty‐six percent had used oral prednisone. Nonadherence was self‐reported by 45% of patients (Table 2).
| n (%) | |
|---|---|
| |
| Medications | |
| Albuterol | 72 (91%) |
| Inhaled steroids | 22 (27%) |
| Leukotriene antagonist | 29 (36%) |
| Inhaled combination* | 41 (51%) |
| Prednisone | 29 (36%) |
| Noncompliance | 20 (45%) |
| Arterial blood gas | |
| PaCO2 (mm Hg) | 12 5 |
| APACHE II score | 12 5 |
| Chest radiograph (NAPD) | 70 (83%) |
| NIV | 10 (12%) |
Emergency department management for all patients included inhaled beta‐2 agonist therapy administered continuously, intravenous corticosteroid therapy (methylprednisolone 125 mg once), and magnesium sulfate (2 g intravenously).
Noninvasive ventilation was initiated in 10 patients (Table 2).
MICU Management
All patients in the MICU initially received aerosolized bronchodilator therapy every 1 to 2 hours and high‐dose intravenous corticosteroid therapy (40125 mg methylprednisolone every 6 hours). The standard ventilator modality was assist control and permissive hypercapnia. The tidal volume averaged 8 1.5 mL/kg, and mean respiratory rate was 12 1.7 breaths/minute. Plateau pressure and intrinsic PEEP were inconsistently recorded.
The highest PaCO2 during the first 24 hours of ventilation averaged 67 27 mm Hg and exceeded 100 mm Hg in 8 episodes; neuromuscular blockade was used in 5 of these episodes. The highest PaCO2 recorded during controlled mechanical ventilation in a patient who survived was 159 mm Hg.
Of the 10 patients who were given a trial of noninvasive ventilation (NIV), 4 subsequently required intubation. The average time on NIV before intubation was 2 hours. Patients who were intubated after a trial of NIV had a significantly higher initial PaCO2 than those who were successfully managed with NIV (Table 3). There were no deaths among patients treated with NIV. Table 4 demonstrates the main differences between patients requiring invasive ventilation and those successfully managed with noninvasive ventilation.
| NIV successful | NIV required intubation | |
|---|---|---|
| Number of patients | 6 | 4 |
| Age | 52 20 | 52 5.6 |
| Admission PaCO2 (mean) | 50 13 | 76 17 P = 0.044 |
| Admission pH (mean) | 7.33 0.09 | 7.18 0.04 P = 0.007 |
| Intubated patients | Patients managed only with NIV | |
|---|---|---|
| Number of patients | 64 | 6 |
| Age | 45 16 | 52 20 |
| Admission PaCO2 (mean) | 64 22 | 50 13 P = 0.057 |
| Admission pH (mean) | 7.2 0.15 | 7.33 0.09 P = 0.021 |
| Length of MICU stay (days) | 5.8 4.4 | 3 4.2 P = 0.012 |
| Hospital mortality | 6 | 0 |
Sedation and Neuromuscular Blockade
Propofol was used for sedation in almost all patients (97%). The addition of lorazepam was required in 27 patients (42%). Neuromuscular blockade with cisatracurium was initiated in 6 episodes after high levels of 3 sedatives (propofol, opiates, and benzodiazepines) were used for continued respiratory efforts and evidence of severe dynamic hyperinflation. These patients were younger and manifested a significantly greater degree of respiratory acidosis while receiving mechanical ventilation (Table 5). Duration of neuromuscular blockade averaged 2 days, and their use was associated with significantly longer durations of mechanical ventilation and MICU stay and a greater risk of complications. However, none of these patients died (Table 5).
| () NMB | (+) NMB | P value | |
|---|---|---|---|
| Number of patients | 58 | 6 | |
| Age | 47 15 | 24 2 | |
| Highest PaCO2 (mean) | 68 21 | 119 35 | 0.015 |
| Lowest pH (mean) | 7.18 0.14 | 6.96 0.13 | 0.007 |
| Barotrauma | 1 (2%) | 2 (33%) | |
| Myopathy | 10 (17%) | 2 (33%) | |
| Duration of MV (days) | 4 3.7 | 7.5 1.2 | 0.0001 |
| Length of MICU stay (days) | 5.3 4.3 | 10 3 | 0.007 |
| Length of hospital stay (days) | 8 6 | 14 3.4 | 0.006 |
| Mortality | 6 (10%) | 0 (0%) |
The complications of status asthmaticus are shown in Table 6. Three patients suffered barotrauma (2 patients with pneumomediastinum and 1 with pneumothorax requiring chest tube placement). MICU complications, including suspected ventilator‐associated pneumonia and catheter‐related infection, were predominantly seen in patients who required mechanical ventilation for more than 5 days. Excessive sedation was noted in 7 patients, prompting additional investigations (brain imaging and electroencephalograms).
| n (%) | |
|---|---|
| Complication | |
| Ventilator‐associated pneumonia | 14 (21%) |
| Catheter‐related infection | 7 (11%) |
| Barotrauma | 3 (3.5%) |
| Myopathy | 12 (19%) |
| Outcome | |
| Duration of MV (days) | 4.4 3.7 |
| Length of hospital stay (days) | 7.78 5.7 |
| Discharge home | 69 (82%) |
| Mortality | 6 (7%) |
Outcomes
Table 6 shows the outcomes for the patients. Duration of mechanical ventilation averaged 4.4 3.7 days. Eighty‐four percent of patients were extubated successfully. Three patients required a tracheostomy for prolonged ventilatory support. Duration of MICU stay averaged 4.8 4.2 days. Following the MICU course, only 21% of patients were seen by pulmonary specialists in the hospital, and on hospital discharge, only 45% were referred to the outpatient pulmonary specialty clinic (Table 7). Most patients (82%) were discharged home.
| Years | 19951999 | 20022006 |
|---|---|---|
| Number of admissions | 88 | 89 |
| Sex (women) | 63 (72%) | 61 (73%) |
| Pregnancy | 3 | 5 |
| Age (mean) | 45 | 44 |
| Nonwhite | 78 (90%) | 81 (97%) |
| Smoker | 27 (31%) | 40 (51%) |
| Illicit drugs | 16 (18%) | 22 (30%) |
| Initial PaCO2 (mm Hg) | 54.9 | 61 |
| Cardiopulmonary arrest prior to MICU | 6 (7%) | 7 (8%) |
| Mechanical ventilation | 75 (87%) | 64 (76%) |
| NIV | 0 | 10 (12%) |
| Highest PaCO2 (mm Hg) | 60.2 | 67 |
| Duration of MV (days) | 3 | 4.4 |
| Sedatives: propofol | 0 (0%) | 62 (97%) |
| NMB | 1 (1%) | 6 (9%) |
| Barotrauma | 5 (6%) | 3 (4%) |
| Mortality | 2 (2.3%) | 6 (7%) |
| Discharge home | 83 (95.4%) | 69 (82%) |
There were 6 deaths (7%). Three patients sustained a prolonged cardiopulmonary arrest prior to MICU admission and were determined to be brain dead. One young patient who was intubated for status asthmaticus and lobar pneumonia rapidly developed hyperthermia, rhabdomyolysis, and multiorgan failure; in addition to antibiotics to treat sepsis, empiric treatment of malignant hyperthermia was initiated. Unfortunately, autopsy was declined. Two patients died after a prolonged hospital stay complicated by nosocomial infection and multiorgan failure.
Comparison to Prior 5‐Year Period
Table 7 compares the current study to the prior 5‐year period. Demographic features and ventilator management remained stable, but we noted more use of NIV, increased use of propofol and cisatracurium, increased severity of respiratory acidosis, increased duration of ventilation, and a higher mortality rate.
DISCUSSION
We identified greater severity of status asthmaticus among patients requiring admission to our urban intensive care unit. Despite reports of improvement in outcome3 and reduction in the severity and number of MICU admissions by other investigators4 in New York City, patients with status asthmaticus admitted to the MICU suffered significant mortality and morbidity. During the recent 5‐year period, compared with the period reported in our previous report,5 these patients had greater respiratory acidosis, more frequent need for neuromuscular blockade, longer duration of mechanical ventilation, increased complications, and higher unadjusted mortality.
There remain few large series of status asthmaticus. Episodes of life‐threatening asthma occur more frequently in specific high‐risk areas. We had the benefit of a prior study in our institution in order to compare trends in status asthmaticus. With greater attention to asthma severity, treatment, access to information, and medical care, a change in demographic features may have been expected. Yet we found that noncompliance with medications and smoking and illicit drug usage increased in this recent 5‐year period compared with the prior study period. Minority populations are also at particular risk for severe asthma.6
Noninvasive ventilation has been shown to be effective in acute hypercapnic respiratory failure in patients with chronic obstructive lung disease.7, 8 A small study of asthma found that NIV was associated with a reduction in PaCO2 during the early hours of use and that mortality and complications were not increased in those who subsequently required intubation.9 However, in another study of 27 patients managed with NIV, 2 of the 5 patients requiring intubation died.10 In the 1 randomized controlled study of NIV in severe asthma, Soroksky et al. found that NIV significantly improved lung function and decreased hospitalization rate compared with the use of conventional therapy alone. The average PaCO2 and pH of these patients were 33.59 mm Hg and 7.41, respectively.11 Meduri et al. reported a small series of 17 patients with severe asthma treated with NIV, 2 of whom were subsequently intubated. The initial pH and PaCO2 of these patients averaged 7.25 and 65 mm Hg, respectively.12 In our series, NIV was used in 10 patients, 4 of whom were subsequently intubated. The average time on NIV before intubation was 2 hours, and there were no deaths in this group. Patients who were intubated after NIV had a statistically significant lower pH (7.17) and higher PaCO2 (76 mm Hg) on admission than those who were successfully managed with NIV, with the pH and PaCO2 of the latter group 7.32 and 50 mm Hg, respectively.
Improvement in mortality of status asthmaticus over the past decades has been attributed to improved ventilatory strategy using permissive hypercapnia. This approach has been credited with a decrease in barotrauma, hemodynamic instability, and mortality.5, 13 The latter complications were mainly a result of the dynamic hyperinflation found in patients with severe asthma. Decreasing the respiratory rate and tidal volume as well as increasing the inspiratory flow rate will lead to an increase in expiratory time and will subsequently decrease the dynamic hyperinflation. With this approach, hypercapnia may occur. Hypercapnia (PaCO2 level up to 90 mm Hg) is generally well tolerated when oxygenation is maintained.14 Sedation is crucial to achieving optimal ventilation. Because of its short duration of action and bronchodilator effects,15, 16 propofol was the main sedative used in our MICU. Additional sedatives were required for half our patients. A prolonged sedative effect was noted in several cases, which prompted additional neurologic evaluation. It is conceivable that higher doses of sedatives are required for ventilatory control of young patients with a strong respiratory drive.
The administration of therapeutic paralysis is generally avoided in patients with status asthmaticus treated concurrently with corticosteroids. Myopathy may develop in the setting of neuromuscular blockade and corticosteroid administration and prolong ventilatory failure.17 In our earlier series, only 1 patient received a paralytic agent; in the current series, neuromuscular paralysis was needed in 6 episodes despite maximum sedative infusion. Patients requiring neuromuscular blockade were younger and had a significantly lower pH and higher PaCO2 than did those not receiving neuromuscular blockade. These patients developed more complications, including prolonged weakness, supporting the general approach of avoiding paralytic use unless absolutely necessary. It is noteworthy that despite this greater degree of respiratory failure and subsequent ICU complications, no patients in this group died.
The median duration of mechanical ventilation was 4.4 days. Complications included ventilator‐associated pneumonia, catheter‐related infection, excessive sedation, and prolonged weakness. These events occurred primarily in patients who received paralytics and patients whose mechanical ventilation was prolonged. The average duration of mechanical ventilation for patients who had ventilator‐associated pneumonia and catheter‐related infection was 22 and 31 days, respectively.
Status asthmaticus in pregnancy deserves special attention, and its course has not been well described in the literature. We report finding that in the current study period there were 5 pregnant patients requiring ICU management for status asthmaticus, all with dramatic degrees of hypercapnia and acidosis during controlled mechanical ventilation; the highest PaCO2 and lowest pH averaged 101 mm Hg and 7.06, respectively. Management of status asthmaticus in pregnancy is no different than in nonpregnant individuals, but there are concerns about the effects of hypercapnia and acidosis on the fetus.18 In all 4 patients who delivered, the pregnancies resulted in healthy babies. In the 1 patient who suffered a pneumomediastinum during early labor, the decision was made for cesarean delivery because of concerns about potential worsening of the barotrauma and maternal cardiopulmonary condition. This patient did not require intubation prior to or during the cesarean delivery. Collaboration with the obstetrician is essential in the management of these cases.
Despite advances in ventilator management and critical care, there remains a mortality risk in patients with status asthmaticus.17, 19, 20 In our study, 6 patients (7%) died; 3 patients died after suffering pre‐MICU cardiac arrest, and 3 patients died of multiorgan failure. Regular asthma clinic follow‐up, to include counseling about smoking cessation and illicit drugs, is essential. Unfortunately, only 45% of our patients had specialty clinic referral on discharge. Lack of patient understanding of their illness may also complicate their care, as demonstrated by nonadherence to medication and medical appointments. Five of our patients left against medical advice, 4 of them within a day of extubation.
Our study had several limitations. Patients were identified based on admission diagnosis by the attending physician; the coexistence of chronic obstructive pulmonary disease could not always be definitely excluded. However, all patients had a prior diagnosis of asthma and had been treated for asthma. The young age of the patient group is consistent with that reported in the literature.
It is difficult to compare studies of status asthmaticus, given the dynamic nature of the airways disease and individual clinician judgments about intubation and extubation. We believe that longer duration of ventilation reflects more severe asthma, especially in this time when clinicians attempt noninvasive ventilation and daily trials of spontaneous breathing for earlier extubation.
In conclusion, this report describes an increase in the severity of status asthmaticus in patients admitted to an urban MICU. The reason for the increase in severity compared to our previous study is uncertain. Possible factors include: cigarette and substance use, refractoriness to therapy because of environment or smoking, inadequate medical care, poor understanding of illness, and adherence to therapy. As the ICU management is supportive, the best approach is prevention, targeting at‐risk minority populations with education, counseling for smoking and drug cessation, and specialty care. Once status asthmaticus has developed, a careful, limited trial of NIV in selected patients may offer benefits in the management of ventilatory failure and avoidance of ICU complications.
- ,,, et al.Characteristics and outcome for admissions to adult, general critical care units with acute severe asthma: a secondary analysis of the ICNARC case mix programmed database.Crit Care.2004;8:R112–R121.
- ,,.The asthma epidemic.N Engl J Med.2006;355:2226–2235.
- ,,, et al.Clinical review: severe asthma.Crit Care.2002;6:30–44.
- ,.Evolving differences in the presentation of severe asthma requiring intensive care unit admission.Respiration.2004;71:458–462.
- ,.Status asthmaticus: a large MICU experience.Clin Intensive Care.2002;13:89–93.
- ,.Health care disparities in critical illness.Clin Chest Med.2006;27:473–486.
- ,,, et al.Randomized controlled trial of nasal ventilation in acute ventilatory failure due to chronic obstructive airways disease.Lancet.1993;341:1555–1557.
- ,,, et al.Randomized, prospective trial of noninvasive positive pressure ventilation in acute respiratory failure.Am J Respir Crit Care Med.1995;151:1799–806.
- ,.Acute asthma in adults.Chest.2004;125:1081–1102.
- ,,.Clinical course and outcomes of patients admitted to an ICU for status asthmaticus.Chest.2001;120:1616–1621.
- ,,.A pilot prospective, randomized, placebo‐controlled trial of bilevel positive airway pressure in acute asthma attack.Chest.2003;123:1018–1025.
- ,,, et al.Noninvasive positive pressure ventilation in status asthmaticus.Chest.1996;110:767–774.
- ,.Mechanical controlled hypoventilation in status asthmaticus.Am Rev Respir Dis.1984;129:385–387.
- .Permissive hypercapnic ventilation.Am J Respir Crit Care Med.1994;146:607–615.
- ,,.Anaesthetic management in asthma.Minerva Anestesiol.2006.
- ,,, et al.Propofol induces bronchodilation in a patient mechanically ventilated for status asthmaticus.Intensive Care Med.1993;19:305.
- .Intensive care management of status asthmaticus.Chest.2001;120:1439–1441.
- ,.Acute asthma in pregnancy.Crit Care Med.2005;33:S319–S324.
- ,,, et al.Mechanical ventilation in patients with acute severe asthma.Am J Med.1990;89:42–48.
- ,,, et al.Mortality in patients hospitalized for asthma exacerbations in the United States.Am J Respir Crit Care Med.2006;174:633–638.
Copyright © 2008 Society of Hospital Medicine
Costs and Arthroplasty
Hospital practices are increasingly responsible for ensuring enhanced patient safety, satisfaction, and cost containment. Recently developed models of care have achieved the necessary efficiency to attain these measures, not only in the use of hospitalists managing general medical1, 2 and postoperative orthopedic patients,3, 4 but also in the use of midlevel providers in busy primary care settings.5 In addition, stroke units6 and geriatric evaluation and management units7, 8 worldwide have demonstrated reduced disability and improved survival and importantly have been proven to provide cost‐effective care. Specialized orthopedic surgery (SOS) units may be a means to reproduce the results observed in these other models.
The economic potential of SOS units will become more significant with changing demographics. The percentage of patients greater than 65 years old will increase, from 12.3% in 2002 to 20% by 2030, with a parallel increase in the prevalence of osteoarthritis (OA).9 The World Health Organization has declared 2000‐2010 the Bone and Joint Decade,10, 11 reflecting that OA affects some 43 million people, with more than 60 million projected to be affected by 2020.12, 13 The National Center for Health Statistics reported that more than 280,000 total knee arthroplasties (TKAs) are performed annually in the United States, which marks an increase in frequency in the last decade that is likely to continue.1419
Approximately 75% of all TKAs are reimbursed under Medicare,17 whereas elective TKA continues to be one of the most common surgeries in the Medicare‐age patient population,20 foreshadowing the prominent cost burden of osteoarthritis in the aging population. The concomitant decreasing reimbursement for arthroplasty in general supports an examination of what constitutes efficient, high‐quality, and cost‐effective care21 for TKA. At our institution, patients undergoing TKA are preferentially triaged to an SOS nursing unit for postoperative care. As hospital bed capacity continues to decline, patients may be triaged to open beds at locations that may not be the optimal choice for nursing care. The primary purpose of this study was to determine the impact of SOS units versus nonorthopedic nursing (NON) units on resource utilization for and outcomes of patients undergoing elective knee arthroplasty. We hypothesized that length of stay would be shorter and cost of inpatient care would be lower for patients cared for on SOS units.
MATERIALS AND METHODS
Study Design and Setting
We conducted a retrospective observational cohort study of all patients undergoing elective primary TKA from January 1, 1996, to December 31, 2004, comparing outcomes of patients assigned to SOS units with those of patients assigned to NON units. Patients were admitted to Rochester Methodist Hospital, Mayo Clinic, a tertiary‐care primary surgical teaching hospital that has 794 beds and more than 15,000 admissions annually. There were 13 faculty orthopedic surgeons performing elective nontraumatic lower‐extremity joint procedures during the study period, each with orthopedic residents rotating as part of the patient care team.
Study Population
All patients at Mayo Clinic who had undergone a joint replacement were followed prospectively, and data were collected using standardized forms and protocols, the methodologies of which have been described previously.22 Follow‐up was greater than 95% complete. Using the joint registry, patients who had undergone a TKA were identified (n = 9798). Postoperative patients initially transferred from the postanesthesia care unit to a general care floor were included. We excluded patients who required urgent, revision, or bilateral arthroplasties; who had been treated at or transferred from another institution; and whose primary surgical indication was trauma or septic arthritis. Subjects admitted to the hospital on the day prior to the procedure and subjects initially transferred directly from the postanesthesia care unit to the intensive care unit (ICU) were excluded, including patients requiring immediate postoperative cardiac monitoring. All primary surgical interventions were performed between Monday and Friday. The study authors identified 5883 eligible patients.
Patient clinical and demographic data including surgical indication; age; sex; height and weight at surgery; and dates of admission, surgery, death, discharge, and last follow‐up were abstracted from the registry. Type of anesthesia (general, regional, combined), American Society of Anesthesiologists (ASA) physical status class, and date and time of ICU admission and discharge were abstracted from individual departmental databases. The Decision Support System (DSS) administrative database (Eclipsys, Boca Raton, FL) was utilized to abstract relevant clinical variables, including major comorbid conditions such as cancer, cerebrovascular disease, chronic pulmonary disease, congestive heart failure, dementia, diabetes, hemiplegia, HIV/AIDS, metastatic solid tumors, myocardial infarction, peripheral vascular disease, renal disease, rheumatologic disease, and ulcers. A composite Charlson comorbidity score was computed as previously described.23, 24 Administrative variables regarding patient encounters including inpatient stay variableslength of stay, costs, patient location, nursing care units, admission times, discharge disposition and datewere also obtained from the DSS database.
Variables and Definitions
Length of stay was defined as the number of days from time of admission for the surgical episode to time of discharge. All costs were based on a provider perspective using standardized 2005 costs based on inflation‐adjusted estimates as previously described.3, 25, 26 We assessed resource utilization among patients who received care on an SOS unit by determining length of stay and total, hospital, and physician costs for the specified surgical episode. We also assessed blood bank, ICU, laboratory, pharmacy, physical therapy, occupational therapy, respiratory therapy, radiology, and room‐and‐board costs. Blood bank costs consisted of the costs of storing, processing, and administering the transfusion. Surgical procedure, anesthesia, and preoperative service costs were excluded from our cost analyses, as our aim was to examine hospital flow and resource utilization from time of transfer from the postanesthesia care unit to hospital discharge in order to specifically examine the impact of an SOS unit. We compared unexpected ICU admissions and stays and the resources utilized of patients in these 2 groups.
State and federal death registries confirmed patient expiration and primary cause of death. In‐hospital mortality was defined as death during the same hospital admission as the indexed surgical episode. Thirty‐day mortality was defined as death occurring within 30 days of the surgical procedure. Readmission at 30 days was defined as any admission to our institutions within a 30‐day period whose purpose was possibly related to the initial surgical episode and not a result of an elective admission. A priori we were aware of the small number of these events in the elective joint population. Therefore, we combined inpatient 30‐day mortality, 30‐day reoperation, and 30‐day readmission rates as a composite endpoint.
Specialized Orthopedic Surgery Units
An SOS unit was defined as a general care nursing unit where patients receive all their postoperative care after elective TKA. Such a unit has a multidisciplinary staff that has orthopedic expertise. The differences between an SOS unit and a NON unit are described in Table 1. Bed availability at the time of discharge from the postanesthesia care unit was the exclusive factor for admission to this unit. Bed availability was dependent on staff availability or whether there was an excess number of operative cases. The number and severity of patient medical comorbidities or complications, the time of discharge from the postanesthesia care unit, and patient room preference had no impact on which unit patients were admitted to. Patients were allocated to the SOS group or the NON unit group according to their physical location the evening of admission. Monitored beds at this facility are solely located in the ICU, and neither SOS nor NON units have this capability. Any patient requiring a monitored bed at any time, regardless of the reason, would be transferred directly to the ICU. Daily rounds were performed on either unit by the primary orthopedic team. The need for either medical or pain service consultation was at the discretion of the primary orthopedic team and not dependent on the patient's physical location.
| Specialized orthopedic surgical unit (SOS) | Nonorthopedic nursing unit (NON) | |
|---|---|---|
| ||
| Type of unit | Orthopedic general care unit. | General surgical care unit. |
| Patient type | Postoperative elective orthopedic only. | Any patientmedical or surgical. |
| Determinants of physical location for orthopedic patient | Primary bed assignment. | Admitted only if SOS units have reached full bed capacity. |
| Orthopedic‐trained nursing staff | Yesrequired to have additional post‐RN* training in orthopedics. These RNs rarely float to nonorthopedic units. | Nomay have additional training or experience in an unrelated medical or surgical discipline. Floating to other units may occur. |
| Orthopedic‐specific physical + occupational therapy | Provided by certified physical therapists trained in lower‐extremity joint procedures. Site‐based therapy available to all patients on SOS units. | Provided by certified physical therapists who do not necessarily have postoperative orthopedic lower‐extremity specialization. Site‐based therapy on NON unit available to all patients. |
| Licensed social workers | Dedicated to postoperative needs of orthopedic patients physically located on SOS units. | Not specifically dedicated to the postoperative elective orthopedic joint patient and not physically located on these units. |
| Interdisciplinary team meetings | Patient care addressed in a interdisciplinary team meeting 3 times weeklyconsists of an RN, physical and occupational therapists, social worker, and physician. | No care team meetings, as patients are off‐service. |
| Physician postoperative order set | Orthopedic‐specific order set that is available hospitalwide. Nursing staff on these units is familiar with these order sets. | Orthopedic‐specific order set available hospitalwide. Nursing staff on these units may not be entirely familiar with these order sets. |
| Rehabilitation protocols | Orthopedic specific. | Not orthopedic specific. |
| Patient‐care instructions | Orthopedic diagnosis‐specific instructions readily available | Orthopedic diagnosis‐specific instructions available but requires staff to obtain information and forms from the SOS inits. |
| Discharge protocol | Specifically targeted to the postarthroplasty patient | Generic hospitalwide protocol. |
| Hospital discharge summary | Yescowritten by primary orthopedic team and primary orthopedic RN. | Yescowritten by primary orthopedic team and nonorthopedic RN. |
| Orthopedic‐specific discharge instructions | Yescowritten by primary orthopedic team and primary orthopedic RN. | No. |
All data were subsequently combined into a single database to facilitate data analysis. We further excluded 44 patients because no cost information was available, 9 patients who had multiple joint replacements performed during the specified surgical hospitalization, 69 patients because they had not authorized their medical records to be used for the purposes of research; 163 patients admitted directly to the ICU, 63 patients admitted the day prior to surgery, and 1 patient whose billing data suggested an outpatient encounter. A final patient cohort of 5534 patients was in the analysis. With the observed sample size and the overall variability, our study had 80% power to detect a difference between the 2 groups as small as 0.22 days in length of stay and $761 in hospital costs. The study was approved by our institutional review board. All study patients had authorized the use of their medical records for the purposes of research. Funding was obtained through an intramurally sponsored Small Grants Program by the Division of General Internal Medicine, which had no impact on the design of the study, reporting, or decision to submit an article on the study for publication.
Statistical Analysis
The statistical analysis compared baseline health and demographic characteristics of the patients cared for on SOS units with those cared for on NON units using chi‐square tests for nominal factors and the 2‐sample Wilcoxon rank sum tests for continuous variables. We used the chi‐square test to test for unadjusted differences in sex, patient residence (local or referred), race, individual Charlson comorbid conditions, anesthesia type, admitting diagnosis, 30‐day readmission rate, and discharge location. The 2‐sample Wilcoxon rank sum test assessed unadjusted differences in length of stay, costs, age, ICU days of stay, number of reoperations, total Charlson score and ASA class. Thirty‐day mortality rates were tested using the Fisher exact test.
Differences between patients in SOS and NON units in length of stay (LOS) and costs were the study's primary outcomes. We adjusted for baseline and surgical covariates using generalized linear regression models for these outcomes. The effect of the nursing unit was based on regression coefficients for age, sex, ASA class, anesthesia type, Charlson comorbidities, and surgical year. Age was analyzed using 5 categories: <55; 55‐64; 70‐74; 54‐69, and >75 years, with 65‐69 years used as the reference group. Each Charlson comorbid condition was treated as an indicator variable. Indicator variables were also assigned to surgical year, with 2004 used as the reference. These variables were subsequently entered into the model to calculate the differences between patients on an SOS unit and those on a NON unit.
Our secondary outcomes included ICU utilization and 30‐day outcomes of mortality, reoperations, and readmissions. We then assessed the effect of treatment on the SOS unit using the entire cohort (n = 5534) for unplanned postoperative ICU stay (yes or no) and on our combined endpoint after adjusting for the variables listed previously, using logistic regression models. A P value < 0.05 was considered statistically significant. All analyses were performed using statistical software (SAS, version 9.1; SAS Institute Inc, Cary, NC).
RESULTS
Baseline patient characteristics are represented in Table 2. Five thousand and eighty‐two patients were admitted to an SOS unit, and 452 patients were admitted to a NON unit. The annual number of patients undergoing TKA increased during our study period, as did the number of patients cared for on NON units. There were no differences between groups in the number of local county patients or in the number of patients primarily referred by other providers for elective arthroplasty. Mean length of stay was 4.9 days in both groups. After adjusting for the specified covariates, including age, sex, year of surgery, Charlson comorbidities, ASA class, and type of anesthesia, LOS was 0.234 days shorter in the SOS group (95% confidence interval [CI]: 0.08, 0.39; P = .002). Overall and hospital costs were significantly lower in the SOS group, as outlined with the other costs in Table 3. Room‐and‐board costs were 5.3% lower for SOS patients than for patients on NON units, representing a per‐patient difference of $244 $87 (95% CI: $72, $415; P = .005).
| Specialized orthopedic surgery unit (n = 5082) | Nonorthopedic nursing unit (n = 452) | P value | |||
|---|---|---|---|---|---|
| n | % | n | % | ||
| |||||
| Age (years) | |||||
| <55 | 534 | 10.5% | 57 | 12.6% | |
| 55‐64 | 1148 | 22.6% | 101 | 22.4% | |
| 65‐69 | 802 | 15.8% | 66 | 14.6% | |
| 70‐74 | 1106 | 21.8% | 91 | 20.1% | |
| >75 | 1492 | 29.4% | 137 | 30.3% | |
| Mean age ( SD*) | 68.3 10.75 | 67.9 11.5 | .50 | ||
| Sex | .70 | ||||
| Male | 2173 | 42.8% | 189 | 41.8% | |
| Female | 2909 | 57.2% | 263 | 58.2% | |
| Race | .28 | ||||
| White | 4731 | 93.1% | 420 | 92.9% | |
| Other* | 51 | 1.0% | 8 | 1.8% | |
| Unknown | 300 | 5.9% | 24 | 5.3% | |
| Local Olmsted County patients | 772 | 15.2% | 58 | 12.8% | .18 |
| Indication for surgery | .03 | ||||
| Osteoarthritis | 4778 | 94% | 430 | 95.1% | |
| Rheumatologic disease | 184 | 3.6% | 6 | 1.3% | |
| Avascular necrosis | 62 | 1.2% | 5 | 1.1% | |
| Congenital | 6 | 0.1% | 1 | 0.2% | |
| Cancer | 22 | 0.4% | 5 | 1.1% | |
| Other | 30 | 0.6% | 5 | 1.1% | |
| Year of surgery | < .001 | ||||
| 1996 | 497 | 98.8% | 6 | 1.19% | |
| 1997 | 571 | 99.7% | 2 | 0.35% | |
| 1998 | 479 | 98.8% | 6 | 1.24% | |
| 1999 | 487 | 94.8% | 27 | 5.25% | |
| 2000 | 458 | 92.7% | 36 | 7.29% | |
| 2001 | 502 | 86.7% | 77 | 13.3% | |
| 2002 | 593 | 89.2% | 72 | 10.8% | |
| 2003 | 639 | 87.1% | 95 | 12.9% | |
| 2004 | 856 | 86.7% | 131 | 13.3% | |
| Charlson score (mean SD) | 0.256 0.536 | 0.288 0.593 | .23 | ||
| AIDS | 0 | 0% | 1 | 0.22% | 1.00 |
| Cancer | 85 | 1.68% | 7 | 1.55% | .84 |
| Cerebrovascular disease | 32 | 0.63% | 0 | 0% | .09 |
| Chronic pulmonary disease | 28 | 5.63% | 23 | 5.09% | .63 |
| Congestive heart failure | 89 | 1.75% | 22 | 4.87% | < .001 |
| Dementia | 10 | 0.2% | 2 | 0.44% | .28 |
| Diabetes | 603 | 11.9% | 58 | 12.8% | .54 |
| Hemiplegia | 9 | 0.18% | 0 | 0% | .37 |
| Metastatic solid tumor | 11 | 0.22% | 2 | 0.44% | .34 |
| Myocardial infarction | 29 | 0.57% | 4 | 0.88% | .4 |
| Peripheral vascular disease | 67 | 1.32% | 4 | 0.88% | .43 |
| Renal disease | 52 | 1.02% | 5 | 1.11% | .87 |
| Rheumatologic disease | 12 | 0.24% | 2 | 0.44% | .40 |
| Ulcers | 15 | 0.3% | 0 | 0% | .25 |
| ASA class‖ | |||||
| I | 99 | 2.0% | 12 | 2.7% | |
| II | 2891 | 56.9% | 255 | 56.4% | |
| III | 2084 | 41.0% | 183 | 40.5% | |
| IV | 8 | 0.2% | 2 | 0.4% | |
| Average ASA class ( SD) | 2.39 0.53 | 2.39 0.55 | .80 | ||
| Anesthesia type | .02 | ||||
| General | 1644 | 32.4% | 143 | 31.6% | |
| Regional | 2742 | 54% | 226 | 50% | |
| Combined | 696 | 13.7% | 83 | 18.4% | |
| Unadjusted values | Adjusted values | ||||||||
|---|---|---|---|---|---|---|---|---|---|
| SOS* | SD | NON | SD | P value | Difference | SD | P value | 95% CI | |
| |||||||||
| Total cost | $9989 | $5392 | $10,067 | $5075 | .77 | $600 | $244 | .01 | $122, $1079 |
| Hospital costs | $9789 | $5123 | $ 9805 | $4647 | .23 | $594 | $231 | .01 | $141, $1047 |
| Room & board | $4399 | $1825 | $ 4577 | $1579 | .04 | $244 | $ 87 | .005 | $ 72, $ 415 |
| ICU costs | $ 58 | $1094 | $ 107 | $ 682 | .35 | $ 11 | $ 51 | .82 | $111, $ 88 |
| Pharmacy | $ 851 | $1701 | $ 931 | $1823 | .34 | $ 87 | $ 85 | .30 | $ 79, $253 |
| Laboratory costs | $ 386 | $ 438 | $ 395 | $ 405 | .65 | $ 27 | $ 20 | .18 | $ 12, $ 65 |
| Radiology costs | $ 98 | $ 205 | $ 103 | $ 183 | .61 | $ 1 | $ 10 | .93 | $ 20, $ 19 |
| PT/OT**/RT | $ 739 | $ 505 | $ 682 | $ 394 | .004 | $ 15 | $ 19 | .45 | $ 23, $ 52 |
| Blood bank | $ 159 | $ 306 | $ 178 | $3023 | .22 | $ 6 | $ 15 | .69 | $ 35, $ 23 |
| Physician costs | $ 207 | $ 464 | $ 258 | $ 628 | .09 | $ 20 | $ 22 | .386 | $ 24, $ 63 |
| E&M costs‖ | $ 89 | $ 211 | $ 109 | $ 238 | .09 | $ 4 | $ 9 | .658 | $ 23, $ 14 |
| Physician radiology | $ 63 | $ 158 | $ 38 | $ 192 | .49 | $ 2 | $ 8 | .78 | $ 13, $ 18 |
| Other costs | $ 34 | $ 138 | $ 37 | $ 160 | .61 | $0.64 | $ 6 | .92 | $ 13, $ 12 |
There were 83 patients (1.63%) transferred from SOS units to the ICU, compared with 14 patients (3.1%) transferred from NON units (P = .02), but no differences in the mean number of ICU days or associated costs between groups. A priori, the authors were aware of the small number of postoperative medical events in this population. In examining the combined endpoint of reoperations, readmissions, and mortality, there were no differences observed in our regression analysis between SOS patients and NON unit patients (0.03 events, standard error: 0.1859; odds ratio: 0.976). Table 4 demonstrates a higher percentage of patients discharged with home health on the NON units than on the SOS units (8.41% vs. 4.62%; P < .001).
| Specialized orthopedic surgery unit | Nonorthopedic nursing unit | P value | |||
|---|---|---|---|---|---|
| n* | % | n | % | ||
| |||||
| Home | 3812 | 75% | 328 | 72.6% | .252 |
| Home health | 235 | 4.62% | 38 | 8.41% | < .001 |
| Transferred to skilled nursing facility | 1030 | 20.3% | 86 | 19% | .529 |
DISCUSSION
To the best of our knowledge, this is the first study to examine the impact of specialized orthopedic surgery units on resource utilization in elective knee arthroplasty patients. Our findings demonstrate that patients admitted following elective TKA to SOS units will have a reduced length of stay, lower overall and hospital costs, and fewer unexpected transfers to higher levels of care (ICUs). We believe that these findings are a result in part of the specialized expertise allied health care providers develop by taking care of and focusing on a large volume of patients over time with the same group and type of surgeons. This multidisciplinary setting in which care providers are familiar not only with each other but with this specific population of patients creates the environment necessary for adherence to specialized clinical pathways.27
Patient LOS is an important determinant of resource utilization. In a study by Husted et al., the mean length of stay in Danish hospitals following TKA was 8.6 days in 2003.28 An epidemiological study using the Nationwide Inpatient Sample database of patients in the United States showed that from 1998 to 2000, the mean LOS was 4.3 days.18 In our study, the mean LOS was slightly higher (4.9 days), potentially reflecting referral bias. Achieving additional savings and improved outcomes by further reducing LOS in an environment in which care pathways are already in place is often difficult; hence, alternative approaches and strategies are often necessary.29, 30 Our results suggest that in TKA patients, after adjusting for other factors, there is a decrease in the length of stay of 0.234 days among those cared for on SOS units. However, we cannot state that the existence of the clinical pathway alone is responsible for our data differences because certain components of the care pathway for elective TKA patients are used throughout the hospital regardless of type of postoperative nursing unit. We believe that the interdisciplinary specialty care provided to orthopedic patients on SOS units is a critical component of a successfully implemented care pathway and not just a convenience or practice preference. The same surgeons admitting patients to the same nursing unit, with the same nurses, physical therapists and pharmacists providing care to the same type of patient population over time, leverages the collective experience of all care providers. This integrated, multidisciplinary teamwork may optimize timeliness, achieve incremental cost savings, and improve safety (including a decreased number of unanticipated transfers to an ICU setting).
Clinical pathways are known to reduce overall costs, normally by reducing LOS,29, 3133 and our results suggest approximately an incremental 6% cost reduction with the use of improving patient logistics by using SOS units. An economic evaluation study by Healy et al. suggests that focusing on nursing units may be a means of reducing total costs.29 Our cost savings were slightly lower than the reported savings by other practice assessments; however, we excluded operative and anesthesia costs, both significant contributors to overall and hospital costs. By eliminating these variables, our costs were specifically limited to the postoperative course, which is highly dependent on specialized interdisciplinary care.29
Providing specialized care has a significant impact on society. Although there is a per‐patient savings of only $600 when elective TKA patients are cared for on SOS units, this could be the difference between a positive and negative margin in the setting of fixed reimbursement. With a current average of 90 patients annually triaged postoperatively to NON units, there is a potential loss of $54,000 annually at our institution in just this single patient population with the current mechanisms of perioperative hospital flow. Multiply this potential savings to a national level, and the total is significant. With an aging population, the number of arthroplasties and concomitantly the number of hospitalizations in general are likely to increase, suggesting that changes in hospital flow are required to ensure optimal, cost‐effective care in the best setting available for patients. Such care is often related to surgical volume, and our institution observes such volume. Our results indicate that SOS units are one possible means of achieving this objective of fiscal sustainability, but further studies are needed to determine the indirect and hidden costs of sustaining such units in order to observe the actual cost savings.34 It could be argued that for elective TKA patients to have the most optimal outcomes and most efficient care, the surgical procedure should be performed only if beds are available on the nursing units whose staff has the most specific training.
Thirty‐Day Outcomes
We elected to combine 30‐day mortality, reoperations, and readmissions pertaining to the joint procedure as a composite endpoint and found no differences in outcomes between groups. These results suggest that these longer‐term patient‐specific outcomes are likely not related to the specialty nursing care. We used a 30‐day endpoint assuming that a longer period may have led to the inclusion of deaths that were not directly attributable to the surgical intervention. In addition, a previous study advocated using 30 days as an endpoint for follow‐up, as it adequately accounts for adverse events.35 Our institution is also a referral center; hence, we would likely be unable to capture all events if we were to use the standard 90‐day period used for payment for this procedure, as these data are not canvassed by the joint registry.
Discharge Disposition
NON unit patients tended to have a higher degree of home health arranged at discharge. The NON unit nursing staff cares for other nonorthopedic surgical patients daily and may transfer their patterns of care utilization to the orthopedic patients despite different postoperative needs. In addition, if NON unit nursing staff members care for TKA patients only intermittently, they may not have as clear a working understanding of the particular postoperative requirements of TKA patients and consequently request unnecessary home health services and general community resources. Alternatively, patients cared for on NON units may actually have needed more assistance and more services on discharge. Although purely speculative, patients cared for by dedicated orthopedic surgery staff may develop added confidence from the experience of the allied care staff and feel less of a need for postdismissal services.
Role of Hospitalists in Specialized Care Pathways
Hospitalists are known to improve efficiency without reducing patient satisfaction. Their role has been demonstrated in different patient populations.1, 2, 3638 In a study of hip fracture patients, a hospitalist care model demonstrated a reduction in length of stay and time to surgery, without compromising long‐term outcomes.4, 39 Utilizing a hospitalist/midlevel care provider team approach to reduce LOS in units with a static number of beds can possibly increase bed turnover and prevent triaging of patients onto NON units. This is but one example of how a medical‐surgical partnership can improve outcomes. However, in an era where cost‐effective and regulatory practices require optimal resource allocation, hospitalists are in a key position to foster quality improvement projects, promote patient safety measures, and enhance systems care delivery. Becoming involved in designing specialized clinical units, with an emphasis on a multidisciplinary care approach, and developing their relationships with hospital administrators and nursing staff should be among their priorities. The Society of Hospital Medicine has also been committed to the care of the elderly through its core competencies40 and the orthopedic population that will benefit from such process changes and care pathways. Hospital innovations such as the implementation of SOS‐type units not only for other medical‐surgical partnerships but also for site‐based units caring for geriatric patients can be top priorities for hospitalists.
Strengths and Applicability
Our results are important in that they can likely be applied to both large tertiary‐care centers and smaller community‐based centers that perform specialized orthopedic surgeries. Nurses on specialized orthopedic units are very familiar with this postoperative population and have developed expertise in the care of these patients. These experienced nurses can likely be found on orthopedic units in tertiary‐care centers or surgical units in smaller facilities. Furthermore, our results support the benefits of interdisciplinary advanced teamwork. When an interdisciplinary group of health care providers works together on a daily basis, certain habits and patterns inevitably develop that often are unplanned and may be difficult to measure. This enhanced patient flow may not occur if these patients are cared for by providers unfamiliar with each other's work patterns. The importance of optimized teamwork is not hospital‐size dependent. Only primary elective knee arthroplasties were included to minimize confounding bias by bilateral or revision surgeries or indications such as septic arthritis, which are known to lead to increased length of stay, costs and complications.41
Limitations
Our study has the limitations of its retrospective nonrandomized study design, and only a prospective, randomized investigation could definitively address our aims. By excluding sicker patients, such as those referred with complicated health issues or high‐risk patients who required admission in advance of the proposed surgery for monitoring of perioperative anticoagulation issues, our estimates of possible differences between our comparison groups may have been conservative. We are unaware of how these sicker patients would fare on either nursing unit. Furthermore, what occurs in the hospital setting may not only have an impact on the hospital stay but may also influence long‐term outcomes. This is impossible to assess with analysis of administrative databases.
We relied on the complete and accurate recording of data from various databases, depending on the validity of data entry and collection. With a large cohort of patients, any errors in documentation or abstraction would be expected to be similar in both groups. Furthermore, confounding variables such as patient comorbidities are extracted from administrative data sets whose personnel might not be as familiar with the medical aspects of patient care. We used linear and logistic regression analyses to account for known differences in baseline characteristics despite the sample sizes being proportionally larger in the SOS group. Although we attribute the shortened length of stay in the SOS group to the interdisciplinary team approach, we were unable to determine to what extent this was a result of nursing staff or discharge planning. By using administrative databases, we were unable to abstract the consensus time and date of discharge, when all hospital staff deemed the patient ready for discharge, and hence relied on the actual time of discharge, which can be heavily reliant on availability at skilled nursing facilities. In addition, it was unknown whether patients discharged from SOS units were, by matter of protocol, discharged earlier in the day. Nevertheless, this small difference in length of stay can improve patient flow by opening up postoperative patient beds. Furthermore, such data sets are unable to provide information on patient satisfaction or quality‐of‐life measures, both of which are important determinants in specialized care pathways.42 The patient population served by our institution is generally ethnically homogeneous, thereby limiting potential generalizations to tertiary‐care centers or geographical areas with a population similar to ours. Our study also was not intended as a formal cost‐effectiveness analysis; hence, the impact of possible startup costs to begin a similar nursing unit was not explored. Although differences in practice management can be considered a limitation of not only operative but also perioperative care, we neither expected nor encountered any significant or drastic alterations during the study period, and year of surgery was adjusted for in our analysis. However, prospective randomized controlled studies testing specific clinical pathways and practice‐related innovations are needed to better examine these outcomes.
CONCLUSIONS
In conclusion, postoperative patients after elective knee arthroplasty cared for on specialized orthopedic surgery units have shorter length of stays and cost hospitals less than patients admitted to nonspecialized orthopedic nursing units. In an era in which quality indicators and external reviews are forcing practitioners and health care organizations to become increasingly responsible for their own practices, more research is required to better address specific questions pertaining to different processes of care. Our study is meant to increase the attention paid to patient flow and postoperative logistics in the elective TKA population. SOS units, as a unique model of care, may become an additional step toward ensuring quality care and improved resource utilization.
Acknowledgements
The authors thank Donna K. Lawson, LPN, for her assistance in data collection and management.
- ,,,,,.Implementation of a voluntary hospitalist service at a community teaching hospital: improved clinical efficiency and patient outcomes.Ann Intern Med.2002;137:859–865.
- ,,, et al.Effects of physician experience on costs and outcomes on an academic general medicine service: results of a trial of hospitalists.Ann Intern Med.2002;137:866–874.
- ,,, et al.Medical and surgical comanagement after elective hip and knee arthroplasty: a randomized, controlled trial.Ann Intern Med.2004;141:28–38.
- ,,, et al.Effects of a hospitalist model on elderly patients with hip fracture.Arch Intern Med.2005;165:796–801.
- ,,,,.The economic benefit for family/general medicine practices employing physician assistants.Am J Manag Care.2002;8:613–620.
- ,,, et al.Economic evaluation of Australian stroke services: a prospective, multicenter study comparing dedicated stroke units with other care modalities.Stroke.2006;37:2790–2795.
- ,,,.Geriatric evaluation and management units in the care of the frail elderly cancer patient.J Gerontol A Biol Sci Med Sci.2005;60:798–803.
- ,,,,,.A randomized, controlled trial of a geriatric assessment unit in a community rehabilitation hospital.N Engl J Med.1990;322:1572–1578.
- ,.The effect of longevity on spending for acute and long‐term care.N Engl J Med.2000;342:1409–1415.
- ,,, et al.The Bone and Joint Decade 2000‐2010.Acta Orthop Scand.1998;69:219–220.
- .The Bone and Joint Decade 2000‐2010— for prevention and treatment of musculoskeletal disease.Osteoarthr Cartil.1998;7:1–4.
- Prevalence of self‐reported arthritis or chronic joint symptoms among adults—United States, 2001.MMWR Morb Mortal Wkly Rep.2002;51:948–950.
- ,,, et al.Estimates of the prevalence of arthritis and selected musculoskeletal disorders in the United States.Arthritis Rheum.1998;41:778–799.
- HCUPnet, Healthcare Cost and Utilization Project. Agency for Healthcare Research and Quality, 2002. Available at: http://www.ahrq.gov. Accessed January 25,2005.
- ,,,,,.Costs and cost‐effectiveness in hip and knee replacements. A prospective study.Int J Technol Assess Health Care.1997;13:575–588.
- ,,,,.Trends in total knee replacement surgeries and implications for public health, 1990‐2000.Public Health Rep.2005;120:278–282.
- ,,, et al.Demographic variation in the rate of knee replacement: a multi‐year analysis.Health Serv Res.1996;31:125–140.
- ,,,,.Trends in the epidemiology of total shoulder arthroplasty in the United States from 1990‐2000.Arthritis Rheum.2006;55:591–597.
- ,.2001 National Hospital Discharge Survey.Adv Data.2003;332.
- ,.2002 National Hospital Discharge Survey.Adv Data.2004:1–29.
- ,,.Costs of health care administration in the United States and Canada.N Engl J Med2003;349:768–775.
- ,,.Maintaining a hip registry for 25 years. Mayo Clinic experience.Clin Orthop Relat Res.1997:61–68.
- ,,,.Validation of a combined comorbidity index.J Clin Epidemiol.1994;47:1245–1251.
- ,,,.A new method of classifying prognostic comorbidity in longitudinal studies: development and validation.J Chronic Dis.1987;40:373–383.
- ,,, et al.A prospective randomized comparison of laparoscopic appendectomy with open appendectomy: Clinical and economic analyses.Surgery.2001;129:390–400.
- ,,, et al.Incremental costs of enrolling cancer patients in clinical trials: a population‐based study.J Natl Cancer Inst.1999;91:847–853.
- ,.Understanding the complexity of redesigning care around the clinical microsystem.Qual Saf Health Care.2006;15(Suppl 1):i10–i16.
- ,,, et al.Length of stay after primary total hip and knee arthroplasty in Denmark, 2001‐2003.Ugeskr Laeger.2006;168:276–279.
- ,,,.Opportunities for control of hospital costs for total joint arthroplasty after initial cost containment.J Arthroplasty.1998;13:504–507.
- ,,,,.Effectiveness of clinical pathways for total knee and total hip arthroplasty: literature review.J Arthroplasty.2003;18:69–74.
- ,,, et al.The effect of a perioperative clinical pathway for knee replacement surgery on hospital costs.Anesth Analg.1998;86:978–984.
- The cost effectiveness of streamlined care pathways and product standardization in total knee arthroplasty.J Arthroplasty.1999;14:182–186.
- ,,,,.Impact of cost reduction programs on short‐term patient outcome and hospital cost of total knee arthroplasty.J Bone Joint Surg Am.2002;84‐A:348–353.
- ,,,.Success of clinical pathways for total joint arthroplasty in a community hospital.Clin Orthop Relat Res.2007;457:133–137.
- ,,,.Optimal timeframe for reporting short‐term complication rates after total knee arthroplasty.J Arthroplasty.2006;21:705–711.
- ,,.Associations with reduced length of stay and costs on an academic hospitalist service.Am J Manag Care.2004;10:561–568.
- ,,.Is there a geriatrician in the house? Geriatric care approaches in hospitalist programs.J Hosp Med.2006;1:29–35.
- .Care of hospitalized older patients: opportunities for hospital‐based physicians.J Hosp Med.2006;1:42–47.
- ,,, et al.Effects of a hospitalist care model on mortality of elderly patients with hip fractures.J Hosp Med.2007;2:219–225.
- ,,,,.Core competencies in hospital medicine: development and methodology.J Hosp Med.2006;1:48–56.
- ,,,,,.Effect of feedback on resource use and morbidity in hip and knee arthroplasty in an integrated group practice setting.Mayo Clin Proc.1996;71:127–133.
- ,,,.Integrated care pathways.BMJ.1998;316:133–137.
Hospital practices are increasingly responsible for ensuring enhanced patient safety, satisfaction, and cost containment. Recently developed models of care have achieved the necessary efficiency to attain these measures, not only in the use of hospitalists managing general medical1, 2 and postoperative orthopedic patients,3, 4 but also in the use of midlevel providers in busy primary care settings.5 In addition, stroke units6 and geriatric evaluation and management units7, 8 worldwide have demonstrated reduced disability and improved survival and importantly have been proven to provide cost‐effective care. Specialized orthopedic surgery (SOS) units may be a means to reproduce the results observed in these other models.
The economic potential of SOS units will become more significant with changing demographics. The percentage of patients greater than 65 years old will increase, from 12.3% in 2002 to 20% by 2030, with a parallel increase in the prevalence of osteoarthritis (OA).9 The World Health Organization has declared 2000‐2010 the Bone and Joint Decade,10, 11 reflecting that OA affects some 43 million people, with more than 60 million projected to be affected by 2020.12, 13 The National Center for Health Statistics reported that more than 280,000 total knee arthroplasties (TKAs) are performed annually in the United States, which marks an increase in frequency in the last decade that is likely to continue.1419
Approximately 75% of all TKAs are reimbursed under Medicare,17 whereas elective TKA continues to be one of the most common surgeries in the Medicare‐age patient population,20 foreshadowing the prominent cost burden of osteoarthritis in the aging population. The concomitant decreasing reimbursement for arthroplasty in general supports an examination of what constitutes efficient, high‐quality, and cost‐effective care21 for TKA. At our institution, patients undergoing TKA are preferentially triaged to an SOS nursing unit for postoperative care. As hospital bed capacity continues to decline, patients may be triaged to open beds at locations that may not be the optimal choice for nursing care. The primary purpose of this study was to determine the impact of SOS units versus nonorthopedic nursing (NON) units on resource utilization for and outcomes of patients undergoing elective knee arthroplasty. We hypothesized that length of stay would be shorter and cost of inpatient care would be lower for patients cared for on SOS units.
MATERIALS AND METHODS
Study Design and Setting
We conducted a retrospective observational cohort study of all patients undergoing elective primary TKA from January 1, 1996, to December 31, 2004, comparing outcomes of patients assigned to SOS units with those of patients assigned to NON units. Patients were admitted to Rochester Methodist Hospital, Mayo Clinic, a tertiary‐care primary surgical teaching hospital that has 794 beds and more than 15,000 admissions annually. There were 13 faculty orthopedic surgeons performing elective nontraumatic lower‐extremity joint procedures during the study period, each with orthopedic residents rotating as part of the patient care team.
Study Population
All patients at Mayo Clinic who had undergone a joint replacement were followed prospectively, and data were collected using standardized forms and protocols, the methodologies of which have been described previously.22 Follow‐up was greater than 95% complete. Using the joint registry, patients who had undergone a TKA were identified (n = 9798). Postoperative patients initially transferred from the postanesthesia care unit to a general care floor were included. We excluded patients who required urgent, revision, or bilateral arthroplasties; who had been treated at or transferred from another institution; and whose primary surgical indication was trauma or septic arthritis. Subjects admitted to the hospital on the day prior to the procedure and subjects initially transferred directly from the postanesthesia care unit to the intensive care unit (ICU) were excluded, including patients requiring immediate postoperative cardiac monitoring. All primary surgical interventions were performed between Monday and Friday. The study authors identified 5883 eligible patients.
Patient clinical and demographic data including surgical indication; age; sex; height and weight at surgery; and dates of admission, surgery, death, discharge, and last follow‐up were abstracted from the registry. Type of anesthesia (general, regional, combined), American Society of Anesthesiologists (ASA) physical status class, and date and time of ICU admission and discharge were abstracted from individual departmental databases. The Decision Support System (DSS) administrative database (Eclipsys, Boca Raton, FL) was utilized to abstract relevant clinical variables, including major comorbid conditions such as cancer, cerebrovascular disease, chronic pulmonary disease, congestive heart failure, dementia, diabetes, hemiplegia, HIV/AIDS, metastatic solid tumors, myocardial infarction, peripheral vascular disease, renal disease, rheumatologic disease, and ulcers. A composite Charlson comorbidity score was computed as previously described.23, 24 Administrative variables regarding patient encounters including inpatient stay variableslength of stay, costs, patient location, nursing care units, admission times, discharge disposition and datewere also obtained from the DSS database.
Variables and Definitions
Length of stay was defined as the number of days from time of admission for the surgical episode to time of discharge. All costs were based on a provider perspective using standardized 2005 costs based on inflation‐adjusted estimates as previously described.3, 25, 26 We assessed resource utilization among patients who received care on an SOS unit by determining length of stay and total, hospital, and physician costs for the specified surgical episode. We also assessed blood bank, ICU, laboratory, pharmacy, physical therapy, occupational therapy, respiratory therapy, radiology, and room‐and‐board costs. Blood bank costs consisted of the costs of storing, processing, and administering the transfusion. Surgical procedure, anesthesia, and preoperative service costs were excluded from our cost analyses, as our aim was to examine hospital flow and resource utilization from time of transfer from the postanesthesia care unit to hospital discharge in order to specifically examine the impact of an SOS unit. We compared unexpected ICU admissions and stays and the resources utilized of patients in these 2 groups.
State and federal death registries confirmed patient expiration and primary cause of death. In‐hospital mortality was defined as death during the same hospital admission as the indexed surgical episode. Thirty‐day mortality was defined as death occurring within 30 days of the surgical procedure. Readmission at 30 days was defined as any admission to our institutions within a 30‐day period whose purpose was possibly related to the initial surgical episode and not a result of an elective admission. A priori we were aware of the small number of these events in the elective joint population. Therefore, we combined inpatient 30‐day mortality, 30‐day reoperation, and 30‐day readmission rates as a composite endpoint.
Specialized Orthopedic Surgery Units
An SOS unit was defined as a general care nursing unit where patients receive all their postoperative care after elective TKA. Such a unit has a multidisciplinary staff that has orthopedic expertise. The differences between an SOS unit and a NON unit are described in Table 1. Bed availability at the time of discharge from the postanesthesia care unit was the exclusive factor for admission to this unit. Bed availability was dependent on staff availability or whether there was an excess number of operative cases. The number and severity of patient medical comorbidities or complications, the time of discharge from the postanesthesia care unit, and patient room preference had no impact on which unit patients were admitted to. Patients were allocated to the SOS group or the NON unit group according to their physical location the evening of admission. Monitored beds at this facility are solely located in the ICU, and neither SOS nor NON units have this capability. Any patient requiring a monitored bed at any time, regardless of the reason, would be transferred directly to the ICU. Daily rounds were performed on either unit by the primary orthopedic team. The need for either medical or pain service consultation was at the discretion of the primary orthopedic team and not dependent on the patient's physical location.
| Specialized orthopedic surgical unit (SOS) | Nonorthopedic nursing unit (NON) | |
|---|---|---|
| ||
| Type of unit | Orthopedic general care unit. | General surgical care unit. |
| Patient type | Postoperative elective orthopedic only. | Any patientmedical or surgical. |
| Determinants of physical location for orthopedic patient | Primary bed assignment. | Admitted only if SOS units have reached full bed capacity. |
| Orthopedic‐trained nursing staff | Yesrequired to have additional post‐RN* training in orthopedics. These RNs rarely float to nonorthopedic units. | Nomay have additional training or experience in an unrelated medical or surgical discipline. Floating to other units may occur. |
| Orthopedic‐specific physical + occupational therapy | Provided by certified physical therapists trained in lower‐extremity joint procedures. Site‐based therapy available to all patients on SOS units. | Provided by certified physical therapists who do not necessarily have postoperative orthopedic lower‐extremity specialization. Site‐based therapy on NON unit available to all patients. |
| Licensed social workers | Dedicated to postoperative needs of orthopedic patients physically located on SOS units. | Not specifically dedicated to the postoperative elective orthopedic joint patient and not physically located on these units. |
| Interdisciplinary team meetings | Patient care addressed in a interdisciplinary team meeting 3 times weeklyconsists of an RN, physical and occupational therapists, social worker, and physician. | No care team meetings, as patients are off‐service. |
| Physician postoperative order set | Orthopedic‐specific order set that is available hospitalwide. Nursing staff on these units is familiar with these order sets. | Orthopedic‐specific order set available hospitalwide. Nursing staff on these units may not be entirely familiar with these order sets. |
| Rehabilitation protocols | Orthopedic specific. | Not orthopedic specific. |
| Patient‐care instructions | Orthopedic diagnosis‐specific instructions readily available | Orthopedic diagnosis‐specific instructions available but requires staff to obtain information and forms from the SOS inits. |
| Discharge protocol | Specifically targeted to the postarthroplasty patient | Generic hospitalwide protocol. |
| Hospital discharge summary | Yescowritten by primary orthopedic team and primary orthopedic RN. | Yescowritten by primary orthopedic team and nonorthopedic RN. |
| Orthopedic‐specific discharge instructions | Yescowritten by primary orthopedic team and primary orthopedic RN. | No. |
All data were subsequently combined into a single database to facilitate data analysis. We further excluded 44 patients because no cost information was available, 9 patients who had multiple joint replacements performed during the specified surgical hospitalization, 69 patients because they had not authorized their medical records to be used for the purposes of research; 163 patients admitted directly to the ICU, 63 patients admitted the day prior to surgery, and 1 patient whose billing data suggested an outpatient encounter. A final patient cohort of 5534 patients was in the analysis. With the observed sample size and the overall variability, our study had 80% power to detect a difference between the 2 groups as small as 0.22 days in length of stay and $761 in hospital costs. The study was approved by our institutional review board. All study patients had authorized the use of their medical records for the purposes of research. Funding was obtained through an intramurally sponsored Small Grants Program by the Division of General Internal Medicine, which had no impact on the design of the study, reporting, or decision to submit an article on the study for publication.
Statistical Analysis
The statistical analysis compared baseline health and demographic characteristics of the patients cared for on SOS units with those cared for on NON units using chi‐square tests for nominal factors and the 2‐sample Wilcoxon rank sum tests for continuous variables. We used the chi‐square test to test for unadjusted differences in sex, patient residence (local or referred), race, individual Charlson comorbid conditions, anesthesia type, admitting diagnosis, 30‐day readmission rate, and discharge location. The 2‐sample Wilcoxon rank sum test assessed unadjusted differences in length of stay, costs, age, ICU days of stay, number of reoperations, total Charlson score and ASA class. Thirty‐day mortality rates were tested using the Fisher exact test.
Differences between patients in SOS and NON units in length of stay (LOS) and costs were the study's primary outcomes. We adjusted for baseline and surgical covariates using generalized linear regression models for these outcomes. The effect of the nursing unit was based on regression coefficients for age, sex, ASA class, anesthesia type, Charlson comorbidities, and surgical year. Age was analyzed using 5 categories: <55; 55‐64; 70‐74; 54‐69, and >75 years, with 65‐69 years used as the reference group. Each Charlson comorbid condition was treated as an indicator variable. Indicator variables were also assigned to surgical year, with 2004 used as the reference. These variables were subsequently entered into the model to calculate the differences between patients on an SOS unit and those on a NON unit.
Our secondary outcomes included ICU utilization and 30‐day outcomes of mortality, reoperations, and readmissions. We then assessed the effect of treatment on the SOS unit using the entire cohort (n = 5534) for unplanned postoperative ICU stay (yes or no) and on our combined endpoint after adjusting for the variables listed previously, using logistic regression models. A P value < 0.05 was considered statistically significant. All analyses were performed using statistical software (SAS, version 9.1; SAS Institute Inc, Cary, NC).
RESULTS
Baseline patient characteristics are represented in Table 2. Five thousand and eighty‐two patients were admitted to an SOS unit, and 452 patients were admitted to a NON unit. The annual number of patients undergoing TKA increased during our study period, as did the number of patients cared for on NON units. There were no differences between groups in the number of local county patients or in the number of patients primarily referred by other providers for elective arthroplasty. Mean length of stay was 4.9 days in both groups. After adjusting for the specified covariates, including age, sex, year of surgery, Charlson comorbidities, ASA class, and type of anesthesia, LOS was 0.234 days shorter in the SOS group (95% confidence interval [CI]: 0.08, 0.39; P = .002). Overall and hospital costs were significantly lower in the SOS group, as outlined with the other costs in Table 3. Room‐and‐board costs were 5.3% lower for SOS patients than for patients on NON units, representing a per‐patient difference of $244 $87 (95% CI: $72, $415; P = .005).
| Specialized orthopedic surgery unit (n = 5082) | Nonorthopedic nursing unit (n = 452) | P value | |||
|---|---|---|---|---|---|
| n | % | n | % | ||
| |||||
| Age (years) | |||||
| <55 | 534 | 10.5% | 57 | 12.6% | |
| 55‐64 | 1148 | 22.6% | 101 | 22.4% | |
| 65‐69 | 802 | 15.8% | 66 | 14.6% | |
| 70‐74 | 1106 | 21.8% | 91 | 20.1% | |
| >75 | 1492 | 29.4% | 137 | 30.3% | |
| Mean age ( SD*) | 68.3 10.75 | 67.9 11.5 | .50 | ||
| Sex | .70 | ||||
| Male | 2173 | 42.8% | 189 | 41.8% | |
| Female | 2909 | 57.2% | 263 | 58.2% | |
| Race | .28 | ||||
| White | 4731 | 93.1% | 420 | 92.9% | |
| Other* | 51 | 1.0% | 8 | 1.8% | |
| Unknown | 300 | 5.9% | 24 | 5.3% | |
| Local Olmsted County patients | 772 | 15.2% | 58 | 12.8% | .18 |
| Indication for surgery | .03 | ||||
| Osteoarthritis | 4778 | 94% | 430 | 95.1% | |
| Rheumatologic disease | 184 | 3.6% | 6 | 1.3% | |
| Avascular necrosis | 62 | 1.2% | 5 | 1.1% | |
| Congenital | 6 | 0.1% | 1 | 0.2% | |
| Cancer | 22 | 0.4% | 5 | 1.1% | |
| Other | 30 | 0.6% | 5 | 1.1% | |
| Year of surgery | < .001 | ||||
| 1996 | 497 | 98.8% | 6 | 1.19% | |
| 1997 | 571 | 99.7% | 2 | 0.35% | |
| 1998 | 479 | 98.8% | 6 | 1.24% | |
| 1999 | 487 | 94.8% | 27 | 5.25% | |
| 2000 | 458 | 92.7% | 36 | 7.29% | |
| 2001 | 502 | 86.7% | 77 | 13.3% | |
| 2002 | 593 | 89.2% | 72 | 10.8% | |
| 2003 | 639 | 87.1% | 95 | 12.9% | |
| 2004 | 856 | 86.7% | 131 | 13.3% | |
| Charlson score (mean SD) | 0.256 0.536 | 0.288 0.593 | .23 | ||
| AIDS | 0 | 0% | 1 | 0.22% | 1.00 |
| Cancer | 85 | 1.68% | 7 | 1.55% | .84 |
| Cerebrovascular disease | 32 | 0.63% | 0 | 0% | .09 |
| Chronic pulmonary disease | 28 | 5.63% | 23 | 5.09% | .63 |
| Congestive heart failure | 89 | 1.75% | 22 | 4.87% | < .001 |
| Dementia | 10 | 0.2% | 2 | 0.44% | .28 |
| Diabetes | 603 | 11.9% | 58 | 12.8% | .54 |
| Hemiplegia | 9 | 0.18% | 0 | 0% | .37 |
| Metastatic solid tumor | 11 | 0.22% | 2 | 0.44% | .34 |
| Myocardial infarction | 29 | 0.57% | 4 | 0.88% | .4 |
| Peripheral vascular disease | 67 | 1.32% | 4 | 0.88% | .43 |
| Renal disease | 52 | 1.02% | 5 | 1.11% | .87 |
| Rheumatologic disease | 12 | 0.24% | 2 | 0.44% | .40 |
| Ulcers | 15 | 0.3% | 0 | 0% | .25 |
| ASA class‖ | |||||
| I | 99 | 2.0% | 12 | 2.7% | |
| II | 2891 | 56.9% | 255 | 56.4% | |
| III | 2084 | 41.0% | 183 | 40.5% | |
| IV | 8 | 0.2% | 2 | 0.4% | |
| Average ASA class ( SD) | 2.39 0.53 | 2.39 0.55 | .80 | ||
| Anesthesia type | .02 | ||||
| General | 1644 | 32.4% | 143 | 31.6% | |
| Regional | 2742 | 54% | 226 | 50% | |
| Combined | 696 | 13.7% | 83 | 18.4% | |
| Unadjusted values | Adjusted values | ||||||||
|---|---|---|---|---|---|---|---|---|---|
| SOS* | SD | NON | SD | P value | Difference | SD | P value | 95% CI | |
| |||||||||
| Total cost | $9989 | $5392 | $10,067 | $5075 | .77 | $600 | $244 | .01 | $122, $1079 |
| Hospital costs | $9789 | $5123 | $ 9805 | $4647 | .23 | $594 | $231 | .01 | $141, $1047 |
| Room & board | $4399 | $1825 | $ 4577 | $1579 | .04 | $244 | $ 87 | .005 | $ 72, $ 415 |
| ICU costs | $ 58 | $1094 | $ 107 | $ 682 | .35 | $ 11 | $ 51 | .82 | $111, $ 88 |
| Pharmacy | $ 851 | $1701 | $ 931 | $1823 | .34 | $ 87 | $ 85 | .30 | $ 79, $253 |
| Laboratory costs | $ 386 | $ 438 | $ 395 | $ 405 | .65 | $ 27 | $ 20 | .18 | $ 12, $ 65 |
| Radiology costs | $ 98 | $ 205 | $ 103 | $ 183 | .61 | $ 1 | $ 10 | .93 | $ 20, $ 19 |
| PT/OT**/RT | $ 739 | $ 505 | $ 682 | $ 394 | .004 | $ 15 | $ 19 | .45 | $ 23, $ 52 |
| Blood bank | $ 159 | $ 306 | $ 178 | $3023 | .22 | $ 6 | $ 15 | .69 | $ 35, $ 23 |
| Physician costs | $ 207 | $ 464 | $ 258 | $ 628 | .09 | $ 20 | $ 22 | .386 | $ 24, $ 63 |
| E&M costs‖ | $ 89 | $ 211 | $ 109 | $ 238 | .09 | $ 4 | $ 9 | .658 | $ 23, $ 14 |
| Physician radiology | $ 63 | $ 158 | $ 38 | $ 192 | .49 | $ 2 | $ 8 | .78 | $ 13, $ 18 |
| Other costs | $ 34 | $ 138 | $ 37 | $ 160 | .61 | $0.64 | $ 6 | .92 | $ 13, $ 12 |
There were 83 patients (1.63%) transferred from SOS units to the ICU, compared with 14 patients (3.1%) transferred from NON units (P = .02), but no differences in the mean number of ICU days or associated costs between groups. A priori, the authors were aware of the small number of postoperative medical events in this population. In examining the combined endpoint of reoperations, readmissions, and mortality, there were no differences observed in our regression analysis between SOS patients and NON unit patients (0.03 events, standard error: 0.1859; odds ratio: 0.976). Table 4 demonstrates a higher percentage of patients discharged with home health on the NON units than on the SOS units (8.41% vs. 4.62%; P < .001).
| Specialized orthopedic surgery unit | Nonorthopedic nursing unit | P value | |||
|---|---|---|---|---|---|
| n* | % | n | % | ||
| |||||
| Home | 3812 | 75% | 328 | 72.6% | .252 |
| Home health | 235 | 4.62% | 38 | 8.41% | < .001 |
| Transferred to skilled nursing facility | 1030 | 20.3% | 86 | 19% | .529 |
DISCUSSION
To the best of our knowledge, this is the first study to examine the impact of specialized orthopedic surgery units on resource utilization in elective knee arthroplasty patients. Our findings demonstrate that patients admitted following elective TKA to SOS units will have a reduced length of stay, lower overall and hospital costs, and fewer unexpected transfers to higher levels of care (ICUs). We believe that these findings are a result in part of the specialized expertise allied health care providers develop by taking care of and focusing on a large volume of patients over time with the same group and type of surgeons. This multidisciplinary setting in which care providers are familiar not only with each other but with this specific population of patients creates the environment necessary for adherence to specialized clinical pathways.27
Patient LOS is an important determinant of resource utilization. In a study by Husted et al., the mean length of stay in Danish hospitals following TKA was 8.6 days in 2003.28 An epidemiological study using the Nationwide Inpatient Sample database of patients in the United States showed that from 1998 to 2000, the mean LOS was 4.3 days.18 In our study, the mean LOS was slightly higher (4.9 days), potentially reflecting referral bias. Achieving additional savings and improved outcomes by further reducing LOS in an environment in which care pathways are already in place is often difficult; hence, alternative approaches and strategies are often necessary.29, 30 Our results suggest that in TKA patients, after adjusting for other factors, there is a decrease in the length of stay of 0.234 days among those cared for on SOS units. However, we cannot state that the existence of the clinical pathway alone is responsible for our data differences because certain components of the care pathway for elective TKA patients are used throughout the hospital regardless of type of postoperative nursing unit. We believe that the interdisciplinary specialty care provided to orthopedic patients on SOS units is a critical component of a successfully implemented care pathway and not just a convenience or practice preference. The same surgeons admitting patients to the same nursing unit, with the same nurses, physical therapists and pharmacists providing care to the same type of patient population over time, leverages the collective experience of all care providers. This integrated, multidisciplinary teamwork may optimize timeliness, achieve incremental cost savings, and improve safety (including a decreased number of unanticipated transfers to an ICU setting).
Clinical pathways are known to reduce overall costs, normally by reducing LOS,29, 3133 and our results suggest approximately an incremental 6% cost reduction with the use of improving patient logistics by using SOS units. An economic evaluation study by Healy et al. suggests that focusing on nursing units may be a means of reducing total costs.29 Our cost savings were slightly lower than the reported savings by other practice assessments; however, we excluded operative and anesthesia costs, both significant contributors to overall and hospital costs. By eliminating these variables, our costs were specifically limited to the postoperative course, which is highly dependent on specialized interdisciplinary care.29
Providing specialized care has a significant impact on society. Although there is a per‐patient savings of only $600 when elective TKA patients are cared for on SOS units, this could be the difference between a positive and negative margin in the setting of fixed reimbursement. With a current average of 90 patients annually triaged postoperatively to NON units, there is a potential loss of $54,000 annually at our institution in just this single patient population with the current mechanisms of perioperative hospital flow. Multiply this potential savings to a national level, and the total is significant. With an aging population, the number of arthroplasties and concomitantly the number of hospitalizations in general are likely to increase, suggesting that changes in hospital flow are required to ensure optimal, cost‐effective care in the best setting available for patients. Such care is often related to surgical volume, and our institution observes such volume. Our results indicate that SOS units are one possible means of achieving this objective of fiscal sustainability, but further studies are needed to determine the indirect and hidden costs of sustaining such units in order to observe the actual cost savings.34 It could be argued that for elective TKA patients to have the most optimal outcomes and most efficient care, the surgical procedure should be performed only if beds are available on the nursing units whose staff has the most specific training.
Thirty‐Day Outcomes
We elected to combine 30‐day mortality, reoperations, and readmissions pertaining to the joint procedure as a composite endpoint and found no differences in outcomes between groups. These results suggest that these longer‐term patient‐specific outcomes are likely not related to the specialty nursing care. We used a 30‐day endpoint assuming that a longer period may have led to the inclusion of deaths that were not directly attributable to the surgical intervention. In addition, a previous study advocated using 30 days as an endpoint for follow‐up, as it adequately accounts for adverse events.35 Our institution is also a referral center; hence, we would likely be unable to capture all events if we were to use the standard 90‐day period used for payment for this procedure, as these data are not canvassed by the joint registry.
Discharge Disposition
NON unit patients tended to have a higher degree of home health arranged at discharge. The NON unit nursing staff cares for other nonorthopedic surgical patients daily and may transfer their patterns of care utilization to the orthopedic patients despite different postoperative needs. In addition, if NON unit nursing staff members care for TKA patients only intermittently, they may not have as clear a working understanding of the particular postoperative requirements of TKA patients and consequently request unnecessary home health services and general community resources. Alternatively, patients cared for on NON units may actually have needed more assistance and more services on discharge. Although purely speculative, patients cared for by dedicated orthopedic surgery staff may develop added confidence from the experience of the allied care staff and feel less of a need for postdismissal services.
Role of Hospitalists in Specialized Care Pathways
Hospitalists are known to improve efficiency without reducing patient satisfaction. Their role has been demonstrated in different patient populations.1, 2, 3638 In a study of hip fracture patients, a hospitalist care model demonstrated a reduction in length of stay and time to surgery, without compromising long‐term outcomes.4, 39 Utilizing a hospitalist/midlevel care provider team approach to reduce LOS in units with a static number of beds can possibly increase bed turnover and prevent triaging of patients onto NON units. This is but one example of how a medical‐surgical partnership can improve outcomes. However, in an era where cost‐effective and regulatory practices require optimal resource allocation, hospitalists are in a key position to foster quality improvement projects, promote patient safety measures, and enhance systems care delivery. Becoming involved in designing specialized clinical units, with an emphasis on a multidisciplinary care approach, and developing their relationships with hospital administrators and nursing staff should be among their priorities. The Society of Hospital Medicine has also been committed to the care of the elderly through its core competencies40 and the orthopedic population that will benefit from such process changes and care pathways. Hospital innovations such as the implementation of SOS‐type units not only for other medical‐surgical partnerships but also for site‐based units caring for geriatric patients can be top priorities for hospitalists.
Strengths and Applicability
Our results are important in that they can likely be applied to both large tertiary‐care centers and smaller community‐based centers that perform specialized orthopedic surgeries. Nurses on specialized orthopedic units are very familiar with this postoperative population and have developed expertise in the care of these patients. These experienced nurses can likely be found on orthopedic units in tertiary‐care centers or surgical units in smaller facilities. Furthermore, our results support the benefits of interdisciplinary advanced teamwork. When an interdisciplinary group of health care providers works together on a daily basis, certain habits and patterns inevitably develop that often are unplanned and may be difficult to measure. This enhanced patient flow may not occur if these patients are cared for by providers unfamiliar with each other's work patterns. The importance of optimized teamwork is not hospital‐size dependent. Only primary elective knee arthroplasties were included to minimize confounding bias by bilateral or revision surgeries or indications such as septic arthritis, which are known to lead to increased length of stay, costs and complications.41
Limitations
Our study has the limitations of its retrospective nonrandomized study design, and only a prospective, randomized investigation could definitively address our aims. By excluding sicker patients, such as those referred with complicated health issues or high‐risk patients who required admission in advance of the proposed surgery for monitoring of perioperative anticoagulation issues, our estimates of possible differences between our comparison groups may have been conservative. We are unaware of how these sicker patients would fare on either nursing unit. Furthermore, what occurs in the hospital setting may not only have an impact on the hospital stay but may also influence long‐term outcomes. This is impossible to assess with analysis of administrative databases.
We relied on the complete and accurate recording of data from various databases, depending on the validity of data entry and collection. With a large cohort of patients, any errors in documentation or abstraction would be expected to be similar in both groups. Furthermore, confounding variables such as patient comorbidities are extracted from administrative data sets whose personnel might not be as familiar with the medical aspects of patient care. We used linear and logistic regression analyses to account for known differences in baseline characteristics despite the sample sizes being proportionally larger in the SOS group. Although we attribute the shortened length of stay in the SOS group to the interdisciplinary team approach, we were unable to determine to what extent this was a result of nursing staff or discharge planning. By using administrative databases, we were unable to abstract the consensus time and date of discharge, when all hospital staff deemed the patient ready for discharge, and hence relied on the actual time of discharge, which can be heavily reliant on availability at skilled nursing facilities. In addition, it was unknown whether patients discharged from SOS units were, by matter of protocol, discharged earlier in the day. Nevertheless, this small difference in length of stay can improve patient flow by opening up postoperative patient beds. Furthermore, such data sets are unable to provide information on patient satisfaction or quality‐of‐life measures, both of which are important determinants in specialized care pathways.42 The patient population served by our institution is generally ethnically homogeneous, thereby limiting potential generalizations to tertiary‐care centers or geographical areas with a population similar to ours. Our study also was not intended as a formal cost‐effectiveness analysis; hence, the impact of possible startup costs to begin a similar nursing unit was not explored. Although differences in practice management can be considered a limitation of not only operative but also perioperative care, we neither expected nor encountered any significant or drastic alterations during the study period, and year of surgery was adjusted for in our analysis. However, prospective randomized controlled studies testing specific clinical pathways and practice‐related innovations are needed to better examine these outcomes.
CONCLUSIONS
In conclusion, postoperative patients after elective knee arthroplasty cared for on specialized orthopedic surgery units have shorter length of stays and cost hospitals less than patients admitted to nonspecialized orthopedic nursing units. In an era in which quality indicators and external reviews are forcing practitioners and health care organizations to become increasingly responsible for their own practices, more research is required to better address specific questions pertaining to different processes of care. Our study is meant to increase the attention paid to patient flow and postoperative logistics in the elective TKA population. SOS units, as a unique model of care, may become an additional step toward ensuring quality care and improved resource utilization.
Acknowledgements
The authors thank Donna K. Lawson, LPN, for her assistance in data collection and management.
- ,,,,,.Implementation of a voluntary hospitalist service at a community teaching hospital: improved clinical efficiency and patient outcomes.Ann Intern Med.2002;137:859–865.
- ,,, et al.Effects of physician experience on costs and outcomes on an academic general medicine service: results of a trial of hospitalists.Ann Intern Med.2002;137:866–874.
- ,,, et al.Medical and surgical comanagement after elective hip and knee arthroplasty: a randomized, controlled trial.Ann Intern Med.2004;141:28–38.
- ,,, et al.Effects of a hospitalist model on elderly patients with hip fracture.Arch Intern Med.2005;165:796–801.
- ,,,,.The economic benefit for family/general medicine practices employing physician assistants.Am J Manag Care.2002;8:613–620.
- ,,, et al.Economic evaluation of Australian stroke services: a prospective, multicenter study comparing dedicated stroke units with other care modalities.Stroke.2006;37:2790–2795.
- ,,,.Geriatric evaluation and management units in the care of the frail elderly cancer patient.J Gerontol A Biol Sci Med Sci.2005;60:798–803.
- ,,,,,.A randomized, controlled trial of a geriatric assessment unit in a community rehabilitation hospital.N Engl J Med.1990;322:1572–1578.
- ,.The effect of longevity on spending for acute and long‐term care.N Engl J Med.2000;342:1409–1415.
- ,,, et al.The Bone and Joint Decade 2000‐2010.Acta Orthop Scand.1998;69:219–220.
- .The Bone and Joint Decade 2000‐2010— for prevention and treatment of musculoskeletal disease.Osteoarthr Cartil.1998;7:1–4.
- Prevalence of self‐reported arthritis or chronic joint symptoms among adults—United States, 2001.MMWR Morb Mortal Wkly Rep.2002;51:948–950.
- ,,, et al.Estimates of the prevalence of arthritis and selected musculoskeletal disorders in the United States.Arthritis Rheum.1998;41:778–799.
- HCUPnet, Healthcare Cost and Utilization Project. Agency for Healthcare Research and Quality, 2002. Available at: http://www.ahrq.gov. Accessed January 25,2005.
- ,,,,,.Costs and cost‐effectiveness in hip and knee replacements. A prospective study.Int J Technol Assess Health Care.1997;13:575–588.
- ,,,,.Trends in total knee replacement surgeries and implications for public health, 1990‐2000.Public Health Rep.2005;120:278–282.
- ,,, et al.Demographic variation in the rate of knee replacement: a multi‐year analysis.Health Serv Res.1996;31:125–140.
- ,,,,.Trends in the epidemiology of total shoulder arthroplasty in the United States from 1990‐2000.Arthritis Rheum.2006;55:591–597.
- ,.2001 National Hospital Discharge Survey.Adv Data.2003;332.
- ,.2002 National Hospital Discharge Survey.Adv Data.2004:1–29.
- ,,.Costs of health care administration in the United States and Canada.N Engl J Med2003;349:768–775.
- ,,.Maintaining a hip registry for 25 years. Mayo Clinic experience.Clin Orthop Relat Res.1997:61–68.
- ,,,.Validation of a combined comorbidity index.J Clin Epidemiol.1994;47:1245–1251.
- ,,,.A new method of classifying prognostic comorbidity in longitudinal studies: development and validation.J Chronic Dis.1987;40:373–383.
- ,,, et al.A prospective randomized comparison of laparoscopic appendectomy with open appendectomy: Clinical and economic analyses.Surgery.2001;129:390–400.
- ,,, et al.Incremental costs of enrolling cancer patients in clinical trials: a population‐based study.J Natl Cancer Inst.1999;91:847–853.
- ,.Understanding the complexity of redesigning care around the clinical microsystem.Qual Saf Health Care.2006;15(Suppl 1):i10–i16.
- ,,, et al.Length of stay after primary total hip and knee arthroplasty in Denmark, 2001‐2003.Ugeskr Laeger.2006;168:276–279.
- ,,,.Opportunities for control of hospital costs for total joint arthroplasty after initial cost containment.J Arthroplasty.1998;13:504–507.
- ,,,,.Effectiveness of clinical pathways for total knee and total hip arthroplasty: literature review.J Arthroplasty.2003;18:69–74.
- ,,, et al.The effect of a perioperative clinical pathway for knee replacement surgery on hospital costs.Anesth Analg.1998;86:978–984.
- The cost effectiveness of streamlined care pathways and product standardization in total knee arthroplasty.J Arthroplasty.1999;14:182–186.
- ,,,,.Impact of cost reduction programs on short‐term patient outcome and hospital cost of total knee arthroplasty.J Bone Joint Surg Am.2002;84‐A:348–353.
- ,,,.Success of clinical pathways for total joint arthroplasty in a community hospital.Clin Orthop Relat Res.2007;457:133–137.
- ,,,.Optimal timeframe for reporting short‐term complication rates after total knee arthroplasty.J Arthroplasty.2006;21:705–711.
- ,,.Associations with reduced length of stay and costs on an academic hospitalist service.Am J Manag Care.2004;10:561–568.
- ,,.Is there a geriatrician in the house? Geriatric care approaches in hospitalist programs.J Hosp Med.2006;1:29–35.
- .Care of hospitalized older patients: opportunities for hospital‐based physicians.J Hosp Med.2006;1:42–47.
- ,,, et al.Effects of a hospitalist care model on mortality of elderly patients with hip fractures.J Hosp Med.2007;2:219–225.
- ,,,,.Core competencies in hospital medicine: development and methodology.J Hosp Med.2006;1:48–56.
- ,,,,,.Effect of feedback on resource use and morbidity in hip and knee arthroplasty in an integrated group practice setting.Mayo Clin Proc.1996;71:127–133.
- ,,,.Integrated care pathways.BMJ.1998;316:133–137.
Copyright © 2008 Society of Hospital Medicine
Improving nurse working conditions: Towards safer models of hospital care
Over the past decade, an emerging body of literature established a link between nurses' working conditions and their ability to provide safe care. Nurses who are not at their best are both prone to making errors themselves, and less able to serve as effective safety nets for their patients, intercepting errors made by physicians and others.1 Excessive nurse workloads predict an increased rate of adverse events,2, 3 and, by their own reports, nurses working shifts of >12 hours are at greatly increased risk of making medical errors.4, 5 On the basis of these and related findings, the Institute of Medicine has recommended: a) that efforts be made to assure appropriate nurse workloads and b) that nurses work no more than 12 hours per day and 60 hours per week;6 but these recommendations have not been broadly enforced.7
Two articles in the current issue of the Journal of Hospital Medicine add to our understanding of the relationship between nurse working conditions and safety, and substantiate the need to improve nurses' working conditions. In the first, Surani et al. conducted a pilot study of 20 night nurses working 12‐hour shifts in which well‐validated, objective tools revealed that ICU nurses were suffering from pathologic levels of drowsiness on the job.8 The topic is of importance as recent survey work demonstrated that nurses working >12 hours and resident‐physicians working shifts of 24 of more hours make significantly more medical errors and suffer many more occupational injuries than those working less exhausting schedules.4, 5, 912 Objective data on resident‐physicians has corroborated these findings,13, 14 but objective data measuring sleepiness in nurses has been lacking. Surani et al.'s study helps to fill this need. Further, this study suggests that hospitals should not be complacent about the safety of 12‐hour shifts, which may still be associated with dangerous levels of drowsiness‐induced impairment. Careful management of the number of consecutive night shifts,15 or further reductions in nursing work hours even beyond the 12‐hour limit endorsed by the IOM may be in orderparticularly in high‐risk critical care environmentsthough further research substantiating Surani et al.'s findings and comparing alternative scheduling options would be valuable.
The second study by Conway et al. analyzed data for acute care hospitals in California from 1993 to 2004, and found that following the passage of nurse staffing legislation in 1999 and its implementation in 2004, nurse‐patient staffing ratios increased significantly.16 Safety‐net hospitals, however, with high proportions of vulnerable patient populations, were least likely to achieve mandated ratios. As the authors point out, diverting funds to achieve mandated ratios in under‐funded safety net hospitals could potentially lead to reductions in other essential services, though whether such an eventuality might come to pass has not been adequately assessed to date.
In light of these data, where should we go from here? Public and professional concerns over the impact of fewer nurses on the delivery of care have led to the passage of legislation or adoption of regulations by many states in an attempt to ensure safe care. Examples include elimination of mandatory overtime in the following states: CT, IL, ME, MD, MN, NJ, NH, OR, RI, WA, WV, CA, MO, and TX; implementation of nurse staffing plans with input from staff nurses (WA, IL, OR, RI, TX), and mandates of specific nurse to patient ratios (CA [as discussed by Conway et al.] and FL).17 Proposed legislation regarding nurse staffing and nurse‐to‐patient ratios is currently under consideration in many additional states. Legislation broadly restricting nurse work hours has not been passed by the federal government or individual states, but some hospital systems including the Veteran's Administration now have policies prohibiting shifts of greater than 12 hours and work weeks of greater than 60 hours.18
Unfortunately, several major barriers have made the implementation of safer work hours and workloads challenging, and uncertainty about the effectiveness of implementation efforts remains. A major challenge has been the presence of a serious shortage of nurses, which is expected to peak by 2020.19 A lack of nurses will make both staffing and scheduling initiatives difficult. Over the next 10 to 15 years, policies that fund nursing education or otherwise address this shortfall will consequently be essential.
A second challenge in efforts to implement safer work schedules appears to be an absence of knowledge about the hazards of sleep deprivation, compounded by financial pressures that may lead to unsafe schedules. Some nurses oppose restriction of work hours citing that they know when they are tired, their schedule works for their personal life, and they should be allowed to work as much as they want to earn the salary they want/need. Unfortunately, it has been well‐demonstrated that chronically sleep‐deprived individuals routinely under‐estimate their level of impairment, calling into question the ability of nurses and others working extreme hours to accurately judge their abilities to perform safely.20
Clearly, education on the effects of fatigue on performance is needed, as are widespread efforts to implement safe schedules. Further study of work injuries, medical errors, and their relation to fatigue and specific work schedules is warranted, as well as studies of the impact of fatigue on sick calls and absenteeism. In many tightly staffed hospitals, overtime is used to provide coverage for sick calls, which in turn potentiates further risk of fatigue. As a profession, nurses need to take the fear factor out of saying I'm tired and advocate for adequate breaks, naps, and diet. Nurse leaders often find that offering 12‐hour shifts is required to recruit nurses, and that rotating shiftssometimes in a manner that can lead to significant circadian misalignmenthelps balance the schedule and preference for day shifts. They are also aware that a scheduled 3‐day work week is attractive to many nurses, as it allows those desiring greater income to work additional shifts through an agency at premium pay, though this may lead to further sleep deprivation. It is easy to conceive how these factors can lead to a serious conundrum.
How best to address concerns over nurse staffing remains a subject of ongoing debate. Higher nurse‐to‐patient ratios have been associated in multiple studies and a meta‐analysis with lower rates of complications and mortality.3, 21 Understanding the causal relationship between ratios and outcomes, however, has been complicated by consideration of confounding hospital variables and varying acuity of patient care between centers. The number of patients a nurse can safely care for at any one time is likely a product of the acuity of the patients, the education and experience of the nurse, and the makeup of the team available to care for the patients' needs. How well implementation of mandates regarding nurse‐patient ratios can address this complex need is unclear, and should be a focus of future research.
Leadership is essential in implementing work hour standards and staffing plans to promote a high‐quality nursing environment. Hospitals with poor operating margins, poor leadership, or poor environments of care will be unable to retain nurses to meet care requirements. Magnet hospitals, with nurse leaders who promote RN empowerment, can develop less stressful work environments with lower turnover rates and greater job satisfaction, which positively impacts quality of care. The Magnet Recognition Program, developed by the American Nurses Credentialing Center (ANCC), has recognized less than 300 hospitals in the US as providing nursing excellence (
State and federal regulation may address initial safety needs, but it cannot in isolation address all of the elements that contribute to high‐quality care. While data are limited, it is possible that in financially constrained hospitals, suboptimal implementation of mandates may potentially lead to misuse of limited resources. Future research should directly assess the net effects of implementing nurse scheduling and staffing policies on mortality, hospital complication rates, and the safety of patient care processes across diverse medical centers and patient care settings. Building upon the research of Surani, Conway, and their colleagues, such research could help promote the further development of optimal care policies and the quality of patient care.
- ,,,,,, et al.Recovery from medical errors: the critical care nursing safety net.Jt Comm J Qual Patient Saf2006;32(2):63–72.
- ,,,,,, et al.Hospital workload and adverse events.Med Care2007;45(5):448–455.
- ,,,,.Nurse staffing and quality of patient care.Evid Rep Technol Assess (Full Rep)2007(151):1–115.
- ,,,,.The working hours of hospital staff nurses and patient safety.Health Aff (Millwood)2004;23(4):202–212.
- ,,,.Effects of critical care nurses' work hours on vigilance and patients' safety.Am J Crit Care2006;15(1):30–37.
- Institute of Medicine.Keeping Patients Safe: Transforming the Work Environment of Nurses.2006. Washington, DC, The National Academies Press.
- ,,,,.How Long and How Much Are Nurses Now Working?Am J Nursing2006;106(4):60–71.
- ,,,,.Sleepiness in Critical Care Nurses: Results of a Pilot Study.J Hosp Med20083(3):200–205.
- ,.Work schedule characteristics and substance use in nurses.Am J Ind Med1998;34(3):266–271.
- ,,,,,, et al.Extended work shifts and the risk of motor vehicle crashes among interns.N Engl J Med2005;352(2):125–134.
- ,,,,,, et al.Impact of extended‐duration shifts on medical errors, adverse events, and attentional failures.PLoS Med2006;3(12):e487.
- ,,,,,, et al.Extended work duration and the risk of self‐reported percutaneous injuries in interns.JAMA2006;296(9):1055–1062.
- ,,,,,, et al.Effect of reducing interns' weekly work hours on sleep and attentional failures.N Engl J Med2004;351(18):1829–1837.
- ,,,,,, et al.Effect of reducing interns' work hours on serious medical errors in intensive care units.N Engl J Med2004;351(18):1838–1848.
- ,.Shift work, safety and productivity.Occup Med (Lond)2003;53(2):95–101.
- ,,,.Nurse Staffing Ratios: Trends and Policy Implications for Hospitalists and the Safety Net.J Hosp Med20083(3):193–199.
- American Nurses Association. Nationwide State Legislative Agenda, 2007–2008 Reports. Accessed May 12,2008 at http://www.nursingworld.org/MainMenuCategories/ANAPoliticalPower/State/StateLegislativeAgenda.aspx
- United States Department of Veteran Affairs. Law Gives VA Flexible Pay for Physicians, Schedules for Nurses.2004. Accessed May 12, 2008 at http://www1.va.gov/opa/pressrel/pressrelease.cfm?id=916.
- ,,. What is Behind HRSA's Projected Supply, Demand, and Shortage of Registered Nurses?2004. Rockville, MD, National Center for Health Workforce Analysis, Health Resources and Services Administration Accessed May 12, 2008 at https://www.ncsbn.org/Projected_Supply_Demand_Shortage_RNs.pdf.
- ,,,.The cumulative cost of additional wakefulness: Dose‐response effects on neurobehavioral functions and sleep physiology from chronic sleep restriction and total sleep deprivation.Sleep2003;26(2):117–126.
- ,,,,.Hospital nurse staffing and patient mortality, nurse burnout, and job dissatisfaction.JAMA2002;288(16):1987–1993.
Over the past decade, an emerging body of literature established a link between nurses' working conditions and their ability to provide safe care. Nurses who are not at their best are both prone to making errors themselves, and less able to serve as effective safety nets for their patients, intercepting errors made by physicians and others.1 Excessive nurse workloads predict an increased rate of adverse events,2, 3 and, by their own reports, nurses working shifts of >12 hours are at greatly increased risk of making medical errors.4, 5 On the basis of these and related findings, the Institute of Medicine has recommended: a) that efforts be made to assure appropriate nurse workloads and b) that nurses work no more than 12 hours per day and 60 hours per week;6 but these recommendations have not been broadly enforced.7
Two articles in the current issue of the Journal of Hospital Medicine add to our understanding of the relationship between nurse working conditions and safety, and substantiate the need to improve nurses' working conditions. In the first, Surani et al. conducted a pilot study of 20 night nurses working 12‐hour shifts in which well‐validated, objective tools revealed that ICU nurses were suffering from pathologic levels of drowsiness on the job.8 The topic is of importance as recent survey work demonstrated that nurses working >12 hours and resident‐physicians working shifts of 24 of more hours make significantly more medical errors and suffer many more occupational injuries than those working less exhausting schedules.4, 5, 912 Objective data on resident‐physicians has corroborated these findings,13, 14 but objective data measuring sleepiness in nurses has been lacking. Surani et al.'s study helps to fill this need. Further, this study suggests that hospitals should not be complacent about the safety of 12‐hour shifts, which may still be associated with dangerous levels of drowsiness‐induced impairment. Careful management of the number of consecutive night shifts,15 or further reductions in nursing work hours even beyond the 12‐hour limit endorsed by the IOM may be in orderparticularly in high‐risk critical care environmentsthough further research substantiating Surani et al.'s findings and comparing alternative scheduling options would be valuable.
The second study by Conway et al. analyzed data for acute care hospitals in California from 1993 to 2004, and found that following the passage of nurse staffing legislation in 1999 and its implementation in 2004, nurse‐patient staffing ratios increased significantly.16 Safety‐net hospitals, however, with high proportions of vulnerable patient populations, were least likely to achieve mandated ratios. As the authors point out, diverting funds to achieve mandated ratios in under‐funded safety net hospitals could potentially lead to reductions in other essential services, though whether such an eventuality might come to pass has not been adequately assessed to date.
In light of these data, where should we go from here? Public and professional concerns over the impact of fewer nurses on the delivery of care have led to the passage of legislation or adoption of regulations by many states in an attempt to ensure safe care. Examples include elimination of mandatory overtime in the following states: CT, IL, ME, MD, MN, NJ, NH, OR, RI, WA, WV, CA, MO, and TX; implementation of nurse staffing plans with input from staff nurses (WA, IL, OR, RI, TX), and mandates of specific nurse to patient ratios (CA [as discussed by Conway et al.] and FL).17 Proposed legislation regarding nurse staffing and nurse‐to‐patient ratios is currently under consideration in many additional states. Legislation broadly restricting nurse work hours has not been passed by the federal government or individual states, but some hospital systems including the Veteran's Administration now have policies prohibiting shifts of greater than 12 hours and work weeks of greater than 60 hours.18
Unfortunately, several major barriers have made the implementation of safer work hours and workloads challenging, and uncertainty about the effectiveness of implementation efforts remains. A major challenge has been the presence of a serious shortage of nurses, which is expected to peak by 2020.19 A lack of nurses will make both staffing and scheduling initiatives difficult. Over the next 10 to 15 years, policies that fund nursing education or otherwise address this shortfall will consequently be essential.
A second challenge in efforts to implement safer work schedules appears to be an absence of knowledge about the hazards of sleep deprivation, compounded by financial pressures that may lead to unsafe schedules. Some nurses oppose restriction of work hours citing that they know when they are tired, their schedule works for their personal life, and they should be allowed to work as much as they want to earn the salary they want/need. Unfortunately, it has been well‐demonstrated that chronically sleep‐deprived individuals routinely under‐estimate their level of impairment, calling into question the ability of nurses and others working extreme hours to accurately judge their abilities to perform safely.20
Clearly, education on the effects of fatigue on performance is needed, as are widespread efforts to implement safe schedules. Further study of work injuries, medical errors, and their relation to fatigue and specific work schedules is warranted, as well as studies of the impact of fatigue on sick calls and absenteeism. In many tightly staffed hospitals, overtime is used to provide coverage for sick calls, which in turn potentiates further risk of fatigue. As a profession, nurses need to take the fear factor out of saying I'm tired and advocate for adequate breaks, naps, and diet. Nurse leaders often find that offering 12‐hour shifts is required to recruit nurses, and that rotating shiftssometimes in a manner that can lead to significant circadian misalignmenthelps balance the schedule and preference for day shifts. They are also aware that a scheduled 3‐day work week is attractive to many nurses, as it allows those desiring greater income to work additional shifts through an agency at premium pay, though this may lead to further sleep deprivation. It is easy to conceive how these factors can lead to a serious conundrum.
How best to address concerns over nurse staffing remains a subject of ongoing debate. Higher nurse‐to‐patient ratios have been associated in multiple studies and a meta‐analysis with lower rates of complications and mortality.3, 21 Understanding the causal relationship between ratios and outcomes, however, has been complicated by consideration of confounding hospital variables and varying acuity of patient care between centers. The number of patients a nurse can safely care for at any one time is likely a product of the acuity of the patients, the education and experience of the nurse, and the makeup of the team available to care for the patients' needs. How well implementation of mandates regarding nurse‐patient ratios can address this complex need is unclear, and should be a focus of future research.
Leadership is essential in implementing work hour standards and staffing plans to promote a high‐quality nursing environment. Hospitals with poor operating margins, poor leadership, or poor environments of care will be unable to retain nurses to meet care requirements. Magnet hospitals, with nurse leaders who promote RN empowerment, can develop less stressful work environments with lower turnover rates and greater job satisfaction, which positively impacts quality of care. The Magnet Recognition Program, developed by the American Nurses Credentialing Center (ANCC), has recognized less than 300 hospitals in the US as providing nursing excellence (
State and federal regulation may address initial safety needs, but it cannot in isolation address all of the elements that contribute to high‐quality care. While data are limited, it is possible that in financially constrained hospitals, suboptimal implementation of mandates may potentially lead to misuse of limited resources. Future research should directly assess the net effects of implementing nurse scheduling and staffing policies on mortality, hospital complication rates, and the safety of patient care processes across diverse medical centers and patient care settings. Building upon the research of Surani, Conway, and their colleagues, such research could help promote the further development of optimal care policies and the quality of patient care.
- ,,,,,, et al.Recovery from medical errors: the critical care nursing safety net.Jt Comm J Qual Patient Saf2006;32(2):63–72.
- ,,,,,, et al.Hospital workload and adverse events.Med Care2007;45(5):448–455.
- ,,,,.Nurse staffing and quality of patient care.Evid Rep Technol Assess (Full Rep)2007(151):1–115.
- ,,,,.The working hours of hospital staff nurses and patient safety.Health Aff (Millwood)2004;23(4):202–212.
- ,,,.Effects of critical care nurses' work hours on vigilance and patients' safety.Am J Crit Care2006;15(1):30–37.
- Institute of Medicine.Keeping Patients Safe: Transforming the Work Environment of Nurses.2006. Washington, DC, The National Academies Press.
- ,,,,.How Long and How Much Are Nurses Now Working?Am J Nursing2006;106(4):60–71.
- ,,,,.Sleepiness in Critical Care Nurses: Results of a Pilot Study.J Hosp Med20083(3):200–205.
- ,.Work schedule characteristics and substance use in nurses.Am J Ind Med1998;34(3):266–271.
- ,,,,,, et al.Extended work shifts and the risk of motor vehicle crashes among interns.N Engl J Med2005;352(2):125–134.
- ,,,,,, et al.Impact of extended‐duration shifts on medical errors, adverse events, and attentional failures.PLoS Med2006;3(12):e487.
- ,,,,,, et al.Extended work duration and the risk of self‐reported percutaneous injuries in interns.JAMA2006;296(9):1055–1062.
- ,,,,,, et al.Effect of reducing interns' weekly work hours on sleep and attentional failures.N Engl J Med2004;351(18):1829–1837.
- ,,,,,, et al.Effect of reducing interns' work hours on serious medical errors in intensive care units.N Engl J Med2004;351(18):1838–1848.
- ,.Shift work, safety and productivity.Occup Med (Lond)2003;53(2):95–101.
- ,,,.Nurse Staffing Ratios: Trends and Policy Implications for Hospitalists and the Safety Net.J Hosp Med20083(3):193–199.
- American Nurses Association. Nationwide State Legislative Agenda, 2007–2008 Reports. Accessed May 12,2008 at http://www.nursingworld.org/MainMenuCategories/ANAPoliticalPower/State/StateLegislativeAgenda.aspx
- United States Department of Veteran Affairs. Law Gives VA Flexible Pay for Physicians, Schedules for Nurses.2004. Accessed May 12, 2008 at http://www1.va.gov/opa/pressrel/pressrelease.cfm?id=916.
- ,,. What is Behind HRSA's Projected Supply, Demand, and Shortage of Registered Nurses?2004. Rockville, MD, National Center for Health Workforce Analysis, Health Resources and Services Administration Accessed May 12, 2008 at https://www.ncsbn.org/Projected_Supply_Demand_Shortage_RNs.pdf.
- ,,,.The cumulative cost of additional wakefulness: Dose‐response effects on neurobehavioral functions and sleep physiology from chronic sleep restriction and total sleep deprivation.Sleep2003;26(2):117–126.
- ,,,,.Hospital nurse staffing and patient mortality, nurse burnout, and job dissatisfaction.JAMA2002;288(16):1987–1993.
Inpatient Hyperglycemia in Children
Diabetes is one of the most common diagnoses in hospitalized patients.1, 2 Hyperglycemia is present in 38% of adults admitted to the hospital, one third of whom had no history of diabetes before admission.3 The impact of inpatient hyperglycemia on clinical outcome in adult patients has been increasingly appreciated. Extensive evidence from observational studies indicates that hyperglycemia in patients with or without a history of diabetes is an important marker of poor clinical outcome.312 Several prospective randomized trials in patients with critical illness have shown that aggressive glycemic control improves short‐ and long‐term mortality, multiorgan failure and systemic infection, and length of hospitalization.1317 The importance of glucose control also applies to adult patients admitted to general surgical and medical wards.3, 6, 18 In such patients, we recently reported that the presence of hyperglycemia is associated with prolonged hospital stay, infection, disability after hospital discharge, and death.3, 6, 18 Despite the extensive data in adult patients, there is little information on the impact of inpatient hyperglycemia in pediatric patients. The few observational studies in critically ill children admitted to the pediatric ICU with severe brain injury or extensive burn injuries have shown a positive association between inpatient hyperglycemia and increased length of hospital and ICU stay and a higher risk of complication and mortality rates.1923 No previous studies, however, have examined the association of hyperglycemia and clinical outcome in children admitted to a general community pediatric hospital. Therefore, in this study we determined the prevalence of inpatient hyperglycemia and examined the impact of hyperglycemia on morbidity and mortality in children admitted to Hughes Spalding Children's Hospital, a large community hospital serving the inner city and indigent pediatric population in Atlanta, Georgia.
MATERIALS AND METHODS
This was a retrospective observational cohort of pediatric patients consecutively admitted to Hughes Spalding Children's Hospital in Atlanta from January 2004 to August 2004. This general community pediatric hospital is part of the Grady Health System in Atlanta, a large health care organization that operates under the auspices of the Fulton‐Dekalb Hospital Authoritythe major counties in metropolitan Atlantato deliver care to their uninsured and underserved populations. Ninety percent of the organization's inpatient cases are either uninsured or dependent on Medicaid. This is a broad‐based pediatric hospital without cardiac surgery, burn, or dedicated inpatient hematology‐oncology units. Patients are managed by members of the pediatric residency program and supervised by faculty members from Emory University School of Medicine. The Institutional Review Board of Emory University and Grady Health System Oversight Research Committee approved the methods for data collection and analysis used in the study and waived the need for informed consent.
The medical records of 903 consecutive pediatric patients admitted to both critical and noncritical care areas were reviewed. For the analysis, patients were divided according to a known history of diabetes prior to admission and according to admission blood glucose concentration. A normoglycemic group included patients with normal plasma glucose and without a history of diabetes. Serum or plasma glucose measured in the laboratory was assumed to be equivalent to blood glucose measured by finger stick at bedside using a glucose meter. Hyperglycemia was defined as an admission or in‐hospital blood glucose level >120 mg/dL. High blood glucose was subsequently divided into those with blood glucose of 120179 mg/dL and those with blood glucose 180 mg/dL. Patient information was collected regarding demographic characteristics, blood glucose level on admission and during hospital stay, concurrent medical diagnoses, medical treatment, and hospital outcome (including mortality and disposition at discharge).
The primary objectives of this study were to determine the prevalence of in‐hospital hyperglycemia and to examine the association of hyperglycemia and mortality in children with critical and noncritical illness in a community pediatric hospital. Secondary end points included length of hospital stay, requirement of intensive care, and treatment of hyperglycemia. In addition to blood glucose level, prognostic variables included sex, age, body mass index, admission diagnosis, presence of comorbidities, and intensive care unit admission.
Statistical Analysis
To compare demographics and clinical characteristics between groups, the independent t test and ANOVA with Sheff's method were used for continuous variables. Levine's test for homogeneity of variances and log transformations were used when necessary. For categorical variables, 2 analysis was used. P < .05 was considered significant. SPSS version 12.0 (SPSS, Inc., Chicago, IL), was the statistical software used for the analysis.
RESULTS
Of the 903 admitted patients, 342 patients (38%) had no blood glucose measurement during the hospital stay and were excluded from the analysis. Three patients with a length of stay greater than 6 months were excluded. In addition, 16 patients admitted with diabetic ketoacidosis (DKA) and 1 subject with hyperglycemic hyperosmolar syndrome were also excluded from the analysis. The remaining 542 patients constituted the study population. Most of these, 406 patients (75%), had an admission blood glucose concentration 120 mg/dL (mean SEM 98 1 mg/dL, median 93 mg/dL). A total of 103 children (19%) had an admission blood glucose level of 121179 mg/dL (mean 143 2 mg/dL, median 140 mg/dL), and 32 patients (5.9%) had an admission blood glucose level >180 mg/dL (mean 260 18 mg/dL, median 211 mg/dL; Fig. 1).

The clinical characteristics of study patients are shown in Table 1. Most patients in this study were from minority ethnic groups82% were black, 12% were Hispanic, 2% were from other minority groups, and 4.2% were white. There were no significant differences in mean age, sex, racial distribution, or body mass index among the 3 groups. A total of 409 patients (75.5%) were admitted to general pediatric wards and 133 patients (24.5%) were admitted to the surgical unit. There were no differences in the admission blood glucose between patients admitted to general pediatric wards (112.2 mg/dL) and those admitted to surgical areas (115.7 mg/dL, P > .05). The most common diagnoses in the severe hyperglycemia group were trauma/surgery (25%), pulmonary disease (18.8%), metabolic disorders (12.5%), and infection (6.3%). Most children admitted with hyperglycemia had no history of diabetes prior to admission. Among the 135 children with admission hyperglycemia (blood glucose >120 mg/dL), 17 patients (13%) had a known history of diabetes or were receiving therapy prior to admission. The mean admission blood glucose was 162.4 mg/dL (range 121480 mg/dL) in children with new hyperglycemia and 369.8 mg/dL (range 145678 mg/dL) in those children with a known history of diabetes (P < .01). Among children without a history of diabetes, 33 of 118 children (28%) with admission hyperglycemia had 1 or more glucose values >120 mg/dL during their hospitalizations. Twenty‐five children had a blood glucose of 121179 mg/dL (mean 109 5 mg/dL), and 8 children had a blood glucose 180 mg/dL (mean 159 13 mg/dL). Most patients with a history of diabetes were admitted with significant hyperglycemia. One patient (1%) had a glucose level in the 121179 mg/dL category, and 16 patients (50%) had a glucose level >180 mg/dL.
| BG <120 mg/dL | BG 121179 mg/dL | BG 180 mg/dL | |
|---|---|---|---|
| |||
| No. of patients (%) | 406 (75%) | 103 (19%) | 32 (6%) |
| Mean age (years) | 7.0 .4 | 6.8 .6 | 7.8 1.1 |
| Sex (M/F) | 50/50 | 57/43 | 50/50 |
| Race | |||
| White | 4% | 8% | 9% |
| Black | 80% | 80% | 84% |
| Hispanic | 15% | 10% | 6% |
| Other | 1% | 2% | 1% |
| Weight on admission (kg) | 29 2 | 26 3 | 32 6 |
| Height on admission (cm) | 79 4 | 94 9 | 74 19 |
| Body mass index (kg/m2) | 17 5 | 18 4 | 37 16 |
| Mean admission BG | 92 1 | 143 2 | 260 18 |
| Mean inpatient BG | 96 3 | 109 5 | 159 13 |
| Mean length of hospital stay | 3.8 0.2 | 5.4 1.0 | 5.7 1.8 |
| Mean length of ICU stay | 0.6 0.1 | 1.1 .4a | 3.6 1.9 |
| Admission service (%) | |||
| Pediatrics | 79.6% | 58.8% | 72.4% |
| Surgery | 20.4% | 41.2% | 27.6% |
The presence of hyperglycemia on admission in pediatric patients was not associated with increased mortality or with increased length of hospital stay. There was only 1 death reported during the study period, which occurred in a patient with respiratory failure because of bronchiolitis who was admitted with an admission blood glucose of 151 mg/dL. The mean length of stay for patients with normoglycemia was 3.83 0.2 days, which increased to 5.36 1.0 and 5.68 1.8 days for children with blood glucose of 120179 and 180 mg/dL, respectively (P > .05).
Children with hyperglycemia were more likely to be admitted to the ICU and had a longer length of ICU stay. Admission to the ICU was needed by 10% of children with an admission blood glucose <120 mg/dL, 18% of children with a blood glucose of 120179 mg/dL, and 40% of children with an admission blood 180 mg/dL (P < .01). In addition, length of ICU stay was significantly longer for hyperglycemic children, particularly those with a glucose level 180 mg/dL (P < .001). The mean length of ICU stay (ICU) was 0.56 0.1 days for patients with normoglycemia, and 1.1 0.4 days and 3.6 1.9 days for patients with a blood glucose of 120179 and 180 mg/dL, respectively (P < .01).
Newly diagnosed hyperglycemia was frequently left untreated. Only 3 children without a history of diabetes but with hyperglycemia recorded during the hospital stay received insulin therapy. New hyperglycemia patients received regular insulin per a sliding scale as the main insulin regimen in the hospital. In contrast, all patients with a previous history of diabetes were treated with insulin during their hospital stay.
DISCUSSION
Diabetes mellitus represents a significant public health burden on the basis of increased morbidity, mortality, and economic costs. Increasing evidence from observational and prospective interventional studies has shown that inpatient hyperglycemia is a predictor of poor clinical outcome of adult subjects.313, 16, 17 Admission hyperglycemia has been associated with increased morbidity and mortality in patients with critical illness, as well as in noncritically ill adult subjects admitted to general surgical and medical wards.3, 6, 18 In this study we also found that hyperglycemia is a common finding in children admitted with critical and noncritical illnesses and that most children had no history of diabetes before admission. One‐fourth of the children admitted to the hospital had hyperglycemia on admission. Children with hyperglycemia were more likely to be admitted to the ICU and had a longer length of ICU stay; however, inpatient hyperglycemia was not associated with higher hospital mortality or longer hospital stay than was inpatient normoglycemia. Our findings suggest that recognition of inpatient hyperglycemia can be improved because screening for hyperglycemia was not performed in more than one third of patients (38%) during the hospital stay.
The prevalence of inpatient hyperglycemia in children varies according to the severity of the illness and the study population. Ruiz Magro et al.21 reported that 50% of 353 critically ill children without diabetes mellitus had initial glucose values >120 mg/dL. In a study of 942 nondiabetic patients, Faustino et al.20 found that within 24 hours of admission to the ICU, hyperglycemia was prevalent in 70.4% of patients with a glucose value >120 mg/dL, 44.5% of patients with a glucose value >150 mg/dL, and 22.3% of patients with a glucose value >200 mg/dL. The prevalence of hyperglycemia in non‐critically ill children seen in the emergency department was much lower, ranging from 3.8% to 5.0% (based on an initial blood glucose >150 mg/dL).19, 24 In agreement with these studies, we found inpatient hyperglycemia to be a common finding among hospitalized children. Approximately 75% of our patients had a normal blood glucose on admission, 19% had an admission blood glucose of 121179 mg/dL (mean 143 2 mg/dL), and 5.9% of children had an admission blood glucose 180 mg/dL (mean 260 18 mg/dL). Only 13% of our patients had a known history of diabetes prior to admission, suggesting that the hyperglycemia was a result of the stress of the medical illness or the surgery. Stress hyperglycemia, defined as a transient increase in blood glucose level during acute physiological stress, has been reported to occur in 4% of children with an acute non‐critical illness and in more than 50% of children in the ICU.
A few studies have reported on the impact of inpatient hyperglycemia in children with acute critical illness.1015 Three retrospective studies have demonstrated that admission hyperglycemia is also a predictor of adverse outcomes in the pediatric intensive care unit.20, 22 Srinivasan and colleagues22 demonstrated that 86% of patients in their pediatric intensive care unit had a glucose value >126 mg/dL at some point during their stay. In addition, they showed that duration of the hyperglycemia and peak glucose were also associated with mortality. Faustino and Apkon20 demonstrated that hyperglycemia occurs frequently among critically‐ill nondiabetic children and is correlated with a greater in‐hospital mortality rate and longer length of stay in the ICU. They reported a 2.5‐fold increased risk of dying if the maximum glucose obtained within 24 hours of admission to the ICU was >150 mg/dL. More recently, Yates et al.25 reported that hyperglycemia in the postoperative period was associated with increased morbidity and mortality in postoperative pediatric cardiac patients. Other studies in children with traumatic brain or head injury have also shown an association between poor neurological outcome and elevated admission blood glucose.24, 2628 Brain trauma patients with permanent neurological deficits and in a vegetative state were found to have significantly higher admission blood glucose concentrations than children with good neurological recovery or minimal deficits. In addition, the development of inpatient hyperglycemia in children with extensive burn injuries, covering more than 60% of total body surface area, was found to increase the risk of bacteremia and fungemia, reduce skin graft adhesion, and increase the mortality rate.29 These data show an association of initial glucose, peak glucose, and duration of hyperglycemia with increased incidence of morbidity and mortality in children with acute critical illness. We found no association between initial blood glucose and risk of death. This is in contrast to our previous results in adult patients, in whom inpatient hyperglycemia was found to represent an important marker of increased morbidity and mortality among both those critically ill and not critically ill.3 It is important to note that the overall mortality rate reported in children with hyperglycemia relates to severity of illness and is significantly lower than that of adults.30 In most critically ill pediatric series, hospital mortality ranges from 2% to 5.3% and is higher in patients with severe trauma and those who underwent major cardiac surgery.23, 31 The mortality in children without critical illness admitted to general pediatric wards is significantly lower.30
In agreement with the increasing rate of obesity among children with diabetes,32, 33 especially in minority populations, we found that hospitalized children with a history of diabetes and glucose >180 mg/dL had a higher body mass index than those with normoglycemia (P < .001). Obesity in children has been associated with the presence of several comorbidities and an increased risk of hospital complications.34, 35 There is also increasing evidence among patients admitted to the intensive care unit that obesity contributes to increased morbidity and to a prolonged length of stay.35 Because they have a higher rate of hyperglycemia, diabetes, and hospital complications, we believe that obese children should be screened for hyperglycemia and diabetes.
We acknowledge the following limitations of this study. The main limitation was its retrospective nature. The method of blood glucose collection and analysis was not standardized; thus, it prevented uniformity in the determination of serum glucose values of individual patients. We arbitrarily used 3 glucose cutoff values in this study (<120, 120179, and >180 mg/dL). Although similar values have been used in inpatient diabetes studies,2022 there is no uniform definition of hyperglycemia in hospitalized patients, and the clinical significance of these cutoff values in pediatric population has not been determined. The study was conducted in a single institution in Atlanta, whose population and disease spectrum might be different from those at other pediatric institutions. Our study did not address the question of whether treatment of hyperglycemia might improve the outcome of length of hospital stay of patients with hyperglycemia. We believe that newly diagnosed hyperglycemia is usually considered a transient finding in response to acute illness not requiring medical intervention, as indicated by the fact that more than half of these patients did not receive antidiabetic therapy. Another limitation of our study is that we were not able to determine the percentage of patients with latent or unrecognized diabetes because of the lack of hemoglobin A1C testing and follow‐up after discharge. A prospective, randomized trial of strict glycemic control is certainly needed to address these issues.
In summary, inpatient hyperglycemia is a common finding in children with and without critical illness. One‐fourth of the children admitted to the hospital had hyperglycemia, most of them without a history of diabetes prior to admission. Although we found a higher need for ICU admission and a longer length of ICU stay, hyperglycemia in pediatric patients was not associated with higher hospital mortality compared with that in children with normoglycemia. Several observational studies have reported an association of hyperglycemia with poor clinical outcome in critically ill children; however, no prospective controlled studies have assessed the effect of tight glucose control in pediatric populations. These studies need to be prospective, randomized multicenter trials of sufficient magnitude to provide a well‐powered analysis to enable multiple observations and evaluation of subsets of critically and non‐critically ill pediatric patients.
- ,,, et al.Diabetes trends in the U.S.: 1990–1998.Diabetes Care.2000;23:1278–1283.
- ,,,,.Unrecognized diabetes among hospitalized patients.Diabetes Care.1998;21:246–249.
- ,,, et al.Hyperglycemia: an independent marker of in‐hospital mortality in patients with undiagnosed diabetes.J Clin Endocrinol Metab.2002;87:978–982.
- ,,, et al.Hospital hypoglycemia: not only treatment but also prevention.Endocr Pract.2004;10(Suppl 2):89–99.
- ,,,.Stress hyperglycaemia and increased risk of death after myocardial infarction in patients with and without diabetes: a systematic overview.Lancet.2000;355:773–778.
- ,,, et al.Management of diabetes and hyperglycemia in hospitals.Diabetes Care.2004;27:553–597.
- ,,,.Outcomes and perioperative hyperglycemia in patients with or without diabetes mellitus undergoing coronary artery bypass grafting.Ann Thorac Surg.2003;75:1392–1399.
- .Blood glucose management during critical illness.Rev Endocr Metab Disord.2003;4:187–194.
- ,,.Hyperglycemia in acutely ill patients.JAMA.2002;288:2167–2169.
- ,.ICU care for patients with diabetes.Curr Opin Endocrinol.2004;11:75–81.
- ,,.Admission plasma glucose. Independent risk factor for long‐term prognosis after myocardial infarction even in nondiabetic patients.Diabetes Care.1999;22:1827–1831.
- ,,,.Glucose control and mortality in critically ill patients.JAMA.2003;290:2041–2047.
- .Association between hyperglycemia and increased hospital mortality in a heterogeneous population of critically ill patients.Mayo Clin Proc.2003;78:1471–1478.
- ,,, et al.Management of hyperglycemic crises in patients with diabetes.Diabetes Care.2001;24:131–153.
- .Prospective randomised study of intensive insulin treatment on long term survival after acute myocardial infarction in patients with diabetes mellitus. DIGAMI (Diabetes Mellitus, Insulin Glucose Infusion in Acute Myocardial Infarction) Study Group.BMJ.1997;314:1512–1515.
- ,,, et al.Intensive insulin therapy in the medical ICU.N Engl J Med.2006;354:449–461.
- ,,, et al.Intensive insulin therapy in the critically ill patients.N Engl J Med.2001;345:1359–1367.
- ,,, et al.Early postoperative glucose control predicts nosocomial infection rate in diabetic patients.JPEN J Parenter Enteral Nutr.1998;22:77–81.
- ,,,,,.Prevalence of stress hyperglycemia among patients attending a pediatric emergency department.J Pediatr.1994;124:547–551.
- ,.Persistent hyperglycemia in critically ill children.J Pediatr.2005;146:30–34.
- ,, et al.[Metabolic changes in critically ill children].An Esp Pediatr.1999;51:143–148.
- ,,,,,:Association of timing, duration, and intensity of hyperglycemia with intensive care unit mortality in critically ill children.Pediatr Crit Care Med.2004;5:329–336.
- ,,.Improved survival with hospitalists in a pediatric intensive care unit.Crit Care Med2003;31:847–852.
- ,,,,,:High prevalence of stress hyperglycaemia in children with febrile seizures and traumatic injuries.Acta Paediatr2001;90:618–622.
- ,,, et al.Hyperglycemia is a marker for poor outcome in the postoperative pediatric cardiac patient.Pediatr Crit Care Med.2006;7:351–355.
- ,,,:Hyperglycemia and outcomes from pediatric traumatic brain injury.J Trauma.2003;55:1035–1038.
- ,,, et al.Prognostic implications of hyperglycaemia in paediatric head injury.Childs Nerv Syst.1998;14:455–459.
- ,,, et al.Gunshot wounds in brains of children: prognostic variables in mortality, course, and outcome.J Neurotrauma.1998;15:967–972.
- ,,,,,:Association of hyperglycemia with increased mortality after severe burn injury.J Trauma.51:540–544,2001.
- ,,, et al.Impact of a health maintenance organization hospitalist system in academic pediatrics.Pediatrics.2002;110:720–728.
- ,.Can regionalization decrease the number of deaths for children who undergo cardiac surgery? A theoretical analysis.Pediatrics.2002;109:173–181.
- ,,,.Emerging epidemic of type 2 diabetes in youth.Diabetes Care.1999;22:345–354.
- ,.Type 2 diabetes in children and adolescents: screening, diagnosis, and management.JAAPA.2007;20:51–54.
- ,,,,,.Childhood body mass index and perioperative complications.Paediatr Anaesth.2007;17:426–430.
- ,,,.Childhood obesity increases duration of therapy during severe asthma exacerbations.Pediatr Crit Care Med.2006;7:527–531.
Diabetes is one of the most common diagnoses in hospitalized patients.1, 2 Hyperglycemia is present in 38% of adults admitted to the hospital, one third of whom had no history of diabetes before admission.3 The impact of inpatient hyperglycemia on clinical outcome in adult patients has been increasingly appreciated. Extensive evidence from observational studies indicates that hyperglycemia in patients with or without a history of diabetes is an important marker of poor clinical outcome.312 Several prospective randomized trials in patients with critical illness have shown that aggressive glycemic control improves short‐ and long‐term mortality, multiorgan failure and systemic infection, and length of hospitalization.1317 The importance of glucose control also applies to adult patients admitted to general surgical and medical wards.3, 6, 18 In such patients, we recently reported that the presence of hyperglycemia is associated with prolonged hospital stay, infection, disability after hospital discharge, and death.3, 6, 18 Despite the extensive data in adult patients, there is little information on the impact of inpatient hyperglycemia in pediatric patients. The few observational studies in critically ill children admitted to the pediatric ICU with severe brain injury or extensive burn injuries have shown a positive association between inpatient hyperglycemia and increased length of hospital and ICU stay and a higher risk of complication and mortality rates.1923 No previous studies, however, have examined the association of hyperglycemia and clinical outcome in children admitted to a general community pediatric hospital. Therefore, in this study we determined the prevalence of inpatient hyperglycemia and examined the impact of hyperglycemia on morbidity and mortality in children admitted to Hughes Spalding Children's Hospital, a large community hospital serving the inner city and indigent pediatric population in Atlanta, Georgia.
MATERIALS AND METHODS
This was a retrospective observational cohort of pediatric patients consecutively admitted to Hughes Spalding Children's Hospital in Atlanta from January 2004 to August 2004. This general community pediatric hospital is part of the Grady Health System in Atlanta, a large health care organization that operates under the auspices of the Fulton‐Dekalb Hospital Authoritythe major counties in metropolitan Atlantato deliver care to their uninsured and underserved populations. Ninety percent of the organization's inpatient cases are either uninsured or dependent on Medicaid. This is a broad‐based pediatric hospital without cardiac surgery, burn, or dedicated inpatient hematology‐oncology units. Patients are managed by members of the pediatric residency program and supervised by faculty members from Emory University School of Medicine. The Institutional Review Board of Emory University and Grady Health System Oversight Research Committee approved the methods for data collection and analysis used in the study and waived the need for informed consent.
The medical records of 903 consecutive pediatric patients admitted to both critical and noncritical care areas were reviewed. For the analysis, patients were divided according to a known history of diabetes prior to admission and according to admission blood glucose concentration. A normoglycemic group included patients with normal plasma glucose and without a history of diabetes. Serum or plasma glucose measured in the laboratory was assumed to be equivalent to blood glucose measured by finger stick at bedside using a glucose meter. Hyperglycemia was defined as an admission or in‐hospital blood glucose level >120 mg/dL. High blood glucose was subsequently divided into those with blood glucose of 120179 mg/dL and those with blood glucose 180 mg/dL. Patient information was collected regarding demographic characteristics, blood glucose level on admission and during hospital stay, concurrent medical diagnoses, medical treatment, and hospital outcome (including mortality and disposition at discharge).
The primary objectives of this study were to determine the prevalence of in‐hospital hyperglycemia and to examine the association of hyperglycemia and mortality in children with critical and noncritical illness in a community pediatric hospital. Secondary end points included length of hospital stay, requirement of intensive care, and treatment of hyperglycemia. In addition to blood glucose level, prognostic variables included sex, age, body mass index, admission diagnosis, presence of comorbidities, and intensive care unit admission.
Statistical Analysis
To compare demographics and clinical characteristics between groups, the independent t test and ANOVA with Sheff's method were used for continuous variables. Levine's test for homogeneity of variances and log transformations were used when necessary. For categorical variables, 2 analysis was used. P < .05 was considered significant. SPSS version 12.0 (SPSS, Inc., Chicago, IL), was the statistical software used for the analysis.
RESULTS
Of the 903 admitted patients, 342 patients (38%) had no blood glucose measurement during the hospital stay and were excluded from the analysis. Three patients with a length of stay greater than 6 months were excluded. In addition, 16 patients admitted with diabetic ketoacidosis (DKA) and 1 subject with hyperglycemic hyperosmolar syndrome were also excluded from the analysis. The remaining 542 patients constituted the study population. Most of these, 406 patients (75%), had an admission blood glucose concentration 120 mg/dL (mean SEM 98 1 mg/dL, median 93 mg/dL). A total of 103 children (19%) had an admission blood glucose level of 121179 mg/dL (mean 143 2 mg/dL, median 140 mg/dL), and 32 patients (5.9%) had an admission blood glucose level >180 mg/dL (mean 260 18 mg/dL, median 211 mg/dL; Fig. 1).
The clinical characteristics of study patients are shown in Table 1. Most patients in this study were from minority ethnic groups82% were black, 12% were Hispanic, 2% were from other minority groups, and 4.2% were white. There were no significant differences in mean age, sex, racial distribution, or body mass index among the 3 groups. A total of 409 patients (75.5%) were admitted to general pediatric wards and 133 patients (24.5%) were admitted to the surgical unit. There were no differences in the admission blood glucose between patients admitted to general pediatric wards (112.2 mg/dL) and those admitted to surgical areas (115.7 mg/dL, P > .05). The most common diagnoses in the severe hyperglycemia group were trauma/surgery (25%), pulmonary disease (18.8%), metabolic disorders (12.5%), and infection (6.3%). Most children admitted with hyperglycemia had no history of diabetes prior to admission. Among the 135 children with admission hyperglycemia (blood glucose >120 mg/dL), 17 patients (13%) had a known history of diabetes or were receiving therapy prior to admission. The mean admission blood glucose was 162.4 mg/dL (range 121480 mg/dL) in children with new hyperglycemia and 369.8 mg/dL (range 145678 mg/dL) in those children with a known history of diabetes (P < .01). Among children without a history of diabetes, 33 of 118 children (28%) with admission hyperglycemia had 1 or more glucose values >120 mg/dL during their hospitalizations. Twenty‐five children had a blood glucose of 121179 mg/dL (mean 109 5 mg/dL), and 8 children had a blood glucose 180 mg/dL (mean 159 13 mg/dL). Most patients with a history of diabetes were admitted with significant hyperglycemia. One patient (1%) had a glucose level in the 121179 mg/dL category, and 16 patients (50%) had a glucose level >180 mg/dL.
| BG <120 mg/dL | BG 121179 mg/dL | BG 180 mg/dL | |
|---|---|---|---|
| |||
| No. of patients (%) | 406 (75%) | 103 (19%) | 32 (6%) |
| Mean age (years) | 7.0 .4 | 6.8 .6 | 7.8 1.1 |
| Sex (M/F) | 50/50 | 57/43 | 50/50 |
| Race | |||
| White | 4% | 8% | 9% |
| Black | 80% | 80% | 84% |
| Hispanic | 15% | 10% | 6% |
| Other | 1% | 2% | 1% |
| Weight on admission (kg) | 29 2 | 26 3 | 32 6 |
| Height on admission (cm) | 79 4 | 94 9 | 74 19 |
| Body mass index (kg/m2) | 17 5 | 18 4 | 37 16 |
| Mean admission BG | 92 1 | 143 2 | 260 18 |
| Mean inpatient BG | 96 3 | 109 5 | 159 13 |
| Mean length of hospital stay | 3.8 0.2 | 5.4 1.0 | 5.7 1.8 |
| Mean length of ICU stay | 0.6 0.1 | 1.1 .4a | 3.6 1.9 |
| Admission service (%) | |||
| Pediatrics | 79.6% | 58.8% | 72.4% |
| Surgery | 20.4% | 41.2% | 27.6% |
The presence of hyperglycemia on admission in pediatric patients was not associated with increased mortality or with increased length of hospital stay. There was only 1 death reported during the study period, which occurred in a patient with respiratory failure because of bronchiolitis who was admitted with an admission blood glucose of 151 mg/dL. The mean length of stay for patients with normoglycemia was 3.83 0.2 days, which increased to 5.36 1.0 and 5.68 1.8 days for children with blood glucose of 120179 and 180 mg/dL, respectively (P > .05).
Children with hyperglycemia were more likely to be admitted to the ICU and had a longer length of ICU stay. Admission to the ICU was needed by 10% of children with an admission blood glucose <120 mg/dL, 18% of children with a blood glucose of 120179 mg/dL, and 40% of children with an admission blood 180 mg/dL (P < .01). In addition, length of ICU stay was significantly longer for hyperglycemic children, particularly those with a glucose level 180 mg/dL (P < .001). The mean length of ICU stay (ICU) was 0.56 0.1 days for patients with normoglycemia, and 1.1 0.4 days and 3.6 1.9 days for patients with a blood glucose of 120179 and 180 mg/dL, respectively (P < .01).
Newly diagnosed hyperglycemia was frequently left untreated. Only 3 children without a history of diabetes but with hyperglycemia recorded during the hospital stay received insulin therapy. New hyperglycemia patients received regular insulin per a sliding scale as the main insulin regimen in the hospital. In contrast, all patients with a previous history of diabetes were treated with insulin during their hospital stay.
DISCUSSION
Diabetes mellitus represents a significant public health burden on the basis of increased morbidity, mortality, and economic costs. Increasing evidence from observational and prospective interventional studies has shown that inpatient hyperglycemia is a predictor of poor clinical outcome of adult subjects.313, 16, 17 Admission hyperglycemia has been associated with increased morbidity and mortality in patients with critical illness, as well as in noncritically ill adult subjects admitted to general surgical and medical wards.3, 6, 18 In this study we also found that hyperglycemia is a common finding in children admitted with critical and noncritical illnesses and that most children had no history of diabetes before admission. One‐fourth of the children admitted to the hospital had hyperglycemia on admission. Children with hyperglycemia were more likely to be admitted to the ICU and had a longer length of ICU stay; however, inpatient hyperglycemia was not associated with higher hospital mortality or longer hospital stay than was inpatient normoglycemia. Our findings suggest that recognition of inpatient hyperglycemia can be improved because screening for hyperglycemia was not performed in more than one third of patients (38%) during the hospital stay.
The prevalence of inpatient hyperglycemia in children varies according to the severity of the illness and the study population. Ruiz Magro et al.21 reported that 50% of 353 critically ill children without diabetes mellitus had initial glucose values >120 mg/dL. In a study of 942 nondiabetic patients, Faustino et al.20 found that within 24 hours of admission to the ICU, hyperglycemia was prevalent in 70.4% of patients with a glucose value >120 mg/dL, 44.5% of patients with a glucose value >150 mg/dL, and 22.3% of patients with a glucose value >200 mg/dL. The prevalence of hyperglycemia in non‐critically ill children seen in the emergency department was much lower, ranging from 3.8% to 5.0% (based on an initial blood glucose >150 mg/dL).19, 24 In agreement with these studies, we found inpatient hyperglycemia to be a common finding among hospitalized children. Approximately 75% of our patients had a normal blood glucose on admission, 19% had an admission blood glucose of 121179 mg/dL (mean 143 2 mg/dL), and 5.9% of children had an admission blood glucose 180 mg/dL (mean 260 18 mg/dL). Only 13% of our patients had a known history of diabetes prior to admission, suggesting that the hyperglycemia was a result of the stress of the medical illness or the surgery. Stress hyperglycemia, defined as a transient increase in blood glucose level during acute physiological stress, has been reported to occur in 4% of children with an acute non‐critical illness and in more than 50% of children in the ICU.
A few studies have reported on the impact of inpatient hyperglycemia in children with acute critical illness.1015 Three retrospective studies have demonstrated that admission hyperglycemia is also a predictor of adverse outcomes in the pediatric intensive care unit.20, 22 Srinivasan and colleagues22 demonstrated that 86% of patients in their pediatric intensive care unit had a glucose value >126 mg/dL at some point during their stay. In addition, they showed that duration of the hyperglycemia and peak glucose were also associated with mortality. Faustino and Apkon20 demonstrated that hyperglycemia occurs frequently among critically‐ill nondiabetic children and is correlated with a greater in‐hospital mortality rate and longer length of stay in the ICU. They reported a 2.5‐fold increased risk of dying if the maximum glucose obtained within 24 hours of admission to the ICU was >150 mg/dL. More recently, Yates et al.25 reported that hyperglycemia in the postoperative period was associated with increased morbidity and mortality in postoperative pediatric cardiac patients. Other studies in children with traumatic brain or head injury have also shown an association between poor neurological outcome and elevated admission blood glucose.24, 2628 Brain trauma patients with permanent neurological deficits and in a vegetative state were found to have significantly higher admission blood glucose concentrations than children with good neurological recovery or minimal deficits. In addition, the development of inpatient hyperglycemia in children with extensive burn injuries, covering more than 60% of total body surface area, was found to increase the risk of bacteremia and fungemia, reduce skin graft adhesion, and increase the mortality rate.29 These data show an association of initial glucose, peak glucose, and duration of hyperglycemia with increased incidence of morbidity and mortality in children with acute critical illness. We found no association between initial blood glucose and risk of death. This is in contrast to our previous results in adult patients, in whom inpatient hyperglycemia was found to represent an important marker of increased morbidity and mortality among both those critically ill and not critically ill.3 It is important to note that the overall mortality rate reported in children with hyperglycemia relates to severity of illness and is significantly lower than that of adults.30 In most critically ill pediatric series, hospital mortality ranges from 2% to 5.3% and is higher in patients with severe trauma and those who underwent major cardiac surgery.23, 31 The mortality in children without critical illness admitted to general pediatric wards is significantly lower.30
In agreement with the increasing rate of obesity among children with diabetes,32, 33 especially in minority populations, we found that hospitalized children with a history of diabetes and glucose >180 mg/dL had a higher body mass index than those with normoglycemia (P < .001). Obesity in children has been associated with the presence of several comorbidities and an increased risk of hospital complications.34, 35 There is also increasing evidence among patients admitted to the intensive care unit that obesity contributes to increased morbidity and to a prolonged length of stay.35 Because they have a higher rate of hyperglycemia, diabetes, and hospital complications, we believe that obese children should be screened for hyperglycemia and diabetes.
We acknowledge the following limitations of this study. The main limitation was its retrospective nature. The method of blood glucose collection and analysis was not standardized; thus, it prevented uniformity in the determination of serum glucose values of individual patients. We arbitrarily used 3 glucose cutoff values in this study (<120, 120179, and >180 mg/dL). Although similar values have been used in inpatient diabetes studies,2022 there is no uniform definition of hyperglycemia in hospitalized patients, and the clinical significance of these cutoff values in pediatric population has not been determined. The study was conducted in a single institution in Atlanta, whose population and disease spectrum might be different from those at other pediatric institutions. Our study did not address the question of whether treatment of hyperglycemia might improve the outcome of length of hospital stay of patients with hyperglycemia. We believe that newly diagnosed hyperglycemia is usually considered a transient finding in response to acute illness not requiring medical intervention, as indicated by the fact that more than half of these patients did not receive antidiabetic therapy. Another limitation of our study is that we were not able to determine the percentage of patients with latent or unrecognized diabetes because of the lack of hemoglobin A1C testing and follow‐up after discharge. A prospective, randomized trial of strict glycemic control is certainly needed to address these issues.
In summary, inpatient hyperglycemia is a common finding in children with and without critical illness. One‐fourth of the children admitted to the hospital had hyperglycemia, most of them without a history of diabetes prior to admission. Although we found a higher need for ICU admission and a longer length of ICU stay, hyperglycemia in pediatric patients was not associated with higher hospital mortality compared with that in children with normoglycemia. Several observational studies have reported an association of hyperglycemia with poor clinical outcome in critically ill children; however, no prospective controlled studies have assessed the effect of tight glucose control in pediatric populations. These studies need to be prospective, randomized multicenter trials of sufficient magnitude to provide a well‐powered analysis to enable multiple observations and evaluation of subsets of critically and non‐critically ill pediatric patients.
- ,,, et al.Diabetes trends in the U.S.: 1990–1998.Diabetes Care.2000;23:1278–1283.
- ,,,,.Unrecognized diabetes among hospitalized patients.Diabetes Care.1998;21:246–249.
- ,,, et al.Hyperglycemia: an independent marker of in‐hospital mortality in patients with undiagnosed diabetes.J Clin Endocrinol Metab.2002;87:978–982.
- ,,, et al.Hospital hypoglycemia: not only treatment but also prevention.Endocr Pract.2004;10(Suppl 2):89–99.
- ,,,.Stress hyperglycaemia and increased risk of death after myocardial infarction in patients with and without diabetes: a systematic overview.Lancet.2000;355:773–778.
- ,,, et al.Management of diabetes and hyperglycemia in hospitals.Diabetes Care.2004;27:553–597.
- ,,,.Outcomes and perioperative hyperglycemia in patients with or without diabetes mellitus undergoing coronary artery bypass grafting.Ann Thorac Surg.2003;75:1392–1399.
- .Blood glucose management during critical illness.Rev Endocr Metab Disord.2003;4:187–194.
- ,,.Hyperglycemia in acutely ill patients.JAMA.2002;288:2167–2169.
- ,.ICU care for patients with diabetes.Curr Opin Endocrinol.2004;11:75–81.
- ,,.Admission plasma glucose. Independent risk factor for long‐term prognosis after myocardial infarction even in nondiabetic patients.Diabetes Care.1999;22:1827–1831.
- ,,,.Glucose control and mortality in critically ill patients.JAMA.2003;290:2041–2047.
- .Association between hyperglycemia and increased hospital mortality in a heterogeneous population of critically ill patients.Mayo Clin Proc.2003;78:1471–1478.
- ,,, et al.Management of hyperglycemic crises in patients with diabetes.Diabetes Care.2001;24:131–153.
- .Prospective randomised study of intensive insulin treatment on long term survival after acute myocardial infarction in patients with diabetes mellitus. DIGAMI (Diabetes Mellitus, Insulin Glucose Infusion in Acute Myocardial Infarction) Study Group.BMJ.1997;314:1512–1515.
- ,,, et al.Intensive insulin therapy in the medical ICU.N Engl J Med.2006;354:449–461.
- ,,, et al.Intensive insulin therapy in the critically ill patients.N Engl J Med.2001;345:1359–1367.
- ,,, et al.Early postoperative glucose control predicts nosocomial infection rate in diabetic patients.JPEN J Parenter Enteral Nutr.1998;22:77–81.
- ,,,,,.Prevalence of stress hyperglycemia among patients attending a pediatric emergency department.J Pediatr.1994;124:547–551.
- ,.Persistent hyperglycemia in critically ill children.J Pediatr.2005;146:30–34.
- ,, et al.[Metabolic changes in critically ill children].An Esp Pediatr.1999;51:143–148.
- ,,,,,:Association of timing, duration, and intensity of hyperglycemia with intensive care unit mortality in critically ill children.Pediatr Crit Care Med.2004;5:329–336.
- ,,.Improved survival with hospitalists in a pediatric intensive care unit.Crit Care Med2003;31:847–852.
- ,,,,,:High prevalence of stress hyperglycaemia in children with febrile seizures and traumatic injuries.Acta Paediatr2001;90:618–622.
- ,,, et al.Hyperglycemia is a marker for poor outcome in the postoperative pediatric cardiac patient.Pediatr Crit Care Med.2006;7:351–355.
- ,,,:Hyperglycemia and outcomes from pediatric traumatic brain injury.J Trauma.2003;55:1035–1038.
- ,,, et al.Prognostic implications of hyperglycaemia in paediatric head injury.Childs Nerv Syst.1998;14:455–459.
- ,,, et al.Gunshot wounds in brains of children: prognostic variables in mortality, course, and outcome.J Neurotrauma.1998;15:967–972.
- ,,,,,:Association of hyperglycemia with increased mortality after severe burn injury.J Trauma.51:540–544,2001.
- ,,, et al.Impact of a health maintenance organization hospitalist system in academic pediatrics.Pediatrics.2002;110:720–728.
- ,.Can regionalization decrease the number of deaths for children who undergo cardiac surgery? A theoretical analysis.Pediatrics.2002;109:173–181.
- ,,,.Emerging epidemic of type 2 diabetes in youth.Diabetes Care.1999;22:345–354.
- ,.Type 2 diabetes in children and adolescents: screening, diagnosis, and management.JAAPA.2007;20:51–54.
- ,,,,,.Childhood body mass index and perioperative complications.Paediatr Anaesth.2007;17:426–430.
- ,,,.Childhood obesity increases duration of therapy during severe asthma exacerbations.Pediatr Crit Care Med.2006;7:527–531.
Copyright © 2008 Society of Hospital Medicine
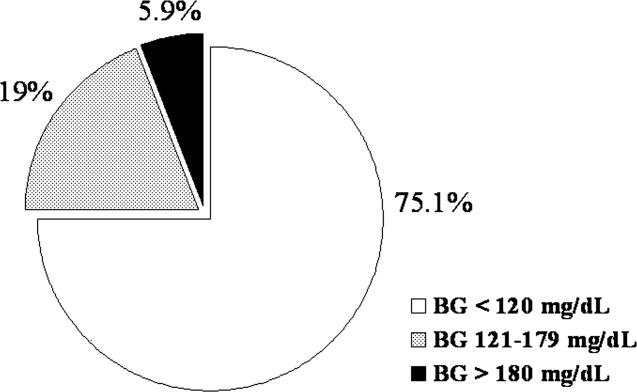
Percentage of Health Care Workers who Smoke at KHMC
Smoking represents the single most important cause of premature death and potentially lost years of life in the developing countries. Cigarette smoking causes more than 350,000 deaths each year in the United States and more than 4.9 million premature deaths worldwide.1 Death as a consequence of smoking is by no means limited to the elderly. Tobacco is the largest single cause of premature death and accounts for 3 of 10 of all deaths that occur among smokers and nonsmokers between the ages 35 and 69.2 Because most health professionals deal with different smoking‐related health problems, they make up the sector with the greatest potential to influence reducing smoking among their patients if they can show a positive attitude toward smoking‐cessation intervention.3 Tobacco smoking by health care workers has a negative influence on the general population.3, 4 The World Health Organization (WHO) has advocated that physicians should not smoke cigarettes, and surveys on this issue should be conducted among medical professionals.35 In Jordan, the prevalence of smoking is high and is increasing among women, but there are no data about the prevalence of smoking among physicians and other health care workers (HCWs).5 As members of an antismoking committee working at King Hussein Medical Center (KHMC) we realized that before applying any tobacco control strategy, it was important to understand the prevalence of smoking among HCWs at our center. To our knowledge, no representative survey of smoking among physicians in Jordan has been reported.
This study describes the prevalence of cigarettes smoking among HCWs in the largest tertiary‐care hospital in Jordan.
METHODS
The study was approved by the local ethics committee at KHMC and was conducted between June 1999 and September 1999. The study involved 600 representative samples of HCWs at KHMC. Subjects were divided into 3 groups according to their professions (physicians, nurses, and other professions). Each subject was interviewed personally. Questions were designed to obtain various demographic data and cigarette smoking characteristics. All other forms of tobacco consumption were not included into the questionnaire. Questions addressed various factors such as the age at which smoking was started and its duration and the number of cigarettes smoked per day. We defined smoking status as current smoker, occasional smoker, past smoker, or never smoker, according to WHO's 1995 definitions.4 Current smokers were those who had smoked at least 100 cigarettes and who were currently smoking on a daily basis. Occasional smokers were those who did not smoke daily. Past (ex‐)smokers were those nonsmokers who previously smoked every day for 6 months or more. The rate of cigarette smoking was calculated for each age group and for different medical specialties. Statistical analysis was performed with Statistical Package for Social Sciences 10.0 software (SPSS Inc., Chicago, IL). The 2 test was used to determine statistical significance. The 2‐tailed significance level was set at 5% (P < 0.05).
RESULTS
Among the 600 respondents, there were 310 women (52%) and 290 men (48%), of whom 260 (43%) were physicians, 250 (42%) were nurses, and 90 (15%) were other HCWs. The total prevalence of smoking was 65%, ranging from 10% in the dermatologist group to 75% in the family practitioner group. We learned that 52% of smokers started before age 21 and that 78% started their habit during the first 2 years of college. The most common motive for starting smoking was pleasure encouraged by peer influence. Eighty‐two percent of male HCWs smoked cigarettes compared with 47% of female HCWs. The prevalence of current smokers was 77% and 33% in men and women, respectively (P = .002). Forty‐three percent of women did not smoke cigarettes, whereas only 14% of men did not smoke (P = .002; Table 1). Smoking prevalence did not significantly differ between age groups (P = .38; Table 2). The highest rate of smoking was among current smokers age 3140 years (58%). Of the 260 physicians, 46% were smokers, (currently or occasionally), 29% were ex‐smokers, and 25% were nonsmokers. Sixty‐seven percent of physicians who were smokers smoked 1120 cigarettes/day. There were fewer current smokers among physicians than among other HCWs (46% versus 74%, respectively). The highest percentage of smokers in the physician group was observed among family practitioners working in the emergency room (75%). On the other hand, dermatologists had the lowest percentage (10%). Women in general had a lower prevalence than men in all categories. Of the female nurses, 17% were smokers, 13% were ex‐smokers, and 70% were nonsmokers. The smoking rate of female nurses fell below their male counterparts (17% and 49%, respectively; P = .002). Seventy‐eight percent of the nonsmoking physicians reported that they do ask their patients routinely about their smoking history and encourage them to discontinue this habit. Only 36% of the physicians who smoked provide such advice during their clinical practice.
| Smoking status | Men (n = 310) | Women (n = 290) | Total (n = 600) | |||
|---|---|---|---|---|---|---|
| n | % | n | % | n | % | |
| Current smoker | 238 | 77 | 96 | 33 | 334 | 56 |
| Occasional smoker | 17 | 5 | 40 | 14 | 57 | 9 |
| Ex‐smoker | 12 | 4 | 30 | 10 | 42 | 7 |
| Nonsmoker | 43 | 14 | 124 | 43 | 167 | 28 |
| Smoking status | Age group | |||||
|---|---|---|---|---|---|---|
| <30 Years | 3140 Years | >40 Years | ||||
| n | % | n | % | n | % | |
| Current smoker | 92 | 54% | 170 | 58% | 72 | 52% |
| Occasional smoker | 19 | 11% | 22 | 8% | 16 | 12% |
| Ex‐smoker | 10 | 6% | 12 | 4% | 20 | 14% |
| Nonsmoker | 49 | 29% | 88 | 30% | 30 | 22% |
| Total | 170 | 292 | 138 | |||
DISCUSSION
Tobacco use, notably cigarette smoking, is the leading cause of an array of preventable diseases.12 It is estimated that approximately 30%40% of the adult population worldwide smokes. The situation is particularly alarming in adolescents.5, 6 The prevalence of smoking in developing countries now equals or exceeds the high smoking levels common in the United Kingdom 20 or 30 years ago.6 There is a significant difference in smoking prevalence between socioeconomic groups in the Western world. For professional people the prevalence is now 16%, whereas for unskilled manual workers the prevalence is 48%.7 HCWs are important opinion leaders in the community, and their behavior more than their words has a significant impact on the lifestyle of their patients.3, 89 It is therefore discouraging to learn that so many doctors and nurses still smoke. The smoking habits of health staff members may influence their attitudes toward patients.810 Numerous international studies have addressed the issue of smoking among physicians and other HCWs.816 In a study conducted by Ohida et al.,8 the prevalence of smoking among Japanese physicians was 27.1% for men and 6.8% for women, about half the general population in Japan (male, 54.0%; female, 14.5%). The prevalence of smoking varied in other industrialized countries: in the United States, the prevalence was 3% of men and 10% of women9; in the United Kingdom, it was 4% of men and 5% of women10; in France, 33% of men and 24% of women;11 and in the Netherlands, 41% of men and 24% of women12 Approximately 40% of Italian general practitioners and approximately 45% of their Spanish colleagues also smoke.13 There are limited published data addressing the issue of cigarette smoking among physicians and other HCWs in various Arab countries. Our results showed a higher rate of cigarette smoking among Jordanian physicians compared with that in the surrounding Arab countries.1416 Physicians at KHMC have a very high prevalence of cigarette smokingfar above the results reported in the above‐noted countries. It is comparable with that of unskilled manual workers in the Western world.2, 5 It has been reported that the highest smoking prevalence among young women in the East Mediterranean region occurs in Jordan.17 Our study showed that the smoking rate among women at KHMC, especially among nursing staff, is much lower than that of men, but this might change in the coming years if antismoking measures are not applied and directed toward younger generations. Smoking practice widely varies among the nonmedical KHMC staff and is reaching a very dangerous and worrisome level. This study was the first to be conducted to calculate the prevalence of smoking among HCWs at the largest tertiary‐care hospital in Jordan. A limitation of our study was that the number of responders included in this study might not fully represent the smoking status among HCWs in the country. However, the results raise some important issues to be discussed and analyzed further on a national level concerning this growing health problem. Physicians play an important role in accelerating the process of smoking cessation. Physicians should play an active role in the control of smoking by participating in public debate regarding smoking, both individually and through medical organizations. Nonsmoking physicians at KHMC were more active in asking patients about smoking habits than were those who smoked. The physician smokers were less critical of smoking than were the physician nonsmokers. Jordanian physicians do not fully comply with the rules against tobacco smoking in hospital. Smoking doctors frequently smoke in the hospital and do not counsel patients about smoking.10, 11, 13 Special effort is needed in the educational field concerning the issue of tobacco smoking for Jordanian physicians, and a strong initiative toward smoke‐free hospitals would help spread the message. To promote antismoking measures among doctors and nurses, it will be necessary to scrutinize the smoking habits and behavior of medical and nursing students18 and to conduct effective antismoking and health education activities before they acquire the smoking habit.
- Centers for Disease Control and Prevention.Smoking‐attributable mortality and years of potential life lost—United States, 1990.MMMWR Morb Mortal Wkly Rep.1993;42:645–648.
- ,,,,.Mortality from tobacco in developed countries: indirect estimation from national vital statistics.Lancet.1992;339:1268–1278.
- Working Group on Tobacco or Health.Guidelines for the conduct of tobacco smoking surveys among health professionals.Tokyo, Japan:World Health Organization Regional Office for Western Pacific;1987:9–19.
- World Health Organization.Leave the Pack Behind.Geneva, Switzerland:World Health Organization;1999:33–39.
- ,,,Tobacco Control Country Profiles.2nd ed.Atlanta, GA:American Cancer Society;2003:220–221.
- .The Seventh World Conference on Tobacco and Health.Thorax.1990;45:560–562.
- Department of Health.Smoke‐Free for Health, an Action Plan to Achieve the Health of the Nation Targets on Smoking.London:Department of Health;1994.
- ,,, et al.Smoking prevalence and attitudes toward smoking among Japanese physicians.JAMA.2001;286:917.
- ,,, et al.Trends in cigarette smoking among US physicians and nurses.JAMA.1994;271:1273–1275.
- ,,, et al.Attitudes to smoking and smoking habits among hospital staff.Thorax.1993;48:174–175.
- ,,,,.Smoking by French general practitioners: behaviour, attitudes and practice.Eur J Public Health.2005;15:33–38.
- ,,,.Prevalence of smoking in physicians and medical students, and the generation effect in the Netherlands.Soc Sci Med.1993;36:817–822.
- .Smoking habits of Italian health professionals.Ital Heart J.2001;2:110–112.
- ,,.Knowledge of and attitudes towards tobacco control among smoking and non‐smoking physicians in 2 Gulf Arab states.Saudi Med J.2004;25:585–591.
- ,,.Smoking habits among physicians in two Gulf countries.J R Soc Health.1993;113:298–301.
- .Smoking habits of primary health care physicians in Bahrain.J R Soc Health.1999;119:36–39.
- ,,,Tobacco Control Country Profiles.1st ed.Atlanta, GA:American Cancer Society;2000:30.
- ,,,.Smoking habits and attitudes of medical students towards smoking and antismoking campaigns in nine Asian countries. The Tobacco and Health Committee of the International Union Against Tuberculosis and Lung Diseases.Int J Epidemiol.1992;21:298–304.
Smoking represents the single most important cause of premature death and potentially lost years of life in the developing countries. Cigarette smoking causes more than 350,000 deaths each year in the United States and more than 4.9 million premature deaths worldwide.1 Death as a consequence of smoking is by no means limited to the elderly. Tobacco is the largest single cause of premature death and accounts for 3 of 10 of all deaths that occur among smokers and nonsmokers between the ages 35 and 69.2 Because most health professionals deal with different smoking‐related health problems, they make up the sector with the greatest potential to influence reducing smoking among their patients if they can show a positive attitude toward smoking‐cessation intervention.3 Tobacco smoking by health care workers has a negative influence on the general population.3, 4 The World Health Organization (WHO) has advocated that physicians should not smoke cigarettes, and surveys on this issue should be conducted among medical professionals.35 In Jordan, the prevalence of smoking is high and is increasing among women, but there are no data about the prevalence of smoking among physicians and other health care workers (HCWs).5 As members of an antismoking committee working at King Hussein Medical Center (KHMC) we realized that before applying any tobacco control strategy, it was important to understand the prevalence of smoking among HCWs at our center. To our knowledge, no representative survey of smoking among physicians in Jordan has been reported.
This study describes the prevalence of cigarettes smoking among HCWs in the largest tertiary‐care hospital in Jordan.
METHODS
The study was approved by the local ethics committee at KHMC and was conducted between June 1999 and September 1999. The study involved 600 representative samples of HCWs at KHMC. Subjects were divided into 3 groups according to their professions (physicians, nurses, and other professions). Each subject was interviewed personally. Questions were designed to obtain various demographic data and cigarette smoking characteristics. All other forms of tobacco consumption were not included into the questionnaire. Questions addressed various factors such as the age at which smoking was started and its duration and the number of cigarettes smoked per day. We defined smoking status as current smoker, occasional smoker, past smoker, or never smoker, according to WHO's 1995 definitions.4 Current smokers were those who had smoked at least 100 cigarettes and who were currently smoking on a daily basis. Occasional smokers were those who did not smoke daily. Past (ex‐)smokers were those nonsmokers who previously smoked every day for 6 months or more. The rate of cigarette smoking was calculated for each age group and for different medical specialties. Statistical analysis was performed with Statistical Package for Social Sciences 10.0 software (SPSS Inc., Chicago, IL). The 2 test was used to determine statistical significance. The 2‐tailed significance level was set at 5% (P < 0.05).
RESULTS
Among the 600 respondents, there were 310 women (52%) and 290 men (48%), of whom 260 (43%) were physicians, 250 (42%) were nurses, and 90 (15%) were other HCWs. The total prevalence of smoking was 65%, ranging from 10% in the dermatologist group to 75% in the family practitioner group. We learned that 52% of smokers started before age 21 and that 78% started their habit during the first 2 years of college. The most common motive for starting smoking was pleasure encouraged by peer influence. Eighty‐two percent of male HCWs smoked cigarettes compared with 47% of female HCWs. The prevalence of current smokers was 77% and 33% in men and women, respectively (P = .002). Forty‐three percent of women did not smoke cigarettes, whereas only 14% of men did not smoke (P = .002; Table 1). Smoking prevalence did not significantly differ between age groups (P = .38; Table 2). The highest rate of smoking was among current smokers age 3140 years (58%). Of the 260 physicians, 46% were smokers, (currently or occasionally), 29% were ex‐smokers, and 25% were nonsmokers. Sixty‐seven percent of physicians who were smokers smoked 1120 cigarettes/day. There were fewer current smokers among physicians than among other HCWs (46% versus 74%, respectively). The highest percentage of smokers in the physician group was observed among family practitioners working in the emergency room (75%). On the other hand, dermatologists had the lowest percentage (10%). Women in general had a lower prevalence than men in all categories. Of the female nurses, 17% were smokers, 13% were ex‐smokers, and 70% were nonsmokers. The smoking rate of female nurses fell below their male counterparts (17% and 49%, respectively; P = .002). Seventy‐eight percent of the nonsmoking physicians reported that they do ask their patients routinely about their smoking history and encourage them to discontinue this habit. Only 36% of the physicians who smoked provide such advice during their clinical practice.
| Smoking status | Men (n = 310) | Women (n = 290) | Total (n = 600) | |||
|---|---|---|---|---|---|---|
| n | % | n | % | n | % | |
| Current smoker | 238 | 77 | 96 | 33 | 334 | 56 |
| Occasional smoker | 17 | 5 | 40 | 14 | 57 | 9 |
| Ex‐smoker | 12 | 4 | 30 | 10 | 42 | 7 |
| Nonsmoker | 43 | 14 | 124 | 43 | 167 | 28 |
| Smoking status | Age group | |||||
|---|---|---|---|---|---|---|
| <30 Years | 3140 Years | >40 Years | ||||
| n | % | n | % | n | % | |
| Current smoker | 92 | 54% | 170 | 58% | 72 | 52% |
| Occasional smoker | 19 | 11% | 22 | 8% | 16 | 12% |
| Ex‐smoker | 10 | 6% | 12 | 4% | 20 | 14% |
| Nonsmoker | 49 | 29% | 88 | 30% | 30 | 22% |
| Total | 170 | 292 | 138 | |||
DISCUSSION
Tobacco use, notably cigarette smoking, is the leading cause of an array of preventable diseases.12 It is estimated that approximately 30%40% of the adult population worldwide smokes. The situation is particularly alarming in adolescents.5, 6 The prevalence of smoking in developing countries now equals or exceeds the high smoking levels common in the United Kingdom 20 or 30 years ago.6 There is a significant difference in smoking prevalence between socioeconomic groups in the Western world. For professional people the prevalence is now 16%, whereas for unskilled manual workers the prevalence is 48%.7 HCWs are important opinion leaders in the community, and their behavior more than their words has a significant impact on the lifestyle of their patients.3, 89 It is therefore discouraging to learn that so many doctors and nurses still smoke. The smoking habits of health staff members may influence their attitudes toward patients.810 Numerous international studies have addressed the issue of smoking among physicians and other HCWs.816 In a study conducted by Ohida et al.,8 the prevalence of smoking among Japanese physicians was 27.1% for men and 6.8% for women, about half the general population in Japan (male, 54.0%; female, 14.5%). The prevalence of smoking varied in other industrialized countries: in the United States, the prevalence was 3% of men and 10% of women9; in the United Kingdom, it was 4% of men and 5% of women10; in France, 33% of men and 24% of women;11 and in the Netherlands, 41% of men and 24% of women12 Approximately 40% of Italian general practitioners and approximately 45% of their Spanish colleagues also smoke.13 There are limited published data addressing the issue of cigarette smoking among physicians and other HCWs in various Arab countries. Our results showed a higher rate of cigarette smoking among Jordanian physicians compared with that in the surrounding Arab countries.1416 Physicians at KHMC have a very high prevalence of cigarette smokingfar above the results reported in the above‐noted countries. It is comparable with that of unskilled manual workers in the Western world.2, 5 It has been reported that the highest smoking prevalence among young women in the East Mediterranean region occurs in Jordan.17 Our study showed that the smoking rate among women at KHMC, especially among nursing staff, is much lower than that of men, but this might change in the coming years if antismoking measures are not applied and directed toward younger generations. Smoking practice widely varies among the nonmedical KHMC staff and is reaching a very dangerous and worrisome level. This study was the first to be conducted to calculate the prevalence of smoking among HCWs at the largest tertiary‐care hospital in Jordan. A limitation of our study was that the number of responders included in this study might not fully represent the smoking status among HCWs in the country. However, the results raise some important issues to be discussed and analyzed further on a national level concerning this growing health problem. Physicians play an important role in accelerating the process of smoking cessation. Physicians should play an active role in the control of smoking by participating in public debate regarding smoking, both individually and through medical organizations. Nonsmoking physicians at KHMC were more active in asking patients about smoking habits than were those who smoked. The physician smokers were less critical of smoking than were the physician nonsmokers. Jordanian physicians do not fully comply with the rules against tobacco smoking in hospital. Smoking doctors frequently smoke in the hospital and do not counsel patients about smoking.10, 11, 13 Special effort is needed in the educational field concerning the issue of tobacco smoking for Jordanian physicians, and a strong initiative toward smoke‐free hospitals would help spread the message. To promote antismoking measures among doctors and nurses, it will be necessary to scrutinize the smoking habits and behavior of medical and nursing students18 and to conduct effective antismoking and health education activities before they acquire the smoking habit.
- Centers for Disease Control and Prevention.Smoking‐attributable mortality and years of potential life lost—United States, 1990.MMMWR Morb Mortal Wkly Rep.1993;42:645–648.
- ,,,,.Mortality from tobacco in developed countries: indirect estimation from national vital statistics.Lancet.1992;339:1268–1278.
- Working Group on Tobacco or Health.Guidelines for the conduct of tobacco smoking surveys among health professionals.Tokyo, Japan:World Health Organization Regional Office for Western Pacific;1987:9–19.
- World Health Organization.Leave the Pack Behind.Geneva, Switzerland:World Health Organization;1999:33–39.
- ,,,Tobacco Control Country Profiles.2nd ed.Atlanta, GA:American Cancer Society;2003:220–221.
- .The Seventh World Conference on Tobacco and Health.Thorax.1990;45:560–562.
- Department of Health.Smoke‐Free for Health, an Action Plan to Achieve the Health of the Nation Targets on Smoking.London:Department of Health;1994.
- ,,, et al.Smoking prevalence and attitudes toward smoking among Japanese physicians.JAMA.2001;286:917.
- ,,, et al.Trends in cigarette smoking among US physicians and nurses.JAMA.1994;271:1273–1275.
- ,,, et al.Attitudes to smoking and smoking habits among hospital staff.Thorax.1993;48:174–175.
- ,,,,.Smoking by French general practitioners: behaviour, attitudes and practice.Eur J Public Health.2005;15:33–38.
- ,,,.Prevalence of smoking in physicians and medical students, and the generation effect in the Netherlands.Soc Sci Med.1993;36:817–822.
- .Smoking habits of Italian health professionals.Ital Heart J.2001;2:110–112.
- ,,.Knowledge of and attitudes towards tobacco control among smoking and non‐smoking physicians in 2 Gulf Arab states.Saudi Med J.2004;25:585–591.
- ,,.Smoking habits among physicians in two Gulf countries.J R Soc Health.1993;113:298–301.
- .Smoking habits of primary health care physicians in Bahrain.J R Soc Health.1999;119:36–39.
- ,,,Tobacco Control Country Profiles.1st ed.Atlanta, GA:American Cancer Society;2000:30.
- ,,,.Smoking habits and attitudes of medical students towards smoking and antismoking campaigns in nine Asian countries. The Tobacco and Health Committee of the International Union Against Tuberculosis and Lung Diseases.Int J Epidemiol.1992;21:298–304.
Sleepiness in Critical Care Nurses
Current practice patterns among nurses show they are working longer than they ever have.14 The effect of these long hours is that many nurses work in the midst of severe lethargy and sleep deprivation.5 Sleep deprivation jeopardizes not only patient safety but also the safety and general health of the nurses themselves.46 Numerous studies of shift workers in other professions have been done to assess sleepiness using subjective and objective data and also the effect of shift work on work and health.710 Despite the Accreditation Council for Graduate Medical Education (ACGME) mandating work‐hour limitations for medical residents, recent data suggest that sleepiness continues to be a significant issue for medical residents.11 There is a paucity of objective information about the sleepiness and performance of nurses, especially now that most nurses in the United States are working 12‐hour shifts. We hypothesized that nurses working a 12‐hour night shift would have a significant degree of sleepiness. Our objective was to assess the daytime sleepiness of post‐night‐shift nurses using both subjective measures (Epworth Sleepiness Scale [ESS]) and objective testing (Multiple Sleep Latency Test [MSLT]).
MATERIALS AND METHODS
The study was initiated after we obtained institutional review board approval.
Setting
The setting of the study was a community hospital in Corpus Christi, Texas.
Design
The study was a prospective pilot study.
Subjects
Twenty adult nurses (age > 18 years) assigned to duty on general floors (both medical and surgical) and the intensive care unit (ICU) who consented to participate in the study were included. Exclusion criteria included recent or ongoing use of sedative, hypnotic, stimulant drugs; illnesses such as cardiac disease; narcolepsy and other primary sleep disorders; being pregnant or lactating, and being obese (body mass index [BMI] > 30).
Protocol
Floor nurses (n = 10) constituted the control group, and ICU nurses (n = 10) formed the study group. Both groups of nurses came on duty at 7 PM and completed their duty at 7 AM. The MSLT test was performed in the morning following either the third or fourth night shift. All nurses maintained a detailed sleep diary for the week prior to the day of the test that included a detailed record of their bedtimes, wake times, and daytime naps and also included comments about nocturnal awakenings and subjective sleepiness. All nurses were asked to fill out the ESS prior to undergoing the MSLT. ESS is a well‐standardized and validated measure of subjective sleepiness.12 The score was established based on the questionnaire about their chances of falling asleep in 6 different scenarios. A score greater than 8 was considered abnormal. A modified protocol for MSLT was used, which consisted of only 2 nap opportunities. This was done to enable these nurses to go home at a reasonable time in order to catch up on their sleep after having spent the previous night at work. The MSLT procedure was explained to nurses before the start of study, and the MSLT was done at 7:15 AM and 8:30 AM. Standard guidelines for the test were followed.13 Nurses were given $25 gift certificates on completion of the study.
Statistical Analysis
Standard software was used for computation of all data. The t test was used for comparison of means, and Fisher's exact analysis was used to compare proportions. All P values are 2 sided. The term significant indicates a P value < .05. Computations were performed using Microsoft Excel software.
RESULTS
Baseline data are shown in Table 1. Nurses in the 2 groups were matched for age, sex, and marital and offspring status. There was a small but statistically significant difference between the 2 groups in BMI (see Table 1). There was no difference between the 2 groups in the average time slept (per night) in the week preceding the test. Seven of 10 ICU nurses had an abnormal ESS (>8) compared with 2 of 10 floor nurses. Mean ESS of ICU nurses was also higher (5.6 2.1 vs. 8.7 3.9 minutes, respectively, P = .042). Nine of 10 ICU nurses had sleep latency values in the severe pathologic range (<5 minutes) for the first sleep period, compared with only 2 of 10 in the floor group. Mean sleep latency in the nap 1 period differed significantly between the 2 groups (Table 2). Overall, however, mean MSLT value did not differ between the ICU nurses and the control group (6.1 3.8 vs. 10.6 7.5 minutes; Table 2 and Fig. 1). Also, during MSLT, the nurses were unaware of their sleep onset in 10 of the 32 periods (31.3%).

| Variable | ICU nurses (n = 10) | Floor nurses (n = 10) | P value |
|---|---|---|---|
| |||
| Age (years) | 37.1 7.53 | 34.6 7.19 | .45 |
| Sex (M:F) | 4:6 | 1:9 | .118 |
| BMI* | 24.9 3.5 | 21.6 1.9 | .02 |
| Married | 5 | 6 | .315 |
| With Children | 6 | 5 | .315 |
| Variable | ICU nurses (n = 10) | Floor nurses (n = 10) | P value |
|---|---|---|---|
| |||
| Sleep time (minutes) | 405.2 36.6 | 416.1 84.73 | .72 |
| ESS score* | 8.7 3.9 | 5.6 2.1 | .042 |
| Abnormal ESS (>8)* | 7 | 2 | .032 |
| MSLT (min) | 6.1 3.8 | 1.6 7.5 | .19 |
| First‐period sleep latency < 5 minutes* | 9 | 2 | <.005 |
| First nap MSLT | 4.65 5.56 | 1.85 7.44 | .025 |
DISCUSSION
Our study shows that nurses working night shifts have a pathologic degree of sleepiness. This was especially severe in the ICU nurses as determined by both the ESS and the MSLT studies.
To our knowledge, ours is the first study that has comprehensively evaluated the issue of sleepiness in nurses working night shifts using both the ESS and the MSLT. Previous studies have evaluated subjective sleepiness in nurses. In a cross‐sectional study in 8 large hospitals in Japan, Suzuki et al. found that an estimated 26% of the 4407 nurses surveyed reported excess sleepiness.14 They found key associations of daytime sleepiness with motor vehicle accidents, medication errors, and incorrect operation of medical equipment. Scott et al. randomly surveyed 502 critical care nurses across the US and found that almost two thirds reported struggling to stay awake at least once during the study period and that 22% fell asleep at least once during their work shift.2 Sleep deprivation resulting in impairment in cognitive and psychomotor performance and its association with medical errors have now been well documented in medical residents.1517 This has resulted in the Accreditation Council for Graduate Medical Education mandating a reduction in resident work hours.18 No state or federal regulations restrict the number of hours a nurse may voluntarily work in a 24‐hour or a 7‐day period. Bills prohibiting mandatory overtime for nurses have passed only in California, Maine, New Jersey, and Oregon. No measure, either proposed or enacted, addresses how long nurses may work voluntarily. The recent Institute of Medicine (IOM) report, Keeping Patients Safe, explicitly recommends that nurses' shifts be limited to 12 hours in a 24‐hour period, 60 hours per week, and that voluntary overtime be limited.19
Even with the current ACGME‐mandated reduction in work hours, we and others have reported that sleepiness in medical residents continues to be a major issue.11, 20 In the first year following implementation of the ACGME duty‐hour standards, as many as 43% of interns reported noncompliance with these requirements.21 This demonstrates that mandating work‐hour reductions is only the first step in what is likely to be a long process of effecting change in nurse work hours and fatigue and, in turn, improving patient safety. However, initiating this process is going to be crucial, given the impact even small changes in nursing fatigue could have on patient‐care outcomes.
A nationwide nursing shortage has placed enormous stress on the delivery of patient care in our hospitals. Demands of nursing care requirements have also increased in today's health care scenario because of a variety of socioeconomic factors, and this in turn has forced hospitals to encourage and in many instances insist on nurses working overtime and longer shifts. Rogers et al. examined logbooks completed by 393 hospital staff nurses and found that 40% of the 5317 work shifts they logged exceeded 12 hours. The risk of making an error was significantly increased when the work shift was longer than 12 hours, when overtime was worked, and when the workweek was more than 40 hours.5 There are good data comparing 8‐ and 12‐hour shift lengths among other occupational groups that demonstrate, particularly for the night shift, greater sleepiness during a 12‐hour night shift than during an 8‐hour night shift.22 Emergency room physicians overwhelmingly prefer shifts to last 8 and 10 hours than 12 hours, and longer shifts have been shown to impair their triage decisions in simulation studies.23 The problem is compounded for female nurses, as they also have to carry out their responsibilities as partner and parent along with working, resulting in chronic fatigue and sleep deprivation.24 From these results together with the results of the present study, we suggest enforcing a shift length of no longer than 10 hours for nurses working the night shift in a critical care environment.
In our study, ICU nurses were found to be more sleepy than floor nurses. Sleep quantity in the week prior to the study day did not differ between the 2 groups (405.2 36.6 vs. 416.1 84.73 minutes; P = .364; Fig. 2). For the 24 hours prior to the night shift that was studied, the average amount of sleep was not different between the 2 groups (406 65 minutes for the ICU group vs. 432 107 minutes for the control group; P = .265; Fig. 4). Sleep quality could certainly be markedly different between the 2 groups. A recent study has reported that nearly a third of ICU nurses had severe burnout syndrome, and this has been associated with profound sleep disturbances.25, 26 This could also be attributed to the floor nurses having a less demanding schedule than the ICU nurses.
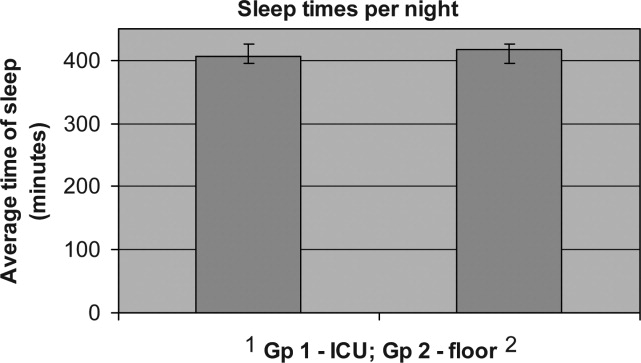
Our study had some limitations. Our sample size was small, and larger studies may be needed to validate the results of this pilot study. Although our 2 groups were matched for age and sex, the BMI of ICU nurses was slightly but statistically significantly higher than that of floor nurses. Although the mean BMI of ICU nurses was still not in the obese range (one of the exclusion criteria was a BMI > 30), we still cannot definitively rule out that the higher BMI may have conferred a risk of increased upper airway resistance and sleep‐disordered breathing. The control group consisted of RNs in different settingsmedical and surgicaland because of the small numbers of nurses studied, we are unable to further dissect this group and identify differences in degrees of sleepiness. For example, sleep deprivation effects have been shown to be less pronounced in nurses regularly and permanently working night shifts than in nurses working to rotating shifts,27 perhaps a consequence of circadian misalignment being more severe in the latter group, and this factor was not controlled for. We also measured sleepiness after the shift was completed and not during the shift. Not only is this likely reflective of the nurses' sleepiness toward the latter portion of their shift, it also has direct implications for the driving safety of nurses at the end of a shift.
Our MSLT data showed significant differences only for nap 1 but not when combined for the 2 nap periods. We speculate that the reason for this could be that some alertness was recovered by the first nap, as 9 of 10 in the ICU group had at least 15 minutes of sleep during the first nap opportunity compared with only 2 of 10 nurses in the floor group. Incidentally, the only nurse in the ICU group who had no sleep during the first nap period had a sleep latency of 2 minutes during the second nap period (see Fig. 3).
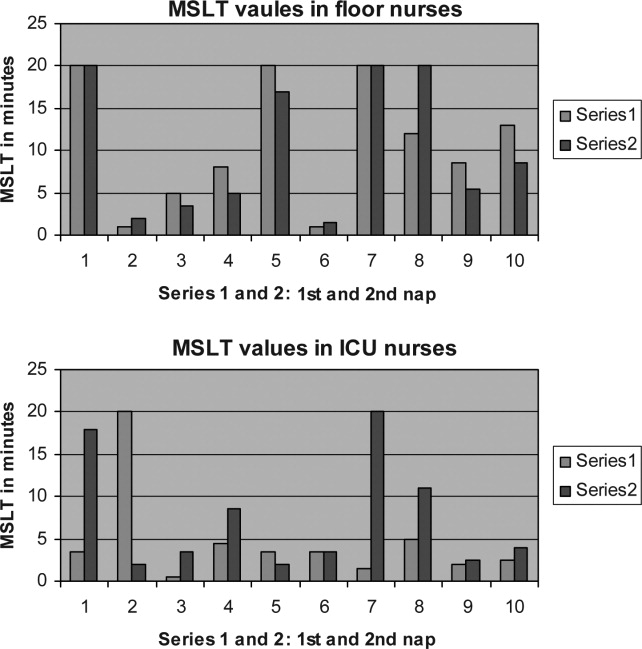
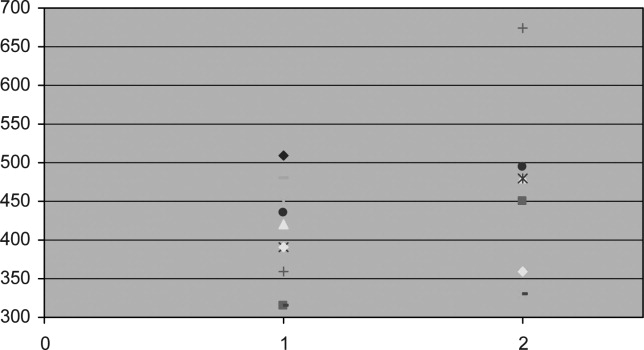
We also did not correlate sleepiness in our study with any clinical performance, and this will be an important variable to focus on in future studies.
In conclusion, our data indicate that nurses working in the ICU are significantly more sleepy than nurses on the floor. Level of sleepiness of ICU nurses is frequently in the pathologic range, comparable to narcolepsy.
- ,.Trends in nurse overtime, 1995–2002.Policy Polit Nurs Pract.2005;6:183–190.
- ,,,.Effects of critical care nurses' work hours on vigilance and patients' safety.Am J Crit Care.2006;15:30–37.
- ,,,,.How long and how much are nurses now working?Am J Nurs.2006;106:60–71.
- ,.Are you tired? Sleep deprivation compromises nurse's health and jeopardizes patients.Am J Nurs.2004;104:36–38.
- ,,,,.The working hours of hospital staff nurses and patient safety.Health Aff (Millwood).2004;23:202–212.
- ,.Twelve‐hour night shifts of healthcare workers: a risk to the patients?Chronobiol Int.2003;20:351–360.
- ,,,,.The sleep of long‐haul truck drivers.N Engl J Med.1997;337:755–761.
- ,,, et al.Subjective and objective measures of adaptation and readaptation to night work on an oil rig in the North Sea.Sleep.2006;29:821–829.
- ,,,,.Shift work sleep disorder: prevalence and consequences beyond that of symptomatic day workers.Sleep.2004;27:1453–1462.
- ,.Impact of shift work on the health and safety of nurses and patients.Clin J Oncol Nurs.2006;0:465–471.
- ,,,,.Sleepiness in medical residents: Impact of mandated reduction in work hours.Sleep Med.2007;8:90–93.
- .A new method for measuring daytime sleepiness: the Epworth sleepiness scale.Sleep.1991;14:540–545.
- ,,,,,, et al.Standards of practice committee of the American Academy of Sleep Medicine. Practice parameters for clinical use of the multiple sleep latency test and the maintenance of wakefulness test.Sleep.2005;28:113–121.
- ,,,,.Daytime sleepiness, sleep habits and occupational accidents among hospital nurses.J Adv Nurs.2005;52:445–453.
- ,,,,.Neurobehavioral performance of residents after heavy night call vs after alcohol ingestion.JAMA.2005;294:1025–1033.
- .Simulation study of rested versus sleep‐deprived anesthesiologists.Anesthesiology.2003;98:1345–1355.
- ,,,.The risks and implication of excessive daytime sleepiness in resident physicians.Acad Med.2002;77:1019–1025.
- Accreditation Council for Graduate Medical Education. Common program requirements. Available at: http://www.acgme.org/acWebsite/dutyHours/dh_dutyHoursCommonPR.pdf.
- Institute of Medicine.Keeping Patients Safe: Transforming the Work Environment of Nurses.Washington, DC:National Academies Press;2003.
- ,,, et al.Sleep and well‐being of ICU housestaff.Chest.2007;131:1685–1693.
- ,,,,.Interns' compliance with accreditation council for graduate medical education work‐hour limits.JAMA.2006;296:1063–1070.
- ,,, et al.Effects of alternating 8‐ and 12‐hour shifts on sleep, sleepiness, physical effort and performance.Scand J Work Environ Health.1998;24:62–68.
- ,,, et al.Emergency medicine residents' shiftwork tolerance and preference.Acad Emerg Med.2000;7:670–673.
- ,,,.A study of female nurses combining partner and parent roles with working a continuous three‐shift roster: the impact on sleep, fatigue and stress.Contemp Nurse.2002;12:294–302.
- ,,, et al.Burnout syndrome in critical care nursing staff.Am J Respir Crit Care Med2007;175:698–704.
- ,,, et al.Disturbed sleep and fatigue in occupational burnout.Scand J Work Environ Health.2006;32:121.
- .A computer‐aided comparative study of progressive alertness changes in nurses working two different night‐shift rotations.J Adv Nurs.1996;23:1247–1253.
Current practice patterns among nurses show they are working longer than they ever have.14 The effect of these long hours is that many nurses work in the midst of severe lethargy and sleep deprivation.5 Sleep deprivation jeopardizes not only patient safety but also the safety and general health of the nurses themselves.46 Numerous studies of shift workers in other professions have been done to assess sleepiness using subjective and objective data and also the effect of shift work on work and health.710 Despite the Accreditation Council for Graduate Medical Education (ACGME) mandating work‐hour limitations for medical residents, recent data suggest that sleepiness continues to be a significant issue for medical residents.11 There is a paucity of objective information about the sleepiness and performance of nurses, especially now that most nurses in the United States are working 12‐hour shifts. We hypothesized that nurses working a 12‐hour night shift would have a significant degree of sleepiness. Our objective was to assess the daytime sleepiness of post‐night‐shift nurses using both subjective measures (Epworth Sleepiness Scale [ESS]) and objective testing (Multiple Sleep Latency Test [MSLT]).
MATERIALS AND METHODS
The study was initiated after we obtained institutional review board approval.
Setting
The setting of the study was a community hospital in Corpus Christi, Texas.
Design
The study was a prospective pilot study.
Subjects
Twenty adult nurses (age > 18 years) assigned to duty on general floors (both medical and surgical) and the intensive care unit (ICU) who consented to participate in the study were included. Exclusion criteria included recent or ongoing use of sedative, hypnotic, stimulant drugs; illnesses such as cardiac disease; narcolepsy and other primary sleep disorders; being pregnant or lactating, and being obese (body mass index [BMI] > 30).
Protocol
Floor nurses (n = 10) constituted the control group, and ICU nurses (n = 10) formed the study group. Both groups of nurses came on duty at 7 PM and completed their duty at 7 AM. The MSLT test was performed in the morning following either the third or fourth night shift. All nurses maintained a detailed sleep diary for the week prior to the day of the test that included a detailed record of their bedtimes, wake times, and daytime naps and also included comments about nocturnal awakenings and subjective sleepiness. All nurses were asked to fill out the ESS prior to undergoing the MSLT. ESS is a well‐standardized and validated measure of subjective sleepiness.12 The score was established based on the questionnaire about their chances of falling asleep in 6 different scenarios. A score greater than 8 was considered abnormal. A modified protocol for MSLT was used, which consisted of only 2 nap opportunities. This was done to enable these nurses to go home at a reasonable time in order to catch up on their sleep after having spent the previous night at work. The MSLT procedure was explained to nurses before the start of study, and the MSLT was done at 7:15 AM and 8:30 AM. Standard guidelines for the test were followed.13 Nurses were given $25 gift certificates on completion of the study.
Statistical Analysis
Standard software was used for computation of all data. The t test was used for comparison of means, and Fisher's exact analysis was used to compare proportions. All P values are 2 sided. The term significant indicates a P value < .05. Computations were performed using Microsoft Excel software.
RESULTS
Baseline data are shown in Table 1. Nurses in the 2 groups were matched for age, sex, and marital and offspring status. There was a small but statistically significant difference between the 2 groups in BMI (see Table 1). There was no difference between the 2 groups in the average time slept (per night) in the week preceding the test. Seven of 10 ICU nurses had an abnormal ESS (>8) compared with 2 of 10 floor nurses. Mean ESS of ICU nurses was also higher (5.6 2.1 vs. 8.7 3.9 minutes, respectively, P = .042). Nine of 10 ICU nurses had sleep latency values in the severe pathologic range (<5 minutes) for the first sleep period, compared with only 2 of 10 in the floor group. Mean sleep latency in the nap 1 period differed significantly between the 2 groups (Table 2). Overall, however, mean MSLT value did not differ between the ICU nurses and the control group (6.1 3.8 vs. 10.6 7.5 minutes; Table 2 and Fig. 1). Also, during MSLT, the nurses were unaware of their sleep onset in 10 of the 32 periods (31.3%).
| Variable | ICU nurses (n = 10) | Floor nurses (n = 10) | P value |
|---|---|---|---|
| |||
| Age (years) | 37.1 7.53 | 34.6 7.19 | .45 |
| Sex (M:F) | 4:6 | 1:9 | .118 |
| BMI* | 24.9 3.5 | 21.6 1.9 | .02 |
| Married | 5 | 6 | .315 |
| With Children | 6 | 5 | .315 |
| Variable | ICU nurses (n = 10) | Floor nurses (n = 10) | P value |
|---|---|---|---|
| |||
| Sleep time (minutes) | 405.2 36.6 | 416.1 84.73 | .72 |
| ESS score* | 8.7 3.9 | 5.6 2.1 | .042 |
| Abnormal ESS (>8)* | 7 | 2 | .032 |
| MSLT (min) | 6.1 3.8 | 1.6 7.5 | .19 |
| First‐period sleep latency < 5 minutes* | 9 | 2 | <.005 |
| First nap MSLT | 4.65 5.56 | 1.85 7.44 | .025 |
DISCUSSION
Our study shows that nurses working night shifts have a pathologic degree of sleepiness. This was especially severe in the ICU nurses as determined by both the ESS and the MSLT studies.
To our knowledge, ours is the first study that has comprehensively evaluated the issue of sleepiness in nurses working night shifts using both the ESS and the MSLT. Previous studies have evaluated subjective sleepiness in nurses. In a cross‐sectional study in 8 large hospitals in Japan, Suzuki et al. found that an estimated 26% of the 4407 nurses surveyed reported excess sleepiness.14 They found key associations of daytime sleepiness with motor vehicle accidents, medication errors, and incorrect operation of medical equipment. Scott et al. randomly surveyed 502 critical care nurses across the US and found that almost two thirds reported struggling to stay awake at least once during the study period and that 22% fell asleep at least once during their work shift.2 Sleep deprivation resulting in impairment in cognitive and psychomotor performance and its association with medical errors have now been well documented in medical residents.1517 This has resulted in the Accreditation Council for Graduate Medical Education mandating a reduction in resident work hours.18 No state or federal regulations restrict the number of hours a nurse may voluntarily work in a 24‐hour or a 7‐day period. Bills prohibiting mandatory overtime for nurses have passed only in California, Maine, New Jersey, and Oregon. No measure, either proposed or enacted, addresses how long nurses may work voluntarily. The recent Institute of Medicine (IOM) report, Keeping Patients Safe, explicitly recommends that nurses' shifts be limited to 12 hours in a 24‐hour period, 60 hours per week, and that voluntary overtime be limited.19
Even with the current ACGME‐mandated reduction in work hours, we and others have reported that sleepiness in medical residents continues to be a major issue.11, 20 In the first year following implementation of the ACGME duty‐hour standards, as many as 43% of interns reported noncompliance with these requirements.21 This demonstrates that mandating work‐hour reductions is only the first step in what is likely to be a long process of effecting change in nurse work hours and fatigue and, in turn, improving patient safety. However, initiating this process is going to be crucial, given the impact even small changes in nursing fatigue could have on patient‐care outcomes.
A nationwide nursing shortage has placed enormous stress on the delivery of patient care in our hospitals. Demands of nursing care requirements have also increased in today's health care scenario because of a variety of socioeconomic factors, and this in turn has forced hospitals to encourage and in many instances insist on nurses working overtime and longer shifts. Rogers et al. examined logbooks completed by 393 hospital staff nurses and found that 40% of the 5317 work shifts they logged exceeded 12 hours. The risk of making an error was significantly increased when the work shift was longer than 12 hours, when overtime was worked, and when the workweek was more than 40 hours.5 There are good data comparing 8‐ and 12‐hour shift lengths among other occupational groups that demonstrate, particularly for the night shift, greater sleepiness during a 12‐hour night shift than during an 8‐hour night shift.22 Emergency room physicians overwhelmingly prefer shifts to last 8 and 10 hours than 12 hours, and longer shifts have been shown to impair their triage decisions in simulation studies.23 The problem is compounded for female nurses, as they also have to carry out their responsibilities as partner and parent along with working, resulting in chronic fatigue and sleep deprivation.24 From these results together with the results of the present study, we suggest enforcing a shift length of no longer than 10 hours for nurses working the night shift in a critical care environment.
In our study, ICU nurses were found to be more sleepy than floor nurses. Sleep quantity in the week prior to the study day did not differ between the 2 groups (405.2 36.6 vs. 416.1 84.73 minutes; P = .364; Fig. 2). For the 24 hours prior to the night shift that was studied, the average amount of sleep was not different between the 2 groups (406 65 minutes for the ICU group vs. 432 107 minutes for the control group; P = .265; Fig. 4). Sleep quality could certainly be markedly different between the 2 groups. A recent study has reported that nearly a third of ICU nurses had severe burnout syndrome, and this has been associated with profound sleep disturbances.25, 26 This could also be attributed to the floor nurses having a less demanding schedule than the ICU nurses.
Our study had some limitations. Our sample size was small, and larger studies may be needed to validate the results of this pilot study. Although our 2 groups were matched for age and sex, the BMI of ICU nurses was slightly but statistically significantly higher than that of floor nurses. Although the mean BMI of ICU nurses was still not in the obese range (one of the exclusion criteria was a BMI > 30), we still cannot definitively rule out that the higher BMI may have conferred a risk of increased upper airway resistance and sleep‐disordered breathing. The control group consisted of RNs in different settingsmedical and surgicaland because of the small numbers of nurses studied, we are unable to further dissect this group and identify differences in degrees of sleepiness. For example, sleep deprivation effects have been shown to be less pronounced in nurses regularly and permanently working night shifts than in nurses working to rotating shifts,27 perhaps a consequence of circadian misalignment being more severe in the latter group, and this factor was not controlled for. We also measured sleepiness after the shift was completed and not during the shift. Not only is this likely reflective of the nurses' sleepiness toward the latter portion of their shift, it also has direct implications for the driving safety of nurses at the end of a shift.
Our MSLT data showed significant differences only for nap 1 but not when combined for the 2 nap periods. We speculate that the reason for this could be that some alertness was recovered by the first nap, as 9 of 10 in the ICU group had at least 15 minutes of sleep during the first nap opportunity compared with only 2 of 10 nurses in the floor group. Incidentally, the only nurse in the ICU group who had no sleep during the first nap period had a sleep latency of 2 minutes during the second nap period (see Fig. 3).
We also did not correlate sleepiness in our study with any clinical performance, and this will be an important variable to focus on in future studies.
In conclusion, our data indicate that nurses working in the ICU are significantly more sleepy than nurses on the floor. Level of sleepiness of ICU nurses is frequently in the pathologic range, comparable to narcolepsy.
- ,.Trends in nurse overtime, 1995–2002.Policy Polit Nurs Pract.2005;6:183–190.
- ,,,.Effects of critical care nurses' work hours on vigilance and patients' safety.Am J Crit Care.2006;15:30–37.
- ,,,,.How long and how much are nurses now working?Am J Nurs.2006;106:60–71.
- ,.Are you tired? Sleep deprivation compromises nurse's health and jeopardizes patients.Am J Nurs.2004;104:36–38.
- ,,,,.The working hours of hospital staff nurses and patient safety.Health Aff (Millwood).2004;23:202–212.
- ,.Twelve‐hour night shifts of healthcare workers: a risk to the patients?Chronobiol Int.2003;20:351–360.
- ,,,,.The sleep of long‐haul truck drivers.N Engl J Med.1997;337:755–761.
- ,,, et al.Subjective and objective measures of adaptation and readaptation to night work on an oil rig in the North Sea.Sleep.2006;29:821–829.
- ,,,,.Shift work sleep disorder: prevalence and consequences beyond that of symptomatic day workers.Sleep.2004;27:1453–1462.
- ,.Impact of shift work on the health and safety of nurses and patients.Clin J Oncol Nurs.2006;0:465–471.
- ,,,,.Sleepiness in medical residents: Impact of mandated reduction in work hours.Sleep Med.2007;8:90–93.
- .A new method for measuring daytime sleepiness: the Epworth sleepiness scale.Sleep.1991;14:540–545.
- ,,,,,, et al.Standards of practice committee of the American Academy of Sleep Medicine. Practice parameters for clinical use of the multiple sleep latency test and the maintenance of wakefulness test.Sleep.2005;28:113–121.
- ,,,,.Daytime sleepiness, sleep habits and occupational accidents among hospital nurses.J Adv Nurs.2005;52:445–453.
- ,,,,.Neurobehavioral performance of residents after heavy night call vs after alcohol ingestion.JAMA.2005;294:1025–1033.
- .Simulation study of rested versus sleep‐deprived anesthesiologists.Anesthesiology.2003;98:1345–1355.
- ,,,.The risks and implication of excessive daytime sleepiness in resident physicians.Acad Med.2002;77:1019–1025.
- Accreditation Council for Graduate Medical Education. Common program requirements. Available at: http://www.acgme.org/acWebsite/dutyHours/dh_dutyHoursCommonPR.pdf.
- Institute of Medicine.Keeping Patients Safe: Transforming the Work Environment of Nurses.Washington, DC:National Academies Press;2003.
- ,,, et al.Sleep and well‐being of ICU housestaff.Chest.2007;131:1685–1693.
- ,,,,.Interns' compliance with accreditation council for graduate medical education work‐hour limits.JAMA.2006;296:1063–1070.
- ,,, et al.Effects of alternating 8‐ and 12‐hour shifts on sleep, sleepiness, physical effort and performance.Scand J Work Environ Health.1998;24:62–68.
- ,,, et al.Emergency medicine residents' shiftwork tolerance and preference.Acad Emerg Med.2000;7:670–673.
- ,,,.A study of female nurses combining partner and parent roles with working a continuous three‐shift roster: the impact on sleep, fatigue and stress.Contemp Nurse.2002;12:294–302.
- ,,, et al.Burnout syndrome in critical care nursing staff.Am J Respir Crit Care Med2007;175:698–704.
- ,,, et al.Disturbed sleep and fatigue in occupational burnout.Scand J Work Environ Health.2006;32:121.
- .A computer‐aided comparative study of progressive alertness changes in nurses working two different night‐shift rotations.J Adv Nurs.1996;23:1247–1253.
Copyright © 2008 Society of Hospital Medicine
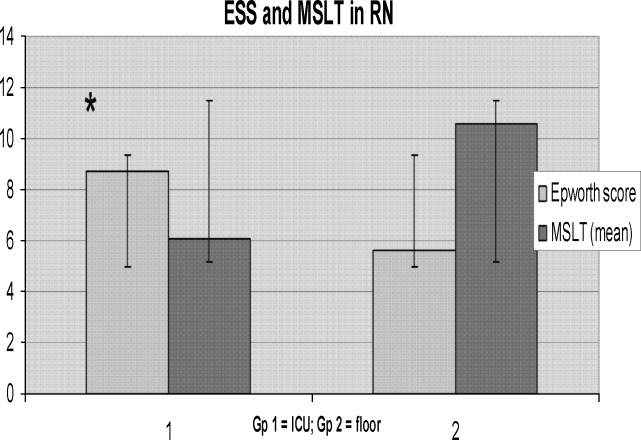
“String‐of‐Pearls”
A 41‐year‐old intravenous drug user (IVDU) was admitted with candidal endophthalmitis 6 weeks after a hospitalization for pneumonia. After discharge from his previous hospitalization which were blood cultures grew Candida albicans, attributed to contamination by a covering physician. The patient described looking through spider webs. Fundoscopic examination revealed fluffy, white string‐of‐pearls opacities with retinal obscuration (Fig. 1). There were no findings of endocarditis (negative echocardiogram) or congestive heart failure. Blood and vitreal cultures grew Candida albicans. The patient underwent a pars plana vitrectomy, and was prescribed chronic fluconazole. He was lost to follow‐up.

Candida albicans is the most common organism identified in endogenous endophthalmitis.1 Predisposing factors include IVDU, indwelling catheters, endocarditis, recent surgeries, immunosuppression, broad‐spectrum antibiotics, and parental nutrition.1 The diagnosis is based on retinal findings of white pinpoint opacities (string‐of‐pearls, Fig. 2), with vitreous involvement and positive cultures. Endocarditis occurs in 15%17% of patients with endophthalmitis.2 This case highlights the importance of physician recognition of the significant attributable morbidity and mortality of candidemia.3, 4

- ,,, et al.Endogenous endophthalmitis with azole‐resistant Candida albicans—case report and review of the literature.Infection.2006;34:285–288.
- ,,, et al.Endogenous endophthalmitis: a 13‐year review at a tertiary hospital in south Australia. ScandinavianJ Infect Dis.2005;37:184–189.
- ,,.Attributable mortaility of candidemia: a systematic review of matched cohort and case‐control studies.Eur J Clin Microbiol Infect Dis.2006;25:419–425.
- ,,, et al.Bloodstream infections in a secondary and tertiary care hospital setting.Intern Med J.2006;765–772.
A 41‐year‐old intravenous drug user (IVDU) was admitted with candidal endophthalmitis 6 weeks after a hospitalization for pneumonia. After discharge from his previous hospitalization which were blood cultures grew Candida albicans, attributed to contamination by a covering physician. The patient described looking through spider webs. Fundoscopic examination revealed fluffy, white string‐of‐pearls opacities with retinal obscuration (Fig. 1). There were no findings of endocarditis (negative echocardiogram) or congestive heart failure. Blood and vitreal cultures grew Candida albicans. The patient underwent a pars plana vitrectomy, and was prescribed chronic fluconazole. He was lost to follow‐up.
Candida albicans is the most common organism identified in endogenous endophthalmitis.1 Predisposing factors include IVDU, indwelling catheters, endocarditis, recent surgeries, immunosuppression, broad‐spectrum antibiotics, and parental nutrition.1 The diagnosis is based on retinal findings of white pinpoint opacities (string‐of‐pearls, Fig. 2), with vitreous involvement and positive cultures. Endocarditis occurs in 15%17% of patients with endophthalmitis.2 This case highlights the importance of physician recognition of the significant attributable morbidity and mortality of candidemia.3, 4
- ,,, et al.Endogenous endophthalmitis with azole‐resistant Candida albicans—case report and review of the literature.Infection.2006;34:285–288.
- ,,, et al.Endogenous endophthalmitis: a 13‐year review at a tertiary hospital in south Australia. ScandinavianJ Infect Dis.2005;37:184–189.
- ,,.Attributable mortaility of candidemia: a systematic review of matched cohort and case‐control studies.Eur J Clin Microbiol Infect Dis.2006;25:419–425.
- ,,, et al.Bloodstream infections in a secondary and tertiary care hospital setting.Intern Med J.2006;765–772.
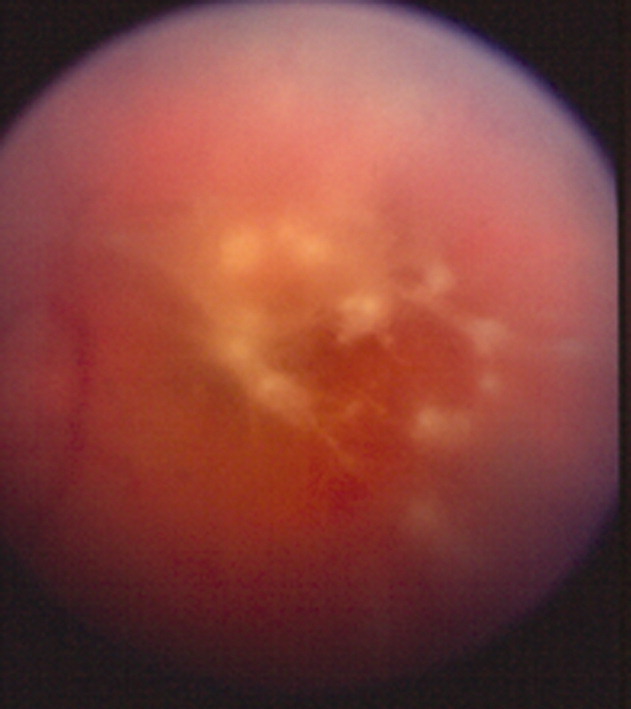
Physician Specialty and Ischemic Stroke Outcomes
The appropriate role of specialists in hospital management of common medical conditions has been vigorously debated.13 Few argue that specialists serve an important role as consultants, but whether patients with specific conditions should be admitted to the care of specialists or generalists is unresolved. This is demonstrated by the large degree of hospital‐to‐hospital variability in the proportion of patients with myocardial infarction admitted to cardiologists,4 patients with asthma exacerbations admitted to pulmonologists,5 and patients with renal failure admitted to nephrologists.6
Stroke is another common diagnosis, with variable rates of admission to specialists and generalists. Several prior studies have suggested that outcomes after ischemic stroke are better if a neurologist is the attending physician.710 However, these observational studies could not rule out the possibility that differences in outcome were a result of prognosis at the time of admission rather than improvements in medical care. Although these studies have controlled for known prognostic variables, it is possible that unknown, unmeasured, or inadequately measured variables were different in the groups admitted to neurologists and the groups admitted to generalists. These differences, in turn, might account for outcome differences rather than specialist care.
This form of selection bias, a type of confounding by indication, is a constant threat to validity in observational studies. Randomized trials avoid it because the randomization process balances all prognostic variables, both known and unknown, in the treatment groups.11 Observational studies cannot guarantee the same balance of unmeasured risk factors.12 Multivariate modeling is meant to account for prognostic differences between groups in observational studies, but confounding by indication may remain if all the factors that determine prognosis are not accurately measured. We developed a method to avoid confounding by indication by evaluating individual outcome differences associated with practice variability.13 This technique, termed grouped‐treatment (GT) analysis, is related to the instrumental variable approach developed by economists and occasionally applied to health services research.14
In multivariate GT analyses, the institutional proportion of cases admitted to the care of a neurologist is used as a predictor of outcomes rather than whether an individual patient was admitted to neurology. For example, at a hospital where three‐fourths of acute stroke patients are admitted to neurology, all patients are treated as having a 75% chance of admission to neurology. Rather than denoting whether each patient's specialist attending was a neurologist or a generalist, the 0.75 probability of admission to neurology is used for analysis. If admission to an attending neurologist improves ischemic stroke care, then GT analysis should demonstrate that hospitals admitting higher proportions of stroke patients to neurologists have improved outcomes regardless of whether there is selection bias at the individual patient level. In this way, the method bypasses unmeasured confounders at the individual level in its estimates of treatment effects. The method is susceptible to confounding at the group level; that is, unmeasured prognostic differences in patients admitted to hospitals that rely more heavily on neurologists could bias the GT estimate of treatment effect. The GT estimates are accurate if it can be assumed that a hospital's rate of treatment is not associated (in an unmeasured way) with its patient population's intrinsic, pretreatment prognosis. However, practice variability is very common between hospitals and is generally poorly associated with systematic differences in prognosis of treated patients,15, 16 and in this setting GT provides an independent assessment of treatment effect that may either confirm or refute an association found at the individual level, where confounding is nearly always an important issue.
In this study, we evaluated the impact of admission to a neurologist or generalist on outcomes of ischemic stroke patients treated at academic medical centers throughout the United States. We also compared traditional analysis to GT analysis. In doing so, we demonstrate the influence of unmeasured confounders on observational assessments of specialist care and may provide a more accurate measure of the impact of care by a neurologist on outcomes after ischemic stroke.
MATERIALS AND METHODS
We used the University HealthSystem Consortium (UHC) administrative database, which contained patient information from 84 large academic health centers and their 39 associate hospitals, with more than 2.1 million discharges each year.17 We obtained UHC discharge abstracts for all ischemic stroke patients admitted through emergency departments from 1997 through 1999. Discharge abstracts included patient demographics, urgency status (emergent, urgent, elective), illness severity class, admitting and discharge specialties, discharge diagnoses, procedure codes, in‐hospital mortality, length of stay, and total hospital charges. Patients were identified using International Classification of Diseases, Ninth Revision (ICD‐9) codes that were previously recognized as specific indicators of acute ischemic stroke (ICD‐9 433.01, 433.11, 433.21, 433.31, 433.81, 433.91, 434.01, 434.11, 434.91, 436).1820 We limited the cohort to emergency department admissions in order to reduce the likelihood of referral bias.
Variables in the discharge database were validated by comparison with a detailed medical record review. Between June and December 1999, 42 institutions participating in a quality improvement project identified 30 consecutive ischemic stroke cases. Trained analysts or clinicians abstracted information on demographics, medical history, and treatment. Kappa statistics have been previously reported for all individual characteristics except hospital charges, for which medical record review data were not available.21 Demographic and clinical variables in the administrative database tended to agree well with medical record review, with agreement ranging from 85% to 100% (kappa 0.581.00). Because the admitting attending likely directed acute stroke management, this was used to define a patient's attending physician specialty in all analyses. Administrative coding of tissue plasminogen activator (tPA) use was imperfect, with a sensitivity of 50% but a specificity of 100%.22
Institutional rate of admission to neurologists versus generalists was calculated as the percentage over the entire study duration. Unadjusted logistic regression was used to compare the distribution of patient pretreatment prognostic factors between institutions above and below the 50th percentile to determine a rate of admission to neurology because generalized estimating equations that could account for clustering were unable to support these models as a result of diverging estimates. We calculated the yearly volume of ischemic strokes treated at an institution from discharge abstracts, including admissions from all sources, because all treated cases would be expected to increase physician experience.
In‐hospital mortality was chosen as the primary outcome because of its frequency, importance, and coding reliability. Univariate predictors of in‐hospital mortality were identified using Pearson's chi‐square and the Wilcoxon rank sum tests.23 Length of stay (LOS), total hospital charges, and receipt of tPA were secondary outcomes. LOS and total hospital charges were compared using the Wilcoxon rank sum test. LOS and total charge calculations included only those patients surviving to discharge so that early mortality would not be confused with more efficient care. Similarly, we compared demographics and clinical variables of patients admitted to the care of neurologists with those of patients admitted to the care of generalists. To evaluate variability between institutions, we determined the proportion of patients with specific characteristics and outcomes at each institution and report median values and the 10th‐ to 90th‐percentile range among the institutions. The correlation between institutional rate of admission and institutional rate of mortality was evaluated.
In standard multivariate analysis, we assessed physician specialty as a predictor of in‐hospital mortality of individual patients after adjustment for demographic characteristics, admission status (emergent, urgent, elective), comorbid illness severity score (range 04, from 0 = no substantial comorbid illness to 4 = catastrophic comorbid illness), and annual institutional treatment volume of ischemic stroke. UHC defined severity class to represent an individual's overall calculated risk of illness; its value was dependent on the refinement of the Health Care Facility Administration's diagnosis‐related groups (DRGs) and the Sach's Complication Profiler count of total comorbidities present.24, 25 Effects on LOS and total charges, as well as the ability of physician specialty to predict tPA use in individual patients, were similarly evaluated. Analysis of tPA use was restricted to patients admitted to universities that ever coded tPA use, which increased the sensitivity of the indicator to 57%.22 Residual misclassification error of tPA use would be expected to obscure a true underlying association between its use and physician specialty.
In multivariate GT calculations, we used the institutional proportion of cases admitted to a neurologist as a predictor of outcomes. GT analysis is based on the observation that if a treatment is effective, hospitals that use it more frequently should have better patient outcomes and that this association should persist regardless of whether individual‐level selection bias is present. The method assumes that hospital rates of admission to neurology are independent on the patient population's pretreatment prognosis. Because utilization differences between hospitals likely reflect practice variability rather than differences in patient prognosis,15, 16 the influence of unmeasured confounders at the hospital level is expected to be small. Measured variables that proved significant in univariate analyses or were thought to be responsible for an association between overall patient prognosis and modalities and frequencies of acute stroke treatments used, such as institutional treatment volume, were included in the multivariate GT model in order to isolate the effect of increasing rates of admission to neurologists.
We included both institutional and individual data to more accurately specify individual outcomes and covariates compared with an analysis that simply compared institutions' characteristics and their outcomes.26 Generalized estimating equations (GEE) were used in order to account for institutional clustering of predictor variables and outcomes. GEE is similar to logistic regression but produces broader confidence intervals (CIs) because logistic regression ignores the possibility that individuals at institutions are more similar to each other than would be expected by chance alone. We used a compound symmetry correlation structure, which initiates modeling by assuming a constant correlation between observations within each institution as well as between institutions, and used a logistic link function for binary outcomes in order to mimic logistic regression. The natural log transformations of LOS and hospital charges were modeled to reduce positive skew and approximate a normal distribution, and an identity link function was used in GEE to mimic linear regression for these analyses. To evaluate the impact of adjustment, both unadjusted and adjusted analyses were conducted. Methods to calculate power of GT analysis are not available. The Stata statistical package was used for all analyses (version 8.0; Stata Corporation, College Station, TX).
RESULTS
A total of 26,925 patients with ischemic strokes were admitted to neurologists or generalists through the emergency department at 113 institutions participating in the study. Patients admitted to neurologists rather than generalists (Table 1) were younger and more likely to be male, but less likely to have a serious comorbid illness. Institutions varied widely in the demographics of treated patients as well as in the markers of pretreatment prognosis. Institutional annual case volume of all ischemic strokes ranged from 1 to 741. Mortality rate, mean LOS, and mean hospital charges also varied broadly between institutions (Table 1). Patients treated at institutions whose rate of admissions to a neurologist's care was in the upper 50th percentile were younger and more often male, but did not differ in illness severity class (Table 2).
| Characteristic | Neurologist (n = 16,287) | Generalist (n = 10,638) | Institutional (n = 113) median (10th90th percentiles) |
|---|---|---|---|
| |||
| Age (years), mean (SD) | 66.2 (14.7) | 69.3 (15.2) | 67.7 (62.174.8) |
| Female, n (%) | 8291 (51) | 5904 (56) | 54% (46%67%) |
| Ethnicity | |||
| African American, n (%) | 4516 (28) | 3335 (31) | 19% (0%71%) |
| Asian American, n (%) | 570 (4) | 201 (2) | 0.7% (0%8%) |
| Hispanic, n (%) | 906 (6) | 458 (4) | 0.7% (0%16%) |
| Native American, Eskimo, n (%) | 48 (0) | 21 (0) | 0% (0%1%) |
| White, n (%) | 9012 (55) | 5851 (55) | 65% (10%95%) |
| Other ethnicity, n (%) | 398 (2) | 157 (1) | 0.3% (0%4%) |
| Unknown, n (%) | 837 (5) | 615 (6) | 0.1% (0%9%) |
| Comorbid illness severity score,* median (interquartile range) | 1 (01) | 1 (01) | 0.83 (0.650.95) |
| Treatment and outcome | |||
| tPA administered, n (%) | 132 (3) | 51 (2) | 1.9% (0.6%6.5%) |
| In‐hospital deaths, n (%) | 755 (5) | 1005 (9) | 6.1% (3%10%) |
| Discharges to home, n (%) | 9504 (59) | 5235 (49) | 52% (38%72%) |
| Length of stay (days), mean (SD) | 6.6 (7.2) | 7.9 (9.9) | 6.6 (4.210.0) |
| Total charges | $16,600 ($20,500) | $18,700 ($26,300) | $15,000 ($9000$30,000) |
| Characteristic | <50th percentile | >50th percentile | P value |
|---|---|---|---|
| |||
| Age (years), mean (SD) | 66.7 (15.2) | 69.4 (14.3) | <.001 |
| Female, n (%) | 5288 (54) | 8907 (52) | .001 |
| Comorbid illness severity score*, median (interquartile range) | 1 (01) | 1 (01) | .87 |
There were 1760 in‐hospital deaths (7.0%). In univariate analysis, older age (P < .001), white ethnicity (P < .001), emergent stroke (P < .001), and increased illness severity (P < .001) were associated with greater risk of death, whereas African‐American (P < .001) and Hispanic (P = .007) ethnicities were protective. No other patient characteristics were important, and institutional annual case volume showed no association with mortality risk.
Overall, 60% of patients with ischemic stroke were admitted to a neurologist's care. In univariate analysis (Table 3), a lower risk of in‐hospital mortality was observed in cases admitted to neurologists (4.6%) compared with those admitted to generalists (9.5%; P < .001). After adjustment in standard multivariable models, the association between neurologist admission and lower risk of death persisted (OR 0.60; 95% CI, 0.500.72; P < .001).
| Characteristics | Unadjusted | Adjusted | ||
|---|---|---|---|---|
| Odds ratio (95% CI) | P value | Odds ratio (95% CI) | P value | |
| ||||
| Mortality | ||||
| Attending neurologist | 0.32 (0.260.39) | <.001 | 0.60 (0.500.72) | <.001 |
| Proportion of admissions to neurology | 1.05 (0.851.31) | .64 | 1.02 (0.791.30) | .90 |
| tPA Use | ||||
| Attending neurologist | 1.87 (1.302.69) | .001 | 2.56 (1.723.78) | <.001 |
| Proportion of admissions to neurology | 2.32 (0.985.49) | .06 | 2.47 (1.085.65) | .03 |
The institutional rate of admission of ischemic stroke patients to neurologists ranged from 0% to 90%, and higher rates were seen at hospitals with higher institutional case volumes (P < .001). There was no correlation between the institutional rate of admission to neurology and the institutional mortality rate (0.33; P = .73). At the individual‐level, greater rates of admission to neurologists had no significant impact on mortality (OR 1.05; 95% CI, 0.851.31; P = .64; Table 3) in unadjusted analysis. After adjustment for patient demographics, comorbid illness severity score, urgency status, and institutional case volume in GT analysis, there remained no association between death and proportion of ischemic stroke cases admitted to neurologists (OR 1.02; 95% CI, 0.791.30; P = .90), consistent with the absence of an association between neurologist care and in‐hospital mortality.
Patients treated by neurologists were likely to have shorter stays (P < .001) and lower charges (P = .01) in univariate analysis (Table 4). In traditional adjusted multivariable analysis, the same associations were seen for LOS (P < .001) and charges (P = .05). However, in adjusted GT analyses, increased institutional rate of admission to neurologists was not associated with briefer LOS (P = .36) and was associated with greater hospital charges (P = .044).
| Characteristic | Unadjusted Analysis | Adjusted ratio* | |||
|---|---|---|---|---|---|
| Neurologist | Generalist | P value | Ratio (95% CI) | P value | |
| |||||
| LOS (days), n = 25,094 | |||||
| Standard analysis | 6.6 | 8.0 | <.001 | 0.92 (0.880.96) | <.001 |
| Group‐treatment analysis | 7.2 | 7.1 | .80 | 1.06 (0.941.19) | .35 |
| Total Charges, n = 21,812 | |||||
| Standard analysis | $16,600 | $18,700 | .01 | 0.95 (0.911.00) | .05 |
| Group‐treatment analysis | $17,800 | $16,900 | <.001 | 1.26 (1.011.57) | .04 |
In 1999, 190 (2.2%) ischemic stroke patients received tPA at the 64 universities that had ever coded tPA use. In univariate analysis, patients admitted to a neurologist were more likely to have received tPA (P = .001; Table 3), and this association persisted after adjustment (P < .001). In adjusted GT analysis, institutions admitting a higher proportion of ischemic stroke patients to neurologists also treated patients with tPA more frequently (P = .033).
DISCUSSION
Several prior studies found that ischemic stroke outcomes were better when an attending neurologist was responsible for patient care.710 Traditional analyses of our data also indicate that care by a neurologist lowers inpatient mortality, LOS, and total charges. By contrast, a GT analysis that bypasses selection bias at the patient level suggests there is no independent benefit of neurologist care on mortality or LOS and actually shows higher associated charges.
The discrepancy between standard and GT analyses suggests that healthier patients may have been preferentially admitted to the care of neurologists. Measured pretreatment prognostic factors in our data present a mixed picture. Patients admitted to a neurologist's care were younger, more often male, more often emergently admitted, and less likely to have serious comorbid illnesses. These patient factors were controlled for in all adjusted analyses. Although traditional multivariate analysis attempts to adjust for variations between the 2 patient populations, it cannot adjust for inaccurately measured or unmeasured differences. Using the institutional proportion of admissions to neurologists as a predictor of patient outcomes, we were better able to control for the selection bias associated with differential distribution of patients to teams led by attending neurologists versus generalists.13, 14
Petty et al.7 studied 299 ischemic stroke patients and showed equivalent survival among stroke patients admitted to neurology inpatient teams versus generalist teams with neurologic consultation. However, patients cared for by generalist teams without neurologic consultation fared worse. Their subjects were treated at both academic and community hospitals. In our study, contributing hospitals were solely academic institutions. Because specialty cross talk may be more frequent at university‐based hospitals, academic‐based generalist physicians may be more familiar with recent stroke literature and guidelines than are their community‐based peers. Further, restricting analysis to academic centers in our study should have reduced the potential confounding influences of differences between other aspects of institutional care. Although no information was available on neurologist consultation in our database, informal consultation is believed to play a large but hidden role at academic medical centers. Thus, the inclusion of a formal consultation variable may be misleading at academic medical centers.
Analyzing claims data on 44,099 Medicare beneficiaries with acute ischemic strokes cared for at both academic and community hospitals, Smith et al.10 also recently reported a 10% lower risk of 30‐day mortality and 12% lower risk of rehospitalization for infections and aspiration pneumonitis among patients admitted to the care of neurologists compared with those admitted to the care of generalists. However, the upper 95% confidence interval limits for these 2 findings nearly crossed 1 (ranging from 0.9980.999). The study also concluded that patients cared for collaboratively by generalists and neurologists had a 16% lower 30‐day mortality risk (hazard ratio 0.84; 95% CI, 0.790.90) than those cared for by generalists alone but simultaneously noted that patients admitted to generalists only had more comorbidities than either the collaborative care or neurologist‐only patient groups. If sicker patients were triaged to generalist admission, as occurs in confounding by indication (also known as channeling bias), then incomplete adjustment for comorbid disease may bias outcomes in favor of neurologist involvement. The GT analysis we employed is specifically designed to overcome this exact type of selection bias.
In our study, patients admitted to neurologists received tPA significantly more often than those admitted to generalists. GT analysis also found that hospitals admitting a higher proportion of strokes to neurologists treated more patients with tPA. This result is consistent with a prior study demonstrating that academic institutions employing a vascular neurologist had significantly higher odds of administering tPA.21 Since tPA must be administered within 3 hours of symptom onset,27 it is commonly delivered in the emergency department prior to admission. Thus, patients may be preferentially selected for admission to neurologic services because of their receipt of tPA, rather than that this association reflects an actual increased use of tPA by neurologists over generalists. Alternatively, institutions with a higher rate of stroke admissions to neurology may simply be more familiar with tPA protocols. Importantly, the poor sensitivity of our data for actual tPA administration may affect the analysis of its use by physician specialty; however, the failure to administratively code tPA use is unlikely to be differentially biased based on physician specialty. Thus, undercoding of tPA use would be expected to bias these analyses toward the null.
The potential advantage and efficacy of stroke centers, stroke units, stroke services, and other institutional processes of care are not addressed by our data. Previously, among academic hospitals, we found that acute ischemic stroke mortality was lower at hospitals employing a vascular neurologist and at those whose guidelines allowed only neurologists to administer tPA.21 A later analysis evaluated the impact of all elements of stroke center care supported by the original Brain Attack Coalition consensus28 and found that no single element improved mortality.29 However, recent studies have found significant mortality benefit associated with stroke units30, 31 and stroke services.32 Clearly, the debate continues over these important questions.
Our study had several limitations. First, generalizability may be lessened because only academic medical centers contributed data and only admissions through the ED were included. However, limiting the study population to academic centers provided a homogenous study population and greatly reduced the potential for confounding at the institutional level. Although the selection of ED cases mitigated the effects of referral bias and the use of only academic hospitals minimized interinstitutional differences, institutions whose rate of admissions to neurology was above the 50th percentile differed from those whose rate admissions to neurology was below the 50th percentile. However, this difference did not consistently result in patients with worse pretreatment prognostic factors being cared for at hospitals with higher rates of admission to neurology. Second, there are important limitations to using administrative data. In our study, patients were selected based on diagnostic coding of records analysts at discharge, and the diagnostic accuracy of such coding for stroke is imperfect.33 Furthermore, missing or incomplete information could have impaired adjustments for patient differences. Third, details of patient treatment were limited. The lack of information about formal and informal consultations may have obscured a true difference in outcomes among specialties.7 Additionally, academic institutions may use systematized care plans more often than do community hospitals, potentially minimizing differences between specialties. Fourth, at the time of our study, tPA had been recently introduced into stroke care. Current rates of tPA use among neurologists and generalists may be more similar. Fifth, the ability of in‐hospital mortality to adequately assess quality of care is limited, and longer‐term and functional outcomes would be better measures and more clinically relevant.
After controlling for selection bias using GT analysis, we found stroke outcomes to be similar regardless of whether a neurologist or a generalist was the admitting physician. This result contrasts with the findings of several previous studies that suggested admitting stroke patients to a neurologist resulted in better clinical outcomes.710 Because only 1 neurologist is employed for approximately every 19.8 generalists in the United States34 and 40% of acute strokes were cared for by generalists, even in this sample entirely restricted to university hospitals, such findings would suggest that many U.S. stroke patients receive inferior care. Because the role of the neurologist as consultant rather than as attending physician is significantly more feasible in most practice settings, the demonstration of equivalent outcomes by both types of physicians is reassuring and certainly reinforces the important role that unmeasured confounders may play in observational studies.
However, these results do imply that it is vital that generalists remain fully trained in the current best practices of acute stroke management in order to maintain the equivalence of care suggested here. Given how common acute stroke is, any proposed future hospitalist training, certification, and recertification programs should include a focus on acute stroke management.
- ,,.Knowledge, patterns of care, and outcomes of care for generalists and specialists.J Gen Intern Med.1999;14:499–511.
- ,,,,.The generalist role of specialty physicians: is there a hidden system of primary care?JAMA.1998;279:1364–1370.
- .Primary care: specialists or generalists.Mayo Clin Proc.1996;71:415–419.
- ,,, et al.Consultation between cardiologists and generalists in the management of acute myocardial infarction: implications for quality of care.Arch Intern Med.1998;158:1778–1783.
- ,,, et al.Quality of care and outcomes of adults with asthma treated by specialists and generalists in managed care.Arch Intern Med.2001;161:2554–2560.
- ,,, et al.Nephrologist care and mortality in patients with chronic renal insufficiency.Arch Intern Med.2002;162:2002–2006.
- ,,,,,.Ischemic stroke: outcomes, patient mix, and practice variation for neurologists and generalists in a community.Neurology.1998;50:1699–1678.
- ,,.Where and how should elderly stroke patients be treated? A randomized trial.Stroke.1995;26:249–253.
- ,,,,,.What role do neurologists play in determining the costs and outcomes of stroke patients?Stroke.1996;27:1937–1943.
- ,,,.30‐Day survival and rehospitalization for stroke patients according to physician specialty.Cerebrovasc Dis.2006;22:21–26.
- .The need for randomization in the study of intended effects.Stat Med.1983;2:267–271.
- ,.Modern Epidemiology.Philadelphia, PA:Lippincott‐Raven;1998.
- ,,,.Modeling treatment effects on binary outcomes with grouped‐treatment variables and individual covariates.Am J Epidemiol.2002;156:753–760.
- ,,.Does more intensive treatment of acute myocardial infarction in the elderly reduce mortality? Analysis using instrumental variables.JAMA.1994;272:859–866.
- .The Cochrane Lecture. The best and the enemy of the good: randomised controlled trials, uncertainty, and assessing the role of patient choice in medical decision making.J Epidemiol Community Health.1994;48:6–15.
- ,.Uses of ecologic studies in the assessment of intended treatment effects.J Clin Epidemiol.1999;52:7–12.
- University HealthSystem Consortium. Available at: http://www.uhc.edu. Accessed April 11,2007.
- ,,,.Identification of incident stroke in Norway: hospital discharge data compared with a population‐based stroke register.Stroke.1999;30:56–60.
- .Accuracy of ICD‐9‐CM coding for the identification of patients with acute ischemic stroke: effect of modifier codes.Stroke.1998;29:1602–1604.
- ,,,.Accuracy of hospital discharge abstracts for identifying stroke.Stroke.1994;25:2348–2355.
- ,.Characteristics of academic medical centers and ischemic stroke outcomes.Stroke.2001;32:2137–2142.
- ,,, et al.Utilization of intravenous tissue‐type plasminogen activator for ischemic stroke at academic medical centers: the influence of ethnicity.Stroke.2001;32:1061–1068.
- .Biostatistics: a Foundation for Analysis in the Health Sciences.New York:John Wiley 1995.
- Sachs Group.Sachs Complications Profiler, version 1.0, User's Guide.Evanston, IL,1995.
- University HealthSystem Consortium Services Corporation.Clinical information management: risk adjustment of the UHC clinical database.Oak Brook, IL,1997.
- .Combining ecological and individual variables to reduce confounding by indication: case study—subarachnoid hemorrhage treatment.J Clin Epidemiol.2000;53:1236–1241.
- The National Institute of Neurological Disorders and Stroke rt‐PA Stroke Study Group.Tissue plasminogen activator for acute ischemic stroke.N Engl J Med.1995;333:1581–1588.
- ,,, et al.Recommendations for the establishment of primary stroke centers. Brain Attack Coalition.JAMA.2000;283:3102–3109.
- ,,, et al.Do the Brain Attack Coalition's criteria for stroke centers improve care for ischemic stroke?Neurology.2005;64:422–427.
- Organised inpatient (stroke unit) care for stroke.Cochrane Database Syst Rev2002:CD000197.
- ,,,,,.Stroke‐unit care for acute stroke patients: an observational follow‐up study.Lancet.2007;369:299–305.
- ,,,.Multispecialty stroke services in California hospitals are associated with reduced mortality.Neurology.2006;66:1527–32.
- ,,,,,.Inaccuracy of the International Classification of Diseases (ICD‐9‐CM) in identifying the diagnosis of ischemic cerebrovascular disease.Neurology.1997;49:660–664.
- .Physician characteristics and distribution in the US. 2006 ed. In: Department of Data Quality and Measurement, ed. Physician Characteristics and Distribution in the US. Washington, DC: American Medical Association,2006:312.
The appropriate role of specialists in hospital management of common medical conditions has been vigorously debated.13 Few argue that specialists serve an important role as consultants, but whether patients with specific conditions should be admitted to the care of specialists or generalists is unresolved. This is demonstrated by the large degree of hospital‐to‐hospital variability in the proportion of patients with myocardial infarction admitted to cardiologists,4 patients with asthma exacerbations admitted to pulmonologists,5 and patients with renal failure admitted to nephrologists.6
Stroke is another common diagnosis, with variable rates of admission to specialists and generalists. Several prior studies have suggested that outcomes after ischemic stroke are better if a neurologist is the attending physician.710 However, these observational studies could not rule out the possibility that differences in outcome were a result of prognosis at the time of admission rather than improvements in medical care. Although these studies have controlled for known prognostic variables, it is possible that unknown, unmeasured, or inadequately measured variables were different in the groups admitted to neurologists and the groups admitted to generalists. These differences, in turn, might account for outcome differences rather than specialist care.
This form of selection bias, a type of confounding by indication, is a constant threat to validity in observational studies. Randomized trials avoid it because the randomization process balances all prognostic variables, both known and unknown, in the treatment groups.11 Observational studies cannot guarantee the same balance of unmeasured risk factors.12 Multivariate modeling is meant to account for prognostic differences between groups in observational studies, but confounding by indication may remain if all the factors that determine prognosis are not accurately measured. We developed a method to avoid confounding by indication by evaluating individual outcome differences associated with practice variability.13 This technique, termed grouped‐treatment (GT) analysis, is related to the instrumental variable approach developed by economists and occasionally applied to health services research.14
In multivariate GT analyses, the institutional proportion of cases admitted to the care of a neurologist is used as a predictor of outcomes rather than whether an individual patient was admitted to neurology. For example, at a hospital where three‐fourths of acute stroke patients are admitted to neurology, all patients are treated as having a 75% chance of admission to neurology. Rather than denoting whether each patient's specialist attending was a neurologist or a generalist, the 0.75 probability of admission to neurology is used for analysis. If admission to an attending neurologist improves ischemic stroke care, then GT analysis should demonstrate that hospitals admitting higher proportions of stroke patients to neurologists have improved outcomes regardless of whether there is selection bias at the individual patient level. In this way, the method bypasses unmeasured confounders at the individual level in its estimates of treatment effects. The method is susceptible to confounding at the group level; that is, unmeasured prognostic differences in patients admitted to hospitals that rely more heavily on neurologists could bias the GT estimate of treatment effect. The GT estimates are accurate if it can be assumed that a hospital's rate of treatment is not associated (in an unmeasured way) with its patient population's intrinsic, pretreatment prognosis. However, practice variability is very common between hospitals and is generally poorly associated with systematic differences in prognosis of treated patients,15, 16 and in this setting GT provides an independent assessment of treatment effect that may either confirm or refute an association found at the individual level, where confounding is nearly always an important issue.
In this study, we evaluated the impact of admission to a neurologist or generalist on outcomes of ischemic stroke patients treated at academic medical centers throughout the United States. We also compared traditional analysis to GT analysis. In doing so, we demonstrate the influence of unmeasured confounders on observational assessments of specialist care and may provide a more accurate measure of the impact of care by a neurologist on outcomes after ischemic stroke.
MATERIALS AND METHODS
We used the University HealthSystem Consortium (UHC) administrative database, which contained patient information from 84 large academic health centers and their 39 associate hospitals, with more than 2.1 million discharges each year.17 We obtained UHC discharge abstracts for all ischemic stroke patients admitted through emergency departments from 1997 through 1999. Discharge abstracts included patient demographics, urgency status (emergent, urgent, elective), illness severity class, admitting and discharge specialties, discharge diagnoses, procedure codes, in‐hospital mortality, length of stay, and total hospital charges. Patients were identified using International Classification of Diseases, Ninth Revision (ICD‐9) codes that were previously recognized as specific indicators of acute ischemic stroke (ICD‐9 433.01, 433.11, 433.21, 433.31, 433.81, 433.91, 434.01, 434.11, 434.91, 436).1820 We limited the cohort to emergency department admissions in order to reduce the likelihood of referral bias.
Variables in the discharge database were validated by comparison with a detailed medical record review. Between June and December 1999, 42 institutions participating in a quality improvement project identified 30 consecutive ischemic stroke cases. Trained analysts or clinicians abstracted information on demographics, medical history, and treatment. Kappa statistics have been previously reported for all individual characteristics except hospital charges, for which medical record review data were not available.21 Demographic and clinical variables in the administrative database tended to agree well with medical record review, with agreement ranging from 85% to 100% (kappa 0.581.00). Because the admitting attending likely directed acute stroke management, this was used to define a patient's attending physician specialty in all analyses. Administrative coding of tissue plasminogen activator (tPA) use was imperfect, with a sensitivity of 50% but a specificity of 100%.22
Institutional rate of admission to neurologists versus generalists was calculated as the percentage over the entire study duration. Unadjusted logistic regression was used to compare the distribution of patient pretreatment prognostic factors between institutions above and below the 50th percentile to determine a rate of admission to neurology because generalized estimating equations that could account for clustering were unable to support these models as a result of diverging estimates. We calculated the yearly volume of ischemic strokes treated at an institution from discharge abstracts, including admissions from all sources, because all treated cases would be expected to increase physician experience.
In‐hospital mortality was chosen as the primary outcome because of its frequency, importance, and coding reliability. Univariate predictors of in‐hospital mortality were identified using Pearson's chi‐square and the Wilcoxon rank sum tests.23 Length of stay (LOS), total hospital charges, and receipt of tPA were secondary outcomes. LOS and total hospital charges were compared using the Wilcoxon rank sum test. LOS and total charge calculations included only those patients surviving to discharge so that early mortality would not be confused with more efficient care. Similarly, we compared demographics and clinical variables of patients admitted to the care of neurologists with those of patients admitted to the care of generalists. To evaluate variability between institutions, we determined the proportion of patients with specific characteristics and outcomes at each institution and report median values and the 10th‐ to 90th‐percentile range among the institutions. The correlation between institutional rate of admission and institutional rate of mortality was evaluated.
In standard multivariate analysis, we assessed physician specialty as a predictor of in‐hospital mortality of individual patients after adjustment for demographic characteristics, admission status (emergent, urgent, elective), comorbid illness severity score (range 04, from 0 = no substantial comorbid illness to 4 = catastrophic comorbid illness), and annual institutional treatment volume of ischemic stroke. UHC defined severity class to represent an individual's overall calculated risk of illness; its value was dependent on the refinement of the Health Care Facility Administration's diagnosis‐related groups (DRGs) and the Sach's Complication Profiler count of total comorbidities present.24, 25 Effects on LOS and total charges, as well as the ability of physician specialty to predict tPA use in individual patients, were similarly evaluated. Analysis of tPA use was restricted to patients admitted to universities that ever coded tPA use, which increased the sensitivity of the indicator to 57%.22 Residual misclassification error of tPA use would be expected to obscure a true underlying association between its use and physician specialty.
In multivariate GT calculations, we used the institutional proportion of cases admitted to a neurologist as a predictor of outcomes. GT analysis is based on the observation that if a treatment is effective, hospitals that use it more frequently should have better patient outcomes and that this association should persist regardless of whether individual‐level selection bias is present. The method assumes that hospital rates of admission to neurology are independent on the patient population's pretreatment prognosis. Because utilization differences between hospitals likely reflect practice variability rather than differences in patient prognosis,15, 16 the influence of unmeasured confounders at the hospital level is expected to be small. Measured variables that proved significant in univariate analyses or were thought to be responsible for an association between overall patient prognosis and modalities and frequencies of acute stroke treatments used, such as institutional treatment volume, were included in the multivariate GT model in order to isolate the effect of increasing rates of admission to neurologists.
We included both institutional and individual data to more accurately specify individual outcomes and covariates compared with an analysis that simply compared institutions' characteristics and their outcomes.26 Generalized estimating equations (GEE) were used in order to account for institutional clustering of predictor variables and outcomes. GEE is similar to logistic regression but produces broader confidence intervals (CIs) because logistic regression ignores the possibility that individuals at institutions are more similar to each other than would be expected by chance alone. We used a compound symmetry correlation structure, which initiates modeling by assuming a constant correlation between observations within each institution as well as between institutions, and used a logistic link function for binary outcomes in order to mimic logistic regression. The natural log transformations of LOS and hospital charges were modeled to reduce positive skew and approximate a normal distribution, and an identity link function was used in GEE to mimic linear regression for these analyses. To evaluate the impact of adjustment, both unadjusted and adjusted analyses were conducted. Methods to calculate power of GT analysis are not available. The Stata statistical package was used for all analyses (version 8.0; Stata Corporation, College Station, TX).
RESULTS
A total of 26,925 patients with ischemic strokes were admitted to neurologists or generalists through the emergency department at 113 institutions participating in the study. Patients admitted to neurologists rather than generalists (Table 1) were younger and more likely to be male, but less likely to have a serious comorbid illness. Institutions varied widely in the demographics of treated patients as well as in the markers of pretreatment prognosis. Institutional annual case volume of all ischemic strokes ranged from 1 to 741. Mortality rate, mean LOS, and mean hospital charges also varied broadly between institutions (Table 1). Patients treated at institutions whose rate of admissions to a neurologist's care was in the upper 50th percentile were younger and more often male, but did not differ in illness severity class (Table 2).
| Characteristic | Neurologist (n = 16,287) | Generalist (n = 10,638) | Institutional (n = 113) median (10th90th percentiles) |
|---|---|---|---|
| |||
| Age (years), mean (SD) | 66.2 (14.7) | 69.3 (15.2) | 67.7 (62.174.8) |
| Female, n (%) | 8291 (51) | 5904 (56) | 54% (46%67%) |
| Ethnicity | |||
| African American, n (%) | 4516 (28) | 3335 (31) | 19% (0%71%) |
| Asian American, n (%) | 570 (4) | 201 (2) | 0.7% (0%8%) |
| Hispanic, n (%) | 906 (6) | 458 (4) | 0.7% (0%16%) |
| Native American, Eskimo, n (%) | 48 (0) | 21 (0) | 0% (0%1%) |
| White, n (%) | 9012 (55) | 5851 (55) | 65% (10%95%) |
| Other ethnicity, n (%) | 398 (2) | 157 (1) | 0.3% (0%4%) |
| Unknown, n (%) | 837 (5) | 615 (6) | 0.1% (0%9%) |
| Comorbid illness severity score,* median (interquartile range) | 1 (01) | 1 (01) | 0.83 (0.650.95) |
| Treatment and outcome | |||
| tPA administered, n (%) | 132 (3) | 51 (2) | 1.9% (0.6%6.5%) |
| In‐hospital deaths, n (%) | 755 (5) | 1005 (9) | 6.1% (3%10%) |
| Discharges to home, n (%) | 9504 (59) | 5235 (49) | 52% (38%72%) |
| Length of stay (days), mean (SD) | 6.6 (7.2) | 7.9 (9.9) | 6.6 (4.210.0) |
| Total charges | $16,600 ($20,500) | $18,700 ($26,300) | $15,000 ($9000$30,000) |
| Characteristic | <50th percentile | >50th percentile | P value |
|---|---|---|---|
| |||
| Age (years), mean (SD) | 66.7 (15.2) | 69.4 (14.3) | <.001 |
| Female, n (%) | 5288 (54) | 8907 (52) | .001 |
| Comorbid illness severity score*, median (interquartile range) | 1 (01) | 1 (01) | .87 |
There were 1760 in‐hospital deaths (7.0%). In univariate analysis, older age (P < .001), white ethnicity (P < .001), emergent stroke (P < .001), and increased illness severity (P < .001) were associated with greater risk of death, whereas African‐American (P < .001) and Hispanic (P = .007) ethnicities were protective. No other patient characteristics were important, and institutional annual case volume showed no association with mortality risk.
Overall, 60% of patients with ischemic stroke were admitted to a neurologist's care. In univariate analysis (Table 3), a lower risk of in‐hospital mortality was observed in cases admitted to neurologists (4.6%) compared with those admitted to generalists (9.5%; P < .001). After adjustment in standard multivariable models, the association between neurologist admission and lower risk of death persisted (OR 0.60; 95% CI, 0.500.72; P < .001).
| Characteristics | Unadjusted | Adjusted | ||
|---|---|---|---|---|
| Odds ratio (95% CI) | P value | Odds ratio (95% CI) | P value | |
| ||||
| Mortality | ||||
| Attending neurologist | 0.32 (0.260.39) | <.001 | 0.60 (0.500.72) | <.001 |
| Proportion of admissions to neurology | 1.05 (0.851.31) | .64 | 1.02 (0.791.30) | .90 |
| tPA Use | ||||
| Attending neurologist | 1.87 (1.302.69) | .001 | 2.56 (1.723.78) | <.001 |
| Proportion of admissions to neurology | 2.32 (0.985.49) | .06 | 2.47 (1.085.65) | .03 |
The institutional rate of admission of ischemic stroke patients to neurologists ranged from 0% to 90%, and higher rates were seen at hospitals with higher institutional case volumes (P < .001). There was no correlation between the institutional rate of admission to neurology and the institutional mortality rate (0.33; P = .73). At the individual‐level, greater rates of admission to neurologists had no significant impact on mortality (OR 1.05; 95% CI, 0.851.31; P = .64; Table 3) in unadjusted analysis. After adjustment for patient demographics, comorbid illness severity score, urgency status, and institutional case volume in GT analysis, there remained no association between death and proportion of ischemic stroke cases admitted to neurologists (OR 1.02; 95% CI, 0.791.30; P = .90), consistent with the absence of an association between neurologist care and in‐hospital mortality.
Patients treated by neurologists were likely to have shorter stays (P < .001) and lower charges (P = .01) in univariate analysis (Table 4). In traditional adjusted multivariable analysis, the same associations were seen for LOS (P < .001) and charges (P = .05). However, in adjusted GT analyses, increased institutional rate of admission to neurologists was not associated with briefer LOS (P = .36) and was associated with greater hospital charges (P = .044).
| Characteristic | Unadjusted Analysis | Adjusted ratio* | |||
|---|---|---|---|---|---|
| Neurologist | Generalist | P value | Ratio (95% CI) | P value | |
| |||||
| LOS (days), n = 25,094 | |||||
| Standard analysis | 6.6 | 8.0 | <.001 | 0.92 (0.880.96) | <.001 |
| Group‐treatment analysis | 7.2 | 7.1 | .80 | 1.06 (0.941.19) | .35 |
| Total Charges, n = 21,812 | |||||
| Standard analysis | $16,600 | $18,700 | .01 | 0.95 (0.911.00) | .05 |
| Group‐treatment analysis | $17,800 | $16,900 | <.001 | 1.26 (1.011.57) | .04 |
In 1999, 190 (2.2%) ischemic stroke patients received tPA at the 64 universities that had ever coded tPA use. In univariate analysis, patients admitted to a neurologist were more likely to have received tPA (P = .001; Table 3), and this association persisted after adjustment (P < .001). In adjusted GT analysis, institutions admitting a higher proportion of ischemic stroke patients to neurologists also treated patients with tPA more frequently (P = .033).
DISCUSSION
Several prior studies found that ischemic stroke outcomes were better when an attending neurologist was responsible for patient care.710 Traditional analyses of our data also indicate that care by a neurologist lowers inpatient mortality, LOS, and total charges. By contrast, a GT analysis that bypasses selection bias at the patient level suggests there is no independent benefit of neurologist care on mortality or LOS and actually shows higher associated charges.
The discrepancy between standard and GT analyses suggests that healthier patients may have been preferentially admitted to the care of neurologists. Measured pretreatment prognostic factors in our data present a mixed picture. Patients admitted to a neurologist's care were younger, more often male, more often emergently admitted, and less likely to have serious comorbid illnesses. These patient factors were controlled for in all adjusted analyses. Although traditional multivariate analysis attempts to adjust for variations between the 2 patient populations, it cannot adjust for inaccurately measured or unmeasured differences. Using the institutional proportion of admissions to neurologists as a predictor of patient outcomes, we were better able to control for the selection bias associated with differential distribution of patients to teams led by attending neurologists versus generalists.13, 14
Petty et al.7 studied 299 ischemic stroke patients and showed equivalent survival among stroke patients admitted to neurology inpatient teams versus generalist teams with neurologic consultation. However, patients cared for by generalist teams without neurologic consultation fared worse. Their subjects were treated at both academic and community hospitals. In our study, contributing hospitals were solely academic institutions. Because specialty cross talk may be more frequent at university‐based hospitals, academic‐based generalist physicians may be more familiar with recent stroke literature and guidelines than are their community‐based peers. Further, restricting analysis to academic centers in our study should have reduced the potential confounding influences of differences between other aspects of institutional care. Although no information was available on neurologist consultation in our database, informal consultation is believed to play a large but hidden role at academic medical centers. Thus, the inclusion of a formal consultation variable may be misleading at academic medical centers.
Analyzing claims data on 44,099 Medicare beneficiaries with acute ischemic strokes cared for at both academic and community hospitals, Smith et al.10 also recently reported a 10% lower risk of 30‐day mortality and 12% lower risk of rehospitalization for infections and aspiration pneumonitis among patients admitted to the care of neurologists compared with those admitted to the care of generalists. However, the upper 95% confidence interval limits for these 2 findings nearly crossed 1 (ranging from 0.9980.999). The study also concluded that patients cared for collaboratively by generalists and neurologists had a 16% lower 30‐day mortality risk (hazard ratio 0.84; 95% CI, 0.790.90) than those cared for by generalists alone but simultaneously noted that patients admitted to generalists only had more comorbidities than either the collaborative care or neurologist‐only patient groups. If sicker patients were triaged to generalist admission, as occurs in confounding by indication (also known as channeling bias), then incomplete adjustment for comorbid disease may bias outcomes in favor of neurologist involvement. The GT analysis we employed is specifically designed to overcome this exact type of selection bias.
In our study, patients admitted to neurologists received tPA significantly more often than those admitted to generalists. GT analysis also found that hospitals admitting a higher proportion of strokes to neurologists treated more patients with tPA. This result is consistent with a prior study demonstrating that academic institutions employing a vascular neurologist had significantly higher odds of administering tPA.21 Since tPA must be administered within 3 hours of symptom onset,27 it is commonly delivered in the emergency department prior to admission. Thus, patients may be preferentially selected for admission to neurologic services because of their receipt of tPA, rather than that this association reflects an actual increased use of tPA by neurologists over generalists. Alternatively, institutions with a higher rate of stroke admissions to neurology may simply be more familiar with tPA protocols. Importantly, the poor sensitivity of our data for actual tPA administration may affect the analysis of its use by physician specialty; however, the failure to administratively code tPA use is unlikely to be differentially biased based on physician specialty. Thus, undercoding of tPA use would be expected to bias these analyses toward the null.
The potential advantage and efficacy of stroke centers, stroke units, stroke services, and other institutional processes of care are not addressed by our data. Previously, among academic hospitals, we found that acute ischemic stroke mortality was lower at hospitals employing a vascular neurologist and at those whose guidelines allowed only neurologists to administer tPA.21 A later analysis evaluated the impact of all elements of stroke center care supported by the original Brain Attack Coalition consensus28 and found that no single element improved mortality.29 However, recent studies have found significant mortality benefit associated with stroke units30, 31 and stroke services.32 Clearly, the debate continues over these important questions.
Our study had several limitations. First, generalizability may be lessened because only academic medical centers contributed data and only admissions through the ED were included. However, limiting the study population to academic centers provided a homogenous study population and greatly reduced the potential for confounding at the institutional level. Although the selection of ED cases mitigated the effects of referral bias and the use of only academic hospitals minimized interinstitutional differences, institutions whose rate of admissions to neurology was above the 50th percentile differed from those whose rate admissions to neurology was below the 50th percentile. However, this difference did not consistently result in patients with worse pretreatment prognostic factors being cared for at hospitals with higher rates of admission to neurology. Second, there are important limitations to using administrative data. In our study, patients were selected based on diagnostic coding of records analysts at discharge, and the diagnostic accuracy of such coding for stroke is imperfect.33 Furthermore, missing or incomplete information could have impaired adjustments for patient differences. Third, details of patient treatment were limited. The lack of information about formal and informal consultations may have obscured a true difference in outcomes among specialties.7 Additionally, academic institutions may use systematized care plans more often than do community hospitals, potentially minimizing differences between specialties. Fourth, at the time of our study, tPA had been recently introduced into stroke care. Current rates of tPA use among neurologists and generalists may be more similar. Fifth, the ability of in‐hospital mortality to adequately assess quality of care is limited, and longer‐term and functional outcomes would be better measures and more clinically relevant.
After controlling for selection bias using GT analysis, we found stroke outcomes to be similar regardless of whether a neurologist or a generalist was the admitting physician. This result contrasts with the findings of several previous studies that suggested admitting stroke patients to a neurologist resulted in better clinical outcomes.710 Because only 1 neurologist is employed for approximately every 19.8 generalists in the United States34 and 40% of acute strokes were cared for by generalists, even in this sample entirely restricted to university hospitals, such findings would suggest that many U.S. stroke patients receive inferior care. Because the role of the neurologist as consultant rather than as attending physician is significantly more feasible in most practice settings, the demonstration of equivalent outcomes by both types of physicians is reassuring and certainly reinforces the important role that unmeasured confounders may play in observational studies.
However, these results do imply that it is vital that generalists remain fully trained in the current best practices of acute stroke management in order to maintain the equivalence of care suggested here. Given how common acute stroke is, any proposed future hospitalist training, certification, and recertification programs should include a focus on acute stroke management.
- ,,.Knowledge, patterns of care, and outcomes of care for generalists and specialists.J Gen Intern Med.1999;14:499–511.
- ,,,,.The generalist role of specialty physicians: is there a hidden system of primary care?JAMA.1998;279:1364–1370.
- .Primary care: specialists or generalists.Mayo Clin Proc.1996;71:415–419.
- ,,, et al.Consultation between cardiologists and generalists in the management of acute myocardial infarction: implications for quality of care.Arch Intern Med.1998;158:1778–1783.
- ,,, et al.Quality of care and outcomes of adults with asthma treated by specialists and generalists in managed care.Arch Intern Med.2001;161:2554–2560.
- ,,, et al.Nephrologist care and mortality in patients with chronic renal insufficiency.Arch Intern Med.2002;162:2002–2006.
- ,,,,,.Ischemic stroke: outcomes, patient mix, and practice variation for neurologists and generalists in a community.Neurology.1998;50:1699–1678.
- ,,.Where and how should elderly stroke patients be treated? A randomized trial.Stroke.1995;26:249–253.
- ,,,,,.What role do neurologists play in determining the costs and outcomes of stroke patients?Stroke.1996;27:1937–1943.
- ,,,.30‐Day survival and rehospitalization for stroke patients according to physician specialty.Cerebrovasc Dis.2006;22:21–26.
- .The need for randomization in the study of intended effects.Stat Med.1983;2:267–271.
- ,.Modern Epidemiology.Philadelphia, PA:Lippincott‐Raven;1998.
- ,,,.Modeling treatment effects on binary outcomes with grouped‐treatment variables and individual covariates.Am J Epidemiol.2002;156:753–760.
- ,,.Does more intensive treatment of acute myocardial infarction in the elderly reduce mortality? Analysis using instrumental variables.JAMA.1994;272:859–866.
- .The Cochrane Lecture. The best and the enemy of the good: randomised controlled trials, uncertainty, and assessing the role of patient choice in medical decision making.J Epidemiol Community Health.1994;48:6–15.
- ,.Uses of ecologic studies in the assessment of intended treatment effects.J Clin Epidemiol.1999;52:7–12.
- University HealthSystem Consortium. Available at: http://www.uhc.edu. Accessed April 11,2007.
- ,,,.Identification of incident stroke in Norway: hospital discharge data compared with a population‐based stroke register.Stroke.1999;30:56–60.
- .Accuracy of ICD‐9‐CM coding for the identification of patients with acute ischemic stroke: effect of modifier codes.Stroke.1998;29:1602–1604.
- ,,,.Accuracy of hospital discharge abstracts for identifying stroke.Stroke.1994;25:2348–2355.
- ,.Characteristics of academic medical centers and ischemic stroke outcomes.Stroke.2001;32:2137–2142.
- ,,, et al.Utilization of intravenous tissue‐type plasminogen activator for ischemic stroke at academic medical centers: the influence of ethnicity.Stroke.2001;32:1061–1068.
- .Biostatistics: a Foundation for Analysis in the Health Sciences.New York:John Wiley 1995.
- Sachs Group.Sachs Complications Profiler, version 1.0, User's Guide.Evanston, IL,1995.
- University HealthSystem Consortium Services Corporation.Clinical information management: risk adjustment of the UHC clinical database.Oak Brook, IL,1997.
- .Combining ecological and individual variables to reduce confounding by indication: case study—subarachnoid hemorrhage treatment.J Clin Epidemiol.2000;53:1236–1241.
- The National Institute of Neurological Disorders and Stroke rt‐PA Stroke Study Group.Tissue plasminogen activator for acute ischemic stroke.N Engl J Med.1995;333:1581–1588.
- ,,, et al.Recommendations for the establishment of primary stroke centers. Brain Attack Coalition.JAMA.2000;283:3102–3109.
- ,,, et al.Do the Brain Attack Coalition's criteria for stroke centers improve care for ischemic stroke?Neurology.2005;64:422–427.
- Organised inpatient (stroke unit) care for stroke.Cochrane Database Syst Rev2002:CD000197.
- ,,,,,.Stroke‐unit care for acute stroke patients: an observational follow‐up study.Lancet.2007;369:299–305.
- ,,,.Multispecialty stroke services in California hospitals are associated with reduced mortality.Neurology.2006;66:1527–32.
- ,,,,,.Inaccuracy of the International Classification of Diseases (ICD‐9‐CM) in identifying the diagnosis of ischemic cerebrovascular disease.Neurology.1997;49:660–664.
- .Physician characteristics and distribution in the US. 2006 ed. In: Department of Data Quality and Measurement, ed. Physician Characteristics and Distribution in the US. Washington, DC: American Medical Association,2006:312.
Copyright © 2008 Society of Hospital Medicine
Non–Housestaff Medicine Services in Academic Centers
Many academic medical centers (AMCs) have developed nonhousestaff services to provide clinical care once provided by physicians‐in‐training. These services, often staffed by hospitalists and/or midlevel providers, have experienced tremendous growth in the past few years, yet very little exists in the literature about their development, structure, efficacy, or impact on hospitals, patients, and hospital medicine programs. The primary forces driving this growth include Accreditation Council for Graduate Medical Education (ACGME) resident duty hour restrictions,1 growth of the hospitalist movement,2 and the emphasis on simultaneously improving financial performance and quality of care in AMCs.3
Resident Duty Hour Restrictions
In 2003, the ACGME mandated restrictions on resident work hours, limiting trainees to 80 hours per week.1 Many training programs struggled with how to provide important clinical services while complying with the new restrictionscreating numerous models that bridged care between different shifts of residents.45 Implementation of day floats (a dedicated resident who rounds with the postcall team), night floats (a dedicated overnight resident who admits and cross‐covers patients), or some variation of both was common.6 No guidelines accompanied the ACGME mandate, leaving institutions to independently structure their programs without a known best practice.
Subsequent literature carefully addressed how the duty hour restrictions affect residents' lives and education but failed to discuss models for providing care.711 Training programs began to institute necessary changes but in doing so, created greater patient discontinuity and increased handoffs between residents, elevating the potential for adverse patient outcomes.12 Recent large‐scale studies indicate that inpatient care is the same or improved since adoption of the duty hour restrictions,1316 but controversy continues, with several editorials debating the issue.1719
Because increasing the volume of patients on housestaff services was not a viable option,20 many AMCs created nonhousestaff services and hired midlevel providers (nurse practitioners and physician assistants) to offset resident workloads and comply with the new restrictions. However, this strategy represented a very expensive alternative.21 Moreover, the current 80‐hour work limits may be revised downward, particularly given the lower restrictions in other countries,22 and this will further drive the demand for nonhousestaff services. Hospitalists, with their documented impact on efficiency and return on investment,23 represent a solution to fill these needs and have quickly become the predominant approach at AMCs.
The Hospitalist Movement
Since the term hospitalist was first coined in 1996,24 the remarkable growth of the number of practicing hospitalists emphasizes how first community hospitals and now AMCs have embraced this approach.25 With more than 20,000 nationwide and projections that the field will grow to 30,000 by 2010,26 hospitalists are becoming the primary providers for in‐patients.2 This growth was further catalyzed when widely expressed concerns about safety and quality became public,2728 and hospitalists incorporated patient safety and quality improvement activities into their efforts.3 The confluence of these factors also prompted emergence of hospital medicine programs at AMCs, a growth that came with anticipated dangers.29 Reflecting the recognition that hospital medicine is becoming a separate specialty30 and is integral to the functioning of an AMC, institutions now operate dedicated divisions of hospital medicine.
AMCs and Hospital Performance
AMCs operate 3 related enterprises: a medical school that trains future physicians, a research arena that promotes basic and clinical investigation, and health care services that often encompass both hospitals and clinics. The financial viability of AMCs has always been a topic of debate, largely because of the different missions they pursue and the financial means by which they survive.3133 Over the past decade, cuts in Medicare reimbursement, challenges in balancing bed availability with occupancy rates, and a growing emphasis on cost reduction have created a more competitive health care environment, but without the predicted demise of AMCs.34 Because education and research generally fail to bolster the bottom line, AMCs have focused on optimizing clinical services to promote financial viability.
Hospitalists are uniquely positioned to help this bottom line, just as they do at community hospitals. Their involvement in patient care may produce reductions in length of stay, greater efficiency in discharge planning, and significant cost savings.3537 Hospitalists may also improve throughput in emergency departments and decrease wait times, leading to more efficient bed utilization.38 This leads to a potential for greater hospital revenue by increasing both the number of admissions, particularly surgical cases, and staffed inpatient beds, the latter a premium, as AMCs continue to expand their bed capacity almost annually. Finally, hospitalists may serve as change agents in improving the quality and safety of care delivered, an increasingly important metric given the desire for and expansion of publicly reported measures.
From a financial standpoint, Medicare support to AMCs for training residents now subsidizes fewer clinical care hours. Hospitalist‐driven nonhousestaff services will continue to fulfill a need created by this marked change in residency training. The tension of who pays for nonhousestaff servicesincreased federal support, financial backing from AMCs, or academic department fundsposes an ongoing struggle. In fact, this may be the most important issue currently debated among hospital administrators and department chairs. Regardless, AMCs continue to view hospitalists as a mechanism (or even solution) to maintaining their financial bottom line through improving care delivery systems, adhering to resident work hour restrictions, leading quality and safety improvement initiatives, and improving clinical patient outcomes.
MODELS FOR NONHOUSESTAFF MEDICAL SERVICES
For AMCs developing nonhousestaff services, the process begins by addressing a series of important questions (Table 1). How these questions are answered is often driven by local factors such as the vision of local leadership and the availability of important resources. Nonetheless, it is important for hospitals to share their experiences because best practices remain unclear. Table 2 provides a tabular snapshot of nonhousestaff medicine services at 5 AMCs to highlight similarities and differences. Data in the table were compiled by having a representative from each AMC report the different attributes, which reflects each program as of July 2007. Table 2 provides no data on the quality or efficiency of housestaff versus nonhousestaff services, though this type of investigation is underway and will be critical in future planning.3940
| Questions | Potential options |
|---|---|
| Who will provide care on nonhousestaff services? | Physicians seeking a 1‐year position |
| Physicians committed to a purely clinical career | |
| Physicians committed to an academic career in hospital medicine | |
| Will hospitalists share nonhousestaff service time, or will there be dedicated nonhousestaff hospitalists? | Hybrid positions |
| Dedicated nonhousestaff hospitalists | |
| Use of PGY‐4s1‐year positions (often individuals planning a fellowship) | |
| How should staffing be organized? | Hospitalist‐only services |
| Use of midlevel providers | |
| Will there be 24‐7 coverage, and if so, how will nights be staffed? | Dedicated nocturnists |
| Shared among daytime hospitalists | |
| Midlevel providers | |
| Moonlighters (fellows or residents) | |
| What type of schedule will provide blocks of clinical time to ensure continuity of care but also ensure adequate nonclinical time to prevent physician burnout and turnover? | 7 on/7 off sequences |
| 45 day sequences | |
| Longer shifts with fewer shifts per month | |
| Shorter shifts with more shifts per month | |
| Where will patients on a nonhousestaff service receive care? | Geographically designed serviced |
| ○ Different floor | |
| ○ Different hospital | |
| Mixed among housestaff service | |
| What patient population will be cared for on the nonhousestaff service? | Same as on housestaff service |
| Based on bed availability if nonhousestaff service is geographic (a unit) | |
| Based on triage guidelines (lower acuity, observation patients, specific diagnoses) | |
| What volume of patients will be cared for on the nonhousestaff service? | Fixed census cap based on staffing |
| Flexible census depending on activity of housestaff service (above their cap) | |
| Will compensation for providing nonhousestaff services differ from that on housestaff services? | Higher base salary |
| Incentives tied to nonhousestaff time | |
| Different incentive structures |
| Attributes | BWH | Emory | University of Michigan | Northwestern | UCSF |
|---|---|---|---|---|---|
| Description of staffing model | Mon.‐Sun.: 1 daytime Hospitalist | Mon.‐Sun.: 4 daytime hospitalists, 2 swing shift admitters | Weekdays: 7 daytime hospitalists, 1 swing shift hospitalist | Mon.‐Sun.: 8 daytime hospitalists, 1 triage hospitalist | Weekdays: 2 daytime hospitalists, 1 swing shift hospitalist |
| Nights: 1 MD | Nights: 1 MDs | Weekends: 7 daytime hospitalists | Nights: 2 MDs | Weekends: 2 daytime hospitalists | |
| Nights: 2 MDs | Nights: 1 MD | ||||
| Location of service | In same university hospital | In same university hospital | In same university hospital | In same university hospital | Physically separate hospital affiliate (UCSF Medical Center at Mount Zion) |
| Nonhousestaff FTEs/total hospitalist group | 3/15 | 10/14 | 20/30 | 25/34 | 6/36 |
| What hospitalists provide care on nonhous estaff services? | Core of 3 hospitalists (also do month on housestaff service) | Hospitalist group shares nonhousestaff services | Core of 14 FTEs dedicated to nonhousestaff services | Hospitalist group shares nonhousestaff services | Core of 6 Mount Zionbased hospitalists (also spend 23 months on housestaff service at university hospital) |
| Other 6 FTEs consist of 10 faculty with mixed roles | |||||
| Age of service | 2 years | 4 years | 3 years | 5 years | 3 years |
| How patients get assigned to non‐housestaff service? | 1. Only ED admissions with no transfers from ICU or other services | Assigned by rotation | 1. Alternating admissions with housestaff services during afternoon | 1. Alternating admissions with housestaff services during day | 1. Lower‐acuity admissions from ED |
| 2. Admit whenever bed open on service (geographic) | 2. Observation cases triaged directly to service | 2. Lower‐acuity patients and direct admissions | 2. Lower‐acuity admissions from clinics | ||
| 3. Once housestaff cap, all subsequent admits until midnight to nonhousestaff service | 3. Nonhousestaff service admits all patients once resident caps reached | 3. Transfers from housestaff service no longer requiring tertiary services (or with complex discharge planning) | |||
| Average daily census of nonhousestaff service | 12 | 56 | 70 (75 cap) | 8595 | 2026 |
| Number of shifts per month/shift duration | 15/1012 hours | 15/12 hours | 1517 (depending on number of nights covered)/812 hours (swing = 8 hours, day = 1012 hours, night = 12 hours) | 20/1012 hours | 1617/1012 hours |
| Shift sequences | 710 days consecutive | Variable | 67 days consecutive followed by 1 night for those who cover nights | 7 days consecutive | 4‐ to 6‐day variable sequences |
| Total clinical days worked/year | 168 | 182.5 | 185202 (depending on number of nights covered) | 212 | 196 |
| Weekend clinical time | 50% of weekends | 50% of weekends | 50% of weekends | 50% of weekends | 50% of weekends |
| Night coverage/by whom? | Yes/exclusively moonlighters | Yes/shared (50% covered by 1 dedicated nocturnist) | Yes/66% of nights staffed by dedicated nocturnists with remainder shared | Yes/exclusively by six 1‐year nocturnists | Yes/exclusively by moonlighters |
| Presence of midlevel providers | Yes 6 FTE PAs Mon.‐Sun. | No | Yes 8 FTE PAs weekdays | No | No |
| Presence of dedicated case manager | Yes | Yes | Yes | No | Yes |
| Presence of medical students for patient care | No | No | Yes, 4th‐year subinterns or students on elective rotation | No | No |
| Compensation model | Salary + weekend bonus beyond 10 | Salary + incentive | Base + shift‐based incentive + quality incentive | Salary + incentive | Salary |
| Pay differential compared to housestaff service compensation | 10% Higher because of weekend bonus | None | About 20% higher base compensation; loan forgiveness program tied to nonhousestaff time | None | About 20% higher compensation |
| Hospital financial support | Yes | Yes | Yes | Yes | Yes |
Table 2 does illustrate several important considerations in structuring nonhousestaff services. For example, if a nonhousestaff service operates at a different physical location, careful triage of patients is necessary. Resources, including the availability of subspecialty and surgical consultants, may differ, and thus patient complexity and acuity may dictate whether a patient gets admitted to the nonhousestaff service. These triage factors were a major challenge in the design of UCSF's nonhousestaff service. The other nonhousestaff services handle overflow admissions after the housestaff service reaches a census or admission cap; transfers between services rarely occur, and resources are similar.
Other observations include that hospitalists work a similar number of hours each year and cover 50% of weekends but with differing shift lengths and sequences. Each service also provides night coverage but only Emory, the University of Michigan, and Northwestern utilize dedicated nocturnists. The University of Michigan and Brigham & Women's Hospital are the only sites that employ midlevel providers who work closely with hospitalists. In terms of group structure, Northwestern's hospitalists are the most integrated, with each hospitalist sharing equal responsibility for nonhousestaff coverage. In contrast, the other programs use selected hospitalists or a dedicated core of hospitalists to provide nonhousestaff services. Compensation models also vary, with certain groups salaried and others having incentive systems, although all receive hospital‐based funding support. Hospital‐based funding support ranges from 40% to 100% of total program costs across sites, creating similar variance in a given program's deficit risk. Finally, most programs do compensate nonhousestaff services at higher rates.
All the decisions captured in Table 2 have implications for costs, recruitment, and service structure. Furthermore, the striking variations demonstrate how different academic hospitalist positions can occur both within a hospital medicine group and across institutions. Of note, Table 2 only characterizes nonhousestaff medicine services, not the growing number of comanagement (eg, orthopedics, neurosurgery, or hematology/oncology) and other clinical services (eg, observation unit or preoperative medicine clinic) also staffed by hospitalists at AMCs.
CHALLENGES
Hospital medicine programs and AMCs face several challenges in building non‐housestaff services, but these will likely become less daunting as programs learn from their own experiences, from those of colleagues at other institutions, and from future investigations of these care models. We highlight a few issues below that warrant important consideration.
The Equities of the System
Prior to developing nonhousestaff services, our academic hospitalist programs scheduled teaching service time in month or half‐month blocks, balancing holidays and weekends. Equity in scheduling became a function of required clinical time, sources of non‐clinical funding (eg, grants, educational or administrative roles), and expectations for scholarship, attributes typical of most subspecialty academic divisions. Given the differing clinical missions that have stimulated academic hospital medicine programs to form, concerns of scheduling equity have grown, posing challenges not experienced in other divisions.
Institutions that choose to divide housestaff and nonhousestaff duties among distinct groups of hospitalists create the potential for a 2‐tiered system, one in which those with housestaff roles are more valued and respected by the institution. Hospitalists working on nonhousestaff services admit patients, write orders, and field direct patient calls, a role rarely undertaken by subspecialty attendings or hospitalists on housestaff services. Our collective experiences provide evidence of the danger of this second‐class‐citizen status, one that requires attention to ensure job satisfaction, retention, and necessary career development.
Institutions have accentuated the second‐class‐citizen concern by staffing nonhousestaff roles with 1‐year hospitalistsPGY‐4s. Most of these hires in our institutions are individuals just out of residency and intent on pursuing a fellowship. We speculate that they enjoy the comforts of the AMC where they often trained and accept purely nonhousestaff positions because of what they view as an appealing work schedule and salary. Although this approach addresses the growing need for hospitalists on nonhousestaff services in the short term, these positions must remain attractive enough (both financially and professionally) to encourage residency graduates to pursue an academic hospitalist career instead of a 1‐year position as a transition to fellowship. Otherwise, the approach conveys a message that relatively inexperienced physicians are good enough to be hospitalists.
Developing a cadre of clinically focused hospitalists who provide outstanding patient care and also garner respect as successful academicians is a difficult task. Although 1 group in our sample (Northwestern) shares nonhousestaff responsibilities equally, others may find this impractical, particularly where faculty members were hired before nonhousestaff services were established. Redefining such clinical positions several years into a career may be challenging, as it forces faculty members into roles they didn't sign up for or grandfathers them out of such roles, adding to the risk of a 2‐tiered system. Alternatively, groups may focus on building academic activities into nonhousestaff services, including medical student teaching, quality improvement, or clinical research activities. In this article, we deliberately classified these services as nonhousestaff rather than non‐teaching because the latter fails to acknowledge that these hospitalists often serve as teachers (eg, housestaff conferences, supervision of midlevel providers, and/or rotating medical students)an important if not symbolic distinction. It is imperative that planning for nonhousestaff services balance the larger academic mission of hospital medicine groups with creating equitable, valued, and sustainable job descriptions.
Defining the Patient Mix
Developing an optimal patient mix on nonhousestaff services also carries important implications. For services that work in parallel with the housestaff service and simply take extra patients above the resident cap, this concern may be less significant. However, other nonhousestaff services have been structured to care for lower‐acuity patients (eg, cellulitis, asthma, pneumonia) or select patient populations (eg, sickle cell or inflammatory bowel disease). This distribution system potentially changes the educational experience on the housestaff servicedecreasing the bread‐and‐butter admissionsbut also may affect the job satisfaction of hospitalists and midlevel providers on nonhousestaff services. Building triage criteria, working with emergency department leadership, and avoiding patients being turfed between different services is critical. We strongly recommend a regular process to review admissions to each service and determine when the triage process requires further calibration.
Recruitment and Retention
Traditionally, graduates of residency or fellowship training programs chose academic positions because of an interest in teaching, a desire for scholarship, or a commitment to research. Those interested in primarily clinical roles typically pursued positions in nonacademic settings. The development of nonhousestaff services challenges this paradigm because the objective for academic hospitalist leadership now becomes recruiting pure clinicians as well as academicians. These might be the same individual, a hospitalist who provides both housestaff and nonhousestaff services, or 2 different individuals if the nonhousestaff service is covered by dedicated hospitalists. In addition, with the current promotion structure in academia, a purely clinical position may be less attractive, as it provides fewer opportunities for advancement.
Therefore, recruitment and retention of academic hospitalists will require job descriptions that provide dedicated teaching opportunities, time for participation in quality and safety improvement projects, or pursuit of a scholarly interest in non‐clinical timethe diastole of an academic hospitalist.41 Hospital medicine leadership will also need to better distinguish off‐time from non‐clinical time, as many young hospitalists struggle to balance professional and personal commitmentsa recipe for burnout.42 Regardless of how clinical responsibilities differ between 2 hospitalists, providing them with similar academic resources is what will distinguish their positions from that in the community. Furthermore, many groups have chosen to pay faculty a premium for their nonhousestaff roles or to use specific recruitment incentives such as educational loan forgiveness programs.
With the expected growth of nonhousestaff services and surgical comanagement, hospital medicine programs will also need to determine if new hires will focus on a specific service (eg, orthopedic hospitalist) or whether job descriptions will include a mix of activities (eg, 3 months' teaching service, 3 months' nonhousestaff medical service, and 3 months' surgical comanagement service). A second and equally important question is where does the hospitalist live? If cardiology wants hospitalists to care for their patients, should they be hired and mentored by cardiologists or by hospitalists in a division of general or hospital medicine? In many cases, a graduating resident with plans to pursue a fellowship (eg, cardiology or hematology/oncology) may be a perfect candidate for a 1‐year position on his or her future specialty service. However, in the long term, maintaining all the academic hospitalists under the same umbrella will provide greater mentorship, professional development, opportunities for collaboration, clinical diversity, and sense of belonging to a group, rather than being a token hospitalist for another division.
Compensation and Financial Relationships with AMCs
Salaries for hospitalists working on nonhousestaff services are typically higher at AMCs, which are competing with community standards given the similar level of clinical hours worked. However, although pay for nonhousestaff activities should reflect the nature of the work, compensation models based on clinical productivity alone may prove inadequate. It appears hospitalists working in academic facilities spend significant time on indirect patient care because of these hospitals' inefficiencies, usually not found in community settings.43 Devising compensation for an academic hospitalist requires careful attention and must balance a number of factors because these hospitalists will not generate their entire salary from clinical services. Financial support must come from either the division or medical center, an annual negotiation at AMCs.
Several methods exist to structure hospitalist compensation. A hospitalist's salary may be fixed, may have a base salary with incentives, or may be derived based on clinical productivity. For example, if a hospital medicine program provides both housestaff and nonhousestaff services and employs a fixed‐salary approach, it may choose a menu‐style method to determine compensation (eg, 6 months on nonhousestaff service at x dollars/month + 3 months on housestaff service at x dollars/month = annual salary). If a hospitalist takes on a funded nonclinical role or secures extramural funding, the salary menu gets adjusted accordingly as the clinical time is bought out. Critics of the fixed‐salary approach argue that paying each hospitalist the same salary regardless of the specific job description yields an inequitable system in which some are rewarded with less clinical time.
Compensation should probably have a guaranteed base salary with incentives, which could be determined by a formula that weighs clinical productivity, quality improvement efforts, scholarly activity, and teaching excellence. This model provides financial incentives to develop both clinically and academically but introduces complexity in determining a fair incentive structure. Finally, compensation can be structured without salary guarantee and putting compensation fully at risk based on clinical productivity, although this is an unlikely strategy for any hospital medicine group. This approach does disproportionately reward high volume providers, potentially at the risk of quality and safety, but also creates significant incentives to improve efficiency.
With respect to AMC relationships, hospital medicine programs must ensure the positive return on investment that drives financial support at their institutions. This fundamental economic dynamic makes AMCs dependent on their hospital medicine groups and vice versa. We caution programs from solely relying on measures such as reduced hospital costs or length of stay as a basis of funding unless there is a reward for maintaining performance once it inevitably plateaus. Moreover, explicitly tying utilization efficiency (ie, length of stay) to salary violates Stark rules44 and carries potential malpractice implications should patient care errors be attributable to premature hospital discharge. Over time hospitalists will need to maintain clinical benchmarks but also provide additional and valued services to their institutions, including quality and safety improvement activities and compliance with residency work hour restrictions.
Defining the Academic Hospitalist
The question is simple and perhaps philosophical: Are hospitalists who work at an AMC academic hospitalists? And what job description truly defines an academic hospitalist? Currently, there are no standards for the clinical activity of an academic hospitalist position (eg, number of weeks, weekends, and hours) or for assessment of nonclinical productivity. Hospital medicine programs face the challenge of defining positions that fulfill the growing clinical mission at AMCs but have little experience or guidance in ensuring they will lead to advancing the academic mission. Specifically, how do hospitalists who provide mostly clinical care, particularly on nonhousestaff services, achieve promotion? Hospital medicine program leadership must create enough opportunity and time for the development of skills in research, education, and quality or systems improvement if academic hospitalists are to succeed.
The Association of Chiefs of General Internal Medicine (ACGIM), the Society of General Internal Medicine (SGIM), and the Society of Hospital Medicine (SHM) are currently collaborating to develop consensus guidelines in this area. Ultimately, through the efforts of these important governing bodies, the specialty of hospital medicine will be able to demonstrate the unique skills and services they provide and move toward advocating for academic promotion criteria that recognize their value and accomplishments.
FUTURE DIRECTIONS
Many lament that the milieu for academic hospitalists raises more challenges than solutions, but we believe the current era is one of excitement and opportunity. In the coming years, we will experience continued growth of nonhousestaff services, including greater comanagement with our surgical and medical specialty colleagues. These opportunities will create new relationships and increase our visibility in AMCs. However, we must remain committed to studying nonhousestaff services and determine if and how they differ from their housestaff and community counterparts, as this will be an important step toward addressing current challenges.
As hospitalists take on increasingly diverse roles,45 we must also lead initiatives to better train, recruit, and retain those interested in our specialty. Promoting our field and recruiting future faculty should occur through local hospitalist career nights, events at national meetings (targeting students, housestaff, and fellows), and other mechanisms utilized by our subspecialty colleagues. For housestaff interested in fellowship training, the growing number of hospitalist fellowships can provide skills in teaching and quality improvement.46 For trainees committed to research, we should work with existing general medicine research fellowships and partner to provide hospitalist mentorship.
Hospitalists are in a unique position to influence the delivery of clinical services, shape the future of residency training, guide quality and safety improvement initiatives, and take on leadership roles through our departments, universities, and medical centers. With the growing number of clinical services being added to our portfolio, we will need careful planning and evaluation of our efforts to build successful partnerships and develop faculty roles that balance clinical and academic pursuits to sustain long‐term and satisfying hospitalist careers.
- Accreditation Council for Graduate Medical Education. Information related to the ACGME's effort to address resident duty hours and other relevant resource materials. Available at: http://www.acgme.org/acWebsite/dutyHours/dh_index.asp Accessed May 28,2007.
- ,,,.The status of hospital medicine groups in the United States.J Hosp Med.2006;1:75–80.
- .Reflections: the hospitalist movement a decade later.J Hosp Med.2006;1:248–252.
- .Duty hours for resident physicians—tough choices for teaching hospitals.N Engl J Med.2002;347:1275–1278.
- ,.Resident work hours, hospitalist programs and academic medical centers.The Hospitalist.2005;Jan/Feb:30–33.
- .Adapting to duty‐hour limits—four years on.N Engl J Med.2007;356:2668–2670.
- ,,,,,.Effects of work hour reduction on residents' lives: a systematic review.JAMA.2005;294:1088–1100.
- ,,,,.Impact of reduced duty hours on residents' educational satisfaction at the University of California, San Francisco.Acad Med.2006;81:76–81.
- ,,, et al.Effect of Residency Duty‐Hour Limits. Views of Key Clinical Faculty.Arch Intern Med.2007;167:1487–1492.
- ,,,.Perceived impact of duty hours regulation: a survey of residents and program directors.Am J Med.2007;120:644–648.
- ,,,.The impact of duty hours on resident self reports of errors.J Gen Intern Med.2007;22:205–209.
- ,,,,.Managing discontinuity in academic medical centers: strategies for a safe and effective resident sign‐out.J Hosp Med.2006;1:257–266.
- ,.Changes in hospital mortality associated with residency work‐hour regulations.Ann Intern Med.2007;147:73–80.
- ,,,.Changes in outcomes for internal medicine inpatients after work‐hour regulations.Ann Intern Med.2007;147:97–103.
- ,,, et al.Mortality among hospitalized Medicare beneficiaries in the first 2 years following ACGME resident duty hour reform.JAMA.2007;298:975–983.
- ,,, et al.Mortality among patients in VA hospitals in the first 2 years following ACGME resident duty hour reform.JAMA.2007;298:984–991.
- .An elusive balance—residents' work hours and the continuity of care.N Engl J Med.2007;356:2665–2667.
- ,.Hippocrates affirmed? Limiting residents' work hours does no harm to patients.Ann Intern Med.2007;356:143–144.
- ,.Evaluating resident duty hour reforms.JAMA.2007;298:1055–1057.
- ,,,,.Housestaff team workload and organization effects on patient outcomes in an academic general internal medicine inpatient service.Arch Intern Med.2007;167:47–52.
- ,,,.Predicting future staffing needs at teaching hospitals: use of an analytical program with multiple variables.Arch Surg.2007;142:329–334.
- . A primer on: resident work hours. American Medical Student Association. 6th ed. 2005. Available at: http://www.amsa.org/rwh/RWHprimer_6thEdition.pdf. Accessed May 28,2007.
- ,.The hospitalist movement 5 years later.JAMA.2002;287:487–494.
- ,.The emerging role of “hospitalists” in the American health care system.N Engl J Med.1996;335:514–517.
- .The future of hospital medicine: evolution or revolution?Am J Med.2004;117:446–450.
- Society of Hospital Medicine. Media Center link: Growth of hospital medicine nationwide. Available at www.hospitalmedicine.org. Accessed May 28,2007.
- Kohn L,Corrigan JM,Donaldson MS, eds.To Err Is Human: Building a Safer Health System.Washington DC:Committee on Quality of Health Care in America, Institute of Medicine, National Academy Press;2000.
- Committee on Quality of Health Care in America, Institute of Medicine.Crossing the Quality Chasm: A New Health System for the 21st Century.Washington, DC:National Academy Press;2001.
- ,.Hospitalists in teaching hospitals: opportunities but not without danger.J Gen Intern Med.2004;19:392–393.
- .What will board certification be‐and mean‐for hospitalists?J Hosp Med.2007;2:102–104.
- .Academic medical centers under siege.N Engl J Med.1994;331:1370–1371.
- ,.Academic medicine meets managed care: a high impact collision.Acad Med.1996;71:839–845.
- .Preventing the academic medical center from becoming an oxymoron.Acad Med.1996;71:117–120.
- ,,.Why have academic medical center survived?JAMA.2005:293;1495–1500.
- ,,,.Comparison of hospitalist and nonhospitalists in inpatient length of stay adjusting for patient and physician characteristics.J Gen Intern Med.2004;19:1127–1132.
- ,,.Comparison of hospital costs and length of stay for community internists, hospitalists, and academicians.J Gen Intern Med.2007;22;662–667.
- ,.The impact of hospitalists on the cost and quality of inpatient care in the United States: a research synthesis.Med Care Res Rev.2005;62:379–406.
- ,,.Hospitalists and an innovative emergency department admissions process.J Gen Intern Med.2004;19:266–268.
- ,,,,.Comparison of resource utilization and clinical outcomes between teaching and nonteaching medical services.J Hosp Med.2007;2:150–157.
- ,,.Comparison of hospital costs and length of stay for community internists, hospitalists, and academicians.J Gen Intern Med.2007;22:662–667.
- ,,,.Preparing for “diastole”: advanced training opportunities for academic hospitalists.J Hosp Med.2006;1:368–377.
- Society of Hospital Medicine Career Satisfaction Task Force. White Paper on Hospitalist Career Satisfaction. 2006;1–45. Available at: http://www.hospitalmedicine.org. Accessed August 11,2007.
- ,,.How hospitalists spend their time: insights on efficiency and safety.J Hosp Med.2006;1:88–93.
- A Guide to Complying with Stark Self‐Referral Rules.Washington, DC:Atlantic Information Services, Inc.; 2004. Available at: http://www.aispub.com/. Accessed September 9, 2007.
- ,.The expanding role of hospitalists in the United States.Swiss Med Wkly.2006;136:591–596.
- ,,,.Hospital medicine fellowships: works in progress.Am J Med.2006;119:72e71–e77.
Many academic medical centers (AMCs) have developed nonhousestaff services to provide clinical care once provided by physicians‐in‐training. These services, often staffed by hospitalists and/or midlevel providers, have experienced tremendous growth in the past few years, yet very little exists in the literature about their development, structure, efficacy, or impact on hospitals, patients, and hospital medicine programs. The primary forces driving this growth include Accreditation Council for Graduate Medical Education (ACGME) resident duty hour restrictions,1 growth of the hospitalist movement,2 and the emphasis on simultaneously improving financial performance and quality of care in AMCs.3
Resident Duty Hour Restrictions
In 2003, the ACGME mandated restrictions on resident work hours, limiting trainees to 80 hours per week.1 Many training programs struggled with how to provide important clinical services while complying with the new restrictionscreating numerous models that bridged care between different shifts of residents.45 Implementation of day floats (a dedicated resident who rounds with the postcall team), night floats (a dedicated overnight resident who admits and cross‐covers patients), or some variation of both was common.6 No guidelines accompanied the ACGME mandate, leaving institutions to independently structure their programs without a known best practice.
Subsequent literature carefully addressed how the duty hour restrictions affect residents' lives and education but failed to discuss models for providing care.711 Training programs began to institute necessary changes but in doing so, created greater patient discontinuity and increased handoffs between residents, elevating the potential for adverse patient outcomes.12 Recent large‐scale studies indicate that inpatient care is the same or improved since adoption of the duty hour restrictions,1316 but controversy continues, with several editorials debating the issue.1719
Because increasing the volume of patients on housestaff services was not a viable option,20 many AMCs created nonhousestaff services and hired midlevel providers (nurse practitioners and physician assistants) to offset resident workloads and comply with the new restrictions. However, this strategy represented a very expensive alternative.21 Moreover, the current 80‐hour work limits may be revised downward, particularly given the lower restrictions in other countries,22 and this will further drive the demand for nonhousestaff services. Hospitalists, with their documented impact on efficiency and return on investment,23 represent a solution to fill these needs and have quickly become the predominant approach at AMCs.
The Hospitalist Movement
Since the term hospitalist was first coined in 1996,24 the remarkable growth of the number of practicing hospitalists emphasizes how first community hospitals and now AMCs have embraced this approach.25 With more than 20,000 nationwide and projections that the field will grow to 30,000 by 2010,26 hospitalists are becoming the primary providers for in‐patients.2 This growth was further catalyzed when widely expressed concerns about safety and quality became public,2728 and hospitalists incorporated patient safety and quality improvement activities into their efforts.3 The confluence of these factors also prompted emergence of hospital medicine programs at AMCs, a growth that came with anticipated dangers.29 Reflecting the recognition that hospital medicine is becoming a separate specialty30 and is integral to the functioning of an AMC, institutions now operate dedicated divisions of hospital medicine.
AMCs and Hospital Performance
AMCs operate 3 related enterprises: a medical school that trains future physicians, a research arena that promotes basic and clinical investigation, and health care services that often encompass both hospitals and clinics. The financial viability of AMCs has always been a topic of debate, largely because of the different missions they pursue and the financial means by which they survive.3133 Over the past decade, cuts in Medicare reimbursement, challenges in balancing bed availability with occupancy rates, and a growing emphasis on cost reduction have created a more competitive health care environment, but without the predicted demise of AMCs.34 Because education and research generally fail to bolster the bottom line, AMCs have focused on optimizing clinical services to promote financial viability.
Hospitalists are uniquely positioned to help this bottom line, just as they do at community hospitals. Their involvement in patient care may produce reductions in length of stay, greater efficiency in discharge planning, and significant cost savings.3537 Hospitalists may also improve throughput in emergency departments and decrease wait times, leading to more efficient bed utilization.38 This leads to a potential for greater hospital revenue by increasing both the number of admissions, particularly surgical cases, and staffed inpatient beds, the latter a premium, as AMCs continue to expand their bed capacity almost annually. Finally, hospitalists may serve as change agents in improving the quality and safety of care delivered, an increasingly important metric given the desire for and expansion of publicly reported measures.
From a financial standpoint, Medicare support to AMCs for training residents now subsidizes fewer clinical care hours. Hospitalist‐driven nonhousestaff services will continue to fulfill a need created by this marked change in residency training. The tension of who pays for nonhousestaff servicesincreased federal support, financial backing from AMCs, or academic department fundsposes an ongoing struggle. In fact, this may be the most important issue currently debated among hospital administrators and department chairs. Regardless, AMCs continue to view hospitalists as a mechanism (or even solution) to maintaining their financial bottom line through improving care delivery systems, adhering to resident work hour restrictions, leading quality and safety improvement initiatives, and improving clinical patient outcomes.
MODELS FOR NONHOUSESTAFF MEDICAL SERVICES
For AMCs developing nonhousestaff services, the process begins by addressing a series of important questions (Table 1). How these questions are answered is often driven by local factors such as the vision of local leadership and the availability of important resources. Nonetheless, it is important for hospitals to share their experiences because best practices remain unclear. Table 2 provides a tabular snapshot of nonhousestaff medicine services at 5 AMCs to highlight similarities and differences. Data in the table were compiled by having a representative from each AMC report the different attributes, which reflects each program as of July 2007. Table 2 provides no data on the quality or efficiency of housestaff versus nonhousestaff services, though this type of investigation is underway and will be critical in future planning.3940
| Questions | Potential options |
|---|---|
| Who will provide care on nonhousestaff services? | Physicians seeking a 1‐year position |
| Physicians committed to a purely clinical career | |
| Physicians committed to an academic career in hospital medicine | |
| Will hospitalists share nonhousestaff service time, or will there be dedicated nonhousestaff hospitalists? | Hybrid positions |
| Dedicated nonhousestaff hospitalists | |
| Use of PGY‐4s1‐year positions (often individuals planning a fellowship) | |
| How should staffing be organized? | Hospitalist‐only services |
| Use of midlevel providers | |
| Will there be 24‐7 coverage, and if so, how will nights be staffed? | Dedicated nocturnists |
| Shared among daytime hospitalists | |
| Midlevel providers | |
| Moonlighters (fellows or residents) | |
| What type of schedule will provide blocks of clinical time to ensure continuity of care but also ensure adequate nonclinical time to prevent physician burnout and turnover? | 7 on/7 off sequences |
| 45 day sequences | |
| Longer shifts with fewer shifts per month | |
| Shorter shifts with more shifts per month | |
| Where will patients on a nonhousestaff service receive care? | Geographically designed serviced |
| ○ Different floor | |
| ○ Different hospital | |
| Mixed among housestaff service | |
| What patient population will be cared for on the nonhousestaff service? | Same as on housestaff service |
| Based on bed availability if nonhousestaff service is geographic (a unit) | |
| Based on triage guidelines (lower acuity, observation patients, specific diagnoses) | |
| What volume of patients will be cared for on the nonhousestaff service? | Fixed census cap based on staffing |
| Flexible census depending on activity of housestaff service (above their cap) | |
| Will compensation for providing nonhousestaff services differ from that on housestaff services? | Higher base salary |
| Incentives tied to nonhousestaff time | |
| Different incentive structures |
| Attributes | BWH | Emory | University of Michigan | Northwestern | UCSF |
|---|---|---|---|---|---|
| Description of staffing model | Mon.‐Sun.: 1 daytime Hospitalist | Mon.‐Sun.: 4 daytime hospitalists, 2 swing shift admitters | Weekdays: 7 daytime hospitalists, 1 swing shift hospitalist | Mon.‐Sun.: 8 daytime hospitalists, 1 triage hospitalist | Weekdays: 2 daytime hospitalists, 1 swing shift hospitalist |
| Nights: 1 MD | Nights: 1 MDs | Weekends: 7 daytime hospitalists | Nights: 2 MDs | Weekends: 2 daytime hospitalists | |
| Nights: 2 MDs | Nights: 1 MD | ||||
| Location of service | In same university hospital | In same university hospital | In same university hospital | In same university hospital | Physically separate hospital affiliate (UCSF Medical Center at Mount Zion) |
| Nonhousestaff FTEs/total hospitalist group | 3/15 | 10/14 | 20/30 | 25/34 | 6/36 |
| What hospitalists provide care on nonhous estaff services? | Core of 3 hospitalists (also do month on housestaff service) | Hospitalist group shares nonhousestaff services | Core of 14 FTEs dedicated to nonhousestaff services | Hospitalist group shares nonhousestaff services | Core of 6 Mount Zionbased hospitalists (also spend 23 months on housestaff service at university hospital) |
| Other 6 FTEs consist of 10 faculty with mixed roles | |||||
| Age of service | 2 years | 4 years | 3 years | 5 years | 3 years |
| How patients get assigned to non‐housestaff service? | 1. Only ED admissions with no transfers from ICU or other services | Assigned by rotation | 1. Alternating admissions with housestaff services during afternoon | 1. Alternating admissions with housestaff services during day | 1. Lower‐acuity admissions from ED |
| 2. Admit whenever bed open on service (geographic) | 2. Observation cases triaged directly to service | 2. Lower‐acuity patients and direct admissions | 2. Lower‐acuity admissions from clinics | ||
| 3. Once housestaff cap, all subsequent admits until midnight to nonhousestaff service | 3. Nonhousestaff service admits all patients once resident caps reached | 3. Transfers from housestaff service no longer requiring tertiary services (or with complex discharge planning) | |||
| Average daily census of nonhousestaff service | 12 | 56 | 70 (75 cap) | 8595 | 2026 |
| Number of shifts per month/shift duration | 15/1012 hours | 15/12 hours | 1517 (depending on number of nights covered)/812 hours (swing = 8 hours, day = 1012 hours, night = 12 hours) | 20/1012 hours | 1617/1012 hours |
| Shift sequences | 710 days consecutive | Variable | 67 days consecutive followed by 1 night for those who cover nights | 7 days consecutive | 4‐ to 6‐day variable sequences |
| Total clinical days worked/year | 168 | 182.5 | 185202 (depending on number of nights covered) | 212 | 196 |
| Weekend clinical time | 50% of weekends | 50% of weekends | 50% of weekends | 50% of weekends | 50% of weekends |
| Night coverage/by whom? | Yes/exclusively moonlighters | Yes/shared (50% covered by 1 dedicated nocturnist) | Yes/66% of nights staffed by dedicated nocturnists with remainder shared | Yes/exclusively by six 1‐year nocturnists | Yes/exclusively by moonlighters |
| Presence of midlevel providers | Yes 6 FTE PAs Mon.‐Sun. | No | Yes 8 FTE PAs weekdays | No | No |
| Presence of dedicated case manager | Yes | Yes | Yes | No | Yes |
| Presence of medical students for patient care | No | No | Yes, 4th‐year subinterns or students on elective rotation | No | No |
| Compensation model | Salary + weekend bonus beyond 10 | Salary + incentive | Base + shift‐based incentive + quality incentive | Salary + incentive | Salary |
| Pay differential compared to housestaff service compensation | 10% Higher because of weekend bonus | None | About 20% higher base compensation; loan forgiveness program tied to nonhousestaff time | None | About 20% higher compensation |
| Hospital financial support | Yes | Yes | Yes | Yes | Yes |
Table 2 does illustrate several important considerations in structuring nonhousestaff services. For example, if a nonhousestaff service operates at a different physical location, careful triage of patients is necessary. Resources, including the availability of subspecialty and surgical consultants, may differ, and thus patient complexity and acuity may dictate whether a patient gets admitted to the nonhousestaff service. These triage factors were a major challenge in the design of UCSF's nonhousestaff service. The other nonhousestaff services handle overflow admissions after the housestaff service reaches a census or admission cap; transfers between services rarely occur, and resources are similar.
Other observations include that hospitalists work a similar number of hours each year and cover 50% of weekends but with differing shift lengths and sequences. Each service also provides night coverage but only Emory, the University of Michigan, and Northwestern utilize dedicated nocturnists. The University of Michigan and Brigham & Women's Hospital are the only sites that employ midlevel providers who work closely with hospitalists. In terms of group structure, Northwestern's hospitalists are the most integrated, with each hospitalist sharing equal responsibility for nonhousestaff coverage. In contrast, the other programs use selected hospitalists or a dedicated core of hospitalists to provide nonhousestaff services. Compensation models also vary, with certain groups salaried and others having incentive systems, although all receive hospital‐based funding support. Hospital‐based funding support ranges from 40% to 100% of total program costs across sites, creating similar variance in a given program's deficit risk. Finally, most programs do compensate nonhousestaff services at higher rates.
All the decisions captured in Table 2 have implications for costs, recruitment, and service structure. Furthermore, the striking variations demonstrate how different academic hospitalist positions can occur both within a hospital medicine group and across institutions. Of note, Table 2 only characterizes nonhousestaff medicine services, not the growing number of comanagement (eg, orthopedics, neurosurgery, or hematology/oncology) and other clinical services (eg, observation unit or preoperative medicine clinic) also staffed by hospitalists at AMCs.
CHALLENGES
Hospital medicine programs and AMCs face several challenges in building non‐housestaff services, but these will likely become less daunting as programs learn from their own experiences, from those of colleagues at other institutions, and from future investigations of these care models. We highlight a few issues below that warrant important consideration.
The Equities of the System
Prior to developing nonhousestaff services, our academic hospitalist programs scheduled teaching service time in month or half‐month blocks, balancing holidays and weekends. Equity in scheduling became a function of required clinical time, sources of non‐clinical funding (eg, grants, educational or administrative roles), and expectations for scholarship, attributes typical of most subspecialty academic divisions. Given the differing clinical missions that have stimulated academic hospital medicine programs to form, concerns of scheduling equity have grown, posing challenges not experienced in other divisions.
Institutions that choose to divide housestaff and nonhousestaff duties among distinct groups of hospitalists create the potential for a 2‐tiered system, one in which those with housestaff roles are more valued and respected by the institution. Hospitalists working on nonhousestaff services admit patients, write orders, and field direct patient calls, a role rarely undertaken by subspecialty attendings or hospitalists on housestaff services. Our collective experiences provide evidence of the danger of this second‐class‐citizen status, one that requires attention to ensure job satisfaction, retention, and necessary career development.
Institutions have accentuated the second‐class‐citizen concern by staffing nonhousestaff roles with 1‐year hospitalistsPGY‐4s. Most of these hires in our institutions are individuals just out of residency and intent on pursuing a fellowship. We speculate that they enjoy the comforts of the AMC where they often trained and accept purely nonhousestaff positions because of what they view as an appealing work schedule and salary. Although this approach addresses the growing need for hospitalists on nonhousestaff services in the short term, these positions must remain attractive enough (both financially and professionally) to encourage residency graduates to pursue an academic hospitalist career instead of a 1‐year position as a transition to fellowship. Otherwise, the approach conveys a message that relatively inexperienced physicians are good enough to be hospitalists.
Developing a cadre of clinically focused hospitalists who provide outstanding patient care and also garner respect as successful academicians is a difficult task. Although 1 group in our sample (Northwestern) shares nonhousestaff responsibilities equally, others may find this impractical, particularly where faculty members were hired before nonhousestaff services were established. Redefining such clinical positions several years into a career may be challenging, as it forces faculty members into roles they didn't sign up for or grandfathers them out of such roles, adding to the risk of a 2‐tiered system. Alternatively, groups may focus on building academic activities into nonhousestaff services, including medical student teaching, quality improvement, or clinical research activities. In this article, we deliberately classified these services as nonhousestaff rather than non‐teaching because the latter fails to acknowledge that these hospitalists often serve as teachers (eg, housestaff conferences, supervision of midlevel providers, and/or rotating medical students)an important if not symbolic distinction. It is imperative that planning for nonhousestaff services balance the larger academic mission of hospital medicine groups with creating equitable, valued, and sustainable job descriptions.
Defining the Patient Mix
Developing an optimal patient mix on nonhousestaff services also carries important implications. For services that work in parallel with the housestaff service and simply take extra patients above the resident cap, this concern may be less significant. However, other nonhousestaff services have been structured to care for lower‐acuity patients (eg, cellulitis, asthma, pneumonia) or select patient populations (eg, sickle cell or inflammatory bowel disease). This distribution system potentially changes the educational experience on the housestaff servicedecreasing the bread‐and‐butter admissionsbut also may affect the job satisfaction of hospitalists and midlevel providers on nonhousestaff services. Building triage criteria, working with emergency department leadership, and avoiding patients being turfed between different services is critical. We strongly recommend a regular process to review admissions to each service and determine when the triage process requires further calibration.
Recruitment and Retention
Traditionally, graduates of residency or fellowship training programs chose academic positions because of an interest in teaching, a desire for scholarship, or a commitment to research. Those interested in primarily clinical roles typically pursued positions in nonacademic settings. The development of nonhousestaff services challenges this paradigm because the objective for academic hospitalist leadership now becomes recruiting pure clinicians as well as academicians. These might be the same individual, a hospitalist who provides both housestaff and nonhousestaff services, or 2 different individuals if the nonhousestaff service is covered by dedicated hospitalists. In addition, with the current promotion structure in academia, a purely clinical position may be less attractive, as it provides fewer opportunities for advancement.
Therefore, recruitment and retention of academic hospitalists will require job descriptions that provide dedicated teaching opportunities, time for participation in quality and safety improvement projects, or pursuit of a scholarly interest in non‐clinical timethe diastole of an academic hospitalist.41 Hospital medicine leadership will also need to better distinguish off‐time from non‐clinical time, as many young hospitalists struggle to balance professional and personal commitmentsa recipe for burnout.42 Regardless of how clinical responsibilities differ between 2 hospitalists, providing them with similar academic resources is what will distinguish their positions from that in the community. Furthermore, many groups have chosen to pay faculty a premium for their nonhousestaff roles or to use specific recruitment incentives such as educational loan forgiveness programs.
With the expected growth of nonhousestaff services and surgical comanagement, hospital medicine programs will also need to determine if new hires will focus on a specific service (eg, orthopedic hospitalist) or whether job descriptions will include a mix of activities (eg, 3 months' teaching service, 3 months' nonhousestaff medical service, and 3 months' surgical comanagement service). A second and equally important question is where does the hospitalist live? If cardiology wants hospitalists to care for their patients, should they be hired and mentored by cardiologists or by hospitalists in a division of general or hospital medicine? In many cases, a graduating resident with plans to pursue a fellowship (eg, cardiology or hematology/oncology) may be a perfect candidate for a 1‐year position on his or her future specialty service. However, in the long term, maintaining all the academic hospitalists under the same umbrella will provide greater mentorship, professional development, opportunities for collaboration, clinical diversity, and sense of belonging to a group, rather than being a token hospitalist for another division.
Compensation and Financial Relationships with AMCs
Salaries for hospitalists working on nonhousestaff services are typically higher at AMCs, which are competing with community standards given the similar level of clinical hours worked. However, although pay for nonhousestaff activities should reflect the nature of the work, compensation models based on clinical productivity alone may prove inadequate. It appears hospitalists working in academic facilities spend significant time on indirect patient care because of these hospitals' inefficiencies, usually not found in community settings.43 Devising compensation for an academic hospitalist requires careful attention and must balance a number of factors because these hospitalists will not generate their entire salary from clinical services. Financial support must come from either the division or medical center, an annual negotiation at AMCs.
Several methods exist to structure hospitalist compensation. A hospitalist's salary may be fixed, may have a base salary with incentives, or may be derived based on clinical productivity. For example, if a hospital medicine program provides both housestaff and nonhousestaff services and employs a fixed‐salary approach, it may choose a menu‐style method to determine compensation (eg, 6 months on nonhousestaff service at x dollars/month + 3 months on housestaff service at x dollars/month = annual salary). If a hospitalist takes on a funded nonclinical role or secures extramural funding, the salary menu gets adjusted accordingly as the clinical time is bought out. Critics of the fixed‐salary approach argue that paying each hospitalist the same salary regardless of the specific job description yields an inequitable system in which some are rewarded with less clinical time.
Compensation should probably have a guaranteed base salary with incentives, which could be determined by a formula that weighs clinical productivity, quality improvement efforts, scholarly activity, and teaching excellence. This model provides financial incentives to develop both clinically and academically but introduces complexity in determining a fair incentive structure. Finally, compensation can be structured without salary guarantee and putting compensation fully at risk based on clinical productivity, although this is an unlikely strategy for any hospital medicine group. This approach does disproportionately reward high volume providers, potentially at the risk of quality and safety, but also creates significant incentives to improve efficiency.
With respect to AMC relationships, hospital medicine programs must ensure the positive return on investment that drives financial support at their institutions. This fundamental economic dynamic makes AMCs dependent on their hospital medicine groups and vice versa. We caution programs from solely relying on measures such as reduced hospital costs or length of stay as a basis of funding unless there is a reward for maintaining performance once it inevitably plateaus. Moreover, explicitly tying utilization efficiency (ie, length of stay) to salary violates Stark rules44 and carries potential malpractice implications should patient care errors be attributable to premature hospital discharge. Over time hospitalists will need to maintain clinical benchmarks but also provide additional and valued services to their institutions, including quality and safety improvement activities and compliance with residency work hour restrictions.
Defining the Academic Hospitalist
The question is simple and perhaps philosophical: Are hospitalists who work at an AMC academic hospitalists? And what job description truly defines an academic hospitalist? Currently, there are no standards for the clinical activity of an academic hospitalist position (eg, number of weeks, weekends, and hours) or for assessment of nonclinical productivity. Hospital medicine programs face the challenge of defining positions that fulfill the growing clinical mission at AMCs but have little experience or guidance in ensuring they will lead to advancing the academic mission. Specifically, how do hospitalists who provide mostly clinical care, particularly on nonhousestaff services, achieve promotion? Hospital medicine program leadership must create enough opportunity and time for the development of skills in research, education, and quality or systems improvement if academic hospitalists are to succeed.
The Association of Chiefs of General Internal Medicine (ACGIM), the Society of General Internal Medicine (SGIM), and the Society of Hospital Medicine (SHM) are currently collaborating to develop consensus guidelines in this area. Ultimately, through the efforts of these important governing bodies, the specialty of hospital medicine will be able to demonstrate the unique skills and services they provide and move toward advocating for academic promotion criteria that recognize their value and accomplishments.
FUTURE DIRECTIONS
Many lament that the milieu for academic hospitalists raises more challenges than solutions, but we believe the current era is one of excitement and opportunity. In the coming years, we will experience continued growth of nonhousestaff services, including greater comanagement with our surgical and medical specialty colleagues. These opportunities will create new relationships and increase our visibility in AMCs. However, we must remain committed to studying nonhousestaff services and determine if and how they differ from their housestaff and community counterparts, as this will be an important step toward addressing current challenges.
As hospitalists take on increasingly diverse roles,45 we must also lead initiatives to better train, recruit, and retain those interested in our specialty. Promoting our field and recruiting future faculty should occur through local hospitalist career nights, events at national meetings (targeting students, housestaff, and fellows), and other mechanisms utilized by our subspecialty colleagues. For housestaff interested in fellowship training, the growing number of hospitalist fellowships can provide skills in teaching and quality improvement.46 For trainees committed to research, we should work with existing general medicine research fellowships and partner to provide hospitalist mentorship.
Hospitalists are in a unique position to influence the delivery of clinical services, shape the future of residency training, guide quality and safety improvement initiatives, and take on leadership roles through our departments, universities, and medical centers. With the growing number of clinical services being added to our portfolio, we will need careful planning and evaluation of our efforts to build successful partnerships and develop faculty roles that balance clinical and academic pursuits to sustain long‐term and satisfying hospitalist careers.
- Accreditation Council for Graduate Medical Education. Information related to the ACGME's effort to address resident duty hours and other relevant resource materials. Available at: http://www.acgme.org/acWebsite/dutyHours/dh_index.asp Accessed May 28,2007.
- ,,,.The status of hospital medicine groups in the United States.J Hosp Med.2006;1:75–80.
- .Reflections: the hospitalist movement a decade later.J Hosp Med.2006;1:248–252.
- .Duty hours for resident physicians—tough choices for teaching hospitals.N Engl J Med.2002;347:1275–1278.
- ,.Resident work hours, hospitalist programs and academic medical centers.The Hospitalist.2005;Jan/Feb:30–33.
- .Adapting to duty‐hour limits—four years on.N Engl J Med.2007;356:2668–2670.
- ,,,,,.Effects of work hour reduction on residents' lives: a systematic review.JAMA.2005;294:1088–1100.
- ,,,,.Impact of reduced duty hours on residents' educational satisfaction at the University of California, San Francisco.Acad Med.2006;81:76–81.
- ,,, et al.Effect of Residency Duty‐Hour Limits. Views of Key Clinical Faculty.Arch Intern Med.2007;167:1487–1492.
- ,,,.Perceived impact of duty hours regulation: a survey of residents and program directors.Am J Med.2007;120:644–648.
- ,,,.The impact of duty hours on resident self reports of errors.J Gen Intern Med.2007;22:205–209.
- ,,,,.Managing discontinuity in academic medical centers: strategies for a safe and effective resident sign‐out.J Hosp Med.2006;1:257–266.
- ,.Changes in hospital mortality associated with residency work‐hour regulations.Ann Intern Med.2007;147:73–80.
- ,,,.Changes in outcomes for internal medicine inpatients after work‐hour regulations.Ann Intern Med.2007;147:97–103.
- ,,, et al.Mortality among hospitalized Medicare beneficiaries in the first 2 years following ACGME resident duty hour reform.JAMA.2007;298:975–983.
- ,,, et al.Mortality among patients in VA hospitals in the first 2 years following ACGME resident duty hour reform.JAMA.2007;298:984–991.
- .An elusive balance—residents' work hours and the continuity of care.N Engl J Med.2007;356:2665–2667.
- ,.Hippocrates affirmed? Limiting residents' work hours does no harm to patients.Ann Intern Med.2007;356:143–144.
- ,.Evaluating resident duty hour reforms.JAMA.2007;298:1055–1057.
- ,,,,.Housestaff team workload and organization effects on patient outcomes in an academic general internal medicine inpatient service.Arch Intern Med.2007;167:47–52.
- ,,,.Predicting future staffing needs at teaching hospitals: use of an analytical program with multiple variables.Arch Surg.2007;142:329–334.
- . A primer on: resident work hours. American Medical Student Association. 6th ed. 2005. Available at: http://www.amsa.org/rwh/RWHprimer_6thEdition.pdf. Accessed May 28,2007.
- ,.The hospitalist movement 5 years later.JAMA.2002;287:487–494.
- ,.The emerging role of “hospitalists” in the American health care system.N Engl J Med.1996;335:514–517.
- .The future of hospital medicine: evolution or revolution?Am J Med.2004;117:446–450.
- Society of Hospital Medicine. Media Center link: Growth of hospital medicine nationwide. Available at www.hospitalmedicine.org. Accessed May 28,2007.
- Kohn L,Corrigan JM,Donaldson MS, eds.To Err Is Human: Building a Safer Health System.Washington DC:Committee on Quality of Health Care in America, Institute of Medicine, National Academy Press;2000.
- Committee on Quality of Health Care in America, Institute of Medicine.Crossing the Quality Chasm: A New Health System for the 21st Century.Washington, DC:National Academy Press;2001.
- ,.Hospitalists in teaching hospitals: opportunities but not without danger.J Gen Intern Med.2004;19:392–393.
- .What will board certification be‐and mean‐for hospitalists?J Hosp Med.2007;2:102–104.
- .Academic medical centers under siege.N Engl J Med.1994;331:1370–1371.
- ,.Academic medicine meets managed care: a high impact collision.Acad Med.1996;71:839–845.
- .Preventing the academic medical center from becoming an oxymoron.Acad Med.1996;71:117–120.
- ,,.Why have academic medical center survived?JAMA.2005:293;1495–1500.
- ,,,.Comparison of hospitalist and nonhospitalists in inpatient length of stay adjusting for patient and physician characteristics.J Gen Intern Med.2004;19:1127–1132.
- ,,.Comparison of hospital costs and length of stay for community internists, hospitalists, and academicians.J Gen Intern Med.2007;22;662–667.
- ,.The impact of hospitalists on the cost and quality of inpatient care in the United States: a research synthesis.Med Care Res Rev.2005;62:379–406.
- ,,.Hospitalists and an innovative emergency department admissions process.J Gen Intern Med.2004;19:266–268.
- ,,,,.Comparison of resource utilization and clinical outcomes between teaching and nonteaching medical services.J Hosp Med.2007;2:150–157.
- ,,.Comparison of hospital costs and length of stay for community internists, hospitalists, and academicians.J Gen Intern Med.2007;22:662–667.
- ,,,.Preparing for “diastole”: advanced training opportunities for academic hospitalists.J Hosp Med.2006;1:368–377.
- Society of Hospital Medicine Career Satisfaction Task Force. White Paper on Hospitalist Career Satisfaction. 2006;1–45. Available at: http://www.hospitalmedicine.org. Accessed August 11,2007.
- ,,.How hospitalists spend their time: insights on efficiency and safety.J Hosp Med.2006;1:88–93.
- A Guide to Complying with Stark Self‐Referral Rules.Washington, DC:Atlantic Information Services, Inc.; 2004. Available at: http://www.aispub.com/. Accessed September 9, 2007.
- ,.The expanding role of hospitalists in the United States.Swiss Med Wkly.2006;136:591–596.
- ,,,.Hospital medicine fellowships: works in progress.Am J Med.2006;119:72e71–e77.