User login
Most family medicine residents remain in specialty
As many primary care practices struggle financially, a new study offers positive news about the retention of family medicine (FM) graduates in the specialty. According to the research, at least 85% of physicians who completed FM residency training in 2014-2017 went on to be certified by the American Board of Family Medicine (ABFM).
The U.S. could have a shortage of 21,100-55,200 primary care physicians by the year 2033, says a report released in June by the Association of American Medical Colleges.
Most U.S. primary care doctors specialize in FM, according to the American Academy of Family Physicians, and the number of physicians choosing this specialty declined over most of the period of the study, Mingliang Dai, PhD, lead author of the research, said in an interview. The study is in the July/August 2020 issue of Annals of Family Medicine.
Some positive news for the specialty is that 92% of 66,778 FM residency graduates from 1994-2017 self-designated FM as their primary specialty. This represents a 2.5% improvement on physician retention in the specialty compared with the period from 1969 to 1993, reported Dr. Dai and coauthor Lars E. Peterson, MD, PhD, both of the American Board of Family Medicine. Dr. Peterson also works in the department of family and community medicine at the University of Kentucky in Lexington.
“I am not surprised by the finding and hope that it means that family medicine has continued to demonstrate its importance as a specialty,” Santina J. Wheat, MD, program director of Northwestern’s McGaw Family Medicine residency program at Humboldt Park, Chicago, said in an interview. “We have demonstrated to our peers during the pandemic that we are valuable team members and I hope that perception will only be strengthened.
“Many of our graduates feel very strongly about being family medicine physicians. Most of graduates are practicing outpatient primary care so this does strongly align with my experience,” noted Dr. Wheat, a family physician at Erie Family Health Center in Chicago who serves on the editorial advisory board of Family Practice News.
The study authors noted that 98% of those whose last training was in FM “claimed FM as their primary specialty.”
The new research provides follow-up to a landmark 1996 report that found 91% of 38,659 FM residency graduates from 1969-1993 identified their specialty as FM, Dr. Dai said in an interview.
“The statistics on the primary care workforce, especially family medicine residency graduates, have not been examined for over 20 years,” the study author noted.
“We think it is important to monitor whether recent graduates continue to practice what they are trained for,” Dr. Dai said.
For the new report, Dr. Dai and Dr. Peterson examined records from the ABFM and American Medical Association for the years 1994-2017. They tracked 66,778 family medicine residency graduates and found that 92% identified FM as their primary specialty. The other top specialties were FM/sport medicine (2%), FM/geriatric medicine (1%), internal medicine/geriatrics (1%), and emergency medicine (1%).
The study reveals the tremendous evolution of the FM residency pipeline since the mid-1990s. The percentage of women among residency graduates grew from 40% in 1994-1997 to 54% in 2014-2017, and the percentage of international students jumped from 18% to 29% over that time period.
The 1996 report found that just 23% of FM graduate residents were women during the 1969-1993 period, and only 12% were international students.
In an interview, Heather Paladine, MD, MEd, FAAFP, residency director of the New York Presbyterian–Columbia Family Medicine Residency Program, called the study “thorough.” She also made the following comments about the new research: “It’s very good news that the percentage of FM grads who practice in our field is not decreasing. Once people finish an FM residency, they stay in our field.”
Dr. Paladine added that “this study validates what I have seen as a residency program director. Most of our graduates go into primary care job, and even many who do fellowships continue to practice primary care as well as their area of focus.”
However, she cautioned that the study doesn’t address a crucial challenge.
“The key to relieving the primary care shortage will be to look earlier in the pipeline: How can we get more medical students to choose family medicine? How can we increase the number of FM residency positions and find stable funding for them? How can we support family physicians to decrease burnout and make it a more attractive field? We know our field is needed, but insurance reimbursements are focused on more subspecialty care,” she noted.
As for the years since 2017, the last year analyzed in the study, Dr. Paladine said the trends seem to be continuing.
The impact of COVID-19 is still yet to be seen, but Dr. Paladine and other experts provided possibilities for the field in light of the pandemic.
“While the nation’s health care system is strained by COVID-19 patients, we have not yet seen COVID-19-related policy changes in medical education that may have a direct impact on residency programs,” Dr. Dai said in an interview.
Dr. Paladine said it’s possible that the pandemic could actually boost interest in medicine.
“After 9/11, I saw a number of college graduates who wanted to reach out and help people and ended up switching their plans to medical school,” she said. “This may happen again after COVID.”
Dr. Wheat also offered a positive outlook for the specialty.
“I am not expecting COVID to decrease the percentage of FM graduates working in family medicine. If anything, I think it will encourage them to have a broader scope and work as leaders in health care to look out for the primary care needs of our communities,” she said.
Neil Skolnik, MD, associate director of the family medicine residency program at Abington (Pa.) Hospital–Jefferson Health, said in an interview that the study shows that the FM pipeline “remains strong.”
Dr. Skolnik, who serves on the editorial advisory board of Family Practice News, added that “it is also good to see that there has been an increasing diversity in the composition of physicians graduating from family medicine residency programs, most importantly an increase in the proportion of women, with women now accounting for over half of graduates.”
However, Dr. Skolnik noted, “it is a bit surprising that less than 1% of graduates identified as practicing geriatric medicine, given the expected increasing proportion of the population that is over 80 years of age. As a specialty, perhaps we can think about ways to encourage more graduating residents to consider geriatrics as an area of interest as there is a societal need, and it can be a very gratifying area of practice.”
No study funding was reported. The study authors, Dr. Paladine, Dr. Skolnik, and Dr. Wheat reported no relevant disclosures.
Katie Lennon contributed to this report.
SOURCE: Dai M and Peterson LE. Ann Fam Med. 2020 Jul. doi: 10.1370/afm.2535.
FROM ANNALS OF FAMILY MEDICINE
Topical PDE-4 inhibitor for psoriasis effective in phase 2b trial
Once-daily – including challenging lesions in tough-to-treat intertriginous areas – in a phase 2b, randomized, double-blind, vehicle-controlled clinical trial, Mark G. Lebwohl, MD, reported at the virtual annual meeting of the American Academy of Dermatology.
The clinical improvement occurred rapidly. And topical roflumilast’s side effect profile was essentially the same as in vehicle-treated controls, which suggests a potential major advantage for the novel drug in future clinical practice. After all, topical treatment is the mainstay of psoriasis therapy, but the current topical agents – high-potency corticosteroids, vitamin D derivatives, and retinoids – have long-term tolerability, efficacy, or side effect issues, especially in treating sensitive skin areas, including the face and intertriginous areas.
“Roflumilast cream could really be a game changer,” predicted Dr. Lebwohl, professor and chair of the department of dermatology at the Icahn School of Medicine at Mount Sinai, New York.
Phosphodiesterase-4 (PDE-4) activity is elevated in psoriatic skin. Indeed, inhibition of PDE-4 via oral apremilast (Otezla) is an established strategy for improving psoriasis through down-regulation of inflammatory cytokines including tumor necrosis factor–alpha, interleukins-17 and -23, and interferon-gamma. Notably, however, roflumilast is orders of magnitude more potent than any other PDE-4 inhibitor. An oral version marketed as Daliresp has been available for treatment of chronic obstructive pulmonary disease for nearly a decade.
The 12-week, multicenter, phase 2b study included 331 patients with chronic plaque psoriasis who were randomized to once-daily 0.3% roflumilast cream, 0.15% roflumilast cream, or vehicle. Three-quarters of participants had a baseline Investigator Global Assessment (IGA) score of 3, indicative of moderate disease.
The primary endpoint was achievement of an IGA score of 0 or 1 (clear or almost clear) at week 6. The observed improvement was dose related, although both doses of roflumilast were significantly more effective than vehicle. However, peak improvement occurred at week 8, not week 6, with subsequent plateauing of response through week 12. A week 8 IGA of 0 or 1 plus at least a 2-grade improvement from baseline occurred in 32% of the high-dose roflumilast group, 25% of those on the 0.15% formulation, and 10% of controls.
“The effect in improvement was very rapid, with a statistically significant improvement compared to vehicle for both concentrations as early as week 2,” Dr. Lebwohl said.
A key secondary endpoint focused on treatment response in intertriginous areas, since “those are the areas where we really don’t want to use steroids because of major irritation problems,” the dermatologist explained. At week 12, treatment success as defined by an intertriginous IGA score of 0 or 1 plus at least a 2-point improvement from baseline was seen in 86% of the 0.3% roflumilast cream group, 50% on low-dose therapy, and 29% of controls.
About 65% of subjects on high-dose roflumilast cream reported at least a 4-point reduction in the Worst Itch–Numerical Rating Scale by week 8, as did 58% of those on the low-dose version and 42% of controls. Another secondary endpoint – patient-reported burden of disease as captured in a Psoriasis Symptoms Diary – showed a significant divergence between both doses of roflumilast and vehicle as early as week 2.
“Adverse events were negligible,” Dr. Lebwohl said. “In fact, there was only one discontinuation in the 0.3% arm, compared to none with 0.15% and two with vehicle.”
The phase 3 program is now recruiting participants.
The phase 2b study was funded by Arcutis Biotherapeutics. Dr. Lebwohl reported receiving research funding from and serving as a consultant to that company and numerous others.
FROM AAD 20
Post-PCI mortality higher in Blacks vs. Whites, regardless of comorbidities
A combined analysis of 10 prospective trials, intended to shed light on racial disparities in percutaneous coronary intervention (PCI) outcomes, saw sharply higher risks of death and myocardial infarction (MI) for Blacks compared with Whites.
The burden of comorbidities, including diabetes, was greater for Hispanics and Blacks, compared with Whites, but only in Blacks were PCI outcomes significantly worse even after controlling for such conditions and other baseline risk factors.
The analysis based on more than 22,000 patients was published July 6 in JACC: Cardiovascular Interventions,with lead author Mordechai Golomb, MD, Cardiovascular Research Foundation, New York.
In the study based on patient-level data from the different trials, the adjusted risk of MI after PCI was increased 45% at 1 year and 55% after 5 years for Blacks, compared with Whites. Their risk of death at 1 year was doubled, and their risk of major adverse cardiac events (MACE) was up by 28% at 5 years.
“Improving health care and outcomes for minorities is essential, and we are hopeful that our work may help direct these efforts, senior author Gregg W. Stone, MD, Icahn School of Medicine at Mount Sinai, New York, said in an interview.
“But this won’t happen without active, concerted efforts to promote change and opportunity, a task for government, regulators, payers, hospital administrators, physicians, and all health care providers,” he said. “Understanding patient outcomes according to race and ethnicity is essential to optimize health for all patients,” but “most prior studies in this regard have looked at population-based data.”
In contrast, the current study used hospital source records – which are considered more accurate than administrative databases – and event coding reports, Dr. Stone said, plus angiographic core laboratory analyses for all patients, which allows “an independent assessment of the extent and type of coronary artery disease and procedural outcomes.”
The analysis “demonstrated that even when upfront treatments are presumably similar [across racial groups] in a clinical trial setting, longitudinal outcomes still differ by race,” Michael Nanna, MD, said in an interview.
The “troubling” results “highlight the persistence of racial disparities in health care and the need to renew our focus on closing these gaps [and] is yet another call to action for clinicians, researchers, and the health care system at large,” said Dr. Nanna, of Duke University Medical Center, Durham, N.C., and lead author on an editorial accompanying the published analysis.
Of the 10 randomized controlled trials included in the study, which encompassed 22,638 patients, 9 were stent comparisons and 1 compared antithrombotic regimens in patients with acute coronary syndromes (ACS), the authors noted. The median follow-up was about 1,100 days.
White patients made up 90.9% of the combined cohort, Black patients comprised 4.1%, Hispanics 2.1%, and Asians 1.8% – figures that “confirm the well-known fact that minority groups are underrepresented in clinical trials,” Dr. Stone said.
There were notable demographic and clinical differences at baseline between the four groups.
For example, Black patients tended to be younger than White, Hispanic, and Asian patients. Black and Hispanic patients were also less likely to be male, compared with White patients.
Both Black and Hispanic patients had more comorbidities than Whites did at baseline, the authors observe. For example, Black and Hispanic patients had a greater body mass index, compared with Whites, whereas it was lower for Asians; and they had more diabetes and more hypertension than Whites (P < .0001 for all differences). Hispanics were more likely to have ACS at baseline, compared with Whites, and less likely to have stable coronary artery disease (CAD) (P < .0001 for all differences). Similar proportions of Blacks and of Whites had stable CAD (about 32% of each) and ACS (about 68% in both cases). Rates of hyperlipidemia and stable CAD were greater and rates of ACS was lower in Asians than the other three race groups (P < .0001 for each difference). In adjusted analysis, the risk of MACE at 5 years was significantly increased for Blacks, compared with Whites (hazard ratio, 1.28; 95% CI, 1.05-1.57; P = .01). The same applied to MI (HR, 1.55; 95% CI, 1.15-2.09; P = .004). At 1 year, Blacks showed higher risks for death (HR, 2.06; 95% CI, 1.26-3.36; P = .004) and for MI (HR, 1.45; 95% CI, 1.01-2.10; P = .045), compared with Whites.
No significant increases in risk for outcomes at 1 and 5 years were seen for Hispanics or Asians, compared with Whites.
Covariates in the analyses included age, sex, body mass index, diabetes, current smoking, hypertension, hyperlipidemia, history of MI or coronary revascularization, clinical CAD presentation, category of stent, and race stratified by study.
Even with underlying genotypic differences between Blacks and Whites, much of the difference in risk for outcomes “should have been accounted for when the researchers adjusted for these clinical phenotypes,” the editorial notes.
Some of the difference in risk must have derived from uncontrolled-for variables, and “[b]eyond genetics, it is clear that race is also a surrogate for other socioeconomic factors that influence both medical care and patient outcomes,” the editorialists wrote.
The adjusted analysis, noted Golomb et al, suggests “that for Hispanic patients, the excess risk for adverse clinical outcomes may have been attributable to a higher prevalence of risk factors. In contrast, the excess risk for adverse clinical outcomes for Black patients persisted even after adjustment for baseline risk factors.”
As such, they agreed: “The observed increased risk may be explained by differences that are not fully captured in traditional cardiovascular risk factor assessment, including socioeconomic differences and education, treatment compliance rates, and yet-to-be-elucidated genetic differences and/or other factors.”
Dr. Stone said that such socioeconomic considerations may include reduced access to care and insurance coverage; lack of preventive care, disease awareness, and education; delayed presentation; and varying levels of provided care.
“Possible genetic or environmental-related differences in the development and progression of atherosclerosis and other disease processes” may also be involved.
“Achieving representative proportions of minorities in clinical trials is essential but has proved challenging,” Dr. Stone said. “We must ensure that adequate numbers of hospitals and providers that are serving these patients participate in multicenter trials, and trust has to be developed so that minority populations have confidence to enroll in studies.”
Dr. Stone reported holding equity options in Ancora, Qool Therapeutics, Cagent, Applied Therapeutics, the Biostar family of funds, SpectraWave, Orchestro Biomed, Aria, Cardiac Success, the MedFocus family of funds, and Valfix and receiving consulting fees from Valfix, TherOx, Vascular Dynamics, Robocath, HeartFlow, Gore Ablative Solutions, Miracor, Neovasc, W-Wave, Abiomed, and others. Disclosures for the other authors are in the report. Nanna reports no relevant financial relationships; other coauthor disclosures are provided with the editorial.
A version of this article originally appeared on Medscape.com.
About one-third of older Americans receive shingles vaccine
The number of Americans aged 60 years and older who report receiving shingles vaccination had risen steadily since 2008 and has leveled off during the past few years, new data from the Centers for Disease Control and Prevention’s (CDC’s) National Center for Health Statistics reveal.
The proportion of people in this age group who were vaccinated rose from 6.7% in 2008 to 34.5% in 2018, for example.
Emily Terlizzi, MPH, told Medscape Medical News.
The report was published online July 9 in NCHS Data Brief.
Similar rates for men and women
Rates of people who reported receiving at least one vaccination with Zostavax (Merck) or Shingrix (GlaxoSmithKline) varied by factors that included Hispanic origin, education, and family income. An unexpected finding was that rates did not vary significantly between men and women.
“One finding that I would say surprised me was that, although the percentage who had ever received a shingles vaccine among women aged 60 and over was higher than that among men in this age group, this difference was not statistically significant,” said Ms. Terlizzi, a health statistician in the Data Analysis and Quality Assurance Branch, Division of Health Interview Statistics, the CDC National Center for Health Statistics. In 2018, for example, 35.4% of women and 33.5% of men reported ever receiving a shingles vaccine.
The similarity of rates was less of a surprise to Len Horovitz, MD, a pulmonary specialist at Lenox Hill Hospital in New York, who was not affiliated with the report. “In my anecdotal experience, I don’t see a preponderance of one sex getting shingles more than another. It’s pretty evenly distributed,” he said in an interview.
Ms. Terlizzi and coauthor Lindsey I. Black, MPH, say their findings align with prior research. However, they noted: “Our report uses more recent data from a large, nationally representative data source to update these estimates and describe these disparities.” Data come from results of the annual National Health Interview Survey of households nationwide.
Multiple factors explain vaccination differences
Non-Hispanic White adults were more likely to report receiving the vaccine than were Hispanic and non-Hispanic Black survey respondents. Non-Hispanic White adults were about twice as likely to report vaccination – 38.6% – compared with 19.5% of Hispanic adults and 18.8% of non-Hispanic Black adults.
The disparity in vaccination by race was “disappointing news,” Kenneth E. Schmader, MD, said in an interview.
“The health disparity with regard to lower vaccination rates in Hispanic and non-Hispanic Black populations is reported with other vaccines as well and points to the need for better efforts to vaccinate Hispanic and non-Hispanic Black populations,” added Dr. Schmader, a professor of medicine at Duke University in Durham, N.C.
On a positive note, “It was good to see increasing use of shingles vaccination over time, given how devastating zoster can be in older adults and the fact that the vaccines are effective,” said Dr. Schmader, who also serves on the working groups for the Herpes Zoster, Influenza and General Adult Immunization Guidelines for the CDC Advisory Committee on Immunization Practices (ACIP).
Self-reports of receiving vaccination increased in association with higher education and family income levels. For example, 39.9% of respondents who had more than a high school diploma or GED (General Educational Development) reported receiving the shingles vaccine. In contrast, only 21.2% of people with lower educational attainment reported receiving a vaccine.
In terms of income, 20.4% of poor adults reported being vaccinated, compared with 38.4% of adults who were not poor.
The investigators also evaluated the data by geographic region. They found that rates of vaccinations varied from 26.3% in the East South Central part of the United States (which includes Tennessee, Kentucky, and Alabama) to 42.8% in the West North Central region (which includes the Dakotas, Minnesota, and Nebraska).
Clinical and research considerations
For most of the decade evaluated in the study, ACIP recommended vaccination against shingles for Americans aged 60 years and older. The current findings, therefore, do not account for ACIP’s expanding its recommendations in 2017 to include adults aged 50 years and older.
Zostavax is expected to be discontinued this year. It was the only shingles vaccine available before the approval of Shingrix in 2018. The shift to a single product could alter vaccination patterns further.
Ms. Terlizzi plans to continue monitoring trends to “see what changes occur in the next few years,” she said.
Compliance a concern
Data on vaccination rates for shingles are important given the large proportion of the population at risk, Dr. Horovitz said. “People over age 50 who have had chickenpox have a one third chance over their lifetimes to get shingles. That is a lot of people.”
Multiple factors could be contributing to the fact that vaccination rates have hovered around 34% in recent years, he said. “Whenever you see variations in vaccination rates, you have to think about cultural differences and questions about differences in access, accessibility, and attitudes. Attitudes toward vaccines vary widely – from people who don’t believe in vaccination to people who are eager to take vaccinations.
“I don’t know how to dissect all that out of these data,” he added.
Compliance with recommendations also contributes to vaccination rates, Dr. Horovitz said. The fact that in about 10% of people, a flulike syndrome develops the day after being vaccinated with Shingrix can cause some to postpone or rethink immunization, he added. In addition, Shingrix requires two shots. “People have to come back, and that always sets up an issue with recalling someone.”
Marketplace shortages of the Shingrix vaccine could also contribute to lower vaccination rates. However, Dr. Horovitz said that, in his practice, availability was only a problem during the first year after approval in 2017.
On a related note, manufacturer GlaxoSmithKline announced that a decrease in vaccination demand during the COVID-19 pandemic has allowed the supply to catch up. Shingrix no longer qualifies for the CDC’s shortages list, according to a July 9 report.
Ms. Terlizzi, Dr. Horovitz, and Dr. Schmader have disclosed no relevant financial relationships.
A version of this article originally appeared on Medscape.com.
ctDNA clearance tracks with PFS in NSCLC subtype
The median PFS was 9.1 months for patients with ctDNA clearance and 3.9 months for those without ctDNA clearance three to four cycles after starting treatment with osimertinib, an EGFR tyrosine kinase inhibitor (TKI), and savolitinib, a MET TKI (P = 0.0146).
“[O]ur findings indicate that EGFR-mutant ctDNA clearance may be predictive of longer PFS for patients with EGFR-mutant, MET-amplified non–small cell lung cancer and detectable ctDNA at baseline,” said investigator Ryan Hartmaier, PhD, of AstraZeneca in Boston, Mass.
Dr. Hartmaier presented these findings at the AACR virtual meeting II.
Prior results of TATTON
Interim results of the TATTON study were published earlier this year (Lancet Oncol. 2020 Mar;21[3]:373-386). The trial enrolled patients with locally advanced or metastatic EGFR-mutant, MET-amplified NSCLC who had progressed on a prior EGFR TKI. Results included patients enrolled in parts B and D.
Part B consisted of patients who had previously received a third-generation EGFR TKI and patients who had not received a third-generation EGFR TKI and were either Thr790Met negative or Thr790Met positive. There were 144 patients in part B. All received oral osimertinib at 80 mg, 138 received savolitinib at 600 mg, and 8 received savolitinib at 300 mg daily. Part D included 42 patients who had not received a third-generation EGFR TKI and were Thr790Met negative. In this cohort, patients received osimertinib at 80 mg and savolitinib at 300 mg daily.
The objective response rate (all partial responses) was 48% in part B and 64% in part D. The median PFS was 7.6 months and 9.1 months, respectively.
Alexander E. Drilon, MD, of Memorial Sloan Kettering Cancer Center in New York said results of the TATTON study demonstrate that MET dependence is an actionable EGFR TKI resistance mechanism in EGFR-mutant lung cancers.
“We all would welcome the approval of an EGFR and MET TKI combination in the future,” Dr. Drilon said in a discussion of the study at the AACR meeting.
According to Dr. Hartmaier, MET-based resistance mechanisms are seen in up to 10% of patients with EGFR-mutated NSCLC following progression on first- and second-generation EGFR TKIs, and up to 25% of those progressing on osimertinib, a third-generation EGFR TKI.
“Nonclinical and clinical evidence suggests that combined treatment of a MET inhibitor and an EGFR TKI could overcome acquired MET-mediated resistance,” he said.
ctDNA analysis
Patients in the TATTON study had ctDNA samples collected at various time points from baseline through cycle five of treatment and until disease progression or treatment discontinuation.
Dr. Hartmaier’s analysis focused on ctDNA changes from baseline to day 1 of the third or fourth treatment cycle, time points at which the bulk of ctDNA could be observed, he said.
Among 34 evaluable patients in part B who received savolitinib at 600 mg, 22 had ctDNA clearance, and 12 had not. Among 16 evaluable patients in part D who received savolitinib at 300 mg, 13 had ctDNA clearance, and 3 had not.
Rates of ctDNA clearance were “remarkably similar” among the dosing groups, Dr. Hartmaier said.
In part B, the median PFS was 9.1 months for patients with ctDNA clearance and 3.9 months for patients without clearance (hazard ratio, 0.34; 95% confidence interval, 0.14-0.81; P = 0.0146).
Dr. Hartmaier did not present PFS results according to ctDNA clearance for patients in part D.
Dr. Drilon said serial ctDNA analyses can provide information on mechanisms of primary or acquired resistance, intra- and inter-tumoral heterogeneity, and the potential durability of benefit that can be achieved with combination targeted therapy. He acknowledged, however, that more work needs to be done in the field of MET-targeted therapy development.
“We need to work on standardizing diagnostic definitions of MET dependence, recognizing that loose definitions and poly-assay use make data challenging to interpret,” he said.
The TATTON study was supported by AstraZeneca. Dr. Hartmaier is an AstraZeneca employee and shareholder. Dr. Drilon disclosed relationships with AstraZeneca, Pfizer, Helsinn, Beigene, and other companies.
SOURCE: Hartmaier R, et al. AACR 2020, Abstract CT303.
FROM AACR 2020
Hep C sofosbuvir/daclatasvir combo promising for COVID-19
research from an open-label Iranian study shows.
And the good news is that the treatment combination “already has a well-established safety profile in the treatment of hepatitis C,” said investigator Andrew Hill, PhD, from the University of Liverpool, United Kingdom.
But although the results look promising, they are preliminary, he cautioned. The combination could follow the path of ritonavir plus lopinavir (Kaletra, AbbVie Pharmaceuticals) or hydroxychloroquine (Plaquenil, Sanofi Pharmaceuticals), which showed promise early but did not perform as hoped in large randomized controlled trials.
“We need to remember that conducting research amidst a pandemic with overwhelmed hospitals is a clear challenge, and we cannot be sure of success,” he added.
Three Trials, 176 Patients
Data collected during a four-site trial of the combination treatment in Tehran during an early spike in cases in Iran were presented at the Virtual COVID-19 Conference 2020 by Hannah Wentzel, a masters student in public health at Imperial College London and a member of Hill’s team.
All 66 study participants were diagnosed with moderate to severe COVID-19 and were treated with standard care, which consisted of hydroxychloroquine 200 mg twice daily with or without the combination of lopinavir plus ritonavir 250 mg twice daily.
The 33 patients randomized to the treatment group also received the combination of sofosbuvir plus daclatasvir 460 mg once daily. These patients were slightly younger and more likely to be men than were those in the standard-care group, but the differences were not significant.
All participants were treated for 14 days, and then the researchers assessed fever, respiration rate, and blood oxygen saturation.
More patients in the treatment group than in the standard-care group had recovered at 14 days (88% vs 67%), but the difference was not significant.
However, median time to clinical recovery, which took into account death as a competing risk, was significantly faster in the treatment group than in the standard-care group (6 vs 11 days; P = .041).
The researchers then pooled their Tehran data with those from two other trials of the sofosbuvir plus daclatasvir combination conducted in Iran: one in the city of Sari with 48 patients and one in the city of Abadan with 62 patients.
A meta-analysis showed that clinical recovery in 14 days was 14% better in the treatment group than in the control group in the Sari study, 32% better in the Tehran study, and 82% better in the Abadan study. However, in a sensitivity analysis, because “the trial in Abadan was not properly randomized,” only the improvements in the Sari and Tehran studies were significant, Wentzel reported.
The meta-analysis also showed that patients in the treatment groups were 70% more likely than those in the standard-care groups to survive.
However, the treatment regimens in the standard-care groups of the three studies were all different, reflecting evolving national treatment guidelines in Iran at the time. And SARS-CoV-2 viral loads were not measured in any of the trials, so the effects of the different drugs on the virus itself could not be assessed.
Still, overall, “sofosbuvir and daclatasvir is associated with faster discharge from hospital and improved survival,” Wentzel said.
These findings are hopeful, “provocative, and encouraging,” said Anthony Fauci, MD, director of the National Institute of Allergy and Infectious Diseases, and he echoed Hill’s call to “get these kinds of studies into randomized controlled trials.”
But he cautioned that more data are needed before the sofosbuvir and daclatasvir combination can be added to the National Institutes of Health COVID-19 Treatment Guidelines, which clinicians who might be under-resourced and overwhelmed with spikes in COVID-19 cases rely on.
Results from three double-blind randomized controlled trials – one each in Iran, Egypt, and South Africa – with an estimated cumulative enrollment of about 2,000 patients, are expected in October, Hill reported.
“Having gone through feeling so desperate to help people and try new things, it’s really important to do these trials,” said Kristen Marks, MD, from Weill Cornell Medicine in New York City.
“You get tempted to just kind of throw anything at people. And I think we really have to have science to guide us,” she told Medscape Medical News.
This article first appeared on Medscape.com.
Helping families understand internalized racism
Ms. Jones brings her 15-year-old daughter, Angela, to the resident clinic. Angela is becoming increasingly anxious, withdrawn, and difficult to manage. As part of the initial interview, the resident, Dr. Sota, asks about the sociocultural background of the family. Ms. Jones is African American and recently began a relationship with a white man. Her daughter, Angela, is biracial; her biological father is white and has moved out of state with little ongoing contact with Angela and her mother.

At interview, Angela expresses a lot of anger at her mother, her biological father, and her new “stepfather.” Ms. Jones says: “I do not want Angela growing up as an ‘angry black woman.’ ” When asked for an explanation, she stated that she doesn’t want her daughter to be stereotyped, to be perceived as an angry black person. “She needs to fit in with our new life. She has lots of opportunities if only she would take them.”
Dr. Sota recognizes that Angela’s struggle, and perhaps also the struggle of Ms. Jones, has a component of internalized racism. How should Dr. Sota proceed? Dr. Sota puts herself in Angela’s shoes: How does Angela see herself? Angela has light brown skin, and
The term internalized racism (IR) first appeared in the 1980s. IR was compared to the oppression of black people in the 1800s: “The slavery that captures the mind and incarcerates the motivation, perception, aspiration, and identity in a web of anti-self images, generating a personal and collective self destruction, is more cruel than the shackles on the wrists and ankles.”1 According to Susanne Lipsky,2 IR “in African Americans manifests as internalizing stereotypes, mistrusting the self and other Blacks, and narrows one’s view of authentic Black culture.”
IR refers to the internalization and acceptance of the dominant white culture’s actions and beliefs, while rejecting one’s own cultural background. There is a long history of negative cultural representations of African Americans in popular American culture, and IR has a detrimental impact on the emotional well-being of African Americans.3
IR is associated with poorer metabolic health4 and psychological distress, depression and anxiety,5-8 and decreased self-esteem.9 However, protective processes can reduce one’s response to risk and can be developed through the psychotherapeutic relationship.
Interventions at an individual, family, or community levels
Angela: Tell me about yourself: What type of person are you? How do you identify? How do you feel about yourself/your appearance/your language?
Tell me about your friends/family? What interests do you have?
“Tell me more” questions can reveal conflicted feelings, etc., even if Angela does not answer. A good therapist can talk about IR; even if Angela does not bring it up, it is important for the therapist to find language suitable for the age of the patient.
Dr. Sota has some luck with Angela, who nods her head but says little. Dr. Sota then turns to Ms. Jones and asks whether she can answer these questions, too, and rephrases the questions for an adult. Interviewing parents in the presence of their children gives Dr. Sota and Angela an idea of what is permitted to talk about in the family.
A therapist can also note other permissions in the family: How do Angela and her mother use language? Do they claim or reject words and phrases such as “angry black woman” and choose, instead, to use language to “fit in” with the dominant white culture?
Dr. Sota notices that Ms. Jones presents herself as keen to fit in with her new future husband’s life. She wants Angela to do likewise. Dr. Sota notices that Angela vacillates between wanting to claim her black identity and having to navigate what that means in this family (not a good thing) – and wanting to assimilate into white culture. Her peers fall into two separate groups: a set of black friends and a set of white friends. Her mother prefers that she see her white friends, mistrusting her black friends.
Dr. Sota’s supervisor suggests that she introduce IR more forcefully because this seems to be a major course of conflict for Angela and encourage a frank discussion between mother and daughter. Dr. Sota starts the next session in the following way: “I noticed last week that the way you each identify yourselves is quite different. Ms. Jones, you want Angela to ‘fit in’ and perhaps just embrace white culture, whereas Angela, perhaps you vacillate between a white identity and a black identity?”
The following questions can help Dr. Sota elicit IR:
- What information about yourself would you like others to know – about your heritage, country of origin, family, class background, and so on?
- What makes you proud about being a member of this group, and what do you love about other members of this group?
- What has been hard about being a member of this group, and what don’t you like about others in this group?
- What were your early life experiences with people in this group? How were you treated? How did you feel about others in your group when you were young?
At a community level, family workshops support positive cultural identities that strengthen family functioning and reducing behavioral health risks. In a study of 575 urban American Indian (AI) families from diverse tribal backgrounds, the AI families who participated in such a workshop had significant increases in their ethnic identity, improved sense of spirituality, and a more positive cultural identification. The workshops provided culturally adaptive parenting interventions.10
IR is a serious determinant of both physical and mental health. Assessment of IR can be done using rating scales, such as the Nadanolitization Scale11 or the Internalized Racial Oppression Scale.12 IR also can also be assessed using a more formalized interview guide, such as the DSM-5 Cultural Formulation Interview (CFI).13 This 16-question interview guide helps behavioral health providers better understand the way service users and their social networks (e.g., families, friends) understand what is happening to them and why, as well as the barriers they experience, such as racism, discrimination, stigma, and financial stressors.
Individuals’ cultures and experiences have a profound impact on their understanding of their symptoms and their engagement in care. The American Psychiatric Association considers it to be part of mental health providers’ duty of care to engage all individuals in culturally relevant conversations about their past experiences and care expectations. More relevant, I submit that you cannot treat someone without having made this inquiry. A cultural assessment improves understanding but also shifts power relationships between providers and patients. The DSM-5 CFI and training guides are widely available and provide additional information for those who want to improve their cultural literacy.
Conclusion
Internalized racism is the component of racism that is the most difficult to discern. Psychiatrists and mental health professionals are uniquely poised to address IR, and any subsequent internal conflict and identity difficulties. Each program, office, and clinic can easily find the resources to do this through the APA. If you would like help providing education, contact me at alisonheru@gmail.com.
References
1. Akbar N. J Black Studies. 1984. doi: 10.11771002193478401400401.
2. Lipsky S. Internalized Racism. Seattle: Rational Island Publishers, 1987.
3. Williams DR and Mohammed SA. Am Behav Sci. 2013 May 8. doi: 10.1177/00027642134873340.
4. DeLilly CR and Flaskerud JH. Issues Ment Health Nurs. 2012 Nov;33(11):804-11.
5. Molina KM and James D. Group Process Intergroup Relat. 2016 Jul;19(4):439-61.
6. Szymanski D and Obiri O. Couns Psychologist. 2011;39(3):438-62.
7. Carter RT et al. J Multicul Couns Dev. 2017 Oct 5;45(4):232-59.
8. Mouzon DM and McLean JS. Ethn Health. 2017 Feb;22(1):36-48.
9. Szymanski DM and Gupta A. J Couns Psychol. 2009;56(1):110-18.
10. Kulis SS et al. Cultural Diversity and Ethnic Minority Psychol. 2019. doi: 10.1037/cpd000315.
11. Taylor J and Grundy C. “Measuring black internalization of white stereotypes about African Americans: The Nadanolization Scale.” In: Jones RL, ed. Handbook of Tests and Measurements of Black Populations. Hampton, Va.: Cobb & Henry, 1996.
12. Bailey T-K M et al. J Couns Psychol. 2011 Oct;58(4):481-93.
13. American Psychiatric Association. Cultural Formulation Interview. DSM-5. American Psychiatric Association Publishing: Arlington, Va. 2013.
Various aspects about the case described above have been changed to protect the clinician’s and patients’ identities. Thanks to the following individuals for their contributions to this article: Suzanne Huberty, MD, and Shiona Heru, JD.
Dr. Heru is professor of psychiatry at the University of Colorado at Denver, Aurora. She is editor of “Working With Families in Medical Settings: A Multidisciplinary Guide for Psychiatrists and Other Health Professionals” (Routledge, 2013). She has no conflicts of interest to disclose.
Ms. Jones brings her 15-year-old daughter, Angela, to the resident clinic. Angela is becoming increasingly anxious, withdrawn, and difficult to manage. As part of the initial interview, the resident, Dr. Sota, asks about the sociocultural background of the family. Ms. Jones is African American and recently began a relationship with a white man. Her daughter, Angela, is biracial; her biological father is white and has moved out of state with little ongoing contact with Angela and her mother.
At interview, Angela expresses a lot of anger at her mother, her biological father, and her new “stepfather.” Ms. Jones says: “I do not want Angela growing up as an ‘angry black woman.’ ” When asked for an explanation, she stated that she doesn’t want her daughter to be stereotyped, to be perceived as an angry black person. “She needs to fit in with our new life. She has lots of opportunities if only she would take them.”
Dr. Sota recognizes that Angela’s struggle, and perhaps also the struggle of Ms. Jones, has a component of internalized racism. How should Dr. Sota proceed? Dr. Sota puts herself in Angela’s shoes: How does Angela see herself? Angela has light brown skin, and
The term internalized racism (IR) first appeared in the 1980s. IR was compared to the oppression of black people in the 1800s: “The slavery that captures the mind and incarcerates the motivation, perception, aspiration, and identity in a web of anti-self images, generating a personal and collective self destruction, is more cruel than the shackles on the wrists and ankles.”1 According to Susanne Lipsky,2 IR “in African Americans manifests as internalizing stereotypes, mistrusting the self and other Blacks, and narrows one’s view of authentic Black culture.”
IR refers to the internalization and acceptance of the dominant white culture’s actions and beliefs, while rejecting one’s own cultural background. There is a long history of negative cultural representations of African Americans in popular American culture, and IR has a detrimental impact on the emotional well-being of African Americans.3
IR is associated with poorer metabolic health4 and psychological distress, depression and anxiety,5-8 and decreased self-esteem.9 However, protective processes can reduce one’s response to risk and can be developed through the psychotherapeutic relationship.
Interventions at an individual, family, or community levels
Angela: Tell me about yourself: What type of person are you? How do you identify? How do you feel about yourself/your appearance/your language?
Tell me about your friends/family? What interests do you have?
“Tell me more” questions can reveal conflicted feelings, etc., even if Angela does not answer. A good therapist can talk about IR; even if Angela does not bring it up, it is important for the therapist to find language suitable for the age of the patient.
Dr. Sota has some luck with Angela, who nods her head but says little. Dr. Sota then turns to Ms. Jones and asks whether she can answer these questions, too, and rephrases the questions for an adult. Interviewing parents in the presence of their children gives Dr. Sota and Angela an idea of what is permitted to talk about in the family.
A therapist can also note other permissions in the family: How do Angela and her mother use language? Do they claim or reject words and phrases such as “angry black woman” and choose, instead, to use language to “fit in” with the dominant white culture?
Dr. Sota notices that Ms. Jones presents herself as keen to fit in with her new future husband’s life. She wants Angela to do likewise. Dr. Sota notices that Angela vacillates between wanting to claim her black identity and having to navigate what that means in this family (not a good thing) – and wanting to assimilate into white culture. Her peers fall into two separate groups: a set of black friends and a set of white friends. Her mother prefers that she see her white friends, mistrusting her black friends.
Dr. Sota’s supervisor suggests that she introduce IR more forcefully because this seems to be a major course of conflict for Angela and encourage a frank discussion between mother and daughter. Dr. Sota starts the next session in the following way: “I noticed last week that the way you each identify yourselves is quite different. Ms. Jones, you want Angela to ‘fit in’ and perhaps just embrace white culture, whereas Angela, perhaps you vacillate between a white identity and a black identity?”
The following questions can help Dr. Sota elicit IR:
- What information about yourself would you like others to know – about your heritage, country of origin, family, class background, and so on?
- What makes you proud about being a member of this group, and what do you love about other members of this group?
- What has been hard about being a member of this group, and what don’t you like about others in this group?
- What were your early life experiences with people in this group? How were you treated? How did you feel about others in your group when you were young?
At a community level, family workshops support positive cultural identities that strengthen family functioning and reducing behavioral health risks. In a study of 575 urban American Indian (AI) families from diverse tribal backgrounds, the AI families who participated in such a workshop had significant increases in their ethnic identity, improved sense of spirituality, and a more positive cultural identification. The workshops provided culturally adaptive parenting interventions.10
IR is a serious determinant of both physical and mental health. Assessment of IR can be done using rating scales, such as the Nadanolitization Scale11 or the Internalized Racial Oppression Scale.12 IR also can also be assessed using a more formalized interview guide, such as the DSM-5 Cultural Formulation Interview (CFI).13 This 16-question interview guide helps behavioral health providers better understand the way service users and their social networks (e.g., families, friends) understand what is happening to them and why, as well as the barriers they experience, such as racism, discrimination, stigma, and financial stressors.
Individuals’ cultures and experiences have a profound impact on their understanding of their symptoms and their engagement in care. The American Psychiatric Association considers it to be part of mental health providers’ duty of care to engage all individuals in culturally relevant conversations about their past experiences and care expectations. More relevant, I submit that you cannot treat someone without having made this inquiry. A cultural assessment improves understanding but also shifts power relationships between providers and patients. The DSM-5 CFI and training guides are widely available and provide additional information for those who want to improve their cultural literacy.
Conclusion
Internalized racism is the component of racism that is the most difficult to discern. Psychiatrists and mental health professionals are uniquely poised to address IR, and any subsequent internal conflict and identity difficulties. Each program, office, and clinic can easily find the resources to do this through the APA. If you would like help providing education, contact me at alisonheru@gmail.com.
References
1. Akbar N. J Black Studies. 1984. doi: 10.11771002193478401400401.
2. Lipsky S. Internalized Racism. Seattle: Rational Island Publishers, 1987.
3. Williams DR and Mohammed SA. Am Behav Sci. 2013 May 8. doi: 10.1177/00027642134873340.
4. DeLilly CR and Flaskerud JH. Issues Ment Health Nurs. 2012 Nov;33(11):804-11.
5. Molina KM and James D. Group Process Intergroup Relat. 2016 Jul;19(4):439-61.
6. Szymanski D and Obiri O. Couns Psychologist. 2011;39(3):438-62.
7. Carter RT et al. J Multicul Couns Dev. 2017 Oct 5;45(4):232-59.
8. Mouzon DM and McLean JS. Ethn Health. 2017 Feb;22(1):36-48.
9. Szymanski DM and Gupta A. J Couns Psychol. 2009;56(1):110-18.
10. Kulis SS et al. Cultural Diversity and Ethnic Minority Psychol. 2019. doi: 10.1037/cpd000315.
11. Taylor J and Grundy C. “Measuring black internalization of white stereotypes about African Americans: The Nadanolization Scale.” In: Jones RL, ed. Handbook of Tests and Measurements of Black Populations. Hampton, Va.: Cobb & Henry, 1996.
12. Bailey T-K M et al. J Couns Psychol. 2011 Oct;58(4):481-93.
13. American Psychiatric Association. Cultural Formulation Interview. DSM-5. American Psychiatric Association Publishing: Arlington, Va. 2013.
Various aspects about the case described above have been changed to protect the clinician’s and patients’ identities. Thanks to the following individuals for their contributions to this article: Suzanne Huberty, MD, and Shiona Heru, JD.
Dr. Heru is professor of psychiatry at the University of Colorado at Denver, Aurora. She is editor of “Working With Families in Medical Settings: A Multidisciplinary Guide for Psychiatrists and Other Health Professionals” (Routledge, 2013). She has no conflicts of interest to disclose.
Calculations of an academic hospitalist
The term “academic hospitalist” has come to mean more than a mere affiliation to an academic medical center (AMC). Academic hospitalists perform various clinical roles like staffing house staff teams, covering nonteaching services, critical care services, procedure teams, night services, medical consultation, and comanagement services.

Over the last decade, academic hospitalists have successfully managed many nonclinical roles in areas like research, medical unit leadership, faculty development, faculty affairs, quality, safety, informatics, utilization review, clinical documentation, throughput, group management, hospital administration, and educational leadership. The role of an academic hospital is as clear as a chocolate martini these days. Here we present some recent trends in academic hospital medicine.
Compensation
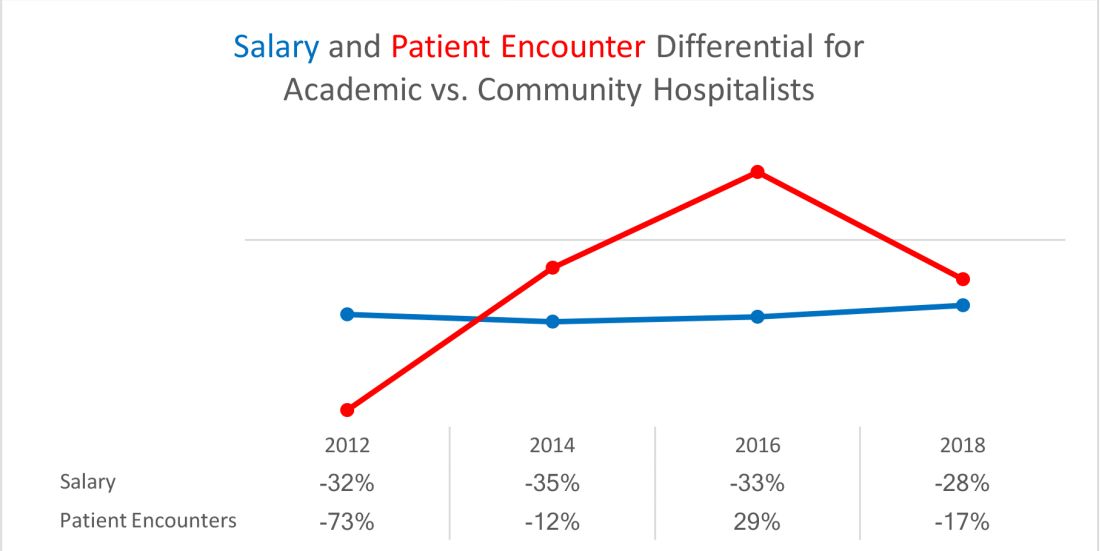
From SHM’s State of Hospital Medicine report (SoHM)2014 to 2018 data, the median compensation for U.S. academic hospitalists has risen by an average of 5.15% every year, although increases vary by rank.1 From 2016 to 2018, clinical instructors saw the most significant growth, 11.23% per year, suggesting a need to remain competitive for junior hospitalists. Compensation also varies by geographic area, with the Southern region reporting the highest compensation. Over the last decade, academic hospitalists received, on average, a 28%-35% lower salary, compared with community hospitalists.
Patient population and census
Lower patient encounters and compensation of the academic hospitalists poses the chicken or the egg dilemma. In the 2018 SoHM report, academic hospitalists had an average of 17% fewer encounters. Of note, AMC patients tend to have higher complexity, as measured by the Case Mix Index (CMI – the average diagnosis-related group weight of a hospital).2 A higher CMI is a surrogate marker for the diagnostic diversity, clinical complexity, and resource needs of the patient population in the hospital.
Productivity and financial metrics
The financial bottom line is a critical aspect, and as a report in the Journal of Hospital Medicine described, all health care executives look at business metrics while making decisions.3 Below are some significant academic and community comparisons from SoHM 2018.
- Collections, encounters, and wRVUs (work relative value units) were highly correlated. All of them were lower for academic hospitalists, corroborating the fact that they see a smaller number of patients. Clinical full-time equivalents (cFTE) is a vernacular of how much of the faculty time is devoted to clinical activities. The academic data from SoHM achieves the same target, as it is standardized to 100% billable clinical activity, so the fact that many academic hospitalists do not work a full-time clinical schedule is not a factor in their lower production.
- Charges had a smaller gap likely because of sicker patients in AMCs. The higher acuity difference can also explain 12% higher wRVU/encounter for academic hospitalists.
- The wRVU/encounter ratio can indicate a few patterns: high acuity of patients in AMCs, higher levels of evaluation and management documentation, or both. As the encounters and charges have the same percentage differences, we would place our bets on the former.
- Compensation per encounter and compensation per wRVU showed that academic hospitalists do get a slight advantage.
CMI and wRVUs
Although the SoHM does not capture information on patient acuity or CMI, we speculate that the relationship between CMI and wRVUs may be more or less linear at lower levels of acuity. However, once level III E/M billing is achieved (assuming there is no critical care provided), wRVUs/encounter plateau, even as acuity continues to increase. This plateau effect may be seen more often in high-acuity AMC settings than in community hospitals.
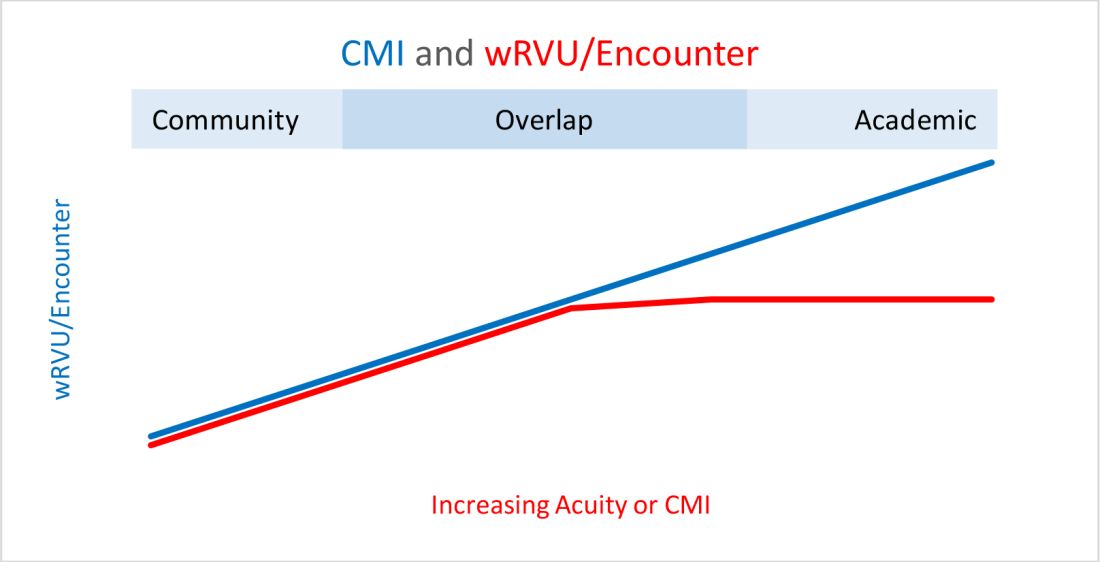
So, in our opinion, compensation models based solely on wRVU production would not do justice for hospitalists in AMC settings since these models would fail to capture the extra work involved with very-high-acuity patients. SoHM 2018 shows the financial support per wRVU for AMC is $45.81, and for the community is $41.28, an 11% difference. We think the higher financial support per wRVU for academic practices may be related to the lost wRVU potential of caring for very-high-acuity patients.
Conclusion
In an academic setting, hospitalists are reforming the field of hospital medicine and defining the ways we could deliver care. They are the pillars of collaboration, education, research, innovation, quality, and safety. It would be increasingly crucial for academic hospitalist leaders to use comparative metrics from SoHM to advocate for their group. The bottom line can be explained by the title of the qualitative study in JHM referenced above: “Collaboration, not calculation.”3

Dr. Chadha is division chief for the division of hospital medicine at the University of Kentucky Healthcare, Lexington. He actively leads efforts of recruiting, scheduling, practice analysis, and operation of the group. He is a first-time member of the practice analysis committee. Ms. Dede is division administrator for the division of hospital medicine at the University of Kentucky Healthcare. She prepares and manages budgets, liaisons with the downstream revenue teams, and contributes to the building of academic compensation models. She is serving in the practice administrators committee for the second year and is currently vice chair of the Executive Council for the Practice Administrators special interest group.
References
1. State of Hospital Medicine Report. https://www.hospitalmedicine.org/practice-management/shms-state-of-hospital-medicine/
2. Deloitte Center for Health Solutions. Academic Medical Centers: Joining forces with community providers for broad benefits and positive outcomes. 2015. https://www2.deloitte.com/us/en/pages/life-sciences-and-health-care/articles/academic-medical-centers-consolidation.html
3. White AA et al. Collaboration, not calculation: A qualitative study of how hospital executives value hospital medicine groups. J Hosp Med. 2019;14(10):662‐7.
The term “academic hospitalist” has come to mean more than a mere affiliation to an academic medical center (AMC). Academic hospitalists perform various clinical roles like staffing house staff teams, covering nonteaching services, critical care services, procedure teams, night services, medical consultation, and comanagement services.
Over the last decade, academic hospitalists have successfully managed many nonclinical roles in areas like research, medical unit leadership, faculty development, faculty affairs, quality, safety, informatics, utilization review, clinical documentation, throughput, group management, hospital administration, and educational leadership. The role of an academic hospital is as clear as a chocolate martini these days. Here we present some recent trends in academic hospital medicine.
Compensation
From SHM’s State of Hospital Medicine report (SoHM)2014 to 2018 data, the median compensation for U.S. academic hospitalists has risen by an average of 5.15% every year, although increases vary by rank.1 From 2016 to 2018, clinical instructors saw the most significant growth, 11.23% per year, suggesting a need to remain competitive for junior hospitalists. Compensation also varies by geographic area, with the Southern region reporting the highest compensation. Over the last decade, academic hospitalists received, on average, a 28%-35% lower salary, compared with community hospitalists.
Patient population and census
Lower patient encounters and compensation of the academic hospitalists poses the chicken or the egg dilemma. In the 2018 SoHM report, academic hospitalists had an average of 17% fewer encounters. Of note, AMC patients tend to have higher complexity, as measured by the Case Mix Index (CMI – the average diagnosis-related group weight of a hospital).2 A higher CMI is a surrogate marker for the diagnostic diversity, clinical complexity, and resource needs of the patient population in the hospital.
Productivity and financial metrics
The financial bottom line is a critical aspect, and as a report in the Journal of Hospital Medicine described, all health care executives look at business metrics while making decisions.3 Below are some significant academic and community comparisons from SoHM 2018.
- Collections, encounters, and wRVUs (work relative value units) were highly correlated. All of them were lower for academic hospitalists, corroborating the fact that they see a smaller number of patients. Clinical full-time equivalents (cFTE) is a vernacular of how much of the faculty time is devoted to clinical activities. The academic data from SoHM achieves the same target, as it is standardized to 100% billable clinical activity, so the fact that many academic hospitalists do not work a full-time clinical schedule is not a factor in their lower production.
- Charges had a smaller gap likely because of sicker patients in AMCs. The higher acuity difference can also explain 12% higher wRVU/encounter for academic hospitalists.
- The wRVU/encounter ratio can indicate a few patterns: high acuity of patients in AMCs, higher levels of evaluation and management documentation, or both. As the encounters and charges have the same percentage differences, we would place our bets on the former.
- Compensation per encounter and compensation per wRVU showed that academic hospitalists do get a slight advantage.
CMI and wRVUs
Although the SoHM does not capture information on patient acuity or CMI, we speculate that the relationship between CMI and wRVUs may be more or less linear at lower levels of acuity. However, once level III E/M billing is achieved (assuming there is no critical care provided), wRVUs/encounter plateau, even as acuity continues to increase. This plateau effect may be seen more often in high-acuity AMC settings than in community hospitals.
So, in our opinion, compensation models based solely on wRVU production would not do justice for hospitalists in AMC settings since these models would fail to capture the extra work involved with very-high-acuity patients. SoHM 2018 shows the financial support per wRVU for AMC is $45.81, and for the community is $41.28, an 11% difference. We think the higher financial support per wRVU for academic practices may be related to the lost wRVU potential of caring for very-high-acuity patients.
Conclusion
In an academic setting, hospitalists are reforming the field of hospital medicine and defining the ways we could deliver care. They are the pillars of collaboration, education, research, innovation, quality, and safety. It would be increasingly crucial for academic hospitalist leaders to use comparative metrics from SoHM to advocate for their group. The bottom line can be explained by the title of the qualitative study in JHM referenced above: “Collaboration, not calculation.”3
Dr. Chadha is division chief for the division of hospital medicine at the University of Kentucky Healthcare, Lexington. He actively leads efforts of recruiting, scheduling, practice analysis, and operation of the group. He is a first-time member of the practice analysis committee. Ms. Dede is division administrator for the division of hospital medicine at the University of Kentucky Healthcare. She prepares and manages budgets, liaisons with the downstream revenue teams, and contributes to the building of academic compensation models. She is serving in the practice administrators committee for the second year and is currently vice chair of the Executive Council for the Practice Administrators special interest group.
References
1. State of Hospital Medicine Report. https://www.hospitalmedicine.org/practice-management/shms-state-of-hospital-medicine/
2. Deloitte Center for Health Solutions. Academic Medical Centers: Joining forces with community providers for broad benefits and positive outcomes. 2015. https://www2.deloitte.com/us/en/pages/life-sciences-and-health-care/articles/academic-medical-centers-consolidation.html
3. White AA et al. Collaboration, not calculation: A qualitative study of how hospital executives value hospital medicine groups. J Hosp Med. 2019;14(10):662‐7.
Relapsing MS: Lower disability progression in long-term users of fingolimod
Key clinical point: Long-term exposure to fingolimod is associated with lower disability progression in patients with relapsing multiple sclerosis (MS).
Major finding: The high (≥8 years) vs. low (<8 years) exposure groups showed a smaller increase in the mean Expanded Disability Status Scale (+0.55 vs. +1.21) and lower frequencies of disability progression (34.7% vs. 56.1%; P less than .01) and wheelchair use (4.9% vs. 16.9%; P less than .0276) at 10 years.
Study details: ACROSS was a cross-sectional follow-up study of patients with relapsing MS enrolled in a phase 2 proof-of-concept study. Disability outcomes were assessed in patients grouped as per fingolimod exposure: high exposure (n=104) and low exposure (n=71).
Disclosures: The study was funded by Novartis Pharma AG, Basel, Switzerland. Amin Azmon and Davorka Tomic are employees of Novartis. The other authors reported relationships with multiple pharmaceutical companies.
Citation: Derfuss T et al. Mult Scler J Exp Transl Clin. 2020 Mar 30. doi: 10.1177/2055217320907951.
Obesity tied to accelerated retinal atrophy in MS
Key clinical point: Elevated body mass index (BMI) is independently associated with an accelerated rate of ganglion cell+inner plexiform layer (GCIPL) atrophy in patients with multiple sclerosis (MS).
Major findings: Obese (n=146; BMI, ≥30 kg/m2) vs. normal weight (n=214; BMI, 18.5-24.9 kg/m2) patients showed accelerated rate of GCIPL atrophy (−0.57%/year vs. −0.42%/year; P = .012). Atrophy rates were not significantly different between overweight (n=153; BMI, 25-29.9 kg/m2) and normal weight patients (−0.47%/year vs. −0.42%/year; P = .41). GCIPL atrophy rate accelerated by −0.011% per year with each 1 kg/m2 higher BMI (P =.003).
Study details: This observational study included 522 patients with MS from Johns Hopkins MS Center who were followed with retinal imaging for a median of 4.4 years.
Disclosures: The study was funded by the National MS Society, Race to Erase MS, and NIH/NINDS. The presenting author had no disclosures. One coauthor reported receiving support from the Race to Erase MS foundation.
Citation: Filippatou AG et al. Mult Scler. 2020 Apr 16. doi: 10.1177/1352458519900942.