User login
OA is underrepresented in the medical literature
TORONTO – Osteoarthritis research doesn’t get nearly the respect it deserves in the medical literature, Elizabeth M. Badley, PhD, asserted at the OARSI 2019 World Congress.

“Osteoarthritis is by far the most common type of arthritis. There are easily 10 times more people who have osteoarthritis than any other joint disease, but when you look at the literature, the situation is kind of reversed. Osteoarthritis is brushed off by society to a degree,” she said at the meeting, sponsored by the Osteoarthritis Research Society International.
Dr. Bradley and colleagues performed a search of MEDLINE for 2007-2016, which turned up a total of 1,625 publications in 2016 on osteoarthritis, excluding those with an orthopedic surgery focus, compared with 10,904 results regarding the broader topic of joint diseases and 28,932 on musculoskeletal diseases.
The bottom line: “Progress is slow, and at this rate osteoarthritis will not be receiving the attention it deserves in our lifetime,” said Dr. Badley, of the department of epidemiology at the University of Toronto and a senior scientist at the Krembil Research Institute, also in Toronto.
The number of publications per year devoted to OA rose by a robust 88% during 2007-2016, while the number on OA not focused on orthopedic procedures grew by 65%. Both of these increases were greater than those for publications on musculoskeletal diseases and joint diseases overall, which were 41% and 51%, respectively. But the absolute number of OA publications was dwarfed by the numbers of those in the other search categories. For example, the number of publications on OA without an orthopedic surgery thrust was 985 in 2007, compared with 7,204 on joint diseases overall.
Among the striking findings of the investigators’ study of the medical literature was the disconnect between the amount of attention devoted to some of the joint-specific manifestations of OA and the actual prevalence of these conditions in the population. For example, the prevalence of hand OA in people living with OA was 52% according to the 2009 Survey on Living with Chronic Diseases in Canada, conducted by Statistics Canada, yet only 6.5% of the publications on OA in 2016 were devoted to hand/thumb OA. Similarly, the prevalence of spine OA was 52% among Canadians with OA, but only 4.3% of OA publications in 2016 focused on that topic. And while the number of publications devoted to elbow OA soared by a seemingly impressive 233% during the study period, the actual numbers were 3 publications in 2007 and 10 in 2016.
“Also, the average number of affected joints in people with osteoarthritis is four. Yet very, very few papers are about multijoint osteoarthritis. And when they do talk about multijoint osteoarthritis, they’re still only talking about hand/hip/knee. So we’re missing the bigger picture of osteoarthritis as a multijoint disease. We’re missing the spine, largely, as a part of osteoarthritis, and we’re missing the peripheral joints,” she said.
Dr. Badley reported having no financial conflicts regarding her study, conducted free of commercial support.
SOURCE: Badley EM et al. Osteoarthritis Cartilage. 2019 Apr;27(Suppl 1):S278, Abstract 393.
TORONTO – Osteoarthritis research doesn’t get nearly the respect it deserves in the medical literature, Elizabeth M. Badley, PhD, asserted at the OARSI 2019 World Congress.
“Osteoarthritis is by far the most common type of arthritis. There are easily 10 times more people who have osteoarthritis than any other joint disease, but when you look at the literature, the situation is kind of reversed. Osteoarthritis is brushed off by society to a degree,” she said at the meeting, sponsored by the Osteoarthritis Research Society International.
Dr. Bradley and colleagues performed a search of MEDLINE for 2007-2016, which turned up a total of 1,625 publications in 2016 on osteoarthritis, excluding those with an orthopedic surgery focus, compared with 10,904 results regarding the broader topic of joint diseases and 28,932 on musculoskeletal diseases.
The bottom line: “Progress is slow, and at this rate osteoarthritis will not be receiving the attention it deserves in our lifetime,” said Dr. Badley, of the department of epidemiology at the University of Toronto and a senior scientist at the Krembil Research Institute, also in Toronto.
The number of publications per year devoted to OA rose by a robust 88% during 2007-2016, while the number on OA not focused on orthopedic procedures grew by 65%. Both of these increases were greater than those for publications on musculoskeletal diseases and joint diseases overall, which were 41% and 51%, respectively. But the absolute number of OA publications was dwarfed by the numbers of those in the other search categories. For example, the number of publications on OA without an orthopedic surgery thrust was 985 in 2007, compared with 7,204 on joint diseases overall.
Among the striking findings of the investigators’ study of the medical literature was the disconnect between the amount of attention devoted to some of the joint-specific manifestations of OA and the actual prevalence of these conditions in the population. For example, the prevalence of hand OA in people living with OA was 52% according to the 2009 Survey on Living with Chronic Diseases in Canada, conducted by Statistics Canada, yet only 6.5% of the publications on OA in 2016 were devoted to hand/thumb OA. Similarly, the prevalence of spine OA was 52% among Canadians with OA, but only 4.3% of OA publications in 2016 focused on that topic. And while the number of publications devoted to elbow OA soared by a seemingly impressive 233% during the study period, the actual numbers were 3 publications in 2007 and 10 in 2016.
“Also, the average number of affected joints in people with osteoarthritis is four. Yet very, very few papers are about multijoint osteoarthritis. And when they do talk about multijoint osteoarthritis, they’re still only talking about hand/hip/knee. So we’re missing the bigger picture of osteoarthritis as a multijoint disease. We’re missing the spine, largely, as a part of osteoarthritis, and we’re missing the peripheral joints,” she said.
Dr. Badley reported having no financial conflicts regarding her study, conducted free of commercial support.
SOURCE: Badley EM et al. Osteoarthritis Cartilage. 2019 Apr;27(Suppl 1):S278, Abstract 393.
REPORTING FROM OARSI 2019
AMA announces final eight recipients of Reimagining Residency initiative
led by medical schools, residency programs, and health systems.
“After establishing a framework for creating the medical schools of the future, the AMA is now supporting innovation projects that will better align residency training with the evolving needs of patients and communities, as well as the workforce needs of the current and future health care system,” AMA CEO and Executive Vice President James L. Madara, MD, stated in a press release.
The projects include curricular innovations to address workforce shortages and address social determinants of health. Other projects will be developed within the framework of innovations and concepts developed and implemented in medical schools over the past 6 years by the AMA’s consortium. These projects include implementing competency-based programs and incorporating Health Systems Science into residency training.
The projects were chosen through a competitive grant process by an advisory panel made up of leading experts in medical education, and selection was based on how well each program met the goals of the initiative: improving the transition from medical school to residency, ensuring readiness for practice through modifications of residency curricula, and optimizing the learning environment to support well-being.
Each of the following projects will receive $1.8 million over 5 years:
- California Oregon Medical Partnership to Address Disparities in Rural Education and Health – Oregon Health & Science University, Portland, and the University of California, Davis
- Fully Integrated Readiness for Service Training: Enhancing the Continuum from Medical School to Residency to Practice – University of North Carolina at Chapel Hill
- NYU Transition to Residency Advantage – New York University
- Promotion in Place: Enhancing Trainee Well-Being and Patient Care Through Time-Variable Graduate Medical Education – Partners HealthCare System, Massachusetts General Hospital, and Brigham and Women’s Hospital, Boston
- Reimagining Residency: Ensuring Readiness for Practice Through Growing Interprofessional Partnerships to Advance Care and Education – Maine Medical Center, Portland
- Residency Training to Effectively Address Social Determinants of Health: Applying a Curricular Framework Across Four Primary Care Specialties – Montefiore Health System, New York
- The Graduate Medical Training “Laboratory”: An Innovative Program to Generate, Implement, and Evaluate Interventions to Improve Resident Burnout and Clinical Skill – Johns Hopkins University, Baltimore; Stanford (Calif.) University; and the University of Alabama at Birmingham
- The GOL2D Project (Goals of Life and Learning Delineated): Collaboration Across Academic Health Systems to Better Align GME with Learner, Patient, and Societal Needs – Vanderbilt University, Nashville, Tenn., and the University of Mississippi, Jackson
An additional three programs will receive a smaller $50,000 planning grant to expedite further exploration and development.
“As the health care landscape and technology rapidly evolve, the AMA will continue working with its community of innovation to drive the future of medicine by supporting significant redesign in physician training. Our goal is to ensure physicians are prepared to adapt, grow, and thrive at every stage of their training and career. Better prepared physicians will deliver more effective and equitable health care,” said Dr. Madara.
Mentoring during fellowship to improve career fit, decrease burnout, and optimize career satisfaction among young gastroenterologists
Introduction

Burnout in physicians has received significant attention within the past several years, particularly among trainees and early-career physicians. The subspecialties of gastroenterology and hepatology are not immune to burnout, with multiple studies indicating that early career gastroenterologists may be disproportionately affected, compared with their more-established counterparts.1-4 Although the drivers of depersonalization, emotional exhaustion, and a reduced sense of personal accomplishment among trainees and early-career gastroenterologists are not fully understood, maximizing career fit during the transition from fellowship into the first posttraining position has been promoted as a potential method to decrease burnout in this population.4,5
While most trainees enter gastroenterology fellowships with a set of predefined career goals, mentorship during fellowship can provide critical guidance along with exposure to new areas and career tracks that were not previously considered. In a survey of gastroenterology and transplant hepatology fellows, 94% of participants with a mentor reported that the mentor significantly influenced their career decision.6 Effective mentoring also has been identified as one possible method to decrease burnout among trainees.7,8
Formal mentoring in gastroenterology fellowship programs might decrease burnout through effectively identifying risk factors such as work hour violations or a lack of social support. Additionally, when fellows are being prepared for transition to their first positions as attending gastroenterologists, there is a critical opportunity to improve career fit and decrease burnout rates among early-career gastroenterologists. Making the correct choice of subsequent career path after fellowship might be a source of stress, but this should allow early-career gastroenterologists to maximize the time spent doing those activities they feel are the most rewarding. A formal mentoring system and an accessible career mentor can be invaluable in allowing the mentee to identify and select that position.
Career fit
The concept of career fit has been described as the ability of individuals to focus their effort on the aspect or aspects of their work that they find most meaningful.5 Multiple specialties have recognized the importance of career fit and the need to choose appropriately when selecting a position and career path upon completing fellowship. In one evaluation of faculty members from the department of medicine at a large academic medical center, those individuals who spent less than 20% of their time working on the activity that they found most meaningful were significantly more likely to demonstrate burnout.5
In a relatively short time period, gastroenterology fellows are required to gather multiple new skill sets, including functioning as a consultant, performing endoscopic procedures, and potentially gaining formal training in clinical, basic, or translational research methods. During this same period, an intense phase of self-assessment should begin, with one critical aim of training being to identify those factors most likely to lead to a long, satisfying career. The growth that occurs during fellowship may allow for the identification of a career track that is likely to be the most rewarding, such as a career as a clinical investigator, clinician educator, or in clinical practice. Importantly, the trainee must decide which career track will most likely lead to self-fulfillment, even if the chosen path does not align with a mentor or advisor. Additionally, self-assessment also may aid in the identification of a niche that an individual finds most intellectually stimulating, which may lead to an area of research or clinical expertise.
While the demonstrated relationship between career fit and burnout is only an association without demonstrated causation, this does merit further consideration. For the first time in most trainees’ careers, the position after fellowship represents an opportunity to choose a job as opposed to going through a “match” process. Therefore, the trainee must strongly consider the factors that will ultimately lead to career satisfaction. If a large disconnect is present between self-identified career goals and the actual tasks required within daily workflow, this may lead to burnout relatively early in a career. Perhaps more importantly, if an individual did not perform adequate self-reflection when choosing a career path or did not receive effective guidance from career mentors, this also might lead to decreased career satisfaction, poor career fit, and an increased risk for burnout as an early-career gastroenterologist.
The mentor’s role
Although a structured career mentoring program is in place within many gastroenterology training programs, other fellowships encourage the mentee to select from a pool of potential mentors. In many cases, trainees and early career gastroenterologists will benefit from building a mentorship team, including career mentor or mentors, research mentors, and other advisors.9
While the mentor-mentee relationship can be an extremely rewarding experience for both parties, the effective mentor must meet a high standard. Several qualities have been identified that will maximize the benefit of the mentor-mentee relationship for the trainee, including the mentor taking a selfless approach to the relationship, working to assist the mentee in choosing a career path that will be the most rewarding, and then aiding the mentee in making helpful connections to promote growth along that chosen path.9 A good mentors should inspire a mentees, but also should be willing to provide honest and at times critical feedback to ensure that mentees maximizes their potential and ultimately assume the appropriate career trajectory. Unbiased mentorship, as well as continued reevaluations of strengths, weaknesses, and career goals by the mentor and mentee, will ultimately offer an opportunity to ensure the best combination of career fit,5 work-life balance,10 and satisfaction with career choice.11
The mentor-mentee relationship after training is complete
Once a trainee has completed gastroenterology fellowship, another stressful transition to the role of an attending physician commences. It is critical that early-career gastroenterologists not only have confidence in the guidance that their mentor has provided to ensure appropriate career fit in their new role but also maintain these critical mentor-mentee relationships during this transition. A good mentor does not disappear because one phase of training is complete. The need for effective mentoring at the junior faculty level also is well recognized,12 and early-career gastroenterologists should continue to rely on established mentoring relationships when new decision points are encountered.
Depending on the career track of an early-career gastroenterologist, formal mentoring also may be offered in the new role as a junior faculty member.12 Additionally, external mentoring can exist within foundations or other subspecialty groups. One example of extramural mentoring is the Career Connection Program offered through the Crohn’s & Colitis Foundation’s Rising Educators Academics and Clinicians Helping IBD (REACH-IBD) platform. In this program, early-career gastroenterologists are selected and paired with national opinion leaders for one-on-one mentoring relationships. Such a program offers further opportunities for career growth, establishing connections within a smaller subspecialty of gastroenterology, and maximizing career fit.
Conclusion
In an era where the toll of burnout and other influences on early-career gastroenterologists are increasingly being recognized, the importance of career fit during the transition into the role of an attending should not be underestimated. In conjunction with appropriate self-reflection, unbiased and critical mentorship during fellowship can promote significant growth among trainees and allow for the ultimate selection of a career track or career path that will promote happiness, work-life balance, and long-term success as defined by the mentee.
Edward L. Barnes, MD, MPH, is with the Multidisciplinary Center for Inflammatory Bowel Diseases and the Center for Gastrointestinal Biology and Disease in the division of gastroenterology and hepatology at the University of North Carolina at Chapel Hill. Dr. Barnes reports no relevant disclosures.
References
1. Keswani RN et al. Am J Gastroenterol. 2011;106(10):1734-40.
2. Burke C et al. Am J Gastroenterol. 2017;112:S593-4.
3. DeCross AJ. AGA Perspectives. 2017.
4. Barnes EL et al. Dig Dis Sci. 2019;64(2):302-6.
5. Shanafelt TD et al. Arch Intern Med. 2009;169(10):990-5.
6. Ordway SM et al. Hepatol Commun. 2017;1(4):347-53.
7. Janko MR, Smeds MR. J Vasc Surg. 2019;69(4):1233-42.
8. Eckleberry-Hunt J et al. Acad Med. 2009;84(2):269-77.
9. Lieberman D. Gastroenterology. 2016;151(1):17-9.
10. Shanafelt TD et al. Mayo Clin Proc. 2015;90(12):1600-13.
11. Shanafelt TD et al. Ann Surg. 2009;250(3):463-71.
12. Shaheen NJ, Sandler RS. Gastroenterology. 2018;155(5):1293-7.
Introduction
Burnout in physicians has received significant attention within the past several years, particularly among trainees and early-career physicians. The subspecialties of gastroenterology and hepatology are not immune to burnout, with multiple studies indicating that early career gastroenterologists may be disproportionately affected, compared with their more-established counterparts.1-4 Although the drivers of depersonalization, emotional exhaustion, and a reduced sense of personal accomplishment among trainees and early-career gastroenterologists are not fully understood, maximizing career fit during the transition from fellowship into the first posttraining position has been promoted as a potential method to decrease burnout in this population.4,5
While most trainees enter gastroenterology fellowships with a set of predefined career goals, mentorship during fellowship can provide critical guidance along with exposure to new areas and career tracks that were not previously considered. In a survey of gastroenterology and transplant hepatology fellows, 94% of participants with a mentor reported that the mentor significantly influenced their career decision.6 Effective mentoring also has been identified as one possible method to decrease burnout among trainees.7,8
Formal mentoring in gastroenterology fellowship programs might decrease burnout through effectively identifying risk factors such as work hour violations or a lack of social support. Additionally, when fellows are being prepared for transition to their first positions as attending gastroenterologists, there is a critical opportunity to improve career fit and decrease burnout rates among early-career gastroenterologists. Making the correct choice of subsequent career path after fellowship might be a source of stress, but this should allow early-career gastroenterologists to maximize the time spent doing those activities they feel are the most rewarding. A formal mentoring system and an accessible career mentor can be invaluable in allowing the mentee to identify and select that position.
Career fit
The concept of career fit has been described as the ability of individuals to focus their effort on the aspect or aspects of their work that they find most meaningful.5 Multiple specialties have recognized the importance of career fit and the need to choose appropriately when selecting a position and career path upon completing fellowship. In one evaluation of faculty members from the department of medicine at a large academic medical center, those individuals who spent less than 20% of their time working on the activity that they found most meaningful were significantly more likely to demonstrate burnout.5
In a relatively short time period, gastroenterology fellows are required to gather multiple new skill sets, including functioning as a consultant, performing endoscopic procedures, and potentially gaining formal training in clinical, basic, or translational research methods. During this same period, an intense phase of self-assessment should begin, with one critical aim of training being to identify those factors most likely to lead to a long, satisfying career. The growth that occurs during fellowship may allow for the identification of a career track that is likely to be the most rewarding, such as a career as a clinical investigator, clinician educator, or in clinical practice. Importantly, the trainee must decide which career track will most likely lead to self-fulfillment, even if the chosen path does not align with a mentor or advisor. Additionally, self-assessment also may aid in the identification of a niche that an individual finds most intellectually stimulating, which may lead to an area of research or clinical expertise.
While the demonstrated relationship between career fit and burnout is only an association without demonstrated causation, this does merit further consideration. For the first time in most trainees’ careers, the position after fellowship represents an opportunity to choose a job as opposed to going through a “match” process. Therefore, the trainee must strongly consider the factors that will ultimately lead to career satisfaction. If a large disconnect is present between self-identified career goals and the actual tasks required within daily workflow, this may lead to burnout relatively early in a career. Perhaps more importantly, if an individual did not perform adequate self-reflection when choosing a career path or did not receive effective guidance from career mentors, this also might lead to decreased career satisfaction, poor career fit, and an increased risk for burnout as an early-career gastroenterologist.
The mentor’s role
Although a structured career mentoring program is in place within many gastroenterology training programs, other fellowships encourage the mentee to select from a pool of potential mentors. In many cases, trainees and early career gastroenterologists will benefit from building a mentorship team, including career mentor or mentors, research mentors, and other advisors.9
While the mentor-mentee relationship can be an extremely rewarding experience for both parties, the effective mentor must meet a high standard. Several qualities have been identified that will maximize the benefit of the mentor-mentee relationship for the trainee, including the mentor taking a selfless approach to the relationship, working to assist the mentee in choosing a career path that will be the most rewarding, and then aiding the mentee in making helpful connections to promote growth along that chosen path.9 A good mentors should inspire a mentees, but also should be willing to provide honest and at times critical feedback to ensure that mentees maximizes their potential and ultimately assume the appropriate career trajectory. Unbiased mentorship, as well as continued reevaluations of strengths, weaknesses, and career goals by the mentor and mentee, will ultimately offer an opportunity to ensure the best combination of career fit,5 work-life balance,10 and satisfaction with career choice.11
The mentor-mentee relationship after training is complete
Once a trainee has completed gastroenterology fellowship, another stressful transition to the role of an attending physician commences. It is critical that early-career gastroenterologists not only have confidence in the guidance that their mentor has provided to ensure appropriate career fit in their new role but also maintain these critical mentor-mentee relationships during this transition. A good mentor does not disappear because one phase of training is complete. The need for effective mentoring at the junior faculty level also is well recognized,12 and early-career gastroenterologists should continue to rely on established mentoring relationships when new decision points are encountered.
Depending on the career track of an early-career gastroenterologist, formal mentoring also may be offered in the new role as a junior faculty member.12 Additionally, external mentoring can exist within foundations or other subspecialty groups. One example of extramural mentoring is the Career Connection Program offered through the Crohn’s & Colitis Foundation’s Rising Educators Academics and Clinicians Helping IBD (REACH-IBD) platform. In this program, early-career gastroenterologists are selected and paired with national opinion leaders for one-on-one mentoring relationships. Such a program offers further opportunities for career growth, establishing connections within a smaller subspecialty of gastroenterology, and maximizing career fit.
Conclusion
In an era where the toll of burnout and other influences on early-career gastroenterologists are increasingly being recognized, the importance of career fit during the transition into the role of an attending should not be underestimated. In conjunction with appropriate self-reflection, unbiased and critical mentorship during fellowship can promote significant growth among trainees and allow for the ultimate selection of a career track or career path that will promote happiness, work-life balance, and long-term success as defined by the mentee.
Edward L. Barnes, MD, MPH, is with the Multidisciplinary Center for Inflammatory Bowel Diseases and the Center for Gastrointestinal Biology and Disease in the division of gastroenterology and hepatology at the University of North Carolina at Chapel Hill. Dr. Barnes reports no relevant disclosures.
References
1. Keswani RN et al. Am J Gastroenterol. 2011;106(10):1734-40.
2. Burke C et al. Am J Gastroenterol. 2017;112:S593-4.
3. DeCross AJ. AGA Perspectives. 2017.
4. Barnes EL et al. Dig Dis Sci. 2019;64(2):302-6.
5. Shanafelt TD et al. Arch Intern Med. 2009;169(10):990-5.
6. Ordway SM et al. Hepatol Commun. 2017;1(4):347-53.
7. Janko MR, Smeds MR. J Vasc Surg. 2019;69(4):1233-42.
8. Eckleberry-Hunt J et al. Acad Med. 2009;84(2):269-77.
9. Lieberman D. Gastroenterology. 2016;151(1):17-9.
10. Shanafelt TD et al. Mayo Clin Proc. 2015;90(12):1600-13.
11. Shanafelt TD et al. Ann Surg. 2009;250(3):463-71.
12. Shaheen NJ, Sandler RS. Gastroenterology. 2018;155(5):1293-7.
Opioid prescriptions declined 33% over 5 years
Fewer opioid retail prescriptions are being filled, according to a new report issued by the American Medical Association Opioid Task Force.

Opioid prescribing declined by 33% over a 5-year period based on the total number of opioid retail prescriptions filled. Total prescriptions declined from 251.8 million in 2013 to 168.8 million in 2018, according to the report.
The numbers come as the most recent data from the Centers for Disease Control and Prevention show a leveling of deaths involving prescription opioids. The CDC data were most recently updated in January 2019 and cover the period 1999-2017.
A closer look shows that deaths involving prescription opioids, but not other synthetic narcotics, peaked in 2011 and have generally declined since then. Deaths involving other synthetic narcotics, however, have been rising, offsetting the reduction and keeping the total number of deaths involving opioids relatively stable between 2016 and 2017.
Other data released by the AMA Opioid Task Force show that physicians are increasing their use of state-level prescription drug monitoring programs (PDMPs).
In 2017, there were 1.5 million physicians registered to use state PDMPs. That number rose to 1.97 million in 2019. And the physicians are using PDMPs. In 2018, physicians made 460 million PDMP queries, up 56% from 2017 and up 651% from 2014.
More education about opioid prescribing is being sought, with 700,000 physicians completing CME training and accessing other training related to opioid prescribing, pain management, screening for substance use disorders, and other related topics.
While the report does show positive trends, the task force is calling for more action, including more access to naloxone and better access to mental health treatment.
The report notes that more than 66,000 physicians and other health professionals have a federal waiver to prescribe buprenorphine, up more than 28,000 since 2016.
A number of policy recommendations are made in the report, including removing inappropriate administrative burdens or barriers that delay access to medications used in medication-assisted treatment (MAT); removing barriers to comprehensive pain care and rehabilitation programs, and reforming the civil and criminal justice system to help ensure access to high-quality, evidence-based care for opioid use disorder.
“We are at a crossroads in our nation’s efforts to end the opioid epidemic,” AMA Opioid Task Force Chair Patrice A. Harris, MD, stated in the report. “It is time to end delays and barriers to medication-assisted treatment – evidence based care proven to save lives; time for payers, [pharmacy benefit managers] and pharmacy chains to reevaluate and revise policies that restrict opioid therapy to patients based on arbitrary thresholds; and time to commit to helping all patients access evidence-based care for pain and substance use disorders.”
Dr. Harris continued: “Physicians must continue to demonstrate leadership, but unless these actions occur, the progress we are making will not stop patients from dying.”
Fewer opioid retail prescriptions are being filled, according to a new report issued by the American Medical Association Opioid Task Force.
Opioid prescribing declined by 33% over a 5-year period based on the total number of opioid retail prescriptions filled. Total prescriptions declined from 251.8 million in 2013 to 168.8 million in 2018, according to the report.
The numbers come as the most recent data from the Centers for Disease Control and Prevention show a leveling of deaths involving prescription opioids. The CDC data were most recently updated in January 2019 and cover the period 1999-2017.
A closer look shows that deaths involving prescription opioids, but not other synthetic narcotics, peaked in 2011 and have generally declined since then. Deaths involving other synthetic narcotics, however, have been rising, offsetting the reduction and keeping the total number of deaths involving opioids relatively stable between 2016 and 2017.
Other data released by the AMA Opioid Task Force show that physicians are increasing their use of state-level prescription drug monitoring programs (PDMPs).
In 2017, there were 1.5 million physicians registered to use state PDMPs. That number rose to 1.97 million in 2019. And the physicians are using PDMPs. In 2018, physicians made 460 million PDMP queries, up 56% from 2017 and up 651% from 2014.
More education about opioid prescribing is being sought, with 700,000 physicians completing CME training and accessing other training related to opioid prescribing, pain management, screening for substance use disorders, and other related topics.
While the report does show positive trends, the task force is calling for more action, including more access to naloxone and better access to mental health treatment.
The report notes that more than 66,000 physicians and other health professionals have a federal waiver to prescribe buprenorphine, up more than 28,000 since 2016.
A number of policy recommendations are made in the report, including removing inappropriate administrative burdens or barriers that delay access to medications used in medication-assisted treatment (MAT); removing barriers to comprehensive pain care and rehabilitation programs, and reforming the civil and criminal justice system to help ensure access to high-quality, evidence-based care for opioid use disorder.
“We are at a crossroads in our nation’s efforts to end the opioid epidemic,” AMA Opioid Task Force Chair Patrice A. Harris, MD, stated in the report. “It is time to end delays and barriers to medication-assisted treatment – evidence based care proven to save lives; time for payers, [pharmacy benefit managers] and pharmacy chains to reevaluate and revise policies that restrict opioid therapy to patients based on arbitrary thresholds; and time to commit to helping all patients access evidence-based care for pain and substance use disorders.”
Dr. Harris continued: “Physicians must continue to demonstrate leadership, but unless these actions occur, the progress we are making will not stop patients from dying.”
New help for peanut allergies
Breakthrough therapy holds potential
When it comes to anaphylaxis episodes leading to pediatric intensive care–unit stays, peanuts are the most common culprit. Now the results of a recent clinical trial may lead to approval of the first oral medication to ameliorate reactions in children with severe peanut allergies.

After 6 months of treatment and 6 months of maintenance therapy, two-thirds of the 372 children who received this treatment could ingest the equivalent of two peanuts without allergic symptoms. Just 4% of the 124 children given a placebo powder were able to consume that amount of peanut without reacting. The treatment was not effective for the small number of adults in the study.
This trial of the drug, called AR101 and developed by Aimmune Therapeutics, was published in Nov. 2018 in the New England Journal of Medicine. The company has submitted a biologics license application to the U.S. Food and Drug Administration, and because the drug has been designated a breakthrough therapy, it will go through an accelerated approval process. It could be on the market by the end of 2019.
Reference
1. Rabin RC. New Peanut Allergy Drug Shows ‘Lifesaving’ Potential. New York Times. Nov. 18, 2018. https://www.nytimes.com/2018/11/18/well/live/new-peanut-allergy-drug-shows-lifesaving-potential.html. Accessed Nov. 26, 2018.
Breakthrough therapy holds potential
Breakthrough therapy holds potential
When it comes to anaphylaxis episodes leading to pediatric intensive care–unit stays, peanuts are the most common culprit. Now the results of a recent clinical trial may lead to approval of the first oral medication to ameliorate reactions in children with severe peanut allergies.
After 6 months of treatment and 6 months of maintenance therapy, two-thirds of the 372 children who received this treatment could ingest the equivalent of two peanuts without allergic symptoms. Just 4% of the 124 children given a placebo powder were able to consume that amount of peanut without reacting. The treatment was not effective for the small number of adults in the study.
This trial of the drug, called AR101 and developed by Aimmune Therapeutics, was published in Nov. 2018 in the New England Journal of Medicine. The company has submitted a biologics license application to the U.S. Food and Drug Administration, and because the drug has been designated a breakthrough therapy, it will go through an accelerated approval process. It could be on the market by the end of 2019.
Reference
1. Rabin RC. New Peanut Allergy Drug Shows ‘Lifesaving’ Potential. New York Times. Nov. 18, 2018. https://www.nytimes.com/2018/11/18/well/live/new-peanut-allergy-drug-shows-lifesaving-potential.html. Accessed Nov. 26, 2018.
Fixed-duration venetoclax-obinutuzumab superior to standard CLL therapy
CHICAGO – A fixed-duration venetoclax-obinutuzumab regimen is safe and provides a superior outcome versus standard chlorambucil-obinutuzumab in elderly patients with untreated chronic lymphocytic leukemia (CLL) and comorbidities, results of a randomized phase 3 trial showed.
At 24 months, progression-free survival was 88.2% for the venetoclax-obinutuzumab regimen, versus 64.1% for chlorambucil-obinutuzumab (hazard ratio, 0.35; 95% confidence interval, 0.23-0.53; P less than .0001) in CLL-14, an open-label, multinational trial presented at the annual meeting of the American Society of Clinical Oncology.
The regimen, given for just 12 28-day cycles, also achieved the highest rate of minimal residual disease (MRD)-negative responses ever seen in a randomized prospective CLL study, according to investigator Kirsten Fischer, MD, of the University of Cologne in Germany.
“We really think that these unprecedented MRD negativity levels will eventually translate into an improved overall survival,” Dr. Fischer said during an oral abstract presentation.
Matthew Steven Davids, MD, of Dana-Farber Cancer Institute/Harvard Medical School, Boston, said venetoclax plus obinutuzumab offers the potential for 1-year, time-limited therapy, which limits concerns over long-term adherence and has the potential for cost savings, should the therapy prove to be highly durable with further follow-up.
“A limitation of the study is that the comparator arm – chlorambucil plus obinutuzumab – is directly applicable to only a relatively small subset of our older and frailer CLL patients,” Dr. Davids said during a podium discussion of the results.
“But nonetheless, venetoclax plus obinutuzumab is a promising, time-limited regimen, and CLL14 is an immediately practice-changing study for frontline CLL treatment,” he added.
The regimen stands in contrast to ibrutinib, which offers durable responses but requires continuous dosing, and FCR (fludarabine, cyclophosphamide, and rituximab), a time-limited therapy with curative potential that is restricted to younger patients with IGHV-mutated CLL, according to Dr. Davids.
In CLL-14, 432 patients were randomized 1:1 to receive venetoclax-obinutuzumab for six cycles followed by venetoclax for six cycles, or chlorambucil-obinutuzumab for six cycles followed by chlorambucil for six cycles. The median age was 72 years in the venetoclax-obinutuzumab arm and 71 years in the chlorambucil-obinutuzumab arm.
The overall response rate was 85% for venetoclax-obinutuzumab and 71% for chlorambucil-obinutuzumab (P = .0007), Dr. Fischer reported at the meeting.
The improvement in progression-free survival seen in the overall study population was also seen in patients with TP53 deletions or mutations, and in those with unmutated IGHV, Dr. Fischer reported.
Rates of MRD negativity in peripheral blood were 76% versus 35% for the venetoclax- and chlorambucil-containing combinations, respectively (P less than .001), and similarly, MRD negativity in bone marrow was 57% versus 17% (P less than .001), she said.
There were no significant differences in the rates of grade 3 or 4 neutropenia, which occurred in 52.8% of the venetoclax–obinutuzumab treated patients and 48.1% of the chlorambucil-obinutuzumab treated patients, or in grade 3 or 4 infections, which occurred in 17.5% and 15.0%, respectively, according to a report, published simultaneously in the New England Journal of Medicine (2019;380:2225-36).
Likewise, all-cause mortality was not significantly different between the arms, at 9.3% and 7.9%, respectively.
F. Hoffmann-La Roche and AbbVie supported the study. Dr. Fischer reported travel, accommodations, or expenses from Roche in her abstract disclosure.
SOURCE: Fischer K et al. ASCO 2019, Abstract 7502.
REPORTING FROM ASCO 2019
Diverse vaginal microbiome may signal risk for preterm birth
in an analysis of approximately 12,000 samples, according to a study published in Nature Medicine.

Preterm births, defined as less than 37 weeks’ gestation, remain the second most common cause of neonatal death worldwide, but few strategies exist to prevent and predict preterm birth (PTB) wrote Jennifer M. Fettweis, MD, of Virginia Commonwealth University, Richmond, and her colleagues. In the United States, women of African ancestry are at significantly greater risk for PTB.
A highly diverse vaginal microbiome is thought to be associated with an increased risk of inflammation, infection, and PTB, “however, many asymptomatic healthy women have diverse vaginal microbiota,” the researchers said.
To identify vaginal microbiota distinct to women who experienced PTB, the researchers analyzed data from the Multi-Omic Microbiome Study: Pregnancy Initiative (MOMS-PI), part of the National Institutes of Health–sponsored Integrative Human Microbiome Project. The MOMS-PI study included 12,039 samples of vaginal flora from 597 pregnancies; the analysis included 45 singleton pregnancies that met the criteria for spontaneous PTB (23-36 weeks, 6 days of gestation) and 90 case-matched full-term singleton pregnancies (greater than or equal to 39 weeks). Approximately 78% of the women were of African descent in both groups, and their average age was 26 years in both groups.
Overall, the diversity of the vaginal microbiome was greater among women who experienced PTB, compared with term birth (TB). Women who experienced PTB had less Lactobacillus crispatus, but more bacterial vaginosis–associated bacterium-1 (BVAB1), Prevotella cluster 2, and Sneathia amnii, compared with TB women.
Of note, vaginal cytokine data showed that proinflammatory cytokines, which may be associated with the induction of labor, may be prompted by inflammation in the vaginal microbiome, Dr. Fettweis and her associates said. “We observed that vaginal IP-10/CXCL10 levels were inversely correlated with BVAB1 in PTB, inversely correlated with L. crispatus in TB, and positively correlated with L. iners in TB, suggesting complex host-microbiome interactions in pregnancy,” they said.
“Further studies are needed to determine whether the signatures of PTB reported in the present study replicate in other cohorts of women of African ancestry, to examine whether the observed differences in vaginal microbiome composition between women of different ancestries has a direct causal link to the ethnic and racial disparities in PTB rates, and to establish whether population-specific microbial markers can be ultimately integrated into a generalizable spectrum of vaginal microbiome states linked to the risk for PTB,” Dr. Fettweis and her associates said.
In a companion study also published in Nature Medicine, Myrna G. Serrano, MD, also of Virginia Commonwealth University, and her colleagues as part of the MOMS-PI initially determined that vaginal microbiome profiles varied between 613 pregnant and 1,969 nonpregnant women in that “pregnant women had significantly higher prevalence of the four most common Lactobacillus vagitypes (L. crispatus, L. iners, L. gasseri, and L. jensenii) and a commensurately lower prevalence of vagitypes dominated by other taxa.” The primary driver of the differences was L. iners.
They then compared vaginal microbiome data from 300 pregnant and 300 nonpregnant case-matched women of African, Hispanic, or European ancestry, as well as 90 pregnant women (49 of African ancestry and 41 of European) ancestry.
In the subset of 300 pregnant and 300 nonpregnant women, the vaginal microbiome of the pregnant women overall became more dominated by Lactobacillus early in pregnancy. Further stratification by race showed that pregnant women of African and Hispanic ancestry had significantly higher levels of four types of Lactobacillus than their nonpregnant counterparts, but no significant difference was seen between pregnant and nonpregnant women of European ancestry.
“It appears that changes occurring during pregnancy may render the reproductive tracts of women of all racial backgrounds more hospitable to taxa of Lactobacillus and less favorable for Gardnerella vaginalis and other taxa associated with BV [bacterial vaginosis] and dysbiosis,” the researchers said.
“Interestingly, BVAB1, which has been associated with dysbiotic vaginal conditions and risk of PTB, and which is present as a major vagitype largely in women of African ancestry, is not noticeably decreased in prevalence in pregnancy,” Dr. Serrano and her associates said. “Thus, BVAB1, for reasons yet to be determined, is apparently resistant to factors sculpting the microbiome in pregnant women, possibly explaining in part the enhanced risk for PTB experienced by women of African ancestry.”
In a look at the 49 pregnant women of African ancestry and 41 of European ancestry, those of African ancestry had “significantly lower representation of the L. crispatus, L. gasseri and L. jensenii vagitypes, and higher representation of L. iners and BVAB1 vagitypes. Variability in women of African ancestry was driven by BVAB1 and L. iners, whereas variability in women of non-African ancestry was driven by L. crispatus and L. iners. Again, pregnancy had no significant effect on prevalence of the BVAB1 vagitype. Prevalence of Lactobacillus-dominated profiles in women of African ancestry was lower in the first than in later trimesters, whereas women of European ancestry had a higher prevalence of Lactobacillus vagitypes throughout pregnancy.”
The presence of vaginal microbiome profiles associated with adverse pregnancy outcomes highlights the need for further studies that take advantage of this information, Dr. Serrano and her associates said. “That the vaginal microbiomes known to confer higher risk of poor health and adverse outcomes of pregnancy are more highly associated with women of African and Hispanic ancestry, but that pregnancy tends to drive these microbiomes toward more favorable microbiota, suggests that an external intervention that favors this trend might be beneficial for these populations,” they concluded. “What remains is to verify the most favorable microbiome and the most effective strategy for intervention.”
Dr. Fettweis had no financial conflicts to disclose; two coauthors are full-time employees at Pacific Biosciences. Dr. Serrano and her coauthors had no relevant financial disclosures. Dr. Serrano’s study received grants from the National Institutes of Health and other sources, as well as support from the Common Fund, the National Center for Complementary and Integrative Health, the Office of Research on Women’s Health, the Eunice Kennedy Shriver National Institute of Child Health and Human Development, and the National Institute of Allergy and Infectious Diseases.
SOURCES: Fettweis J et al. Nature Medicine 2019 May 29. doi: 10.1038/s41591-019-0450-2; Serrano M et al. Nature Medicine. 2019 May 29. doi: 10.1038/s41591-019-0465-8.
in an analysis of approximately 12,000 samples, according to a study published in Nature Medicine.
Preterm births, defined as less than 37 weeks’ gestation, remain the second most common cause of neonatal death worldwide, but few strategies exist to prevent and predict preterm birth (PTB) wrote Jennifer M. Fettweis, MD, of Virginia Commonwealth University, Richmond, and her colleagues. In the United States, women of African ancestry are at significantly greater risk for PTB.
A highly diverse vaginal microbiome is thought to be associated with an increased risk of inflammation, infection, and PTB, “however, many asymptomatic healthy women have diverse vaginal microbiota,” the researchers said.
To identify vaginal microbiota distinct to women who experienced PTB, the researchers analyzed data from the Multi-Omic Microbiome Study: Pregnancy Initiative (MOMS-PI), part of the National Institutes of Health–sponsored Integrative Human Microbiome Project. The MOMS-PI study included 12,039 samples of vaginal flora from 597 pregnancies; the analysis included 45 singleton pregnancies that met the criteria for spontaneous PTB (23-36 weeks, 6 days of gestation) and 90 case-matched full-term singleton pregnancies (greater than or equal to 39 weeks). Approximately 78% of the women were of African descent in both groups, and their average age was 26 years in both groups.
Overall, the diversity of the vaginal microbiome was greater among women who experienced PTB, compared with term birth (TB). Women who experienced PTB had less Lactobacillus crispatus, but more bacterial vaginosis–associated bacterium-1 (BVAB1), Prevotella cluster 2, and Sneathia amnii, compared with TB women.
Of note, vaginal cytokine data showed that proinflammatory cytokines, which may be associated with the induction of labor, may be prompted by inflammation in the vaginal microbiome, Dr. Fettweis and her associates said. “We observed that vaginal IP-10/CXCL10 levels were inversely correlated with BVAB1 in PTB, inversely correlated with L. crispatus in TB, and positively correlated with L. iners in TB, suggesting complex host-microbiome interactions in pregnancy,” they said.
“Further studies are needed to determine whether the signatures of PTB reported in the present study replicate in other cohorts of women of African ancestry, to examine whether the observed differences in vaginal microbiome composition between women of different ancestries has a direct causal link to the ethnic and racial disparities in PTB rates, and to establish whether population-specific microbial markers can be ultimately integrated into a generalizable spectrum of vaginal microbiome states linked to the risk for PTB,” Dr. Fettweis and her associates said.
In a companion study also published in Nature Medicine, Myrna G. Serrano, MD, also of Virginia Commonwealth University, and her colleagues as part of the MOMS-PI initially determined that vaginal microbiome profiles varied between 613 pregnant and 1,969 nonpregnant women in that “pregnant women had significantly higher prevalence of the four most common Lactobacillus vagitypes (L. crispatus, L. iners, L. gasseri, and L. jensenii) and a commensurately lower prevalence of vagitypes dominated by other taxa.” The primary driver of the differences was L. iners.
They then compared vaginal microbiome data from 300 pregnant and 300 nonpregnant case-matched women of African, Hispanic, or European ancestry, as well as 90 pregnant women (49 of African ancestry and 41 of European) ancestry.
In the subset of 300 pregnant and 300 nonpregnant women, the vaginal microbiome of the pregnant women overall became more dominated by Lactobacillus early in pregnancy. Further stratification by race showed that pregnant women of African and Hispanic ancestry had significantly higher levels of four types of Lactobacillus than their nonpregnant counterparts, but no significant difference was seen between pregnant and nonpregnant women of European ancestry.
“It appears that changes occurring during pregnancy may render the reproductive tracts of women of all racial backgrounds more hospitable to taxa of Lactobacillus and less favorable for Gardnerella vaginalis and other taxa associated with BV [bacterial vaginosis] and dysbiosis,” the researchers said.
“Interestingly, BVAB1, which has been associated with dysbiotic vaginal conditions and risk of PTB, and which is present as a major vagitype largely in women of African ancestry, is not noticeably decreased in prevalence in pregnancy,” Dr. Serrano and her associates said. “Thus, BVAB1, for reasons yet to be determined, is apparently resistant to factors sculpting the microbiome in pregnant women, possibly explaining in part the enhanced risk for PTB experienced by women of African ancestry.”
In a look at the 49 pregnant women of African ancestry and 41 of European ancestry, those of African ancestry had “significantly lower representation of the L. crispatus, L. gasseri and L. jensenii vagitypes, and higher representation of L. iners and BVAB1 vagitypes. Variability in women of African ancestry was driven by BVAB1 and L. iners, whereas variability in women of non-African ancestry was driven by L. crispatus and L. iners. Again, pregnancy had no significant effect on prevalence of the BVAB1 vagitype. Prevalence of Lactobacillus-dominated profiles in women of African ancestry was lower in the first than in later trimesters, whereas women of European ancestry had a higher prevalence of Lactobacillus vagitypes throughout pregnancy.”
The presence of vaginal microbiome profiles associated with adverse pregnancy outcomes highlights the need for further studies that take advantage of this information, Dr. Serrano and her associates said. “That the vaginal microbiomes known to confer higher risk of poor health and adverse outcomes of pregnancy are more highly associated with women of African and Hispanic ancestry, but that pregnancy tends to drive these microbiomes toward more favorable microbiota, suggests that an external intervention that favors this trend might be beneficial for these populations,” they concluded. “What remains is to verify the most favorable microbiome and the most effective strategy for intervention.”
Dr. Fettweis had no financial conflicts to disclose; two coauthors are full-time employees at Pacific Biosciences. Dr. Serrano and her coauthors had no relevant financial disclosures. Dr. Serrano’s study received grants from the National Institutes of Health and other sources, as well as support from the Common Fund, the National Center for Complementary and Integrative Health, the Office of Research on Women’s Health, the Eunice Kennedy Shriver National Institute of Child Health and Human Development, and the National Institute of Allergy and Infectious Diseases.
SOURCES: Fettweis J et al. Nature Medicine 2019 May 29. doi: 10.1038/s41591-019-0450-2; Serrano M et al. Nature Medicine. 2019 May 29. doi: 10.1038/s41591-019-0465-8.
FROM NATURE MEDICINE
Beyond Mortality: Improving Outcomes for Children Who Deteriorate in Inpatient Settings
The past 20 years has seen an explosion of approaches to improve the recognition of children who deteriorate in the hospital. Early Warning Scores, Rapid Response Teams, Situational Awareness, and Parent-Triggered Activation systems are a few of the safety initiatives implemented worldwide. Many have an inherent face validity; for example, it would appear to be intuitive that highlighting the changes in physiology via a Pediatric Early Warning Score (PEWS) would enable staff to recognize a change in disease process and intervene accordingly. However, although mortality trends have been shown to diminish over time,1 the evidence base supporting their impact has often been quite heterogeneous.2,3 In particular, a recent international randomized control trial of a PEWS approach was found not to improve overall mortality.4
A major challenge with the evaluation of these patient safety systems is the reliance on mortality as an outcome measure. This is relatively rare, even in large tertiary institutions with complex patients and finding other proxy measures of quality of care are important. Hussain et al. have created a relatively easy to measure metric, an emergency transfer (ET). The benefit of the ET is its simplicity and transferability, which is described as follows:
“Emergency Transfer (ET) is defined as any patient transferred to the ICU where the patient received intubation, inotropes, or three or more fluid boluses in the first hour after arrival or before transfer.”5
All these components are easily extractable from written or electronic records and are representative of meaningful deterioration. Pressure on bed states, challenges with staff skill mix, and increasing parental expectation may all impact on decisions to transfer patients. The ET metric is relatively immune to these biases as its tight time definition separates it from the previous Bonafide et al.6 measure (similar interventions but within a 12-hour window) as being centered on an abrupt critical change, rather than a potential drift toward deterioration. This makes the measure useful not only to an individual institution to measure the impact of an intervention but also internationally, as a comparison between institutions will not be influenced by health system differences.
The ET metric is important as Hussain et al. have demonstrated that it is associated with a worse outcome for the child both as a concrete outcome (increased mortality when it does occur) and as an experience (a longer stay in hospital). “You can’t improve what you can’t measure” is an old improvement maxim, and only by broadening our use of alternative metrics of care will we be able to understand which interventions will make a difference to patients. Certainly, evidence suggests that cultures, hierarchies, and leadership may well be as important as other more concrete or tangible tools,7 but these have seldom been evaluated as part of studies on improving the response to deterioration. The pediatric early warning system utilization and mortality avoidance (PUMA) study, a research program funded by the National Institute for Health Research (United Kingdom), is exploring these tools and will likely report later in 2019.8
Two immediate practical implications of this work emerge, which should be of relevance to clinical leaders in children’s hospitals. The first is that it is highly likely that there will be some events you cannot anticipate. A bronchiolitic infant is always likely to suddenly plug off, and invasive group A streptococcus is a mastery of mimicry and deceit. The authors noted that even with a mature, long-standing Rapid Response System process, ETs were still associated with adverse outcomes. Therefore, it may well be that the ET metric measured over time delineates a locally defined acceptable level of unplanned intensive care admission. If your hospital is significantly above this, they must seriously look at how they can improve their performance. It should be noted here that there were only 45 ETs identified in 4.5 years in Cincinnati and 50% of these were from specialist units within the hospital. It is possible that perhaps the ETs will in the future become as rare as mortality is today, and as hospitals improve, new frames of reference will be needed.
These new references are likely to come from high-performing child health institutions such as those in Philadelphia and Cincinnati, and this leads to a second important principle that hospitals should acknowledge. One of the reasons for patient safety success is the relentless pursuit of excellence. The very act of consistently, and transparently, auditing and analyzing performance is vital to change outcomes. We should digest, evaluate, adopt, and improve the research that groups such as these are undertaking as, although sometimes imperfect, they should also inspire us to ensure that children in our own institutions are as safe as they possibly can be.
Disclosure
Dr. Roland reports that he is currently the cochief investigator of a National Institute for Health Research (NIHR) grant investigating pediatric early warning systems (the PUMA study)
1. United Nations. Levels and Trends in Child Mortality Report 2018. https://www.un.org/en/development/desa/population/publications/mortality/child-mortality-report-2018.asp. Accessed April 26, 2019.
2. McGaughey J, O’Halloran P, Porter S, Trinder J, Blackwood B. Early warning systems and rapid response to the deteriorating patient in hospital: a realist evaluation. J Adv Nurs. 2017;73(12):3119-3132. https://doi.org/10.1111/jan.13367.
3. Chapman SM, Maconochie IK Early warning scores in paediatrics: an overview. Arch Dis Child. 2019;104:395-399. https://doi.org/10.1136/archdischild-2018-314807.
4. Parshuram CS, Dryden-Palmer K, Farrell C, et al. Effect of a pediatric early warning system on all-cause mortality in hospitalized pediatric patients: the EPOCH randomized clinical trial. JAMA. 2018;319(10):1002-1012. https://doi.org/10.1001/jama.2018.0948.
5. Hussain F. Emergency transfers: an important predictor of adverse outcomes in hospitalized children [Published online ahead of print June 7, 2019]. J Hosp Med. 2019;14(8):482-485. https://doi.org/10.12788/jhm.3219.
6. Bonafide CP, Roberts KE, Priestley MA, et al. Development of a pragmatic measure for evaluating and optimizing rapid response systems. Pediatrics. 2012;129(4):e874-e881. https://doi.org/10.1542/peds.2011-2784.
7. Gawronski O, Parshuram C, Cecchetti C, et al. Qualitative study exploring factors influencing escalation of care of deteriorating children in a children’s hospital. BMJ Paediatrics Open. 2018;2(1):e000241. https://doi.org/10.1136/bmjpo-2017-000241.
8. Thomas-Jones E, Lloyd A, Roland D, et al. A prospective, mixed-methods, before and after study to identify the evidence base for the core components of an effective Paediatric Early Warning System and the development of an implementation package containing those core recommendations for use in the UK: Paediatric early warning system - utilisation and mortality avoidance- the PUMA study protocol. BMC Pediatr. 2018;18(1):244. https://doi.org/10.1186/s12887-018-1210-z.
The past 20 years has seen an explosion of approaches to improve the recognition of children who deteriorate in the hospital. Early Warning Scores, Rapid Response Teams, Situational Awareness, and Parent-Triggered Activation systems are a few of the safety initiatives implemented worldwide. Many have an inherent face validity; for example, it would appear to be intuitive that highlighting the changes in physiology via a Pediatric Early Warning Score (PEWS) would enable staff to recognize a change in disease process and intervene accordingly. However, although mortality trends have been shown to diminish over time,1 the evidence base supporting their impact has often been quite heterogeneous.2,3 In particular, a recent international randomized control trial of a PEWS approach was found not to improve overall mortality.4
A major challenge with the evaluation of these patient safety systems is the reliance on mortality as an outcome measure. This is relatively rare, even in large tertiary institutions with complex patients and finding other proxy measures of quality of care are important. Hussain et al. have created a relatively easy to measure metric, an emergency transfer (ET). The benefit of the ET is its simplicity and transferability, which is described as follows:
“Emergency Transfer (ET) is defined as any patient transferred to the ICU where the patient received intubation, inotropes, or three or more fluid boluses in the first hour after arrival or before transfer.”5
All these components are easily extractable from written or electronic records and are representative of meaningful deterioration. Pressure on bed states, challenges with staff skill mix, and increasing parental expectation may all impact on decisions to transfer patients. The ET metric is relatively immune to these biases as its tight time definition separates it from the previous Bonafide et al.6 measure (similar interventions but within a 12-hour window) as being centered on an abrupt critical change, rather than a potential drift toward deterioration. This makes the measure useful not only to an individual institution to measure the impact of an intervention but also internationally, as a comparison between institutions will not be influenced by health system differences.
The ET metric is important as Hussain et al. have demonstrated that it is associated with a worse outcome for the child both as a concrete outcome (increased mortality when it does occur) and as an experience (a longer stay in hospital). “You can’t improve what you can’t measure” is an old improvement maxim, and only by broadening our use of alternative metrics of care will we be able to understand which interventions will make a difference to patients. Certainly, evidence suggests that cultures, hierarchies, and leadership may well be as important as other more concrete or tangible tools,7 but these have seldom been evaluated as part of studies on improving the response to deterioration. The pediatric early warning system utilization and mortality avoidance (PUMA) study, a research program funded by the National Institute for Health Research (United Kingdom), is exploring these tools and will likely report later in 2019.8
Two immediate practical implications of this work emerge, which should be of relevance to clinical leaders in children’s hospitals. The first is that it is highly likely that there will be some events you cannot anticipate. A bronchiolitic infant is always likely to suddenly plug off, and invasive group A streptococcus is a mastery of mimicry and deceit. The authors noted that even with a mature, long-standing Rapid Response System process, ETs were still associated with adverse outcomes. Therefore, it may well be that the ET metric measured over time delineates a locally defined acceptable level of unplanned intensive care admission. If your hospital is significantly above this, they must seriously look at how they can improve their performance. It should be noted here that there were only 45 ETs identified in 4.5 years in Cincinnati and 50% of these were from specialist units within the hospital. It is possible that perhaps the ETs will in the future become as rare as mortality is today, and as hospitals improve, new frames of reference will be needed.
These new references are likely to come from high-performing child health institutions such as those in Philadelphia and Cincinnati, and this leads to a second important principle that hospitals should acknowledge. One of the reasons for patient safety success is the relentless pursuit of excellence. The very act of consistently, and transparently, auditing and analyzing performance is vital to change outcomes. We should digest, evaluate, adopt, and improve the research that groups such as these are undertaking as, although sometimes imperfect, they should also inspire us to ensure that children in our own institutions are as safe as they possibly can be.
Disclosure
Dr. Roland reports that he is currently the cochief investigator of a National Institute for Health Research (NIHR) grant investigating pediatric early warning systems (the PUMA study)
1. United Nations. Levels and Trends in Child Mortality Report 2018. https://www.un.org/en/development/desa/population/publications/mortality/child-mortality-report-2018.asp. Accessed April 26, 2019.
2. McGaughey J, O’Halloran P, Porter S, Trinder J, Blackwood B. Early warning systems and rapid response to the deteriorating patient in hospital: a realist evaluation. J Adv Nurs. 2017;73(12):3119-3132. https://doi.org/10.1111/jan.13367.
3. Chapman SM, Maconochie IK Early warning scores in paediatrics: an overview. Arch Dis Child. 2019;104:395-399. https://doi.org/10.1136/archdischild-2018-314807.
4. Parshuram CS, Dryden-Palmer K, Farrell C, et al. Effect of a pediatric early warning system on all-cause mortality in hospitalized pediatric patients: the EPOCH randomized clinical trial. JAMA. 2018;319(10):1002-1012. https://doi.org/10.1001/jama.2018.0948.
5. Hussain F. Emergency transfers: an important predictor of adverse outcomes in hospitalized children [Published online ahead of print June 7, 2019]. J Hosp Med. 2019;14(8):482-485. https://doi.org/10.12788/jhm.3219.
6. Bonafide CP, Roberts KE, Priestley MA, et al. Development of a pragmatic measure for evaluating and optimizing rapid response systems. Pediatrics. 2012;129(4):e874-e881. https://doi.org/10.1542/peds.2011-2784.
7. Gawronski O, Parshuram C, Cecchetti C, et al. Qualitative study exploring factors influencing escalation of care of deteriorating children in a children’s hospital. BMJ Paediatrics Open. 2018;2(1):e000241. https://doi.org/10.1136/bmjpo-2017-000241.
8. Thomas-Jones E, Lloyd A, Roland D, et al. A prospective, mixed-methods, before and after study to identify the evidence base for the core components of an effective Paediatric Early Warning System and the development of an implementation package containing those core recommendations for use in the UK: Paediatric early warning system - utilisation and mortality avoidance- the PUMA study protocol. BMC Pediatr. 2018;18(1):244. https://doi.org/10.1186/s12887-018-1210-z.
© 2019 Society of Hospital Medicine
Progress (?) Toward Reducing Pediatric Readmissions
Readmission rates have been used by payers to administer financial incentives or penalties to hospitals as a measure of quality. The Centers for Medicare and Medicaid Services (CMS) reduces payments to hospitals with excess readmissions for adult Medicare patients.1 Although the Medicare readmission penalties do not apply to children, several state Medicaid agencies have adopted policies to reduce reimbursement for hospitals with higher than expected readmission rates. These Medicaid programs often use potentially preventable readmission (PPR) rates calculated with proprietary software.2 As a result of these incentives and with a goal of improving care, many children’s hospitals have focused on reducing readmissions through participation in local, regional, and national collaboratives.3
Rates of unplanned readmissions in children are lower than in older adults, with all-cause 30-day pediatric readmission rates around 13%.4-7 Even so, as many as 30% of pediatric readmissions may be potentially preventable, with the most common transition failure involving a hospital factor, such as failure to recognize worsening clinical status prior to discharge.8 While readmission metrics are often judged across peer institutions, little is known about national trends over time. Therefore, we sought to examine readmission rates at children’s hospitals over a six-year timeframe to determine if progress has been made toward reducing readmissions.
METHODS
We utilized data from the Children’s Hospital Association Inpatient Essentials Database and included index hospitalizations from January 1, 2010 through June 30, 2016. This database contains demographic information, diagnosis and procedure codes, and All-Patient Refined Diagnosis-Related Groups (APR-DRGs; 3M Health Information Systems) to describe the principal reason for each hospitalization.9 We included 66 hospitals from 31 states plus the District of Columbia with complete data during the study period.
Seven-day all-cause (AC) readmission and PPR rates were calculated using the output from 3M potentially preventable readmission software (version 32). The PPR software utilizes a proprietary algorithm to designate potentially preventable readmissions based on diagnosis codes and the severity of illness (as measured by the APR-DRG severity of illness classification). We chose seven-day readmissions, as opposed to a longer window, as readmissions soon after discharge are more likely to be preventable8 and thus theoretically more amenable to prevention efforts. Quarterly rates were generated for each hospital and in aggregate across the population. We chose quarterly rates a priori to assess changes in rates without focusing on minor monthly fluctuations due to seasonal differences. We performed generalized linear mixed regression models with cluster adjustments at the hospital level to assess changes in readmission rates over time adjusted for case mix index, as admissions to children’s hospitals have increased in complexity over time.10,11 We operationalized the case mix index as an average of pediatric admissions’ relative weights at each hospital for the quarter.12 We assessed AC and PPR models separately. The average case mix index was a covariate in both regression models.
Finally, to determine if readmission reduction may be specific to particular conditions, we generated readmission rates for a select number of APR-DRGs. We focused on conditions with a very high percentage of AC readmissions classified as PPR (appendectomy, connective tissue disorders, ventricular shunt procedures, bronchiolitis, asthma, and sickle cell crisis) as well as those with a very low percentage of AC readmissions classified as PPR (gastrointestinal infections, hematologic disease, and bone marrow transplant [BMT]).5
RESULTS
We included 4.52 million admissions to the 66 included hospitals. Most hospitals (62%) were freestanding acute-care children’s hospitals. The hospitals were geographically diverse. Two-thirds had magnet status (Appendix Table 1). Appendix Table 2 displays patient/admission characteristics over time. Approximately 49% of children were non-Hispanic white, 19% were non-Hispanic black, and 19% were Hispanic. Half of the children were insured by Medicaid. These characteristics were stable over time, except case mix index, which increased during the study period (P = .04).
Across Diagnosis All-Cause and Potentially Preventable Readmission Rates
Over the study period, there were 227,378 AC seven-day readmissions (5.1% readmission rate), and 91,467 readmissions (40% of AC readmissions) were considered PPRs. Readmission rates did not vary over the study period (Figure, Panel A). The median AC seven-day readmission rate across all quarters was 5.1%, ranging from 4.3% to 5.3% (Figure, Panels A and B). The median seven-day PPR rate across all quarters was 2.5% and ranged from 2.1% to 2.5% (Figure, Panels A and C). When adjusted for case mix index, the AC rate increased slightly (on average 0.006% increase per quarter, P = .01) and PPR rates were unchanged over time (PPR model P = .14; Figure, Panel D).
Condition-Specific Readmission Rates
Of the condition-specific readmission rates, only the AC rate for BMT changed significantly, with a decrease of 0.1% per quarter, P = .048. None of the conditions had significant trends in increasing or decreasing readmission in PPR rates. Some conditions, including sickle cell and cerebrospinal fluid ventricular shunt procedures, had fluctuating readmission rates throughout the study period (Appendix Figure, Panels A-G).
DISCUSSION
Despite substantial national efforts to reduce pediatric readmissions,3 seven-day readmission rates at children’s hospitals have not decreased over six years. When individual conditions are examined, there are minor fluctuations of readmission rates over time but no clear trend of decreased readmission events.
Our results are contrary to findings in the Medicare population, where 30-day readmission rates have decreased over time.13,14 In these analyses, we focused on seven-day readmission, as earlier pediatric readmissions are more likely to be preventable. Importantly, the majority of our included hospitals (88%) participate in the Solutions for Patient Safety collaborative, which focuses on reducing seven-day readmissions. Thus, we are confident that a concerted effort to decrease readmission has been ongoing. Further, our findings are contrary to recent analyses indicating an increase in pediatric readmission rates using the pediatric all-condition readmission rate in the National Readmission Database.15 Our analyses are distinctly different in that they allow a focus on hospital-level performance in children’s hospitals. Although in our analyses the all-cause adjusted readmission rate did increase significantly over time (0.006% a quarter or 0.024% per year), this small increase is unlikely to be clinically relevant.
There are several potential reasons for the lack of change in pediatric readmission rates despite concerted efforts to decrease readmissions. First, pediatric readmissions across all conditions are relatively infrequent compared with adult readmission rates. Extrapolating from the largest pediatric study on readmission preventability,8 it is estimated that only two in 100 pediatric hospitalizations results in a PPR.16 Given the lack of robust pediatric readmission prediction tools, the ability to prospectively identify children at high risk for readmission and target interventions is challenging. Second, as we have previously described, children are readmitted after hospitalization for a wide variety of conditions.5 Medicare readmission penalties are leveraged on specific conditions; yet, Medicaid policies include all conditions. In pediatrics, successful interventions to reduce readmissions have focused on hospitalizations for specific conditions.17 In the only two large pediatric readmission reduction trials across multiple conditions, postdischarge homecare nursing contact did not reduce reutilization.18,19 It is challenging to decrease readmissions in heterogenous populations without a robust set of evidence-based interventions. Third, there are multiple ways to measure pediatric readmissions, and different institutions may focus on different methods. Given the proprietary nature and the reliance on retrospective administrative data, PPR rates cannot be assessed during admission and thus are not feasible as a real-time quality improvement outcome. Fourth, in contrast to other hospital quality metrics such as central line-associated bloodstream infections or catheter-associated urinary tract infection, the locus of control for readmission is not entirely within the purview of the hospital.
It is unclear what readmission rate in children is appropriate—or safe—and whether that level has already been met. National readmission prevention efforts may have collateral benefits such as improved communication, medication errors or adherence, and other important aspects of care during transitions. In this scenario, lower readmission rates may not reflect improved quality. Future research should focus on determining if and how readmission reduction efforts are helping to ease the transition to home. Alternatively, research should determine if there are better interventions to assist with transition challenges which should receive resources divested from failing readmission reduction efforts.
Using administrative data, we are limited in delineating truly preventable readmissions from nonpreventable readmissions. Nevertheless, we chose to focus on the PPR and AC metrics, as these are the most policy-relevant metrics. Additionally, we examined aggregate rates of readmission across a cohort of hospitals and did not assess for within-hospital changes in readmission rates. Thus, it is possible (and likely) that some hospitals saw improvements and others saw increases in readmission rates during the study period. We are unable to examine readmission rates at hospitals based on investment in readmission reduction efforts or individual state Medicaid reimbursement policies. Finally, we are unable to assess readmissions to other institutions; however, it is unlikely that readmissions to other hospitals have decreased significantly when readmissions to the discharging hospital have not changed.
Pediatric readmissions at children’s hospitals have not decreased in the past six years, despite widespread readmission reduction efforts. Readmission rates for individual conditions have fluctuated but have not decreased.
Disclosures
Dr. Auger reports grants from AHRQ, during the conduct of the study. Drs. Harris, Gay, Teufel, McLead, Neuman, Peltz, Morse, Del Beccaro, Simon, Argawal, and Fieldston have nothing to disclose. Dr. Shah is the Editor-in-Chief of the Journal of Hospital Medicine.
Funding
Dr. Auger’s research is funded by a K08 award from the Agency for Healthcare Research and Quality (1K08HS024735-01A).
1. Centers for Medicare & Medicaid Services. Readmissions Reduction Program (HRRP). https://www.cms.gov/Medicare/Medicare-Fee-for-Service-Payment/AcuteInpatientPPS/Readmissions-Reduction-Program.html. Accessed January 19, 2018.
2. 3M Health Information Systems. Potentially Preventable Readmissions Classification System: Methodology Overview. http://multimedia.3m.com/mws/media/1042610O/resources-and-references-his-2015.pdf. Accessed April 5, 2019.
3. Children’s Hospitals’ Solutions for Patient Safety. SPS prevention bundles: readmission. http://www.solutionsforpatientsafety.org/wp-content/uploads/SPS-Prevention-Bundles.pdf. Accessed January 11, 2017.
4. Berry JG, Toomey SL, Zaslavsky AM, et al. Pediatric readmission prevalence and variability across hospitals. JAMA. 2013;309(4):372-380. https://doi.org/10.1001/jama.2012.188351.
5. Gay JC, Agrawal R, Auger KA, et al. Rates and impact of potentially preventable readmissions at children’s hospitals. J Pediatr. 2015;166(3):613-619. https://doi.org/10.1016/j.jpeds.2014.10.052.
6. Auger KA, Teufel RJ, Harris JM, et al. Children’s hospital characteristics and readmission metrics. Pediatrics. 2017;139(2):e20161720. https://doi.org/10.1542/peds.2016-1720.
7. Joynt KE, Orav EJ, Jha AK. Thirty-day readmission rates for medicare beneficiaries by race and site of care. JAMA. 2011;305(7):675-681. https://doi.org/10.1001/jama.2011.123.
8. Toomey SL, Peltz A, Loren S, et al. Potentially preventable 30-day hospital readmissions at a children’s hospital. Pediatrics. 2016;138(2):e20154182. doi: 10.1542/peds.2015-4182.
9. Children’s Hospital Association. Pediatric analytic solutions. https://www.childrenshospitals.org/Programs-and-Services/Data-Analytics-and-Research/Pediatric-Analytic-Solutions. Accessed June 2, 2018.
10. Simon TD, Berry J, Feudtner C, et al. Children with complex chronic conditions in inpatient hospital settings in the United States. Pediatrics. 2010;126(4):647-655. https://doi.org/10.1542/peds.2009-3266.
11. Berry JG, Hall M, Hall DE, et al. Inpatient growth and resource use in 28 children’s hospitals: a longitudinal, multi-institutional study. JAMA Pediatr. 2013;167(2):170-177.https://doi.org/10.1001/jamapediatrics.2013.432.
12. Richardson T, Rodean J, Harris M, et al. Development of hospitalization resource intensity scores for kids (H-RISK) and comparison across pediatric populations. J Hosp Med. 2018;13(9):602-608. https://doi.org/10.12788/jhm.2948.
13. Zuckerman RB, Sheingold SH, Orav EJ, Ruhter J, Epstein AM. Readmissions, observation, and the hospital readmissions reduction program. N Engl J Med. 2016;374(16):1543-1551. https://doi.org/10.1056/NEJMsa1513024.
14. Desai NR, Ross JS, Kwon JY, et al. Association between hospital penalty status under the hospital readmission reduction program and readmission rates for target and nontarget conditions. JAMA. 2016;316(24):2647-2656. https://doi.org/10.1001/jama.2016.18533.
15. Bucholz EM, Toomey SL, Schuster MA. Trends in pediatric hospitalizations and readmissions: 2010-2016. Pediatrics. 2019;143(2):e20181958. https://doi.org/10.1542/peds.2018-1958.
16. Brittan M, Shah SS, Auger KA. Preventing pediatric readmissions: how does the hospital fit in? Pediatrics. 2016;138(2):e20161643. https://doi.org/10.1542/peds.2016-1643.
17. Auger KA, Kenyon CC, Feudtner C, Davis MM. Pediatric hospital discharge interventions to reduce subsequent utilization: a systematic review. J Hosp Med. 2014;9(4):251-260. https://doi.org/10.1002/jhm.2134.
18. Auger KA, Simmons JM, Tubbs-Cooley H, et al. Hospital to home outcomes (H2O) randomized trial of a post-discharge nurse home visit. Pediatrics. In press.
19. Auger KA, Shah SS, Tubbs-Cooley HL, et al. Effects of a 1-time nurse-led telephone call after pediatric discharge: the H2O II randomized clinical trial. JAMA Pediatr. 2018;172(9):e181482. https://doi.org/10.1001/jamapediatrics.2018.1482.
Readmission rates have been used by payers to administer financial incentives or penalties to hospitals as a measure of quality. The Centers for Medicare and Medicaid Services (CMS) reduces payments to hospitals with excess readmissions for adult Medicare patients.1 Although the Medicare readmission penalties do not apply to children, several state Medicaid agencies have adopted policies to reduce reimbursement for hospitals with higher than expected readmission rates. These Medicaid programs often use potentially preventable readmission (PPR) rates calculated with proprietary software.2 As a result of these incentives and with a goal of improving care, many children’s hospitals have focused on reducing readmissions through participation in local, regional, and national collaboratives.3
Rates of unplanned readmissions in children are lower than in older adults, with all-cause 30-day pediatric readmission rates around 13%.4-7 Even so, as many as 30% of pediatric readmissions may be potentially preventable, with the most common transition failure involving a hospital factor, such as failure to recognize worsening clinical status prior to discharge.8 While readmission metrics are often judged across peer institutions, little is known about national trends over time. Therefore, we sought to examine readmission rates at children’s hospitals over a six-year timeframe to determine if progress has been made toward reducing readmissions.
METHODS
We utilized data from the Children’s Hospital Association Inpatient Essentials Database and included index hospitalizations from January 1, 2010 through June 30, 2016. This database contains demographic information, diagnosis and procedure codes, and All-Patient Refined Diagnosis-Related Groups (APR-DRGs; 3M Health Information Systems) to describe the principal reason for each hospitalization.9 We included 66 hospitals from 31 states plus the District of Columbia with complete data during the study period.
Seven-day all-cause (AC) readmission and PPR rates were calculated using the output from 3M potentially preventable readmission software (version 32). The PPR software utilizes a proprietary algorithm to designate potentially preventable readmissions based on diagnosis codes and the severity of illness (as measured by the APR-DRG severity of illness classification). We chose seven-day readmissions, as opposed to a longer window, as readmissions soon after discharge are more likely to be preventable8 and thus theoretically more amenable to prevention efforts. Quarterly rates were generated for each hospital and in aggregate across the population. We chose quarterly rates a priori to assess changes in rates without focusing on minor monthly fluctuations due to seasonal differences. We performed generalized linear mixed regression models with cluster adjustments at the hospital level to assess changes in readmission rates over time adjusted for case mix index, as admissions to children’s hospitals have increased in complexity over time.10,11 We operationalized the case mix index as an average of pediatric admissions’ relative weights at each hospital for the quarter.12 We assessed AC and PPR models separately. The average case mix index was a covariate in both regression models.
Finally, to determine if readmission reduction may be specific to particular conditions, we generated readmission rates for a select number of APR-DRGs. We focused on conditions with a very high percentage of AC readmissions classified as PPR (appendectomy, connective tissue disorders, ventricular shunt procedures, bronchiolitis, asthma, and sickle cell crisis) as well as those with a very low percentage of AC readmissions classified as PPR (gastrointestinal infections, hematologic disease, and bone marrow transplant [BMT]).5
RESULTS
We included 4.52 million admissions to the 66 included hospitals. Most hospitals (62%) were freestanding acute-care children’s hospitals. The hospitals were geographically diverse. Two-thirds had magnet status (Appendix Table 1). Appendix Table 2 displays patient/admission characteristics over time. Approximately 49% of children were non-Hispanic white, 19% were non-Hispanic black, and 19% were Hispanic. Half of the children were insured by Medicaid. These characteristics were stable over time, except case mix index, which increased during the study period (P = .04).
Across Diagnosis All-Cause and Potentially Preventable Readmission Rates
Over the study period, there were 227,378 AC seven-day readmissions (5.1% readmission rate), and 91,467 readmissions (40% of AC readmissions) were considered PPRs. Readmission rates did not vary over the study period (Figure, Panel A). The median AC seven-day readmission rate across all quarters was 5.1%, ranging from 4.3% to 5.3% (Figure, Panels A and B). The median seven-day PPR rate across all quarters was 2.5% and ranged from 2.1% to 2.5% (Figure, Panels A and C). When adjusted for case mix index, the AC rate increased slightly (on average 0.006% increase per quarter, P = .01) and PPR rates were unchanged over time (PPR model P = .14; Figure, Panel D).
Condition-Specific Readmission Rates
Of the condition-specific readmission rates, only the AC rate for BMT changed significantly, with a decrease of 0.1% per quarter, P = .048. None of the conditions had significant trends in increasing or decreasing readmission in PPR rates. Some conditions, including sickle cell and cerebrospinal fluid ventricular shunt procedures, had fluctuating readmission rates throughout the study period (Appendix Figure, Panels A-G).
DISCUSSION
Despite substantial national efforts to reduce pediatric readmissions,3 seven-day readmission rates at children’s hospitals have not decreased over six years. When individual conditions are examined, there are minor fluctuations of readmission rates over time but no clear trend of decreased readmission events.
Our results are contrary to findings in the Medicare population, where 30-day readmission rates have decreased over time.13,14 In these analyses, we focused on seven-day readmission, as earlier pediatric readmissions are more likely to be preventable. Importantly, the majority of our included hospitals (88%) participate in the Solutions for Patient Safety collaborative, which focuses on reducing seven-day readmissions. Thus, we are confident that a concerted effort to decrease readmission has been ongoing. Further, our findings are contrary to recent analyses indicating an increase in pediatric readmission rates using the pediatric all-condition readmission rate in the National Readmission Database.15 Our analyses are distinctly different in that they allow a focus on hospital-level performance in children’s hospitals. Although in our analyses the all-cause adjusted readmission rate did increase significantly over time (0.006% a quarter or 0.024% per year), this small increase is unlikely to be clinically relevant.
There are several potential reasons for the lack of change in pediatric readmission rates despite concerted efforts to decrease readmissions. First, pediatric readmissions across all conditions are relatively infrequent compared with adult readmission rates. Extrapolating from the largest pediatric study on readmission preventability,8 it is estimated that only two in 100 pediatric hospitalizations results in a PPR.16 Given the lack of robust pediatric readmission prediction tools, the ability to prospectively identify children at high risk for readmission and target interventions is challenging. Second, as we have previously described, children are readmitted after hospitalization for a wide variety of conditions.5 Medicare readmission penalties are leveraged on specific conditions; yet, Medicaid policies include all conditions. In pediatrics, successful interventions to reduce readmissions have focused on hospitalizations for specific conditions.17 In the only two large pediatric readmission reduction trials across multiple conditions, postdischarge homecare nursing contact did not reduce reutilization.18,19 It is challenging to decrease readmissions in heterogenous populations without a robust set of evidence-based interventions. Third, there are multiple ways to measure pediatric readmissions, and different institutions may focus on different methods. Given the proprietary nature and the reliance on retrospective administrative data, PPR rates cannot be assessed during admission and thus are not feasible as a real-time quality improvement outcome. Fourth, in contrast to other hospital quality metrics such as central line-associated bloodstream infections or catheter-associated urinary tract infection, the locus of control for readmission is not entirely within the purview of the hospital.
It is unclear what readmission rate in children is appropriate—or safe—and whether that level has already been met. National readmission prevention efforts may have collateral benefits such as improved communication, medication errors or adherence, and other important aspects of care during transitions. In this scenario, lower readmission rates may not reflect improved quality. Future research should focus on determining if and how readmission reduction efforts are helping to ease the transition to home. Alternatively, research should determine if there are better interventions to assist with transition challenges which should receive resources divested from failing readmission reduction efforts.
Using administrative data, we are limited in delineating truly preventable readmissions from nonpreventable readmissions. Nevertheless, we chose to focus on the PPR and AC metrics, as these are the most policy-relevant metrics. Additionally, we examined aggregate rates of readmission across a cohort of hospitals and did not assess for within-hospital changes in readmission rates. Thus, it is possible (and likely) that some hospitals saw improvements and others saw increases in readmission rates during the study period. We are unable to examine readmission rates at hospitals based on investment in readmission reduction efforts or individual state Medicaid reimbursement policies. Finally, we are unable to assess readmissions to other institutions; however, it is unlikely that readmissions to other hospitals have decreased significantly when readmissions to the discharging hospital have not changed.
Pediatric readmissions at children’s hospitals have not decreased in the past six years, despite widespread readmission reduction efforts. Readmission rates for individual conditions have fluctuated but have not decreased.
Disclosures
Dr. Auger reports grants from AHRQ, during the conduct of the study. Drs. Harris, Gay, Teufel, McLead, Neuman, Peltz, Morse, Del Beccaro, Simon, Argawal, and Fieldston have nothing to disclose. Dr. Shah is the Editor-in-Chief of the Journal of Hospital Medicine.
Funding
Dr. Auger’s research is funded by a K08 award from the Agency for Healthcare Research and Quality (1K08HS024735-01A).
1. Centers for Medicare & Medicaid Services. Readmissions Reduction Program (HRRP). https://www.cms.gov/Medicare/Medicare-Fee-for-Service-Payment/AcuteInpatientPPS/Readmissions-Reduction-Program.html. Accessed January 19, 2018.
2. 3M Health Information Systems. Potentially Preventable Readmissions Classification System: Methodology Overview. http://multimedia.3m.com/mws/media/1042610O/resources-and-references-his-2015.pdf. Accessed April 5, 2019.
3. Children’s Hospitals’ Solutions for Patient Safety. SPS prevention bundles: readmission. http://www.solutionsforpatientsafety.org/wp-content/uploads/SPS-Prevention-Bundles.pdf. Accessed January 11, 2017.
4. Berry JG, Toomey SL, Zaslavsky AM, et al. Pediatric readmission prevalence and variability across hospitals. JAMA. 2013;309(4):372-380. https://doi.org/10.1001/jama.2012.188351.
5. Gay JC, Agrawal R, Auger KA, et al. Rates and impact of potentially preventable readmissions at children’s hospitals. J Pediatr. 2015;166(3):613-619. https://doi.org/10.1016/j.jpeds.2014.10.052.
6. Auger KA, Teufel RJ, Harris JM, et al. Children’s hospital characteristics and readmission metrics. Pediatrics. 2017;139(2):e20161720. https://doi.org/10.1542/peds.2016-1720.
7. Joynt KE, Orav EJ, Jha AK. Thirty-day readmission rates for medicare beneficiaries by race and site of care. JAMA. 2011;305(7):675-681. https://doi.org/10.1001/jama.2011.123.
8. Toomey SL, Peltz A, Loren S, et al. Potentially preventable 30-day hospital readmissions at a children’s hospital. Pediatrics. 2016;138(2):e20154182. doi: 10.1542/peds.2015-4182.
9. Children’s Hospital Association. Pediatric analytic solutions. https://www.childrenshospitals.org/Programs-and-Services/Data-Analytics-and-Research/Pediatric-Analytic-Solutions. Accessed June 2, 2018.
10. Simon TD, Berry J, Feudtner C, et al. Children with complex chronic conditions in inpatient hospital settings in the United States. Pediatrics. 2010;126(4):647-655. https://doi.org/10.1542/peds.2009-3266.
11. Berry JG, Hall M, Hall DE, et al. Inpatient growth and resource use in 28 children’s hospitals: a longitudinal, multi-institutional study. JAMA Pediatr. 2013;167(2):170-177.https://doi.org/10.1001/jamapediatrics.2013.432.
12. Richardson T, Rodean J, Harris M, et al. Development of hospitalization resource intensity scores for kids (H-RISK) and comparison across pediatric populations. J Hosp Med. 2018;13(9):602-608. https://doi.org/10.12788/jhm.2948.
13. Zuckerman RB, Sheingold SH, Orav EJ, Ruhter J, Epstein AM. Readmissions, observation, and the hospital readmissions reduction program. N Engl J Med. 2016;374(16):1543-1551. https://doi.org/10.1056/NEJMsa1513024.
14. Desai NR, Ross JS, Kwon JY, et al. Association between hospital penalty status under the hospital readmission reduction program and readmission rates for target and nontarget conditions. JAMA. 2016;316(24):2647-2656. https://doi.org/10.1001/jama.2016.18533.
15. Bucholz EM, Toomey SL, Schuster MA. Trends in pediatric hospitalizations and readmissions: 2010-2016. Pediatrics. 2019;143(2):e20181958. https://doi.org/10.1542/peds.2018-1958.
16. Brittan M, Shah SS, Auger KA. Preventing pediatric readmissions: how does the hospital fit in? Pediatrics. 2016;138(2):e20161643. https://doi.org/10.1542/peds.2016-1643.
17. Auger KA, Kenyon CC, Feudtner C, Davis MM. Pediatric hospital discharge interventions to reduce subsequent utilization: a systematic review. J Hosp Med. 2014;9(4):251-260. https://doi.org/10.1002/jhm.2134.
18. Auger KA, Simmons JM, Tubbs-Cooley H, et al. Hospital to home outcomes (H2O) randomized trial of a post-discharge nurse home visit. Pediatrics. In press.
19. Auger KA, Shah SS, Tubbs-Cooley HL, et al. Effects of a 1-time nurse-led telephone call after pediatric discharge: the H2O II randomized clinical trial. JAMA Pediatr. 2018;172(9):e181482. https://doi.org/10.1001/jamapediatrics.2018.1482.
© 2019 Society of Hospital Medicine
Emergency Transfers: An Important Predictor of Adverse Outcomes in Hospitalized Children
Unrecognized in-hospital deterioration can result in tragic consequences for pediatric patients. The majority of deterioration events have antecedents such as increasingly abnormal vital signs and new concerns from nurses.1 Recent meta-analyses have shown that rapid response systems (RRSs), which include trigger mechanisms such as a pediatric early warning score (PEWS), are associated with a reduced rate of arrests and in-hospital mortality.2,3 Cardiopulmonary arrest rates are useful metrics to judge the effectiveness of the system to identify and respond to deteriorating adult patients; however, there are important challenges to their use as an outcome measure in pediatrics. Arrests, which have been relatively uncommon in pediatric patients, are now even less frequent since the adoption of a RRS in the majority of children’s hospitals.4,5 Several innovations in these systems will be context-dependent and hence best first evaluated in a single center, where arrests outside of the intensive care unit (ICU) may occur rarely. Identification of valid, more frequent proximal measures to arrests may better identify the risk factors for deterioration. This could potentially inform quality improvement efforts to mitigate clinical deterioration.
Bonafide et al. at the Children’s Hospital of Philadelphia developed and validated the critical deterioration event (CDE) metric, demonstrating that children who were transferred to the ICU and who received noninvasive ventilation, intubation, or vasopressor initiation within 12 hours of transfer had a >13-fold increased risk of in-hospital mortality.6 At Cincinnati Children’s Hospital Medical Center, an additional proximal outcome measure was developed for unrecognized clinical deterioration, now termed emergency transfers (ETs).7-9 An ET is defined as any patient transferred to the ICU where the patient received intubation, inotropes, or three or more fluid boluses in the first hour after arrival or before transfer.9 Improvement science work that aimed at increasing clinician situation awareness was associated with a reduction in ETs,8 but the association of ETs with mortality or other healthcare utilization outcomes is unknown. The objective of this study was to determine the predictive validity of an ET on in-hospital mortality, ICU length of stay (LOS), and overall hospital LOS.
METHODS
We conducted a case–control study at Cincinnati Children’s Hospital, a free-standing tertiary care children’s hospital. Our center has had an ICU-based RRS in place since 2005. In 2009, we eliminated the ICU consult such that each floor-to-ICU transfer is evaluated by the RRS. Nurses calculate a Monaghan PEWS every four hours on the majority of nursing units.
Patients of all ages cared for outside of the ICU at any point in their hospitalization from January 1, 2013, to July 31, 2017, were eligible for inclusion. There were no other exclusion criteria. The ICU included both the pediatric ICU and the cardiac ICU.
Cases
We identified all ET cases from an existing situation awareness database in which each RRS call is entered by the hospital nursing supervisor, whose role includes responding to each RRS activation. If the patient transfer meets the ET criteria, the nurse indicates this in the database. Each ET entry is later confirmed for assurance purposes by the nurse leader of the RRS committee (RG). For the purposes of this study, all records were again reviewed and validated using manual chart review in the electronic health record (Epic Systems, Verona, Wisconsin).
Controls
We identified nonemergent ICU transfers to serve as controls and matched those to ET in cases to limit the impact of confounders that may increase the likelihood of both an ET and a negative outcome such as ICU mortality. We identified up to three controls for each case from our database and matched in terms of age group (within five years of age), hospital unit before transfer, and time of year (within three months of ET). These variables were chosen to adjust for the impact of age, diversity of disease (as hospital units are generally organized by organ system of illness), and seasonality on outcomes.
Outcome Measures
Posttransfer LOS in the ICU, posttransfer hospital LOS, and in-hospital mortality were the primary outcome measures. Patient demographics, specific diagnoses, and number of medical conditions were a priori defined as covariates of interest. Data for each case and control were entered into a secure, web-based Research Electronic Data Capture (REDCap) database.
Analysis
Descriptive data were summarized using counts and percentages for categorical variables and medians and ranges for continuous variables due to nonnormal distributions. Chi-square test was used to compare in-hospital mortality between the ETs and the controls. The Wilcoxon rank-sum test was used to compare LOS between ETs and controls. All data analyses were performed using SAS version 9.4 (SAS Institute Inc., Cary, North Carolina).
RESULTS
A total of 45 ETs were identified, and 110 controls were matched. Patient demographics were similar among all cases and controls (P > .05). Patients with ETs had a median age of seven years (interquartile range: 3-18 years), and 51% of them were males. The majority of patients among our examined cases were white (68%) and non-Hispanic (93%). There was no statistical difference in insurance between the ETs and the controls. When evaluating the hospital unit before the transfer, ETs occurred most commonly in the Cardiology (22%), Hematology/Oncology (22%), and Neuroscience (16%) units.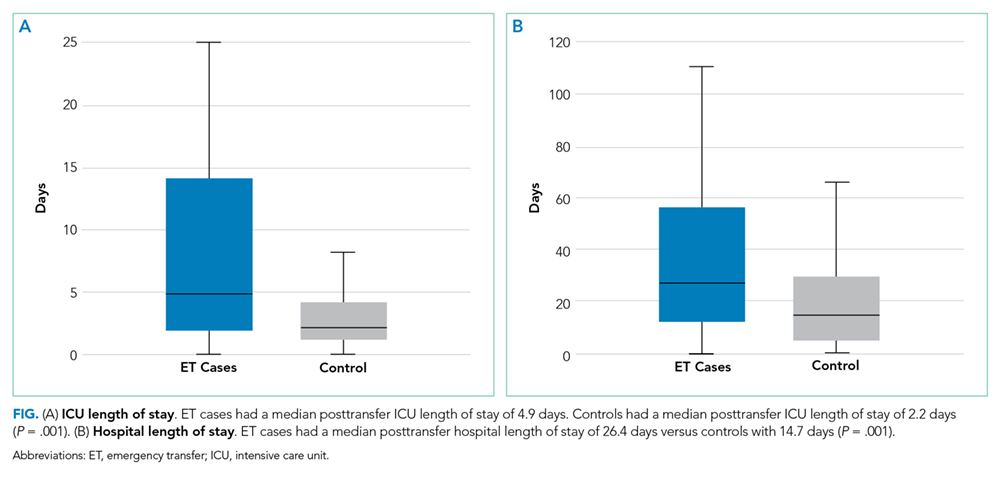
ETs stayed longer in the ICU than non-ETs [median of 4.9 days vs 2.2 days, P = .001; Figure (A)]. Similarly, ET cases had a significantly longer posttransfer hospital LOS [median of 35 days vs 21 days, P = .001; Figure (B)]. ETs had a 22% in-hospital mortality rate, compared with 9% in-hospital mortality in the matched controls (P = .02; Table).
DISCUSSION
Children who experienced an ET had a significantly longer ICU LOS, a longer posttransfer LOS, and a higher in-hospital mortality than the matched controls who were also transferred to the ICU. Researchers and improvement science teams at multiple hospitals have demonstrated that interventions targeting improved situation awareness can reduce ETs; we have demonstrated that reducing ETs may reduce subsequent adverse outcomes.8,10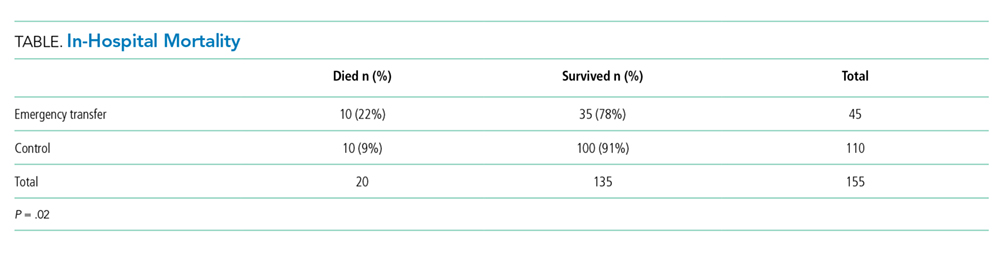
These findings provide additional support for the use of the ET metric in children’s hospitals as a proximal measure for significant clinical deterioration. We found mortality rates that were overall high for a children’s hospital (22% in ET cases and 9% among controls) compared with a national average mortality rate of 2.3% in pediatric ICUs.11 This is likely due to the study sample containing a significant proportion of children with medical complexity.
Aoki et al. recently demonstrated that ETs, compared with non-ETs, were associated with longer LOS and higher mortality in a bivariate analysis.12 In our study, we found similar results with the important addition that these findings were robust when ETs were compared with matched controls who were likely at a higher risk of poor outcomes than ICU transfers in general. In addition, we demonstrated that ETs were associated with adverse outcomes in a United States children’s hospital with a mature, long-standing RRS process. As ETs are considerably more common than cardiac and respiratory arrests, use of the ET metric in children’s hospitals may enable more rapid learning and systems improvement implementations. We also found that most of the children with ETs present from units that care for children with substantial medical complexity, including Cardiology, Hematology/Oncology, and Neurosciences. Future work should continue to examine the relationship between medical complexity and ET risk.
The ET metric is complementary to the CDE measure developed by Bonafide et al. Both metrics capture potential events of unrecognized clinical deterioration, and both offer researchers the opportunity to better understand and improve their RRSs. Both ETs and CDEs are more common than arrests, and CDEs are more common than ETs. ETs, which by definition occur in the first hour of ICU care, are likely a more specific measure of unrecognized clinical deterioration. CDEs will capture therapies that may have been started up to 12 hours after transfer and thus are possibly more sensitive to identify unrecognized clinical deterioration. However, CDEs also may encompass some patients who arrived at the ICU after prompt recognition and then had a subacute deterioration in the ICU.
The maturity of the RRS and the bandwidth of teams to collect data may inform which metric(s) are best for individual centers. As ETs are less common and likely more specific to unrecognized clinical deterioration, they might be the first tracked as a center improves its RRS through QI methods. Alternatively, CDEs may be a useful metric for centers where unrecognized clinical deterioration is less common or in research studies where this more common outcome would lead to more power to detect the effect of interventions to improve care.
Our study had several limitations. Data collection was confined to one tertiary care children’s hospital with a high burden of complex cardiac and oncology care. The results may not generalize well to children hospitalized in smaller or community hospitals or in hospitals without a mature RRS. There is also the possibility of misclassification of covariates and outcomes, but any misclassification would likely be nondifferential and bias toward the null. Matching was not possible based on exact diagnosis, and the unit is a good but imperfect proxy for diagnosis grouping. At our center, overflow of patients into the Cardiology and Hematology/Oncology units is uncommon, mitigating this partially, although residual confounding may remain. The finding that ETs are associated with adverse outcomes does not necessarily mean that these events were preventable; however, it is important and encouraging that the rate of ETs has been reduced at two centers using improvement science interventions.8,10
CONCLUSION
Patients who experienced an ET had a significantly higher likelihood of in-hospital mortality, spent more time in the ICU, and had a longer hospital LOS posttransfer than matched controls. The use of the ET metric in children’s hospitals would allow for further analysis of such patients in hopes of identifying clinical characteristics that serve as predictors of deterioration. This may facilitate better risk stratification in the clinical system as well as enable more rapid learning and systems improvements targeted toward preventing unrecognized clinical deterioration.
Disclosures
Dr. Hussain, Dr. Sosa, Dr. Ambroggio, and Mrs. Gallagher have nothing to disclose. Patrick Brady reports grants from the Agency for Healthcare Research and Quality, outside the submitted work. The authors certify that this submission is not under review by any other publication. The author team has no conflicts of interest to disclose.
Funding
Ms. Hussain was supported by the Society of Hospital Medicine’s Student Hospitalist Scholar Grant Program in 2017. Dr. Brady receives career development support from AHRQ K08-HS023827. The project described was supported by the National Center for Advancing Translational Sciences of the National Institutes of Health, under Award Number 5UL1TR001425-04. The content is solely the responsibility of the authors and does not necessarily represent the official views of the SHM, AHRQ, or NIH.
1. Schein RM, Hazday N, Pena M, Ruben BH, Sprung CL. Clinical antecedents to in-hospital cardiopulmonary arrest. Chest. 1990;98(6):1388-1392. https://doi.org/10.1378/chest.98.6.1388.
2. Maharaj R, Raffaele I, Wendon J. Rapid response systems: a systematic review and meta-analysis. Crit Care. 2015;19:254. https://doi.org/10.1186/s13054-015-0973-y.
3. Bonafide CP, Roland D, Brady PW. Rapid response systems 20 years later: new approaches, old challenges. JAMA Pediatrics. 2016;170(8):729-730. https://doi.org/10.1001/jamapediatrics.2016.0398.
4. Hayes LW, Dobyns EL, DiGiovine B, et al. A multicenter collaborative approach to reducing pediatric codes outside the ICU. Pediatrics. 2012;129(3):e785-e791. https://doi.org/10.1542/peds.2011-0227.
5. Raymond TT, Bonafide CP, Praestgaard A, et al. Pediatric medical emergency team events and outcomes: a report of 3647 events from the American Heart Association’s get with the guidelines-resuscitation registry. Hosp Pediatr. 2016;6(2):57-64. https://doi.org/10.1542/hpeds.2015-0132.
6. Bonafide CP, Roberts KE, Priestley MA, et al. Development of a pragmatic measure for evaluating and optimizing rapid response systems. Pediatrics. 2012;129(4):e874-e881. https://doi.org/10.1542/peds.2011-2784.
7. Brady PW, Goldenhar LM. A qualitative study examining the influences on situation awareness and the identification, mitigation and escalation of recognised patient risk. BMJ Qual Saf. 2014;23(2):153-161. https://doi.org/10.1136/bmjqs-2012-001747.
8. Brady PW, Muething S, Kotagal U, et al. Improving situation awareness to reduce unrecognized clinical deterioration and serious safety events. Pediatrics. 2013;131(1):e298-e308. https://doi.org/10.1542/peds.2012-1364.
9. Brady PW, Wheeler DS, Muething SE, Kotagal UR. Situation awareness: a new model for predicting and preventing patient deterioration. Hosp Pediatr. 2014;4(3):143-146. https://doi.org/10.1542/hpeds.2013-0119.
10. McClain Smith M, Chumpia M, Wargo L, Nicol J, Bugnitz M. Watcher initiative associated with decrease in failure to rescue events in pediatric population. Hosp Pediatr. 2017;7(12):710-715. https://doi.org/10.1542/hpeds.2017-0042.
11. McCrory MC, Spaeder MC, Gower EW, et al. Time of admission to the PICU and mortality. Pediatr Crit Care Med. 2017;18(10):915-923. https://doi.org/10.1097/PCC.0000000000001268.
12. Aoki Y, Inata Y, Hatachi T, Shimizu Y, Takeuchi M. Outcomes of ‘unrecognised situation awareness failures events’ in intensive care unit transfer of children in a Japanese children’s hospital. J Paediatr Child Health. 2018;55(2):213-215. https://doi.org/10.1111/jpc.14185.
Unrecognized in-hospital deterioration can result in tragic consequences for pediatric patients. The majority of deterioration events have antecedents such as increasingly abnormal vital signs and new concerns from nurses.1 Recent meta-analyses have shown that rapid response systems (RRSs), which include trigger mechanisms such as a pediatric early warning score (PEWS), are associated with a reduced rate of arrests and in-hospital mortality.2,3 Cardiopulmonary arrest rates are useful metrics to judge the effectiveness of the system to identify and respond to deteriorating adult patients; however, there are important challenges to their use as an outcome measure in pediatrics. Arrests, which have been relatively uncommon in pediatric patients, are now even less frequent since the adoption of a RRS in the majority of children’s hospitals.4,5 Several innovations in these systems will be context-dependent and hence best first evaluated in a single center, where arrests outside of the intensive care unit (ICU) may occur rarely. Identification of valid, more frequent proximal measures to arrests may better identify the risk factors for deterioration. This could potentially inform quality improvement efforts to mitigate clinical deterioration.
Bonafide et al. at the Children’s Hospital of Philadelphia developed and validated the critical deterioration event (CDE) metric, demonstrating that children who were transferred to the ICU and who received noninvasive ventilation, intubation, or vasopressor initiation within 12 hours of transfer had a >13-fold increased risk of in-hospital mortality.6 At Cincinnati Children’s Hospital Medical Center, an additional proximal outcome measure was developed for unrecognized clinical deterioration, now termed emergency transfers (ETs).7-9 An ET is defined as any patient transferred to the ICU where the patient received intubation, inotropes, or three or more fluid boluses in the first hour after arrival or before transfer.9 Improvement science work that aimed at increasing clinician situation awareness was associated with a reduction in ETs,8 but the association of ETs with mortality or other healthcare utilization outcomes is unknown. The objective of this study was to determine the predictive validity of an ET on in-hospital mortality, ICU length of stay (LOS), and overall hospital LOS.
METHODS
We conducted a case–control study at Cincinnati Children’s Hospital, a free-standing tertiary care children’s hospital. Our center has had an ICU-based RRS in place since 2005. In 2009, we eliminated the ICU consult such that each floor-to-ICU transfer is evaluated by the RRS. Nurses calculate a Monaghan PEWS every four hours on the majority of nursing units.
Patients of all ages cared for outside of the ICU at any point in their hospitalization from January 1, 2013, to July 31, 2017, were eligible for inclusion. There were no other exclusion criteria. The ICU included both the pediatric ICU and the cardiac ICU.
Cases
We identified all ET cases from an existing situation awareness database in which each RRS call is entered by the hospital nursing supervisor, whose role includes responding to each RRS activation. If the patient transfer meets the ET criteria, the nurse indicates this in the database. Each ET entry is later confirmed for assurance purposes by the nurse leader of the RRS committee (RG). For the purposes of this study, all records were again reviewed and validated using manual chart review in the electronic health record (Epic Systems, Verona, Wisconsin).
Controls
We identified nonemergent ICU transfers to serve as controls and matched those to ET in cases to limit the impact of confounders that may increase the likelihood of both an ET and a negative outcome such as ICU mortality. We identified up to three controls for each case from our database and matched in terms of age group (within five years of age), hospital unit before transfer, and time of year (within three months of ET). These variables were chosen to adjust for the impact of age, diversity of disease (as hospital units are generally organized by organ system of illness), and seasonality on outcomes.
Outcome Measures
Posttransfer LOS in the ICU, posttransfer hospital LOS, and in-hospital mortality were the primary outcome measures. Patient demographics, specific diagnoses, and number of medical conditions were a priori defined as covariates of interest. Data for each case and control were entered into a secure, web-based Research Electronic Data Capture (REDCap) database.
Analysis
Descriptive data were summarized using counts and percentages for categorical variables and medians and ranges for continuous variables due to nonnormal distributions. Chi-square test was used to compare in-hospital mortality between the ETs and the controls. The Wilcoxon rank-sum test was used to compare LOS between ETs and controls. All data analyses were performed using SAS version 9.4 (SAS Institute Inc., Cary, North Carolina).
RESULTS
A total of 45 ETs were identified, and 110 controls were matched. Patient demographics were similar among all cases and controls (P > .05). Patients with ETs had a median age of seven years (interquartile range: 3-18 years), and 51% of them were males. The majority of patients among our examined cases were white (68%) and non-Hispanic (93%). There was no statistical difference in insurance between the ETs and the controls. When evaluating the hospital unit before the transfer, ETs occurred most commonly in the Cardiology (22%), Hematology/Oncology (22%), and Neuroscience (16%) units.
ETs stayed longer in the ICU than non-ETs [median of 4.9 days vs 2.2 days, P = .001; Figure (A)]. Similarly, ET cases had a significantly longer posttransfer hospital LOS [median of 35 days vs 21 days, P = .001; Figure (B)]. ETs had a 22% in-hospital mortality rate, compared with 9% in-hospital mortality in the matched controls (P = .02; Table).
DISCUSSION
Children who experienced an ET had a significantly longer ICU LOS, a longer posttransfer LOS, and a higher in-hospital mortality than the matched controls who were also transferred to the ICU. Researchers and improvement science teams at multiple hospitals have demonstrated that interventions targeting improved situation awareness can reduce ETs; we have demonstrated that reducing ETs may reduce subsequent adverse outcomes.8,10
These findings provide additional support for the use of the ET metric in children’s hospitals as a proximal measure for significant clinical deterioration. We found mortality rates that were overall high for a children’s hospital (22% in ET cases and 9% among controls) compared with a national average mortality rate of 2.3% in pediatric ICUs.11 This is likely due to the study sample containing a significant proportion of children with medical complexity.
Aoki et al. recently demonstrated that ETs, compared with non-ETs, were associated with longer LOS and higher mortality in a bivariate analysis.12 In our study, we found similar results with the important addition that these findings were robust when ETs were compared with matched controls who were likely at a higher risk of poor outcomes than ICU transfers in general. In addition, we demonstrated that ETs were associated with adverse outcomes in a United States children’s hospital with a mature, long-standing RRS process. As ETs are considerably more common than cardiac and respiratory arrests, use of the ET metric in children’s hospitals may enable more rapid learning and systems improvement implementations. We also found that most of the children with ETs present from units that care for children with substantial medical complexity, including Cardiology, Hematology/Oncology, and Neurosciences. Future work should continue to examine the relationship between medical complexity and ET risk.
The ET metric is complementary to the CDE measure developed by Bonafide et al. Both metrics capture potential events of unrecognized clinical deterioration, and both offer researchers the opportunity to better understand and improve their RRSs. Both ETs and CDEs are more common than arrests, and CDEs are more common than ETs. ETs, which by definition occur in the first hour of ICU care, are likely a more specific measure of unrecognized clinical deterioration. CDEs will capture therapies that may have been started up to 12 hours after transfer and thus are possibly more sensitive to identify unrecognized clinical deterioration. However, CDEs also may encompass some patients who arrived at the ICU after prompt recognition and then had a subacute deterioration in the ICU.
The maturity of the RRS and the bandwidth of teams to collect data may inform which metric(s) are best for individual centers. As ETs are less common and likely more specific to unrecognized clinical deterioration, they might be the first tracked as a center improves its RRS through QI methods. Alternatively, CDEs may be a useful metric for centers where unrecognized clinical deterioration is less common or in research studies where this more common outcome would lead to more power to detect the effect of interventions to improve care.
Our study had several limitations. Data collection was confined to one tertiary care children’s hospital with a high burden of complex cardiac and oncology care. The results may not generalize well to children hospitalized in smaller or community hospitals or in hospitals without a mature RRS. There is also the possibility of misclassification of covariates and outcomes, but any misclassification would likely be nondifferential and bias toward the null. Matching was not possible based on exact diagnosis, and the unit is a good but imperfect proxy for diagnosis grouping. At our center, overflow of patients into the Cardiology and Hematology/Oncology units is uncommon, mitigating this partially, although residual confounding may remain. The finding that ETs are associated with adverse outcomes does not necessarily mean that these events were preventable; however, it is important and encouraging that the rate of ETs has been reduced at two centers using improvement science interventions.8,10
CONCLUSION
Patients who experienced an ET had a significantly higher likelihood of in-hospital mortality, spent more time in the ICU, and had a longer hospital LOS posttransfer than matched controls. The use of the ET metric in children’s hospitals would allow for further analysis of such patients in hopes of identifying clinical characteristics that serve as predictors of deterioration. This may facilitate better risk stratification in the clinical system as well as enable more rapid learning and systems improvements targeted toward preventing unrecognized clinical deterioration.
Disclosures
Dr. Hussain, Dr. Sosa, Dr. Ambroggio, and Mrs. Gallagher have nothing to disclose. Patrick Brady reports grants from the Agency for Healthcare Research and Quality, outside the submitted work. The authors certify that this submission is not under review by any other publication. The author team has no conflicts of interest to disclose.
Funding
Ms. Hussain was supported by the Society of Hospital Medicine’s Student Hospitalist Scholar Grant Program in 2017. Dr. Brady receives career development support from AHRQ K08-HS023827. The project described was supported by the National Center for Advancing Translational Sciences of the National Institutes of Health, under Award Number 5UL1TR001425-04. The content is solely the responsibility of the authors and does not necessarily represent the official views of the SHM, AHRQ, or NIH.
1. Schein RM, Hazday N, Pena M, Ruben BH, Sprung CL. Clinical antecedents to in-hospital cardiopulmonary arrest. Chest. 1990;98(6):1388-1392. https://doi.org/10.1378/chest.98.6.1388.
2. Maharaj R, Raffaele I, Wendon J. Rapid response systems: a systematic review and meta-analysis. Crit Care. 2015;19:254. https://doi.org/10.1186/s13054-015-0973-y.
3. Bonafide CP, Roland D, Brady PW. Rapid response systems 20 years later: new approaches, old challenges. JAMA Pediatrics. 2016;170(8):729-730. https://doi.org/10.1001/jamapediatrics.2016.0398.
4. Hayes LW, Dobyns EL, DiGiovine B, et al. A multicenter collaborative approach to reducing pediatric codes outside the ICU. Pediatrics. 2012;129(3):e785-e791. https://doi.org/10.1542/peds.2011-0227.
5. Raymond TT, Bonafide CP, Praestgaard A, et al. Pediatric medical emergency team events and outcomes: a report of 3647 events from the American Heart Association’s get with the guidelines-resuscitation registry. Hosp Pediatr. 2016;6(2):57-64. https://doi.org/10.1542/hpeds.2015-0132.
6. Bonafide CP, Roberts KE, Priestley MA, et al. Development of a pragmatic measure for evaluating and optimizing rapid response systems. Pediatrics. 2012;129(4):e874-e881. https://doi.org/10.1542/peds.2011-2784.
7. Brady PW, Goldenhar LM. A qualitative study examining the influences on situation awareness and the identification, mitigation and escalation of recognised patient risk. BMJ Qual Saf. 2014;23(2):153-161. https://doi.org/10.1136/bmjqs-2012-001747.
8. Brady PW, Muething S, Kotagal U, et al. Improving situation awareness to reduce unrecognized clinical deterioration and serious safety events. Pediatrics. 2013;131(1):e298-e308. https://doi.org/10.1542/peds.2012-1364.
9. Brady PW, Wheeler DS, Muething SE, Kotagal UR. Situation awareness: a new model for predicting and preventing patient deterioration. Hosp Pediatr. 2014;4(3):143-146. https://doi.org/10.1542/hpeds.2013-0119.
10. McClain Smith M, Chumpia M, Wargo L, Nicol J, Bugnitz M. Watcher initiative associated with decrease in failure to rescue events in pediatric population. Hosp Pediatr. 2017;7(12):710-715. https://doi.org/10.1542/hpeds.2017-0042.
11. McCrory MC, Spaeder MC, Gower EW, et al. Time of admission to the PICU and mortality. Pediatr Crit Care Med. 2017;18(10):915-923. https://doi.org/10.1097/PCC.0000000000001268.
12. Aoki Y, Inata Y, Hatachi T, Shimizu Y, Takeuchi M. Outcomes of ‘unrecognised situation awareness failures events’ in intensive care unit transfer of children in a Japanese children’s hospital. J Paediatr Child Health. 2018;55(2):213-215. https://doi.org/10.1111/jpc.14185.
© 2019 Society of Hospital Medicine