User login
Egad!
A 69-year-old woman presented to the clinic with pain in the right great toe lasting several days. She was prescribed colchicine and indomethacin empirically for gout. She took one tablet of colchicine (0.6 mg) every hour until her stools became loose after the eighth tablet. Her toe pain resolved, but two days later she developed bilateral lower extremity pruritus and paresthesia and presented to the emergency department (ED). On physical examination, no rash, weakness, or sensory deficits were observed, and she was able to ambulate without assistance. Her patellar reflexes were normal. The complete blood count was notable for an absolute lymphocyte count of 6,120/µL (normal: 1,100-4,800), and the comprehensive metabolic panel was normal. Serum creatine kinase (CK) was 341 U/L (normal: 24-170) and uric acid 7.7 mg/dL (normal: 2.4-6.4). Her lower extremity symptoms were attributed to colchicine, which was discontinued. She was prescribed diphenhydramine and discharged home.
Monoarthritis of the hallux is the classic manifestation of gout, although other considerations include pseudogout, sesamoiditis, and trauma. The typical side effects of colchicine include diarrhea and myositis. Colchicine-induced muscle injury often results in a modest elevation of CK levels and is associated with myalgia.
Paresthesia is defined as abnormal sensory symptoms that most commonly localize to the peripheral nerves or spinal cord. Acute neuropathies or myelopathies might result from vasculitis, heavy metal toxicity, vitamin deficiencies, and paraneoplastic neurologic syndromes. The normal motor, sensory, and reflex examination, however, make these unlikely.
The neuro-anatomic localization of pruritus is poorly understood but is proposed to include peripheral nerves, spinothalamic tracts, and thalami. Acute pruritus (lasting <6 weeks) typically results from a primary dermatologic process such as a drug reaction, eczema, or xerosis. Less common causes include uremia, cholestasis, and thyroid disease. Pruritus can also be seen with malignancy, most commonly hematologic or paraneoplastic syndromes, or with connective tissue diseases. At this stage, it is unclear whether her pruritus and paresthesia are part of a unifying disease process.
Five days later she re-presented to the ED with nausea and emesis after eating at a restaurant. Her symptoms improved with intravenous fluids, and she was discharged. Four days later she returned with difficulty ambulating, bilateral leg cramping, and continued pruritus and paresthesia. The chemistry panel was normal except for a potassium level of 2.6 mmol/L and a bicarbonate level of 32 mmol/L. She was admitted to the hospital because of severe hypokalemia and impaired ability to ambulate. Her potassium was replenished. Her CK was elevated (3,551 U/L on hospital day 7). She was given cyclobenzaprine, gabapentin, oxycodone, acetaminophen, and prednisone (40 mg); her cramping only mildly improved, and she remained unable to walk. On hospital day five she had visual hallucinations and confusion, which did not resolve with administration of haloperidol; a head CT was unremarkable. On hospital day eight the patient, with her family’s support, left the hospital and presented to a different ED for a second opinion.
Difficulty ambulating often results from weakness, sensory impairment, cerebellar ataxia, extrapyramidal dysfunction (eg, parkinsonism), and pain. In this patient, leg cramping suggests pain or true weakness due to a myopathic process as a contributing factor. Symptoms of muscle disease include cramps, myalgia, and difficulty walking. Causes of elevated CK and myalgia include inflammatory myopathies, endocrinopathies, drugs, infections, and electrolyte abnormalities (eg, hypokalemia). Her age and acuity of presentation decrease the likelihood of a metabolic myopathy due to a disorder of glycogen storage, lipid metabolism, or mitochondrial function. Her hypokalemic metabolic alkalosis likely resulted from vomiting. Hypokalemic periodic paralysis is unlikely as exacerbations typically only last hours to days. As such, her difficulty ambulating, muscle cramps, and elevated CK strongly support a primary myopathic disorder, although additional information regarding the neurologic examination is still required.
Acute changes in mental status without corresponding changes in cranial nerve, motor, or sensory function are common in the hospital setting and frequently relate to delirium, which is the most likely explanation for her confusion. Her age and exposure to muscle relaxants, opiates, and corticosteroids increase her risk considerably. Other possible explanations for isolated changes in mental status include nonconvulsive seizures, central nervous system (CNS) infection, and strokes that involve the thalamus, nondominant parietal lobe, and reticular activating system. A shower of emboli resulting in small multifocal strokes can have the same effect.
She was re-evaluated by her new providers. Her only prior medical history was hypertension, which was treated at home with atenolol and amlodipine. She had emigrated from Nigeria to the US many years prior. She occasionally consumed alcohol and never smoked tobacco or used illicit drugs. She was unsure if she had received a tetanus booster in the past 10 years.
On physical examination, her temperature was 36°C, blood pressure 149/70 mm Hg, pulse 56 beats per minute, respiratory rate 18 breaths per minute, and oxygen saturation 98% on ambient air. She was diaphoretic and appeared anxious, grabbing both bedrails out of fear of falling. Cardiovascular, pulmonary, abdominal, and skin examinations were normal. She was alert and oriented to her identity, her location, and the time. Cranial nerves II to XII were normal. Tone was normal in her upper extremities but markedly increased in her lower extremities and back. There were spontaneous and stimulus-induced painful spasms, predominantly involving her axial muscles and distal lower extremities. Muscle bulk was normal. Strength was normal in the upper extremities and could not be assessed in the lower extremities due to rigidity. Reflexes were 2+ and symmetric throughout with downgoing toes on Babinski testing. A sensory examination was normal. Gait could not be tested because of the severe muscle spasms. The patient was admitted to the hospital.
Localized muscle spasms may be caused by muscle overuse, but more generalized spasms are associated with systemic diseases such as electrolyte disturbances, toxidromes, tetanus, peripheral nerve hyperexcitability syndromes (including Isaacs syndrome and Morvan syndrome), or stiff person syndrome (SPS). Hypokalemia is unlikely the cause as its correction did not improve her symptoms. Although tetanus is rare in the United States, it remains endemic in the developing world and can cause focal as well as generalized stimulus-induced spasms. The patient should be asked about potential exposure to Clostridium tetani infection, such as incurring a puncture wound. It is also important to consider neuroleptic malignant syndrome and serotonin syndrome, which can cause confusion, elevated CK, and increased muscle tone. Her confusion, however, was transient and the elevated CK preceded the administration of haloperidol.
SPS and progressive encephalomyelitis with rigidity and myoclonus (PERM) provide better explanations for her presentation. Both diseases cause severe spasms, impaired ambulation, and stiffness. They differ in their acuity of onset, accompanying symptoms, antibody associations, and responses to treatment. The rapid onset, paresthesia, and confusion seen in this patient are atypical of SPS. SPS usually presents with subacute-to-chronic stiffness or soreness of muscles in the back and lower extremities, followed by the upper extremities. Rigidity, stimulation-provoked spasms, hyperlordosis, and difficulty ambulating are typically later-stage findings. Her rapid escalation of symptoms is more consistent with PERM, which is often more acute and progressive than typical SPS; however, unlike this patient, PERM commonly causes widespread CNS dysfunction, including persistent encephalopathy, cranial neuropathies, hyperreflexia, and autonomic instability. Both are rare diagnoses that can manifest as a paraneoplastic neurologic syndrome.
Blood tests showed a leukocyte count of 17,350/µL, neutrophils 8,720/µL (normal: 1,500–7,800), lymphocytes 6,130/µL, hemoglobin 11.3 g/dL, and platelets 231,000/µL. The basic metabolic panel was normal. Serum total protein was 6.7 g/dL with albumin 3.5 g/dL. Aspartate aminotransferase (AST) was 94 U/L (normal: 0-31), alanine aminotransferase (ALT) 56 U/L (normal: 0-31), alkaline phosphatase 45 U/L, and total bilirubin 1.1 mg/dL. Vitamin B12 was 868 pg/mL. Hemoglobin A1c and thyrotropin levels were normal. Creatine kinase was 3,757 U/L and lactate dehydrogenase (LDH) 435 U/L (normal: 122-220). The syphilis treponemal test and hepatitis B surface antigen were negative. HIV and hepatitis C antibodies were nonreactive. The anti-nuclear antibody screen was negative and complement C3 and C4 were normal.
Neutrophilia likely reflects glucocorticoid-induced demargination, as opposed to an infectious process, given the temporal association with steroid administration. Persistent mild lymphocytosis is nonspecific but more likely to reflect a reactive rather than a clonal process. Elevated LDH and CK, as well as a greater increase of AST relative to ALT, suggest muscle injury, although mild concomitant hepatic injury cannot be excluded. Normal or negative serum studies for TSH, HIV, ANA, peripheral blood smear, and creatinine eliminate many of the systemic causes of her pruritus, but malignancy and associated paraneoplastic etiologies remain considerations.
The initial work-up for SPS includes electromyography (EMG) which would show spontaneous muscle activity. Her poorly localized sensory abnormalities, transient vestibular symptoms, and confusion warrant an MRI of the brain and spine to evaluate for inflammation (eg, encephalomyelitis), which could be consistent with PERM.
An MRI of the brain and cervicothoracic spine without contrast was significantly limited by motion artifact but without obvious intracranial or cord signal abnormalities. Electromyography demonstrated spontaneous muscle activity in both lower extremities with co-contraction of agonist and antagonist muscles (hamstrings and quadriceps as well as medial gastrocnemius and tibialis anterior). Sensory and motor nerve conductions were normal. Cerebral spinal fluid (CSF) contained six leukocytes (96% lymphocytes) and three red blood cells per microliter; glucose was 67 mg/dL and protein 24 mg/dL. There were two oligoclonal bands unique to the CSF. Cytology was negative for malignant cells.
The EMG narrows the differential diagnosis considerably. Co-contraction of opposing flexor and extensor groups (with predominance of extensors) on EMG is a diagnostic criterion for SPS and explains the myalgia and elevated CK. Her normal MRI studies effectively ruled out any focal lesion and did not show signs of encephalitis. Oligoclonal bands in the CSF are a sensitive marker of intrathecal inflammation, although not specific to one diagnosis. The mildly elevated cell count also supports CNS inflammation. In the setting of a lymphocytic pleocytosis and unique oligoclonal bands, it is important to consider infectious, neoplastic, autoimmune, and paraneoplastic causes of neuroinflammatory disorders.
Serum analyses, including antiglutamic acid decarboxylase 65 (GAD65) antibody and anti-amphiphysin antibody, should be ordered. The anti-GAD65 antibody is most commonly elevated in the setting of autoimmune diabetes mellitus; the titer, however, is usually dramatically higher in SPS. The CSF titer of anti-GAD65 antibodies is more specific than the serum titer for SPS. Antibodies against amphiphysin are typically elevated in paraneoplastic SPS, and anti-glycine receptor antibodies are associated with PERM, which commonly does not have elevated anti-GAD65 antibodies.
The serum GAD65 antibody level was greater than 265,000 × 103 IU/µL (normal <5,000), and the CSF level was 11.2 nmol/L (normal: ≤0.02). Serum amphiphysin antibody testing was negative.
Significantly elevated serum and CSF anti-GAD65 antibody levels are highly suggestive of SPS. Stiff person syndrome with rapidly progressive clinical symptoms raises the concern of a paraneoplastic neurologic syndrome. Although anti-amphiphysin antibody – the antibody classically associated with breast cancer and SPS – was negative, anti-GAD65 antibody has been implicated in paraneoplastic SPS with thymoma, lymphoma, and thyroid carcinoma. Paraneoplastic neurologic syndrome can predate a detectable malignancy by several years. As SPS and lymphoma are associated with pruritus and lymphocytosis, imaging is indicated to search for malignancy. Antiglycine receptor antibody, associated with PERM, is not routinely available commercially.
Computed tomography of the chest, abdomen, and pelvis with intravenous contrast revealed a 3.9 × 8.0 × 7.0 cm anterior mediastinal mass (Figure 1, Panel A). Biopsy of the mass demonstrated a thymoma. Given that the patient exhibited no further signs of CNS involvement, her initial transiently altered mental status was attributed to opioids and steroids. As she did not meet the clinical criteria for PERM, testing of antiglycine antibodies was not pursued.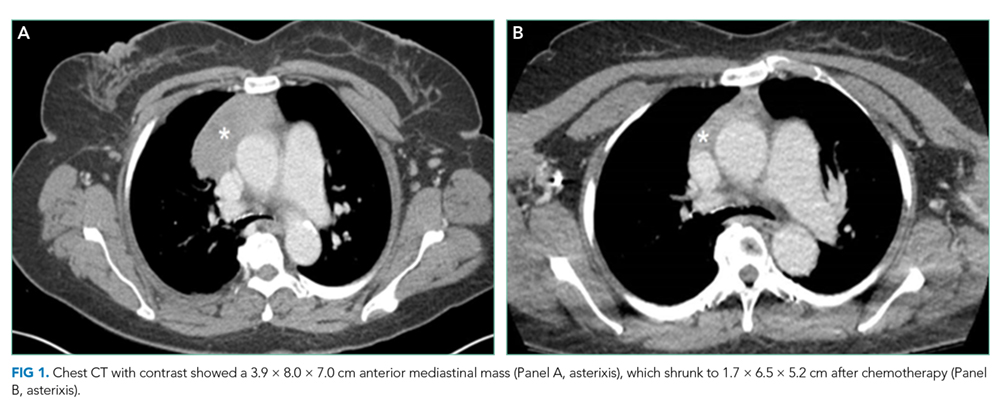
She received scheduled baclofen and diazepam with as needed cyclobenzaprine for continued muscle spasms. Over the next several days, her stiffness, spasms, and myoclonic jerks slowly improved, and she was able to attempt physical therapy (Appendix Video 1; https://youtu.be/d0gLpTgqaCs). She subsequently received intravenous immunoglobulin (IVIG) with further improvement. After five months of scheduled diazepam and baclofen, she was able to ambulate with minimal assistance (Appendix Video 2; https://youtu.be/I00i638u00o). Given the absence of safe tissue planes for resection, the patient received neoadjuvant chemotherapy with four cycles of cyclophosphamide, doxorubicin, and cisplatin. Tumor size decreased to 1.7 × 6.5 × 5.2 cm (Figure 1, Panel B), and she subsequently underwent resection (Figure 2). Pathological analysis demonstrated a type B1 thymoma.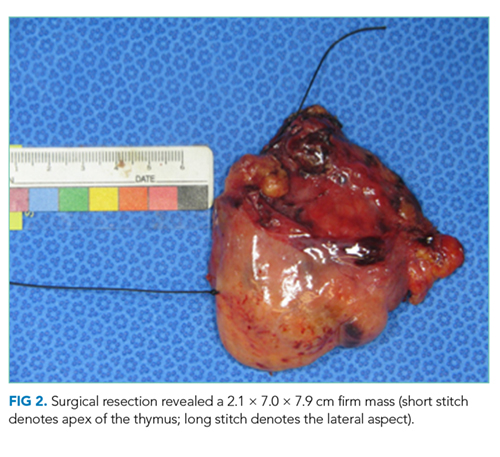
COMMENTARY
SPS is a condition of muscle stiffness and spasticity. Diagnosis is difficult and often delayed due to its rarity, with an approximate prevalence of one to two cases per million people.1 SPS typically occurs in middle age, and women are diagnosed twice as often as men. Classic SPS is characterized by axial and limb muscle stiffness, episodic spasms precipitated by tactile or auditory stimuli, continuous motor unit activity in agonist and antagonist muscles on EMG, high-titer antibody to GAD65 or amphiphysin, and the absence of an alternate diagnosis.2 Variant syndromes have been described, including a milder variant limited to the limbs, a severe variant with brainstem and spinal cord involvement, and a paraneoplastic variant.3 This patient’s clinical presentation, EMG findings, and extraordinarily high anti-GAD titers in the serum and CSF were diagnostic of SPS.
The pathophysiology of SPS is associated with autoantibodies targeting proteins such as GAD65, amphiphysin, gephyrin, and GABAA receptor-associated protein (GABARAP). These proteins are critical to gamma-aminobutyric acid (GABA) signaling, the primary inhibitory neurotransmitter pathway in the CNS (Figure 3).4 The formation of GABA from glutamate is catalyzed by GAD65. Gamma-aminobutyric acid is loaded into secretory vesicles, and amphiphysin facilitates vesicle recycling from the synaptic space.5 In the postsynaptic neuron, GABA binds the GABAA receptor, leading to neuronal hyperpolarization and resistance to excitation. The GABAA receptor is clustered on the plasma membrane through a scaffold formed by gephyrin. GABARAP facilitates this clustering, in part by linking GABAA receptors and gephyrin.6 Autoantibodies to these proteins may be pathogenic; however, the direct effects on their targets are unclear. The end result is decreased GABAergic activity, leading to continuous activation of opposing muscle groups. The resulting stiffness is characteristic of this disorder. Colchicine is known to antagonize GABAA receptor signaling, and this may have brought the underlying diagnosis of SPS to clinical attention.7,8
Symptomatic treatment of SPS targets the GABAergic system. Typically, high doses of scheduled benzodiazepines9 and baclofen10 are necessary. When symptoms are not controlled by GABAergic drugs, immunosuppression with corticosteroids and IVIG has been used, as have plasmapheresis and rituximab.11 The efficacy of the latter, however, was not supported by a randomized, placebo-controlled trial.12 This patient experienced significant improvement with benzodiazepines, baclofen, IVIG, and neoadjuvant chemotherapy prior to thymoma resection. The pruritus, paresthesia, and lymphocytosis also resolved with medical therapy. Interestingly, GABA signaling suppresses itch, suggesting that loss of GABAA signaling may have contributed to the development of pruritus.
SPS occasionally occurs as a paraneoplastic neurologic syndrome. Breast cancer is the most commonly associated malignancy, although associations between thymomas and SPS13 with anti-GAD65 antibodies14 have also been described. The presentation of thymomas is variable, with approximately one-third discovered incidentally on imaging, one-third producing symptoms of local compression, and one-third identified in the setting of another syndrome, most commonly myasthenia gravis. In addition to myasthenia gravis, thymomas have been associated with conditions such as hypogammaglobulinemia, pure red cell aplasia, and agranulocytosis. Stiff person syndrome is a known, albeit infrequently associated, condition.15
A critical step in arriving at the relevant differential diagnosis requires correctly framing the patient’s case.16 The treatment team’s initial frame was “a 69-year-old woman with weakness and elevated CK,” which prioritized causes of weakness and myositis. Stiff person syndrome does not cause weakness, but rather impaired movement from marked stiffness and spasms. The patient’s elevated CK was a result of continual muscle contractions. The physical exam and lack of motor deficit on EMG led the treatment team to reframe as “a 69-year-old woman with severe stiffness and spasms.” Egad! This correct frame was the key to diagnosis and confirmed by EMG and GAD65 antibody testing.
KEY LEARNING POINTS
- Classic SPS is characterized by axial and limb muscle stiffness, episodic spasms precipitated by tactile or auditory stimuli, continuous motor unit activity in agonist and antagonist muscles on EMG, and high-titer antibody to GAD65 or amphiphysin.
- SPS typically occurs in middle age, and women are diagnosed twice as often as men.
- Symptomatic treatment of SPS targets the GABAergic system. Typically, high doses of scheduled benzodiazepines and baclofenare necessary.
- SPS occasionally occurs as a paraneoplastic neurologic syndrome, most commonly in association with breast cancer.
Acknowledgments
The authors wish to thank Jason Kern, MD for his preparation and interpretation of the pathologic image; and the Jeremiah A. Barondess Fellowship in the Clinical Transaction of the New York Academy of Medicine, in collaboration with the Accreditation Council for Graduate Medical Education, for supporting Reza Manesh, MD.
Disclosures
The authors have nothing to disclose.
Appendix Video 1: This video was taken during a physical therapy session after 1 week of scheduled benzodiazepine and 2 days of intravenous immunoglobuli
Appendix Video 2: This video was taken 5 months after scheduled diazepam and baclofen, and 1 week prior to thymectomy. (https://youtu.be/I00i638u00o)
1. Hadavi S, Noyce AJ, Leslie RD, Giovannoni G. Stiff person syndrome. Pract Neurol. 2011;11(5):272-282. doi: 10.1136/practneurol-2011-000071
2. Dalakas MC. Stiff person syndrome: advances in pathogenesis and therapeutic interventions. Curr Treat Options Neurol. 2009;11(2):102-110. doi: 10.1007/s11940-009-0013-9
3. Murinson BB. Stiff-person syndrome. Neurologist. 2004;10(3):131-137. doi: 10.1097/01.nrl.0000126587.37087.1a
4. Rakocevic G, Floeter MK. Autoimmune stiff person syndrome and related myelopathies: understanding of electrophysiological and immunological processes. Muscle Nerve. 2012;45(5):623-634. doi: 10.1002/mus.23234
5. Zhang B, Zelhof AC. Amphiphysins: raising the BAR for synaptic vesicle recycling and membrane dynamics. Bin-Amphiphysin-Rvsp. Traffic. 2002;3(7):452-460. doi: 10.1034/j.1600-0854.2002.30702.x
6. Tyagarajan SK, Fritschy JM. Gephyrin: a master regulator of neuronal function? Nat Rev Neurosci. 2014;15(3):141-156. doi: 10.1038/nrn3670
7. Bueno OF, Leidenheimer NJ. Colchicine inhibits GABA(A) receptors independently of microtubule depolymerization. Neuropharmacology. 1998;37(3):383-390. doi: 10.1016/S0028-3908(98)00020-3
8. Weiner JL, Buhler AV, Whatley VJ, Harris RA, Dunwiddie TV. Colchicine is a competitive antagonist at human recombinant γ-aminobutyric acidA receptors. J Pharmacol Exp Ther. 1998;284(1):95-102 . PubMed
9. Lorish TR, Thorsteinsson G, Howard FM Jr. Stiff-man syndrome updated. Mayo Clin Proc. 1989;64(6):629-636. doi: 10.1016/S0025-6196(12)65339-7
10. McKeon A, Robinson MT, McEvoy KM, et al. Stiff-man syndrome and variants: clinical course, treatments, and outcomes. Arch Neurol. 2012;69(2):230-238. doi: 10.1001/archneurol.2011.991
11. Dalakas MC, Li M, Fujii M, Jacobowitz DM. Stiff person syndrome: quantification, specificity, and intrathecal synthesis of GAD65 antibodies. Neurology. 2001;57(5):780-784. doi: 10.1212/WNL.57.5.780
12. Dalakas MC, Rakocevic G, Dambrosia JM, Alexopoulos H, McElroy B. A double-blind, placebo-controlled study of rituximab in patients with stiff person syndrome. Ann Neurol. 2017;82(2):271-277. doi: 10.1002/ana.25002
13. Hagiwara H, Enomoto-Nakatani S, Sakai K, et al. Stiff-person syndrome associated with invasive thymoma: a case report. J Neurol Sci. 2001;193(1):59-62. doi: 10.1016/S0022-510X(01)00602-5
14. Vernino S, Lennon VA. Autoantibody profiles and neurological correlations of thymoma. Clin Cancer Res. 2004;10(21):7270-7275. doi: 10.1158/1078-0432.CCR-04-0735 PubMed
15. Thomas CR, Wright CD, Loehrer PJ. Thymoma: state of the art. J Clin Oncol. 1999;17(7):2280-2289. doi: 10.1200/JCO.1999.17.7.2280 PubMed
16. Stuart S, Hartig JR, Willett L. The importance of framing. J Gen Intern Med. 2017;32(6):706-710. doi: 10.1007/s11606-016-3964-z PubMed
A 69-year-old woman presented to the clinic with pain in the right great toe lasting several days. She was prescribed colchicine and indomethacin empirically for gout. She took one tablet of colchicine (0.6 mg) every hour until her stools became loose after the eighth tablet. Her toe pain resolved, but two days later she developed bilateral lower extremity pruritus and paresthesia and presented to the emergency department (ED). On physical examination, no rash, weakness, or sensory deficits were observed, and she was able to ambulate without assistance. Her patellar reflexes were normal. The complete blood count was notable for an absolute lymphocyte count of 6,120/µL (normal: 1,100-4,800), and the comprehensive metabolic panel was normal. Serum creatine kinase (CK) was 341 U/L (normal: 24-170) and uric acid 7.7 mg/dL (normal: 2.4-6.4). Her lower extremity symptoms were attributed to colchicine, which was discontinued. She was prescribed diphenhydramine and discharged home.
Monoarthritis of the hallux is the classic manifestation of gout, although other considerations include pseudogout, sesamoiditis, and trauma. The typical side effects of colchicine include diarrhea and myositis. Colchicine-induced muscle injury often results in a modest elevation of CK levels and is associated with myalgia.
Paresthesia is defined as abnormal sensory symptoms that most commonly localize to the peripheral nerves or spinal cord. Acute neuropathies or myelopathies might result from vasculitis, heavy metal toxicity, vitamin deficiencies, and paraneoplastic neurologic syndromes. The normal motor, sensory, and reflex examination, however, make these unlikely.
The neuro-anatomic localization of pruritus is poorly understood but is proposed to include peripheral nerves, spinothalamic tracts, and thalami. Acute pruritus (lasting <6 weeks) typically results from a primary dermatologic process such as a drug reaction, eczema, or xerosis. Less common causes include uremia, cholestasis, and thyroid disease. Pruritus can also be seen with malignancy, most commonly hematologic or paraneoplastic syndromes, or with connective tissue diseases. At this stage, it is unclear whether her pruritus and paresthesia are part of a unifying disease process.
Five days later she re-presented to the ED with nausea and emesis after eating at a restaurant. Her symptoms improved with intravenous fluids, and she was discharged. Four days later she returned with difficulty ambulating, bilateral leg cramping, and continued pruritus and paresthesia. The chemistry panel was normal except for a potassium level of 2.6 mmol/L and a bicarbonate level of 32 mmol/L. She was admitted to the hospital because of severe hypokalemia and impaired ability to ambulate. Her potassium was replenished. Her CK was elevated (3,551 U/L on hospital day 7). She was given cyclobenzaprine, gabapentin, oxycodone, acetaminophen, and prednisone (40 mg); her cramping only mildly improved, and she remained unable to walk. On hospital day five she had visual hallucinations and confusion, which did not resolve with administration of haloperidol; a head CT was unremarkable. On hospital day eight the patient, with her family’s support, left the hospital and presented to a different ED for a second opinion.
Difficulty ambulating often results from weakness, sensory impairment, cerebellar ataxia, extrapyramidal dysfunction (eg, parkinsonism), and pain. In this patient, leg cramping suggests pain or true weakness due to a myopathic process as a contributing factor. Symptoms of muscle disease include cramps, myalgia, and difficulty walking. Causes of elevated CK and myalgia include inflammatory myopathies, endocrinopathies, drugs, infections, and electrolyte abnormalities (eg, hypokalemia). Her age and acuity of presentation decrease the likelihood of a metabolic myopathy due to a disorder of glycogen storage, lipid metabolism, or mitochondrial function. Her hypokalemic metabolic alkalosis likely resulted from vomiting. Hypokalemic periodic paralysis is unlikely as exacerbations typically only last hours to days. As such, her difficulty ambulating, muscle cramps, and elevated CK strongly support a primary myopathic disorder, although additional information regarding the neurologic examination is still required.
Acute changes in mental status without corresponding changes in cranial nerve, motor, or sensory function are common in the hospital setting and frequently relate to delirium, which is the most likely explanation for her confusion. Her age and exposure to muscle relaxants, opiates, and corticosteroids increase her risk considerably. Other possible explanations for isolated changes in mental status include nonconvulsive seizures, central nervous system (CNS) infection, and strokes that involve the thalamus, nondominant parietal lobe, and reticular activating system. A shower of emboli resulting in small multifocal strokes can have the same effect.
She was re-evaluated by her new providers. Her only prior medical history was hypertension, which was treated at home with atenolol and amlodipine. She had emigrated from Nigeria to the US many years prior. She occasionally consumed alcohol and never smoked tobacco or used illicit drugs. She was unsure if she had received a tetanus booster in the past 10 years.
On physical examination, her temperature was 36°C, blood pressure 149/70 mm Hg, pulse 56 beats per minute, respiratory rate 18 breaths per minute, and oxygen saturation 98% on ambient air. She was diaphoretic and appeared anxious, grabbing both bedrails out of fear of falling. Cardiovascular, pulmonary, abdominal, and skin examinations were normal. She was alert and oriented to her identity, her location, and the time. Cranial nerves II to XII were normal. Tone was normal in her upper extremities but markedly increased in her lower extremities and back. There were spontaneous and stimulus-induced painful spasms, predominantly involving her axial muscles and distal lower extremities. Muscle bulk was normal. Strength was normal in the upper extremities and could not be assessed in the lower extremities due to rigidity. Reflexes were 2+ and symmetric throughout with downgoing toes on Babinski testing. A sensory examination was normal. Gait could not be tested because of the severe muscle spasms. The patient was admitted to the hospital.
Localized muscle spasms may be caused by muscle overuse, but more generalized spasms are associated with systemic diseases such as electrolyte disturbances, toxidromes, tetanus, peripheral nerve hyperexcitability syndromes (including Isaacs syndrome and Morvan syndrome), or stiff person syndrome (SPS). Hypokalemia is unlikely the cause as its correction did not improve her symptoms. Although tetanus is rare in the United States, it remains endemic in the developing world and can cause focal as well as generalized stimulus-induced spasms. The patient should be asked about potential exposure to Clostridium tetani infection, such as incurring a puncture wound. It is also important to consider neuroleptic malignant syndrome and serotonin syndrome, which can cause confusion, elevated CK, and increased muscle tone. Her confusion, however, was transient and the elevated CK preceded the administration of haloperidol.
SPS and progressive encephalomyelitis with rigidity and myoclonus (PERM) provide better explanations for her presentation. Both diseases cause severe spasms, impaired ambulation, and stiffness. They differ in their acuity of onset, accompanying symptoms, antibody associations, and responses to treatment. The rapid onset, paresthesia, and confusion seen in this patient are atypical of SPS. SPS usually presents with subacute-to-chronic stiffness or soreness of muscles in the back and lower extremities, followed by the upper extremities. Rigidity, stimulation-provoked spasms, hyperlordosis, and difficulty ambulating are typically later-stage findings. Her rapid escalation of symptoms is more consistent with PERM, which is often more acute and progressive than typical SPS; however, unlike this patient, PERM commonly causes widespread CNS dysfunction, including persistent encephalopathy, cranial neuropathies, hyperreflexia, and autonomic instability. Both are rare diagnoses that can manifest as a paraneoplastic neurologic syndrome.
Blood tests showed a leukocyte count of 17,350/µL, neutrophils 8,720/µL (normal: 1,500–7,800), lymphocytes 6,130/µL, hemoglobin 11.3 g/dL, and platelets 231,000/µL. The basic metabolic panel was normal. Serum total protein was 6.7 g/dL with albumin 3.5 g/dL. Aspartate aminotransferase (AST) was 94 U/L (normal: 0-31), alanine aminotransferase (ALT) 56 U/L (normal: 0-31), alkaline phosphatase 45 U/L, and total bilirubin 1.1 mg/dL. Vitamin B12 was 868 pg/mL. Hemoglobin A1c and thyrotropin levels were normal. Creatine kinase was 3,757 U/L and lactate dehydrogenase (LDH) 435 U/L (normal: 122-220). The syphilis treponemal test and hepatitis B surface antigen were negative. HIV and hepatitis C antibodies were nonreactive. The anti-nuclear antibody screen was negative and complement C3 and C4 were normal.
Neutrophilia likely reflects glucocorticoid-induced demargination, as opposed to an infectious process, given the temporal association with steroid administration. Persistent mild lymphocytosis is nonspecific but more likely to reflect a reactive rather than a clonal process. Elevated LDH and CK, as well as a greater increase of AST relative to ALT, suggest muscle injury, although mild concomitant hepatic injury cannot be excluded. Normal or negative serum studies for TSH, HIV, ANA, peripheral blood smear, and creatinine eliminate many of the systemic causes of her pruritus, but malignancy and associated paraneoplastic etiologies remain considerations.
The initial work-up for SPS includes electromyography (EMG) which would show spontaneous muscle activity. Her poorly localized sensory abnormalities, transient vestibular symptoms, and confusion warrant an MRI of the brain and spine to evaluate for inflammation (eg, encephalomyelitis), which could be consistent with PERM.
An MRI of the brain and cervicothoracic spine without contrast was significantly limited by motion artifact but without obvious intracranial or cord signal abnormalities. Electromyography demonstrated spontaneous muscle activity in both lower extremities with co-contraction of agonist and antagonist muscles (hamstrings and quadriceps as well as medial gastrocnemius and tibialis anterior). Sensory and motor nerve conductions were normal. Cerebral spinal fluid (CSF) contained six leukocytes (96% lymphocytes) and three red blood cells per microliter; glucose was 67 mg/dL and protein 24 mg/dL. There were two oligoclonal bands unique to the CSF. Cytology was negative for malignant cells.
The EMG narrows the differential diagnosis considerably. Co-contraction of opposing flexor and extensor groups (with predominance of extensors) on EMG is a diagnostic criterion for SPS and explains the myalgia and elevated CK. Her normal MRI studies effectively ruled out any focal lesion and did not show signs of encephalitis. Oligoclonal bands in the CSF are a sensitive marker of intrathecal inflammation, although not specific to one diagnosis. The mildly elevated cell count also supports CNS inflammation. In the setting of a lymphocytic pleocytosis and unique oligoclonal bands, it is important to consider infectious, neoplastic, autoimmune, and paraneoplastic causes of neuroinflammatory disorders.
Serum analyses, including antiglutamic acid decarboxylase 65 (GAD65) antibody and anti-amphiphysin antibody, should be ordered. The anti-GAD65 antibody is most commonly elevated in the setting of autoimmune diabetes mellitus; the titer, however, is usually dramatically higher in SPS. The CSF titer of anti-GAD65 antibodies is more specific than the serum titer for SPS. Antibodies against amphiphysin are typically elevated in paraneoplastic SPS, and anti-glycine receptor antibodies are associated with PERM, which commonly does not have elevated anti-GAD65 antibodies.
The serum GAD65 antibody level was greater than 265,000 × 103 IU/µL (normal <5,000), and the CSF level was 11.2 nmol/L (normal: ≤0.02). Serum amphiphysin antibody testing was negative.
Significantly elevated serum and CSF anti-GAD65 antibody levels are highly suggestive of SPS. Stiff person syndrome with rapidly progressive clinical symptoms raises the concern of a paraneoplastic neurologic syndrome. Although anti-amphiphysin antibody – the antibody classically associated with breast cancer and SPS – was negative, anti-GAD65 antibody has been implicated in paraneoplastic SPS with thymoma, lymphoma, and thyroid carcinoma. Paraneoplastic neurologic syndrome can predate a detectable malignancy by several years. As SPS and lymphoma are associated with pruritus and lymphocytosis, imaging is indicated to search for malignancy. Antiglycine receptor antibody, associated with PERM, is not routinely available commercially.
Computed tomography of the chest, abdomen, and pelvis with intravenous contrast revealed a 3.9 × 8.0 × 7.0 cm anterior mediastinal mass (Figure 1, Panel A). Biopsy of the mass demonstrated a thymoma. Given that the patient exhibited no further signs of CNS involvement, her initial transiently altered mental status was attributed to opioids and steroids. As she did not meet the clinical criteria for PERM, testing of antiglycine antibodies was not pursued.
She received scheduled baclofen and diazepam with as needed cyclobenzaprine for continued muscle spasms. Over the next several days, her stiffness, spasms, and myoclonic jerks slowly improved, and she was able to attempt physical therapy (Appendix Video 1; https://youtu.be/d0gLpTgqaCs). She subsequently received intravenous immunoglobulin (IVIG) with further improvement. After five months of scheduled diazepam and baclofen, she was able to ambulate with minimal assistance (Appendix Video 2; https://youtu.be/I00i638u00o). Given the absence of safe tissue planes for resection, the patient received neoadjuvant chemotherapy with four cycles of cyclophosphamide, doxorubicin, and cisplatin. Tumor size decreased to 1.7 × 6.5 × 5.2 cm (Figure 1, Panel B), and she subsequently underwent resection (Figure 2). Pathological analysis demonstrated a type B1 thymoma.
COMMENTARY
SPS is a condition of muscle stiffness and spasticity. Diagnosis is difficult and often delayed due to its rarity, with an approximate prevalence of one to two cases per million people.1 SPS typically occurs in middle age, and women are diagnosed twice as often as men. Classic SPS is characterized by axial and limb muscle stiffness, episodic spasms precipitated by tactile or auditory stimuli, continuous motor unit activity in agonist and antagonist muscles on EMG, high-titer antibody to GAD65 or amphiphysin, and the absence of an alternate diagnosis.2 Variant syndromes have been described, including a milder variant limited to the limbs, a severe variant with brainstem and spinal cord involvement, and a paraneoplastic variant.3 This patient’s clinical presentation, EMG findings, and extraordinarily high anti-GAD titers in the serum and CSF were diagnostic of SPS.
The pathophysiology of SPS is associated with autoantibodies targeting proteins such as GAD65, amphiphysin, gephyrin, and GABAA receptor-associated protein (GABARAP). These proteins are critical to gamma-aminobutyric acid (GABA) signaling, the primary inhibitory neurotransmitter pathway in the CNS (Figure 3).4 The formation of GABA from glutamate is catalyzed by GAD65. Gamma-aminobutyric acid is loaded into secretory vesicles, and amphiphysin facilitates vesicle recycling from the synaptic space.5 In the postsynaptic neuron, GABA binds the GABAA receptor, leading to neuronal hyperpolarization and resistance to excitation. The GABAA receptor is clustered on the plasma membrane through a scaffold formed by gephyrin. GABARAP facilitates this clustering, in part by linking GABAA receptors and gephyrin.6 Autoantibodies to these proteins may be pathogenic; however, the direct effects on their targets are unclear. The end result is decreased GABAergic activity, leading to continuous activation of opposing muscle groups. The resulting stiffness is characteristic of this disorder. Colchicine is known to antagonize GABAA receptor signaling, and this may have brought the underlying diagnosis of SPS to clinical attention.7,8
Symptomatic treatment of SPS targets the GABAergic system. Typically, high doses of scheduled benzodiazepines9 and baclofen10 are necessary. When symptoms are not controlled by GABAergic drugs, immunosuppression with corticosteroids and IVIG has been used, as have plasmapheresis and rituximab.11 The efficacy of the latter, however, was not supported by a randomized, placebo-controlled trial.12 This patient experienced significant improvement with benzodiazepines, baclofen, IVIG, and neoadjuvant chemotherapy prior to thymoma resection. The pruritus, paresthesia, and lymphocytosis also resolved with medical therapy. Interestingly, GABA signaling suppresses itch, suggesting that loss of GABAA signaling may have contributed to the development of pruritus.
SPS occasionally occurs as a paraneoplastic neurologic syndrome. Breast cancer is the most commonly associated malignancy, although associations between thymomas and SPS13 with anti-GAD65 antibodies14 have also been described. The presentation of thymomas is variable, with approximately one-third discovered incidentally on imaging, one-third producing symptoms of local compression, and one-third identified in the setting of another syndrome, most commonly myasthenia gravis. In addition to myasthenia gravis, thymomas have been associated with conditions such as hypogammaglobulinemia, pure red cell aplasia, and agranulocytosis. Stiff person syndrome is a known, albeit infrequently associated, condition.15
A critical step in arriving at the relevant differential diagnosis requires correctly framing the patient’s case.16 The treatment team’s initial frame was “a 69-year-old woman with weakness and elevated CK,” which prioritized causes of weakness and myositis. Stiff person syndrome does not cause weakness, but rather impaired movement from marked stiffness and spasms. The patient’s elevated CK was a result of continual muscle contractions. The physical exam and lack of motor deficit on EMG led the treatment team to reframe as “a 69-year-old woman with severe stiffness and spasms.” Egad! This correct frame was the key to diagnosis and confirmed by EMG and GAD65 antibody testing.
KEY LEARNING POINTS
- Classic SPS is characterized by axial and limb muscle stiffness, episodic spasms precipitated by tactile or auditory stimuli, continuous motor unit activity in agonist and antagonist muscles on EMG, and high-titer antibody to GAD65 or amphiphysin.
- SPS typically occurs in middle age, and women are diagnosed twice as often as men.
- Symptomatic treatment of SPS targets the GABAergic system. Typically, high doses of scheduled benzodiazepines and baclofenare necessary.
- SPS occasionally occurs as a paraneoplastic neurologic syndrome, most commonly in association with breast cancer.
Acknowledgments
The authors wish to thank Jason Kern, MD for his preparation and interpretation of the pathologic image; and the Jeremiah A. Barondess Fellowship in the Clinical Transaction of the New York Academy of Medicine, in collaboration with the Accreditation Council for Graduate Medical Education, for supporting Reza Manesh, MD.
Disclosures
The authors have nothing to disclose.
Appendix Video 1: This video was taken during a physical therapy session after 1 week of scheduled benzodiazepine and 2 days of intravenous immunoglobuli
Appendix Video 2: This video was taken 5 months after scheduled diazepam and baclofen, and 1 week prior to thymectomy. (https://youtu.be/I00i638u00o)
1. Hadavi S, Noyce AJ, Leslie RD, Giovannoni G. Stiff person syndrome. Pract Neurol. 2011;11(5):272-282. doi: 10.1136/practneurol-2011-000071
2. Dalakas MC. Stiff person syndrome: advances in pathogenesis and therapeutic interventions. Curr Treat Options Neurol. 2009;11(2):102-110. doi: 10.1007/s11940-009-0013-9
3. Murinson BB. Stiff-person syndrome. Neurologist. 2004;10(3):131-137. doi: 10.1097/01.nrl.0000126587.37087.1a
4. Rakocevic G, Floeter MK. Autoimmune stiff person syndrome and related myelopathies: understanding of electrophysiological and immunological processes. Muscle Nerve. 2012;45(5):623-634. doi: 10.1002/mus.23234
5. Zhang B, Zelhof AC. Amphiphysins: raising the BAR for synaptic vesicle recycling and membrane dynamics. Bin-Amphiphysin-Rvsp. Traffic. 2002;3(7):452-460. doi: 10.1034/j.1600-0854.2002.30702.x
6. Tyagarajan SK, Fritschy JM. Gephyrin: a master regulator of neuronal function? Nat Rev Neurosci. 2014;15(3):141-156. doi: 10.1038/nrn3670
7. Bueno OF, Leidenheimer NJ. Colchicine inhibits GABA(A) receptors independently of microtubule depolymerization. Neuropharmacology. 1998;37(3):383-390. doi: 10.1016/S0028-3908(98)00020-3
8. Weiner JL, Buhler AV, Whatley VJ, Harris RA, Dunwiddie TV. Colchicine is a competitive antagonist at human recombinant γ-aminobutyric acidA receptors. J Pharmacol Exp Ther. 1998;284(1):95-102 . PubMed
9. Lorish TR, Thorsteinsson G, Howard FM Jr. Stiff-man syndrome updated. Mayo Clin Proc. 1989;64(6):629-636. doi: 10.1016/S0025-6196(12)65339-7
10. McKeon A, Robinson MT, McEvoy KM, et al. Stiff-man syndrome and variants: clinical course, treatments, and outcomes. Arch Neurol. 2012;69(2):230-238. doi: 10.1001/archneurol.2011.991
11. Dalakas MC, Li M, Fujii M, Jacobowitz DM. Stiff person syndrome: quantification, specificity, and intrathecal synthesis of GAD65 antibodies. Neurology. 2001;57(5):780-784. doi: 10.1212/WNL.57.5.780
12. Dalakas MC, Rakocevic G, Dambrosia JM, Alexopoulos H, McElroy B. A double-blind, placebo-controlled study of rituximab in patients with stiff person syndrome. Ann Neurol. 2017;82(2):271-277. doi: 10.1002/ana.25002
13. Hagiwara H, Enomoto-Nakatani S, Sakai K, et al. Stiff-person syndrome associated with invasive thymoma: a case report. J Neurol Sci. 2001;193(1):59-62. doi: 10.1016/S0022-510X(01)00602-5
14. Vernino S, Lennon VA. Autoantibody profiles and neurological correlations of thymoma. Clin Cancer Res. 2004;10(21):7270-7275. doi: 10.1158/1078-0432.CCR-04-0735 PubMed
15. Thomas CR, Wright CD, Loehrer PJ. Thymoma: state of the art. J Clin Oncol. 1999;17(7):2280-2289. doi: 10.1200/JCO.1999.17.7.2280 PubMed
16. Stuart S, Hartig JR, Willett L. The importance of framing. J Gen Intern Med. 2017;32(6):706-710. doi: 10.1007/s11606-016-3964-z PubMed
© 2019 Society of Hospital Medicine
Things We Do For Good Reasons: Contact Precautions for Multidrug-resistant Organisms, Including MRSA and VRE
Contact precautions (CP), the use of gowns and gloves as personal protective equipment when caring for patients who are colonized or infected with one or more multidrug-resistant organisms (MDROs), is an important infection prevention intervention utilized to prevent pathogens from being transmitted among patients in healthcare settings. Recently, certain healthcare facilities have taken steps to limit the use of CP for patients colonized or infected with MDROs that are considered to be endemic, namely methicillin-resistant Staphylococcus aureus (MRSA) and vancomycin-resistant Enterococci (VRE). In this issue of the Journal of Hospital Medicine, authors Young et al. argue that CP for MRSA and VRE is an intervention that should be eliminated as part of the Choosing Wisely® campaign because it is a “thing we do for no reason.”1 We respectfully disagree with this characterization of CP for MRSA and VRE, and we assert instead that CP are a necessary practice that should be continued.
Young et al. refer to published studies and a recent meta-analysis that did not conclusively show a benefit of CP for MRSA and VRE.2 The quasi-experimental studies cited have major methodological flaws that limit their ability to demonstrate the effect of CP. Most importantly, these studies fail to account for the fact that among patients who develop an infection following hospital-acquired MRSA colonization, approximately 70% of the infections are identified after discharge.3 When such studies do not restrict their outcome measure to include only those infections occurring among patients with hospital-acquired colonization, and do not take steps to accurately identify postdischarge infections that occur in such patients, their results are biased toward the null and difficult to interpret. Due to several serious challenges to study feasibility, including the need for an extremely large sample size, a very long period of follow-up, and the need to control for a variety of other concurrent infection prevention measures, there may never be a study that conclusively proves that CP, apart from other infection prevention interventions, has a significant impact. However, despite these limitations, one of the recent multicenter randomized controlled trials, cited by the authors as evidence against the use of CP, was able to demonstrate a significant reduction in MRSA transmission using universal gowns and gloves for all intensive care unit patients, even in sites that utilized other effective strategies, including chlorhexidine bathing.4,5
In this issue of the Journal of Hospital Medicine®, Young et al. acknowledge that CP are generally utilized as part of a comprehensive package of infection prevention approaches that also includes hand hygiene, environmental cleaning, antimicrobial stewardship, and evidence-based interventions to prevent device- and procedure-related infections. This multifaceted approach makes it more difficult to determine the attributable effect of CP alone. However, there is a strong rationale for using CP to prevent transmission, and there are numerous examples where the use of bundled approaches that include CP was associated with success. In the Netherlands, CP were part of an aggressive “search and destroy” approach to MRSA associated with almost total elimination of MRSA from hospitals in that country. The United Kingdom achieved an 80% decrease in MRSA bacteremia following a series of aggressive intervention policies designed to prevent MRSA transmission, including use of screening and CP.6 In the United States, the Veterans Affairs system utilizes this type of approach and reported a 62% decrease in MRSA rates. Subsequent analysis showed that the downward trend of hospital-onset MRSA infections was observed only among patients who were not carrying MRSA at the time of admission, suggesting that preventing transmission was an important contributor to the overall trends.7,8 More broadly, healthcare-associated MRSA rates in the United States have decreased dramatically over the past decade,9,10 a period during which more than 81% of hospitals reported using CP for patients colonized or infected with MRSA as part of the bundle of infection prevention approaches.11 Given these decreases, and the potential role that CP played in achieving these results, we, along with others,12 urge caution about the dangers of abandoning CP prematurely and without data to indicate that it is safe to stop.
Although some studies report adverse events associated with CP, including a reduced number of visits from healthcare personnel and increased anxiety and depression, these studies rarely control for important confounding variables such as the severity of illness or the presence of anxiety and depression at the time of hospital admission.13-15 The highest-quality evidence in studies that control for severity of illness and the presence of depression at the time of admission suggests that CP are not associated with an increased incidence of adverse events.16,17
Interestingly, Young et al. acknowledge that CP are important and should be continued for patients infected or colonized with certain MDROs, including carbapenem-resistant Enterobacteriaceae, multidrug-resistant Pseudomonas aeruginosa, and Candida auris. They even suggest continuing CP for patients with certain types of antimicrobial-resistant Staphylococcus aureus isolates that are resistant or intermediate to vancomycin (Vancomycin-resistant Staphylococcus aureus [VRSA] or Vancomycin-interm
The authors state that CP should be employed to help interrupt outbreaks and for patients with high-risk situations such as open wounds, uncontained secretions, or incontinent diarrhea. We agree that there is appeal to a risk-based approach in which CP are applied based on the likelihood that an individual patient may be carrying and shedding an MDRO. However, to our knowledge, there are no validated algorithms available for this purpose, and it appears likely that using such algorithms would result in an increase in the proportion of patients cared for using CP, rather than a decrease.
The use of CP when caring for patients colonized or infected with an MDRO is considered to be a standard of care. Based on experimental, clinical, and epidemiologic studies and a strong theoretical rationale, the use of CP is currently recommended by the United States Centers for Disease Control and Prevention (CDC), the Healthcare Infection Control Practices Advisory Committee (HICPAC),18 the Society for Healthcare Epidemiology of America (SHEA),19 and the Infectious Diseases Society of America.20 Many healthcare facilities continue to employ CP for patients with a wide array of MDROs, including MRSA and VRE, and many infection prevention experts continue to support and utilize this approach. In response to the growing movement to discontinue CP, the CDC recently reaffirmed its support and recommendation for the use of CP when caring for patients colonized or infected with MRSA.21
In summary, a bundled, multifaceted approach to infection prevention and transmission of MDROs is extremely important, and we caution against stopping CP for MRSA and VRE before data are available on the potential harm of that approach. Study limitations make it difficult to demonstrate the individual contribution of CP, but CP are an important component of a comprehensive infection prevention MDRO bundle that has successfully reduced healthcare-associated MRSA. Well-designed studies that control for confounders such as the severity of illness at the time of admission suggest that CP are not associated with an increased incidence of adverse events. Currently available data do not support a selective approach to utilizing CP for some MDROs while not using CP for others. Current guidelines call for the use of CP for preventing MDRO transmission, including MRSA and VRE. Healthcare facilities need to focus on how to implement CP in a patient-centered manner, rather than abandoning CP for some MDROs.
Disclosures
Dr. Maragakis is a member of the Healthcare Infection Control Practices Advisory Committee for the Centers for Disease Control and Prevention. Dr. Jernigan is an employee of the Centers for Disease Control and Prevention.
Disclaimer
The findings and conclusions in this report are those of the authors and do not necessarily represent the official position of the Centers for Disease Control and Prevention.
1. Young K, Doernberg SB, Snedecor RF, Mallin E. Things we do for no reason: contact precautions for MRSA and VRE. J Hosp Med. 2019:14:178-181. doi: 10.12788/jhm.3126). PubMed
2. Marra AR, Edmond MB, Schweizer ML, Ryan GW, Diekema DJ. Discontinuing contact precautions for multidrug-resistant organisms: A systematic literature review and meta-analysis. Am J Infect Control. 2018;46(3):333-340. doi: 10.1016/j.ajic.2017.08.031. PubMed
3. Nelson RE, Evans ME, Simbartl L, et al. Methicillin-resistant staphylococcus aureus colonization and pre- and post-hospital discharge infection risk. Clin Infect Dis. 2018. doi: 10.1093/cid/ciy507. PubMed
4. Harris AD, Pineles L, Belton B, et al. Universal glove and gown use and acquisition of antibiotic-resistant bacteria in the ICU: a randomized trial. JAMA. 2013;310(15):1571-1580. doi: 10.1001/jama.2013.277815. PubMed
5. Morgan DJ, Pineles L, Shardell M, et al. Effect of chlorhexidine bathing and other infection control practices on the Benefits of Universal Glove and Gown (BUGG) trial: a subgroup analysis. Infect Control Hosp Epidemiol. 2015;36(6):734-737. doi: 10.1017/ice.2015.33. PubMed
6. Duerden B, Fry C, Johnson AP, Wilcox MH. The control of methicillin-resistant Staphylococcus aureus blood stream infections in England. Open Forum Infect Dis. 2015;2(2):ofv035. doi: 10.1093/ofid/ofv035. PubMed
7. Jain R, Kralovic SM, Evans ME, et al. Veterans affairs initiative to prevent methicillin-resistant Staphylococcus aureus infections. N Engl J Med. 2011;364(15):1419-1430. doi: 10.1056/NEJMoa1007474. PubMed
8. Jones M, Ying J, Huttner B, et al. Relationships between the importation, transmission, and nosocomial infections of methicillin-resistant Staphylococcus aureus: an observational study of 112 Veterans Affairs Medical Centers. Clin Infect Dis. 2014;58(1):32-39. doi: 10.1093/cid/cit668. PubMed
9. U.S. Centers for Disease Control and Prevention: Active Bacterial Core surveillance (ABCs) Report: Emerging Infections Program Network, Methicillin-Resistant Staphylococcus aureus, 2005 (Update). 2005; https://www.cdc.gov/abcs/reports-findings/survreports/mrsa05.html. Accessed December 9, 2018.
10. U.S. Centers for Disease Control and Prevention Active Bacterial Core surveillance (ABCs) Report: Emerging Infections Program Network, Methicillin-Resistant Staphylcoccus aureus, 2014. 2014; https://www.cdc.gov/abcs/reports-findings/survreports/mrsa14.html. Accessed December 10, 2018.
11. Weiner LM, Webb AK, Walters MS, Dudeck MA, Kallen AJ. Policies for controlling multidrug-resistant organisms in us healthcare facilities reporting to the national healthcare safety network, 2014. Infect Control Hosp Epidemiol. 2016;37(9):1105-1108. doi: 10.1017/ice.2016.139. PubMed
12. Rubin MA, Samore MH, Harris AD. The importance of contact precautions for endemic methicillin-resistant Staphylococcus aureus and vancomycin-resistant Enterococci. JAMA. 2018;319(9):863-864. doi:10.1001/jama.2017.21122. PubMed
13. Stelfox HT, Bates DW, Redelmeier DA. Safety of patients isolated for infection control. JAMA. 2003;290(14):1899-1905. doi: 10.1001/jama.290.14.1899. PubMed
14. Day HR, Morgan DJ, Himelhoch S, Young A, Perencevich EN. Association between depression and contact precautions in veterans at hospital admission. Am J Infect Control. 2011;39(2):163-165. doi: 10.1016/j.ajic.2010.06.024. PubMed
15. Day HR, Perencevich EN, Harris AD, et al. Do contact precautions cause depression? A two-year study at a tertiary care medical centre. J Hosp Infect. 2011;79(2):103-107. doi: 10.1016/j.jhin.2011.03.026. PubMed
16. Day HR, Perencevich EN, Harris AD, et al. Depression, anxiety, and moods of hospitalized patients under contact precautions. Infect Control Hosp Epidemiol. 2013;34(3):251-258. doi: 10.1086/669526. PubMed
17. Croft LD, Harris AD, Pineles L, et al. The effect of universal glove and gown use on adverse events in intensive care unit patients. Clin Infect Dis. 2015;61(4):545-553. doi: 10.1093/cid/civ315. PubMed
18. Siegel JD, Rhinehart E, Jackson M, Chiarello L. Health care infection control practices advisory committee. 2007 guideline for isolation precautions: preventing transmission of infectious agents in health care settings. Am J Infect Control. 2007;35(10 Suppl 2):S65-S164. doi: 10.1016/j.ajic.2007.10.007. PubMed
19. Calfee DP, Salgado CD, Milstone AM, et al. Strategies to prevent methicillin-resistant Staphylococcus aureus transmission and infection in acute care hospitals: 2014 update. Infect Control Hosp Epidemiol. 2014;35(Suppl 2):S108-S132. doi: 10.1086/676534. PubMed
20. Cohen SH, Gerding DN, Johnson S, et al. Clinical practice guidelines for Clostridium difficile infection in adults: 2010 update by the society for healthcare epidemiology of America (SHEA) and the infectious diseases society of America (IDSA). Infect Control Hosp Epidemiol. 2010;31(5):431-455. doi: 10.1086/651706. PubMed
21. The U.S. Centers for Disease Control and Prevention; Methicillin Resistant Staphylococcus aureus (MRSA): Information for Inpatient Clinicians and Administrators. 2018; https://www.cdc.gov/mrsa/healthcare/clinicians/index.html. Accessed December 9, 2018.
Contact precautions (CP), the use of gowns and gloves as personal protective equipment when caring for patients who are colonized or infected with one or more multidrug-resistant organisms (MDROs), is an important infection prevention intervention utilized to prevent pathogens from being transmitted among patients in healthcare settings. Recently, certain healthcare facilities have taken steps to limit the use of CP for patients colonized or infected with MDROs that are considered to be endemic, namely methicillin-resistant Staphylococcus aureus (MRSA) and vancomycin-resistant Enterococci (VRE). In this issue of the Journal of Hospital Medicine, authors Young et al. argue that CP for MRSA and VRE is an intervention that should be eliminated as part of the Choosing Wisely® campaign because it is a “thing we do for no reason.”1 We respectfully disagree with this characterization of CP for MRSA and VRE, and we assert instead that CP are a necessary practice that should be continued.
Young et al. refer to published studies and a recent meta-analysis that did not conclusively show a benefit of CP for MRSA and VRE.2 The quasi-experimental studies cited have major methodological flaws that limit their ability to demonstrate the effect of CP. Most importantly, these studies fail to account for the fact that among patients who develop an infection following hospital-acquired MRSA colonization, approximately 70% of the infections are identified after discharge.3 When such studies do not restrict their outcome measure to include only those infections occurring among patients with hospital-acquired colonization, and do not take steps to accurately identify postdischarge infections that occur in such patients, their results are biased toward the null and difficult to interpret. Due to several serious challenges to study feasibility, including the need for an extremely large sample size, a very long period of follow-up, and the need to control for a variety of other concurrent infection prevention measures, there may never be a study that conclusively proves that CP, apart from other infection prevention interventions, has a significant impact. However, despite these limitations, one of the recent multicenter randomized controlled trials, cited by the authors as evidence against the use of CP, was able to demonstrate a significant reduction in MRSA transmission using universal gowns and gloves for all intensive care unit patients, even in sites that utilized other effective strategies, including chlorhexidine bathing.4,5
In this issue of the Journal of Hospital Medicine®, Young et al. acknowledge that CP are generally utilized as part of a comprehensive package of infection prevention approaches that also includes hand hygiene, environmental cleaning, antimicrobial stewardship, and evidence-based interventions to prevent device- and procedure-related infections. This multifaceted approach makes it more difficult to determine the attributable effect of CP alone. However, there is a strong rationale for using CP to prevent transmission, and there are numerous examples where the use of bundled approaches that include CP was associated with success. In the Netherlands, CP were part of an aggressive “search and destroy” approach to MRSA associated with almost total elimination of MRSA from hospitals in that country. The United Kingdom achieved an 80% decrease in MRSA bacteremia following a series of aggressive intervention policies designed to prevent MRSA transmission, including use of screening and CP.6 In the United States, the Veterans Affairs system utilizes this type of approach and reported a 62% decrease in MRSA rates. Subsequent analysis showed that the downward trend of hospital-onset MRSA infections was observed only among patients who were not carrying MRSA at the time of admission, suggesting that preventing transmission was an important contributor to the overall trends.7,8 More broadly, healthcare-associated MRSA rates in the United States have decreased dramatically over the past decade,9,10 a period during which more than 81% of hospitals reported using CP for patients colonized or infected with MRSA as part of the bundle of infection prevention approaches.11 Given these decreases, and the potential role that CP played in achieving these results, we, along with others,12 urge caution about the dangers of abandoning CP prematurely and without data to indicate that it is safe to stop.
Although some studies report adverse events associated with CP, including a reduced number of visits from healthcare personnel and increased anxiety and depression, these studies rarely control for important confounding variables such as the severity of illness or the presence of anxiety and depression at the time of hospital admission.13-15 The highest-quality evidence in studies that control for severity of illness and the presence of depression at the time of admission suggests that CP are not associated with an increased incidence of adverse events.16,17
Interestingly, Young et al. acknowledge that CP are important and should be continued for patients infected or colonized with certain MDROs, including carbapenem-resistant Enterobacteriaceae, multidrug-resistant Pseudomonas aeruginosa, and Candida auris. They even suggest continuing CP for patients with certain types of antimicrobial-resistant Staphylococcus aureus isolates that are resistant or intermediate to vancomycin (Vancomycin-resistant Staphylococcus aureus [VRSA] or Vancomycin-interm
The authors state that CP should be employed to help interrupt outbreaks and for patients with high-risk situations such as open wounds, uncontained secretions, or incontinent diarrhea. We agree that there is appeal to a risk-based approach in which CP are applied based on the likelihood that an individual patient may be carrying and shedding an MDRO. However, to our knowledge, there are no validated algorithms available for this purpose, and it appears likely that using such algorithms would result in an increase in the proportion of patients cared for using CP, rather than a decrease.
The use of CP when caring for patients colonized or infected with an MDRO is considered to be a standard of care. Based on experimental, clinical, and epidemiologic studies and a strong theoretical rationale, the use of CP is currently recommended by the United States Centers for Disease Control and Prevention (CDC), the Healthcare Infection Control Practices Advisory Committee (HICPAC),18 the Society for Healthcare Epidemiology of America (SHEA),19 and the Infectious Diseases Society of America.20 Many healthcare facilities continue to employ CP for patients with a wide array of MDROs, including MRSA and VRE, and many infection prevention experts continue to support and utilize this approach. In response to the growing movement to discontinue CP, the CDC recently reaffirmed its support and recommendation for the use of CP when caring for patients colonized or infected with MRSA.21
In summary, a bundled, multifaceted approach to infection prevention and transmission of MDROs is extremely important, and we caution against stopping CP for MRSA and VRE before data are available on the potential harm of that approach. Study limitations make it difficult to demonstrate the individual contribution of CP, but CP are an important component of a comprehensive infection prevention MDRO bundle that has successfully reduced healthcare-associated MRSA. Well-designed studies that control for confounders such as the severity of illness at the time of admission suggest that CP are not associated with an increased incidence of adverse events. Currently available data do not support a selective approach to utilizing CP for some MDROs while not using CP for others. Current guidelines call for the use of CP for preventing MDRO transmission, including MRSA and VRE. Healthcare facilities need to focus on how to implement CP in a patient-centered manner, rather than abandoning CP for some MDROs.
Disclosures
Dr. Maragakis is a member of the Healthcare Infection Control Practices Advisory Committee for the Centers for Disease Control and Prevention. Dr. Jernigan is an employee of the Centers for Disease Control and Prevention.
Disclaimer
The findings and conclusions in this report are those of the authors and do not necessarily represent the official position of the Centers for Disease Control and Prevention.
1. Young K, Doernberg SB, Snedecor RF, Mallin E. Things we do for no reason: contact precautions for MRSA and VRE. J Hosp Med. 2019:14:178-181. doi: 10.12788/jhm.3126). PubMed
2. Marra AR, Edmond MB, Schweizer ML, Ryan GW, Diekema DJ. Discontinuing contact precautions for multidrug-resistant organisms: A systematic literature review and meta-analysis. Am J Infect Control. 2018;46(3):333-340. doi: 10.1016/j.ajic.2017.08.031. PubMed
3. Nelson RE, Evans ME, Simbartl L, et al. Methicillin-resistant staphylococcus aureus colonization and pre- and post-hospital discharge infection risk. Clin Infect Dis. 2018. doi: 10.1093/cid/ciy507. PubMed
4. Harris AD, Pineles L, Belton B, et al. Universal glove and gown use and acquisition of antibiotic-resistant bacteria in the ICU: a randomized trial. JAMA. 2013;310(15):1571-1580. doi: 10.1001/jama.2013.277815. PubMed
5. Morgan DJ, Pineles L, Shardell M, et al. Effect of chlorhexidine bathing and other infection control practices on the Benefits of Universal Glove and Gown (BUGG) trial: a subgroup analysis. Infect Control Hosp Epidemiol. 2015;36(6):734-737. doi: 10.1017/ice.2015.33. PubMed
6. Duerden B, Fry C, Johnson AP, Wilcox MH. The control of methicillin-resistant Staphylococcus aureus blood stream infections in England. Open Forum Infect Dis. 2015;2(2):ofv035. doi: 10.1093/ofid/ofv035. PubMed
7. Jain R, Kralovic SM, Evans ME, et al. Veterans affairs initiative to prevent methicillin-resistant Staphylococcus aureus infections. N Engl J Med. 2011;364(15):1419-1430. doi: 10.1056/NEJMoa1007474. PubMed
8. Jones M, Ying J, Huttner B, et al. Relationships between the importation, transmission, and nosocomial infections of methicillin-resistant Staphylococcus aureus: an observational study of 112 Veterans Affairs Medical Centers. Clin Infect Dis. 2014;58(1):32-39. doi: 10.1093/cid/cit668. PubMed
9. U.S. Centers for Disease Control and Prevention: Active Bacterial Core surveillance (ABCs) Report: Emerging Infections Program Network, Methicillin-Resistant Staphylococcus aureus, 2005 (Update). 2005; https://www.cdc.gov/abcs/reports-findings/survreports/mrsa05.html. Accessed December 9, 2018.
10. U.S. Centers for Disease Control and Prevention Active Bacterial Core surveillance (ABCs) Report: Emerging Infections Program Network, Methicillin-Resistant Staphylcoccus aureus, 2014. 2014; https://www.cdc.gov/abcs/reports-findings/survreports/mrsa14.html. Accessed December 10, 2018.
11. Weiner LM, Webb AK, Walters MS, Dudeck MA, Kallen AJ. Policies for controlling multidrug-resistant organisms in us healthcare facilities reporting to the national healthcare safety network, 2014. Infect Control Hosp Epidemiol. 2016;37(9):1105-1108. doi: 10.1017/ice.2016.139. PubMed
12. Rubin MA, Samore MH, Harris AD. The importance of contact precautions for endemic methicillin-resistant Staphylococcus aureus and vancomycin-resistant Enterococci. JAMA. 2018;319(9):863-864. doi:10.1001/jama.2017.21122. PubMed
13. Stelfox HT, Bates DW, Redelmeier DA. Safety of patients isolated for infection control. JAMA. 2003;290(14):1899-1905. doi: 10.1001/jama.290.14.1899. PubMed
14. Day HR, Morgan DJ, Himelhoch S, Young A, Perencevich EN. Association between depression and contact precautions in veterans at hospital admission. Am J Infect Control. 2011;39(2):163-165. doi: 10.1016/j.ajic.2010.06.024. PubMed
15. Day HR, Perencevich EN, Harris AD, et al. Do contact precautions cause depression? A two-year study at a tertiary care medical centre. J Hosp Infect. 2011;79(2):103-107. doi: 10.1016/j.jhin.2011.03.026. PubMed
16. Day HR, Perencevich EN, Harris AD, et al. Depression, anxiety, and moods of hospitalized patients under contact precautions. Infect Control Hosp Epidemiol. 2013;34(3):251-258. doi: 10.1086/669526. PubMed
17. Croft LD, Harris AD, Pineles L, et al. The effect of universal glove and gown use on adverse events in intensive care unit patients. Clin Infect Dis. 2015;61(4):545-553. doi: 10.1093/cid/civ315. PubMed
18. Siegel JD, Rhinehart E, Jackson M, Chiarello L. Health care infection control practices advisory committee. 2007 guideline for isolation precautions: preventing transmission of infectious agents in health care settings. Am J Infect Control. 2007;35(10 Suppl 2):S65-S164. doi: 10.1016/j.ajic.2007.10.007. PubMed
19. Calfee DP, Salgado CD, Milstone AM, et al. Strategies to prevent methicillin-resistant Staphylococcus aureus transmission and infection in acute care hospitals: 2014 update. Infect Control Hosp Epidemiol. 2014;35(Suppl 2):S108-S132. doi: 10.1086/676534. PubMed
20. Cohen SH, Gerding DN, Johnson S, et al. Clinical practice guidelines for Clostridium difficile infection in adults: 2010 update by the society for healthcare epidemiology of America (SHEA) and the infectious diseases society of America (IDSA). Infect Control Hosp Epidemiol. 2010;31(5):431-455. doi: 10.1086/651706. PubMed
21. The U.S. Centers for Disease Control and Prevention; Methicillin Resistant Staphylococcus aureus (MRSA): Information for Inpatient Clinicians and Administrators. 2018; https://www.cdc.gov/mrsa/healthcare/clinicians/index.html. Accessed December 9, 2018.
© 2019 Society of Hospital Medicine
The Critical Role of Hospitalists for Successful Hospital-SNF Integration Hospitalists and Hospital/SNF Integration
In 2015, the Centers for Medicare and Medicaid Services (CMS) tied 42% of Medicare payments to a value-based model of care.1 Many of these models are designed to expand the scope of hospitals’ accountability to include care provided to patients postdischarge (eg, readmission penalties, bundled payments, accountable care organizations). With such a significant change in organizational incentives, one would expect to see activity as it relates to hospital-skilled nursing facility (SNF) integration, potentially including shared risk among providers.2,3
Hospitals can choose from several different strategies when contemplating SNF integration, such as vertical integration with SNFs, which would involve acquiring and owning SNFs. However, despite the high level of incentive alignment and financial integration achieved through SNF acquisition, this strategy has not been widely adopted. Perhaps this is because hospitals can often attain a shorter length of stay and lower readmission rates without taking on the additional risk of owning a facility, except under particular market conditions.4 Hospitals can alternatively pursue virtual integration by developing preferred provider networks through contractual relationships or other formal processes, attempting to direct patients to SNF providers that have met predefined criteria, as described by Conway and colleagues in this issue of the Journal of Hospital Medicine®.5 While hospitals have adopted this form of integration more widely than vertical integration, only those with additional financial motivations, such as those employing bundled payments, engaged in accountable care organizations (ACOs) or forward-thinking organizations preparing for looming global models of payment, have implemented such action. Finally, hospitals can focus on relational coordination through informal person-to-person communication and transition management. Given the high number of patients discharged to SNFs, the strategies above are not mutually exclusive, and enhanced relational coordination is most likely going to occur regardless of the type of—and perhaps even without—organizational-level integration.
For those hospitals choosing not to pursue integration with SNFs, there are several reasons to maintain the status quo. First, hospitals have different interpretations of provider choice (“beneficiary freedom to choose”), whereby many do not believe they can provide information to patients outside of facility names and addresses. As such, they will refrain from developing a SNF network due to their interpretation of hazy federal rules.6 Second, it is possible that the incremental benefit of establishing a network is viewed by many hospitals as not worth the cost, measured by the time and effort required and the potential risk of not adhering to choice requirements. This could be especially true for hospitals without additional financial motivations, such as participation in an ACO or bundled payment program.
As the landscape continues to evolve, more successful systems will embrace a more concordant partnership with local and regional SNF providers, and several market factors will support the trend. First, the Medicare Payment Advisory Commission (MedPAC) is discussing the idea of choice in the context of postacute discharge, potentially leading to hospitals relaxing their strict interpretations of choice and the level of information provided to patients.7 Second, the evidence supports better patient outcomes when hospitals develop SNF networks.8,9 Finally, continued penetration of value-based payment models combined with CMS decisions regarding choice will continue to provide the additional motivation hospitals may need to change the cost-benefit calculation in favor of developing a network.
IMPLICATIONS FOR HOSPITALISTS
Traditionally, primary care physicians followed their patients through the acute- and postacute care continuum, but a variety of changes led to the growth of hospital medicine as fewer primary care physicians saw patients in the hospital.10,11 This shift has challenged efforts to ensure continuity of care across settings, especially since most hospitalists have ceded control of postdischarge placement to case managers and therapists. Further, there has been little incentive to connect hospitalists to any other component or provider along the range of care, and compensation models rarely, if at all, consider any accountability for patient outcomes outside the hospital. Several factors can change this reality for hospitalists.
First, as more providers adopt team-based care approaches and as alternative payment models expand the scope of accountability, hospitalists will become an even more central component of the risk evaluation process for hospitalized patients as it relates to their discharge profile. This could mean that hospitalists are more involved in the postdischarge follow-up of patients sent home, to make sure patients adhere to discharge instructions. Alternatively, hospitalists may need to increase the level of physician-to-physician communication with SNF medical directors for patients discharged to SNF. This, in turn, could result in an increasing number of hospitalist groups recruiting SNFists to join their group or potentially assigning existing hospitalists or physician assistants to round on patients in the SNF. The 2018 Society of Hospital Medicine report showed an increase in activity among hospital medicine groups performing services in postacute-care facilities outside the hospital from 13% in 2016 to 25% in 2018.12 Similarly, a 2017 study in JAMA Internal Medicine reported a 48.2% increase in the number of physicians classified as SNFists from 2007 to 2014.13
Second, hospitalists will be more involved in the discharge planning process through internal interdisciplinary team communications. Whereas case managers and therapists owned the discharge planning process historically, new teams will include hospitalists, case managers, physical therapists, and pharmacists. System leaders will task them with identifying the appropriate discharge destination (eg, SNF, home health), finalizing the medication reconciliation, scheduling follow-up appointments, and completing a warm handoff.
Finally, as the field matures and hospitalists learn more about postacute-care connections, they will continue to be held more accountable for patient outcomes postdischarge. Many hospitalists have already connected to community providers through checklists and use evidence-based discharge programs like ProjectRed or Project BOOST.14,15 Organizations will need a similar strategy for SNFs, developing process measures, with the input of hospitalists, around those noteworthy areas that hospitalists can control. This will require greater alignment among constituents around overall organizational goals and, more importantly, entail the hospitalist to be attuned to overall patient goals beyond the care provided in the hospital setting.
As payment and care models continue to evolve, the status quo cannot be sustained. We anticipate that hospitalists will become more integrated into the patient discharge process, especially as it relates to discharge to SNFs before patients reconnect to their community physicians. Hospital systems will accelerate integration through the development of preferred SNF networks, and hospitalists stand to play a critical role in the success of these arrangements by enriching the benefits they create through these outward relationships.
For organizations engaged in embedded networks, they can realize gains via incentive alignment, trust, information transfer, mutual support, and coordination through virtual integration, without requiring vertical ownership.3,16Thus, the opportunity exists for hospitalists to be critical drivers of network success, serving as intermediaries from which information, collaboration, and shared problem-solving flow between hospitals, SNFs, patients, and the entire care team. Opportunities to rebuild our system are long past; however, like all changing sectors in healthcare, the disaggregate acute and postacute settings must move in lockstep. Hospitals and postacute care facilities must find ways to alter their thinking to eradicate the obstructive and injurious invisible wall.
Disclosures
The authors have nothing to disclose.
1. Catalyst for Payment Reform. CPR Scorecard on Medicare Payment Reform 2015.
2. Mick S, Shay P. Accountable care organizations and transaction cost economics. Med Care Res Rev. 2016;73(6):649-659. doi: 10.1177/1077558716640411. PubMed
3. Shay P, Mick S. Post-acute care and vertical integration after the Patient Protection and Affordable Care Act. J Healthc Manag. 2013;58(1):15-27. PubMed
4. McHugh J, Zinn J, Shield R, et al. Strategy and risk-sharing in hospital-postacute care integration. Health Care Manage Rev. 2018. doi: 10.1097/HMR.0000000000000204. PubMed
5. Conway S, Parekh A, Hughes A, et al. Post-acute care transitions: developing a skilled nursing facility collaborative within an academic health system. J Hosp Med. 2019;14(3):174-177. doi: 10.12788/jhm.3117. PubMed
6. Tyler D, Gadbois E, McHugh J, Shield R, Winblad U, Mor V. Patients are not given quality-of-care data about skilled nursing facilities when discharged from hospitals. Health Aff. 2017;36(8):1385-1391. doi: 10.1377/hlthaff.2017.0155. PubMed
7. Medicare Payment Advisory Commission. Encouraging Medicare Beneficiaries to Use Higher Quality Post-Acute Care Providers. Washington, DC: MedPAC; 2018.
8. McHugh J, Foster A, Mor V, et al. Reducing hospital readmissions through preferred networks of skilled nursing facilities. Health Aff. 2017;36(9):1591-1598. doi: 10.1377/hlthaff.2017.0211. PubMed
9. Rahman M, Foster A, Grabowski D, Zinn J, Mor V. Effect of hospital-SNF referral linkages on rehospitalization. Health Serv Res. 2013;48(6):1898-1919. doi: 10.1111/1475-6773.12112. PubMed
10. Wachter R, Goldman L. Zero to 50,000 - The 20th anniversary of the hospitalist. N Engl J Med. 2016;375(11):1009-1011. doi: 10.1056/NEJMp1607958. PubMed
11. Kripalani S, Jackson A, Schnipper J, Coleman E. Promoting effective transitions of care at hopsital discharge: A review of key issues for hospitalists. J Hosp Med. 2007;2(5):314-323. doi: 10.1002/jhm.228. PubMed
12. Society of Hospital Medicine. 2018 State of Hospital Medicine Report. Philadelphia: Society of Hospital Medicine; 2018. 2018 SHM Report.
13. Teno J, Gozalo P, Trivedi A, Mitchell S, Bunker J, Mor V. Temporal trends in the numbers of skilled nursing facility specialists from 2007 through 2014. JAMA Intern Med. 2017;177(9):1376-1378. doi: 10.1001/jamainternmed.2017.2136. PubMed
14. Boston University Medical Center. Project RED Re-Engineered Discharge. Project RED. Available at: https://www.bu.edu/fammed/projectred/. Accessed Dec 9, 2018.
15. Hansen L, Greenwald J, Budnitz T, et al. Project BOOST: effectiveness of a multihospital effort to reduce rehospitalization. J Hosp Med. 2013;8:421-427. doi: 10.1002/jhm.2054. PubMed
16. Uzzi B. The sources and consequences of embeddedness for the economic performance of organizations: the network effect. Am Sociol Rev. 1996:674-698. doi: 10.2307/2096399.
In 2015, the Centers for Medicare and Medicaid Services (CMS) tied 42% of Medicare payments to a value-based model of care.1 Many of these models are designed to expand the scope of hospitals’ accountability to include care provided to patients postdischarge (eg, readmission penalties, bundled payments, accountable care organizations). With such a significant change in organizational incentives, one would expect to see activity as it relates to hospital-skilled nursing facility (SNF) integration, potentially including shared risk among providers.2,3
Hospitals can choose from several different strategies when contemplating SNF integration, such as vertical integration with SNFs, which would involve acquiring and owning SNFs. However, despite the high level of incentive alignment and financial integration achieved through SNF acquisition, this strategy has not been widely adopted. Perhaps this is because hospitals can often attain a shorter length of stay and lower readmission rates without taking on the additional risk of owning a facility, except under particular market conditions.4 Hospitals can alternatively pursue virtual integration by developing preferred provider networks through contractual relationships or other formal processes, attempting to direct patients to SNF providers that have met predefined criteria, as described by Conway and colleagues in this issue of the Journal of Hospital Medicine®.5 While hospitals have adopted this form of integration more widely than vertical integration, only those with additional financial motivations, such as those employing bundled payments, engaged in accountable care organizations (ACOs) or forward-thinking organizations preparing for looming global models of payment, have implemented such action. Finally, hospitals can focus on relational coordination through informal person-to-person communication and transition management. Given the high number of patients discharged to SNFs, the strategies above are not mutually exclusive, and enhanced relational coordination is most likely going to occur regardless of the type of—and perhaps even without—organizational-level integration.
For those hospitals choosing not to pursue integration with SNFs, there are several reasons to maintain the status quo. First, hospitals have different interpretations of provider choice (“beneficiary freedom to choose”), whereby many do not believe they can provide information to patients outside of facility names and addresses. As such, they will refrain from developing a SNF network due to their interpretation of hazy federal rules.6 Second, it is possible that the incremental benefit of establishing a network is viewed by many hospitals as not worth the cost, measured by the time and effort required and the potential risk of not adhering to choice requirements. This could be especially true for hospitals without additional financial motivations, such as participation in an ACO or bundled payment program.
As the landscape continues to evolve, more successful systems will embrace a more concordant partnership with local and regional SNF providers, and several market factors will support the trend. First, the Medicare Payment Advisory Commission (MedPAC) is discussing the idea of choice in the context of postacute discharge, potentially leading to hospitals relaxing their strict interpretations of choice and the level of information provided to patients.7 Second, the evidence supports better patient outcomes when hospitals develop SNF networks.8,9 Finally, continued penetration of value-based payment models combined with CMS decisions regarding choice will continue to provide the additional motivation hospitals may need to change the cost-benefit calculation in favor of developing a network.
IMPLICATIONS FOR HOSPITALISTS
Traditionally, primary care physicians followed their patients through the acute- and postacute care continuum, but a variety of changes led to the growth of hospital medicine as fewer primary care physicians saw patients in the hospital.10,11 This shift has challenged efforts to ensure continuity of care across settings, especially since most hospitalists have ceded control of postdischarge placement to case managers and therapists. Further, there has been little incentive to connect hospitalists to any other component or provider along the range of care, and compensation models rarely, if at all, consider any accountability for patient outcomes outside the hospital. Several factors can change this reality for hospitalists.
First, as more providers adopt team-based care approaches and as alternative payment models expand the scope of accountability, hospitalists will become an even more central component of the risk evaluation process for hospitalized patients as it relates to their discharge profile. This could mean that hospitalists are more involved in the postdischarge follow-up of patients sent home, to make sure patients adhere to discharge instructions. Alternatively, hospitalists may need to increase the level of physician-to-physician communication with SNF medical directors for patients discharged to SNF. This, in turn, could result in an increasing number of hospitalist groups recruiting SNFists to join their group or potentially assigning existing hospitalists or physician assistants to round on patients in the SNF. The 2018 Society of Hospital Medicine report showed an increase in activity among hospital medicine groups performing services in postacute-care facilities outside the hospital from 13% in 2016 to 25% in 2018.12 Similarly, a 2017 study in JAMA Internal Medicine reported a 48.2% increase in the number of physicians classified as SNFists from 2007 to 2014.13
Second, hospitalists will be more involved in the discharge planning process through internal interdisciplinary team communications. Whereas case managers and therapists owned the discharge planning process historically, new teams will include hospitalists, case managers, physical therapists, and pharmacists. System leaders will task them with identifying the appropriate discharge destination (eg, SNF, home health), finalizing the medication reconciliation, scheduling follow-up appointments, and completing a warm handoff.
Finally, as the field matures and hospitalists learn more about postacute-care connections, they will continue to be held more accountable for patient outcomes postdischarge. Many hospitalists have already connected to community providers through checklists and use evidence-based discharge programs like ProjectRed or Project BOOST.14,15 Organizations will need a similar strategy for SNFs, developing process measures, with the input of hospitalists, around those noteworthy areas that hospitalists can control. This will require greater alignment among constituents around overall organizational goals and, more importantly, entail the hospitalist to be attuned to overall patient goals beyond the care provided in the hospital setting.
As payment and care models continue to evolve, the status quo cannot be sustained. We anticipate that hospitalists will become more integrated into the patient discharge process, especially as it relates to discharge to SNFs before patients reconnect to their community physicians. Hospital systems will accelerate integration through the development of preferred SNF networks, and hospitalists stand to play a critical role in the success of these arrangements by enriching the benefits they create through these outward relationships.
For organizations engaged in embedded networks, they can realize gains via incentive alignment, trust, information transfer, mutual support, and coordination through virtual integration, without requiring vertical ownership.3,16Thus, the opportunity exists for hospitalists to be critical drivers of network success, serving as intermediaries from which information, collaboration, and shared problem-solving flow between hospitals, SNFs, patients, and the entire care team. Opportunities to rebuild our system are long past; however, like all changing sectors in healthcare, the disaggregate acute and postacute settings must move in lockstep. Hospitals and postacute care facilities must find ways to alter their thinking to eradicate the obstructive and injurious invisible wall.
Disclosures
The authors have nothing to disclose.
1. Catalyst for Payment Reform. CPR Scorecard on Medicare Payment Reform 2015.
2. Mick S, Shay P. Accountable care organizations and transaction cost economics. Med Care Res Rev. 2016;73(6):649-659. doi: 10.1177/1077558716640411. PubMed
3. Shay P, Mick S. Post-acute care and vertical integration after the Patient Protection and Affordable Care Act. J Healthc Manag. 2013;58(1):15-27. PubMed
4. McHugh J, Zinn J, Shield R, et al. Strategy and risk-sharing in hospital-postacute care integration. Health Care Manage Rev. 2018. doi: 10.1097/HMR.0000000000000204. PubMed
5. Conway S, Parekh A, Hughes A, et al. Post-acute care transitions: developing a skilled nursing facility collaborative within an academic health system. J Hosp Med. 2019;14(3):174-177. doi: 10.12788/jhm.3117. PubMed
6. Tyler D, Gadbois E, McHugh J, Shield R, Winblad U, Mor V. Patients are not given quality-of-care data about skilled nursing facilities when discharged from hospitals. Health Aff. 2017;36(8):1385-1391. doi: 10.1377/hlthaff.2017.0155. PubMed
7. Medicare Payment Advisory Commission. Encouraging Medicare Beneficiaries to Use Higher Quality Post-Acute Care Providers. Washington, DC: MedPAC; 2018.
8. McHugh J, Foster A, Mor V, et al. Reducing hospital readmissions through preferred networks of skilled nursing facilities. Health Aff. 2017;36(9):1591-1598. doi: 10.1377/hlthaff.2017.0211. PubMed
9. Rahman M, Foster A, Grabowski D, Zinn J, Mor V. Effect of hospital-SNF referral linkages on rehospitalization. Health Serv Res. 2013;48(6):1898-1919. doi: 10.1111/1475-6773.12112. PubMed
10. Wachter R, Goldman L. Zero to 50,000 - The 20th anniversary of the hospitalist. N Engl J Med. 2016;375(11):1009-1011. doi: 10.1056/NEJMp1607958. PubMed
11. Kripalani S, Jackson A, Schnipper J, Coleman E. Promoting effective transitions of care at hopsital discharge: A review of key issues for hospitalists. J Hosp Med. 2007;2(5):314-323. doi: 10.1002/jhm.228. PubMed
12. Society of Hospital Medicine. 2018 State of Hospital Medicine Report. Philadelphia: Society of Hospital Medicine; 2018. 2018 SHM Report.
13. Teno J, Gozalo P, Trivedi A, Mitchell S, Bunker J, Mor V. Temporal trends in the numbers of skilled nursing facility specialists from 2007 through 2014. JAMA Intern Med. 2017;177(9):1376-1378. doi: 10.1001/jamainternmed.2017.2136. PubMed
14. Boston University Medical Center. Project RED Re-Engineered Discharge. Project RED. Available at: https://www.bu.edu/fammed/projectred/. Accessed Dec 9, 2018.
15. Hansen L, Greenwald J, Budnitz T, et al. Project BOOST: effectiveness of a multihospital effort to reduce rehospitalization. J Hosp Med. 2013;8:421-427. doi: 10.1002/jhm.2054. PubMed
16. Uzzi B. The sources and consequences of embeddedness for the economic performance of organizations: the network effect. Am Sociol Rev. 1996:674-698. doi: 10.2307/2096399.
© 2019 Society of Hospital Medicine
Next Steps in Improving Healthcare Value: Postacute Care Transitions: Developing a Skilled Nursing Facility Collaborative within an Academic Health System
Hospitals and health systems are under mounting financial pressure to shorten hospitalizations and reduce readmissions. These priorities have led to an ever-increasing focus on postacute care (PAC), and more specifically on improving transitions from the hospital.1,2 According to a 2013 Institute of Medicine report, PAC is the source of 73% of the variation in Medicare spending3 and readmissions during the postacute episode nearly double the average Medicare payment.4 Within the PAC landscape, discharges to skilled nursing facilities (SNFs) have received particular focus due to the high rates of readmission and associated care costs.5
Hospitals, hospital physicians, PAC providers, and payers need to improve SNF transitions in care. Hospitals are increasingly responsible for patient care beyond their walls through several mechanisms including rehospitalization penalties, value-based reimbursement strategies (eg, bundled payments), and risk-based contracting on the total cost of care through relationships with accountable care organizations (ACOs) and Medicare Advantage plans. Similarly, hospital-employed physicians and PAC providers are more engaged in achieving value-based goals through increased alignment of provider compensation models6,7 with risk-based contracting.
Current evidence suggests that rehospitalizations could be reduced by focusing on a concentrated referral network of preferred high-quality SNFs;8,9 however, less is known about how to develop and operate such linkages at the administrative or clinical levels.8 In this article, we propose a collaborative framework for the establishment of a preferred PAC network.
SKILLED NURSING FACILITY PREFERRED PROVIDER NETWORK
One mechanism employed to improve transitions to SNFs and reduce associated readmissions is to create a preferred provider network. Increasing the concentration of hospital discharges to higher performing facilities is associated with lower rehospitalization rates, particularly during the critical days following discharge.10
While the criteria applied for preferred provider networks vary, there are several emerging themes.10 Quality metrics are often applied, generally starting with Centers for Medicare and Medicaid Services (CMS) quality star ratings and Long-Term Care Minimum Data Set (MDS) metrics with additional criteria frequently layered upon those. Some examples include the extent of physician coverage,11 the extent of nursing coverage (eg, nursing ratios or 24/7 nursing care), geographic access, and flexible admission times (including weekends and nights).12 In addition, several outcome measures may be used such as 30-day readmission rates, patient/family satisfaction ratings, ED visits, primary care follow-up within seven days of PAC discharge, or impact on the total cost of care.
Beyond the specified criteria, some hospitals choose to build upon existing relationships when developing their preferred network. By selecting historically high-volume facilities, they are able to leverage the existing name recognition amongst patients and providers.13 This minimizes retraining of discharge planners, maintains institutional relationships, and aligns with the patients’ geographic preferences.2,13 While the high volume SNFs may not have the highest quality ratings, some hospitals find they can leverage the value of preferred partner status to push behavior change and improve performance.13
PROPOSED HEALTH SYSTEM FRAMEWORK FOR CREATING A SKILLED NURSING FACILITY COLLABORATIVE
Here we propose a framework for the establishment of a preferred provider network for a hospital or health system based on the early experience of establishing an SNF Collaborative within Johns Hopkins Medicine (JHM). JHM is a large integrated health care system, which includes five hospitals within the region, including two large academic hospitals and three community hospitals serving patients in Maryland and the District of Columbia.14
JHM identified a need for improved coordination with PAC providers and saw opportunities to build upon successful individual hospital efforts to create a system-level approach with a PAC partnership sharing the goals of improving care and reducing costs. Additional opportunities exist given the unique Maryland all-payer Global Budget Revenue system managed by the Health Services Cost Review Commission. This system imposes hospital-level penalties for readmissions or poor quality measure performance and is moving to a new phase that will place hospitals directly at risk for the total Part A and Part B Medicare expenditures for a cohort of attributed Medicare patients, inclusive of their PAC expenses. This state-wide program is one example of a shift in payment structures from volume to value that is occurring throughout the healthcare sector.
Developing a formal collaboration inclusive of the five local hospitals, Johns Hopkins HealthCare (JHHC)—the managed care division of JHM—and the JHM ACO (Johns Hopkins Medicine Alliance for Patients, JMAP), we established a JHM SNF Collaborative. This group was tasked with improving the continuum of care for our patients discharged to PAC facilities. Given the number and diversity of entities involved, we sought to draw on efforts already managed and piloted locally, while disseminating best practices and providing added services at the collaborative level. We propose a collaborative multistakeholder model (Figure) that we anticipate will be adaptable to other health systems.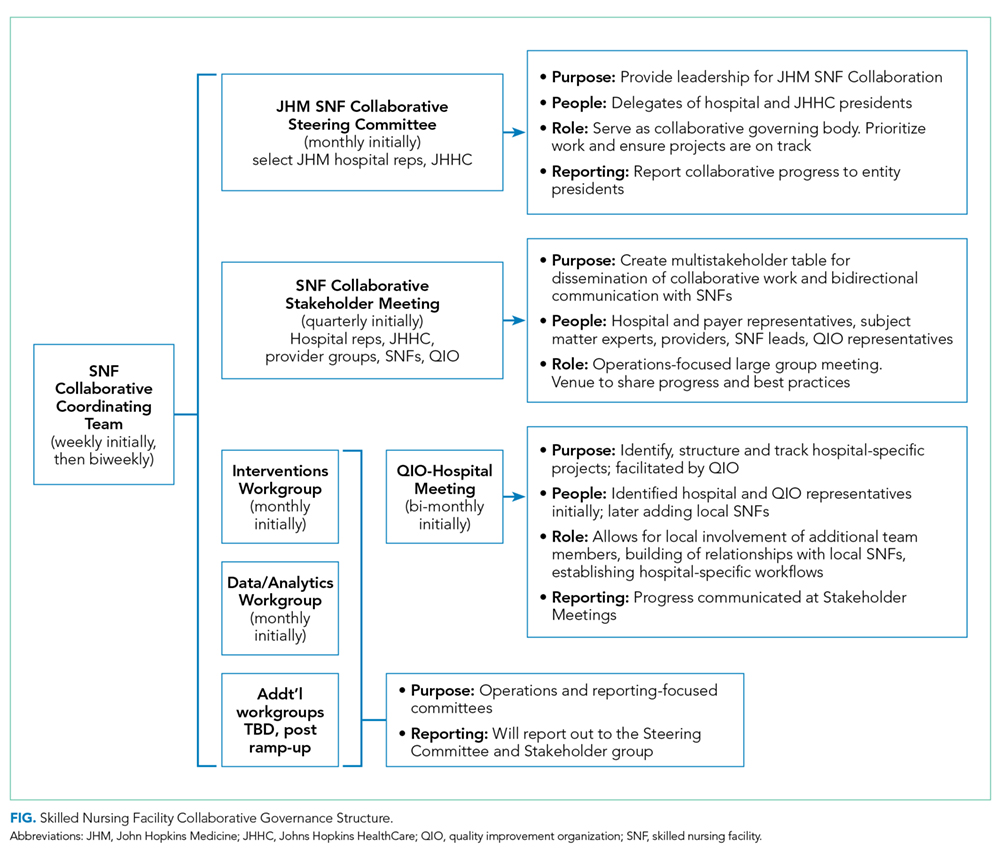
At the outset, we established a Steering Committee and a broad Stakeholder Group (Figure). The Steering Committee is comprised of representatives from all participating JHM entities and serves as the collaborative governing body. This group initially identified 36 local SNF partners including a mixture of larger corporate chains and freestanding entities. In an effort to respect patient choice and acknowledge geographic preferences and capacity limitations, partner selection was based on a combination of publically available quality metrics, historic referral volumes, and recommendations of each JHM hospital. While we sought to align with high-performing SNFs, we also saw an opportunity to leverage collaboration to drive improvement in lower-performing facilities that continue to receive a high volume of referrals. The Stakeholder Group includes a broader representation from JHM, including subject matter experts from related medical specialties (eg, Physical Medicine and Rehabilitation, Internal Medicine, Emergency Medicine, and various surgical subspecialties); partner SNFs, and the local CMS-funded Quality Improvement Organization (QIO). Physician leadership was essential at all levels of the collaborative governing structure including the core Coordinating Team (Figure). Providers representing different hospitals were able to speak about variations in practice patterns and to assess the feasibility of suggested solutions on existing workflows.
After establishing the governance framework for the collaborative, it was determined that dedicated workgroups were needed to drive protocol-based initiatives, data, and analytics. For the former, we selected transitions of care as our initial focus area. All affiliated hospitals were working to address care transitions, but there were opportunities to develop a harmonized approach leveraging individual hospital input. The workgroup included representation from medical and administrative hospital leadership, JHHC, JMAP, our home care group, and SNF medical leadership. Initial priorities identified are reviewed in the Table. We anticipate new priorities for the collaborative over time and intend for the workgroup to evolve in line with shifting priorities.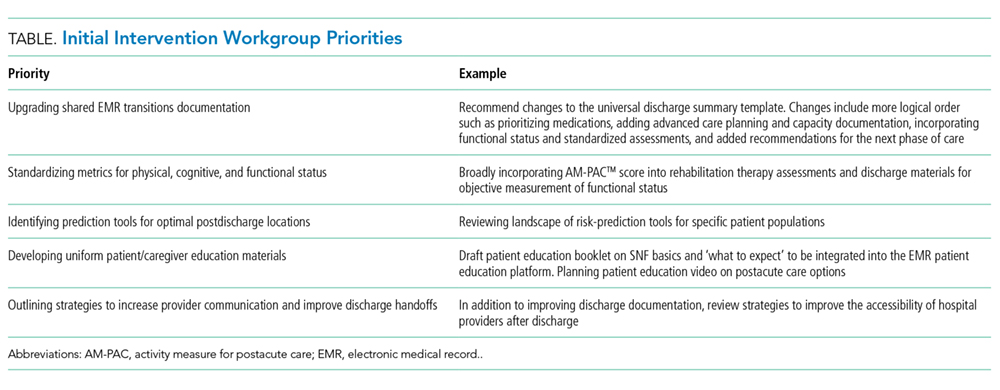
We similarly established a multidisciplinary data and analytics workgroup to identify resources to develop the SNF, and a system-level dashboard to track our ongoing work. While incorporating data from five hospitals with varied patient populations, we felt that the risk-adjusted PAC data were critical to the collaborative establishment and goal setting. After exploring internal and external resources, we initially elected to engage an outside vendor offering risk-adjusted performance metrics. We have subsequently worked with the state health information exchange, CRISP,15 to develop a robust dashboard for Medicare fee-for-service beneficiaries that could provide similar data.
IMPLEMENTATION
In the process of establishing the SNF Collaborative at JHM, there were a number of early challenges faced and lessons learned:
- In a large integrated delivery system, there is a need to balance the benefits of central coordination with the support for ongoing local efforts to promote partner engagement at the hospital and SNF level. The forums created within the collaborative governance structure can facilitate sharing of the prior health system, hospital or SNF initiatives to grow upon successes and avoid prior pitfalls.
- Early identification of risk-adjusted PAC data sources is central to the collaborative establishment and goal setting. This requires assessment of internal analytic resources, budget, and desired timeline for implementation to determine the optimal arrangement. Similarly, identification of available data sources to drive the analytic efforts is essential and should include a health information exchange, claims, and MDS among others.
- Partnering with local QIOs provides support for facility-level quality improvement efforts. They have the staff and onsite expertise to facilitate process implementation within individual SNFs.
- Larger preferred provider networks require considerable administrative support to facilitate communication with the entities, coordinate completion of network agreements, and manage the dissemination of SNF- and hospital-specific performance data.
- Legal and contractual support related to data sharing and HIPAA compliance is needed due to the complexity of the health system and SNF legal structure. Multiple JHM legal entities were involved in this collaborative as were a mixture of freestanding SNFs and corporate chains. There was a significant effort required to execute both data-sharing agreements as well as charters to enable QIO participation.
- Physician leadership and insight are key to implementing meaningful and broad change. When devising system-wide solutions, incorporation and respect for local processes and needs are paramount for provider engagement and behavior change. This process will likely identify gaps in understanding the PAC patient’s experience and needs. It may also reveal practice variability and foster opportunities for provider education on the needs of PAC teams and how to best facilitate quality transitions.
CONCLUSION
We proposed a framework for establishing a collaborative partnership with a preferred network of SNF providers. Depending on organizational readiness, significant upfront investment of time and resources could be needed to establish a coordinated network of SNF providers. However, once established, such networks can be leveraged to support ongoing process improvement efforts within a hospital or delivery system and can be used strategically by such health systems as they implement value-based health strategies. Furthermore, the lessons learned from transitions to SNFs can be applied more broadly in the PAC landscape including transitions to home from both the hospital and SNF.
Acknowledgments
The authors wish to acknowledge all the members and participants in the Johns Hopkins Medicine Skilled Nursing Facility Collaborative and the executive sponsors and JHM hospital presidents for their support of this work.
Disclosures
Michele Bellantoni receives intramural salary support for being the medical director of the JHM SNF Collaborative. Damien Doyle is a part-time geriatrician at the Hebrew Home of Greater Washington, a skilled nursing facility. He received travel expense support for GAPNA, a local Advanced Practice Nurse Association meeting.The authors otherwise have no potential conflicts of interest to disclose.
Funding
The authors state that there were no external sponsors for this work.
1. Burke RE, Whitfield EA, Hittle D, et al. Hospital readmission from post-acute care facilities: risk factors, timing, and outcomes. J Am Med Dir Assoc. 2016;17(3):249-255. doi:10.1016/j.jamda.2015.11.005. PubMed
2. Mchugh JP, Zinn J, Shield RR, et al. Strategy and risk sharing in hospital–post-acute care integration. Health Care Manage Rev. 2018:1. doi:10.1097/hmr.0000000000000204. PubMed
3. Institute of Medicine. Variation in Health Care Spending Assessing Geographic Variation.; 2013. http://nationalacademies.org/hmd/~/media/Files/Report Files/2013/Geographic-Variation2/geovariation_rb.pdf. Accessed January 4, 2018.
4. Dobson A, DaVanzo JE, Heath S, et al. Medicare Payment Bundling: Insights from Claims Data and Policy Implications Analyses of Episode-Based Payment. Washington, DC; 2012. http://www.aha.org/content/12/ahaaamcbundlingreport.pdf. Accessed January 4, 2018.
5. Mor V, Intrator O, Feng Z, Grabowski DC. The revolving door of rehospitalization from skilled nursing facilities. Health Aff. 2010;29(1):57-64. doi:10.1377/hlthaff.2009.0629. PubMed
6. Torchiana DF, Colton DG, Rao SK, Lenz SK, Meyer GS, Ferris TG. Massachusetts general physicians organization’s quality incentive program produces encouraging results. Health Aff. 2013;32(10):1748-1756. doi:10.1377/hlthaff.2013.0377. PubMed
7. Michtalik HJ, Carolan HT, Haut ER, et al. Use of provider-level dashboards and pay-for-performance in venous thromboembolism prophylaxis. J Hosp Med. 2014;10(3):172-178. doi:10.1002/jhm.2303. PubMed
8. Rahman M, Foster AD, Grabowski DC, Zinn JS, Mor V. Effect of hospital-SNF referral linkages on rehospitalization. Health Serv Res. 2013;48(6pt1):1898-1919. doi:10.1111/1475-6773.12112. PubMed
9. Huckfeldt PJ, Weissblum L, Escarce JJ, Karaca-Mandic P, Sood N. Do skilled nursing facilities selected to participate in preferred provider networks have higher quality and lower costs? Health Serv Res. 2018. doi:10.1111/1475-6773.13027. PubMed
10. American Hospital Association. The role of post-acute care in new care delivery models. TrendWatch. http://www.aha.org/research/reports/tw/15dec-tw-postacute.pdf. Published 2015. Accessed December 19, 2017.
11. Lage DE, Rusinak D, Carr D, Grabowski DC, Ackerly DC. Creating a network of high-quality skilled nursing facilities: preliminary data on the postacute care quality improvement experiences of an accountable care organization. J Am Geriatr Soc. 2015;63(4):804-808. doi:10.1111/jgs.13351. PubMed
12. Ouslander JG, Bonner A, Herndon L, Shutes J. The Interventions to Reduce Acute Care Transfers (INTERACT) quality improvement program: an overview for medical directors and primary care clinicians in long-term care. J Am Med Dir Assoc. 2014;15(3):162-170. doi:10.1016/j.jamda.2013.12.005. PubMed
13. McHugh JP, Foster A, Mor V, et al. Reducing hospital readmissions through preferred networks of skilled nursing facilities. Health Aff. 2017;36(9):1591-1598. doi:10.1377/hlthaff.2017.0211. PubMed
14. Fast Facts: Johns Hopkins Medicine. https://www.hopkinsmedicine.org/about/downloads/JHM-Fast-Facts.pdf. Accessed October 18, 2018.
15. CRISP – Chesapeake Regional Information System for our Patients. https://www.crisphealth.org/. Accessed October 17, 2018.
Hospitals and health systems are under mounting financial pressure to shorten hospitalizations and reduce readmissions. These priorities have led to an ever-increasing focus on postacute care (PAC), and more specifically on improving transitions from the hospital.1,2 According to a 2013 Institute of Medicine report, PAC is the source of 73% of the variation in Medicare spending3 and readmissions during the postacute episode nearly double the average Medicare payment.4 Within the PAC landscape, discharges to skilled nursing facilities (SNFs) have received particular focus due to the high rates of readmission and associated care costs.5
Hospitals, hospital physicians, PAC providers, and payers need to improve SNF transitions in care. Hospitals are increasingly responsible for patient care beyond their walls through several mechanisms including rehospitalization penalties, value-based reimbursement strategies (eg, bundled payments), and risk-based contracting on the total cost of care through relationships with accountable care organizations (ACOs) and Medicare Advantage plans. Similarly, hospital-employed physicians and PAC providers are more engaged in achieving value-based goals through increased alignment of provider compensation models6,7 with risk-based contracting.
Current evidence suggests that rehospitalizations could be reduced by focusing on a concentrated referral network of preferred high-quality SNFs;8,9 however, less is known about how to develop and operate such linkages at the administrative or clinical levels.8 In this article, we propose a collaborative framework for the establishment of a preferred PAC network.
SKILLED NURSING FACILITY PREFERRED PROVIDER NETWORK
One mechanism employed to improve transitions to SNFs and reduce associated readmissions is to create a preferred provider network. Increasing the concentration of hospital discharges to higher performing facilities is associated with lower rehospitalization rates, particularly during the critical days following discharge.10
While the criteria applied for preferred provider networks vary, there are several emerging themes.10 Quality metrics are often applied, generally starting with Centers for Medicare and Medicaid Services (CMS) quality star ratings and Long-Term Care Minimum Data Set (MDS) metrics with additional criteria frequently layered upon those. Some examples include the extent of physician coverage,11 the extent of nursing coverage (eg, nursing ratios or 24/7 nursing care), geographic access, and flexible admission times (including weekends and nights).12 In addition, several outcome measures may be used such as 30-day readmission rates, patient/family satisfaction ratings, ED visits, primary care follow-up within seven days of PAC discharge, or impact on the total cost of care.
Beyond the specified criteria, some hospitals choose to build upon existing relationships when developing their preferred network. By selecting historically high-volume facilities, they are able to leverage the existing name recognition amongst patients and providers.13 This minimizes retraining of discharge planners, maintains institutional relationships, and aligns with the patients’ geographic preferences.2,13 While the high volume SNFs may not have the highest quality ratings, some hospitals find they can leverage the value of preferred partner status to push behavior change and improve performance.13
PROPOSED HEALTH SYSTEM FRAMEWORK FOR CREATING A SKILLED NURSING FACILITY COLLABORATIVE
Here we propose a framework for the establishment of a preferred provider network for a hospital or health system based on the early experience of establishing an SNF Collaborative within Johns Hopkins Medicine (JHM). JHM is a large integrated health care system, which includes five hospitals within the region, including two large academic hospitals and three community hospitals serving patients in Maryland and the District of Columbia.14
JHM identified a need for improved coordination with PAC providers and saw opportunities to build upon successful individual hospital efforts to create a system-level approach with a PAC partnership sharing the goals of improving care and reducing costs. Additional opportunities exist given the unique Maryland all-payer Global Budget Revenue system managed by the Health Services Cost Review Commission. This system imposes hospital-level penalties for readmissions or poor quality measure performance and is moving to a new phase that will place hospitals directly at risk for the total Part A and Part B Medicare expenditures for a cohort of attributed Medicare patients, inclusive of their PAC expenses. This state-wide program is one example of a shift in payment structures from volume to value that is occurring throughout the healthcare sector.
Developing a formal collaboration inclusive of the five local hospitals, Johns Hopkins HealthCare (JHHC)—the managed care division of JHM—and the JHM ACO (Johns Hopkins Medicine Alliance for Patients, JMAP), we established a JHM SNF Collaborative. This group was tasked with improving the continuum of care for our patients discharged to PAC facilities. Given the number and diversity of entities involved, we sought to draw on efforts already managed and piloted locally, while disseminating best practices and providing added services at the collaborative level. We propose a collaborative multistakeholder model (Figure) that we anticipate will be adaptable to other health systems.
At the outset, we established a Steering Committee and a broad Stakeholder Group (Figure). The Steering Committee is comprised of representatives from all participating JHM entities and serves as the collaborative governing body. This group initially identified 36 local SNF partners including a mixture of larger corporate chains and freestanding entities. In an effort to respect patient choice and acknowledge geographic preferences and capacity limitations, partner selection was based on a combination of publically available quality metrics, historic referral volumes, and recommendations of each JHM hospital. While we sought to align with high-performing SNFs, we also saw an opportunity to leverage collaboration to drive improvement in lower-performing facilities that continue to receive a high volume of referrals. The Stakeholder Group includes a broader representation from JHM, including subject matter experts from related medical specialties (eg, Physical Medicine and Rehabilitation, Internal Medicine, Emergency Medicine, and various surgical subspecialties); partner SNFs, and the local CMS-funded Quality Improvement Organization (QIO). Physician leadership was essential at all levels of the collaborative governing structure including the core Coordinating Team (Figure). Providers representing different hospitals were able to speak about variations in practice patterns and to assess the feasibility of suggested solutions on existing workflows.
After establishing the governance framework for the collaborative, it was determined that dedicated workgroups were needed to drive protocol-based initiatives, data, and analytics. For the former, we selected transitions of care as our initial focus area. All affiliated hospitals were working to address care transitions, but there were opportunities to develop a harmonized approach leveraging individual hospital input. The workgroup included representation from medical and administrative hospital leadership, JHHC, JMAP, our home care group, and SNF medical leadership. Initial priorities identified are reviewed in the Table. We anticipate new priorities for the collaborative over time and intend for the workgroup to evolve in line with shifting priorities.
We similarly established a multidisciplinary data and analytics workgroup to identify resources to develop the SNF, and a system-level dashboard to track our ongoing work. While incorporating data from five hospitals with varied patient populations, we felt that the risk-adjusted PAC data were critical to the collaborative establishment and goal setting. After exploring internal and external resources, we initially elected to engage an outside vendor offering risk-adjusted performance metrics. We have subsequently worked with the state health information exchange, CRISP,15 to develop a robust dashboard for Medicare fee-for-service beneficiaries that could provide similar data.
IMPLEMENTATION
In the process of establishing the SNF Collaborative at JHM, there were a number of early challenges faced and lessons learned:
- In a large integrated delivery system, there is a need to balance the benefits of central coordination with the support for ongoing local efforts to promote partner engagement at the hospital and SNF level. The forums created within the collaborative governance structure can facilitate sharing of the prior health system, hospital or SNF initiatives to grow upon successes and avoid prior pitfalls.
- Early identification of risk-adjusted PAC data sources is central to the collaborative establishment and goal setting. This requires assessment of internal analytic resources, budget, and desired timeline for implementation to determine the optimal arrangement. Similarly, identification of available data sources to drive the analytic efforts is essential and should include a health information exchange, claims, and MDS among others.
- Partnering with local QIOs provides support for facility-level quality improvement efforts. They have the staff and onsite expertise to facilitate process implementation within individual SNFs.
- Larger preferred provider networks require considerable administrative support to facilitate communication with the entities, coordinate completion of network agreements, and manage the dissemination of SNF- and hospital-specific performance data.
- Legal and contractual support related to data sharing and HIPAA compliance is needed due to the complexity of the health system and SNF legal structure. Multiple JHM legal entities were involved in this collaborative as were a mixture of freestanding SNFs and corporate chains. There was a significant effort required to execute both data-sharing agreements as well as charters to enable QIO participation.
- Physician leadership and insight are key to implementing meaningful and broad change. When devising system-wide solutions, incorporation and respect for local processes and needs are paramount for provider engagement and behavior change. This process will likely identify gaps in understanding the PAC patient’s experience and needs. It may also reveal practice variability and foster opportunities for provider education on the needs of PAC teams and how to best facilitate quality transitions.
CONCLUSION
We proposed a framework for establishing a collaborative partnership with a preferred network of SNF providers. Depending on organizational readiness, significant upfront investment of time and resources could be needed to establish a coordinated network of SNF providers. However, once established, such networks can be leveraged to support ongoing process improvement efforts within a hospital or delivery system and can be used strategically by such health systems as they implement value-based health strategies. Furthermore, the lessons learned from transitions to SNFs can be applied more broadly in the PAC landscape including transitions to home from both the hospital and SNF.
Acknowledgments
The authors wish to acknowledge all the members and participants in the Johns Hopkins Medicine Skilled Nursing Facility Collaborative and the executive sponsors and JHM hospital presidents for their support of this work.
Disclosures
Michele Bellantoni receives intramural salary support for being the medical director of the JHM SNF Collaborative. Damien Doyle is a part-time geriatrician at the Hebrew Home of Greater Washington, a skilled nursing facility. He received travel expense support for GAPNA, a local Advanced Practice Nurse Association meeting.The authors otherwise have no potential conflicts of interest to disclose.
Funding
The authors state that there were no external sponsors for this work.
1. Burke RE, Whitfield EA, Hittle D, et al. Hospital readmission from post-acute care facilities: risk factors, timing, and outcomes. J Am Med Dir Assoc. 2016;17(3):249-255. doi:10.1016/j.jamda.2015.11.005. PubMed
2. Mchugh JP, Zinn J, Shield RR, et al. Strategy and risk sharing in hospital–post-acute care integration. Health Care Manage Rev. 2018:1. doi:10.1097/hmr.0000000000000204. PubMed
3. Institute of Medicine. Variation in Health Care Spending Assessing Geographic Variation.; 2013. http://nationalacademies.org/hmd/~/media/Files/Report Files/2013/Geographic-Variation2/geovariation_rb.pdf. Accessed January 4, 2018.
4. Dobson A, DaVanzo JE, Heath S, et al. Medicare Payment Bundling: Insights from Claims Data and Policy Implications Analyses of Episode-Based Payment. Washington, DC; 2012. http://www.aha.org/content/12/ahaaamcbundlingreport.pdf. Accessed January 4, 2018.
5. Mor V, Intrator O, Feng Z, Grabowski DC. The revolving door of rehospitalization from skilled nursing facilities. Health Aff. 2010;29(1):57-64. doi:10.1377/hlthaff.2009.0629. PubMed
6. Torchiana DF, Colton DG, Rao SK, Lenz SK, Meyer GS, Ferris TG. Massachusetts general physicians organization’s quality incentive program produces encouraging results. Health Aff. 2013;32(10):1748-1756. doi:10.1377/hlthaff.2013.0377. PubMed
7. Michtalik HJ, Carolan HT, Haut ER, et al. Use of provider-level dashboards and pay-for-performance in venous thromboembolism prophylaxis. J Hosp Med. 2014;10(3):172-178. doi:10.1002/jhm.2303. PubMed
8. Rahman M, Foster AD, Grabowski DC, Zinn JS, Mor V. Effect of hospital-SNF referral linkages on rehospitalization. Health Serv Res. 2013;48(6pt1):1898-1919. doi:10.1111/1475-6773.12112. PubMed
9. Huckfeldt PJ, Weissblum L, Escarce JJ, Karaca-Mandic P, Sood N. Do skilled nursing facilities selected to participate in preferred provider networks have higher quality and lower costs? Health Serv Res. 2018. doi:10.1111/1475-6773.13027. PubMed
10. American Hospital Association. The role of post-acute care in new care delivery models. TrendWatch. http://www.aha.org/research/reports/tw/15dec-tw-postacute.pdf. Published 2015. Accessed December 19, 2017.
11. Lage DE, Rusinak D, Carr D, Grabowski DC, Ackerly DC. Creating a network of high-quality skilled nursing facilities: preliminary data on the postacute care quality improvement experiences of an accountable care organization. J Am Geriatr Soc. 2015;63(4):804-808. doi:10.1111/jgs.13351. PubMed
12. Ouslander JG, Bonner A, Herndon L, Shutes J. The Interventions to Reduce Acute Care Transfers (INTERACT) quality improvement program: an overview for medical directors and primary care clinicians in long-term care. J Am Med Dir Assoc. 2014;15(3):162-170. doi:10.1016/j.jamda.2013.12.005. PubMed
13. McHugh JP, Foster A, Mor V, et al. Reducing hospital readmissions through preferred networks of skilled nursing facilities. Health Aff. 2017;36(9):1591-1598. doi:10.1377/hlthaff.2017.0211. PubMed
14. Fast Facts: Johns Hopkins Medicine. https://www.hopkinsmedicine.org/about/downloads/JHM-Fast-Facts.pdf. Accessed October 18, 2018.
15. CRISP – Chesapeake Regional Information System for our Patients. https://www.crisphealth.org/. Accessed October 17, 2018.
© 2019 Society of Hospital Medicine
Statistical Modeling and Aggregate-Weighted Scoring Systems in Prediction of Mortality and ICU Transfer: A Systematic Review
Ensuring the delivery of safe and cost-effective care is the core mission of hospitals,1 but nearly 90% of unplanned patient transfers to critical care may be the result of a new or worsening condition.2 The cost of treatment of sepsis, respiratory failure, and arrest, which are among the deadliest conditions for hospitalized patients,3,4 are estimated to be $30.7 billion annually (8.1% of national hospital costs).5 As many as 44% of adverse events may be avoidable,6 and concerns about patient safety have motivated hospitals and health systems to find solutions to identify and treat deteriorating patients expeditiously. Evidence suggests that many hospitalized patients presenting with rapid decline showed warning signs 24-48 hours before the event.7 Therefore, ample time may be available for early identification and intervention in many patients.
As early as 1997, hospitals have used early warning systems (EWSs) to identify at-risk patients and proactively inform clinicians.8 EWSs can predict a proportion of patients who are at risk for clinical deterioration (this benefit is measured with sensitivity) with the tradeoff that some alerts are false (as measured with positive predictive value [PPV] or its inverse, workup-to-detection ratio [WDR]9-11). Historically, EWS tools were paper-based instruments designed for fast manual calculation by hospital staff. Many aggregate-weighted EWS instruments continue to be used for research and practice, including the Modified Early Warning Systems (MEWS)12 and National Early Warning System (NEWS).13,14 Aggregate-weighted EWSs lack predictive precision because they use simple addition of a few clinical parameter scores, including vital signs and level of consciousness.15 Recently, a new category has emerged, which use multivariable regression or machine learning; we refer to this category as “EWSs using statistical modeling”. This type of EWS uses more computationally intensive risk stratification methods to predict risk16 by adjusting for a larger set of clinical covariates, thereby reducing the degree of unexplained variance. Although these EWSs are thought to be more precise and to generate fewer false positive alarms compared with others,14,17-19 no review to date has systematically synthesized and compared their performance against aggregate-weighted EWSs.
Purpose
The purpose of this systematic review was to evaluate the recent literature regarding prognostic test accuracy and clinical workloads generated by EWSs using statistical modeling versus aggregate-weighted systems.
METHODS
Search Strategy
Adhering to PRISMA protocol guidelines for systematic reviews, we searched the peer-reviewed literature in PubMed and CINAHL Plus, as well as conference proceedings and online repositories of patient safety organizations published between January 1, 2012 and September 15, 2018. We selected this timeframe because EWSs using statistical modeling are relatively new approaches compared with the body of evidence concerning aggregate-weighted EWSs. An expert PhD researcher confirmed the search results in a blinded independent query.
Inclusion and Exclusion Criteria
We included peer-reviewed articles reporting the area under the receiver operator curve (AUC),20 or the equivalent c-statistic, of models predicting clinical deterioration (measured as the composite of transfer to intensive care unit (ICU) and/or mortality) among adult patients in general hospital wards. We excluded studies if they did not compare an EWS using statistical modeling with an aggregate-weighted EWS, did not report AUC, or only reported on an aggregate-weighted EWS. Excluded settings were pediatrics, obstetrics, emergency departments, ICUs, transitional care units, and oncology. We also excluded studies with samples limited to physiological monitoring, sepsis, or postsurgical subpopulations.
Data Abstraction
Following the TRIPOD guidelines for the reporting of predictive models,21 and the PRISMA and Cochrane Collaboration guidelines for systematic reviews,22-24 we extracted study characteristics (Table 1), sample demographics (Appendix Table 4), model characteristics and performance (Appendix Table 5), and level of scientific evidence and risk of bias (Appendix Table 6). To address the potential for overfitting, we selected model performance results of the validation dataset rather than the derivation dataset, if reported. If studies reported multiple models in either EWS category, we selected the best-performing model for comparison.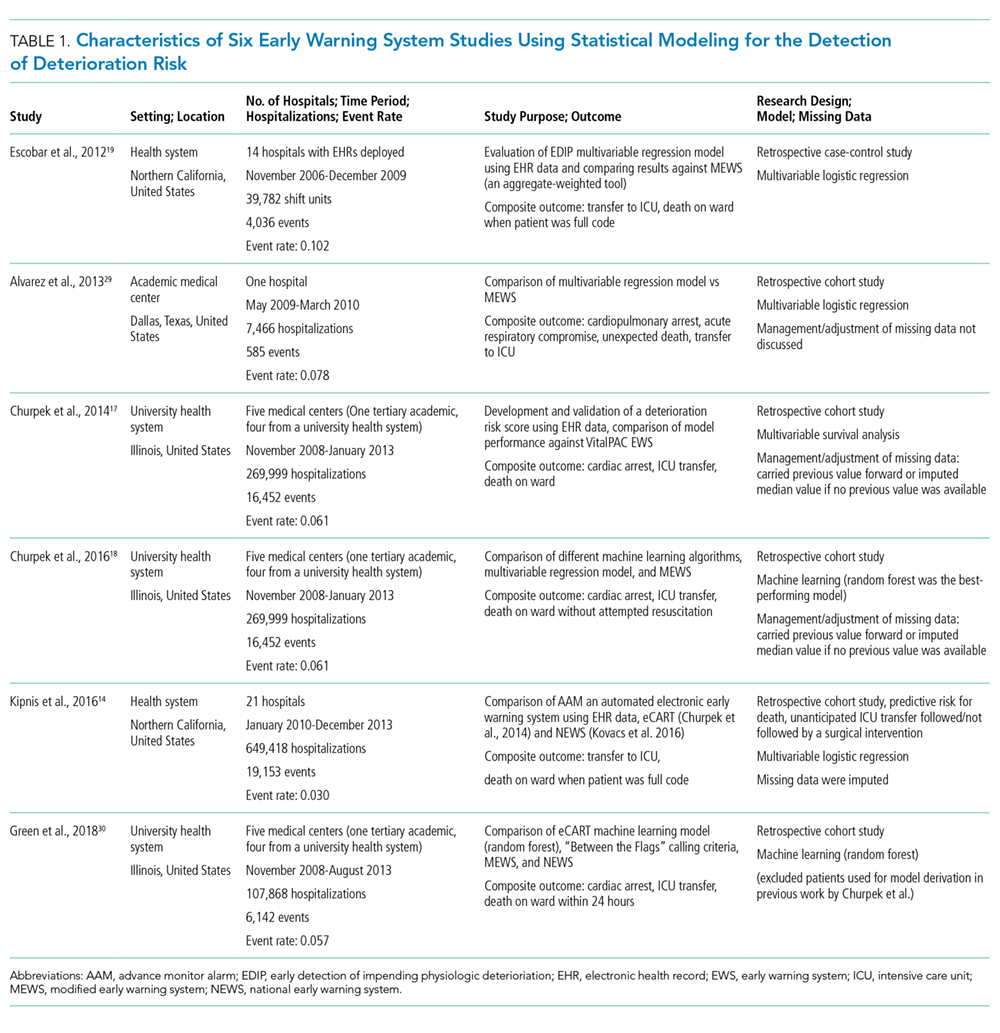
Measures of Model Performance
Because predictive models can achieve good case identification at the expense of high clinical workloads, an assessment of model performance would be incomplete without measures of clinical utility. For clinicians, this aspect can be measured as the model’s PPV (the percentage of true positive alerts among all alerts), or more intelligibly, as the WDR, which equals 1/PPV. WDR indicates the number of patients requiring evaluation to identify and treat one true positive case.9-11 It is known that differences in event rates (prevalence or pretest probability) influence a model’s PPV25 and its reciprocal WDR. However, for systematic comparison, PPV and WDR can be standardized using a fixed representative event rate across studies.24,26 We abstracted the reported PPV and WDR, and computed standardized PPV and WDR for an event rate of 4%.
Other measures included the area under the receiver operator curve (AUC),20 sensitivity, and specificity. AUC plots a model’s false positive rate (x-axis) against its true positive rate (y-axis), with an ideal scenario of very high y-values and very low x-values.27 Sensitivity (the model’s ability to detect a true positive case among all cases) and specificity (the model’s ability to detect a true noncase among all noncases28) are influenced by chosen alert thresholds. It is incorrect to assume that a given model produces only one sensitivity/specificity result; for systematic comparison, we therefore selected results in the 50% sensitivity range, and separately, in the 92% specificity range for EWSs using statistical modeling. Then, we simulated a fixed sensitivity of 0.51 and assumed specificity of 0.87 in aggregate-weighted EWSs.
RESULTS
Search Results
The PubMed search for “early warning score OR early warning system AND deterioration OR predict transfer ICU” returned 285 peer-reviewed articles. A search on CINAHL Plus using the same filters and query terms returned 219 articles with no additional matches (Figure 1). Of the 285 articles, we excluded 269 during the abstract screen and 10 additional articles during full-text review (Figure 1). A final review of the reference lists of the six selected studies did not yield additional articles.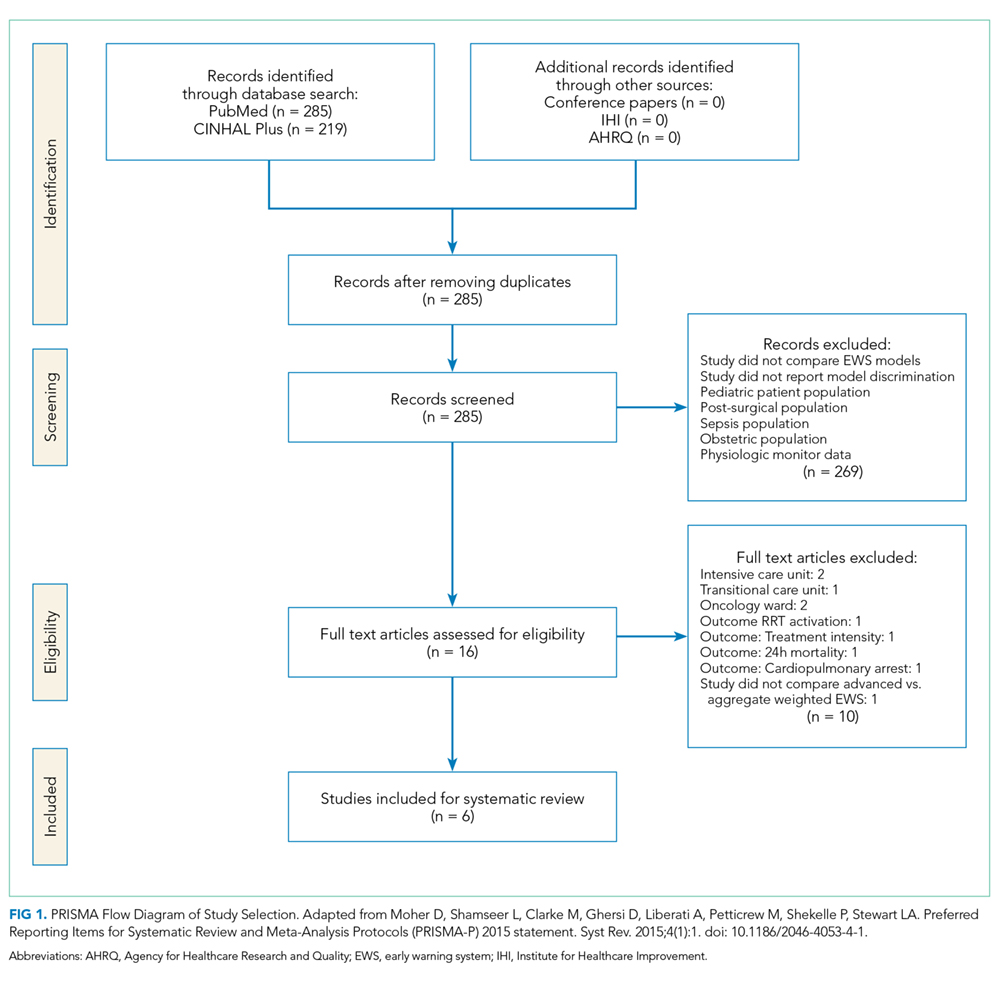
Study Characteristics
There were several similarities across the selected studies (Table 1). All occurred in the United States; all compared their model’s performance against at least one aggregate-weighted EWS model;14,17-19,29 and all used retrospective cohort designs. Of the six studies, one took place in a single hospital;29 three pooled data from five hospitals;17,18,30 and two occurred in a large integrated healthcare delivery system using data from 14 and, subsequently, 21 hospitals.14,19 The largest study14 included nearly 650,000 admissions, while the smallest study29 reported slightly less than 7,500 admissions. Of the six studies, four used multivariable regression,14,17,19,29 and two used machine learning techniques for outcome prediction.18,30
Outcome Variables
The primary outcome for inclusion in this review was clinical deterioration measured by the composite of transfer to ICU and some measure of mortality. Churpek et al.10,11 and Green et al.30 also included cardiac arrest, and Alvarez et al.22 included respiratory compromise in their outcome composite.
Researchers used varying definitions of mortality, including “death outside the ICU in a patient whose care directive was full code;”14,19 “death on the wards without attempted resuscitation;”17,18 “an in-hospital death in patients without a DNR order at admission that occurred on the medical ward or in ICU within 24 hours after transfer;”29 or “death within 24 hours.”30
Predictor Variables
We observed a broad assortment of predictor variables. All models included vital signs (heart rate, respiratory rate, blood pressure, and venous oxygen saturation); mental state; laboratory data; age; and sex. Additional variables included comorbidity, shock index,31 severity of illness score, length of stay, event time of day, season, admission category, and length of stay,14,19 among others.
Model Performance
Reported PPV ranged from 0.16 to 0.42 (mean = 0.27) in EWSs using statistical modeling and 0.15 to 0.28 (mean = 0.19) in aggregate-weighted EWS models. The weighted mean standardized PPV, adjusted for an event rate of 4% across studies (Table 2), was 0.21 in EWSs using statistical modeling versus 0.14 in aggregate-weighted EWS models (simulated at 0.51 sensitivity and 0.87 specificity).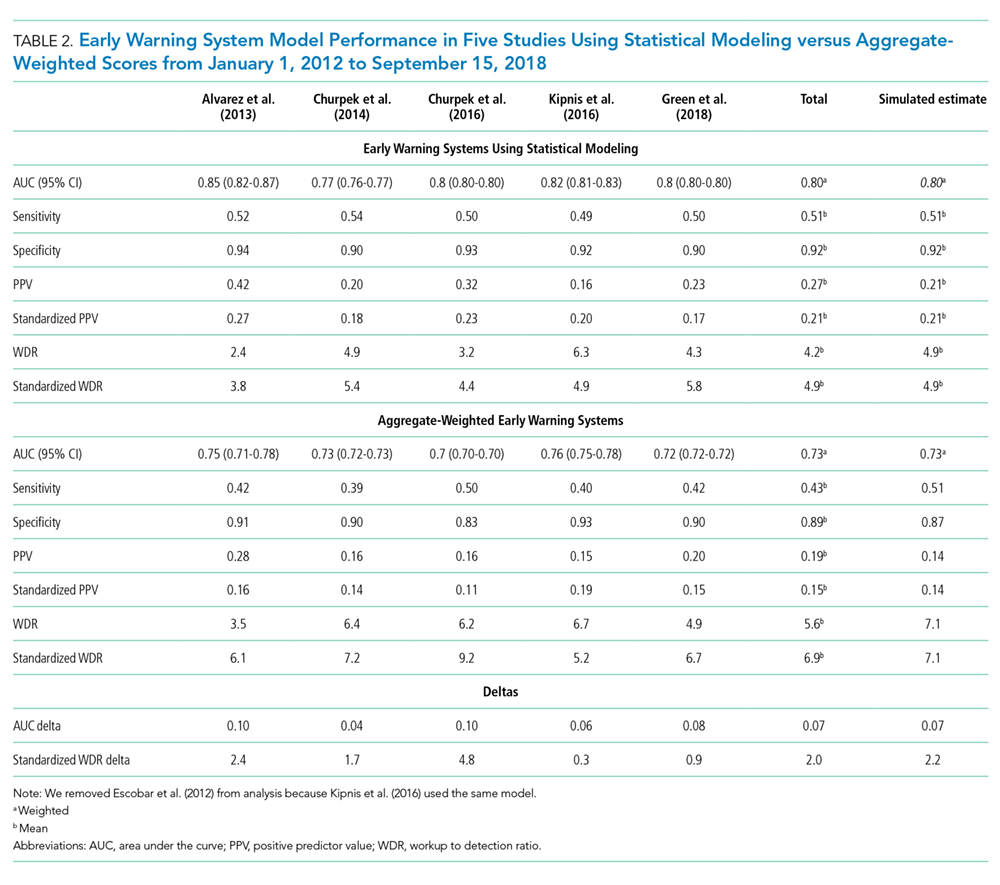
Only two studies14,19 reported the WDR metric (alerts generated to identify one true positive case) explicitly. Based on the above PPV results, EWSs using statistical modeling generated a standardized WDR of 4.9 in models using statistical modeling versus 7.1 in aggregate-weighted models (Figure 2). The delta of 2.2 evaluations to find and treat one true positive case equals a 45% relative increase in RRT evaluation workloads using aggregate-weighted EWSs.
AUC values ranged from 0.77 to 0.85 (weighted mean = 0.80) in EWSs using statistical modeling, indicating good model discrimination. AUCs of aggregate-weighted EWSs ranged from 0.70 to 0.76 (weighted mean = 0.73), indicating fair model discrimination (Figure 2). The overall AUC delta was 0.07. However, our estimates may possibly be favoring EWSs that use statistical modeling by virtue of their derivation in an original research population compared with aggregate-weighted EWSs that were derived externally. For example, sensitivity analysis of eCART,18 an EWS using machine learning, showed an AUC drop of 1% in a large external patient population,14 while NEWS AUCs13 dropped between 11% and 15% in two large external populations (Appendix Table 7).14,30 For hospitals adopting an externally developed EWS using statistical modeling, these results suggest that an AUC delta of approximately 5% can be expected and 7% for an internally developed EWS.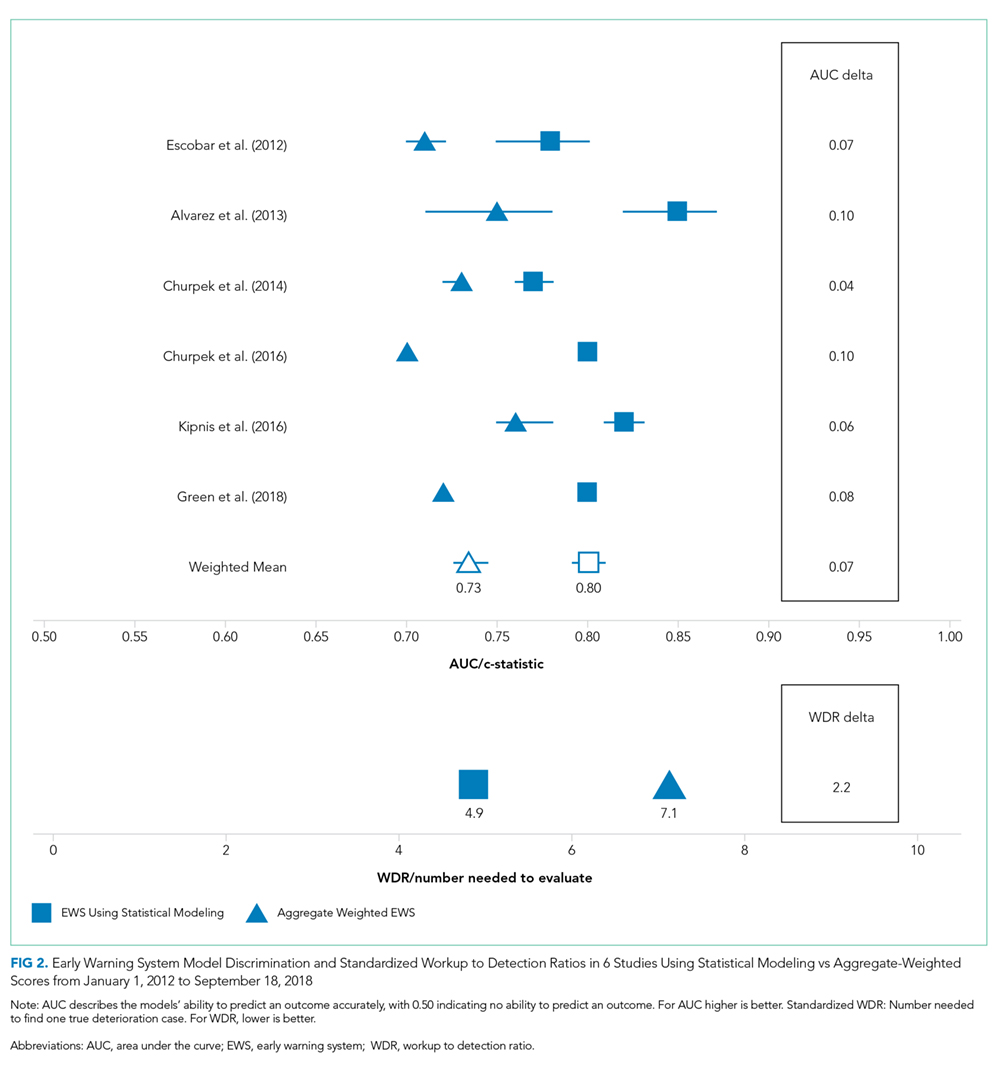
The models’ sensitivity ranged from 0.49 to 0.54 (mean = 0.51) for EWSs using statistical modeling and 0.39 to 0.50 (mean = 0.43). These results were based on chosen alert volume cutoffs. Specificity ranged from 0.90 to 0.94 (mean = 0.92) in EWSs using statistical modeling compared with 0.83 to 0.93 (mean = 0.89) in aggregate-weighted EWS models. At the 0.51 sensitivity level (mean sensitivity of reported EWSs using statistical modeling), aggregate-weighted EWSs would have an estimated specificity of approximately 0.87. Conversely, to reach a specificity of 0.92 (mean specificity of reported EWSs using statistical modeling, aggregate-weighted EWSs would have a sensitivity of approximately 0.42 compared with 0.50 in EWSs using statistical modeling (based on three studies reporting both sensitivity and specificity or an AUC graph).
Risk of Bias Assessment
We scored the studies by adapting the Cochrane Collaboration tool for assessing risk of bias 32 (Appendix Table 5). Of the six studies, five received total scores between 1.0 and 2.0 (indicating relatively low bias risk), and one study had a score of 3.5 (indicating higher bias risk). Low bias studies14,17-19,30 used large samples across multiple hospitals, discussed the choice of predictor variables and outcomes more precisely, and reported their measurement approaches and analytic methods in more detail, including imputation of missing data and model calibration.
DISCUSSION
In this systematic review, we assessed the predictive ability of EWSs using statistical modeling versus aggregate-weighted EWS models to detect clinical deterioration risk in hospitalized adults in general wards. From 2007 to 2018, at least five systematic reviews examined aggregate-weighted EWSs in adult inpatient settings.33-37 No systematic review, however, has synthesized the evidence of EWSs using statistical modeling.
The recent evidence is limited to six studies, of which five had favorable risk of bias scores. All studies included in this review demonstrated superior model performance of the EWSs using statistical modeling compared with an aggregate-weighted EWS, and at least five of the six studies employed rigor in design, measurement, and analytic method. The AUC absolute difference between EWSs using statistical modeling and aggregate-weighted EWSs was 7% overall, moving model performance from fair to good (Table 2; Figure 2). Although this increase in discriminative power may appear modest, it translates into avoiding a 45% increase in WDR workload generated by an aggregate-weighted EWS, approximately two patient evaluations for each true positive case.
Results of our review suggest that EWSs using statistical modeling predict clinical deterioration risk with better precision. This is an important finding for the following reasons: (1) Better risk prediction can support the activation of rescue; (2) Given federal mandates to curb spending, the elimination of some resource-intensive false positive evaluations supports high-value care;38 and (3) The Quadruple Aim39 accounts for clinician wellbeing. EWSs using statistical modeling may offer benefits in terms of clinician satisfaction with the human–system interface because better discrimination reduces the daily evaluation workload/cognitive burden and because the reduction of false positive alerts may reduce alert fatigue.40,41
Still, an important issue with risk detection is that it is unknown which percentage of patients are uniquely identified by an EWS and not already under evaluation by the clinical team. For example, a recent study by Bedoya et al.42 found that using NEWS did not improve clinical outcomes and nurses frequently disregarded the alert. Another study43 found that the combined clinical judgment of physicians and nurses had an AUC of 0.90 in predicting mortality. These results suggest that at certain times, an EWS alert may not add new useful information for clinicians even when it correctly identifies deterioration risk. It remains difficult to define exactly how many patients an EWS would have to uniquely identify to have clinical utility.
Even EWSs that use statistical modeling cannot detect all true deterioration cases perfectly, and they may at times trigger an alert only when the clinical team is already aware of a patient’s clinical decline. Consequently, EWSs using statistical modeling can at best augment and support—but not replace—RRT rounding, physician workup, and vigilant frontline staff. However, clinicians, too, are not perfect, and the failure-to-rescue literature suggests that certain human factors are antecedents to patient crises (eg, stress and distraction,44-46 judging by precedent/experience,44,47 and innate limitations of human cognition47). Because neither clinicians nor EWSs can predict deterioration perfectly, the best possible rescue response combines clinical vigilance, RRT rounding, and EWSs using statistical modeling as complementary solutions.
Our findings suggest that predictive models cannot be judged purely on AUC (in fact, it would be ill-advised) but also by their clinical utility (expressed in WDR and PPV): How many patients does a clinician need to evaluate?9-11 Precision is not meaningful if it comes at the expense of unmanageable evaluation workloads, and our findings suggest that clinicians should evaluate models based on their clinical utility. Hospitals considering adoption of an EWS using statistical modeling should consider that externally developed EWSs appear to experience a performance drop when applied to a new patient population; a slightly higher WDR and slightly lower AUC can be expected. EWSs using statistical modeling appear to perform best when tailored to the targeted patient population (or are derived in-house). Model depreciation over time will likely require recalibration. In addition, adoption of a machine learning algorithm may mean that original model results are obscured by the black box output of the algorithm.48-50
Findings from this systematic review are subject to several limitations. First, we applied strict inclusion criteria, which led us to exclude studies that offered findings in specialty units and specific patient subpopulations, among others. In the interest of systematic comparison, our findings are limited to general wards. We also restricted our search to recent studies that reported on models predicting clinical deterioration, which we defined as the composite of ICU transfer and/or death. Clinically, deteriorating patients in general wards either die or are transferred to ICU. This criterion resulted in exclusion of the Rothman Index,51 which predicts “death within 24 hours” but not ICU transfer. The AUC in this study was higher than those selected in this review (0.93 compared to 0.82 for MEWS; AUC delta: 0.09). The higher AUC may be a function of the outcome definition (30-day mortality would be more challenging to predict). Therefore, hospitals or health systems interested in purchasing an EWS using statistical modeling should carefully consider the outcome selection and definition.
Second, as is true for systematic reviews in general,52 the degree of clinical and methodological heterogeneity across the selected studies may limit our findings. Studies occurred in various settings (university hospital, teaching hospitals, and community hospitals), which may serve diverging patient populations. We observed that studies in university-based settings had a higher event rate ranging from 5.6% to 7.8%, which may result in higher PPV results in these settings. However, this increase would apply to both EWS types equally. To arrive at a “true” reflection of model performance, the simulations for PPV and WDR have used a more conservative event rate of 4%. We observed heterogenous mortality definitions, which did not always account for the reality that a patient’s death may be an appropriate outcome (ie, it was concordant with treatment wishes in the context of severe illness or an end-of-life trajectory). Studies also used different sampling procedures; some allowed multiple observations although most did not. The variation in sampling may change PPV and limit our systematic comparison. However, regardless of methodological differences, our review suggests that EWSs using statistical modeling perform better than aggregate-weighted EWSs in each of the selected studies.
Third, systematic reviews may be subject to the issue of publication bias because they can only compare published results and could possibly omit an unknown number of unpublished studies. However, the selected studies uniformly demonstrated similar model improvements, which are plausibly related to the larger number of covariates, statistical methods, and shrinkage of random error.
Finally, this review was limited to the comparison of observational studies, which aimed to answer how the two EWS classes compared. These studies did not address whether an alert had an impact on clinical care and patient outcomes. Results from at least one randomized nonblinded controlled trial suggest that alert-driven RRT activation may reduce the length of stay by 24 hours and use of oximetry, but has no impact on mortality, ICU transfer, and ICU length of stay.53
CONCLUSION
Our findings point to three areas of need for the field of predictive EWS research: (1) a standardized set of clinical deterioration outcome measures, (2) a standardized set of measures capturing clinical evaluation workload and alert frequency, and (3) cost estimates of clinical workloads with and without deployment of an EWS using statistical modeling. Given the present divergence of outcome definitions, EWS research may benefit from a common “clinical deterioration” outcome standard, including transfer to ICU, inpatient/30-day/90-day mortality, and death with DNR, comfort care, or hospice. The field is lacking a standardized clinical workload measure and an understanding of the net percentage of patients uniquely identified by an EWS.
By using predictive analytics, health systems may be better able to achieve the goals of high-value care and patient safety and support the Quadruple Aim. Still, gaps in knowledge exist regarding the measurement of the clinical processes triggered by EWSs, evaluation workloads, alert fatigue, clinician burnout associated with the human-alert interface, and costs versus benefits. Future research should evaluate the degree to which EWSs can identify risk among patients who are not already under evaluation by the clinical team, assess the balanced treatment effects of RRT interventions between decedents and survivors, and investigate clinical process times relative to the time of an EWS alert using statistical modeling.
Acknowledgments
The authors would like to thank Ms. Jill Pope at the Kaiser Permanente Center for Health Research in Portland, OR for her assistance with manuscript preparation. Daniel Linnen would like to thank Dr. Linda Franck, PhD, RN, FAAN, Professor at the University of California, San Francisco, School of Nursing for reviewing the manuscript.
Disclosures
The authors declare no conflicts of interest.
Funding
The Maribelle & Stephen Leavitt Scholarship, the Jonas Nurse Scholars Scholarship at the University of California, San Francisco, and the Nurse Scholars Academy Predoctoral Research Fellowship at Kaiser Permanente Northern California supported this study during Daniel Linnen’s doctoral training at the University of California, San Francisco. Dr. Vincent Liu was funded by National Institute of General Medical Sciences Grant K23GM112018.
1. Institute of Medicine (US) Committee on Quality of Health Care in America; Kohn LT, Corrigan JM, Donaldson MS, editors. To Err is Human: Building a Safer Health System. Washington (DC): National Academies Press (US); 2000. PubMed
2. Bapoje SR, Gaudiani JL, Narayanan V, Albert RK. Unplanned transfers to a medical intensive care unit: causes and relationship to preventable errors in care. J Hosp Med. 2011;6(2):68-72. doi: 10.1002/jhm.812. PubMed
3. Liu V, Escobar GJ, Greene JD, et al. Hospital deaths in patients with sepsis from 2 independent cohorts. JAMA. 2014;312(1):90-92. doi: 10.1001/jama.2014.5804. PubMed
4. Winters BD, Pham JC, Hunt EA, et al. Rapid response systems: a systematic review. Crit Care Med. 2007;35(5):1238-1243. doi: 10.1097/01.CCM.0000262388.85669.68. PubMed
5. Torio C. Andrews RM (AHRQ). National inpatient hospital costs: the most expensive conditions by payer, 2011. HCUP Statistical Brief# 160. August 2013. Agency for Healthcare Research and Quality, Rockville, MD. Agency for Healthcare Research and Quality. 2015. http://www.ncbi.nlm.nih.gov/books/NBK169005/. Accessed July 10, 2018. PubMed
6. Levinson DR, General I. Adverse events in hospitals: national incidence among Medicare beneficiaries. Department of Health and Human Services Office of the Inspector General. 2010.
7. McGaughey J, Alderdice F, Fowler R, et al. Outreach and Early Warning Systems (EWS) for the prevention of intensive care admission and death of critically ill adult patients on general hospital wards. Cochrane Database Syst Rev. 2007;3(3):CD005529:Cd005529. doi: 10.1002/14651858.CD005529.pub2. PubMed
8. Morgan R, Williams F, Wright M. An early warning score for the early detection of patients with impending illness. Clin Intensive Care. 1997;8:100.
9. Escobar GJ, Dellinger RP. Early detection, prevention, and mitigation of critical illness outside intensive care settings. J Hosp Med. 2016;11(1):S5-S10. doi: 10.1002/jhm.2653. PubMed
10. Escobar GJ, Ragins A, Scheirer P, et al. Nonelective rehospitalizations and postdischarge mortality: predictive models suitable for use in real time. Med Care. 2015;53(11):916-923. doi: 10.1097/MLR.0000000000000435. PubMed
11. Liu VX. Toward the “plateau of productivity”: enhancing the value of machine learning in critical care. Crit Care Med. 2018;46(7):1196-1197. doi: 10.1097/CCM.0000000000003170. PubMed
12. Subbe CP, Kruger M, Rutherford P, Gemmel L. Validation of a modified Early Warning Score in medical admissions. QJM. 2001;94(10):521-526. doi: 10.1093/qjmed/94.10.521. PubMed
13. Smith GB, Prytherch DR, Meredith P, Schmidt PE, Featherstone PI. The ability of the National Early Warning Score (NEWS) to discriminate patients at risk of early cardiac arrest, unanticipated intensive care unit admission, and death. Resuscitation. 2013;84(4):465-470. doi: 10.1016/j.resuscitation.2012.12.016. PubMed
14. Kipnis P, Turk BJ, Wulf DA, et al. Development and validation of an electronic medical record-based alert score for detection of inpatient deterioration outside the ICU. J Biomed Inform. 2016;64:10-19. doi: 10.1016/j.jbi.2016.09.013. PubMed
15. Romero-Brufau S, Huddleston JM, Naessens JM, et al. Widely used track and trigger scores: are they ready for automation in practice? Resuscitation. 2014;85(4):549-552. doi: 10.1016/j.resuscitation.2013.12.017. PubMed
16. Bates DW, Saria S, Ohno-Machado L, Shah A, Escobar G. Big data in health care: using analytics to identify and manage high-risk and high-cost patients. Health Aff (Millwood). 2014;33(7):1123-1131. doi: 10.1377/hlthaff.2014.0041. PubMed
17. Churpek MM, Yuen TC, Park SY, Gibbons R, Edelson DP. Using electronic health record data to develop and validate a prediction model for adverse outcomes in the wards. Crit Care Med. 2014;42(4):841-848. doi: 10.1097/CCM.0000000000000038. PubMed
18. Churpek MM, Yuen TC, Winslow C, et al. Multicenter comparison of machine learning methods and conventional regression for predicting clinical deterioration on the wards. Crit Care Med. 2016;44(2):368-374. doi: 10.1097/CCM.0000000000001571. PubMed
19. Escobar GJ, LaGuardia JC, Turk BJ, et al. Early detection of impending physiologic deterioration among patients who are not in intensive care: development of predictive models using data from an automated electronic medical record. J Hosp Med. 2012;7(5):388-395. doi: 10.1002/jhm.1929. PubMed
20. Zweig MH, Campbell G. Receiver-operating characteristic (ROC) plots: a fundamental evaluation tool in clinical medicine. Clin Chem. 1993;39(4):561-577. PubMed
21. Collins GS, Reitsma JB, Altman DG, Moons KG. Transparent reporting of a multivariable prediction model for individual prognosis or diagnosis (TRIPOD): the TRIPOD statement. BMC Med. 2015;13(1):1. doi: 10.1186/s12916-014-0241-z. PubMed
22. Moher D, Liberati A, Tetzlaff J, Altman DG, PRISMA Group. Preferred reporting items for systematic reviews and meta-analyses: the Prisma statement. PLOS Med. 2009;6(7):e1000097. doi: 10.1371/journal.pmed.1000097. PubMed
23. Higgins JP, Green S. Cochrane handbook for systematic reviews of interventions version 5.1. 0. The Cochrane Collaboration. 2011;5.
24. Bossuyt P, Davenport C, Deeks J, et al. Interpreting results and drawing conclusions. In: Higgins PTJ, Green S, eds. Cochrane Handbook for Systematic Reviews of Diagnostic Test Accuracy Version 0.9. The Cochrane Collaboration; 2013. Chapter 11
25. Altman DG, Bland JM. Statistics Notes: Diagnostic tests 2: predictive values. BMJ. 1994;309(6947):102. doi: 10.1136/bmj.309.6947.102. PubMed
26. Heston TF. Standardizing predictive values in diagnostic imaging research. J Magn Reson Imaging. 2011;33(2):505; author reply 506-507. doi: 10.1002/jmri.22466. PubMed
27. Hanley JA, McNeil BJ. The meaning and use of the area under a receiver operating characteristic (ROC) curve. Radiology. 1982;143(1):29-36. doi: 10.1148/radiology.143.1.7063747. PubMed
28. Bewick V, Cheek L, Ball J. Statistics review 13: receiver operating characteristic curves. Crit Care. 2004;8(6):508-512. doi: 10.1186/cc3000. PubMed
29. Alvarez CA, Clark CA, Zhang S, et al. Predicting out of intensive care unit cardiopulmonary arrest or death using electronic medical record data. BMC Med Inform Decis Mak. 2013;13:28. doi: 10.1186/1472-6947-13-28. PubMed
30. Green M, Lander H, Snyder A, et al. Comparison of the between the FLAGS calling criteria to the MEWS, NEWS and the electronic Cardiac Arrest Risk Triage (eCART) score for the identification of deteriorating ward patients. Resuscitation. 2018;123:86-91. doi: 10.1016/j.resuscitation.2017.10.028. PubMed
31. Berger T, Green J, Horeczko T, et al. Shock index and early recognition of sepsis in the emergency department: pilot study. West J Emerg Med. 2013;14(2):168-174. doi: 10.5811/westjem.2012.8.11546. PubMed
32. Higgins JPT, Altman DG, Gøtzsche PC, et al. The Cochrane Collaboration’s tool for assessing risk of bias in randomised trials. BMJ. 2011;343:d5928-d5928. doi: 10.1136/bmj.d5928.
33. Johnstone CC, Rattray J, Myers L. Physiological risk factors, early warning scoring systems and organizational changes. Nurs Crit Care. 2007;12(5):219-224. doi: 10.1111/j.1478-5153.2007.00238.x. PubMed
34. McNeill G, Bryden D. Do either early warning systems or emergency response teams improve hospital patient survival? A systematic review. Resuscitation. 2013;84(12):1652-1667. doi: 10.1016/j.resuscitation.2013.08.006. PubMed
35. Smith M, Chiovaro J, O’Neil M, et al. Early Warning System Scores: A Systematic Review. In: Washington (DC): Department of Veterans Affairs (US); 2014 Jan: https://www.ncbi.nlm.nih.gov/books/NBK259031/. Accessed January 23, 2017. PubMed
36. Smith ME, Chiovaro JC, O’Neil M, et al. Early warning system scores for clinical deterioration in hospitalized patients: a systematic review. Ann Am Thorac Soc. 2014;11(9):1454-1465. doi: 10.1513/AnnalsATS.201403-102OC. PubMed
37. Subbe CP, Williams E, Fligelstone L, Gemmell L. Does earlier detection of critically ill patients on surgical wards lead to better outcomes? Ann R Coll Surg Engl. 2005;87(4):226-232. doi: 10.1308/003588405X50921. PubMed
38. Berwick DM, Hackbarth AD. Eliminating waste in us health care. JAMA. 2012;307(14):1513-1516. doi: 10.1001/jama.2012.362. PubMed
39. Sikka R, Morath JM, Leape L. The Quadruple Aim: care, health, cost and meaning in work.. BMJ Quality & Safety. 2015;24(10):608-610. doi: 10.1136/bmjqs-2015-004160. PubMed
40. Guardia-Labar LM, Scruth EA, Edworthy J, Foss-Durant AM, Burgoon DH. Alarm fatigue: the human-system interface. Clin Nurse Spec. 2014;28(3):135-137. doi: 10.1097/NUR.0000000000000039. PubMed
41. Ruskin KJ, Hueske-Kraus D. Alarm fatigue: impacts on patient safety. Curr Opin Anaesthesiol. 2015;28(6):685-690. doi: 10.1097/ACO.0000000000000260. PubMed
42. Bedoya AD, Clement ME, Phelan M, et al. Minimal impact of implemented early warning score and best practice alert for patient deterioration. Crit Care Med. 2019;47(1):49-55. doi: 10.1097/CCM.0000000000003439. PubMed
43. Brabrand M, Hallas J, Knudsen T. Nurses and physicians in a medical admission unit can accurately predict mortality of acutely admitted patients: A prospective cohort study. PLoS One. 2014;9(7):e101739. doi: 10.1371/journal.pone.0101739. PubMed
44. Acquaviva K, Haskell H, Johnson J. Human cognition and the dynamics of failure to rescue: the Lewis Blackman case. J Prof Nurs. 2013;29(2):95-101. doi: 10.1016/j.profnurs.2012.12.009. PubMed
45. Jones A, Johnstone MJ. Inattentional blindness and failures to rescue the deteriorating patient in critical care, emergency and perioperative settings: four case scenarios. Aust Crit Care. 2017;30(4):219-223. doi: 10.1016/j.aucc.2016.09.005. PubMed
46. Reason J. Understanding adverse events: human factors. Qual Health Care. 1995;4(2):80-89. doi: 10.1136/qshc.4.2.80. PubMed
47. Bate L, Hutchinson A, Underhill J, Maskrey N. How clinical decisions are made. Br J Clin Pharmacol. 2012;74(4):614-620. doi: 10.1111/j.1365-2125.2012.04366.x. PubMed
48. Cabitza F, Rasoini R, Gensini GF. Unintended consequences of machine learning in medicine. JAMA. 2017;318(6):517-518. doi: 10.1001/jama.2017.7797. PubMed
49. Stead WW. Clinical implications and challenges of artificial intelligence and deep learning. JAMA. 2018;320(11):1107-1108. doi: 10.1001/jama.2018.11029. PubMed
50. Wong TY, Bressler NM. Artificial intelligence with deep learning technology looks into diabetic retinopathy screening. JAMA. 2016;316(22):2366-2367. doi: 10.1001/jama.2016.17563. PubMed
51. Finlay GD, Rothman MJ, Smith RA. Measuring the modified early warning score and the Rothman index: advantages of utilizing the electronic medical record in an early warning system. J Hosp Med. 2014;9(2):116-119. doi: 10.1002/jhm.2132. PubMed
52. Gagnier JJ, Moher D, Boon H, Beyene J, Bombardier C. Investigating clinical heterogeneity in systematic reviews: a methodologic review of guidance in the literature. BMC Med Res Methodol. 2012;12:111-111. doi: 10.1186/1471-2288-12-111. PubMed
53. Kollef MH, Chen Y, Heard K, et al. A randomized trial of real-time automated clinical deterioration alerts sent to a rapid response team. J Hosp Med. 2014;9(7):424-429. doi: 10.1002/jhm.2193. PubMed
Ensuring the delivery of safe and cost-effective care is the core mission of hospitals,1 but nearly 90% of unplanned patient transfers to critical care may be the result of a new or worsening condition.2 The cost of treatment of sepsis, respiratory failure, and arrest, which are among the deadliest conditions for hospitalized patients,3,4 are estimated to be $30.7 billion annually (8.1% of national hospital costs).5 As many as 44% of adverse events may be avoidable,6 and concerns about patient safety have motivated hospitals and health systems to find solutions to identify and treat deteriorating patients expeditiously. Evidence suggests that many hospitalized patients presenting with rapid decline showed warning signs 24-48 hours before the event.7 Therefore, ample time may be available for early identification and intervention in many patients.
As early as 1997, hospitals have used early warning systems (EWSs) to identify at-risk patients and proactively inform clinicians.8 EWSs can predict a proportion of patients who are at risk for clinical deterioration (this benefit is measured with sensitivity) with the tradeoff that some alerts are false (as measured with positive predictive value [PPV] or its inverse, workup-to-detection ratio [WDR]9-11). Historically, EWS tools were paper-based instruments designed for fast manual calculation by hospital staff. Many aggregate-weighted EWS instruments continue to be used for research and practice, including the Modified Early Warning Systems (MEWS)12 and National Early Warning System (NEWS).13,14 Aggregate-weighted EWSs lack predictive precision because they use simple addition of a few clinical parameter scores, including vital signs and level of consciousness.15 Recently, a new category has emerged, which use multivariable regression or machine learning; we refer to this category as “EWSs using statistical modeling”. This type of EWS uses more computationally intensive risk stratification methods to predict risk16 by adjusting for a larger set of clinical covariates, thereby reducing the degree of unexplained variance. Although these EWSs are thought to be more precise and to generate fewer false positive alarms compared with others,14,17-19 no review to date has systematically synthesized and compared their performance against aggregate-weighted EWSs.
Purpose
The purpose of this systematic review was to evaluate the recent literature regarding prognostic test accuracy and clinical workloads generated by EWSs using statistical modeling versus aggregate-weighted systems.
METHODS
Search Strategy
Adhering to PRISMA protocol guidelines for systematic reviews, we searched the peer-reviewed literature in PubMed and CINAHL Plus, as well as conference proceedings and online repositories of patient safety organizations published between January 1, 2012 and September 15, 2018. We selected this timeframe because EWSs using statistical modeling are relatively new approaches compared with the body of evidence concerning aggregate-weighted EWSs. An expert PhD researcher confirmed the search results in a blinded independent query.
Inclusion and Exclusion Criteria
We included peer-reviewed articles reporting the area under the receiver operator curve (AUC),20 or the equivalent c-statistic, of models predicting clinical deterioration (measured as the composite of transfer to intensive care unit (ICU) and/or mortality) among adult patients in general hospital wards. We excluded studies if they did not compare an EWS using statistical modeling with an aggregate-weighted EWS, did not report AUC, or only reported on an aggregate-weighted EWS. Excluded settings were pediatrics, obstetrics, emergency departments, ICUs, transitional care units, and oncology. We also excluded studies with samples limited to physiological monitoring, sepsis, or postsurgical subpopulations.
Data Abstraction
Following the TRIPOD guidelines for the reporting of predictive models,21 and the PRISMA and Cochrane Collaboration guidelines for systematic reviews,22-24 we extracted study characteristics (Table 1), sample demographics (Appendix Table 4), model characteristics and performance (Appendix Table 5), and level of scientific evidence and risk of bias (Appendix Table 6). To address the potential for overfitting, we selected model performance results of the validation dataset rather than the derivation dataset, if reported. If studies reported multiple models in either EWS category, we selected the best-performing model for comparison.
Measures of Model Performance
Because predictive models can achieve good case identification at the expense of high clinical workloads, an assessment of model performance would be incomplete without measures of clinical utility. For clinicians, this aspect can be measured as the model’s PPV (the percentage of true positive alerts among all alerts), or more intelligibly, as the WDR, which equals 1/PPV. WDR indicates the number of patients requiring evaluation to identify and treat one true positive case.9-11 It is known that differences in event rates (prevalence or pretest probability) influence a model’s PPV25 and its reciprocal WDR. However, for systematic comparison, PPV and WDR can be standardized using a fixed representative event rate across studies.24,26 We abstracted the reported PPV and WDR, and computed standardized PPV and WDR for an event rate of 4%.
Other measures included the area under the receiver operator curve (AUC),20 sensitivity, and specificity. AUC plots a model’s false positive rate (x-axis) against its true positive rate (y-axis), with an ideal scenario of very high y-values and very low x-values.27 Sensitivity (the model’s ability to detect a true positive case among all cases) and specificity (the model’s ability to detect a true noncase among all noncases28) are influenced by chosen alert thresholds. It is incorrect to assume that a given model produces only one sensitivity/specificity result; for systematic comparison, we therefore selected results in the 50% sensitivity range, and separately, in the 92% specificity range for EWSs using statistical modeling. Then, we simulated a fixed sensitivity of 0.51 and assumed specificity of 0.87 in aggregate-weighted EWSs.
RESULTS
Search Results
The PubMed search for “early warning score OR early warning system AND deterioration OR predict transfer ICU” returned 285 peer-reviewed articles. A search on CINAHL Plus using the same filters and query terms returned 219 articles with no additional matches (Figure 1). Of the 285 articles, we excluded 269 during the abstract screen and 10 additional articles during full-text review (Figure 1). A final review of the reference lists of the six selected studies did not yield additional articles.
Study Characteristics
There were several similarities across the selected studies (Table 1). All occurred in the United States; all compared their model’s performance against at least one aggregate-weighted EWS model;14,17-19,29 and all used retrospective cohort designs. Of the six studies, one took place in a single hospital;29 three pooled data from five hospitals;17,18,30 and two occurred in a large integrated healthcare delivery system using data from 14 and, subsequently, 21 hospitals.14,19 The largest study14 included nearly 650,000 admissions, while the smallest study29 reported slightly less than 7,500 admissions. Of the six studies, four used multivariable regression,14,17,19,29 and two used machine learning techniques for outcome prediction.18,30
Outcome Variables
The primary outcome for inclusion in this review was clinical deterioration measured by the composite of transfer to ICU and some measure of mortality. Churpek et al.10,11 and Green et al.30 also included cardiac arrest, and Alvarez et al.22 included respiratory compromise in their outcome composite.
Researchers used varying definitions of mortality, including “death outside the ICU in a patient whose care directive was full code;”14,19 “death on the wards without attempted resuscitation;”17,18 “an in-hospital death in patients without a DNR order at admission that occurred on the medical ward or in ICU within 24 hours after transfer;”29 or “death within 24 hours.”30
Predictor Variables
We observed a broad assortment of predictor variables. All models included vital signs (heart rate, respiratory rate, blood pressure, and venous oxygen saturation); mental state; laboratory data; age; and sex. Additional variables included comorbidity, shock index,31 severity of illness score, length of stay, event time of day, season, admission category, and length of stay,14,19 among others.
Model Performance
Reported PPV ranged from 0.16 to 0.42 (mean = 0.27) in EWSs using statistical modeling and 0.15 to 0.28 (mean = 0.19) in aggregate-weighted EWS models. The weighted mean standardized PPV, adjusted for an event rate of 4% across studies (Table 2), was 0.21 in EWSs using statistical modeling versus 0.14 in aggregate-weighted EWS models (simulated at 0.51 sensitivity and 0.87 specificity).
Only two studies14,19 reported the WDR metric (alerts generated to identify one true positive case) explicitly. Based on the above PPV results, EWSs using statistical modeling generated a standardized WDR of 4.9 in models using statistical modeling versus 7.1 in aggregate-weighted models (Figure 2). The delta of 2.2 evaluations to find and treat one true positive case equals a 45% relative increase in RRT evaluation workloads using aggregate-weighted EWSs.
AUC values ranged from 0.77 to 0.85 (weighted mean = 0.80) in EWSs using statistical modeling, indicating good model discrimination. AUCs of aggregate-weighted EWSs ranged from 0.70 to 0.76 (weighted mean = 0.73), indicating fair model discrimination (Figure 2). The overall AUC delta was 0.07. However, our estimates may possibly be favoring EWSs that use statistical modeling by virtue of their derivation in an original research population compared with aggregate-weighted EWSs that were derived externally. For example, sensitivity analysis of eCART,18 an EWS using machine learning, showed an AUC drop of 1% in a large external patient population,14 while NEWS AUCs13 dropped between 11% and 15% in two large external populations (Appendix Table 7).14,30 For hospitals adopting an externally developed EWS using statistical modeling, these results suggest that an AUC delta of approximately 5% can be expected and 7% for an internally developed EWS.
The models’ sensitivity ranged from 0.49 to 0.54 (mean = 0.51) for EWSs using statistical modeling and 0.39 to 0.50 (mean = 0.43). These results were based on chosen alert volume cutoffs. Specificity ranged from 0.90 to 0.94 (mean = 0.92) in EWSs using statistical modeling compared with 0.83 to 0.93 (mean = 0.89) in aggregate-weighted EWS models. At the 0.51 sensitivity level (mean sensitivity of reported EWSs using statistical modeling), aggregate-weighted EWSs would have an estimated specificity of approximately 0.87. Conversely, to reach a specificity of 0.92 (mean specificity of reported EWSs using statistical modeling, aggregate-weighted EWSs would have a sensitivity of approximately 0.42 compared with 0.50 in EWSs using statistical modeling (based on three studies reporting both sensitivity and specificity or an AUC graph).
Risk of Bias Assessment
We scored the studies by adapting the Cochrane Collaboration tool for assessing risk of bias 32 (Appendix Table 5). Of the six studies, five received total scores between 1.0 and 2.0 (indicating relatively low bias risk), and one study had a score of 3.5 (indicating higher bias risk). Low bias studies14,17-19,30 used large samples across multiple hospitals, discussed the choice of predictor variables and outcomes more precisely, and reported their measurement approaches and analytic methods in more detail, including imputation of missing data and model calibration.
DISCUSSION
In this systematic review, we assessed the predictive ability of EWSs using statistical modeling versus aggregate-weighted EWS models to detect clinical deterioration risk in hospitalized adults in general wards. From 2007 to 2018, at least five systematic reviews examined aggregate-weighted EWSs in adult inpatient settings.33-37 No systematic review, however, has synthesized the evidence of EWSs using statistical modeling.
The recent evidence is limited to six studies, of which five had favorable risk of bias scores. All studies included in this review demonstrated superior model performance of the EWSs using statistical modeling compared with an aggregate-weighted EWS, and at least five of the six studies employed rigor in design, measurement, and analytic method. The AUC absolute difference between EWSs using statistical modeling and aggregate-weighted EWSs was 7% overall, moving model performance from fair to good (Table 2; Figure 2). Although this increase in discriminative power may appear modest, it translates into avoiding a 45% increase in WDR workload generated by an aggregate-weighted EWS, approximately two patient evaluations for each true positive case.
Results of our review suggest that EWSs using statistical modeling predict clinical deterioration risk with better precision. This is an important finding for the following reasons: (1) Better risk prediction can support the activation of rescue; (2) Given federal mandates to curb spending, the elimination of some resource-intensive false positive evaluations supports high-value care;38 and (3) The Quadruple Aim39 accounts for clinician wellbeing. EWSs using statistical modeling may offer benefits in terms of clinician satisfaction with the human–system interface because better discrimination reduces the daily evaluation workload/cognitive burden and because the reduction of false positive alerts may reduce alert fatigue.40,41
Still, an important issue with risk detection is that it is unknown which percentage of patients are uniquely identified by an EWS and not already under evaluation by the clinical team. For example, a recent study by Bedoya et al.42 found that using NEWS did not improve clinical outcomes and nurses frequently disregarded the alert. Another study43 found that the combined clinical judgment of physicians and nurses had an AUC of 0.90 in predicting mortality. These results suggest that at certain times, an EWS alert may not add new useful information for clinicians even when it correctly identifies deterioration risk. It remains difficult to define exactly how many patients an EWS would have to uniquely identify to have clinical utility.
Even EWSs that use statistical modeling cannot detect all true deterioration cases perfectly, and they may at times trigger an alert only when the clinical team is already aware of a patient’s clinical decline. Consequently, EWSs using statistical modeling can at best augment and support—but not replace—RRT rounding, physician workup, and vigilant frontline staff. However, clinicians, too, are not perfect, and the failure-to-rescue literature suggests that certain human factors are antecedents to patient crises (eg, stress and distraction,44-46 judging by precedent/experience,44,47 and innate limitations of human cognition47). Because neither clinicians nor EWSs can predict deterioration perfectly, the best possible rescue response combines clinical vigilance, RRT rounding, and EWSs using statistical modeling as complementary solutions.
Our findings suggest that predictive models cannot be judged purely on AUC (in fact, it would be ill-advised) but also by their clinical utility (expressed in WDR and PPV): How many patients does a clinician need to evaluate?9-11 Precision is not meaningful if it comes at the expense of unmanageable evaluation workloads, and our findings suggest that clinicians should evaluate models based on their clinical utility. Hospitals considering adoption of an EWS using statistical modeling should consider that externally developed EWSs appear to experience a performance drop when applied to a new patient population; a slightly higher WDR and slightly lower AUC can be expected. EWSs using statistical modeling appear to perform best when tailored to the targeted patient population (or are derived in-house). Model depreciation over time will likely require recalibration. In addition, adoption of a machine learning algorithm may mean that original model results are obscured by the black box output of the algorithm.48-50
Findings from this systematic review are subject to several limitations. First, we applied strict inclusion criteria, which led us to exclude studies that offered findings in specialty units and specific patient subpopulations, among others. In the interest of systematic comparison, our findings are limited to general wards. We also restricted our search to recent studies that reported on models predicting clinical deterioration, which we defined as the composite of ICU transfer and/or death. Clinically, deteriorating patients in general wards either die or are transferred to ICU. This criterion resulted in exclusion of the Rothman Index,51 which predicts “death within 24 hours” but not ICU transfer. The AUC in this study was higher than those selected in this review (0.93 compared to 0.82 for MEWS; AUC delta: 0.09). The higher AUC may be a function of the outcome definition (30-day mortality would be more challenging to predict). Therefore, hospitals or health systems interested in purchasing an EWS using statistical modeling should carefully consider the outcome selection and definition.
Second, as is true for systematic reviews in general,52 the degree of clinical and methodological heterogeneity across the selected studies may limit our findings. Studies occurred in various settings (university hospital, teaching hospitals, and community hospitals), which may serve diverging patient populations. We observed that studies in university-based settings had a higher event rate ranging from 5.6% to 7.8%, which may result in higher PPV results in these settings. However, this increase would apply to both EWS types equally. To arrive at a “true” reflection of model performance, the simulations for PPV and WDR have used a more conservative event rate of 4%. We observed heterogenous mortality definitions, which did not always account for the reality that a patient’s death may be an appropriate outcome (ie, it was concordant with treatment wishes in the context of severe illness or an end-of-life trajectory). Studies also used different sampling procedures; some allowed multiple observations although most did not. The variation in sampling may change PPV and limit our systematic comparison. However, regardless of methodological differences, our review suggests that EWSs using statistical modeling perform better than aggregate-weighted EWSs in each of the selected studies.
Third, systematic reviews may be subject to the issue of publication bias because they can only compare published results and could possibly omit an unknown number of unpublished studies. However, the selected studies uniformly demonstrated similar model improvements, which are plausibly related to the larger number of covariates, statistical methods, and shrinkage of random error.
Finally, this review was limited to the comparison of observational studies, which aimed to answer how the two EWS classes compared. These studies did not address whether an alert had an impact on clinical care and patient outcomes. Results from at least one randomized nonblinded controlled trial suggest that alert-driven RRT activation may reduce the length of stay by 24 hours and use of oximetry, but has no impact on mortality, ICU transfer, and ICU length of stay.53
CONCLUSION
Our findings point to three areas of need for the field of predictive EWS research: (1) a standardized set of clinical deterioration outcome measures, (2) a standardized set of measures capturing clinical evaluation workload and alert frequency, and (3) cost estimates of clinical workloads with and without deployment of an EWS using statistical modeling. Given the present divergence of outcome definitions, EWS research may benefit from a common “clinical deterioration” outcome standard, including transfer to ICU, inpatient/30-day/90-day mortality, and death with DNR, comfort care, or hospice. The field is lacking a standardized clinical workload measure and an understanding of the net percentage of patients uniquely identified by an EWS.
By using predictive analytics, health systems may be better able to achieve the goals of high-value care and patient safety and support the Quadruple Aim. Still, gaps in knowledge exist regarding the measurement of the clinical processes triggered by EWSs, evaluation workloads, alert fatigue, clinician burnout associated with the human-alert interface, and costs versus benefits. Future research should evaluate the degree to which EWSs can identify risk among patients who are not already under evaluation by the clinical team, assess the balanced treatment effects of RRT interventions between decedents and survivors, and investigate clinical process times relative to the time of an EWS alert using statistical modeling.
Acknowledgments
The authors would like to thank Ms. Jill Pope at the Kaiser Permanente Center for Health Research in Portland, OR for her assistance with manuscript preparation. Daniel Linnen would like to thank Dr. Linda Franck, PhD, RN, FAAN, Professor at the University of California, San Francisco, School of Nursing for reviewing the manuscript.
Disclosures
The authors declare no conflicts of interest.
Funding
The Maribelle & Stephen Leavitt Scholarship, the Jonas Nurse Scholars Scholarship at the University of California, San Francisco, and the Nurse Scholars Academy Predoctoral Research Fellowship at Kaiser Permanente Northern California supported this study during Daniel Linnen’s doctoral training at the University of California, San Francisco. Dr. Vincent Liu was funded by National Institute of General Medical Sciences Grant K23GM112018.
1. Institute of Medicine (US) Committee on Quality of Health Care in America; Kohn LT, Corrigan JM, Donaldson MS, editors. To Err is Human: Building a Safer Health System. Washington (DC): National Academies Press (US); 2000. PubMed
2. Bapoje SR, Gaudiani JL, Narayanan V, Albert RK. Unplanned transfers to a medical intensive care unit: causes and relationship to preventable errors in care. J Hosp Med. 2011;6(2):68-72. doi: 10.1002/jhm.812. PubMed
3. Liu V, Escobar GJ, Greene JD, et al. Hospital deaths in patients with sepsis from 2 independent cohorts. JAMA. 2014;312(1):90-92. doi: 10.1001/jama.2014.5804. PubMed
4. Winters BD, Pham JC, Hunt EA, et al. Rapid response systems: a systematic review. Crit Care Med. 2007;35(5):1238-1243. doi: 10.1097/01.CCM.0000262388.85669.68. PubMed
5. Torio C. Andrews RM (AHRQ). National inpatient hospital costs: the most expensive conditions by payer, 2011. HCUP Statistical Brief# 160. August 2013. Agency for Healthcare Research and Quality, Rockville, MD. Agency for Healthcare Research and Quality. 2015. http://www.ncbi.nlm.nih.gov/books/NBK169005/. Accessed July 10, 2018. PubMed
6. Levinson DR, General I. Adverse events in hospitals: national incidence among Medicare beneficiaries. Department of Health and Human Services Office of the Inspector General. 2010.
7. McGaughey J, Alderdice F, Fowler R, et al. Outreach and Early Warning Systems (EWS) for the prevention of intensive care admission and death of critically ill adult patients on general hospital wards. Cochrane Database Syst Rev. 2007;3(3):CD005529:Cd005529. doi: 10.1002/14651858.CD005529.pub2. PubMed
8. Morgan R, Williams F, Wright M. An early warning score for the early detection of patients with impending illness. Clin Intensive Care. 1997;8:100.
9. Escobar GJ, Dellinger RP. Early detection, prevention, and mitigation of critical illness outside intensive care settings. J Hosp Med. 2016;11(1):S5-S10. doi: 10.1002/jhm.2653. PubMed
10. Escobar GJ, Ragins A, Scheirer P, et al. Nonelective rehospitalizations and postdischarge mortality: predictive models suitable for use in real time. Med Care. 2015;53(11):916-923. doi: 10.1097/MLR.0000000000000435. PubMed
11. Liu VX. Toward the “plateau of productivity”: enhancing the value of machine learning in critical care. Crit Care Med. 2018;46(7):1196-1197. doi: 10.1097/CCM.0000000000003170. PubMed
12. Subbe CP, Kruger M, Rutherford P, Gemmel L. Validation of a modified Early Warning Score in medical admissions. QJM. 2001;94(10):521-526. doi: 10.1093/qjmed/94.10.521. PubMed
13. Smith GB, Prytherch DR, Meredith P, Schmidt PE, Featherstone PI. The ability of the National Early Warning Score (NEWS) to discriminate patients at risk of early cardiac arrest, unanticipated intensive care unit admission, and death. Resuscitation. 2013;84(4):465-470. doi: 10.1016/j.resuscitation.2012.12.016. PubMed
14. Kipnis P, Turk BJ, Wulf DA, et al. Development and validation of an electronic medical record-based alert score for detection of inpatient deterioration outside the ICU. J Biomed Inform. 2016;64:10-19. doi: 10.1016/j.jbi.2016.09.013. PubMed
15. Romero-Brufau S, Huddleston JM, Naessens JM, et al. Widely used track and trigger scores: are they ready for automation in practice? Resuscitation. 2014;85(4):549-552. doi: 10.1016/j.resuscitation.2013.12.017. PubMed
16. Bates DW, Saria S, Ohno-Machado L, Shah A, Escobar G. Big data in health care: using analytics to identify and manage high-risk and high-cost patients. Health Aff (Millwood). 2014;33(7):1123-1131. doi: 10.1377/hlthaff.2014.0041. PubMed
17. Churpek MM, Yuen TC, Park SY, Gibbons R, Edelson DP. Using electronic health record data to develop and validate a prediction model for adverse outcomes in the wards. Crit Care Med. 2014;42(4):841-848. doi: 10.1097/CCM.0000000000000038. PubMed
18. Churpek MM, Yuen TC, Winslow C, et al. Multicenter comparison of machine learning methods and conventional regression for predicting clinical deterioration on the wards. Crit Care Med. 2016;44(2):368-374. doi: 10.1097/CCM.0000000000001571. PubMed
19. Escobar GJ, LaGuardia JC, Turk BJ, et al. Early detection of impending physiologic deterioration among patients who are not in intensive care: development of predictive models using data from an automated electronic medical record. J Hosp Med. 2012;7(5):388-395. doi: 10.1002/jhm.1929. PubMed
20. Zweig MH, Campbell G. Receiver-operating characteristic (ROC) plots: a fundamental evaluation tool in clinical medicine. Clin Chem. 1993;39(4):561-577. PubMed
21. Collins GS, Reitsma JB, Altman DG, Moons KG. Transparent reporting of a multivariable prediction model for individual prognosis or diagnosis (TRIPOD): the TRIPOD statement. BMC Med. 2015;13(1):1. doi: 10.1186/s12916-014-0241-z. PubMed
22. Moher D, Liberati A, Tetzlaff J, Altman DG, PRISMA Group. Preferred reporting items for systematic reviews and meta-analyses: the Prisma statement. PLOS Med. 2009;6(7):e1000097. doi: 10.1371/journal.pmed.1000097. PubMed
23. Higgins JP, Green S. Cochrane handbook for systematic reviews of interventions version 5.1. 0. The Cochrane Collaboration. 2011;5.
24. Bossuyt P, Davenport C, Deeks J, et al. Interpreting results and drawing conclusions. In: Higgins PTJ, Green S, eds. Cochrane Handbook for Systematic Reviews of Diagnostic Test Accuracy Version 0.9. The Cochrane Collaboration; 2013. Chapter 11
25. Altman DG, Bland JM. Statistics Notes: Diagnostic tests 2: predictive values. BMJ. 1994;309(6947):102. doi: 10.1136/bmj.309.6947.102. PubMed
26. Heston TF. Standardizing predictive values in diagnostic imaging research. J Magn Reson Imaging. 2011;33(2):505; author reply 506-507. doi: 10.1002/jmri.22466. PubMed
27. Hanley JA, McNeil BJ. The meaning and use of the area under a receiver operating characteristic (ROC) curve. Radiology. 1982;143(1):29-36. doi: 10.1148/radiology.143.1.7063747. PubMed
28. Bewick V, Cheek L, Ball J. Statistics review 13: receiver operating characteristic curves. Crit Care. 2004;8(6):508-512. doi: 10.1186/cc3000. PubMed
29. Alvarez CA, Clark CA, Zhang S, et al. Predicting out of intensive care unit cardiopulmonary arrest or death using electronic medical record data. BMC Med Inform Decis Mak. 2013;13:28. doi: 10.1186/1472-6947-13-28. PubMed
30. Green M, Lander H, Snyder A, et al. Comparison of the between the FLAGS calling criteria to the MEWS, NEWS and the electronic Cardiac Arrest Risk Triage (eCART) score for the identification of deteriorating ward patients. Resuscitation. 2018;123:86-91. doi: 10.1016/j.resuscitation.2017.10.028. PubMed
31. Berger T, Green J, Horeczko T, et al. Shock index and early recognition of sepsis in the emergency department: pilot study. West J Emerg Med. 2013;14(2):168-174. doi: 10.5811/westjem.2012.8.11546. PubMed
32. Higgins JPT, Altman DG, Gøtzsche PC, et al. The Cochrane Collaboration’s tool for assessing risk of bias in randomised trials. BMJ. 2011;343:d5928-d5928. doi: 10.1136/bmj.d5928.
33. Johnstone CC, Rattray J, Myers L. Physiological risk factors, early warning scoring systems and organizational changes. Nurs Crit Care. 2007;12(5):219-224. doi: 10.1111/j.1478-5153.2007.00238.x. PubMed
34. McNeill G, Bryden D. Do either early warning systems or emergency response teams improve hospital patient survival? A systematic review. Resuscitation. 2013;84(12):1652-1667. doi: 10.1016/j.resuscitation.2013.08.006. PubMed
35. Smith M, Chiovaro J, O’Neil M, et al. Early Warning System Scores: A Systematic Review. In: Washington (DC): Department of Veterans Affairs (US); 2014 Jan: https://www.ncbi.nlm.nih.gov/books/NBK259031/. Accessed January 23, 2017. PubMed
36. Smith ME, Chiovaro JC, O’Neil M, et al. Early warning system scores for clinical deterioration in hospitalized patients: a systematic review. Ann Am Thorac Soc. 2014;11(9):1454-1465. doi: 10.1513/AnnalsATS.201403-102OC. PubMed
37. Subbe CP, Williams E, Fligelstone L, Gemmell L. Does earlier detection of critically ill patients on surgical wards lead to better outcomes? Ann R Coll Surg Engl. 2005;87(4):226-232. doi: 10.1308/003588405X50921. PubMed
38. Berwick DM, Hackbarth AD. Eliminating waste in us health care. JAMA. 2012;307(14):1513-1516. doi: 10.1001/jama.2012.362. PubMed
39. Sikka R, Morath JM, Leape L. The Quadruple Aim: care, health, cost and meaning in work.. BMJ Quality & Safety. 2015;24(10):608-610. doi: 10.1136/bmjqs-2015-004160. PubMed
40. Guardia-Labar LM, Scruth EA, Edworthy J, Foss-Durant AM, Burgoon DH. Alarm fatigue: the human-system interface. Clin Nurse Spec. 2014;28(3):135-137. doi: 10.1097/NUR.0000000000000039. PubMed
41. Ruskin KJ, Hueske-Kraus D. Alarm fatigue: impacts on patient safety. Curr Opin Anaesthesiol. 2015;28(6):685-690. doi: 10.1097/ACO.0000000000000260. PubMed
42. Bedoya AD, Clement ME, Phelan M, et al. Minimal impact of implemented early warning score and best practice alert for patient deterioration. Crit Care Med. 2019;47(1):49-55. doi: 10.1097/CCM.0000000000003439. PubMed
43. Brabrand M, Hallas J, Knudsen T. Nurses and physicians in a medical admission unit can accurately predict mortality of acutely admitted patients: A prospective cohort study. PLoS One. 2014;9(7):e101739. doi: 10.1371/journal.pone.0101739. PubMed
44. Acquaviva K, Haskell H, Johnson J. Human cognition and the dynamics of failure to rescue: the Lewis Blackman case. J Prof Nurs. 2013;29(2):95-101. doi: 10.1016/j.profnurs.2012.12.009. PubMed
45. Jones A, Johnstone MJ. Inattentional blindness and failures to rescue the deteriorating patient in critical care, emergency and perioperative settings: four case scenarios. Aust Crit Care. 2017;30(4):219-223. doi: 10.1016/j.aucc.2016.09.005. PubMed
46. Reason J. Understanding adverse events: human factors. Qual Health Care. 1995;4(2):80-89. doi: 10.1136/qshc.4.2.80. PubMed
47. Bate L, Hutchinson A, Underhill J, Maskrey N. How clinical decisions are made. Br J Clin Pharmacol. 2012;74(4):614-620. doi: 10.1111/j.1365-2125.2012.04366.x. PubMed
48. Cabitza F, Rasoini R, Gensini GF. Unintended consequences of machine learning in medicine. JAMA. 2017;318(6):517-518. doi: 10.1001/jama.2017.7797. PubMed
49. Stead WW. Clinical implications and challenges of artificial intelligence and deep learning. JAMA. 2018;320(11):1107-1108. doi: 10.1001/jama.2018.11029. PubMed
50. Wong TY, Bressler NM. Artificial intelligence with deep learning technology looks into diabetic retinopathy screening. JAMA. 2016;316(22):2366-2367. doi: 10.1001/jama.2016.17563. PubMed
51. Finlay GD, Rothman MJ, Smith RA. Measuring the modified early warning score and the Rothman index: advantages of utilizing the electronic medical record in an early warning system. J Hosp Med. 2014;9(2):116-119. doi: 10.1002/jhm.2132. PubMed
52. Gagnier JJ, Moher D, Boon H, Beyene J, Bombardier C. Investigating clinical heterogeneity in systematic reviews: a methodologic review of guidance in the literature. BMC Med Res Methodol. 2012;12:111-111. doi: 10.1186/1471-2288-12-111. PubMed
53. Kollef MH, Chen Y, Heard K, et al. A randomized trial of real-time automated clinical deterioration alerts sent to a rapid response team. J Hosp Med. 2014;9(7):424-429. doi: 10.1002/jhm.2193. PubMed
© 2019 Society of Hospital Medicine
Beyond Reporting Early Warning Score Sensitivity: The Temporal Relationship and Clinical Relevance of “True Positive” Alerts that Precede Critical Deterioration
Patients at risk for clinical deterioration in the inpatient setting may not be identified efficiently or effectively by health care providers. Early warning systems that link clinical observations to rapid response mechanisms (such as medical emergency teams) have the potential to improve outcomes, but rigorous studies are lacking.1 The pediatric Rothman Index (pRI) is an automated early warning system sold by the company PeraHealth that is integrated with the electronic health record. The system incorporates vital signs, labs, and nursing assessments from existing electronic health record data to provide a single numeric score that generates alerts based on low absolute scores and acute decreases in score (low scores indicate high mortality risk).2 Automated alerts or rules based on the pRI score are meant to bring important changes in clinical status to the attention of clinicians.
Adverse outcomes (eg, unplanned intensive care unit [ICU] transfers and mortality) are associated with low pRI scores, and scores appear to decline prior to such events.2 However, the limitation of this and other studies evaluating the sensitivity of early warning systems3-6 is that the generated alerts are assigned “true positive” status if they precede clinical deterioration, regardless of whether or not they provide meaningful information to the clinicians caring for the patients. There are two potential critiques of this approach. First, the alert may have preceded a deterioration event but may not have been clinically relevant (eg, an alert triggered by a finding unrelated to the patient’s acute health status, such as a scar that was newly documented as an abnormal skin finding and as a result led to a worsening in the pRI). Second, even if the preceding alert demonstrated clinical relevance to a deterioration event, the clinicians at the bedside may have been aware of the patient’s deterioration for hours and have already escalated care. In this situation, the alert would simply confirm what the clinician already knew.
To better understand the relationship between early warning system acuity alerts and clinical practice, we examined a cohort of hospitalized patients who experienced a critical deterioration event (CDE)7 and who would have triggered a preceding pRI alert. We evaluated the clinical relationship of the alert to the CDE (ie, whether the alert reflected physiologic changes related to a CDE or was instead an artifact of documentation) and identified whether the alert would have preceded evidence that clinicians recognized deterioration or escalated care.
METHODS
Patients and Setting
This retrospective cross-sectional study was performed at Children’s Hospital of Philadelphia (CHOP), a freestanding children’s hospital with 546 beds. Eligible patients were hospitalized on nonintensive care, noncardiology, surgical wards between January 1, 2013, and December 31, 2013. The CHOP Institutional Review Board (IRB) approved the study with waivers of consent and assent. A HIPAA Business Associate Agreement and an IRB Reliance Agreement were in place with PeraHealth to permit data transfer.
Definition of Critical Deterioration Events
Critical deterioration events (CDEs) were defined according to an existing, validated measure7 as unplanned transfers to the ICU with continuous or bilevel positive airway pressure, tracheal intubation, and/or vasopressor infusion in the 12 hours after transfer. At CHOP, all unplanned ICU transfers are routed through the hospital’s rapid response or code blue teams, so these patients were identified using an existing database managed by the CHOP Resuscitation Committee. In the database, the elements of CDEs are entered as part of ongoing quality improvement activities. The time of CDE was defined as the time of the rapid response call precipitating unplanned transfer to the ICU.
The Pediatric Rothman Index
The pRI is an automated acuity score that has been validated in hospitalized pediatric patients.2 The pRI is calculated using existing variables from the electronic health record, including manually entered vital signs, laboratory values, cardiac rhythm, and nursing assessments of organ systems. The weights assigned to continuous variables are a function of deviation from the norm.2,8 (See Supplement 1 for a complete list of variables.)
The pRI is integrated with the electronic health record and automatically generates a score each time a new data observation becomes available. Changes in score over time and low absolute scores generate a graduated series of alerts ranging from medium to very high acuity. This analysis used PeraHealth’s standard pRI alerts. Medium acuity alerts occurred when the pRI score decreased by ≥30% in 24 hours. A high acuity alert occurred when the pRI score decreased by ≥40% in 6 hours. A very high acuity alert occurred when the pRI absolute score was ≤ 30.
Development of the Source Dataset
In 2014, CHOP shared one year of clinical data with PeraHealth as part of the process of deciding whether or not to implement the pRI. The pRI algorithm retrospectively generated scores and acuity alerts for all CHOP patients who experienced CDEs between January 1, 2013, and December 31, 2013. The pRI algorithm was not active in the hospital environment during this time period; the scores and acuity alerts were not visible to clinicians. This dataset was provided to the investigators at CHOP to conduct this project.
Data Collection
Pediatric intensive care nurses trained in clinical research data abstraction from the CHOP Critical Care Center for Evidence and Outcomes performed the chart review for this study. Chart abstraction comparisons were completed on the first 15 charts to ensure interrater reliability, and additional quality assurance checks were performed on intermittent charts to ensure consistency and definition adherence. We managed all data using Research Electronic Data Capture.9
To study the value of alerts labeled as “true positives,” we restricted the dataset to CDEs in which acuity alert(s) within the prior 72 hours would have been triggered if the pRI had been in clinical use at the time.
To identify the clinical relationship between pRI and CDE, we reviewed each chart with the goal of determining whether the preceding acuity alerts were clinically associated with the etiology of the CDE. We determined the etiology of the CDE by reviewing the cause(s) identified in the note written by rapid response or code blue team responders or by the admitting clinical team after transfer to the ICU. We then used a tool provided by PeraHealth to identify the specific score components that led to worsening pRI. If the score components that worsened were (a) consistent with a clinical change as opposed to a documentation artifact and (b) an organ system change that was plausibly related to the CDE etiology, we concluded that the alert was clinically related to the etiology of the CDE.
We defined documentation artifacts as instances in nursing documentation in which a finding unrelated to the patient’s acute health status, such as a scar, was newly documented as abnormal and led to worsening pRI. Any cases in which the clinical relevance was unclear underwent review by additional members of the team
To determine the temporal relationship among pRI, CDE, and clinician awareness or action, we then sought to systematically determine whether the preceding acuity alerts preceded documented evidence of clinicians recognizing deterioration or escalation of care. We made the a priori decision that acuity alerts that occurred more than 24 hours prior to a deterioration event had questionable clinical actionability. Therefore, we restricted this next analysis to CDEs with acuity alerts during the 24 hours prior to a CDE. We reviewed time-stamped progress notes written by clinicians in the 24 hours period prior to the time of the CDE and identified whether the notes reflected an adverse change in patient status or a clinical intervention. We then compared the times of these notes with the times of the alerts and CDEs. Given that documentation of change in clinical status often occurs after clinical intervention, we also reviewed new orders placed in the 24 hours prior to each CDE to determine escalation of care. We identified the following orders as reflective of escalation of care independent of specific disease process: administration of intravenous fluid bolus, blood product, steroid, or antibiotic, increased respiratory support, new imaging studies, and new laboratory studies. We then compared the time of each order with the time of the alert and CDE.
RESULTS
During the study period, 73 events met the CDE criteria and had a pRI alert during admission. Of the 73 events, 50 would have triggered at least one pRI alert in the 72-hour period leading up to the CDE (sensitivity 68%). Of the 50 events, 39 generated pRI alerts in the 24 hours leading up to the event, and 11 others generated pRI alerts between 24 and 72 hours prior to the event but did not generate any alerts during the 24 hours leading up to the event (Figure).
Patient Characteristics
The 50 CDEs labeled as true positives occurred in 46 unique patients. Table 1 displays the event characteristics.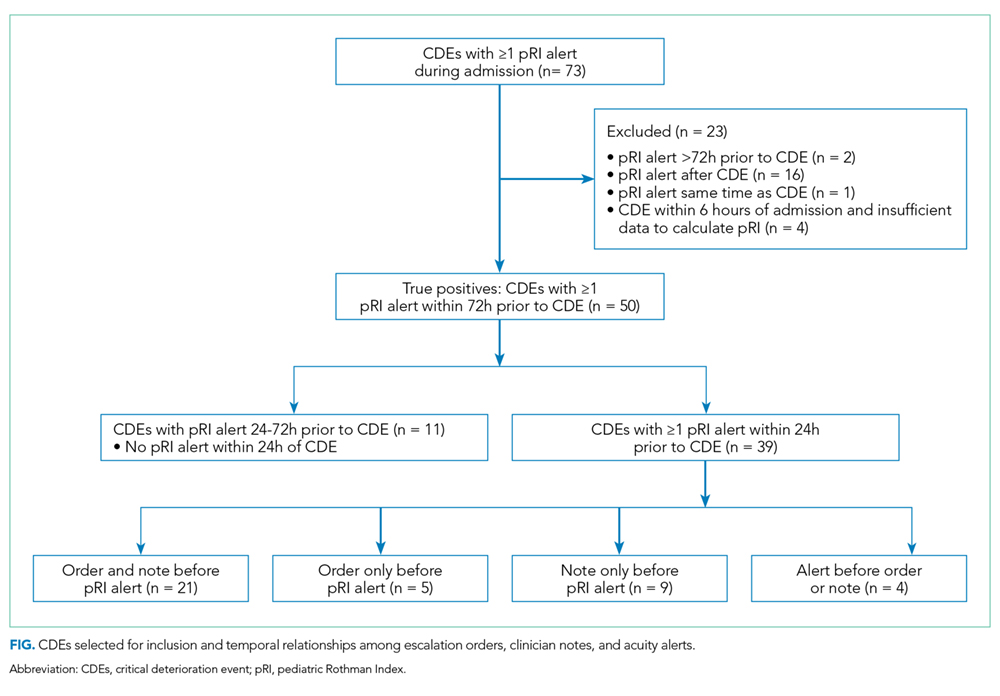
Acuity Alerts
A total of 79 pRI alerts preceded the 50 CDEs. Of these acuity alerts, 44 (56%) were medium acuity alerts, 17 (22%) were high acuity alerts, and 18 (23%) were very high acuity alerts. Of the 50 CDEs that would have triggered pRI alerts, 33 (66%) would have triggered a single acuity alert and 17 (34%) would have triggered multiple acuity alerts.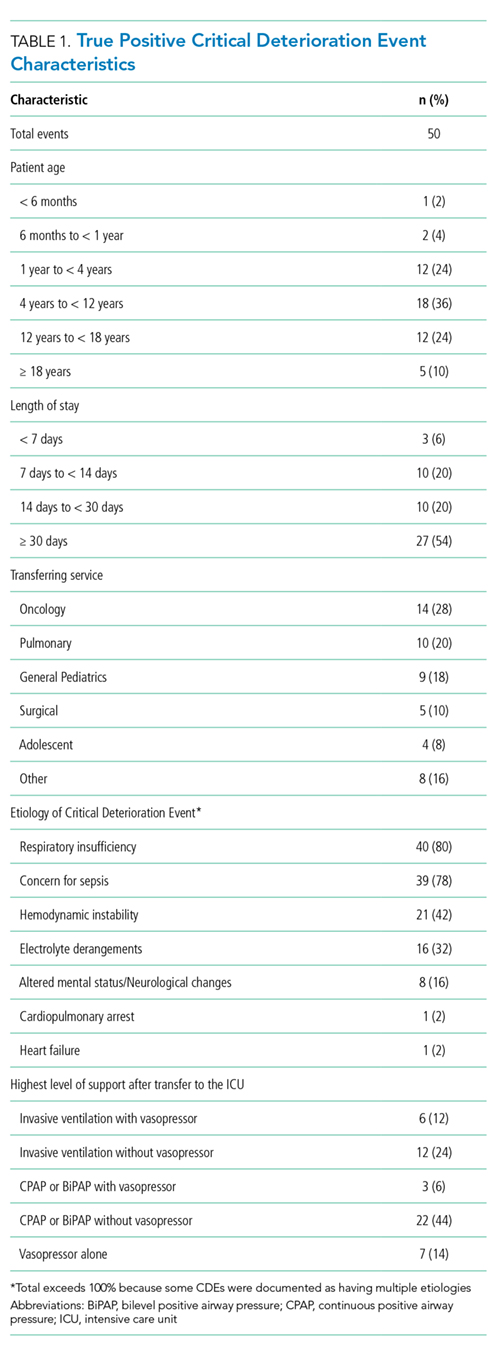
Of the 50 CDEs, 39 (78%) had a preceding acuity alert within 24 hours prior to the CDE. In these cases, the alert preceded the CDE by a median of 3.1 hours (interquartile range of 0.7 to 10.3 hours).
We assessed the score components that caused each alert to trigger. All of the vital sign and laboratory components were assessed as clinically related to the CDE’s etiology. By contrast, about half of nursing assessment components were assessed as clinically related to the etiology of the CDE (Table 2). Abnormal cardiac, respiratory, and neurologic assessments were most frequently assessed as clinically relevant.
Escalation Orders
To determine whether the pRI alert would have preceded the earliest documented treatment efforts, we restricted evaluation to the 39 CDEs that had at least one alert in the 24-hour window prior to the CDE. When we reviewed escalation orders placed by clinicians, we found that in 26 cases (67%), the first clinician order reflecting escalation of care would have preceded the first pRI alert within the 24-hour period prior to the CDE. In 13 cases (33%), the first pRI alert would have preceded the first escalation order placed by the clinician. The first pRI alert and the first escalation order would have occurred within the same 1-hour period in 6 of these cases.
Provider Notes
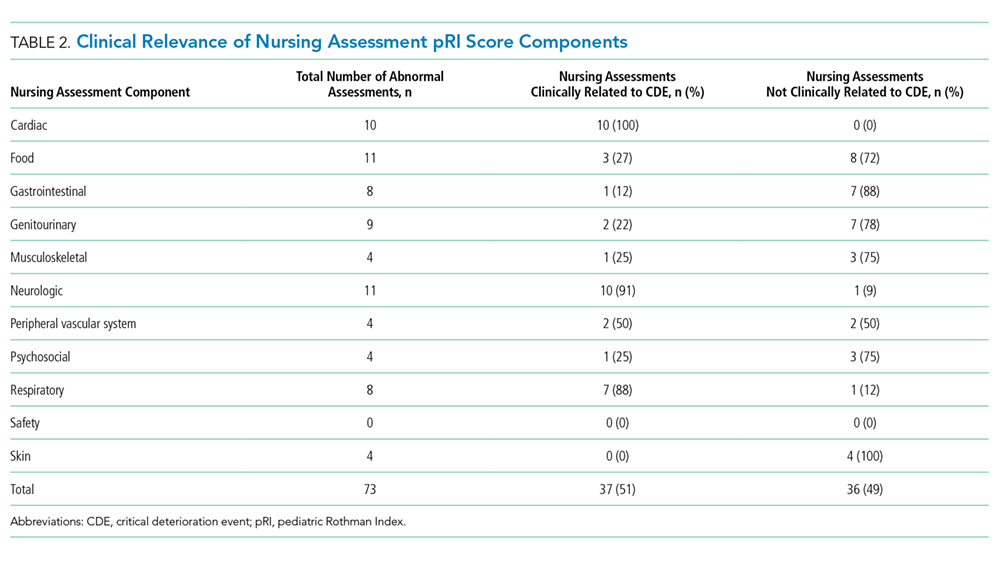
Temporal Relationships
In Supplement 2, we present the proportion of CDEs in which the order or note preceded the pRI alert for each abnormal organ system.
The Figure shows the temporal relationships among escalation orders, clinician notes, and acuity alerts for the 39 CDEs with one or more alerts in the 24 hours leading up to the event. In 21 cases (54%), both an escalation order and a note preceded the first acuity alert. In 14 cases (36%), either an escalation order or a note preceded the first acuity alert. In four cases (10%), the alert preceded any documented evidence that clinicians had recognized deterioration or escalating care.
DISCUSSION
The main finding of this study is that 90% of CDE events that generated “true positive” pRI alerts had evidence suggesting that clinicians had already recognized deterioration and/or were already escalating care before most pRI alerts would have been triggered.
The impacts of early warning scores on patient safety outcomes are not well established. In a recent 21-hospital cluster randomized trial of the BedsidePEWS, a pediatric early warning score system, investigators found that implementing the system does not significantly decrease all-cause mortality in hospitalized children, although hospitals using the BedsidePEWS have low rates of significant CDEs.10 In other studies, early warning scores were often coimplemented with rapid response teams, and separating the incremental benefit of the scoring tool from the availability of a rapid response team is usually not possible.11
Therefore, the benefits of early warning scores are often inferred based on their test characteristics (eg, sensitivity and positive predictive value).12 Sensitivity, which is the proportion of patients who deteriorated and also triggered the early warning score within a reasonable time window preceding the event, is an important consideration when deciding whether an early warning score is worth implementing. A challenging follow-up question that goes beyond sensitivity is how often an early warning score adds new knowledge by identifying patients on a path toward deterioration who were not yet recognized. This study is the first to address that follow-up question. Our results revealed that the score appeared to precede evidence of clinician recognition of deterioration in 10% of CDEs. In some patients, the alert could have contributed to a detection of deterioration that was not previously evident. In the portion of CDEs in which the alert and escalation order or note occurred within the same one-hour window, the alert could have been used as confirmation of clinical suspicion. Notably, we did not evaluate the 16 cases in which a CDE preceded any pRI alert because we chose to focus on “true positive” cases in which pRI alerts preceded CDEs. These events could have had timely recognition by clinicians that we did not capture, so these results may provide an overestimation of CDEs in which the pRI preceded clinician recognition.
Prior work has described a range of mechanisms by which early warning scores can impact patient safety.13 The results of this study suggest limited incremental benefit for the pRI to alert physicians and nurses to new concerning changes at this hospital, although the benefits to low-resourced community hospitals that care for children may be great. The pRI score may also serve as evidence that empowers nurses to overcome barriers to further escalate care, even if the process of escalation has already begun. In addition to empowering nurses, the score may support trainees and clinicians with varying levels of pediatric expertise in the decision to escalate care. Evaluating these potential benefits would require prospective study.
We used the pRI alerts as they were already defined by PeraHealth for CHOP, and different alert thresholds may change score performance. Our study did not identify additional variables to improve score performance, but they can be investigated in future research.
This study had several limitations. First, this work is a single-center study with highly skilled pediatric providers, a mature rapid response system, and low rates of cardiopulmonary arrest outside ICUs. Therefore, the results that we obtained were not immediately generalizable. In a community environment with nurses and physicians who are less experienced in caring for ill children, an early warning score with high sensitivity may be beneficial in ensuring patient safety.
Second, by using escalation orders and notes from the patient chart, we did not capture all the undocumented ways in which clinicians demonstrate awareness of deterioration. For example, a resident may alert the attending on service or a team may informally request consultation with a specialist. We also gave equal weight to escalation orders and clinician notes as evidence of recognition of deterioration. It could be that either orders or notes more closely correlated with clinician awareness.
Finally, the data were from 2013. Although the score components have not changed, efforts to standardize nursing assessments may have altered the performance of the score in the intervening years.
CONCLUSIONS
In most patients who had a CDE at a large freestanding children’s hospital, escalation orders or documented changes in patient status would have occurred before a pRI alert. However, in a minority of patients, the alert could have contributed to the detection of deterioration that was not previously evident.
Disclosures
The authors have nothing to disclose
Funding
The study was supported by funds from the Department of Biomedical and Health Informatics at Children’s Hospital of Philadelphia. PeraHealth, the company that sells the Rothman Index software, provided a service to the investigators but no funding. They applied their proprietary scoring algorithm to the data from Children’s Hospital of Philadelphia to generate alerts retrospectively. This service was provided free of charge in 2014 during the time period when Children’s Hospital of Philadelphia was considering purchasing and implementing PeraHealth software, which it subsequently did. We did not receive any funding for the study from PeraHealth. PeraHealth personnel did not influence the study design, the interpretation of data, the writing of the report, or the decision to submit the article for publication.
1. Alam N, Hobbelink EL, van Tienhoven AJ, van de Ven PM, Jansma EP, Nanayakkara PWB. The impact of the use of the Early Warning Score (EWS) on patient outcomes: a systematic review. Resuscitation. 2014;85(5):587-594. doi: 10.1016/j.resuscitation.2014.01.013. PubMed
2. Rothman MJ, Tepas JJ, Nowalk AJ, et al. Development and validation of a continuously age-adjusted measure of patient condition for hospitalized children using the electronic medical record. J Biomed Inform. 2017;66 (Supplement C):180-193. doi: 10.1016/j.jbi.2016.12.013. PubMed
3. Akre M, Finkelstein M, Erickson M, Liu M, Vanderbilt L, Billman G. Sensitivity of the pediatric early warning score to identify patient deterioration. Pediatrics. 2010;125(4):e763-e769. doi: 10.1542/peds.2009-0338. PubMed
4. Seiger N, Maconochie I, Oostenbrink R, Moll HA. Validity of different pediatric early warning scores in the emergency department. Pediatrics. 2013;132(4):e841-e850. doi: 10.1542/peds.2012-3594. PubMed
5. Parshuram CS, Hutchison J, Middaugh K. Development and initial validation of the Bedside Paediatric Early Warning System score. Crit Care Lond Engl. 2009;13(4):R135. doi: 10.1186/cc7998. PubMed
6. Hollis RH, Graham LA, Lazenby JP, et al. A role for the early warning score in early identification of critical postoperative complications. Ann Surg. 2016;263(5):918-923. doi: 10.1097/SLA.0000000000001514. PubMed
7. Bonafide CP, Roberts KE, Priestley MA, et al. Development of a pragmatic measure for evaluating and optimizing rapid response systems. Pediatrics. 2012;129(4):e874-e881. doi: 10.1542/peds.2011-2784. PubMed
8. Rothman MJ, Rothman SI, Beals J. Development and validation of a continuous measure of patient condition using the electronic medical record. J Biomed Inform. 2013;46(5):837-848. doi: 10.1016/j.jbi.2013.06.011. PubMed
9. Harris PA, Taylor R, Thielke R, Payne J, Gonzalez N, Conde JG. Research Electronic Data Capture (REDCap) - A metadata-driven methodology and workflow process for providing translational research informatics support. J Biomed Inform. 2009;42(2):377-381. doi: 10.1016/j.jbi.2008.08.010. PubMed
10. Parshuram CS, Dryden-Palmer K, Farrell C, et al. Effect of a pediatric early warning system on all-cause mortality in hospitalized pediatric patients: the EPOCH randomized clinical trial. JAMA. 2018;319(10):1002-1012. doi: 10.1001/jama.2018.0948. PubMed
11. Bonafide CP, Localio AR, Roberts KE, Nadkarni VM, Weirich CM, Keren R. Impact of rapid response system implementation on critical deterioration events in children. JAMA Pediatr. 2014;168(1):25-33. doi: 10.1001/jamapediatrics.2013.3266. PubMed
12. Romero-Brufau S, Huddleston JM, Escobar GJ, Liebow M. Why the C-statistic is not informative to evaluate early warning scores and what metrics to use. Crit Care. 2015;19:285. doi: 10.1186/s13054-015-0999-1. PubMed
13. Bonafide CP, Roberts KE, Weirich CM, et al. Beyond statistical prediction: qualitative evaluation of the mechanisms by which pediatric early warning scores impact patient safety. J Hosp Med. 2013;8(5):248-253. doi: 10.1002/jhm.2026. PubMed
Patients at risk for clinical deterioration in the inpatient setting may not be identified efficiently or effectively by health care providers. Early warning systems that link clinical observations to rapid response mechanisms (such as medical emergency teams) have the potential to improve outcomes, but rigorous studies are lacking.1 The pediatric Rothman Index (pRI) is an automated early warning system sold by the company PeraHealth that is integrated with the electronic health record. The system incorporates vital signs, labs, and nursing assessments from existing electronic health record data to provide a single numeric score that generates alerts based on low absolute scores and acute decreases in score (low scores indicate high mortality risk).2 Automated alerts or rules based on the pRI score are meant to bring important changes in clinical status to the attention of clinicians.
Adverse outcomes (eg, unplanned intensive care unit [ICU] transfers and mortality) are associated with low pRI scores, and scores appear to decline prior to such events.2 However, the limitation of this and other studies evaluating the sensitivity of early warning systems3-6 is that the generated alerts are assigned “true positive” status if they precede clinical deterioration, regardless of whether or not they provide meaningful information to the clinicians caring for the patients. There are two potential critiques of this approach. First, the alert may have preceded a deterioration event but may not have been clinically relevant (eg, an alert triggered by a finding unrelated to the patient’s acute health status, such as a scar that was newly documented as an abnormal skin finding and as a result led to a worsening in the pRI). Second, even if the preceding alert demonstrated clinical relevance to a deterioration event, the clinicians at the bedside may have been aware of the patient’s deterioration for hours and have already escalated care. In this situation, the alert would simply confirm what the clinician already knew.
To better understand the relationship between early warning system acuity alerts and clinical practice, we examined a cohort of hospitalized patients who experienced a critical deterioration event (CDE)7 and who would have triggered a preceding pRI alert. We evaluated the clinical relationship of the alert to the CDE (ie, whether the alert reflected physiologic changes related to a CDE or was instead an artifact of documentation) and identified whether the alert would have preceded evidence that clinicians recognized deterioration or escalated care.
METHODS
Patients and Setting
This retrospective cross-sectional study was performed at Children’s Hospital of Philadelphia (CHOP), a freestanding children’s hospital with 546 beds. Eligible patients were hospitalized on nonintensive care, noncardiology, surgical wards between January 1, 2013, and December 31, 2013. The CHOP Institutional Review Board (IRB) approved the study with waivers of consent and assent. A HIPAA Business Associate Agreement and an IRB Reliance Agreement were in place with PeraHealth to permit data transfer.
Definition of Critical Deterioration Events
Critical deterioration events (CDEs) were defined according to an existing, validated measure7 as unplanned transfers to the ICU with continuous or bilevel positive airway pressure, tracheal intubation, and/or vasopressor infusion in the 12 hours after transfer. At CHOP, all unplanned ICU transfers are routed through the hospital’s rapid response or code blue teams, so these patients were identified using an existing database managed by the CHOP Resuscitation Committee. In the database, the elements of CDEs are entered as part of ongoing quality improvement activities. The time of CDE was defined as the time of the rapid response call precipitating unplanned transfer to the ICU.
The Pediatric Rothman Index
The pRI is an automated acuity score that has been validated in hospitalized pediatric patients.2 The pRI is calculated using existing variables from the electronic health record, including manually entered vital signs, laboratory values, cardiac rhythm, and nursing assessments of organ systems. The weights assigned to continuous variables are a function of deviation from the norm.2,8 (See Supplement 1 for a complete list of variables.)
The pRI is integrated with the electronic health record and automatically generates a score each time a new data observation becomes available. Changes in score over time and low absolute scores generate a graduated series of alerts ranging from medium to very high acuity. This analysis used PeraHealth’s standard pRI alerts. Medium acuity alerts occurred when the pRI score decreased by ≥30% in 24 hours. A high acuity alert occurred when the pRI score decreased by ≥40% in 6 hours. A very high acuity alert occurred when the pRI absolute score was ≤ 30.
Development of the Source Dataset
In 2014, CHOP shared one year of clinical data with PeraHealth as part of the process of deciding whether or not to implement the pRI. The pRI algorithm retrospectively generated scores and acuity alerts for all CHOP patients who experienced CDEs between January 1, 2013, and December 31, 2013. The pRI algorithm was not active in the hospital environment during this time period; the scores and acuity alerts were not visible to clinicians. This dataset was provided to the investigators at CHOP to conduct this project.
Data Collection
Pediatric intensive care nurses trained in clinical research data abstraction from the CHOP Critical Care Center for Evidence and Outcomes performed the chart review for this study. Chart abstraction comparisons were completed on the first 15 charts to ensure interrater reliability, and additional quality assurance checks were performed on intermittent charts to ensure consistency and definition adherence. We managed all data using Research Electronic Data Capture.9
To study the value of alerts labeled as “true positives,” we restricted the dataset to CDEs in which acuity alert(s) within the prior 72 hours would have been triggered if the pRI had been in clinical use at the time.
To identify the clinical relationship between pRI and CDE, we reviewed each chart with the goal of determining whether the preceding acuity alerts were clinically associated with the etiology of the CDE. We determined the etiology of the CDE by reviewing the cause(s) identified in the note written by rapid response or code blue team responders or by the admitting clinical team after transfer to the ICU. We then used a tool provided by PeraHealth to identify the specific score components that led to worsening pRI. If the score components that worsened were (a) consistent with a clinical change as opposed to a documentation artifact and (b) an organ system change that was plausibly related to the CDE etiology, we concluded that the alert was clinically related to the etiology of the CDE.
We defined documentation artifacts as instances in nursing documentation in which a finding unrelated to the patient’s acute health status, such as a scar, was newly documented as abnormal and led to worsening pRI. Any cases in which the clinical relevance was unclear underwent review by additional members of the team
To determine the temporal relationship among pRI, CDE, and clinician awareness or action, we then sought to systematically determine whether the preceding acuity alerts preceded documented evidence of clinicians recognizing deterioration or escalation of care. We made the a priori decision that acuity alerts that occurred more than 24 hours prior to a deterioration event had questionable clinical actionability. Therefore, we restricted this next analysis to CDEs with acuity alerts during the 24 hours prior to a CDE. We reviewed time-stamped progress notes written by clinicians in the 24 hours period prior to the time of the CDE and identified whether the notes reflected an adverse change in patient status or a clinical intervention. We then compared the times of these notes with the times of the alerts and CDEs. Given that documentation of change in clinical status often occurs after clinical intervention, we also reviewed new orders placed in the 24 hours prior to each CDE to determine escalation of care. We identified the following orders as reflective of escalation of care independent of specific disease process: administration of intravenous fluid bolus, blood product, steroid, or antibiotic, increased respiratory support, new imaging studies, and new laboratory studies. We then compared the time of each order with the time of the alert and CDE.
RESULTS
During the study period, 73 events met the CDE criteria and had a pRI alert during admission. Of the 73 events, 50 would have triggered at least one pRI alert in the 72-hour period leading up to the CDE (sensitivity 68%). Of the 50 events, 39 generated pRI alerts in the 24 hours leading up to the event, and 11 others generated pRI alerts between 24 and 72 hours prior to the event but did not generate any alerts during the 24 hours leading up to the event (Figure).
Patient Characteristics
The 50 CDEs labeled as true positives occurred in 46 unique patients. Table 1 displays the event characteristics.
Acuity Alerts
A total of 79 pRI alerts preceded the 50 CDEs. Of these acuity alerts, 44 (56%) were medium acuity alerts, 17 (22%) were high acuity alerts, and 18 (23%) were very high acuity alerts. Of the 50 CDEs that would have triggered pRI alerts, 33 (66%) would have triggered a single acuity alert and 17 (34%) would have triggered multiple acuity alerts.
Of the 50 CDEs, 39 (78%) had a preceding acuity alert within 24 hours prior to the CDE. In these cases, the alert preceded the CDE by a median of 3.1 hours (interquartile range of 0.7 to 10.3 hours).
We assessed the score components that caused each alert to trigger. All of the vital sign and laboratory components were assessed as clinically related to the CDE’s etiology. By contrast, about half of nursing assessment components were assessed as clinically related to the etiology of the CDE (Table 2). Abnormal cardiac, respiratory, and neurologic assessments were most frequently assessed as clinically relevant.
Escalation Orders
To determine whether the pRI alert would have preceded the earliest documented treatment efforts, we restricted evaluation to the 39 CDEs that had at least one alert in the 24-hour window prior to the CDE. When we reviewed escalation orders placed by clinicians, we found that in 26 cases (67%), the first clinician order reflecting escalation of care would have preceded the first pRI alert within the 24-hour period prior to the CDE. In 13 cases (33%), the first pRI alert would have preceded the first escalation order placed by the clinician. The first pRI alert and the first escalation order would have occurred within the same 1-hour period in 6 of these cases.
Provider Notes
Temporal Relationships
In Supplement 2, we present the proportion of CDEs in which the order or note preceded the pRI alert for each abnormal organ system.
The Figure shows the temporal relationships among escalation orders, clinician notes, and acuity alerts for the 39 CDEs with one or more alerts in the 24 hours leading up to the event. In 21 cases (54%), both an escalation order and a note preceded the first acuity alert. In 14 cases (36%), either an escalation order or a note preceded the first acuity alert. In four cases (10%), the alert preceded any documented evidence that clinicians had recognized deterioration or escalating care.
DISCUSSION
The main finding of this study is that 90% of CDE events that generated “true positive” pRI alerts had evidence suggesting that clinicians had already recognized deterioration and/or were already escalating care before most pRI alerts would have been triggered.
The impacts of early warning scores on patient safety outcomes are not well established. In a recent 21-hospital cluster randomized trial of the BedsidePEWS, a pediatric early warning score system, investigators found that implementing the system does not significantly decrease all-cause mortality in hospitalized children, although hospitals using the BedsidePEWS have low rates of significant CDEs.10 In other studies, early warning scores were often coimplemented with rapid response teams, and separating the incremental benefit of the scoring tool from the availability of a rapid response team is usually not possible.11
Therefore, the benefits of early warning scores are often inferred based on their test characteristics (eg, sensitivity and positive predictive value).12 Sensitivity, which is the proportion of patients who deteriorated and also triggered the early warning score within a reasonable time window preceding the event, is an important consideration when deciding whether an early warning score is worth implementing. A challenging follow-up question that goes beyond sensitivity is how often an early warning score adds new knowledge by identifying patients on a path toward deterioration who were not yet recognized. This study is the first to address that follow-up question. Our results revealed that the score appeared to precede evidence of clinician recognition of deterioration in 10% of CDEs. In some patients, the alert could have contributed to a detection of deterioration that was not previously evident. In the portion of CDEs in which the alert and escalation order or note occurred within the same one-hour window, the alert could have been used as confirmation of clinical suspicion. Notably, we did not evaluate the 16 cases in which a CDE preceded any pRI alert because we chose to focus on “true positive” cases in which pRI alerts preceded CDEs. These events could have had timely recognition by clinicians that we did not capture, so these results may provide an overestimation of CDEs in which the pRI preceded clinician recognition.
Prior work has described a range of mechanisms by which early warning scores can impact patient safety.13 The results of this study suggest limited incremental benefit for the pRI to alert physicians and nurses to new concerning changes at this hospital, although the benefits to low-resourced community hospitals that care for children may be great. The pRI score may also serve as evidence that empowers nurses to overcome barriers to further escalate care, even if the process of escalation has already begun. In addition to empowering nurses, the score may support trainees and clinicians with varying levels of pediatric expertise in the decision to escalate care. Evaluating these potential benefits would require prospective study.
We used the pRI alerts as they were already defined by PeraHealth for CHOP, and different alert thresholds may change score performance. Our study did not identify additional variables to improve score performance, but they can be investigated in future research.
This study had several limitations. First, this work is a single-center study with highly skilled pediatric providers, a mature rapid response system, and low rates of cardiopulmonary arrest outside ICUs. Therefore, the results that we obtained were not immediately generalizable. In a community environment with nurses and physicians who are less experienced in caring for ill children, an early warning score with high sensitivity may be beneficial in ensuring patient safety.
Second, by using escalation orders and notes from the patient chart, we did not capture all the undocumented ways in which clinicians demonstrate awareness of deterioration. For example, a resident may alert the attending on service or a team may informally request consultation with a specialist. We also gave equal weight to escalation orders and clinician notes as evidence of recognition of deterioration. It could be that either orders or notes more closely correlated with clinician awareness.
Finally, the data were from 2013. Although the score components have not changed, efforts to standardize nursing assessments may have altered the performance of the score in the intervening years.
CONCLUSIONS
In most patients who had a CDE at a large freestanding children’s hospital, escalation orders or documented changes in patient status would have occurred before a pRI alert. However, in a minority of patients, the alert could have contributed to the detection of deterioration that was not previously evident.
Disclosures
The authors have nothing to disclose
Funding
The study was supported by funds from the Department of Biomedical and Health Informatics at Children’s Hospital of Philadelphia. PeraHealth, the company that sells the Rothman Index software, provided a service to the investigators but no funding. They applied their proprietary scoring algorithm to the data from Children’s Hospital of Philadelphia to generate alerts retrospectively. This service was provided free of charge in 2014 during the time period when Children’s Hospital of Philadelphia was considering purchasing and implementing PeraHealth software, which it subsequently did. We did not receive any funding for the study from PeraHealth. PeraHealth personnel did not influence the study design, the interpretation of data, the writing of the report, or the decision to submit the article for publication.
1. Alam N, Hobbelink EL, van Tienhoven AJ, van de Ven PM, Jansma EP, Nanayakkara PWB. The impact of the use of the Early Warning Score (EWS) on patient outcomes: a systematic review. Resuscitation. 2014;85(5):587-594. doi: 10.1016/j.resuscitation.2014.01.013. PubMed
2. Rothman MJ, Tepas JJ, Nowalk AJ, et al. Development and validation of a continuously age-adjusted measure of patient condition for hospitalized children using the electronic medical record. J Biomed Inform. 2017;66 (Supplement C):180-193. doi: 10.1016/j.jbi.2016.12.013. PubMed
3. Akre M, Finkelstein M, Erickson M, Liu M, Vanderbilt L, Billman G. Sensitivity of the pediatric early warning score to identify patient deterioration. Pediatrics. 2010;125(4):e763-e769. doi: 10.1542/peds.2009-0338. PubMed
4. Seiger N, Maconochie I, Oostenbrink R, Moll HA. Validity of different pediatric early warning scores in the emergency department. Pediatrics. 2013;132(4):e841-e850. doi: 10.1542/peds.2012-3594. PubMed
5. Parshuram CS, Hutchison J, Middaugh K. Development and initial validation of the Bedside Paediatric Early Warning System score. Crit Care Lond Engl. 2009;13(4):R135. doi: 10.1186/cc7998. PubMed
6. Hollis RH, Graham LA, Lazenby JP, et al. A role for the early warning score in early identification of critical postoperative complications. Ann Surg. 2016;263(5):918-923. doi: 10.1097/SLA.0000000000001514. PubMed
7. Bonafide CP, Roberts KE, Priestley MA, et al. Development of a pragmatic measure for evaluating and optimizing rapid response systems. Pediatrics. 2012;129(4):e874-e881. doi: 10.1542/peds.2011-2784. PubMed
8. Rothman MJ, Rothman SI, Beals J. Development and validation of a continuous measure of patient condition using the electronic medical record. J Biomed Inform. 2013;46(5):837-848. doi: 10.1016/j.jbi.2013.06.011. PubMed
9. Harris PA, Taylor R, Thielke R, Payne J, Gonzalez N, Conde JG. Research Electronic Data Capture (REDCap) - A metadata-driven methodology and workflow process for providing translational research informatics support. J Biomed Inform. 2009;42(2):377-381. doi: 10.1016/j.jbi.2008.08.010. PubMed
10. Parshuram CS, Dryden-Palmer K, Farrell C, et al. Effect of a pediatric early warning system on all-cause mortality in hospitalized pediatric patients: the EPOCH randomized clinical trial. JAMA. 2018;319(10):1002-1012. doi: 10.1001/jama.2018.0948. PubMed
11. Bonafide CP, Localio AR, Roberts KE, Nadkarni VM, Weirich CM, Keren R. Impact of rapid response system implementation on critical deterioration events in children. JAMA Pediatr. 2014;168(1):25-33. doi: 10.1001/jamapediatrics.2013.3266. PubMed
12. Romero-Brufau S, Huddleston JM, Escobar GJ, Liebow M. Why the C-statistic is not informative to evaluate early warning scores and what metrics to use. Crit Care. 2015;19:285. doi: 10.1186/s13054-015-0999-1. PubMed
13. Bonafide CP, Roberts KE, Weirich CM, et al. Beyond statistical prediction: qualitative evaluation of the mechanisms by which pediatric early warning scores impact patient safety. J Hosp Med. 2013;8(5):248-253. doi: 10.1002/jhm.2026. PubMed
© 2018 Society of Hospital Medicine.
Assess Before Rx: Reducing the Overtreatment of Asymptomatic Blood Pressure Elevation in the Inpatient Setting
With the presence of hypertension in 25% of patients admitted to the hospital,1 its proper management is imperative. A hypertensive crisis is a severe elevation of blood pressure, defined as systolic ≥180 mm Hg and/or diastolic ≥120 mm Hg. It is further classified as either a hypertensive emergency which includes the presence of end-organ damage,2 or hypertensive urgency, defined as asymptomatic blood pressure elevation.3 Although hypertensive emergencies account for only 1%-2% of patients with hypertension,4 they are associated with a high one-year mortality rate (>79%).5 Hypertensive emergency requires immediate reduction of blood pressure with IV antihypertensive drugs to limit organ damage. In contrast, as per national guidelines, inpatient management of hypertensive urgency requires gradual reductions of blood pressure over hours to days using oral antihypertensives.2 It is also recommended that alternative etiologies, such as anxiety or pain, be considered before treatment is initiated.1
Clinicians often inappropriately treat asymptomatic hypertension in the inpatient setting,6,7 using intravenous (IV) antihypertensive medications despite evidence showing potential harm.5,8 This can lead to unpredictable reductions in blood pressure.7,9 A recent retrospective analysis demonstrated that 32.6% of patients had a blood pressure reduction greater than 25% after the use of an IV antihypertensive.7 Reductions greater than 25% lead to shifts in autoregulation, which may result in patient harm, such as hypotension, decreased renal perfusion, and stroke.9 IV medications are also more expensive than oral agents, due to the additional cost of administration.
Although overtreatment of asymptomatic hypertension with IV antihypertensive medications is common,7 initiatives to address this in inpatient settings are lacking in the literature. The aim of this quality improvement initiative was to reduce unnecessary IV antihypertensive treatment for hypertensive urgency in the inpatient setting.
METHODS
Setting
An interdisciplinary quality improvement intervention was initiated on two inpatient medicine units at an urban, 1,134-bed tertiary medical center affiliated with the Icahn School of Medicine at Mount Sinai. Members of the Mount Sinai High Value Care Committee and the Student High Value Care Initiative10 developed this project. The intervention was implemented in stages from March 2017 to February 2018. It targeted nurses, housestaff, nurse practitioners, and attendings on general medical teaching and nonteaching services. The components of the intervention included education, a treatment algorithm, audit and feedback, and electronic medical record (EMR) change. This project was submitted to the Quality Committee in the Department of Medicine and determined to be a quality improvement project rather than research and thus, an IRB submission was not required.
Treatment Algorithm and Education
A clinical algorithm was designed with nursing and cardiology representatives to provide guidance for nurses regarding the best practice for evaluation of inpatient hypertension, focusing on assessing patients before recommending treatment (“Assess Before Rx”; Figure 1). Educational sessions reinforcing the clinical algorithm were held monthly at nursing huddles. These involved an introduction session providing the background and purpose of the project, with follow-up sessions including interactive mock cases on the assessment of hypertensive urgency.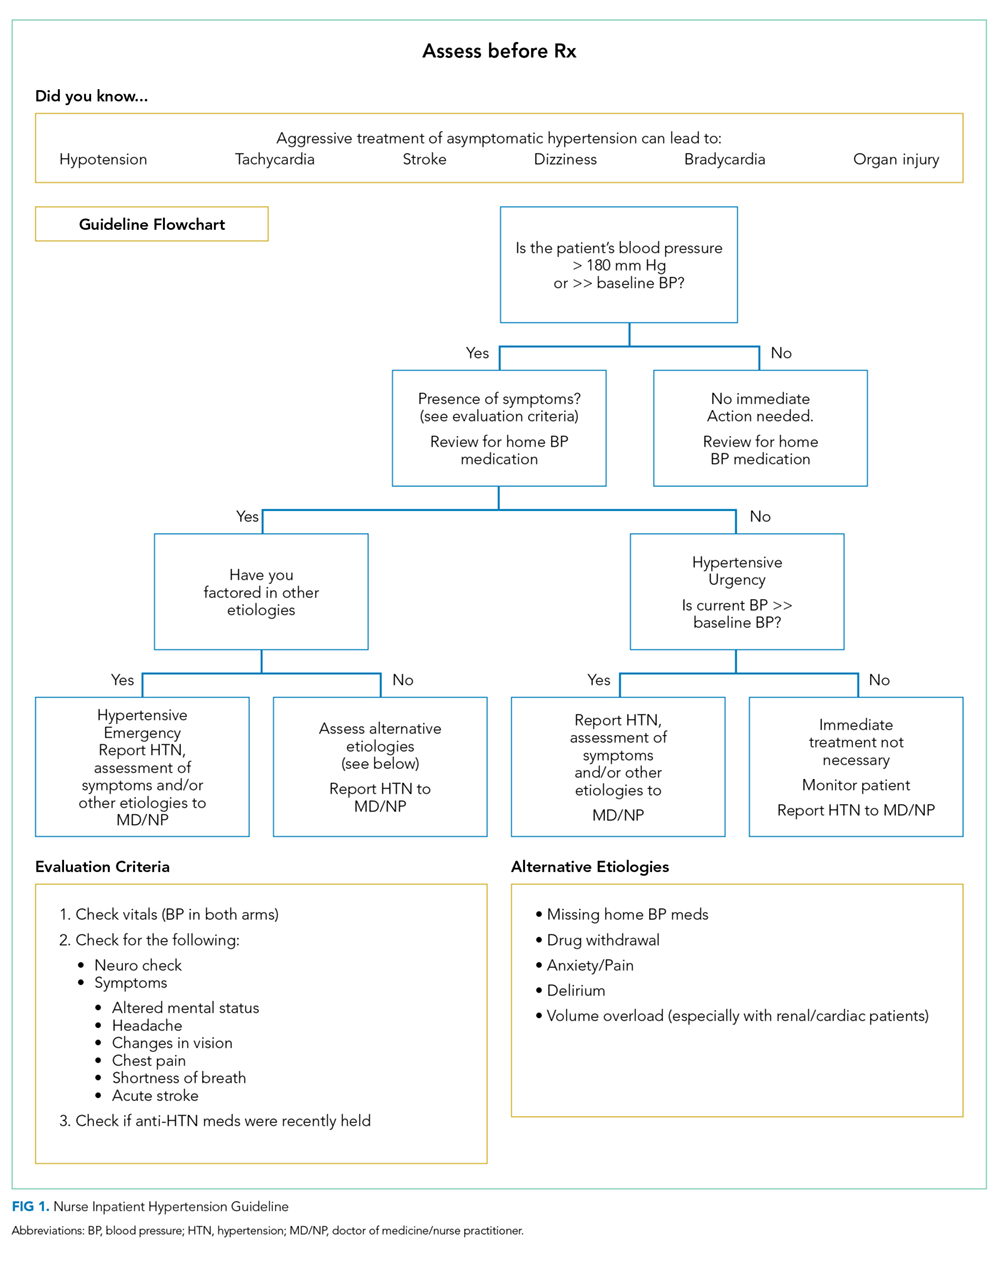
A second treatment algorithm was designed, with housestaff and cardiology input, to provide guidance for the internal medicine housestaff and nurse practitioners. It utilized a similar approach regarding identification, evaluation, and assessment of alternate etiologies but included more detailed treatment recommendations with a table outlining the oral medications used for hypertensive urgency (Figure 2). The flowchart and table were uploaded to an existing mobile application used by housestaff and nurse practitioners for quick access. The mobile application is frequently used by housestaff and contains many clinical resources. Additionally, e-mails including the purpose of the project and the treatment algorithm were sent to rotating housestaff at the start of each new medicine rotation.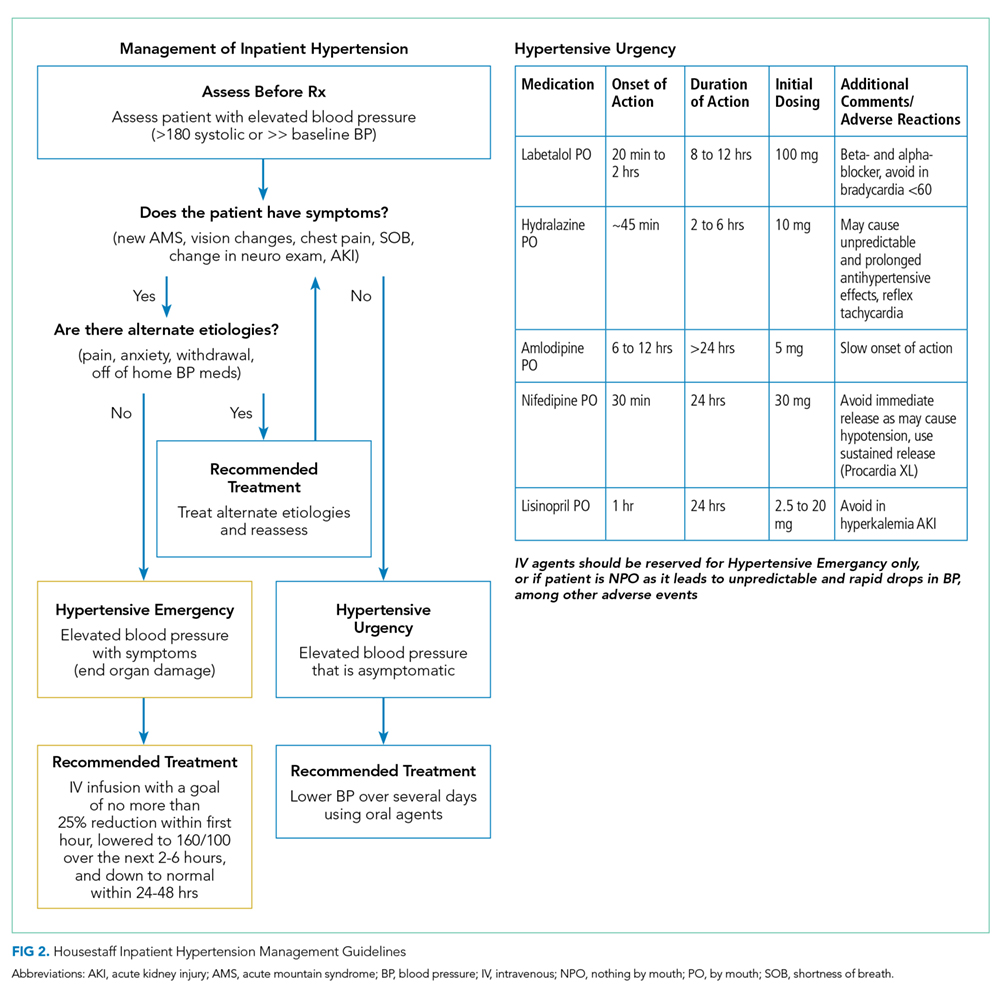
Audit and Feedback
Monthly feedback was e-mailed to the nurses, which reinforced the goals and provided positive feedback on outcomes with an announcement of the “Nurse of the Month.” The winners were selected based on the most accurate and appropriate documentation of their assessments determined through retrospective chart review.
Targeted e-mail feedback was also sent to providers who ordered IV antihypertensives without the appropriate indication. The e-mails included the medical record number, date and time of the order, any alternate etiologies that were documented, and any adverse events that occurred as a result of the medication.
Systems Change: Electronic Medical Record Orders
EMR advisory warnings were placed on IV antihypertensive orders of labetalol and hydralazine. The alerts served to nonintrusively remind providers to assess for symptoms before placing the order to ensure that the order was appropriate.
Data Collection and Assessment
Seven-month preintervention (January-July 2016) and 12-month postintervention (March 2017-February 2018) data were compared. The months prior to intervention were excluded to account for project development and educational lag. Data were obtained from EMR utilization reports of one-time orders of IV labetalol and hydralazine, and retrospective chart review. Patients who were pregnant, less than 18 years of age, or postoperative were excluded. Orders were designated as inappropriate if there was no evidence of hypertensive emergency through documentation in progress notes, or if the patient was able to take oral medication (not NPO). Adverse events were defined as a blood pressure drop of more than 25%, a change in the heart rate by more than 20 beats per minute, or the need for IV fluids, based on previous studies.7 Although decreased blood pressure is not necessarily dangerous in and of itself, adverse events arising from blood pressure decreasing too rapidly from IV antihypertensives are well documented.9,11 The presence of alternate etiologies of high blood pressure that were documented in progress notes, including pain, anxiety, agitation, and holding of home blood pressure medications, were recorded. The numbers of inappropriate orders pre- and postintervention were compared. Confounding factors of patient age and length of stay (LOS) were compared pre- and postintervention in order to rule out other factors to which the intervention’s effect could be attributed.
For this study, orders were reported on the standardized form of orders per 1,000 patient days. This was calculated as the number of orders divided by the total number of patient days from the two medicine units. For the univariate analysis, pre- and postintervention orders were compared for the different order categories using a t-test. Results were considered statistically significant at P < .05. Data analysis was conducted using SAS v. 9.4 (SAS Institute, Cary, North Carolina).
Additionally, a cost analysis was performed to estimate the hospital-wide annual cost of inappropriate orders. The analysis used the cost per dose12 and included nurse-time derived from the median salary of those on our units. The hospital-wide cost was extrapolated to estimate the potential annual savings for the institution.
RESULTS
A total of 260 one-time orders of IV antihypertensives were analyzed in this study, 127 in the seven-month preintervention period and 133 in the 12-month postintervention period. The majority, 67.3% (n = 175), were labetalol orders. Inappropriate orders (ie, neither NPO nor hypertensive emergency) decreased from 8.3 to 3.3 orders per 1,000 patient days (P = .0099; Figure 3).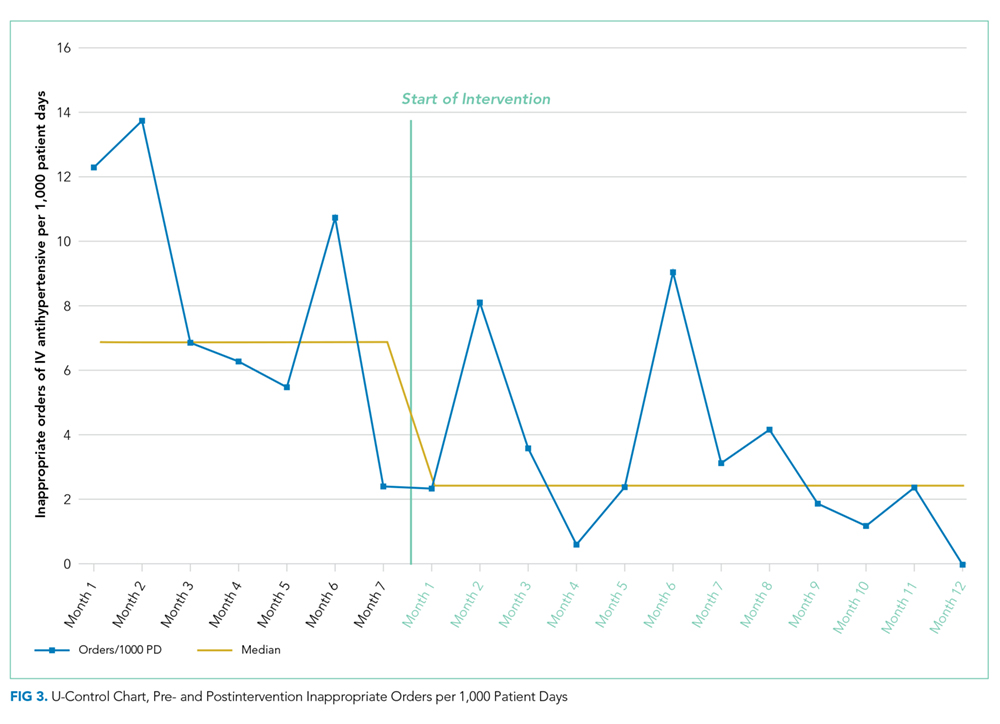
In total, there were 86 adverse events (33.1%), the majority of which (94.2%, n = 81) were a >25% decrease in blood pressure (Table 1). The number of adverse events per 1,000 patient days decreased from 4.4 in the preintervention period to 1.9 postintervention, P = .0112. Of the inappropriate orders, adverse events decreased from 3.7 to 0.8 per 1,000 patient days, P = .0072. Overall, there were 76 orders (29.2%) with documented alternate etiologies. The number of orders per 1,000 patient days with an alternate etiology decreased from 4.7 in the preintervention period to 1.2 postintervention, P =.0044 (Table 2). Descriptive analysis of patient characteristics pre-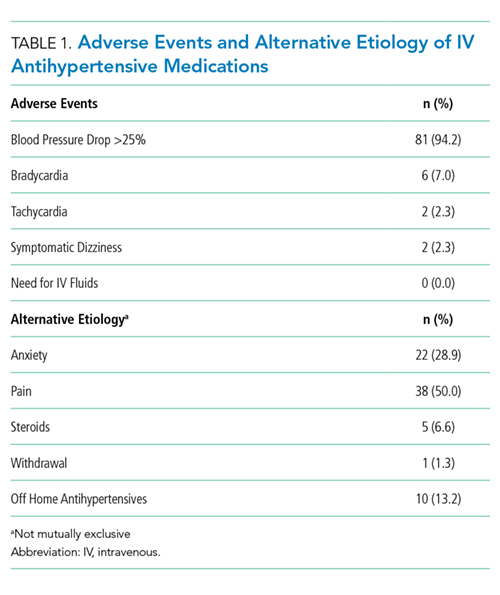
Cost analysis estimated a $17,890 annual hospital-wide cost for unnecessary IV antihypertensive medications before the intervention. The estimate was calculated using the number of orders on the two medical units observed during the seven-month preintervention period, extrapolated to a 12-month period and to the total number of 15 medical units in the hospital. The intervention on the two studied medical units themselves led to an estimated $1,421 cost reduction (59.6%). Had the intervention been implemented hospital-wide with similar results, the resulting cost reduction would have amounted to $10,662.
DISCUSSION
Our initiative successfully demonstrated a significant reduction of 60% in inappropriate one-time orders of IV antihypertensives per 1,000 patient days. Accordingly, the number of adverse events per 1,000 patient days decreased by 57%. There was also a decrease in the number and percentage of IV orders with documented alternate etiologies. We hypothesize that this was due to nurses and physicians assessing and treating these conditions prior to treating hypertension in the intervention period, consequently avoiding an IV order.
The goal of the intervention was to have nurses assess for end-organ damage and alternate etiologies and include this information on their assessment provided to the physician, which would result in appropriate treatment of elevated blood pressure. By performing an interdisciplinary intervention, we addressed the knowledge deficit of both nurses and physicians, improved the triage of elevated blood pressure, and likely decreased the number of pages to providers.
To our knowledge, this is the first intervention addressing the inpatient overuse of IV antihypertensive medications for the treatment of asymptomatic hypertension. Additionally, this study bolsters prior evidence that the use of IV antihypertensives in asymptomatic patients leads to a large number of adverse events.7 A third of patients in the preintervention period had documented alternate etiologies of their blood pressure elevation, highlighting the need to assess and potentially treat these causes prior to treating blood pressure itself.
Reducing unnecessary treatment of asymptomatic blood pressure elevation is challenging. Evidence shows that both clinicians and patients overestimate the benefits and underestimate the harms of medical interventions.13,14 This unfortunately leads to unjustified enthusiasm for medical treatments, which can worsen outcomes.15 Additionally, there may be a lack of knowledge of the guidelines, as well as the amount of time required in the full assessment of hypertensive urgency, that creates a culture of “treating the number.”
Changing physician behavior is difficult.16 However, active forms of continuing education and multifaceted interventions, such as ours, are most effective.17 Our message focused on patient safety and harm reduction, addressed clinicians’ safety concerns, and included stories of real cases where this overuse led to adverse events—all of which are encouraged in order to facilitate clinician engagement.18
There were limitations to this study. Only blood pressure elevations associated with an IV antihypertensive order and not all blood pressure elevations meeting the criteria for hypertensive urgency in general were examined. Additionally, our documentation of symptoms of hypertensive emergency and alternate etiologies was based only on documentation in the medical record. Ideally, we would have liked to conduct an interrupted time series analysis to assess the effect of the intervention over time; however, there were not enough orders of IV antihypertensives to perform such an analysis.
CONCLUSION
Treatment of asymptomatic blood pressure with IV antihypertensive medications can lead to patient harm. To reduce inappropriate treatment, our Student High Value Care team set out to challenge this common practice. Our interdisciplinary intervention successfully reduced unnecessary IV antihypertensive treatment. This may serve as a model for other institutions.
Disclosures
There are no relevant conflicts of interest to disclose for any authors.
1. Herzog E, Frankenberger O, Aziz E, et al. A novel pathway for the management of hypertension for hospitalized patients. Crit Pathw Cardiol. 2007;6(4):150-160. doi: 10.1097/HPC.0b013e318160c3a7. PubMed
2. Whelton PK, Carey RM, Aronow WS, et al. 2017 ACC/AHA/AAPA/ABC/ACPM/AGS/APhA/ASH/ASPC/NMA/PCNA guideline for the prevention, detection, evaluation, and management of high blood pressure in adults: a report of the American College of Cardiology/American Heart Association Task Force on clinical practice guidelines. Hypertension. 2018;71(6):e13-e115. doi: 10.1161/HYP.0000000000000065. PubMed
3. Mancia G, Fagard R, Narkiewicz K, et al. 2013 ESH/ESC guidelines for the management of arterial hypertension: the Task Force for the Management of Arterial Hypertension of the European Society of Hypertension (ESH) and of the European Society of Cardiology (ESC). Eur Heart J. 2013;34(28):2159-2219. doi: 10.1093/eurheartj/eht151. PubMed
4. Global status report on noncommunicable diseases 2010. Geneva, Switzerland: World Health Organization; 2011. 3.
5. Weder AB, Erickson S. Treatment of hypertension in the inpatient setting: use of intravenous labetalol and hydralazine. J Clin Hypertens (Greenwich). 2010;12(1):29-33. doi: 10.1111/j.1751-7176.2009.00196.x. PubMed
6. James PA, Oparil S, Carter BL, et al. 2014 evidence-based guideline for the management of high blood pressure in adults: report from the panel members appointed to the Eighth Joint National Committee (JNC 8). JAMA. 2014;311(5):507-520. doi: 10.1001/jama.2013.284427. PubMed
7. Lipari M, Moser LR, Petrovitch EA, Farber M, Flack JM. As-needed intravenous antihypertensive therapy and blood pressure control. J Hosp Med. 2016;11(3):193-198. doi: 10.1002/jhm.2510. PubMed
8. Patel KK, Young L, Howell EH, et al. Characteristics and outcomes of patients presenting with hypertensive urgency in the office setting. JAMA Intern Med. 2016;176(7):981-988. doi: 10.1001/jamainternmed.2016.1509. PubMed
9. Ipek E, Oktay AA, Krim SR. Hypertensive crisis: an update on clinical approach and management. Curr Opin Cardiol. 2017;32(4):397-406. doi: 10.1097/HCO.0000000000000398. PubMed
10. Cho HC, Dunn A, Di Capua J, Lee IT, Makhni S, Korenstein DR. Student high value care committee: a model for student-led implementation [abstract 286]. J Hosp Med. 2017. PubMed
11. Yang JY, Chiu S, Krouss M. Overtreatment of asymptomatic hypertension-urgency is not an emergency: a teachable moment. JAMA Intern Med. 2018;178(5):704-705. doi: 10.1001/jamainternmed.2018.0126. PubMed
12. Malesker MA, Hilleman DE. Intravenous labetalol compared with intravenous nicardipine in the management of hypertension in critically ill patients. J Crit Care. 2012;27(5):528 e527-514. doi: 10.1016/j.jcrc.2011.12.005. PubMed
13. Hoffmann TC, Del Mar C. Clinicians’ expectations of the benefits and harms of treatments, screening, and tests: a systematic review. JAMA Intern Med. 2017;177(3):407-419. doi: 10.1001/jamainternmed.2016.8254. PubMed
14. Hoffmann TC, Del Mar C. Patients’ expectations of the benefits and harms of treatments, screening, and tests: a systematic review. JAMA Intern Med. 2015;175(2):274-286. doi: 10.1001/jamainternmed.2014.6016. PubMed
15. Casarett D. The science of choosing wisely--overcoming the therapeutic illusion. N Engl J Med. 2016;374(13):1203-1205. doi: 10.1056/NEJMp1516803. PubMed
16. Wilensky G. Changing physician behavior is harder than we thought. JAMA. 2016;316(1):21-22. doi: 10.1001/jama.2016.8019. PubMed
17. Mostofian F, Ruban C, Simunovic N, Bhandari M. Changing physician behavior: what works? Am J Manag Care. 2015;21(1):75-84.
18. Pasik S, Korenstein D, Israilov S, Cho HJ. Engagement in eliminating overuse: the argument for safety and beyond. J Patient Saf. 2018. doi: 10.1097/PTS.0000000000000487. PubMed
With the presence of hypertension in 25% of patients admitted to the hospital,1 its proper management is imperative. A hypertensive crisis is a severe elevation of blood pressure, defined as systolic ≥180 mm Hg and/or diastolic ≥120 mm Hg. It is further classified as either a hypertensive emergency which includes the presence of end-organ damage,2 or hypertensive urgency, defined as asymptomatic blood pressure elevation.3 Although hypertensive emergencies account for only 1%-2% of patients with hypertension,4 they are associated with a high one-year mortality rate (>79%).5 Hypertensive emergency requires immediate reduction of blood pressure with IV antihypertensive drugs to limit organ damage. In contrast, as per national guidelines, inpatient management of hypertensive urgency requires gradual reductions of blood pressure over hours to days using oral antihypertensives.2 It is also recommended that alternative etiologies, such as anxiety or pain, be considered before treatment is initiated.1
Clinicians often inappropriately treat asymptomatic hypertension in the inpatient setting,6,7 using intravenous (IV) antihypertensive medications despite evidence showing potential harm.5,8 This can lead to unpredictable reductions in blood pressure.7,9 A recent retrospective analysis demonstrated that 32.6% of patients had a blood pressure reduction greater than 25% after the use of an IV antihypertensive.7 Reductions greater than 25% lead to shifts in autoregulation, which may result in patient harm, such as hypotension, decreased renal perfusion, and stroke.9 IV medications are also more expensive than oral agents, due to the additional cost of administration.
Although overtreatment of asymptomatic hypertension with IV antihypertensive medications is common,7 initiatives to address this in inpatient settings are lacking in the literature. The aim of this quality improvement initiative was to reduce unnecessary IV antihypertensive treatment for hypertensive urgency in the inpatient setting.
METHODS
Setting
An interdisciplinary quality improvement intervention was initiated on two inpatient medicine units at an urban, 1,134-bed tertiary medical center affiliated with the Icahn School of Medicine at Mount Sinai. Members of the Mount Sinai High Value Care Committee and the Student High Value Care Initiative10 developed this project. The intervention was implemented in stages from March 2017 to February 2018. It targeted nurses, housestaff, nurse practitioners, and attendings on general medical teaching and nonteaching services. The components of the intervention included education, a treatment algorithm, audit and feedback, and electronic medical record (EMR) change. This project was submitted to the Quality Committee in the Department of Medicine and determined to be a quality improvement project rather than research and thus, an IRB submission was not required.
Treatment Algorithm and Education
A clinical algorithm was designed with nursing and cardiology representatives to provide guidance for nurses regarding the best practice for evaluation of inpatient hypertension, focusing on assessing patients before recommending treatment (“Assess Before Rx”; Figure 1). Educational sessions reinforcing the clinical algorithm were held monthly at nursing huddles. These involved an introduction session providing the background and purpose of the project, with follow-up sessions including interactive mock cases on the assessment of hypertensive urgency.
A second treatment algorithm was designed, with housestaff and cardiology input, to provide guidance for the internal medicine housestaff and nurse practitioners. It utilized a similar approach regarding identification, evaluation, and assessment of alternate etiologies but included more detailed treatment recommendations with a table outlining the oral medications used for hypertensive urgency (Figure 2). The flowchart and table were uploaded to an existing mobile application used by housestaff and nurse practitioners for quick access. The mobile application is frequently used by housestaff and contains many clinical resources. Additionally, e-mails including the purpose of the project and the treatment algorithm were sent to rotating housestaff at the start of each new medicine rotation.
Audit and Feedback
Monthly feedback was e-mailed to the nurses, which reinforced the goals and provided positive feedback on outcomes with an announcement of the “Nurse of the Month.” The winners were selected based on the most accurate and appropriate documentation of their assessments determined through retrospective chart review.
Targeted e-mail feedback was also sent to providers who ordered IV antihypertensives without the appropriate indication. The e-mails included the medical record number, date and time of the order, any alternate etiologies that were documented, and any adverse events that occurred as a result of the medication.
Systems Change: Electronic Medical Record Orders
EMR advisory warnings were placed on IV antihypertensive orders of labetalol and hydralazine. The alerts served to nonintrusively remind providers to assess for symptoms before placing the order to ensure that the order was appropriate.
Data Collection and Assessment
Seven-month preintervention (January-July 2016) and 12-month postintervention (March 2017-February 2018) data were compared. The months prior to intervention were excluded to account for project development and educational lag. Data were obtained from EMR utilization reports of one-time orders of IV labetalol and hydralazine, and retrospective chart review. Patients who were pregnant, less than 18 years of age, or postoperative were excluded. Orders were designated as inappropriate if there was no evidence of hypertensive emergency through documentation in progress notes, or if the patient was able to take oral medication (not NPO). Adverse events were defined as a blood pressure drop of more than 25%, a change in the heart rate by more than 20 beats per minute, or the need for IV fluids, based on previous studies.7 Although decreased blood pressure is not necessarily dangerous in and of itself, adverse events arising from blood pressure decreasing too rapidly from IV antihypertensives are well documented.9,11 The presence of alternate etiologies of high blood pressure that were documented in progress notes, including pain, anxiety, agitation, and holding of home blood pressure medications, were recorded. The numbers of inappropriate orders pre- and postintervention were compared. Confounding factors of patient age and length of stay (LOS) were compared pre- and postintervention in order to rule out other factors to which the intervention’s effect could be attributed.
For this study, orders were reported on the standardized form of orders per 1,000 patient days. This was calculated as the number of orders divided by the total number of patient days from the two medicine units. For the univariate analysis, pre- and postintervention orders were compared for the different order categories using a t-test. Results were considered statistically significant at P < .05. Data analysis was conducted using SAS v. 9.4 (SAS Institute, Cary, North Carolina).
Additionally, a cost analysis was performed to estimate the hospital-wide annual cost of inappropriate orders. The analysis used the cost per dose12 and included nurse-time derived from the median salary of those on our units. The hospital-wide cost was extrapolated to estimate the potential annual savings for the institution.
RESULTS
A total of 260 one-time orders of IV antihypertensives were analyzed in this study, 127 in the seven-month preintervention period and 133 in the 12-month postintervention period. The majority, 67.3% (n = 175), were labetalol orders. Inappropriate orders (ie, neither NPO nor hypertensive emergency) decreased from 8.3 to 3.3 orders per 1,000 patient days (P = .0099; Figure 3).
In total, there were 86 adverse events (33.1%), the majority of which (94.2%, n = 81) were a >25% decrease in blood pressure (Table 1). The number of adverse events per 1,000 patient days decreased from 4.4 in the preintervention period to 1.9 postintervention, P = .0112. Of the inappropriate orders, adverse events decreased from 3.7 to 0.8 per 1,000 patient days, P = .0072. Overall, there were 76 orders (29.2%) with documented alternate etiologies. The number of orders per 1,000 patient days with an alternate etiology decreased from 4.7 in the preintervention period to 1.2 postintervention, P =.0044 (Table 2). Descriptive analysis of patient characteristics pre-
Cost analysis estimated a $17,890 annual hospital-wide cost for unnecessary IV antihypertensive medications before the intervention. The estimate was calculated using the number of orders on the two medical units observed during the seven-month preintervention period, extrapolated to a 12-month period and to the total number of 15 medical units in the hospital. The intervention on the two studied medical units themselves led to an estimated $1,421 cost reduction (59.6%). Had the intervention been implemented hospital-wide with similar results, the resulting cost reduction would have amounted to $10,662.
DISCUSSION
Our initiative successfully demonstrated a significant reduction of 60% in inappropriate one-time orders of IV antihypertensives per 1,000 patient days. Accordingly, the number of adverse events per 1,000 patient days decreased by 57%. There was also a decrease in the number and percentage of IV orders with documented alternate etiologies. We hypothesize that this was due to nurses and physicians assessing and treating these conditions prior to treating hypertension in the intervention period, consequently avoiding an IV order.
The goal of the intervention was to have nurses assess for end-organ damage and alternate etiologies and include this information on their assessment provided to the physician, which would result in appropriate treatment of elevated blood pressure. By performing an interdisciplinary intervention, we addressed the knowledge deficit of both nurses and physicians, improved the triage of elevated blood pressure, and likely decreased the number of pages to providers.
To our knowledge, this is the first intervention addressing the inpatient overuse of IV antihypertensive medications for the treatment of asymptomatic hypertension. Additionally, this study bolsters prior evidence that the use of IV antihypertensives in asymptomatic patients leads to a large number of adverse events.7 A third of patients in the preintervention period had documented alternate etiologies of their blood pressure elevation, highlighting the need to assess and potentially treat these causes prior to treating blood pressure itself.
Reducing unnecessary treatment of asymptomatic blood pressure elevation is challenging. Evidence shows that both clinicians and patients overestimate the benefits and underestimate the harms of medical interventions.13,14 This unfortunately leads to unjustified enthusiasm for medical treatments, which can worsen outcomes.15 Additionally, there may be a lack of knowledge of the guidelines, as well as the amount of time required in the full assessment of hypertensive urgency, that creates a culture of “treating the number.”
Changing physician behavior is difficult.16 However, active forms of continuing education and multifaceted interventions, such as ours, are most effective.17 Our message focused on patient safety and harm reduction, addressed clinicians’ safety concerns, and included stories of real cases where this overuse led to adverse events—all of which are encouraged in order to facilitate clinician engagement.18
There were limitations to this study. Only blood pressure elevations associated with an IV antihypertensive order and not all blood pressure elevations meeting the criteria for hypertensive urgency in general were examined. Additionally, our documentation of symptoms of hypertensive emergency and alternate etiologies was based only on documentation in the medical record. Ideally, we would have liked to conduct an interrupted time series analysis to assess the effect of the intervention over time; however, there were not enough orders of IV antihypertensives to perform such an analysis.
CONCLUSION
Treatment of asymptomatic blood pressure with IV antihypertensive medications can lead to patient harm. To reduce inappropriate treatment, our Student High Value Care team set out to challenge this common practice. Our interdisciplinary intervention successfully reduced unnecessary IV antihypertensive treatment. This may serve as a model for other institutions.
Disclosures
There are no relevant conflicts of interest to disclose for any authors.
1. Herzog E, Frankenberger O, Aziz E, et al. A novel pathway for the management of hypertension for hospitalized patients. Crit Pathw Cardiol. 2007;6(4):150-160. doi: 10.1097/HPC.0b013e318160c3a7. PubMed
2. Whelton PK, Carey RM, Aronow WS, et al. 2017 ACC/AHA/AAPA/ABC/ACPM/AGS/APhA/ASH/ASPC/NMA/PCNA guideline for the prevention, detection, evaluation, and management of high blood pressure in adults: a report of the American College of Cardiology/American Heart Association Task Force on clinical practice guidelines. Hypertension. 2018;71(6):e13-e115. doi: 10.1161/HYP.0000000000000065. PubMed
3. Mancia G, Fagard R, Narkiewicz K, et al. 2013 ESH/ESC guidelines for the management of arterial hypertension: the Task Force for the Management of Arterial Hypertension of the European Society of Hypertension (ESH) and of the European Society of Cardiology (ESC). Eur Heart J. 2013;34(28):2159-2219. doi: 10.1093/eurheartj/eht151. PubMed
4. Global status report on noncommunicable diseases 2010. Geneva, Switzerland: World Health Organization; 2011. 3.
5. Weder AB, Erickson S. Treatment of hypertension in the inpatient setting: use of intravenous labetalol and hydralazine. J Clin Hypertens (Greenwich). 2010;12(1):29-33. doi: 10.1111/j.1751-7176.2009.00196.x. PubMed
6. James PA, Oparil S, Carter BL, et al. 2014 evidence-based guideline for the management of high blood pressure in adults: report from the panel members appointed to the Eighth Joint National Committee (JNC 8). JAMA. 2014;311(5):507-520. doi: 10.1001/jama.2013.284427. PubMed
7. Lipari M, Moser LR, Petrovitch EA, Farber M, Flack JM. As-needed intravenous antihypertensive therapy and blood pressure control. J Hosp Med. 2016;11(3):193-198. doi: 10.1002/jhm.2510. PubMed
8. Patel KK, Young L, Howell EH, et al. Characteristics and outcomes of patients presenting with hypertensive urgency in the office setting. JAMA Intern Med. 2016;176(7):981-988. doi: 10.1001/jamainternmed.2016.1509. PubMed
9. Ipek E, Oktay AA, Krim SR. Hypertensive crisis: an update on clinical approach and management. Curr Opin Cardiol. 2017;32(4):397-406. doi: 10.1097/HCO.0000000000000398. PubMed
10. Cho HC, Dunn A, Di Capua J, Lee IT, Makhni S, Korenstein DR. Student high value care committee: a model for student-led implementation [abstract 286]. J Hosp Med. 2017. PubMed
11. Yang JY, Chiu S, Krouss M. Overtreatment of asymptomatic hypertension-urgency is not an emergency: a teachable moment. JAMA Intern Med. 2018;178(5):704-705. doi: 10.1001/jamainternmed.2018.0126. PubMed
12. Malesker MA, Hilleman DE. Intravenous labetalol compared with intravenous nicardipine in the management of hypertension in critically ill patients. J Crit Care. 2012;27(5):528 e527-514. doi: 10.1016/j.jcrc.2011.12.005. PubMed
13. Hoffmann TC, Del Mar C. Clinicians’ expectations of the benefits and harms of treatments, screening, and tests: a systematic review. JAMA Intern Med. 2017;177(3):407-419. doi: 10.1001/jamainternmed.2016.8254. PubMed
14. Hoffmann TC, Del Mar C. Patients’ expectations of the benefits and harms of treatments, screening, and tests: a systematic review. JAMA Intern Med. 2015;175(2):274-286. doi: 10.1001/jamainternmed.2014.6016. PubMed
15. Casarett D. The science of choosing wisely--overcoming the therapeutic illusion. N Engl J Med. 2016;374(13):1203-1205. doi: 10.1056/NEJMp1516803. PubMed
16. Wilensky G. Changing physician behavior is harder than we thought. JAMA. 2016;316(1):21-22. doi: 10.1001/jama.2016.8019. PubMed
17. Mostofian F, Ruban C, Simunovic N, Bhandari M. Changing physician behavior: what works? Am J Manag Care. 2015;21(1):75-84.
18. Pasik S, Korenstein D, Israilov S, Cho HJ. Engagement in eliminating overuse: the argument for safety and beyond. J Patient Saf. 2018. doi: 10.1097/PTS.0000000000000487. PubMed
© 2019 Society of Hospital Medicine
Reducing Unnecessary Treatment of Asymptomatic Elevated Blood Pressure with Intravenous Medications on the General Internal Medicine Wards: A Quality Improvement Initiative
Elevated blood pressure (BP) is common among hospitalized adults, with prevalence estimates between 50% and 70%.1 Many factors can cause or exacerbate BP elevations in the setting of acute illness, such as pain, anxiety, medication withdrawal, and volume status, among others.2 While there are clear evidence-based recommendations for treating hypertension (HTN) in the ambulatory setting,3 guidelines for the management of elevated BP in the hospital are lacking.4,5
Hypertensive crises are generally recognized as warranting rapid reduction in BP;6-8 however, these represent the minority of cases.9,10 Far more common in the hospital are patients with asymptomatic elevated BP, a population for which there is no high-quality evidence and no guidelines supporting the use of intravenous (IV) antihypertensives.11,12 Treatment with such medications has been associated with highly variable clinical responses13-15 and may result in adverse events, such as hypotension.10
To date, only a small number of studies have investigated the treatment of asymptomatic elevated BP among hospitalized adults.10,13-15 These have suggested that IV antihypertensives are utilized frequently in this setting, often for only modestly elevated BPs; however, the studies have tended to be small, not racially diverse, and limited to noncritically ill patients. Furthermore, while it is generally accepted that reducing the use of IV antihypertensives among asymptomatic patients would have no adverse impact, to our knowledge there have been no published studies which have instituted such an initiative while measuring balancing outcomes.
The purpose of this study was to further the existing literature by defining the prevalence and effects of IV antihypertensive medication utilization among a medically complex, multiracial population of asymptomatic medical inpatients using a large electronic dataset and to evaluate the impact of a division-wide, two-tiered quality improvement (QI) initiative on the rates of IV antihypertensive utilization and patient outcomes.
METHODS
Setting
The study was conducted at the University of California, San Francisco (UCSF), an 800-bed tertiary care, academic medical center. It was approved by the UCSF Institutional Review Board. General medicine patients at UCSF are distributed between teaching and direct-care (hospitalist) services. The intensive care unit (ICU) is “open,” meaning the medicine service acts as the primary team for all nonsurgical ICU patients. This study included all adult general medicine patients admitted to UCSF Medical Center between January 1, 2017 and March 1, 2018, including those in the ICU.
Study Population and Data Collection
The UCSF Medical Center uses the electronic health record (EHR) Epic (Epic 2017, Epic Systems Corporation, Verona, Wisconsin) for all clinical care. We obtained computerized EHR data from Clarity, the relational database that stores Epic’s inpatient data in thousands of tables, including orders, medications, laboratory and radiology results, vital signs, patient demographics, and notes. We identified all adult patients hospitalized on the general medicine service with ≥1 episode of elevated BP (>160/90 mm Hg) at any point during their hospitalization who were not on a vasopressor medication at the time of the vital sign recording.
We further identified all instances in which either IV labetalol or hydralazine were administered to these patients. These two agents were chosen because they are the only IV antihypertensives used commonly at our institution for the treatment of asymptomatic elevated BP among internal medicine patients. Only those orders placed by a general medicine provider or reconciled by a general medicine provider upon transfer from another service were included. For each medication administration timestamp, we collected vital signs before and after the administration, along with the ordering provider and the clinical indication that was documented in the electronic order. To determine if a medication was administered with concern for end-organ injury, we also extracted orders that could serve as a proxy for the provider’s clinical assessment—namely electrocardiograms, serum troponins, chest x-rays, and computerized tomography scans of the head—which were placed in the one hour preceding or 15 minutes following administration of an IV antihypertensive medication.
To assess for comorbid conditions, including a preexisting diagnosis of HTN, we collected International Classification of Diseases (ICD)-9/10 diagnosis codes. Further, we also extracted All Patient Refined Diagnosis-Related Group (APR-DRG) weights, which are a standardized measure of illness severity based on relative resource consumption during hospitalization.16,17
Patients were categorized as having either “symptomatic” or “asymptomatic” elevated BP. We defined symptomatic elevated BP as having received treatment with an IV medication with provider concern for end-organ injury, as defined above. We further identified all patients in which tight BP control may be clinically indicated on the basis of the presence of any of the following ICD-9/10 diagnosis codes at the time of hospital discharge: myocardial infarction, ischemic stroke, intracranial hemorrhage, subarachnoid hemorrhage, subdural hematoma, aortic dissection, hypertensive emergency, or hypertensive encephalopathy. All patients with symptomatic elevated BP or any of the above ICD-9/10 diagnoses were excluded from the analysis, since administration of IV antihypertensive medications would plausibly be warranted in these clinical scenarios.
The encounter numbers from the dataset were used to link to patient demographic data, which included age, sex, race, ethnicity, primary language, and insurance status. Finally, we identified all instances of rapid response calls, ICU transfers, and code blues (cardiopulmonary arrests) for each patient in the dataset.
Blood Pressure Measurements
BP data were collected from invasive BP (IBP) monitoring devices and noninvasive BP cuffs. For patients with BP measurements recorded concomitantly from both IBP (ie, arterial lines) in addition to noninvasive BP cuffs, the arterial line reading was favored. All systolic BP (SBP) readings >240 mm Hg from arterial lines were excluded, as this has previously been described as the upper physiologic limit for IBP readings.18
Primary Outcome
The primary outcome for the study was the proportion of patients treated with IV antihypertensive medications (labetalol or hydralazine). Using aggregate data, we calculated the number of patients who were treated at least once with an IV antihypertensive in a given month (numerator), divided by the number of patients with ≥1 episode of asymptomatic elevated BP that month (denominator). The denominator was considered to be the population of patients “at risk” of being treated with IV antihypertensive medications. For patients with multiple admissions during the study period, each admission was considered separately. These results are displayed in the upper portion of the run chart (Figure).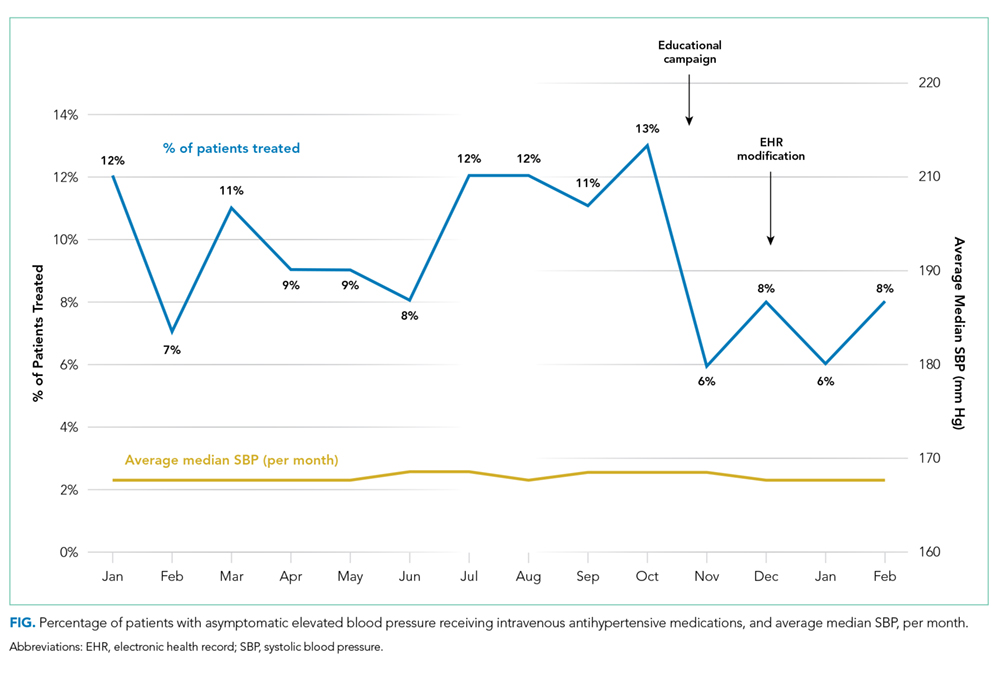
Secondary Outcomes
To investigate blood pressure trends over time, we analyzed BP in three ways. First, we analyzed the median SBP for the entire population. Second, to determine clinical responses to IV antihypertensive medications among patients receiving treatment, we calculated the population medians for the pretreatment SBP, the change in SBP from pretreatment baseline, and the posttreatment SBP. Third, we calculated the average median SBP on a monthly basis for the duration of the study. This was achieved by calculating the median value of all SBPs for an individual patient, then averaging across all patients in a given month. The average monthly median SBPs are displayed in the lower portion of the Figure.
To investigate whether the intervention was associated with negative patient outcomes, the proportions of several balancing outcomes were compared between pre- and postintervention periods, including ICU transfers, rapid response calls, and code blues (cardiopulmonary arrests).
Development and Implementation of an Intervention to Reduce Excessive IV Antihypertensive Use
After establishing the baseline prevalence of IV antihypertensive medication use at our institution, we developed a QI initiative with the goal of reducing IV antihypertensive medication utilization by the general medicine service for the treatment of asymptomatic patients. We hypothesized that potential contributors to overutilization might include lack of education, provider/nursing discomfort, and a system designed to mandate provider notification for even modestly elevated BPs. The QI initiative, which took place between October 2017 and December 2017, was designed to address these potential contributors and was comprised of a division-wide, two-tiered, bundled intervention. Our choice of a two-tiered approach was based on the fact that successful culture change is challenging, along with the existing evidence that multifaceted QI interventions are more often successful than single-tiered approaches.19
The first tier of the initiative included an educational campaign referred to colloquially as “NoIVForHighBP,” which targeted residents, hospitalists, and nursing staff. The campaign consisted of a series of presentations, best practice updates, handouts, and posters displayed prominently in shared workspaces. The educational content focused on alternative approaches to the management of asymptomatic elevated BP in the hospital, such as identification and treatment of pain, anxiety, volume overload, or other contributing factors (see supplemental materials). These educational outreaches occurred periodically between October 4, 2017 and November 20, 2017, with the bulk of the educational efforts taking place during November. Therefore, November 1, 2017 was designated the start date for the intervention period.
The second tier of the intervention included the liberalization of the EHR BP notification parameters on the standard inpatient admission order set from >160/90 mm Hg to >180/90 mm Hg. This change took effect on 12/6/2017. The decision to modify the BP notification parameters was based on the hypothesis that mandatory notifications for modestly elevated BPs may prompt providers to reflexively order IV antihypertensive medications, especially during times of cross-coverage or high clinical workload.
Statistical Analysis
All statistical analyses were performed using Stata software version 15 (StataCorp. 2017. Stata Statistical Software: Release 15. College Station, Texas: StataCorp LLC). Baseline patient characteristics were compared using nonparametric tests of significance. Population median SBPs were compared between pre- and postintervention periods using Mood’s Median Test, which was selected because the data were distributed nonnormally, and variances between samples were unequal.
Among patients treated with IV antihypertensive medications, we compared the proportion of pretreatment SBPs falling into each of three specified ranges (SBP <180 mm Hg, SBP 180-199 mm Hg, and SBP >200 mm Hg) between baseline and intervention periods using chi-squared tests.
Using aggregate data, we compared the unadjusted proportion of patients treated with IV antihypertensive medications between pre- and postintervention periods using a chi-squared test. Next, using patient-level data, a logistic regression analysis was performed to examine the association between receipt of IV antihypertensive medications and time (dichotomized between pre- and postintervention periods) while adjusting for age, sex, race, ethnicity, primary language, insurance status, preexisting HTN, length of stay, and APR-DRG weight.
Rates of balancing outcomes were compared using chi-squared tests. A logistic regression analysis using patient-level data was also performed to investigate the association between each of these outcomes and the intervention period (pre vs post) while adjusting for age, sex, race, ethnicity, primary language, insurance status, preexisting HTN, length of stay, and APR-DRG weight.
RESULTS
Baseline Period
We identified 2,306 patients with ≥1 episode of asymptomatic elevated BP during the 10-month preintervention period. Patients on average experienced 9 episodes of elevated BP per hospitalization, representing 21,207 potential opportunities for treatment. Baseline characteristics are summarized in Table 1. In general, this represents an older population that was medically complex and multiracial.
Of these patients, 251 (11%) received IV hydralazine and/or labetalol at least once during their hospitalization, with a total of 597 doses administered. Among those treated, a median of 2 doses were given per patient (IQR: 1-4), 64% of which were hydralazine. The majority (380 [64%]) were ordered on an “as needed” basis, while 217 (36%) were administered as a one-time dose. Three-quarters of all doses were ordered by the teaching service (456 [76%]), with the remaining 24% ordered by the direct-care (hospitalist) service.
During the baseline period among patients receiving IV antihypertensive medications, the median SBP of the population prior to treatment was 187 mm Hg (IQR 177-199; Table 2). Treatment was initiated in 30% of patients for an SBP <180 mm Hg and in 75% for an SBP <200 mm Hg. The median time to follow-up BP check was 34 minutes (IQR 15-58). The median decrement in SBP was 20 mm Hg (IQR 5-37); however, the response to treatment was highly variable, with 2% of patients experiencing no change and 14% experiencing an increase in SBP. Seventy-nine patients (14%) had a decrement in SBP >25% following treatment.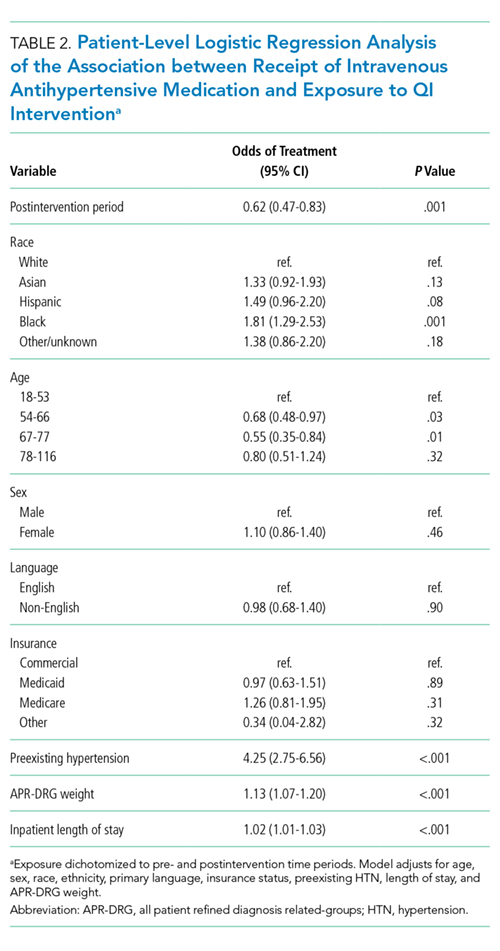
Description of Quality Improvement Results
Following the QI initiative, a total of 934 patients experienced 9,743 episodes of asymptomatic elevated blood pressure over a 4-month period (November 1, 2017 to February 28, 2018). As shown in Table 1, patients in the postintervention period had a slightly higher median age (67 [IQR 55-80] vs 69 [IQR 57-83]; P = .01), a higher median APR-DRG weight (1.34 [IQR 0.99-1.77] vs 1.48 [1.00-1.82]; P < .001), and a longer median length of stay (4.6 [2.8-8.0] days vs 5.1 [2.9-9.2] days; P = .004). There was also a higher proportion of nonEnglish speakers, fewer Black patients, and a lower proportion of preexisting HTN, in the postintervention period.
Of the 934 patients with ≥1 episode of asymptomatic elevated BP, 70 (7%) were treated with IV antihypertensive medications, with a total of 196 doses administered. The proportion of patients treated per month during the postintervention period ranged from 6% to 8%, which was the lowest of the entire study period and below the baseline average of 10% (Figure).
In a patient-level logistic regression pre-post analysis adjusting for age, sex, race, ethnicity, primary language, insurance status, preexisting HTN, length of stay, and APR-DRG weight, patients admitted to the general medicine service during the postintervention period had 38% lower odds of receiving IV antihypertensive medications than those admitted during the baseline period (OR = 0.62; 95% CI 0.47-0.83; P = .001). In this adjusted model, the following factors were independently associated with increased odds of receiving treatment: APR-DRG weight (OR 1.13; 95% CI 1.07-1.20; P < .001), Black race (OR 1.81; 95% CI 1.29-2.53; P = .001), length of stay (OR 1.02; 95% CI 1.01-1.03; P < .001), and preexisting HTN (OR 4.25; 95% CI 2.75-6.56; P < .001). Older age was associated with lower odds of treatment (Table 2).
Among patients who received treatment, there were no differences between pre- and postintervention periods in the proportion of pretreatment SBP <180 mm Hg (29% vs 32%; P = .40), 180-199 mm Hg (47% vs 40%; P = .10), or >200 mm Hg (25% vs 28%; P = .31; Table 3).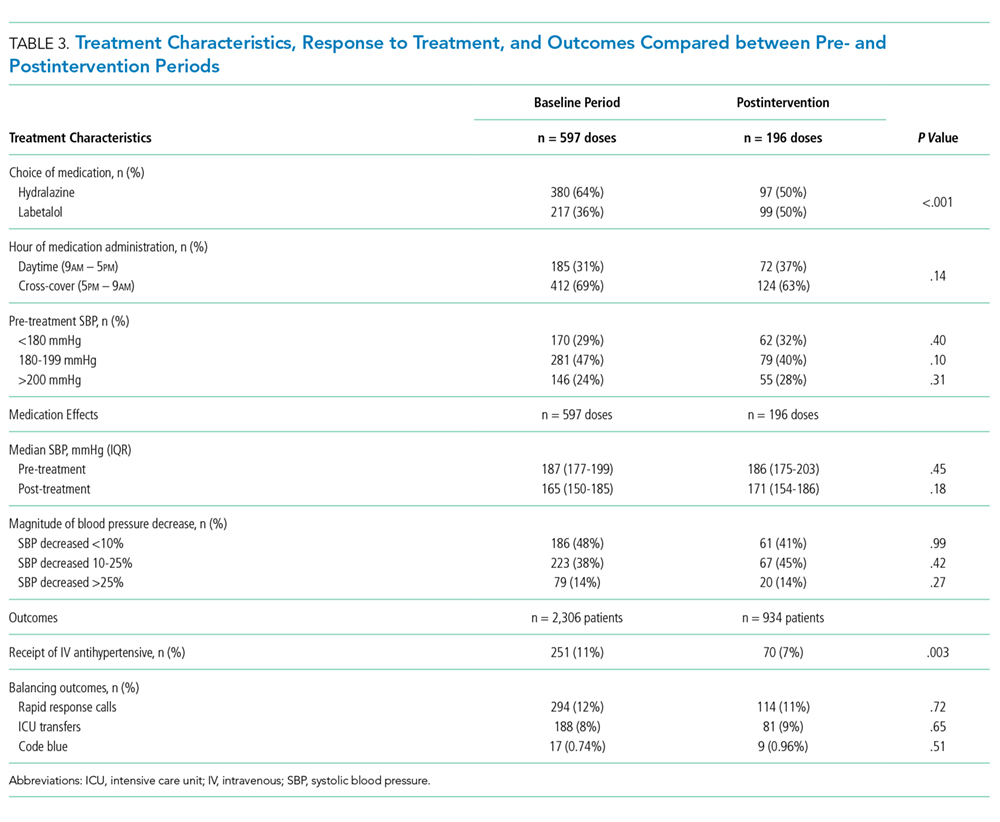
Population-level median SBP was similar between pre- and postintervention periods (167 mm Hg vs 168 mm Hg, P = .78), as were unadjusted rates of rapid response calls, ICU transfers, and code blues (Table 3). After adjustment for baseline characteristics and illness severity at the patient level, the odds of rapid response calls (OR 0.84; 95% CI 0.65-1.10; P = .21) and ICU transfers (OR 1.01; 95% CI 0.75-1.38; P = .93) did not differ between pre- and postintervention periods. A regression model was not fit for cardiopulmonary arrests due to the low absolute number of events.
CONCLUSIONS
Our results suggest that treatment of asymptomatic elevated BP using IV antihypertensive medications is common practice at our institution. We found that treatment is often initiated for only modestly elevated BPs and that the clinical response to these medications is highly variable. In the baseline period, one in seven patients experienced a decrement in BP >25% following treatment, which could potentially cause harm.11 There is no evidence, neither are there any consensus guidelines, to support the rapid reduction of BP among asymptomatic patients, making this a potential valuable opportunity for reducing unnecessary treatment, minimizing waste, and avoiding harm.
While there are a few previously published studies with similar results, we add to the existing literature by studying a larger population of more than 3,000 total patients, which was uniquely multiracial, including a high proportion of non-English speakers. Furthermore, our cohort included patients in the ICU, which is reflected in the higher-than-average APR-DRG weights. Despite being critically ill, these patients arguably still do not warrant aggressive treatment of elevated BP when asymptomatic. By excluding symptomatic BP elevations using surrogate markers for end-organ damage in addition to discharge diagnosis codes indicative of conditions in which tight BP control may be warranted, we were able to study a more critically ill patient population. We were also able to describe which baseline patient characteristics convey higher adjusted odds of receiving treatment, such as preexisting HTN, younger age, illness severity, and black race.
Perhaps most significantly, our study is the first to demonstrate an effective QI intervention aimed at reducing unnecessary utilization of IV antihypertensives. We found that this can feasibly be accomplished through a combination of educational efforts and systems changes, which could easily be replicated at other institutions. While the absolute reduction in the number of patients receiving treatment was modest, if these findings were to be widely accepted and resulted in a wide-spread change in culture, there would be a potential for greater impact.
Despite the reduction in the proportion of patients receiving IV antihypertensive medications, we found no change in the median SBP compared with the baseline period, which seems to support that the intervention was well tolerated. We also found no difference in the number of ICU transfers, rapid response calls, and cardiopulmonary arrests between groups. While these findings are both reassuring, it is impossible to draw definitive conclusions about safety given the small absolute number of patients having received treatment in each group. Fortunately, current guidelines and literature support the safety of such an intervention, as there is no existing evidence to suggest that failing to rapidly lower BP among asymptomatic patients is potentially harmful.11
There are several limitations to our study. First, by utilizing a large electronic dataset, the quality of our analyses was reliant on the accuracy of the recorded EHR data. Second, in the absence of a controlled trial or control group, we cannot say definitively that our QI initiative was the direct cause of the improved rates of IV antihypertensive utilization, though the effect did persist after adjusting for baseline characteristics in patient-level models. Third, our follow-up period was relatively short, with fewer than half as many patients as in the preintervention period. This is an important limitation, since the impact of QI interventions often diminishes over time. We plan to continually monitor IV antihypertensive use, feed those data back to our group, and revitalize educational efforts should rates begin to rise. Fourth, we were unable to directly measure which patients had true end-organ injury and instead used orders placed around the time of medication administration as a surrogate marker. While this is an imperfect measure, we feel that in cases where a provider was concerned enough to even test for end-organ injury, the use of IV antihypertensives was likely justified and was therefore appropriately excluded from the analysis. Lastly, we were limited in our ability to describe associations with true clinical outcomes, such as stroke or myocardial infarction, which could theoretically be propagated by either the use or the avoidance of IV antihypertensive medications. Fortunately, based on clinical guidelines and existing evidence, there is no reason to believe that reducing IV antihypertensive use would result in increased rates of these outcomes.
Our study reaffirms the fact that overutilization of IV antihypertensive medications among asymptomatic hospitalized patients is pervasive across hospital systems. This represents a potential target for a concerted change in culture, which we have demonstrated can be feasibly accomplished through education and systems changes.
Disclosures
Dr. Auerbach has current or pending grants from the CDC, PCORI, and FDA that are unrelated to this research manuscript. He also receives royalties from UpToDate, and received an honorarium for being editor of JHM. Dr. Jacobs received a $1,000 Resident/Fellow Travel Grant from the Society of Hospital Medicine to support the cost of travel to SHM, where he presented this research as a poster in 2018. Dr. Prasad receives money from EpiExcellence, LLC for consultation, which is unrelated to this research manuscript. All other authors have nothing to disclose.
1. Axon RN, Cousineau L, Egan BM. Prevalence and management of hypertension in the inpatient setting: A systematic review. J Hosp Med. 2011;6(7):417-422. doi: 10.1002/jhm.804. PubMed
2. Herzog E, Frankenberger O, Aziz E, et al. A novel pathway for the management of ypertension for hospitalized patients. Crit Pathw Cardiol. 2007;6(4):150-160. doi: 10.1097/HPC.0b013e318160c3a7. PubMed
3. James PA, Oparil S, Carter BL, et al. 2014 evidence-based guideline for the management of high blood pressure in adults: report from the panel members appointed to the eighth Joint National Committee (JNC 8). JAMA. 2014;311(5):507-520. doi: 10.1001/jama.2013.284427. PubMed
4. Weder AB. Treating acute hypertension in the hospital: A lacuna in the guidelines [editorial]. Hypertension. 2011;57(1):18-20. PubMed
5. Axon RN, Turner M, Buckley R. An update on inpatient hypertension management. Curr Cardiol Rep. 2015;17(11):94. doi: 10.1007/s11886-015-0648-y. PubMed
6. Marik PE, Rivera R. Hypertensive emergencies: an update. Curr Opin Crit Care. 2011;17(6):569-580. doi:10.1097/MCC.0b013e32834cd31d. PubMed
7. Cherney D, Straus S. Management of patients with hypertensive urgencies and emergencies: a systematic review of the literature. J Gen Intern Med. 2002;17(12):937-945. doi: 10.1046/j.1525-1497.2002.20389.x. PubMed
8. Padilla Ramos A, Varon J. Current and newer agents for hypertensive emergencies. Curr Hypertens Rep. 2014;16(7):450. doi: 10.1007/s11906-014-0450-z. PubMed
9. Whitworth JA, World Health Organization, International Society of Hypertension Writing Group. 2003 World Health Organization (WHO)/International Society of Hypertension (ISH) statement on management of hypertension. J Hypertens. 2003;21(11):1983-1992. doi: 10.1097/01.hjh.0000084751.37215.d2. PubMed
10. Campbell P, Baker WL, Bendel SD, White WB. Intravenous hydralazine for blood pressure management in the hospitalized patient: its use is often unjustified. J Am Soc Hypertens. 2011;5(6):473-477. doi: 10.1016/j.jash.2011.07.002. PubMed
11. Chobanian AV, Bakris GL, Black HR, et al. The Seventh Report of the Joint National Committee on Prevention, Detection, Evaluation, and Treatment of High Blood Pressure: the JNC 7 report. JAMA. 2003;289(19):2560-2572. doi: 10.1001/jama.289.19.2560. PubMed
12. Gauer R. Severe asymptomatic hypertension: Evaluation and treatment. Am Fam Physician. 2017;95(8):492-500. PubMed
13. Lipari M, Moser LR, Petrovitch EA, Farber M, Flack JM. As-needed intravenous antihypertensive therapy and blood pressure control: Antihypertensive Therapy and BP Control. J Hosp Med. 2016;11(3):193-198. doi: 10.1002/jhm.2510. PubMed
14. Gaynor MF, Wright GC, Vondracek S. Retrospective review of the use of as-needed hydralazine and labetalol for the treatment of acute hypertension in hospitalized medicine patients. Ther Adv Cardiovasc Dis. 2017;12(1):7-15. doi: 10.1177/1753944717746613. PubMed
15. Weder AB, Erickson S. Treatment of hypertension in the inpatient setting: Use of intravenous labetalol and hydralazine. J Clin Hypertens. 2010;12(1):29-33. doi: 10.1111/j.1751-7176.2009.00196.x. PubMed
16. Averill RF, Goldfield N, Hughes, JS, et al. All Patient Refined Diagnosis Related Groups (APR-DRGs) Version 20.0: Methodology Overview. Clinical Research and Documentation Departments of 3M Health Information Systems, Wallingford, Connecticut and Murray, Utah, 2003. https://www.hcup-us.ahrq.gov/. Accessed February 19, 2018.
17. Iezzoni LI, Ash AS, Shwartz M, Daley J, Hughes JS, Mackiernan YD. Predicting who dies depends on how severity is measured: Implications for evaluating patient outcomes. Ann Intern Med. 1995;123(10):763-770. PubMed
18. Romagnoli S, Ricci Z, Quattrone D, et al. Accuracy of invasive arterial pressure monitoring in cardiovascular patients: an observational study. Crit Care. 2014;18(6):644. doi: 10.1186/s13054-014-0644-4. PubMed
19. Shojania K, Grimshaw JM. Evidence-based quality improvement: The state of the science. Health Aff (Millwood). 2005;24(1):138-150. doi: 10.1377/hlthaff.24.1.138. PubMed
Elevated blood pressure (BP) is common among hospitalized adults, with prevalence estimates between 50% and 70%.1 Many factors can cause or exacerbate BP elevations in the setting of acute illness, such as pain, anxiety, medication withdrawal, and volume status, among others.2 While there are clear evidence-based recommendations for treating hypertension (HTN) in the ambulatory setting,3 guidelines for the management of elevated BP in the hospital are lacking.4,5
Hypertensive crises are generally recognized as warranting rapid reduction in BP;6-8 however, these represent the minority of cases.9,10 Far more common in the hospital are patients with asymptomatic elevated BP, a population for which there is no high-quality evidence and no guidelines supporting the use of intravenous (IV) antihypertensives.11,12 Treatment with such medications has been associated with highly variable clinical responses13-15 and may result in adverse events, such as hypotension.10
To date, only a small number of studies have investigated the treatment of asymptomatic elevated BP among hospitalized adults.10,13-15 These have suggested that IV antihypertensives are utilized frequently in this setting, often for only modestly elevated BPs; however, the studies have tended to be small, not racially diverse, and limited to noncritically ill patients. Furthermore, while it is generally accepted that reducing the use of IV antihypertensives among asymptomatic patients would have no adverse impact, to our knowledge there have been no published studies which have instituted such an initiative while measuring balancing outcomes.
The purpose of this study was to further the existing literature by defining the prevalence and effects of IV antihypertensive medication utilization among a medically complex, multiracial population of asymptomatic medical inpatients using a large electronic dataset and to evaluate the impact of a division-wide, two-tiered quality improvement (QI) initiative on the rates of IV antihypertensive utilization and patient outcomes.
METHODS
Setting
The study was conducted at the University of California, San Francisco (UCSF), an 800-bed tertiary care, academic medical center. It was approved by the UCSF Institutional Review Board. General medicine patients at UCSF are distributed between teaching and direct-care (hospitalist) services. The intensive care unit (ICU) is “open,” meaning the medicine service acts as the primary team for all nonsurgical ICU patients. This study included all adult general medicine patients admitted to UCSF Medical Center between January 1, 2017 and March 1, 2018, including those in the ICU.
Study Population and Data Collection
The UCSF Medical Center uses the electronic health record (EHR) Epic (Epic 2017, Epic Systems Corporation, Verona, Wisconsin) for all clinical care. We obtained computerized EHR data from Clarity, the relational database that stores Epic’s inpatient data in thousands of tables, including orders, medications, laboratory and radiology results, vital signs, patient demographics, and notes. We identified all adult patients hospitalized on the general medicine service with ≥1 episode of elevated BP (>160/90 mm Hg) at any point during their hospitalization who were not on a vasopressor medication at the time of the vital sign recording.
We further identified all instances in which either IV labetalol or hydralazine were administered to these patients. These two agents were chosen because they are the only IV antihypertensives used commonly at our institution for the treatment of asymptomatic elevated BP among internal medicine patients. Only those orders placed by a general medicine provider or reconciled by a general medicine provider upon transfer from another service were included. For each medication administration timestamp, we collected vital signs before and after the administration, along with the ordering provider and the clinical indication that was documented in the electronic order. To determine if a medication was administered with concern for end-organ injury, we also extracted orders that could serve as a proxy for the provider’s clinical assessment—namely electrocardiograms, serum troponins, chest x-rays, and computerized tomography scans of the head—which were placed in the one hour preceding or 15 minutes following administration of an IV antihypertensive medication.
To assess for comorbid conditions, including a preexisting diagnosis of HTN, we collected International Classification of Diseases (ICD)-9/10 diagnosis codes. Further, we also extracted All Patient Refined Diagnosis-Related Group (APR-DRG) weights, which are a standardized measure of illness severity based on relative resource consumption during hospitalization.16,17
Patients were categorized as having either “symptomatic” or “asymptomatic” elevated BP. We defined symptomatic elevated BP as having received treatment with an IV medication with provider concern for end-organ injury, as defined above. We further identified all patients in which tight BP control may be clinically indicated on the basis of the presence of any of the following ICD-9/10 diagnosis codes at the time of hospital discharge: myocardial infarction, ischemic stroke, intracranial hemorrhage, subarachnoid hemorrhage, subdural hematoma, aortic dissection, hypertensive emergency, or hypertensive encephalopathy. All patients with symptomatic elevated BP or any of the above ICD-9/10 diagnoses were excluded from the analysis, since administration of IV antihypertensive medications would plausibly be warranted in these clinical scenarios.
The encounter numbers from the dataset were used to link to patient demographic data, which included age, sex, race, ethnicity, primary language, and insurance status. Finally, we identified all instances of rapid response calls, ICU transfers, and code blues (cardiopulmonary arrests) for each patient in the dataset.
Blood Pressure Measurements
BP data were collected from invasive BP (IBP) monitoring devices and noninvasive BP cuffs. For patients with BP measurements recorded concomitantly from both IBP (ie, arterial lines) in addition to noninvasive BP cuffs, the arterial line reading was favored. All systolic BP (SBP) readings >240 mm Hg from arterial lines were excluded, as this has previously been described as the upper physiologic limit for IBP readings.18
Primary Outcome
The primary outcome for the study was the proportion of patients treated with IV antihypertensive medications (labetalol or hydralazine). Using aggregate data, we calculated the number of patients who were treated at least once with an IV antihypertensive in a given month (numerator), divided by the number of patients with ≥1 episode of asymptomatic elevated BP that month (denominator). The denominator was considered to be the population of patients “at risk” of being treated with IV antihypertensive medications. For patients with multiple admissions during the study period, each admission was considered separately. These results are displayed in the upper portion of the run chart (Figure).
Secondary Outcomes
To investigate blood pressure trends over time, we analyzed BP in three ways. First, we analyzed the median SBP for the entire population. Second, to determine clinical responses to IV antihypertensive medications among patients receiving treatment, we calculated the population medians for the pretreatment SBP, the change in SBP from pretreatment baseline, and the posttreatment SBP. Third, we calculated the average median SBP on a monthly basis for the duration of the study. This was achieved by calculating the median value of all SBPs for an individual patient, then averaging across all patients in a given month. The average monthly median SBPs are displayed in the lower portion of the Figure.
To investigate whether the intervention was associated with negative patient outcomes, the proportions of several balancing outcomes were compared between pre- and postintervention periods, including ICU transfers, rapid response calls, and code blues (cardiopulmonary arrests).
Development and Implementation of an Intervention to Reduce Excessive IV Antihypertensive Use
After establishing the baseline prevalence of IV antihypertensive medication use at our institution, we developed a QI initiative with the goal of reducing IV antihypertensive medication utilization by the general medicine service for the treatment of asymptomatic patients. We hypothesized that potential contributors to overutilization might include lack of education, provider/nursing discomfort, and a system designed to mandate provider notification for even modestly elevated BPs. The QI initiative, which took place between October 2017 and December 2017, was designed to address these potential contributors and was comprised of a division-wide, two-tiered, bundled intervention. Our choice of a two-tiered approach was based on the fact that successful culture change is challenging, along with the existing evidence that multifaceted QI interventions are more often successful than single-tiered approaches.19
The first tier of the initiative included an educational campaign referred to colloquially as “NoIVForHighBP,” which targeted residents, hospitalists, and nursing staff. The campaign consisted of a series of presentations, best practice updates, handouts, and posters displayed prominently in shared workspaces. The educational content focused on alternative approaches to the management of asymptomatic elevated BP in the hospital, such as identification and treatment of pain, anxiety, volume overload, or other contributing factors (see supplemental materials). These educational outreaches occurred periodically between October 4, 2017 and November 20, 2017, with the bulk of the educational efforts taking place during November. Therefore, November 1, 2017 was designated the start date for the intervention period.
The second tier of the intervention included the liberalization of the EHR BP notification parameters on the standard inpatient admission order set from >160/90 mm Hg to >180/90 mm Hg. This change took effect on 12/6/2017. The decision to modify the BP notification parameters was based on the hypothesis that mandatory notifications for modestly elevated BPs may prompt providers to reflexively order IV antihypertensive medications, especially during times of cross-coverage or high clinical workload.
Statistical Analysis
All statistical analyses were performed using Stata software version 15 (StataCorp. 2017. Stata Statistical Software: Release 15. College Station, Texas: StataCorp LLC). Baseline patient characteristics were compared using nonparametric tests of significance. Population median SBPs were compared between pre- and postintervention periods using Mood’s Median Test, which was selected because the data were distributed nonnormally, and variances between samples were unequal.
Among patients treated with IV antihypertensive medications, we compared the proportion of pretreatment SBPs falling into each of three specified ranges (SBP <180 mm Hg, SBP 180-199 mm Hg, and SBP >200 mm Hg) between baseline and intervention periods using chi-squared tests.
Using aggregate data, we compared the unadjusted proportion of patients treated with IV antihypertensive medications between pre- and postintervention periods using a chi-squared test. Next, using patient-level data, a logistic regression analysis was performed to examine the association between receipt of IV antihypertensive medications and time (dichotomized between pre- and postintervention periods) while adjusting for age, sex, race, ethnicity, primary language, insurance status, preexisting HTN, length of stay, and APR-DRG weight.
Rates of balancing outcomes were compared using chi-squared tests. A logistic regression analysis using patient-level data was also performed to investigate the association between each of these outcomes and the intervention period (pre vs post) while adjusting for age, sex, race, ethnicity, primary language, insurance status, preexisting HTN, length of stay, and APR-DRG weight.
RESULTS
Baseline Period
We identified 2,306 patients with ≥1 episode of asymptomatic elevated BP during the 10-month preintervention period. Patients on average experienced 9 episodes of elevated BP per hospitalization, representing 21,207 potential opportunities for treatment. Baseline characteristics are summarized in Table 1. In general, this represents an older population that was medically complex and multiracial.
Of these patients, 251 (11%) received IV hydralazine and/or labetalol at least once during their hospitalization, with a total of 597 doses administered. Among those treated, a median of 2 doses were given per patient (IQR: 1-4), 64% of which were hydralazine. The majority (380 [64%]) were ordered on an “as needed” basis, while 217 (36%) were administered as a one-time dose. Three-quarters of all doses were ordered by the teaching service (456 [76%]), with the remaining 24% ordered by the direct-care (hospitalist) service.
During the baseline period among patients receiving IV antihypertensive medications, the median SBP of the population prior to treatment was 187 mm Hg (IQR 177-199; Table 2). Treatment was initiated in 30% of patients for an SBP <180 mm Hg and in 75% for an SBP <200 mm Hg. The median time to follow-up BP check was 34 minutes (IQR 15-58). The median decrement in SBP was 20 mm Hg (IQR 5-37); however, the response to treatment was highly variable, with 2% of patients experiencing no change and 14% experiencing an increase in SBP. Seventy-nine patients (14%) had a decrement in SBP >25% following treatment.
Description of Quality Improvement Results
Following the QI initiative, a total of 934 patients experienced 9,743 episodes of asymptomatic elevated blood pressure over a 4-month period (November 1, 2017 to February 28, 2018). As shown in Table 1, patients in the postintervention period had a slightly higher median age (67 [IQR 55-80] vs 69 [IQR 57-83]; P = .01), a higher median APR-DRG weight (1.34 [IQR 0.99-1.77] vs 1.48 [1.00-1.82]; P < .001), and a longer median length of stay (4.6 [2.8-8.0] days vs 5.1 [2.9-9.2] days; P = .004). There was also a higher proportion of nonEnglish speakers, fewer Black patients, and a lower proportion of preexisting HTN, in the postintervention period.
Of the 934 patients with ≥1 episode of asymptomatic elevated BP, 70 (7%) were treated with IV antihypertensive medications, with a total of 196 doses administered. The proportion of patients treated per month during the postintervention period ranged from 6% to 8%, which was the lowest of the entire study period and below the baseline average of 10% (Figure).
In a patient-level logistic regression pre-post analysis adjusting for age, sex, race, ethnicity, primary language, insurance status, preexisting HTN, length of stay, and APR-DRG weight, patients admitted to the general medicine service during the postintervention period had 38% lower odds of receiving IV antihypertensive medications than those admitted during the baseline period (OR = 0.62; 95% CI 0.47-0.83; P = .001). In this adjusted model, the following factors were independently associated with increased odds of receiving treatment: APR-DRG weight (OR 1.13; 95% CI 1.07-1.20; P < .001), Black race (OR 1.81; 95% CI 1.29-2.53; P = .001), length of stay (OR 1.02; 95% CI 1.01-1.03; P < .001), and preexisting HTN (OR 4.25; 95% CI 2.75-6.56; P < .001). Older age was associated with lower odds of treatment (Table 2).
Among patients who received treatment, there were no differences between pre- and postintervention periods in the proportion of pretreatment SBP <180 mm Hg (29% vs 32%; P = .40), 180-199 mm Hg (47% vs 40%; P = .10), or >200 mm Hg (25% vs 28%; P = .31; Table 3).
Population-level median SBP was similar between pre- and postintervention periods (167 mm Hg vs 168 mm Hg, P = .78), as were unadjusted rates of rapid response calls, ICU transfers, and code blues (Table 3). After adjustment for baseline characteristics and illness severity at the patient level, the odds of rapid response calls (OR 0.84; 95% CI 0.65-1.10; P = .21) and ICU transfers (OR 1.01; 95% CI 0.75-1.38; P = .93) did not differ between pre- and postintervention periods. A regression model was not fit for cardiopulmonary arrests due to the low absolute number of events.
CONCLUSIONS
Our results suggest that treatment of asymptomatic elevated BP using IV antihypertensive medications is common practice at our institution. We found that treatment is often initiated for only modestly elevated BPs and that the clinical response to these medications is highly variable. In the baseline period, one in seven patients experienced a decrement in BP >25% following treatment, which could potentially cause harm.11 There is no evidence, neither are there any consensus guidelines, to support the rapid reduction of BP among asymptomatic patients, making this a potential valuable opportunity for reducing unnecessary treatment, minimizing waste, and avoiding harm.
While there are a few previously published studies with similar results, we add to the existing literature by studying a larger population of more than 3,000 total patients, which was uniquely multiracial, including a high proportion of non-English speakers. Furthermore, our cohort included patients in the ICU, which is reflected in the higher-than-average APR-DRG weights. Despite being critically ill, these patients arguably still do not warrant aggressive treatment of elevated BP when asymptomatic. By excluding symptomatic BP elevations using surrogate markers for end-organ damage in addition to discharge diagnosis codes indicative of conditions in which tight BP control may be warranted, we were able to study a more critically ill patient population. We were also able to describe which baseline patient characteristics convey higher adjusted odds of receiving treatment, such as preexisting HTN, younger age, illness severity, and black race.
Perhaps most significantly, our study is the first to demonstrate an effective QI intervention aimed at reducing unnecessary utilization of IV antihypertensives. We found that this can feasibly be accomplished through a combination of educational efforts and systems changes, which could easily be replicated at other institutions. While the absolute reduction in the number of patients receiving treatment was modest, if these findings were to be widely accepted and resulted in a wide-spread change in culture, there would be a potential for greater impact.
Despite the reduction in the proportion of patients receiving IV antihypertensive medications, we found no change in the median SBP compared with the baseline period, which seems to support that the intervention was well tolerated. We also found no difference in the number of ICU transfers, rapid response calls, and cardiopulmonary arrests between groups. While these findings are both reassuring, it is impossible to draw definitive conclusions about safety given the small absolute number of patients having received treatment in each group. Fortunately, current guidelines and literature support the safety of such an intervention, as there is no existing evidence to suggest that failing to rapidly lower BP among asymptomatic patients is potentially harmful.11
There are several limitations to our study. First, by utilizing a large electronic dataset, the quality of our analyses was reliant on the accuracy of the recorded EHR data. Second, in the absence of a controlled trial or control group, we cannot say definitively that our QI initiative was the direct cause of the improved rates of IV antihypertensive utilization, though the effect did persist after adjusting for baseline characteristics in patient-level models. Third, our follow-up period was relatively short, with fewer than half as many patients as in the preintervention period. This is an important limitation, since the impact of QI interventions often diminishes over time. We plan to continually monitor IV antihypertensive use, feed those data back to our group, and revitalize educational efforts should rates begin to rise. Fourth, we were unable to directly measure which patients had true end-organ injury and instead used orders placed around the time of medication administration as a surrogate marker. While this is an imperfect measure, we feel that in cases where a provider was concerned enough to even test for end-organ injury, the use of IV antihypertensives was likely justified and was therefore appropriately excluded from the analysis. Lastly, we were limited in our ability to describe associations with true clinical outcomes, such as stroke or myocardial infarction, which could theoretically be propagated by either the use or the avoidance of IV antihypertensive medications. Fortunately, based on clinical guidelines and existing evidence, there is no reason to believe that reducing IV antihypertensive use would result in increased rates of these outcomes.
Our study reaffirms the fact that overutilization of IV antihypertensive medications among asymptomatic hospitalized patients is pervasive across hospital systems. This represents a potential target for a concerted change in culture, which we have demonstrated can be feasibly accomplished through education and systems changes.
Disclosures
Dr. Auerbach has current or pending grants from the CDC, PCORI, and FDA that are unrelated to this research manuscript. He also receives royalties from UpToDate, and received an honorarium for being editor of JHM. Dr. Jacobs received a $1,000 Resident/Fellow Travel Grant from the Society of Hospital Medicine to support the cost of travel to SHM, where he presented this research as a poster in 2018. Dr. Prasad receives money from EpiExcellence, LLC for consultation, which is unrelated to this research manuscript. All other authors have nothing to disclose.
1. Axon RN, Cousineau L, Egan BM. Prevalence and management of hypertension in the inpatient setting: A systematic review. J Hosp Med. 2011;6(7):417-422. doi: 10.1002/jhm.804. PubMed
2. Herzog E, Frankenberger O, Aziz E, et al. A novel pathway for the management of ypertension for hospitalized patients. Crit Pathw Cardiol. 2007;6(4):150-160. doi: 10.1097/HPC.0b013e318160c3a7. PubMed
3. James PA, Oparil S, Carter BL, et al. 2014 evidence-based guideline for the management of high blood pressure in adults: report from the panel members appointed to the eighth Joint National Committee (JNC 8). JAMA. 2014;311(5):507-520. doi: 10.1001/jama.2013.284427. PubMed
4. Weder AB. Treating acute hypertension in the hospital: A lacuna in the guidelines [editorial]. Hypertension. 2011;57(1):18-20. PubMed
5. Axon RN, Turner M, Buckley R. An update on inpatient hypertension management. Curr Cardiol Rep. 2015;17(11):94. doi: 10.1007/s11886-015-0648-y. PubMed
6. Marik PE, Rivera R. Hypertensive emergencies: an update. Curr Opin Crit Care. 2011;17(6):569-580. doi:10.1097/MCC.0b013e32834cd31d. PubMed
7. Cherney D, Straus S. Management of patients with hypertensive urgencies and emergencies: a systematic review of the literature. J Gen Intern Med. 2002;17(12):937-945. doi: 10.1046/j.1525-1497.2002.20389.x. PubMed
8. Padilla Ramos A, Varon J. Current and newer agents for hypertensive emergencies. Curr Hypertens Rep. 2014;16(7):450. doi: 10.1007/s11906-014-0450-z. PubMed
9. Whitworth JA, World Health Organization, International Society of Hypertension Writing Group. 2003 World Health Organization (WHO)/International Society of Hypertension (ISH) statement on management of hypertension. J Hypertens. 2003;21(11):1983-1992. doi: 10.1097/01.hjh.0000084751.37215.d2. PubMed
10. Campbell P, Baker WL, Bendel SD, White WB. Intravenous hydralazine for blood pressure management in the hospitalized patient: its use is often unjustified. J Am Soc Hypertens. 2011;5(6):473-477. doi: 10.1016/j.jash.2011.07.002. PubMed
11. Chobanian AV, Bakris GL, Black HR, et al. The Seventh Report of the Joint National Committee on Prevention, Detection, Evaluation, and Treatment of High Blood Pressure: the JNC 7 report. JAMA. 2003;289(19):2560-2572. doi: 10.1001/jama.289.19.2560. PubMed
12. Gauer R. Severe asymptomatic hypertension: Evaluation and treatment. Am Fam Physician. 2017;95(8):492-500. PubMed
13. Lipari M, Moser LR, Petrovitch EA, Farber M, Flack JM. As-needed intravenous antihypertensive therapy and blood pressure control: Antihypertensive Therapy and BP Control. J Hosp Med. 2016;11(3):193-198. doi: 10.1002/jhm.2510. PubMed
14. Gaynor MF, Wright GC, Vondracek S. Retrospective review of the use of as-needed hydralazine and labetalol for the treatment of acute hypertension in hospitalized medicine patients. Ther Adv Cardiovasc Dis. 2017;12(1):7-15. doi: 10.1177/1753944717746613. PubMed
15. Weder AB, Erickson S. Treatment of hypertension in the inpatient setting: Use of intravenous labetalol and hydralazine. J Clin Hypertens. 2010;12(1):29-33. doi: 10.1111/j.1751-7176.2009.00196.x. PubMed
16. Averill RF, Goldfield N, Hughes, JS, et al. All Patient Refined Diagnosis Related Groups (APR-DRGs) Version 20.0: Methodology Overview. Clinical Research and Documentation Departments of 3M Health Information Systems, Wallingford, Connecticut and Murray, Utah, 2003. https://www.hcup-us.ahrq.gov/. Accessed February 19, 2018.
17. Iezzoni LI, Ash AS, Shwartz M, Daley J, Hughes JS, Mackiernan YD. Predicting who dies depends on how severity is measured: Implications for evaluating patient outcomes. Ann Intern Med. 1995;123(10):763-770. PubMed
18. Romagnoli S, Ricci Z, Quattrone D, et al. Accuracy of invasive arterial pressure monitoring in cardiovascular patients: an observational study. Crit Care. 2014;18(6):644. doi: 10.1186/s13054-014-0644-4. PubMed
19. Shojania K, Grimshaw JM. Evidence-based quality improvement: The state of the science. Health Aff (Millwood). 2005;24(1):138-150. doi: 10.1377/hlthaff.24.1.138. PubMed
© 2019 Society of Hospital Medicine
Progress stalls in HIV prevention
The CDC says the United States has hit a plateau with HIV infections. The feds’ infectious disease leadership testifies on the measles outbreaks. Big pharma tells Congress it can’t drop drug list prices alone. And why there may be too much screening for Barrett’s esophagus in patients with uncomplicated GERD.
Amazon Alexa
Apple Podcasts
Google Podcasts
Spotify

Burnout and Parenting in training: Kirti Magudia and Thomas Ng - Part II
Kirti Magudia, MD, and Thomas Ng, MD, continue their conversation with host Nick Andrews, sharing their experiences as parents of young children as well as early career physicians.
Dr. Magudia and Dr. Ng, both diagnostic radiology fellows at Brigham and Women’s Hospital, Boston, discuss traditional ways of mitigating against burnout – practices such as exercise, meditation, and carving out self-care time – as well as finding meaning in researching and advocating for work-life integration for residents.
Apple Podcasts
Google Podcasts
Spotify
Contact us: podcasts@mdedge.com
Nick Andrews @tribnic on Twitter