User login
Handoffs
When I was four years old, Grandpa always cut off the crust of the bread before I ate my peanut butter and jelly sandwich.
When I was seven years old, Grandpa took me to the circus and bought me cotton candy. He didn't care when I got the sticky stuff all over my face and dress.
When I was nine years old, Grandpa took me out on my birthday for a chocolate ice cream cone with rainbow sprinkles on top.
I didn't know he had high blood pressure. And neither did he.
He made me laugh. He made me feel so good deep down inside.
At age eleven I returned home from school to find Grandpa had been taken to the hospital with a stroke.
I cut the crust off his bread, got him cotton candy and an ice cream cone so he would feel better.
I went with Mommy to see him. She was stopped at the nurses' station. They wanted to talk to her.
I broke away and ran down the hall to his room. His bed was empty. Grandpa had died. No one told me.
Grandpa never got to eat the peanut butter and jelly sandwich with the crust cut off.
Maybe if he had, things would have turned out differently.
Teaching Versus Nonteaching Medical Services
The most seriously ill medical patients are often admitted to an academic institution and taken care of on a teaching service.14 Previously published reports have found that, despite substantial differences in case mix, being admitted to a teaching hospital is associated with reduced morbidity and risk‐adjusted mortality for various conditions compared with receiving care delivered at a nonacademic hospital.2, 513 For example, among 248 major teaching, minor teaching, and nonteaching hospitals in New York state, Polanczyk et al. found that major teaching hospital status was an important determinant of outcomes in patients hospitalized with myocardial infarction, heart failure, or stroke.1
Some studies have noted that the high cost of care at teaching hospitals may offset these potential benefits.1, 6, 12, 13 In a retrospective analysis of 2674 Medicare patients, Taylor et al. determined that adjusted mortality rates were usually lower and Medicare payments usually higher in major teaching hospitals than in for‐profit hospitals.13 However, in a study of 80,851 patients admitted to 39 hospitals in northeastern Ohio, Rosenthal et al. reported both lower hospital mortality and shorter length of hospital stay (LOS) of patients admitted to major teaching hospitals than of patients admitted to nonteaching hospitals.12
Understanding the differences in economic and clinical outcomes between teaching and nonteaching medical services is topical in today's health care environment. Comparisons across institutions are inherently cumbersome because of the number of variables, other than teaching status, that can potentially contribute to differences in outcomes. A study comparing teaching and nonteaching services within a single institution could provide results unencumbered by such confounding factors. Accordingly, we sought to compare the teaching service with the nonteaching service at our academic community hospital to see if there were notable differences between the 2 services in case mix, costs, and clinical outcomes.
PATIENTS AND METHODS
Our analysis was based on administrative data for 2189 patients who were admitted to a 450‐bed university‐affiliated community hospital from February through October 2002 and assigned to 1 of the 3 teaching services staffed by residents in internal medicine and a faculty attending (n = 1637) or to a nonteaching service staffed by hospitalists or clinic‐based internists (n = 552).
Care on the nonteaching service was provided by 4 hospitalists and 12 clinic‐based internists. The nonteaching service generally had no interns or residents but occasionally had a third‐ or fourth‐year medical student on rotation. Care on the teaching services was provided under the supervision of 5 hospitalists and 18 clinic‐based internists. The day‐to‐day clinical decisions on the teaching services were made by the upper‐level resident (PGY‐2 or ‐3) assigned to the particular service, with the attending physicians acting in a supervisory role. Four of the 5 hospitalists rotated between nonteaching and teaching services. Cross‐coverage for teaching services was provided by other residents (by a night float team that rotated monthly), whereas a night attending only provided coverage for the nonteaching service. Patient handoffs occurred more commonly on the nonteaching service, where attendings rotated every 1‐2 weeks compared with the teaching services, where interns and residents rotated monthly and attendings changed every 2‐4 weeks.
All admissions to the medical services were screened and approved by either the chief medical resident or a designated faculty member who carried the departmental admission pager. Patients were randomly allocated to the respective teams based on patient load, in accordance with ACGME‐ and residency programimposed limits, rather than according to patient diagnoses. Differences between groups in severity of illness were minimized by limiting levels of acuity and including only patients admitted to the medical ward and not to the intensive care, coronary care, or intermediate care units. Patients on both model services were admitted to geographically shared wards with the same nursing staff and other ancillary personnel. All residents and faculty had similar access to hospital resources such as academic meetings, clinical protocols, practice‐based guidelines, and quality improvement initiatives.
The main outcome measures were total hospital costs; LOS; hospital readmission within 30 days; in‐hospital mortality; number of tests and procedures ordered; and pharmacy, laboratory, radiology, and procedural costs and costs for physical, speech, occupational, and respiratory therapy consultations. Financial data for patient care excluding physician fees were based on actual direct and indirect costs and were estimated using an activity‐based system (Transition Systems, Inc., Eclypsis Corporation, Boca Raton, FL). Department‐specific costs represented actual variable costs and did not include indirect (overhead) costs. Hospital length of stay was defined as the number of days from the time a patient was admitted to the general medicine service to the day discharged from the hospital, even if the patient was transferred to another service before discharge. Hospital readmission for the same primary diagnosis within 30 days after discharge was used to compare the quality of care on the 2 types of services.
We assessed the case mix on the 2 services by comparing the distribution of the 10 most frequent diagnosis‐related groups (DRGs) in the data set, plus angina, arrhythmia, and hypertension combined into a single category (Table 1). The chi‐square test was used to test differences between the 2 services in the proportion of each DRG. To obtain a surrogate index for case severity, the list of coexisting or comorbid conditions present at the time of admission was used to calculate the mean number of comorbidities per patient. The morbidity experience of the 2 patient populations was compared using the Student t test for 2 independent samples.
| Variable | Teaching service | Nonteaching service | P Value |
|---|---|---|---|
| |||
| Number of patients | 1637 | 552 | |
| Mean age SD (years) | 67.1 19.2 | 67.5 18.3 | 0.64 |
| Men (%) | 760 (46.4) | 276 (50) | 0.15 |
| Deaths (%) | 61 (3.7) | 25 (4.5) | 0.40 |
| Mean number of comorbidities per patient SD | 6.7 4.2 | 6.7 4.3 | 0.99 |
| Insurance (%) | 0.12 | ||
| Commercial | 352 (21.5) | 109 (17.8) | |
| Medicare | 1095 (66.9) | 374 (67.8) | |
| Medicaid | 77 (4.7) | 31 (5.6) | |
| Self‐pay | 93 (5.7) | 24 (4.4) | |
| Others | 20 (1.2) | 14 (2.5) | |
| Common diagnoses by DRG* (%) | |||
| Community‐acquired pneumonia | 140 (8.6) | 45 (8.2) | 0.84 |
| Gastrointestinal bleed | 89 (5.4) | 30 (5.4) | 1.00 |
| Congestive heart failure | 75 (4.6) | 25 (4.5) | 1.00 |
| COPD | 55 (3.4) | 20 (3.6) | 0.87 |
| Metabolic disorders | 45 (2.8) | 28 (5.1) | 0.01 |
| CVA | 61 (3.7) | 11 (2.0) | 0.07 |
| Other respiratory infections | 60 (3.7) | 9 (1.6) | 0.03 |
| Gastroenteritis | 42 (2.6) | 17 (3.1) | 0.62 |
| Septicemia | 41 (2.5) | 15 (2.7) | 0.91 |
| Urinary tract infection | 42 (2.6) | 13 (2.4) | 0.91 |
| Angina, arrhythmia, or hypertension | 41 (2.5) | 13 (2.4) | 0.97 |
We compared the main outcome measures for teaching and nonteaching services using 3 analytic methods. First, the crude difference in total costs, service‐ and diagnosis‐specific costs, and length of hospital stay and the unadjusted odds ratio for readmission, in‐hospital mortality, and services ordered were calculated. The Student t test for 2 independent samples was used to compare total cost, LOS, and DRG‐specific and service‐specific costs. The chi‐square test was used to compare readmission rate, in‐hospital mortality, and number of services ordered. Second, we used multiple linear regression and logistic regression analyses to estimate the difference in the main outcome measures of the 2 medical services, adjusted for age, sex, insurance classification, number of comorbidities, and primary DRGs. The Wald test was used to obtain P values for testing differences between teaching and nonteaching services.
In observational studies, multiple linear regression models are commonly used to remove the effects of confounding factors. However, regression methods do not ensure the balance in the distribution of covariates, and imbalance becomes more problematic as the number of covariates increases. To manage the imbalance of case mix and other potential confounders, we used a propensity score method to balance confounding variables between the 2 groups.17 Specifically, by performing logistic regression with the potential confounding variables as covariates, we estimated the propensity score or the probability of being assigned to the teaching services for each patient (Tables 2 and 3). The collection of multiple characteristics was collapsed into a single composite score called the propensity score, and this score was used as if it were the only confounding variable. Patients were stratified to quintiles based on their propensity score, and the balance of the distribution of each potential confounder in the 5 propensity strata was checked, and we estimated the overall difference between the 2 medical services with the weighted average of the strata‐specific difference, where the weights were proportional to the stratum size. The Z test was used to derive P values for comparing the total hospital costs, LOS, and service‐specific costs of the 2 medical services. The Mantel‐Haenszel test was used to determine whether the 2 medical services had the same risk of readmission, death, and frequency of diagnostic or consultation services ordered. In all analyses we report P values without adjusting for multiple comparisons. The significance level of hypothesis testing was set at .05.
| Variable | Crude method | Multiple linear regression | Propensity score method | ||||||
|---|---|---|---|---|---|---|---|---|---|
| Difference | SE | P Value | Difference | SE | P Value | Difference | SE | P Value | |
| |||||||||
| Overall costs | 4 | 341 | 0.99 | 61 | 310 | .84 | 130 | 336 | 0.70 |
| Length of hospital stay | 0.18 | 0.23 | 0.43 | 0.13 | 0.22 | .54 | 0.08 | 0.23 | 0.73 |
| Service‐specific costs | |||||||||
| Laboratory | 127 | 55 | 0.02 | 145 | 53 | .01 | 148 | 55 | 0.01 |
| Pharmacy | 4 | 23 | 0.85 | 8 | 25 | .76 | 12 | 23 | 0.61 |
| Radiology | 38 | 15 | 0.01 | 42 | 20 | .03 | 42 | 15 | 0.01 |
| Speech therapy | 0.1 | 0.8 | 0.95 | 0.3 | 0.7 | .64 | 0.1 | 0.8 | 0.87 |
| Physical therapy | 0.6 | 1.0 | 0.52 | 0.7 | 1.0 | .46 | 0.7 | 1.0 | 0.46 |
| Occupation therapy | 0.5 | 0.6 | 0.43 | 0.4 | 0.8 | .57 | 0.5 | 0.6 | 0.41 |
| Respiratory therapy | 5 | 6 | 0.42 | 3 | 6 | .56 | 4 | 6 | 0.47 |
| Pulmonary function tests | 0.002 | 0.1 | 0.99 | 0.03 | 0.1 | .80 | 0.04 | 0.1 | 0.75 |
| GI endoscopy | 0.2 | 1.9 | 0.94 | 0.9 | 2.2 | .70 | 0.6 | 1.9 | 0.73 |
| Variable | Crude method | Multiple linear regression | Propensity score method | ||||||
|---|---|---|---|---|---|---|---|---|---|
| Odds ratio | SE | P Value | Odds ratio | SE | P Value | Odds ratio | SE | P Value | |
| |||||||||
| Readmission | 1.22 | 0.19 | .21 | 1.25 | 0.20 | .17 | 1.26 | 0.20 | .15 |
| In‐hospital mortality | 0.82 | 0.20 | .40 | 0.76 | 0.19 | .28 | 0.82 | 0.20 | .41 |
| Service/consultant ordered | |||||||||
| Laboratory | 1.89 | 0.92 | .18 | 1.81 | 0.92 | .24 | 1.88 | 0.92 | .20 |
| Pharmacy | 0.74 | 0.83 | .79 | 0.75 | 0.84 | .80 | 1.02 | 1.14 | .99 |
| Radiology | 1.07 | 0.15 | .61 | 1.09 | 0.16 | .58 | 1.09 | 0.15 | .55 |
| Speech therapy | 1.18 | 0.23 | .39 | 0.87 | 0.19 | .53 | 1.07 | 0.21 | .75 |
| Physical therapy | 0.99 | 0.10 | .94 | 0.98 | 0.11 | .86 | 1.01 | 0.10 | .94 |
| Occupation therapy | 1.18 | 0.14 | .17 | 1.14 | 0.15 | .30 | 1.19 | 0.15 | .17 |
| Respiratory therapy | 1.14 | 0.11 | .19 | 1.16 | 0.13 | .18 | 1.14 | 0.11 | .19 |
| Pulmonary function tests | 0.97 | 0.24 | .89 | 0.89 | 0.23 | .65 | 0.90 | 0.22 | .68 |
| GI endoscopy | 0.75 | 0.16 | .18 | 0.79 | 0.19 | .33 | 0.79 | 0.17 | .27 |
RESULTS
The study consisted of 2189 patients (1036 men) whose mean age was 67.2 years (SD = 19.0 years). Patient demographics and frequencies of various DRGs on the 2 services are shown in Table 1. The distribution of insurance classifications (eg, third‐party payer, Medicare, Medicaid, private pay) wase comparable between teaching and nonteaching groups. No statistically significant differences between the 2 services in patient characteristics and distribution of the 10 most common DRGs in the data set were observed except for patients with metabolic disorders (P = .01) and other respiratory infections (P = .03). The mean number of comorbidities was also comparable between teaching and nonteaching services (6.7 vs. 6.7; P = .99).
Care on the teaching service was not associated with a significant increase in overall costs per patient ($5572 vs. $5576, P = .99). Crude comparison of other main outcome measures showed that the LOS (4.92 vs. 5.10 days; P = .43), odds of readmission within 30 days (202/1637 vs. 57/552; P = .21), and odds of in‐hospital mortality (61/1637 vs. 25/552; P = .40) were comparable for teaching and nonteaching services (Tables 2 and 3). Using multiple linear regression analysis, the estimated adjusted differences were only $61 (P = .84) in overall costs and 0.13 days (P = .54) in LOS between teaching and nonteaching services. Estimated adjusted risk of readmission within 30 days was 25% higher (P = .17), and in‐hospital mortality was 24% lower (P = .28) for patients treated on the medical teaching services. Using the propensity score method, the estimated difference between teaching and nonteaching services was $130 (P = .70) in overall costs and 0.08 days (P = .73) in length of stay. Risk of readmission within 30 days was 26% higher (P = .15), and in‐hospital mortality was 18% lower (P = .41) for the teaching service. Because the distributions of overall costs and length of stay were heavily skewed, we also performed statistical analyses using logarithm‐transformed data on these 2 outcomes. The results using all 4 analytic methods showed that care on the teaching services was not associated with statistically significant differences in total hospital costs, LOS, risk of readmission, and in‐hospital mortality.
Service‐specific cost analyses showed that mean laboratory costs per patient ($937 vs. $810; P = .02) and mean radiology costs per patient ($134 vs. $96; P = .01) were higher for teaching services, whereas costs for the pharmacy ($233 vs. $229; P = .85) and for speech therapy ($2.4 vs. $2.4; P = .95), physical therapy ($6.6 vs. $7.2; P = .52), occupational therapy ($3.9 vs. $3.4; P = .43), respiratory therapy ($46 vs. $41; P = .42), pulmonary function testing ($0.4 vs. $0.4; P = .99), and GI endoscopy procedures ($5.9 vs. $5.8; P = .94) were not significantly different. A comparison of the number of consults or tests ordered indicated physicians on the teaching service did not order more radiology (1411/1637 vs. 471/552; P = .61), speech therapy (128/1637 vs. 37/552; P = .39), physical therapy (611/1637 vs. 207/552; P = .94), occupational therapy (369/1637 vs. 109/552; P = .17), respiratory therapy (893/1637 vs. 283/552; P = .19), or pulmonary function testing (75/1637 vs. 27/552; P = .89) consultations or GI endoscopy procedures (188/1637 vs. 65/552; P = .18). Inferential results derived by multiple linear regression and logistic regression analyses, as well as the propensity score method, all agreed with the results derived using crude comparisons and concluded that, except for laboratory and radiology costs, patients treated on the teaching services did not have higher service‐specific costs or more therapies and consultations.
To remove the potential confounding effects of the 5 hospitalists who rotated between teaching and nonteaching services, we removed 875 patients (125 on the nonteaching and 750 on the teaching service) from the original data set who were cared for by these physicians, and repeated crude, multivariate, and propensity score analyses. In the data subset (Tables 4 and 5), laboratory costs remained higher on the teaching service, but the difference in radiology costs between teaching and nonteaching services seen in the total data set diminished and did not remain statistically significant when hospitalists were excluded from the analysis.
| Variable | Crude method | Multiple linear regression | Propensity score method | ||||||
|---|---|---|---|---|---|---|---|---|---|
| Difference* | SE | P Value | Difference | SE | P Value | Difference | SE | P Value | |
| |||||||||
| Overall costs | 59 | 424 | .89 | 31 | 378 | .93 | 94 | 410 | .82 |
| Length of hospital stay | 0.18 | 0.28 | .52 | 0.18 | 0.26 | .49 | 0.13 | 0.27 | .63 |
| Service‐specific costs | |||||||||
| Laboratory | 163 | 69 | .02 | 157 | 66 | .02 | 155 | 68 | .02 |
| Pharmacy | 28 | 27 | .30 | 26 | 30 | .39 | 30 | 26 | .25 |
| Radiology | 36 | 19 | .06 | 37 | 23 | .11 | 38 | 17 | .03 |
| Speech therapy | 0.2 | 1.0 | .82 | 0.8 | 0.9 | .36 | 0.53 | 0.97 | .59 |
| Physical therapy | 1.9 | 1.2 | .11 | 2.1 | 1.0 | .03 | 2.0 | 1.1 | .07 |
| Occupation therapy | 0.01 | 0.7 | .99 | 0.16 | 0.7 | .81 | 0.07 | 0.67 | .92 |
| Respiratory therapy | 6.2 | 7.6 | .42 | 3.1 | 7.9 | .70 | 4.0 | 7.5 | .60 |
| Pulmonary function | 0.13 | 0.16 | .39 | 0.18 | 0.16 | .25 | 0.17 | 0.16 | .28 |
| GI endoscopy procedures | 1.8 | 1.9 | .33 | 1.5 | 2.1 | .49 | 1.72 | 1.65 | .30 |
| Variable | Crude method | Multiple linear regression | Propensity Score Method | ||||||
|---|---|---|---|---|---|---|---|---|---|
| Odds ratio | SE | P Value* | Odds ratio | SE | P Value | Odds ratio | SE | P Value | |
| |||||||||
| Re‐admission | 1.41 | 0.27 | .07 | 1.43 | 0.28 | .07 | 1.44 | 0.27 | .06 |
| In‐hospital mortality | 0.89 | 0.25 | .67 | 0.83 | 0.25 | .52 | 0.89 | 0.26 | .68 |
| Service/consultant ordered | .54 | ||||||||
| Laboratory | 1.49 | 0.88 | .50 | 1.30 | 0.82 | .67 | 1.44 | 0.86 | .85 |
| Pharmacy | 1.04 | 1.28 | .97 | 0.78 | 0.98 | .84 | 1.27 | 1.56 | .91 |
| Radiology | 1.00 | 0.17 | .97 | 0.97 | 0.17 | .85 | 0.98 | 0.17 | .79 |
| Speech therapy | 1.30 | 0.31 | .27 | 0.87 | 0.24 | .60 | 1.07 | 0.26 | .93 |
| Physical therapy | 1.03 | 0.12 | .81 | 1.00 | 0.13 | 1.00 | 1.01 | 0.12 | .57 |
| Occupation therapy | 1.12 | 0.16 | .44 | 1.06 | 0.17 | .70 | 1.09 | 0.16 | .34 |
| Respiratory therapy | 1.15 | 0.14 | .24 | 1.16 | 0.15 | .26 | 1.12 | 0.13 | .10 |
| Pulmonary function | 0.69 | 0.20 | .19 | 0.64 | 0.19 | .13 | 0.63 | 0.18 | .64 |
| GI endoscopy procedures | 0.96 | 0.31 | .90 | 0.85 | 0.30 | .64 | 0.86 | 0.28 | |
DISCUSSION
We found that care delivered on the resident‐based teaching services at our academic community hospital was not associated with increases in overall costs, pharmacy costs, or consultative services ordered, although laboratory‐related costs and radiology costs were slightly higher than for the nonteaching service. In addition, clinical outcomes were not significantly different between teaching and nonteaching services in terms of hospital length of stay, in‐hospital mortality, and 30‐day readmission rate.
Several previous interinstitutional studies have documented greater utilization of resources at academic medical centers as a tradeoff for improved clinical outcomes.2, 4, 12, 13 One frequently offered explanation for higher costs at teaching hospitals is the purported tendency of resident physicians to order more tests and consults and to more heavily rely on modern diagnostic and therapeutic modalities. Apart from the number of tests and procedures ordered, differences in administrative, personnel, and other nonshared costs may account for higher overall costs at teaching hospitals reported in earlier studies. These variables, however, did not differ in our comparison of teaching and nonteaching services within the same institution because they were equally shared.
Studies that have looked at the hospitalist experience at academic centers and community hospitals have demonstrated improved efficiency associated with the use of hospitalist physicians.1517 At the University of Chicago, hospitalist care was associated with lower costs and short‐term mortality in the second year of hospitalist experience.15, 16 The authors suggested that disease‐specific physician experience in the hospitalist model may lead to reduced resource consumption and improved patient outcomes. The focus of our study was not a comparison of hospitalist with nonhospitalist models. However, when we excluded patients cared for by hospitalist physicians from our costs, services, and outcomes analyses, laboratory costs remained the only significant difference between teaching and nonteaching services.
Other than teaching hospital status and use of hospitalist physicians, institutional characteristics that can potentially influence clinical outcomes include hospital size, location, ownership, case mix, access to on‐site specialized diagnostic and therapeutic equipment, and availability of specialty services.15, 16 However, all these variables were identical in our study of teaching versus nonteaching services within the same community hospital, thereby allowing an uncontaminated estimation of the effect of teaching status on resource utilization and clinical outcomes. Although both teaching and nonteaching services were sometimes headed by attendings who participated in both models, teaching services differed notably in being run by resident team leaders with attendings performing a largely supervisory role.
We recognize several limitations of our study. Patients were quasirandomly triaged to teaching and nonteaching services according to patient loads without any consideration for diagnoses, comorbidities, or severity of illness. Therefore, it is quite possible there were unascertainable differences in disease severity and case mix between the teaching and nonteaching services. Notably, there was some discordance in the number of patients with nonpneumonia respiratory infection and the number with metabolic disorders assigned between the 2 services. However, 8 of the 10 most common primary diagnoses in the data set were similarly distributed between the 2 services, and the mean number of secondary diagnoses per patient was also not statistically different. More importantl we employed multiple regression analysis and a propensity score method to account for any imbalance in case mix and other potential confounders such as sex, age, and insurance classifications. These advanced statistical methods produced results similar to the unadjusted method and, hence, strengthen our conclusion that care delivered on the resident‐based teaching services at our academic community hospital was not significantly associated with increases in overall patient care costs, LOS, readmission rate, or in‐hospital mortality. Having hospitalist physicians on both teaching and nonteaching services may have had some effect on the practice patterns of other physicians, creating greater similarities than might have been expected otherwise. Data used in this study were obtained from only 1 academic institution, and caution should be exercised in extrapolating our findings to other settings unless substantiated by other studies.
- ,,,,,.Hospital outcomes in major teaching, minor teaching, and non‐teaching hospitals in New York State.Am J Med.2002;112:255–261.
- ,,, et al.Value and cost of teaching hospitals: A prospective, multicenter, inception cohort study.Crit Care Med.1994;22:1706–1709.
- ,,, et al.Comparison of surgical outcomes between teaching and non‐teaching hospitals in the Department of Veterans Affairs.Ann Surg.2001;234:370–382.
- ,,,.Effect of academic affiliation and obstetric volume on clinical outcome and cost of childbirth.Obstet Gynecol.2001;97:567–576.
- ,,.Community‐acquired bacteremia at a teaching versus a non‐teaching hospital: Impact of acute severity of illness on 30‐day mortality.Am J Infect Control.2001;29:13–19.
- ,,, et al.Pulmonary sarcoidosis: comparison of patients at a university and a municipal hospital.J Natl Med Assoc.1999;91:322–327.
- ,,,,,.Use of medical resources, complication, and long‐term outcome in patients hospitalized with acute chest pain. Comparison between a city university hospital and a county hospital.Int J Cardiol.2002;85:229–238.
- ,,.Breast cancer survival by teaching status of the initial treating hospital.CMAJ.2001;164:183–188.
- ,,, et al.Relationship of hospital teaching status with quality of care and mortality for Medicare patients with acute MI.JAMA.2000;284:1256–1262.
- ,,, et al.Outcome of acute myocardial infarction according to the specialty of the admitting physician.N Engl J Med.1996;335:1880–1887.
- ,,, et al.Quality of care at teaching and non‐teaching hospitals.JAMA.2000;284:1220–1222.
- ,,, et al.Severity‐adjusted mortality and length of stay in teaching and non‐teaching hospitals.JAMA.1997;278:485–490.
- ,,.Effects of admission to a teaching hospital and the cost and quality of care for Medicare beneficiaries.N Engl J Med.1999;340:293–299.
- ,,, et al.Effects of physician experience on costs and outcomes on an academic general medicine service: Results of a trial of hospitalists.Ann Intern Med.2002;137:866–874.
- ,,,,,.Implementation of a voluntary hospitalist service at a community teaching hospital: Improved clinical efficiency and patient outcomes.Ann Intern Med2002;137:859–865.
- .,. et al.Hospital characteristics and quality of care.JAMA.1992;268:1709–1714.
- and.The central role of the propensity score in observational studies for causal effects.Biometrika.1983;70:41–55.
The most seriously ill medical patients are often admitted to an academic institution and taken care of on a teaching service.14 Previously published reports have found that, despite substantial differences in case mix, being admitted to a teaching hospital is associated with reduced morbidity and risk‐adjusted mortality for various conditions compared with receiving care delivered at a nonacademic hospital.2, 513 For example, among 248 major teaching, minor teaching, and nonteaching hospitals in New York state, Polanczyk et al. found that major teaching hospital status was an important determinant of outcomes in patients hospitalized with myocardial infarction, heart failure, or stroke.1
Some studies have noted that the high cost of care at teaching hospitals may offset these potential benefits.1, 6, 12, 13 In a retrospective analysis of 2674 Medicare patients, Taylor et al. determined that adjusted mortality rates were usually lower and Medicare payments usually higher in major teaching hospitals than in for‐profit hospitals.13 However, in a study of 80,851 patients admitted to 39 hospitals in northeastern Ohio, Rosenthal et al. reported both lower hospital mortality and shorter length of hospital stay (LOS) of patients admitted to major teaching hospitals than of patients admitted to nonteaching hospitals.12
Understanding the differences in economic and clinical outcomes between teaching and nonteaching medical services is topical in today's health care environment. Comparisons across institutions are inherently cumbersome because of the number of variables, other than teaching status, that can potentially contribute to differences in outcomes. A study comparing teaching and nonteaching services within a single institution could provide results unencumbered by such confounding factors. Accordingly, we sought to compare the teaching service with the nonteaching service at our academic community hospital to see if there were notable differences between the 2 services in case mix, costs, and clinical outcomes.
PATIENTS AND METHODS
Our analysis was based on administrative data for 2189 patients who were admitted to a 450‐bed university‐affiliated community hospital from February through October 2002 and assigned to 1 of the 3 teaching services staffed by residents in internal medicine and a faculty attending (n = 1637) or to a nonteaching service staffed by hospitalists or clinic‐based internists (n = 552).
Care on the nonteaching service was provided by 4 hospitalists and 12 clinic‐based internists. The nonteaching service generally had no interns or residents but occasionally had a third‐ or fourth‐year medical student on rotation. Care on the teaching services was provided under the supervision of 5 hospitalists and 18 clinic‐based internists. The day‐to‐day clinical decisions on the teaching services were made by the upper‐level resident (PGY‐2 or ‐3) assigned to the particular service, with the attending physicians acting in a supervisory role. Four of the 5 hospitalists rotated between nonteaching and teaching services. Cross‐coverage for teaching services was provided by other residents (by a night float team that rotated monthly), whereas a night attending only provided coverage for the nonteaching service. Patient handoffs occurred more commonly on the nonteaching service, where attendings rotated every 1‐2 weeks compared with the teaching services, where interns and residents rotated monthly and attendings changed every 2‐4 weeks.
All admissions to the medical services were screened and approved by either the chief medical resident or a designated faculty member who carried the departmental admission pager. Patients were randomly allocated to the respective teams based on patient load, in accordance with ACGME‐ and residency programimposed limits, rather than according to patient diagnoses. Differences between groups in severity of illness were minimized by limiting levels of acuity and including only patients admitted to the medical ward and not to the intensive care, coronary care, or intermediate care units. Patients on both model services were admitted to geographically shared wards with the same nursing staff and other ancillary personnel. All residents and faculty had similar access to hospital resources such as academic meetings, clinical protocols, practice‐based guidelines, and quality improvement initiatives.
The main outcome measures were total hospital costs; LOS; hospital readmission within 30 days; in‐hospital mortality; number of tests and procedures ordered; and pharmacy, laboratory, radiology, and procedural costs and costs for physical, speech, occupational, and respiratory therapy consultations. Financial data for patient care excluding physician fees were based on actual direct and indirect costs and were estimated using an activity‐based system (Transition Systems, Inc., Eclypsis Corporation, Boca Raton, FL). Department‐specific costs represented actual variable costs and did not include indirect (overhead) costs. Hospital length of stay was defined as the number of days from the time a patient was admitted to the general medicine service to the day discharged from the hospital, even if the patient was transferred to another service before discharge. Hospital readmission for the same primary diagnosis within 30 days after discharge was used to compare the quality of care on the 2 types of services.
We assessed the case mix on the 2 services by comparing the distribution of the 10 most frequent diagnosis‐related groups (DRGs) in the data set, plus angina, arrhythmia, and hypertension combined into a single category (Table 1). The chi‐square test was used to test differences between the 2 services in the proportion of each DRG. To obtain a surrogate index for case severity, the list of coexisting or comorbid conditions present at the time of admission was used to calculate the mean number of comorbidities per patient. The morbidity experience of the 2 patient populations was compared using the Student t test for 2 independent samples.
| Variable | Teaching service | Nonteaching service | P Value |
|---|---|---|---|
| |||
| Number of patients | 1637 | 552 | |
| Mean age SD (years) | 67.1 19.2 | 67.5 18.3 | 0.64 |
| Men (%) | 760 (46.4) | 276 (50) | 0.15 |
| Deaths (%) | 61 (3.7) | 25 (4.5) | 0.40 |
| Mean number of comorbidities per patient SD | 6.7 4.2 | 6.7 4.3 | 0.99 |
| Insurance (%) | 0.12 | ||
| Commercial | 352 (21.5) | 109 (17.8) | |
| Medicare | 1095 (66.9) | 374 (67.8) | |
| Medicaid | 77 (4.7) | 31 (5.6) | |
| Self‐pay | 93 (5.7) | 24 (4.4) | |
| Others | 20 (1.2) | 14 (2.5) | |
| Common diagnoses by DRG* (%) | |||
| Community‐acquired pneumonia | 140 (8.6) | 45 (8.2) | 0.84 |
| Gastrointestinal bleed | 89 (5.4) | 30 (5.4) | 1.00 |
| Congestive heart failure | 75 (4.6) | 25 (4.5) | 1.00 |
| COPD | 55 (3.4) | 20 (3.6) | 0.87 |
| Metabolic disorders | 45 (2.8) | 28 (5.1) | 0.01 |
| CVA | 61 (3.7) | 11 (2.0) | 0.07 |
| Other respiratory infections | 60 (3.7) | 9 (1.6) | 0.03 |
| Gastroenteritis | 42 (2.6) | 17 (3.1) | 0.62 |
| Septicemia | 41 (2.5) | 15 (2.7) | 0.91 |
| Urinary tract infection | 42 (2.6) | 13 (2.4) | 0.91 |
| Angina, arrhythmia, or hypertension | 41 (2.5) | 13 (2.4) | 0.97 |
We compared the main outcome measures for teaching and nonteaching services using 3 analytic methods. First, the crude difference in total costs, service‐ and diagnosis‐specific costs, and length of hospital stay and the unadjusted odds ratio for readmission, in‐hospital mortality, and services ordered were calculated. The Student t test for 2 independent samples was used to compare total cost, LOS, and DRG‐specific and service‐specific costs. The chi‐square test was used to compare readmission rate, in‐hospital mortality, and number of services ordered. Second, we used multiple linear regression and logistic regression analyses to estimate the difference in the main outcome measures of the 2 medical services, adjusted for age, sex, insurance classification, number of comorbidities, and primary DRGs. The Wald test was used to obtain P values for testing differences between teaching and nonteaching services.
In observational studies, multiple linear regression models are commonly used to remove the effects of confounding factors. However, regression methods do not ensure the balance in the distribution of covariates, and imbalance becomes more problematic as the number of covariates increases. To manage the imbalance of case mix and other potential confounders, we used a propensity score method to balance confounding variables between the 2 groups.17 Specifically, by performing logistic regression with the potential confounding variables as covariates, we estimated the propensity score or the probability of being assigned to the teaching services for each patient (Tables 2 and 3). The collection of multiple characteristics was collapsed into a single composite score called the propensity score, and this score was used as if it were the only confounding variable. Patients were stratified to quintiles based on their propensity score, and the balance of the distribution of each potential confounder in the 5 propensity strata was checked, and we estimated the overall difference between the 2 medical services with the weighted average of the strata‐specific difference, where the weights were proportional to the stratum size. The Z test was used to derive P values for comparing the total hospital costs, LOS, and service‐specific costs of the 2 medical services. The Mantel‐Haenszel test was used to determine whether the 2 medical services had the same risk of readmission, death, and frequency of diagnostic or consultation services ordered. In all analyses we report P values without adjusting for multiple comparisons. The significance level of hypothesis testing was set at .05.
| Variable | Crude method | Multiple linear regression | Propensity score method | ||||||
|---|---|---|---|---|---|---|---|---|---|
| Difference | SE | P Value | Difference | SE | P Value | Difference | SE | P Value | |
| |||||||||
| Overall costs | 4 | 341 | 0.99 | 61 | 310 | .84 | 130 | 336 | 0.70 |
| Length of hospital stay | 0.18 | 0.23 | 0.43 | 0.13 | 0.22 | .54 | 0.08 | 0.23 | 0.73 |
| Service‐specific costs | |||||||||
| Laboratory | 127 | 55 | 0.02 | 145 | 53 | .01 | 148 | 55 | 0.01 |
| Pharmacy | 4 | 23 | 0.85 | 8 | 25 | .76 | 12 | 23 | 0.61 |
| Radiology | 38 | 15 | 0.01 | 42 | 20 | .03 | 42 | 15 | 0.01 |
| Speech therapy | 0.1 | 0.8 | 0.95 | 0.3 | 0.7 | .64 | 0.1 | 0.8 | 0.87 |
| Physical therapy | 0.6 | 1.0 | 0.52 | 0.7 | 1.0 | .46 | 0.7 | 1.0 | 0.46 |
| Occupation therapy | 0.5 | 0.6 | 0.43 | 0.4 | 0.8 | .57 | 0.5 | 0.6 | 0.41 |
| Respiratory therapy | 5 | 6 | 0.42 | 3 | 6 | .56 | 4 | 6 | 0.47 |
| Pulmonary function tests | 0.002 | 0.1 | 0.99 | 0.03 | 0.1 | .80 | 0.04 | 0.1 | 0.75 |
| GI endoscopy | 0.2 | 1.9 | 0.94 | 0.9 | 2.2 | .70 | 0.6 | 1.9 | 0.73 |
| Variable | Crude method | Multiple linear regression | Propensity score method | ||||||
|---|---|---|---|---|---|---|---|---|---|
| Odds ratio | SE | P Value | Odds ratio | SE | P Value | Odds ratio | SE | P Value | |
| |||||||||
| Readmission | 1.22 | 0.19 | .21 | 1.25 | 0.20 | .17 | 1.26 | 0.20 | .15 |
| In‐hospital mortality | 0.82 | 0.20 | .40 | 0.76 | 0.19 | .28 | 0.82 | 0.20 | .41 |
| Service/consultant ordered | |||||||||
| Laboratory | 1.89 | 0.92 | .18 | 1.81 | 0.92 | .24 | 1.88 | 0.92 | .20 |
| Pharmacy | 0.74 | 0.83 | .79 | 0.75 | 0.84 | .80 | 1.02 | 1.14 | .99 |
| Radiology | 1.07 | 0.15 | .61 | 1.09 | 0.16 | .58 | 1.09 | 0.15 | .55 |
| Speech therapy | 1.18 | 0.23 | .39 | 0.87 | 0.19 | .53 | 1.07 | 0.21 | .75 |
| Physical therapy | 0.99 | 0.10 | .94 | 0.98 | 0.11 | .86 | 1.01 | 0.10 | .94 |
| Occupation therapy | 1.18 | 0.14 | .17 | 1.14 | 0.15 | .30 | 1.19 | 0.15 | .17 |
| Respiratory therapy | 1.14 | 0.11 | .19 | 1.16 | 0.13 | .18 | 1.14 | 0.11 | .19 |
| Pulmonary function tests | 0.97 | 0.24 | .89 | 0.89 | 0.23 | .65 | 0.90 | 0.22 | .68 |
| GI endoscopy | 0.75 | 0.16 | .18 | 0.79 | 0.19 | .33 | 0.79 | 0.17 | .27 |
RESULTS
The study consisted of 2189 patients (1036 men) whose mean age was 67.2 years (SD = 19.0 years). Patient demographics and frequencies of various DRGs on the 2 services are shown in Table 1. The distribution of insurance classifications (eg, third‐party payer, Medicare, Medicaid, private pay) wase comparable between teaching and nonteaching groups. No statistically significant differences between the 2 services in patient characteristics and distribution of the 10 most common DRGs in the data set were observed except for patients with metabolic disorders (P = .01) and other respiratory infections (P = .03). The mean number of comorbidities was also comparable between teaching and nonteaching services (6.7 vs. 6.7; P = .99).
Care on the teaching service was not associated with a significant increase in overall costs per patient ($5572 vs. $5576, P = .99). Crude comparison of other main outcome measures showed that the LOS (4.92 vs. 5.10 days; P = .43), odds of readmission within 30 days (202/1637 vs. 57/552; P = .21), and odds of in‐hospital mortality (61/1637 vs. 25/552; P = .40) were comparable for teaching and nonteaching services (Tables 2 and 3). Using multiple linear regression analysis, the estimated adjusted differences were only $61 (P = .84) in overall costs and 0.13 days (P = .54) in LOS between teaching and nonteaching services. Estimated adjusted risk of readmission within 30 days was 25% higher (P = .17), and in‐hospital mortality was 24% lower (P = .28) for patients treated on the medical teaching services. Using the propensity score method, the estimated difference between teaching and nonteaching services was $130 (P = .70) in overall costs and 0.08 days (P = .73) in length of stay. Risk of readmission within 30 days was 26% higher (P = .15), and in‐hospital mortality was 18% lower (P = .41) for the teaching service. Because the distributions of overall costs and length of stay were heavily skewed, we also performed statistical analyses using logarithm‐transformed data on these 2 outcomes. The results using all 4 analytic methods showed that care on the teaching services was not associated with statistically significant differences in total hospital costs, LOS, risk of readmission, and in‐hospital mortality.
Service‐specific cost analyses showed that mean laboratory costs per patient ($937 vs. $810; P = .02) and mean radiology costs per patient ($134 vs. $96; P = .01) were higher for teaching services, whereas costs for the pharmacy ($233 vs. $229; P = .85) and for speech therapy ($2.4 vs. $2.4; P = .95), physical therapy ($6.6 vs. $7.2; P = .52), occupational therapy ($3.9 vs. $3.4; P = .43), respiratory therapy ($46 vs. $41; P = .42), pulmonary function testing ($0.4 vs. $0.4; P = .99), and GI endoscopy procedures ($5.9 vs. $5.8; P = .94) were not significantly different. A comparison of the number of consults or tests ordered indicated physicians on the teaching service did not order more radiology (1411/1637 vs. 471/552; P = .61), speech therapy (128/1637 vs. 37/552; P = .39), physical therapy (611/1637 vs. 207/552; P = .94), occupational therapy (369/1637 vs. 109/552; P = .17), respiratory therapy (893/1637 vs. 283/552; P = .19), or pulmonary function testing (75/1637 vs. 27/552; P = .89) consultations or GI endoscopy procedures (188/1637 vs. 65/552; P = .18). Inferential results derived by multiple linear regression and logistic regression analyses, as well as the propensity score method, all agreed with the results derived using crude comparisons and concluded that, except for laboratory and radiology costs, patients treated on the teaching services did not have higher service‐specific costs or more therapies and consultations.
To remove the potential confounding effects of the 5 hospitalists who rotated between teaching and nonteaching services, we removed 875 patients (125 on the nonteaching and 750 on the teaching service) from the original data set who were cared for by these physicians, and repeated crude, multivariate, and propensity score analyses. In the data subset (Tables 4 and 5), laboratory costs remained higher on the teaching service, but the difference in radiology costs between teaching and nonteaching services seen in the total data set diminished and did not remain statistically significant when hospitalists were excluded from the analysis.
| Variable | Crude method | Multiple linear regression | Propensity score method | ||||||
|---|---|---|---|---|---|---|---|---|---|
| Difference* | SE | P Value | Difference | SE | P Value | Difference | SE | P Value | |
| |||||||||
| Overall costs | 59 | 424 | .89 | 31 | 378 | .93 | 94 | 410 | .82 |
| Length of hospital stay | 0.18 | 0.28 | .52 | 0.18 | 0.26 | .49 | 0.13 | 0.27 | .63 |
| Service‐specific costs | |||||||||
| Laboratory | 163 | 69 | .02 | 157 | 66 | .02 | 155 | 68 | .02 |
| Pharmacy | 28 | 27 | .30 | 26 | 30 | .39 | 30 | 26 | .25 |
| Radiology | 36 | 19 | .06 | 37 | 23 | .11 | 38 | 17 | .03 |
| Speech therapy | 0.2 | 1.0 | .82 | 0.8 | 0.9 | .36 | 0.53 | 0.97 | .59 |
| Physical therapy | 1.9 | 1.2 | .11 | 2.1 | 1.0 | .03 | 2.0 | 1.1 | .07 |
| Occupation therapy | 0.01 | 0.7 | .99 | 0.16 | 0.7 | .81 | 0.07 | 0.67 | .92 |
| Respiratory therapy | 6.2 | 7.6 | .42 | 3.1 | 7.9 | .70 | 4.0 | 7.5 | .60 |
| Pulmonary function | 0.13 | 0.16 | .39 | 0.18 | 0.16 | .25 | 0.17 | 0.16 | .28 |
| GI endoscopy procedures | 1.8 | 1.9 | .33 | 1.5 | 2.1 | .49 | 1.72 | 1.65 | .30 |
| Variable | Crude method | Multiple linear regression | Propensity Score Method | ||||||
|---|---|---|---|---|---|---|---|---|---|
| Odds ratio | SE | P Value* | Odds ratio | SE | P Value | Odds ratio | SE | P Value | |
| |||||||||
| Re‐admission | 1.41 | 0.27 | .07 | 1.43 | 0.28 | .07 | 1.44 | 0.27 | .06 |
| In‐hospital mortality | 0.89 | 0.25 | .67 | 0.83 | 0.25 | .52 | 0.89 | 0.26 | .68 |
| Service/consultant ordered | .54 | ||||||||
| Laboratory | 1.49 | 0.88 | .50 | 1.30 | 0.82 | .67 | 1.44 | 0.86 | .85 |
| Pharmacy | 1.04 | 1.28 | .97 | 0.78 | 0.98 | .84 | 1.27 | 1.56 | .91 |
| Radiology | 1.00 | 0.17 | .97 | 0.97 | 0.17 | .85 | 0.98 | 0.17 | .79 |
| Speech therapy | 1.30 | 0.31 | .27 | 0.87 | 0.24 | .60 | 1.07 | 0.26 | .93 |
| Physical therapy | 1.03 | 0.12 | .81 | 1.00 | 0.13 | 1.00 | 1.01 | 0.12 | .57 |
| Occupation therapy | 1.12 | 0.16 | .44 | 1.06 | 0.17 | .70 | 1.09 | 0.16 | .34 |
| Respiratory therapy | 1.15 | 0.14 | .24 | 1.16 | 0.15 | .26 | 1.12 | 0.13 | .10 |
| Pulmonary function | 0.69 | 0.20 | .19 | 0.64 | 0.19 | .13 | 0.63 | 0.18 | .64 |
| GI endoscopy procedures | 0.96 | 0.31 | .90 | 0.85 | 0.30 | .64 | 0.86 | 0.28 | |
DISCUSSION
We found that care delivered on the resident‐based teaching services at our academic community hospital was not associated with increases in overall costs, pharmacy costs, or consultative services ordered, although laboratory‐related costs and radiology costs were slightly higher than for the nonteaching service. In addition, clinical outcomes were not significantly different between teaching and nonteaching services in terms of hospital length of stay, in‐hospital mortality, and 30‐day readmission rate.
Several previous interinstitutional studies have documented greater utilization of resources at academic medical centers as a tradeoff for improved clinical outcomes.2, 4, 12, 13 One frequently offered explanation for higher costs at teaching hospitals is the purported tendency of resident physicians to order more tests and consults and to more heavily rely on modern diagnostic and therapeutic modalities. Apart from the number of tests and procedures ordered, differences in administrative, personnel, and other nonshared costs may account for higher overall costs at teaching hospitals reported in earlier studies. These variables, however, did not differ in our comparison of teaching and nonteaching services within the same institution because they were equally shared.
Studies that have looked at the hospitalist experience at academic centers and community hospitals have demonstrated improved efficiency associated with the use of hospitalist physicians.1517 At the University of Chicago, hospitalist care was associated with lower costs and short‐term mortality in the second year of hospitalist experience.15, 16 The authors suggested that disease‐specific physician experience in the hospitalist model may lead to reduced resource consumption and improved patient outcomes. The focus of our study was not a comparison of hospitalist with nonhospitalist models. However, when we excluded patients cared for by hospitalist physicians from our costs, services, and outcomes analyses, laboratory costs remained the only significant difference between teaching and nonteaching services.
Other than teaching hospital status and use of hospitalist physicians, institutional characteristics that can potentially influence clinical outcomes include hospital size, location, ownership, case mix, access to on‐site specialized diagnostic and therapeutic equipment, and availability of specialty services.15, 16 However, all these variables were identical in our study of teaching versus nonteaching services within the same community hospital, thereby allowing an uncontaminated estimation of the effect of teaching status on resource utilization and clinical outcomes. Although both teaching and nonteaching services were sometimes headed by attendings who participated in both models, teaching services differed notably in being run by resident team leaders with attendings performing a largely supervisory role.
We recognize several limitations of our study. Patients were quasirandomly triaged to teaching and nonteaching services according to patient loads without any consideration for diagnoses, comorbidities, or severity of illness. Therefore, it is quite possible there were unascertainable differences in disease severity and case mix between the teaching and nonteaching services. Notably, there was some discordance in the number of patients with nonpneumonia respiratory infection and the number with metabolic disorders assigned between the 2 services. However, 8 of the 10 most common primary diagnoses in the data set were similarly distributed between the 2 services, and the mean number of secondary diagnoses per patient was also not statistically different. More importantl we employed multiple regression analysis and a propensity score method to account for any imbalance in case mix and other potential confounders such as sex, age, and insurance classifications. These advanced statistical methods produced results similar to the unadjusted method and, hence, strengthen our conclusion that care delivered on the resident‐based teaching services at our academic community hospital was not significantly associated with increases in overall patient care costs, LOS, readmission rate, or in‐hospital mortality. Having hospitalist physicians on both teaching and nonteaching services may have had some effect on the practice patterns of other physicians, creating greater similarities than might have been expected otherwise. Data used in this study were obtained from only 1 academic institution, and caution should be exercised in extrapolating our findings to other settings unless substantiated by other studies.
- ,,,,,.Hospital outcomes in major teaching, minor teaching, and non‐teaching hospitals in New York State.Am J Med.2002;112:255–261.
- ,,, et al.Value and cost of teaching hospitals: A prospective, multicenter, inception cohort study.Crit Care Med.1994;22:1706–1709.
- ,,, et al.Comparison of surgical outcomes between teaching and non‐teaching hospitals in the Department of Veterans Affairs.Ann Surg.2001;234:370–382.
- ,,,.Effect of academic affiliation and obstetric volume on clinical outcome and cost of childbirth.Obstet Gynecol.2001;97:567–576.
- ,,.Community‐acquired bacteremia at a teaching versus a non‐teaching hospital: Impact of acute severity of illness on 30‐day mortality.Am J Infect Control.2001;29:13–19.
- ,,, et al.Pulmonary sarcoidosis: comparison of patients at a university and a municipal hospital.J Natl Med Assoc.1999;91:322–327.
- ,,,,,.Use of medical resources, complication, and long‐term outcome in patients hospitalized with acute chest pain. Comparison between a city university hospital and a county hospital.Int J Cardiol.2002;85:229–238.
- ,,.Breast cancer survival by teaching status of the initial treating hospital.CMAJ.2001;164:183–188.
- ,,, et al.Relationship of hospital teaching status with quality of care and mortality for Medicare patients with acute MI.JAMA.2000;284:1256–1262.
- ,,, et al.Outcome of acute myocardial infarction according to the specialty of the admitting physician.N Engl J Med.1996;335:1880–1887.
- ,,, et al.Quality of care at teaching and non‐teaching hospitals.JAMA.2000;284:1220–1222.
- ,,, et al.Severity‐adjusted mortality and length of stay in teaching and non‐teaching hospitals.JAMA.1997;278:485–490.
- ,,.Effects of admission to a teaching hospital and the cost and quality of care for Medicare beneficiaries.N Engl J Med.1999;340:293–299.
- ,,, et al.Effects of physician experience on costs and outcomes on an academic general medicine service: Results of a trial of hospitalists.Ann Intern Med.2002;137:866–874.
- ,,,,,.Implementation of a voluntary hospitalist service at a community teaching hospital: Improved clinical efficiency and patient outcomes.Ann Intern Med2002;137:859–865.
- .,. et al.Hospital characteristics and quality of care.JAMA.1992;268:1709–1714.
- and.The central role of the propensity score in observational studies for causal effects.Biometrika.1983;70:41–55.
Copyright © 2007 Society of Hospital Medicine
Editorial
Founded in 1997 by 2 community‐based hospitalists, Win Whitcomb and John Nelson, the National Association of Inpatient Physicians was renamed the Society of Hospital Medicine in 2003 and celebrates its 10th anniversary this year. Evolving from the enthusiastic engagement by the attendees at the first hospital medicine CME meeting in the spring of 1997,1 this new organization has grown into a robust voice for improving the care of hospitalized patients. The Society has actively attempted to represent a big tent welcoming participation from everyone involved in hospital care. The name change to the Society of Hospital Medicine (SHM) reflected the recognition that a team is needed to achieve the goal of optimizing care of the hospitalized patient. Merriam‐Webster defines society as companionship or association with one's fellows and a voluntary association of individuals for common ends; especially an organized group working together or periodically meeting because of common interests, beliefs, or profession.2 The hospital medicine team working together includes nurses, pharmacists, case managers, social workers, physicians, and administrators in addition to dieticians, respiratory therapists, and physical and occupational therapists. With a focus on patient‐centered care and quality improvement, SHM eagerly anticipates future changes in health care, seeking to help its membership adapt to and manage the expected change.
As an integral component of the hospital care delivery team, physicians represent the bulk of membership in SHM. Thus, development of hospital medicine as a medical specialty has concerned many of its members. Fortunately, progress is being made, and Bob Wachter is chairing a task force on this for the American Board of Internal Medicine.3 Certainly, content in the field is growing exponentially, with textbooks (including possibly 3 separate general references for adult and pediatric hospital medicine), multiple printed periodicals, and this successful peer‐reviewed journal listed in MEDLINE and PubMed. In addition, most academic medical centers now have thriving groups of hospitalists, and many are establishing or plan separate divisions within their respective departments of medicine (eg, Northwestern, UCSan Francisco, UCSan Diego, Duke, Mayo Clinic). These events confirm how hospital medicine has progressed to become a true specialty of medicine and justify the publication of its own set of core competencies.4 We believe some form of certification is inevitable. This will be supported by development of residency tracks and fellowships in hospital medicine.5
Most remarkable about the Society of Hospital Medicine has been its ability to collaborate with multiple medical societies, governmental agencies, foundations, and organizations seeking to improve care for hospitalized patients (see Table 1). These relationships represent the teamwork approach that hospitalists take into their hospitals on a daily basis. We hope to build on these collaborations and work toward more interactive efforts to identify optimal delivery of health care in the hospital setting, while also reaching out to ambulatory‐based providers to ensure smooth transitions of care. Such efforts will require innovative approaches to educating SHM members and altering the standard approach to continuing medical education (CME). Investment in the concept of hospitalists by the John A. Hartford Foundation with a $1.4 million grant to improve the discharge process (Improving Hospital Care Transitions for Older Adults) exemplifies SHM's commitment to collaboration, with more than 10 organizations participating on the advisory board.
| Agency for Healthcare Research and Quality (AHRQ) |
| Alliance of Academic Internal Medicine |
| Ambulatory Pediatric Association |
| American Academy of Clinical Endocrinology |
| American Academy of Pediatricians |
| American Association of Critical Care Nurses |
| American Board of Internal Medicine |
| American College of Health Executives |
| American College of Chest Physicians |
| American College of Emergency Physicians |
| American College of Physicians |
| American College of Physician Executives |
| American Diabetes Association |
| American Geriatric Society |
| American Hospital Association |
| American Society of Health System Pharmacists |
| AMA's Physician Consortium for Performance Improvement |
| Association of American Medical Colleges |
| Case Management Society of America |
| Centers for Disease Control and Prevention (CDC) |
| Centers for Medicare & Medicaid Services (CMS) |
| The Hartford Foundation |
| Hospital Quality Alliance |
| Institute of Healthcare Improvement |
| The Joint Commission |
| National Quality Forum |
| Society of Critical Care Medicine |
| Society of General Internal Medicine |
As SHM and its growing membership, which now exceeds 6500, stride into the future, we embrace advances in educational approaches to enhancing health care delivery and expect to play a leadership role in applying them. Increasingly, use of pay‐for‐performance (P4P) will attempt to align payment incentives to promote better quality care by rewarding providers that perform well.6 SHM aims to train hospitalists through use of knowledge translation which combines the right educational tools with involvement of the entire health care team, yielding truly effective CME.7 A reinvention of CME that links it to care delivery and improving performance, it is supported by governmental health care leaders.8 This approach moves CME to where hospitalists deliver care, targets all participants (patients, nurses, pharmacists, and doctors), and has content based around initiatives to improve health care.
Such a quality improvement model would take advantage of SHM's Quality Improvement Resource Rooms (hospitalmedicine.org), marking an important shift toward translating evidence into practice. SHM will also continue with its efforts to lead in nonclinical training, as exemplified by its popular biannual leadership training courses. We expect this will expand to provide much‐needed QI training in the future.
In its first 10 years SHM has accomplished much already, but the best days for hospital medicine lie ahead of us. There will be more than 30,000 hospitalists practicing at virtually every hospital in the United States, with high expectations for teams of health professionals providing patient‐centered care with documented quality standards. SHM is poised to work with all our partner organizations to do our part to create the hospital of the future. Our patients are counting on all of us.
- .Reflections: the hospitalist movement a decade later.J Hosp Med.2006;1:248–252.
- Available at: www.merriam‐webster.com. accessed April 2,2007.
- .What will board certification be—and mean—for hospitalists?J Hosp Med.2007;2:102–104.
- ,,,,.Core competencies of hospital medicine: development and methodology.J Hosp Med.2006;1:48–56
- ,,,.Hospital medicine fellowships: in progress.Am J Med.2006;119:72.e1–e7.
- Committee on Redesigning Health Insurance Performance Measures Payment and Performance Improvement Programs.Rewarding Provider Performance: Aligning Incentives in Medicare.Washington, DC:National Academies Press;2007.
- ,,, et al.The case for knowledge translation: shortening the journey from evidence to effect.BMJ.2003;327:33–35.
- .Commentary: reinventing continuing medical education.BMJ.2004;4:181.
Founded in 1997 by 2 community‐based hospitalists, Win Whitcomb and John Nelson, the National Association of Inpatient Physicians was renamed the Society of Hospital Medicine in 2003 and celebrates its 10th anniversary this year. Evolving from the enthusiastic engagement by the attendees at the first hospital medicine CME meeting in the spring of 1997,1 this new organization has grown into a robust voice for improving the care of hospitalized patients. The Society has actively attempted to represent a big tent welcoming participation from everyone involved in hospital care. The name change to the Society of Hospital Medicine (SHM) reflected the recognition that a team is needed to achieve the goal of optimizing care of the hospitalized patient. Merriam‐Webster defines society as companionship or association with one's fellows and a voluntary association of individuals for common ends; especially an organized group working together or periodically meeting because of common interests, beliefs, or profession.2 The hospital medicine team working together includes nurses, pharmacists, case managers, social workers, physicians, and administrators in addition to dieticians, respiratory therapists, and physical and occupational therapists. With a focus on patient‐centered care and quality improvement, SHM eagerly anticipates future changes in health care, seeking to help its membership adapt to and manage the expected change.
As an integral component of the hospital care delivery team, physicians represent the bulk of membership in SHM. Thus, development of hospital medicine as a medical specialty has concerned many of its members. Fortunately, progress is being made, and Bob Wachter is chairing a task force on this for the American Board of Internal Medicine.3 Certainly, content in the field is growing exponentially, with textbooks (including possibly 3 separate general references for adult and pediatric hospital medicine), multiple printed periodicals, and this successful peer‐reviewed journal listed in MEDLINE and PubMed. In addition, most academic medical centers now have thriving groups of hospitalists, and many are establishing or plan separate divisions within their respective departments of medicine (eg, Northwestern, UCSan Francisco, UCSan Diego, Duke, Mayo Clinic). These events confirm how hospital medicine has progressed to become a true specialty of medicine and justify the publication of its own set of core competencies.4 We believe some form of certification is inevitable. This will be supported by development of residency tracks and fellowships in hospital medicine.5
Most remarkable about the Society of Hospital Medicine has been its ability to collaborate with multiple medical societies, governmental agencies, foundations, and organizations seeking to improve care for hospitalized patients (see Table 1). These relationships represent the teamwork approach that hospitalists take into their hospitals on a daily basis. We hope to build on these collaborations and work toward more interactive efforts to identify optimal delivery of health care in the hospital setting, while also reaching out to ambulatory‐based providers to ensure smooth transitions of care. Such efforts will require innovative approaches to educating SHM members and altering the standard approach to continuing medical education (CME). Investment in the concept of hospitalists by the John A. Hartford Foundation with a $1.4 million grant to improve the discharge process (Improving Hospital Care Transitions for Older Adults) exemplifies SHM's commitment to collaboration, with more than 10 organizations participating on the advisory board.
| Agency for Healthcare Research and Quality (AHRQ) |
| Alliance of Academic Internal Medicine |
| Ambulatory Pediatric Association |
| American Academy of Clinical Endocrinology |
| American Academy of Pediatricians |
| American Association of Critical Care Nurses |
| American Board of Internal Medicine |
| American College of Health Executives |
| American College of Chest Physicians |
| American College of Emergency Physicians |
| American College of Physicians |
| American College of Physician Executives |
| American Diabetes Association |
| American Geriatric Society |
| American Hospital Association |
| American Society of Health System Pharmacists |
| AMA's Physician Consortium for Performance Improvement |
| Association of American Medical Colleges |
| Case Management Society of America |
| Centers for Disease Control and Prevention (CDC) |
| Centers for Medicare & Medicaid Services (CMS) |
| The Hartford Foundation |
| Hospital Quality Alliance |
| Institute of Healthcare Improvement |
| The Joint Commission |
| National Quality Forum |
| Society of Critical Care Medicine |
| Society of General Internal Medicine |
As SHM and its growing membership, which now exceeds 6500, stride into the future, we embrace advances in educational approaches to enhancing health care delivery and expect to play a leadership role in applying them. Increasingly, use of pay‐for‐performance (P4P) will attempt to align payment incentives to promote better quality care by rewarding providers that perform well.6 SHM aims to train hospitalists through use of knowledge translation which combines the right educational tools with involvement of the entire health care team, yielding truly effective CME.7 A reinvention of CME that links it to care delivery and improving performance, it is supported by governmental health care leaders.8 This approach moves CME to where hospitalists deliver care, targets all participants (patients, nurses, pharmacists, and doctors), and has content based around initiatives to improve health care.
Such a quality improvement model would take advantage of SHM's Quality Improvement Resource Rooms (hospitalmedicine.org), marking an important shift toward translating evidence into practice. SHM will also continue with its efforts to lead in nonclinical training, as exemplified by its popular biannual leadership training courses. We expect this will expand to provide much‐needed QI training in the future.
In its first 10 years SHM has accomplished much already, but the best days for hospital medicine lie ahead of us. There will be more than 30,000 hospitalists practicing at virtually every hospital in the United States, with high expectations for teams of health professionals providing patient‐centered care with documented quality standards. SHM is poised to work with all our partner organizations to do our part to create the hospital of the future. Our patients are counting on all of us.
- .Reflections: the hospitalist movement a decade later.J Hosp Med.2006;1:248–252.
- Available at: www.merriam‐webster.com. accessed April 2,2007.
- .What will board certification be—and mean—for hospitalists?J Hosp Med.2007;2:102–104.
- ,,,,.Core competencies of hospital medicine: development and methodology.J Hosp Med.2006;1:48–56
- ,,,.Hospital medicine fellowships: in progress.Am J Med.2006;119:72.e1–e7.
- Committee on Redesigning Health Insurance Performance Measures Payment and Performance Improvement Programs.Rewarding Provider Performance: Aligning Incentives in Medicare.Washington, DC:National Academies Press;2007.
- ,,, et al.The case for knowledge translation: shortening the journey from evidence to effect.BMJ.2003;327:33–35.
- .Commentary: reinventing continuing medical education.BMJ.2004;4:181.
Editorial
Why measure hospital quality? One popular premise is that measurement and transparency will inform consumer decision making and drive volume to high‐quality programs, providing incentives for improvement and raising the bar nationally. In this issue of the Journal of Hospital Medicine, Halasyamani and Davis report that there is relatively poor correlation between the Hospital Compare scores of the Centers for Medicare and Medicaid Services (CMS) and U.S. News and World Report's Best Hospitals rankings.1 The authors note that this is not necessarily surprising, as the methodologies of these rating systems are quite different, although their purposes are functionally similar.
Clearly, these 2 popular quality evaluation systems reflect different underlying constructs (which may or may not actually describe quality). And therein lies a central dilemma for health care professionals and academics: we haven't agreed among ourselves on reliable and meaningful quality metrics; so how can we, or even should we, expect the public to use available data to make health care decisions?
The 2 constructs in this particular comparison are certainly divergent in design. For the Hospital Compare ratings, the CMS used detailed process‐of‐care measures, expensively abstracted from the medical record, for just 3 medical conditions: acute myocardial infarction, congestive heart failure, and community‐acquired pneumonia. The U.S. News Best Hospitals rankings used reputation (based on a survey of physicians), severity‐adjusted mortality rate, staffing ratio, and key technologies offered by hospitals. Halasyamani and Davis conclude that consumers may be left to wonder how to reconcile these discordant rating systems. At the same time, they acknowledge that it is not yet clear whether public reporting will affect consumers' health care choices. Available evidence suggests that when making choices about health care, patients are much more likely to consult family and friends than an Internet site that posts quality information.2 There is as yet no conclusive evidence that quality data drive consumer decision making. Furthermore, acute myocardial infarction patients rarely have the opportunity to choose a hospital, even if they had access to the data.
The assessment of hospital quality is not only a challenge for patients, it's still perplexing for those of us immersed in health care. The scope of measures of quality is both broad and incomplete. At the microsystem and individual clinical syndrome level, we have a plethora of process measures that are evidence based (such as the CMS Hospital Compare measures) but appear to move meaningful outcomes only slightly, if at all. The evidence linking the pneumonia measures, for instance, to significant outcomes such as lower mortality or (rarely studied) better functional outcomes is extremely limited or nonexistent.3, 4
At the other end of the continuum are sweeping metrics such as risk‐adjusted in‐hospital mortality, which may be important and yet has 2 significant limitations. First, mortality rates in acute care are generally so low that this is not a useful outcome of interest for most clinical conditions. Its utility is really limited to well‐studied procedures such as cardiac surgery. Second, mortality rate reduction is extraordinarily difficult to link meaningfully to specific process interventions with available information and tools. For high‐volume complex medical conditions, such as pneumonia, nonsurgically‐managed cardiac disease, and oncology, we cannot as yet reliably use in‐hospital mortality rate as a descriptor for quality of care because the populations are so diverse and the statistical tools so crude. The public reporting of these data is even more complex because it often lags behind current data by years and may be significantly affected by sample size.
Even when we settle on a few, well‐defined process metrics, we have problems with complete and accurate reporting of data. In Halasyamani and Davis's study, only 2.9% of hospitals reported all 14 Hospital Compare core performance measures used in their analysis.1 Evidence suggests that poor performance is a strong disincentive to voluntarily report quality measures to the public.5 And because there is no evidence that this type of transparency initiative will drive volume to higher‐quality programs, publicly reporting quality measures may not provide a strong enough incentive for hospitals to allocate resources to the improvement of the quality of care they deliver in these specific areas.
The CMS has introduced financial incentives to encourage hospitals to report performance measures (regardless of the actual level of performance which is reported), providing financial rewards to top‐performing hospitals and/or to hospitals that actually demonstrate that strong performance may have a greater impact. The results of early studies suggested that that pay‐for‐performance did improve the quality of health care.6 Lindenauer et al. recently published the results of a large study evaluating adherence to quality measures in hospitals that voluntarily reported measures compared with those participating in a pay‐for‐performance demonstration project funded by the CMS. Hospitals engaged in both public reporting and pay‐for‐performance achieved modestly greater improvements in quality compared with those that only did public reporting.7 It is notable that this demonstration project generally produced modest financial rewards to those hospitals that improved performance.8 The optimal model to reward performance remains to be determined.7, 9, 10
There are a number of potentially harmful unintended consequences of poorly designed quality measures and associated transparency and incentive programs. The most obvious is opportunity cost. As the incentives become more tangible and meaningful, hospital quality leaders will be expected to step up efforts to improve performance in the specific process of care measures for which they are rewarded. Without caution, however, hospital quality leaders may develop a narrow focus in deciding where to apply their limited resources and may become distracted from other areas in dire need of improvement. Their boards of directors might appropriately argue that it is their fiduciary responsibility to focus on improving those aspects of quality that the payer community has highlighted as most important. If the metrics are excellent and the underlying constructs are in fact the right ones to advance quality in American acute care, this is a direction to be applauded. If the metrics are flawed and limited, which is the case today, then the risk is that resources will be wasted and diverted from more important priorities.
Even worse, an overly narrow focus may have unintended adverse clinical consequences. Recently, Wachter discussed several real‐world examples of unintended consequences of quality improvement efforts, including giving patients multiple doses of pneumococcal vaccines and inappropriately treating patients with symptoms that might indicate community‐acquired pneumonia with antibiotics.11 As hospitals attempt to improve their report cards, a significant risk exists that patients will receive excessive or unnecessary care in an attempt to meet specified timeliness goals.
The most important issue that has still not been completely addressed is whether improvements in process‐of‐care measures will actually improve patient outcomes. In a recent issue of this journal, Seymann concluded that there is strong evidence for influenza vaccination and the use of appropriate antibiotics for community‐acquired pneumonia12 but that other pneumonia quality measures were of less obvious clinical benefit. Controversy continues over whether the optimal timing of the initial treatment of community‐acquired pneumonia with antibiotics is 4 hours, as it currently stands, or 8 hours. Patients hospitalized with pneumonia may be motivated to quit smoking, but CMS requirements for smoking cessation advice/counseling can be satisfied with a simple pamphlet or a video, rather than interventions that involve counseling by specifically trained professionals and the use of pharmacotherapy, which are more likely to succeed. Although smoking cessation is an admirable goal, whether this is performed will not affect the quality of care that a patient with pneumonia receives during the index admission. In fact, it would be more important to counsel all patients about the hazards of smoking in an attempt to prevent pneumonia and acute myocardial infarction as well as a host of other smoking‐related illnesses.
In another example, Fonarow and colleagues examined the association between heart failure clinical outcomes and performance measures in a large observational cohort.13 The study found that current heart failure performance measures, aside from prescribing angiotensin‐converting inhibitor or angiotensin receptor blocker at discharge, had little relationship to mortality in the first 60‐90 days following discharge. On the other hand, the team found that being discharged on a beta blocker was associated with a significant reduction in mortality; however, beta blocker use is not part of the current CMS core measures. In addition, many patients hospitalized for heart failure may benefit from implantable cardioverter‐defibrillator therapy and/or cardiac resynchronization therapy,14 yet referral to a cardiologist to evaluate patients who may be suitable for these therapies is not a CMS core measure.
A similar, more comprehensive study recently evaluated whether performance on CMS quality measures for acute myocardial infarction, heart failure, and pneumonia correlated with condition‐specific inpatient, 30‐day, and 1‐year risk‐adjusted mortality rates.15 The study found that the best hospitals, those performing at the 75th percentile on quality measures, did have lower mortality rates than did hospitals performing at the 25th percentile, but the absolute risk reduction was small. Specifically, the absolute risk reduction for 30‐day mortality was 0.6%, 0.1%, and 0.1% for acute myocardial infarction, heart failure, and pneumonia, respectively. In attempting to explain their findings, the authors noted that current quality measures include only a subset of activities involved in the care of hospitalized patients. In addition, mortality rates are likely influenced by factors not included in current quality measures, such as the use of electronic health records, staffing levels, and other activities of quality oversight committees.
The era of measurement and accountability for providing high‐quality health care is upon us. Public reporting may lead to improvement in quality measures, but it is incumbent on the academic and provider communities as well as the payer community to ensure that the metrics are meaningful, reliable, and reproducible and, equally important, that they make a difference in essential clinical outcomes such as mortality, return to function, and avoidance of adverse events.10 Emerging evidence suggests the measures may need to be linked to meaningful financial incentives to the provider in order to accelerate change. Incentives directed at patients appear to be ineffective, clumsy, and slow to produce results.16
The time is right to revisit the quality measures currently used for transparency and incentives. We need a tighter, more reliable set of metrics that actually correlate with meaningful outcomes. Some evidence‐based measures appear to be missing from the current leading lists and some remain inadequately defined with regard to compliance. As a system, the measurement program contains poorly understood risks of unintended consequences. Above all else, local and national quality leaders need to be mindful that improving patient outcomes must be the central goal in our efforts to improve performance on process‐of‐care measures.
- ,.Conflicting measures of hospital quality: ratings from “Hospital Compare” versus “Best Hospitals.”J Hosp Med.2007;2:128–134.
- Kaiser Family Foundation and Agency for Health Care Research and Quality.National Survey on Consumers' Experiences with Patient Safety and Quality Information.Washington, DC:Kaiser Family Foundation;2004.
- ,, et al.Quality of care, process, and outcomes in elderly patients with pneumonia.JAMA.1997;278:2080–2084.
- ,,,,.Process of care, illness severity, and outcomes in the management of community acquired pneumonia at academic hospitals.Arch Intern Med.2001;161:2099–2104.
- ,,,,.Relationship between low quality‐of‐care scores and HMOs' subsequent public disclosure of quality‐of‐care scores.JAMA.2002;288:1484–1490.
- ,,,,.Does pay‐for‐performance improve the quality of health care?Ann Intern Med.2006;145:265–272.
- ,,, et al.Public Reporting and pay for performance in hospital quality improvement.N Engl J Med.2007;356:486–496.
- The CMS demonstration project methodology provides a 2% incremental payment for the best 10 percent of hospitals and 1% for the second decile. See CMS press release, available at: http://www.cms.hhs.gov/apps/media/. Accessed January 26,2007.
- .Pay for performance and accountability: related themes in improving health care.Ann Intern Med.2006;145:695–699.
- Institute of Medicine Committee on Redesigning Health Insurance Performance Measures, Payment, and Performance Improvement Programs.Rewarding Provider Performance: Aligning Incentives in Medicare (Pathways to Quality Health Care Series).Washington, DC:National Academies Press;2007.
- .Expected and unanticipated consequences of the quality and information technology revolutions.JAMA.2006;295:2780–2783.
- .Community‐acquired pneumonia: defining quality care.J Hosp Med.2006;1:344–353.
- ,,, et al.Association between performance measures and clinical outcomes for patients hospitalized with heart failure.JAMA.2007;297:61–70.
- ,, et al.ACC/AHA 2005 Guideline update for the diagnosis and management of chronic heart failure in the adult: a report of the American College of Cardiology/American Heart Association Task Force on Practice Guidelines.Circulation.2005;112:e154–e235.
- ,.Relationship between Medicare's Hospital Compare performance measures and mortality rates.JAMA.2006;296:2694–2702.
- Employee Benefit Research Institute. 2nd Annual EBRI/Commonwealth Fund Consumerism in Health Care Survey, 2006: early experience with high‐deductible and consumer‐driven health plans. December 2006. Available at: http://www.ebri.org/pdf/briefspdf/EBRI_IB_12‐20061.pdf.. Accessed February 23,2007.
Why measure hospital quality? One popular premise is that measurement and transparency will inform consumer decision making and drive volume to high‐quality programs, providing incentives for improvement and raising the bar nationally. In this issue of the Journal of Hospital Medicine, Halasyamani and Davis report that there is relatively poor correlation between the Hospital Compare scores of the Centers for Medicare and Medicaid Services (CMS) and U.S. News and World Report's Best Hospitals rankings.1 The authors note that this is not necessarily surprising, as the methodologies of these rating systems are quite different, although their purposes are functionally similar.
Clearly, these 2 popular quality evaluation systems reflect different underlying constructs (which may or may not actually describe quality). And therein lies a central dilemma for health care professionals and academics: we haven't agreed among ourselves on reliable and meaningful quality metrics; so how can we, or even should we, expect the public to use available data to make health care decisions?
The 2 constructs in this particular comparison are certainly divergent in design. For the Hospital Compare ratings, the CMS used detailed process‐of‐care measures, expensively abstracted from the medical record, for just 3 medical conditions: acute myocardial infarction, congestive heart failure, and community‐acquired pneumonia. The U.S. News Best Hospitals rankings used reputation (based on a survey of physicians), severity‐adjusted mortality rate, staffing ratio, and key technologies offered by hospitals. Halasyamani and Davis conclude that consumers may be left to wonder how to reconcile these discordant rating systems. At the same time, they acknowledge that it is not yet clear whether public reporting will affect consumers' health care choices. Available evidence suggests that when making choices about health care, patients are much more likely to consult family and friends than an Internet site that posts quality information.2 There is as yet no conclusive evidence that quality data drive consumer decision making. Furthermore, acute myocardial infarction patients rarely have the opportunity to choose a hospital, even if they had access to the data.
The assessment of hospital quality is not only a challenge for patients, it's still perplexing for those of us immersed in health care. The scope of measures of quality is both broad and incomplete. At the microsystem and individual clinical syndrome level, we have a plethora of process measures that are evidence based (such as the CMS Hospital Compare measures) but appear to move meaningful outcomes only slightly, if at all. The evidence linking the pneumonia measures, for instance, to significant outcomes such as lower mortality or (rarely studied) better functional outcomes is extremely limited or nonexistent.3, 4
At the other end of the continuum are sweeping metrics such as risk‐adjusted in‐hospital mortality, which may be important and yet has 2 significant limitations. First, mortality rates in acute care are generally so low that this is not a useful outcome of interest for most clinical conditions. Its utility is really limited to well‐studied procedures such as cardiac surgery. Second, mortality rate reduction is extraordinarily difficult to link meaningfully to specific process interventions with available information and tools. For high‐volume complex medical conditions, such as pneumonia, nonsurgically‐managed cardiac disease, and oncology, we cannot as yet reliably use in‐hospital mortality rate as a descriptor for quality of care because the populations are so diverse and the statistical tools so crude. The public reporting of these data is even more complex because it often lags behind current data by years and may be significantly affected by sample size.
Even when we settle on a few, well‐defined process metrics, we have problems with complete and accurate reporting of data. In Halasyamani and Davis's study, only 2.9% of hospitals reported all 14 Hospital Compare core performance measures used in their analysis.1 Evidence suggests that poor performance is a strong disincentive to voluntarily report quality measures to the public.5 And because there is no evidence that this type of transparency initiative will drive volume to higher‐quality programs, publicly reporting quality measures may not provide a strong enough incentive for hospitals to allocate resources to the improvement of the quality of care they deliver in these specific areas.
The CMS has introduced financial incentives to encourage hospitals to report performance measures (regardless of the actual level of performance which is reported), providing financial rewards to top‐performing hospitals and/or to hospitals that actually demonstrate that strong performance may have a greater impact. The results of early studies suggested that that pay‐for‐performance did improve the quality of health care.6 Lindenauer et al. recently published the results of a large study evaluating adherence to quality measures in hospitals that voluntarily reported measures compared with those participating in a pay‐for‐performance demonstration project funded by the CMS. Hospitals engaged in both public reporting and pay‐for‐performance achieved modestly greater improvements in quality compared with those that only did public reporting.7 It is notable that this demonstration project generally produced modest financial rewards to those hospitals that improved performance.8 The optimal model to reward performance remains to be determined.7, 9, 10
There are a number of potentially harmful unintended consequences of poorly designed quality measures and associated transparency and incentive programs. The most obvious is opportunity cost. As the incentives become more tangible and meaningful, hospital quality leaders will be expected to step up efforts to improve performance in the specific process of care measures for which they are rewarded. Without caution, however, hospital quality leaders may develop a narrow focus in deciding where to apply their limited resources and may become distracted from other areas in dire need of improvement. Their boards of directors might appropriately argue that it is their fiduciary responsibility to focus on improving those aspects of quality that the payer community has highlighted as most important. If the metrics are excellent and the underlying constructs are in fact the right ones to advance quality in American acute care, this is a direction to be applauded. If the metrics are flawed and limited, which is the case today, then the risk is that resources will be wasted and diverted from more important priorities.
Even worse, an overly narrow focus may have unintended adverse clinical consequences. Recently, Wachter discussed several real‐world examples of unintended consequences of quality improvement efforts, including giving patients multiple doses of pneumococcal vaccines and inappropriately treating patients with symptoms that might indicate community‐acquired pneumonia with antibiotics.11 As hospitals attempt to improve their report cards, a significant risk exists that patients will receive excessive or unnecessary care in an attempt to meet specified timeliness goals.
The most important issue that has still not been completely addressed is whether improvements in process‐of‐care measures will actually improve patient outcomes. In a recent issue of this journal, Seymann concluded that there is strong evidence for influenza vaccination and the use of appropriate antibiotics for community‐acquired pneumonia12 but that other pneumonia quality measures were of less obvious clinical benefit. Controversy continues over whether the optimal timing of the initial treatment of community‐acquired pneumonia with antibiotics is 4 hours, as it currently stands, or 8 hours. Patients hospitalized with pneumonia may be motivated to quit smoking, but CMS requirements for smoking cessation advice/counseling can be satisfied with a simple pamphlet or a video, rather than interventions that involve counseling by specifically trained professionals and the use of pharmacotherapy, which are more likely to succeed. Although smoking cessation is an admirable goal, whether this is performed will not affect the quality of care that a patient with pneumonia receives during the index admission. In fact, it would be more important to counsel all patients about the hazards of smoking in an attempt to prevent pneumonia and acute myocardial infarction as well as a host of other smoking‐related illnesses.
In another example, Fonarow and colleagues examined the association between heart failure clinical outcomes and performance measures in a large observational cohort.13 The study found that current heart failure performance measures, aside from prescribing angiotensin‐converting inhibitor or angiotensin receptor blocker at discharge, had little relationship to mortality in the first 60‐90 days following discharge. On the other hand, the team found that being discharged on a beta blocker was associated with a significant reduction in mortality; however, beta blocker use is not part of the current CMS core measures. In addition, many patients hospitalized for heart failure may benefit from implantable cardioverter‐defibrillator therapy and/or cardiac resynchronization therapy,14 yet referral to a cardiologist to evaluate patients who may be suitable for these therapies is not a CMS core measure.
A similar, more comprehensive study recently evaluated whether performance on CMS quality measures for acute myocardial infarction, heart failure, and pneumonia correlated with condition‐specific inpatient, 30‐day, and 1‐year risk‐adjusted mortality rates.15 The study found that the best hospitals, those performing at the 75th percentile on quality measures, did have lower mortality rates than did hospitals performing at the 25th percentile, but the absolute risk reduction was small. Specifically, the absolute risk reduction for 30‐day mortality was 0.6%, 0.1%, and 0.1% for acute myocardial infarction, heart failure, and pneumonia, respectively. In attempting to explain their findings, the authors noted that current quality measures include only a subset of activities involved in the care of hospitalized patients. In addition, mortality rates are likely influenced by factors not included in current quality measures, such as the use of electronic health records, staffing levels, and other activities of quality oversight committees.
The era of measurement and accountability for providing high‐quality health care is upon us. Public reporting may lead to improvement in quality measures, but it is incumbent on the academic and provider communities as well as the payer community to ensure that the metrics are meaningful, reliable, and reproducible and, equally important, that they make a difference in essential clinical outcomes such as mortality, return to function, and avoidance of adverse events.10 Emerging evidence suggests the measures may need to be linked to meaningful financial incentives to the provider in order to accelerate change. Incentives directed at patients appear to be ineffective, clumsy, and slow to produce results.16
The time is right to revisit the quality measures currently used for transparency and incentives. We need a tighter, more reliable set of metrics that actually correlate with meaningful outcomes. Some evidence‐based measures appear to be missing from the current leading lists and some remain inadequately defined with regard to compliance. As a system, the measurement program contains poorly understood risks of unintended consequences. Above all else, local and national quality leaders need to be mindful that improving patient outcomes must be the central goal in our efforts to improve performance on process‐of‐care measures.
- ,.Conflicting measures of hospital quality: ratings from “Hospital Compare” versus “Best Hospitals.”J Hosp Med.2007;2:128–134.
- Kaiser Family Foundation and Agency for Health Care Research and Quality.National Survey on Consumers' Experiences with Patient Safety and Quality Information.Washington, DC:Kaiser Family Foundation;2004.
- ,, et al.Quality of care, process, and outcomes in elderly patients with pneumonia.JAMA.1997;278:2080–2084.
- ,,,,.Process of care, illness severity, and outcomes in the management of community acquired pneumonia at academic hospitals.Arch Intern Med.2001;161:2099–2104.
- ,,,,.Relationship between low quality‐of‐care scores and HMOs' subsequent public disclosure of quality‐of‐care scores.JAMA.2002;288:1484–1490.
- ,,,,.Does pay‐for‐performance improve the quality of health care?Ann Intern Med.2006;145:265–272.
- ,,, et al.Public Reporting and pay for performance in hospital quality improvement.N Engl J Med.2007;356:486–496.
- The CMS demonstration project methodology provides a 2% incremental payment for the best 10 percent of hospitals and 1% for the second decile. See CMS press release, available at: http://www.cms.hhs.gov/apps/media/. Accessed January 26,2007.
- .Pay for performance and accountability: related themes in improving health care.Ann Intern Med.2006;145:695–699.
- Institute of Medicine Committee on Redesigning Health Insurance Performance Measures, Payment, and Performance Improvement Programs.Rewarding Provider Performance: Aligning Incentives in Medicare (Pathways to Quality Health Care Series).Washington, DC:National Academies Press;2007.
- .Expected and unanticipated consequences of the quality and information technology revolutions.JAMA.2006;295:2780–2783.
- .Community‐acquired pneumonia: defining quality care.J Hosp Med.2006;1:344–353.
- ,,, et al.Association between performance measures and clinical outcomes for patients hospitalized with heart failure.JAMA.2007;297:61–70.
- ,, et al.ACC/AHA 2005 Guideline update for the diagnosis and management of chronic heart failure in the adult: a report of the American College of Cardiology/American Heart Association Task Force on Practice Guidelines.Circulation.2005;112:e154–e235.
- ,.Relationship between Medicare's Hospital Compare performance measures and mortality rates.JAMA.2006;296:2694–2702.
- Employee Benefit Research Institute. 2nd Annual EBRI/Commonwealth Fund Consumerism in Health Care Survey, 2006: early experience with high‐deductible and consumer‐driven health plans. December 2006. Available at: http://www.ebri.org/pdf/briefspdf/EBRI_IB_12‐20061.pdf.. Accessed February 23,2007.
Preoperative Cardiac Risk Stratification 2007
More than 33 million patients undergo surgery annually in the United States. Approximately 8 million of these patients either have known coronary artery disease or risk factors for it, and an estimated 50,000 patients sustain a perioperative myocardial infarction, with an additional 1 million developing another medical complication. An integrated comprehensive approach is necessary to risk‐stratify these patients in an attempt to reduce these complications.
The basic role of risk stratification is to identify those patients at increased risk for complications; however, we are looking for a small number of patients at high risk in a population of relatively low‐risk patients. Most surgical patients do well, and further diagnostic testing has a low yield in predicting those likely to have a complication (poor positive predictive value [PPV]). Our goal should be to determine the underlying potential triggers of cardiac complications and institute measures to prevent them. After briefly reviewing pathophysiology, risk indices, and guidelines for preoperative cardiac risk assessment and diagnostic testing, we will focus on risk reduction strategies including prophylactic revascularization (CABG/PCI) and medical therapy.
PATHOPHYSIOLOGY OF PERIOPERATIVE MYOCARDIAL INFARCTION
Perioperative myocardial infarctions result from myocardial ischemia or plaque rupture and coronary thrombosis.1 Myocardial ischemia may be caused by increased oxygen demand or decreased oxygen delivery. Surgical trauma, anesthesia, pain, hypothermia, and bleeding trigger a stress state. This in turn increases catecholamine release, leading to tachycardia, hypertension, and increased oxygen demand. Anesthesia, hypotension, bleeding, and anemia may produce hypoxia, with subsequently decreased delivery of oxygen. Surgical trauma initiates an inflammatory response, leading to plaque fissuring, and a hypercoagulable state, which can result in acute coronary thrombosis. Perioperative prophylaxis should target these potential triggers.
CARDIAC RISK INDICES AND GUIDELINES
Over the past 3 decades, a number of cardiac risk indices have been published. The older group of indices was most notable for Goldman's original cardiac risk index2 and Detsky's modification.3 The newer group consists of the American College of Physicians (ACP) guidelines4 (now considered outdated), the American College of Cardiology/American Heart Association (ACC/AHA) guidelines (to be updated again in early 2007),5 and the Lee revised cardiac risk index (RCRI).6
The 2002 ACC guidelines5 outline how to determine the need for additional cardiac (usually noninvasive) testing (NIT): after ascertaining the urgency of surgery, history of revascularization procedures, and previous stress test results (if any), a combination of clinical risk predictors, surgery‐specific risk, and patient self‐reported exercise capacity should be entered into an algorithm. The guidelines state a shortcut can be used: noninvasive testing should be considered if a patient has any 2 of the following: (1) intermediate clinical risk (stable angina or old MI, compensated heart failure, diabetes mellitus, renal insufficiency), (2) high‐risk surgery (aortic or major vascular procedures, prolonged surgery with significant expected blood loss or fluid shifts), or (3) poor exercise capacity (<4 METs). Patients with major clinical predictors (unstable coronary syndromes, decompensated heart failure, severe valvular heart disease, or hemodynamically significant arrhythmias) should not undergo elective surgery without further workup or treatment. The ACP guidelines use the Detsky3 modified CRI and low‐risk variables to suggest any need for further testing depending on type of surgery (vascular or nonvascular). At times these 2 guidelines offer conflicting recommendations, with the ACC more likely than the ACP to recommend NIT. The RCRI, which was developed prospectively and has been validated, uses 6 predictors of major cardiac complicationshigh‐risk surgery, coronary artery disease, stroke, congestive heart failure, diabetes mellitus requiring insulin, and serum creatinine > 2 mg/dL. Patients with 0 or 1 risk factors are considered at low risk, those with 2 risk factors at moderate risk, and those with 3 or more risk factors at high risk (10% complication rate). Although the RCRI does not make recommendations about whether to test, it has been incorporated into a number of algorithms combining risk stratification with recommendations about noninvasive testing as well as use of perioperative beta‐blockers.710 0
|
DIAGNOSTIC CARDIAC TESTS
Tests should not be done if the results will not alter patient management. If further assessment is indicated based on the ACC/AHA algorithm, other risk indices,10 or criteria independent of the need for surgery, the physician must decide whether to do a noninvasive (eg, echocardiogram or stress test) or an invasive test (coronary angiography). Unless a patient has independent criteria for angiography or, occasionally, a very high prior probability of significant CAD based on multiple risk factors, noninvasive testing is usually the preferred first step. A resting echocardiogram is potentially useful for providing information about suspected valvular heart disease but is not a consistent predictor of ischemic events.
For ambulatory patients, exercise stress testing is usually preferred over pharmacologic testing; in the perioperative setting, the usefulness of exercise testing is limited by the indications for obtaining stress testing (namely, poor functional status) as well as its main limitation, patient inability to reach 85% of the target heart rate. As a result, pharmacologic stress testing should be the primary modality for patients requiring preoperative risk stratification. Pharmacologic stress testing can be done with nuclear imaging (dipyridamole or adenosine thallium) or echocardiography (dobutamine echocardiography). For the most part, the results are comparable,11, 12 with both having excellent negative predictive values (NPV > 95%) but poor positive predictive values (PPV < 20%); however, dobutamine echocardiography tends to have fewer false positives. Dipyridamole or adenosine testing is relatively contraindicated with bronchospasm and COPD but is preferred over exercise or dobutamine for patients with a left bundle‐branch block. Suspected critical aortic stenosis is a contraindication to stress testing. Positive noninvasive findings should result in prophylactic measures, either medical therapy or an invasive procedure.
CORONARY REVASCULARIZATION
Coronary Artery Bypass Grafting
Observational studies have shown that patients with CAD (in the CASS study) treated by coronary artery bypass grafting (CABG) surgery versus had a lower mortality (0.9% vs. 2.4%) and fewer nonfatal myocardial infarctions (0.7% vs. 1.1%) than patients treated with medical therapy who underwent noncardiac surgery months or years later.13 This protective effect of CABG lasted approximately 46 years; however, there was no benefit for low‐risk noncardiac procedures. Furthermore, the risk of perioperative mortality (3%) and morbidity associated with the CABG itself was not taken into account, which would have negated its potential benefit.
Percutaneous Coronary Intervention
Several reports suggested that a previous percutaneous coronary intervention (PCI) was also associated with a lower risk of perioperative mortality and nonfatal myocardial infarction (MI) compared to historical controls. Early studies suggested that noncardiac surgery could be performed as early as 710 days after balloon angioplasty (BA). As bare‐metal stents gradually replaced BA, subsequent reports highlighted the increased risk of noncardiac surgery within 2 weeks14 and then within 46 weeks15 after stenting. This was primarily because of in‐stent thrombosis associated with premature discontinuation of dual antiplatelet therapy or increased major bleeding if this therapy was continued. The current recommendation is to wait at least 46 weeks after inserting a bare‐metal stent and to discontinue clopidogrel aspirin at least 5 days before surgery. A recent review from the Mayo Clinic16 found BA to be reasonably safe if patients require surgery soon after cardiac intervention (after 2 weeks).
More recently drug‐eluting stents (DESs) have become the standard; however, the recommendations for antiplatelet therapy (in the absence of surgery) are for a minimum of 23 months after sirolimus‐coated stents and at least 6 months after stents with paclitaxel. There has been very little in the published literature on patients undergoing noncardiac surgery after drug‐eluting stents. A small retrospective review suggested that patients whose DES had been placed a median of 260 days before surgery had few cardiac events in the perioperative period.17 The recommendations of a French task force did not provide strong guidance, probably because of a lack of evidence.18 The only prospective study of stenting and noncardiac surgery involved continuing antiplatelet therapy (or stopping it less than 3 days before surgery) and using unfractionated heparin or enoxaparin in 103 patients. Despite this therapy, 5 patients died, 12 had myocardial infarctions, 22 had elevation of troponin, but only 4 had major bleeding. Patients with stenting less than 35 days before surgery were at the greatest risk.19 In view of these findings, if noncardiac surgery must be performed within 2 months and the patient is appropriate for PCI, balloon angioplasty or a bare‐metal stent is preferred over DES implantation. If a patient has a DES in place (particularly if it has been fewer than 6 months since implantation) and requires noncardiac surgery, the optimal approach would be to continue at least one if not both antiplatelet agents through surgery; if this is not possible, bridging therapy with intravenous IIB/IIIA receptor blockers has been a suggested approach.10
Revascularization Versus No Revascularization: the CARP Trial
The only randomized controlled study to compare invasive and noninvasive strategies was the Coronary Artery Revascularization Prophylaxis (CARP) trial.20 More than 5800 patients with stable cardiac symptoms scheduled for elective nonvascular surgery in VA hospitals were screened, approximately 20% underwent coronary angiography, and 510 patients (9% of the original group) were randomized to PCI/CABG or no revascularization. Revascularization was associated with 1.7% mortality and a 5.8% nonfatal MI rate, and an additional 4% died after successful revascularization while awaiting vascular surgery. Short‐term outcomes were similar in both the revascularization and no revascularization groups (3% 30‐day mortality and 8%12% perioperative nonfatal MI). The primary outcome, long‐term mortality, also did not differ between the groups (22% vs. 23%) after an average follow‐up of 2.7 years. The investigators concluded on the basis of this data that prophylactic revascularization could not be recommended for patients with stable CAD undergoing elective vascular surgery. Of note is that both groups of patients in the CARP trial were given intensive medical therapy, with 84% on beta‐blockers, 54% on statins, 51% on ACE inhibitors, and 73% on aspirin, which may have made it difficult to show any significant benefit of revascularization. Other limitations of that study are that it was underpowered to detect a short‐term benefit and excluded patients with unstable or more severe cardiac symptoms or disease (left main disease, aortic stenosis, and severe left ventricular dysfunction). In any case, the results of this support the ACC guidelines, which state that prophylactic revascularization is rarely necessary just to get the patient through surgery.
If the goal of risk stratification is to determine which patients are at increased risk and if revascularization fails to lower that risk, various medical therapies, including beta‐blockers, alpha‐agonists, and statins, should be considered as risk‐reduction strategies.
PHARMACOLOGIC STRATEGIES
Cardioprotection with Adrenergic Modulation and Statin Therapy
Support for adrenergic modulation (with beta‐blockers and alpha‐agonists) to prevent postoperative cardiac complications has been the subject of a number of reviews, including our own.7, 8, 21 Initial enthusiasm22, 23 has been tempered, however, as evidence has evolved.
The results of a randomized trial published in abstract form24 showed no significant difference in rates of a combined end point of mortality, myocardial infarction, heart failure, and ventricular arrhythmia 30 days after vascular surgery of 500 patients randomized to metoprolol or placebo. Furthermore, in a randomized trial of 107 aortic surgery patients with no history of coronary disease, metoprolol started on admission and continued for 7 days did not significantly reduce cardiac events.25 In addition, a well‐designed meta‐analysis suggested that there are too few data to definitively determine whether perioperative beta‐blockade is efficacious.26 Finally, the results of a rigorously analyzed observational trial using administrative data from nearly 700,000 patients suggested that perioperative beta‐blockade was protective (reduced mortality) only in higher‐risk patients (eg, RCRI 2 points). In those at lower risk, beta blockade was associated with a higher risk of complications, even if the lower‐risk patients had only 1 risk factor of either diabetes or coronary disease.27
Trials of alpha adrenergic agonists have also been summarized in at least 2 meta‐analyses. One of these meta‐analyses reported alpha‐2 agonists reduced mortality by nearly half and reduced postoperative myocardial infarction by a third in vascular patients, but had no benefit in others.28 Another meta‐analysis calculated that 83 patients needed to be treated with alpha‐agonists to prevent one cardiac event,29 a number higher than that for beta‐blockers.
Data on the effectiveness of statins is accumulating. The results of 5 observational trials3034 and 1 randomized study35 suggest that patients receiving statin therapy at the time of surgery (and afterward) have a lower risk of having a cardiac event and lower mortality, with relative reductions in risk between 80%30 and 30%.32 In the 1 randomized trial, of 100 vascular surgery patients, 20 mg/day of atorvastatin was begun 1 month before surgery and continued for 45 days,35 with beta‐blockers included per protocol. This protocol reduced the combined outcome of cardiac mortality, myocardial infarction, stroke, or unstable angina, but the overall number of events was very small (4 patients vs. 13 patients, P = .03). However, no patient required discontinuation of the drug because of side effects.
HOW SHOULD I INCORPORATE EVIDENCE INTO PRACTICE?
Target Patients Most Likely to Benefit
Recent trends in evidence increasingly support the idea that lower‐risk subgroups (such as those with the minor criteria employed by Mangano) may not benefit from perioperative beta‐blockers and that only higher‐risk subgroups should be targeted. This general approach was recommended in recent guidelines from the AHA‐ACC,36 as well as in an extensive review of perioperative cardiac risk management.10 The strongest recommendations were to continue beta‐blockers in patients already on them and to give them to patients scheduled for vascular surgery who had ischemia on a stress test. The ACC also stated that beta‐blockers were probably recommended for patients with known CAD or high cardiac risk scheduled for intermediate‐ to high‐risk surgery. Recommendations for other groups were weaker or lacked sufficient evidence.36 At this point, it seems prudent to target high‐risk patients (RCRI 2), as well as those who would require beta‐blockers or statin therapy regardless (eg, patients with known coronary artery disease). There are no data to suggest that dose titration of statins is required before surgery.
Be Aware of How Harm Might Be Produced
Notwithstanding its limitations, results from the recent observational trial from Lindenauer raise important questions about the effectiveness of beta‐blockers in practice. That is, are beta‐blockers safe and effective when used in surgical patients outside the tightly controlled setting of a randomized trial? It is apparent how titrating beta‐blockers to a target heart rate without careful clinical assessment (as occurred in most RCTs) might lead to beta‐blockers being used to treat tachycardia related to hypovolemia, pain, anemia, bleeding, or early sepsis. Interestingly, beta‐blockers may be associated with higher risk in other settings as well,37 so potential harm in the perioperative period are not completely surprising.
Use a Protocol That Sticks as Close to the Evidence as Possible
To stay as close as possible to what the evidence shows for the use of beta‐blockers, this drug should be started early enough to allow dose titration and continued for at least 7 days and optimally 30 days after surgery (indefinitely, if a patient requires it long term), working to ensure that patients are physiologically beta‐blocked (eg, heart rate 5565) for as much of the time that they are being treated as possible. Two recent studies demonstrated the importance of tight heart rate control38, 39higher doses of beta‐blockers and tight heart rate control were associated with reduced perioperative myocardial ischemia and troponin T release, which might obviate the need for preoperative cardiac testing in intermediate‐risk patients undergoing vascular surgery. A recent placebo‐controlled, randomized trial40 suggested that a simple strategy of 4 days of transdermal and oral clonidine reduced perioperative ischemia and mortality. Although this approach is very useful for patients who cannot take pills by mouth, it would necessitate a switch to beta‐blockers for patients who need them long term. In addition, use of clonidine may be associated with a higher risk of withdrawal than cardioselective beta‐blockers. No prospective trials have compared beta‐blockers and alpha‐2 agonists. Both produce hypotension and bradycardia, improve pain control, and rarely produce adverse pulmonary effects.41 At the least, consultants should be clear in their recommendations about the start and stop dates for beta‐blockers and should ensure a smooth outpatient transition of patients for whom long‐term statin or beta‐blocker therapy is needed.
Be Ready to Adjust Your Practice as the Evidence Continues to Evolve
Far too few patients have been randomized to beta‐blockers, adrenergic modulation, or statin therapy to date to provide a reasonable estimate of their effects on mortality. As a result, although it seems likely that some subgroups benefit from one or more of these therapies, the degree of risk requiredand an optimal dosing scheduleremains a subject of intense debate. The results of perioperative trials of adrenergic modulators have consistently provided evidence supporting their use in other patient populations, but larger studies may not confirm a beneficial effect. Ongoing Canadian (POISE) and European trials (DECREASE IV) should address sample size limitations and provide information critical for clinicians caring for patients in this era of rapidly evolving evidence.
- ,,,,,.Surveillance and prevention of major perioperative ischemic cardiac events in patients undergoing noncardiac surgery: A review.CMAJ.2005;173:779–788.
- ,,, et al.Multifactorial index of cardiac risk in noncardiac surgical procedures.N Engl J Med.1977;297:845–850.
- ,,,,.Cardiac assessment for patients undergoing noncardiac surgery. A multifactorial clinical risk index.Arch Intern Med.1986;146:2131–2134.
- ,.Perioperative assessment and management of risk from coronary artery disease.Ann Intern Med.1997;127:313–328.
- ,,, et al.ACC/AHA guideline update for perioperative cardiovascular evaluation for noncardiac surgery—executive summary a report of the American College of Cardiology/American Heart Association Task Force on Practice Guidelines (Committee to Update the 1996 Guidelines on Perioperative Cardiovascular Evaluation for Noncardiac Surgery).Circulation.2002;105:1257–1267.
- .Reducing cardiac risk in noncardiac surgery.N Engl J Med.1999;341:1838–1840.
- ,.beta‐Blockers and reduction of cardiac events in noncardiac surgery: scientific review.JAMA.2002;287:1435–1444.
- ,.Clinical practice. Lowering cardiac risk in noncardiac surgery.N Engl J Med.2001;345:1677–1682.
- ,,, et al.Predictors of cardiac events after major vascular surgery: Role of clinical characteristics, dobutamine echocardiography, and beta‐blocker therapy.JAMA.2001;285:1865–1873.
- ,.Assessing and reducing the cardiac risk of noncardiac surgery.Circulation.2006;113:1361–1376.
- ,,, et al.A meta‐analysis comparing the prognostic accuracy of six diagnostic tests for predicting perioperative cardiac risk in patients undergoing major vascular surgery.Heart.2003;89:1327–1334.
- ,,,.Exercise echocardiography or exercise SPECT imaging? A meta‐analysis of diagnostic test performance.JAMA.1998;280:913–920.
- ,,,,,.Cardiac risk of noncardiac surgery: influence of coronary disease and type of surgery in 3368 operations. CASS Investigators and University of Michigan Heart Care Program. Coronary Artery Surgery Study.Circulation.1997;96:1882–1887.
- ,,,,.Catastrophic outcomes of noncardiac surgery soon after coronary stenting.J Am Coll Cardiol.2000;35:1288–1294.
- ,,, et al.Clinical outcome of patients undergoing non‐cardiac surgery in the two months following coronary stenting.J Am Coll Cardiol.2003;42:234–240.
- ,,, et al.Outcome of patients undergoing balloon angioplasty in the two months prior to noncardiac surgery.Am J Cardiol.2005;96:512–514.
- ,,,,.Risk of noncardiac surgery after coronary drug‐eluting stent implantation.Am J Cardiol.2006;98:1212–1213.
- ,,,.Perioperative management of antiplatelet agents in patients with coronary stents: recommendations of a French Task Force.Br J Anaesth.2006;97:580–582.
- ,,,,,.Coronary artery stenting and non‐cardiac surgery—a prospective outcome study.Br J Anaesth.2006;96:686–693.
- ,,, et al.Coronary‐artery revascularization before elective major vascular surgery.N Engl J Med.2004;351:2795–2804.
- ,.Perioperative cardiac assessment for noncardiac surgery: eight steps to the best possible outcome.Circulation.2003;107:2771–2774.
- .Effect of atenolol on mortality and cardiovascular morbidity after noncardiac surgery.N Engl J Med.1997;336:1452; discussion1453–1454.
- ,,, et al.The effect of bisoprolol on perioperative mortality and myocardial infarction in high‐risk patients undergoing vascular surgery.Dutch Echocardiographic Cardiac Risk Evaluation Applying Stress Echocardiography Study Group.N Engl J Med.1999;341:1789–1794.
- ,,,,.Metoprolol after vascular surgery (MAVS).Can J Anesth.2004;51:A7.
- ,,,,.Perioperative beta‐blockade (POBBLE) for patients undergoing infrarenal vascular surgery: results of a randomized double‐blind controlled trial.J Vasc Surg.2005;41:602–609.
- ,,, et al.How strong is the evidence for the use of perioperative beta blockers in non‐cardiac surgery? Systematic review and meta‐analysis of randomised controlled trials.BMJ.2005;331:313–321.
- ,,,,,.Perioperative beta‐blocker therapy and mortality after major noncardiac surgery.N Engl J Med.2005;353:349–361.
- ,,.Alpha‐2 adrenergic agonists to prevent perioperative cardiovascular complications: a meta‐analysis.Am J Med.2003;114:742–752.
- ,,.Pharmacologic myocardial protection in patients undergoing noncardiac surgery: a quantitative systematic review.Anesth Analg.2003;97:623–633.
- ,,, et al.A combination of statins and beta‐blockers is independently associated with a reduction in the incidence of perioperative mortality and nonfatal myocardial infarction in patients undergoing abdominal aortic aneurysm surgery.Eur J Vasc Endovasc Surg.2004;28:343–352.
- ,,,,.Lipid‐lowering therapy and in‐hospital mortality following major noncardiac surgery.JAMA.2004;291:2092–2099.
- ,,, et al.Statins decrease perioperative cardiac complications in patients undergoing noncardiac vascular surgery The Statins for Risk Reduction in Surgery (StaRRS) study.J Am Coll Cardiol.2005;45:336–342.
- ,,, et al.Statins are associated with a reduced incidence of perioperative mortality in patients undergoing major noncardiac vascular surgery.Circulation.2003;107:1848–1851.
- ,,, et al.Effects of atorvastatin on early recurrent ischemic events in acute coronary syndromes: the MIRACL study: a randomized controlled trial.JAMA.2001;285:1711–1718.
- ,,, et al.Reduction in cardiovascular events after vascular surgery with atorvastatin: a randomized trial.J Vasc Surg.2004;39:967–975; discussion975–976.
- ,,, et al.ACC/AHA 2006 guideline update on perioperative cardiovascular evaluation for noncardiac surgery: focused update on perioperative beta‐blocker therapy: a report of the American College of Cardiology/American Heart Association Task Force on Practice Guidelines (Writing Committee to Update the 2002 Guidelines on Perioperative Cardiovascular Evaluation for Noncardiac Surgery): developed in collaboration with the American Society of Echocardiography, American Society of Nuclear Cardiology, Heart Rhythm Society, Society of Cardiovascular Anesthesiologists, Society for Cardiovascular Angiography and Interventions, and Society for Vascular Medicine and Biology.Circulation.2006;113:2662–2674.
- ,,.Atenolol in hypertension: is it a wise choice?Lancet.2004;364:1684–1689.
- ,,, et al.Should major vascular surgery be delayed because of preoperative cardiac testing in intermediate‐risk patients receiving beta‐blocker therapy with tight heart rate control?J Am Coll Cardiol.2006;48:964–969.
- ,,, et al.High‐dose beta‐blockers and tight heart rate control reduce myocardial ischemia and troponin T release in vascular surgery patients.Circulation.2006;114:1344–1349.
- ,,, et al.Effect of clonidine on cardiovascular morbidity and mortality after noncardiac surgery.Anesthesiology.2004;101:284–293.
- ,,.Cardioselective beta‐blockers in patients with reactive airway disease: a meta‐analysis.Ann Intern Med.2002;137:715–725.
- ,,.Does this patient have an abnormal systolic murmur?JAMA.1997;277:564–571.
More than 33 million patients undergo surgery annually in the United States. Approximately 8 million of these patients either have known coronary artery disease or risk factors for it, and an estimated 50,000 patients sustain a perioperative myocardial infarction, with an additional 1 million developing another medical complication. An integrated comprehensive approach is necessary to risk‐stratify these patients in an attempt to reduce these complications.
The basic role of risk stratification is to identify those patients at increased risk for complications; however, we are looking for a small number of patients at high risk in a population of relatively low‐risk patients. Most surgical patients do well, and further diagnostic testing has a low yield in predicting those likely to have a complication (poor positive predictive value [PPV]). Our goal should be to determine the underlying potential triggers of cardiac complications and institute measures to prevent them. After briefly reviewing pathophysiology, risk indices, and guidelines for preoperative cardiac risk assessment and diagnostic testing, we will focus on risk reduction strategies including prophylactic revascularization (CABG/PCI) and medical therapy.
PATHOPHYSIOLOGY OF PERIOPERATIVE MYOCARDIAL INFARCTION
Perioperative myocardial infarctions result from myocardial ischemia or plaque rupture and coronary thrombosis.1 Myocardial ischemia may be caused by increased oxygen demand or decreased oxygen delivery. Surgical trauma, anesthesia, pain, hypothermia, and bleeding trigger a stress state. This in turn increases catecholamine release, leading to tachycardia, hypertension, and increased oxygen demand. Anesthesia, hypotension, bleeding, and anemia may produce hypoxia, with subsequently decreased delivery of oxygen. Surgical trauma initiates an inflammatory response, leading to plaque fissuring, and a hypercoagulable state, which can result in acute coronary thrombosis. Perioperative prophylaxis should target these potential triggers.
CARDIAC RISK INDICES AND GUIDELINES
Over the past 3 decades, a number of cardiac risk indices have been published. The older group of indices was most notable for Goldman's original cardiac risk index2 and Detsky's modification.3 The newer group consists of the American College of Physicians (ACP) guidelines4 (now considered outdated), the American College of Cardiology/American Heart Association (ACC/AHA) guidelines (to be updated again in early 2007),5 and the Lee revised cardiac risk index (RCRI).6
The 2002 ACC guidelines5 outline how to determine the need for additional cardiac (usually noninvasive) testing (NIT): after ascertaining the urgency of surgery, history of revascularization procedures, and previous stress test results (if any), a combination of clinical risk predictors, surgery‐specific risk, and patient self‐reported exercise capacity should be entered into an algorithm. The guidelines state a shortcut can be used: noninvasive testing should be considered if a patient has any 2 of the following: (1) intermediate clinical risk (stable angina or old MI, compensated heart failure, diabetes mellitus, renal insufficiency), (2) high‐risk surgery (aortic or major vascular procedures, prolonged surgery with significant expected blood loss or fluid shifts), or (3) poor exercise capacity (<4 METs). Patients with major clinical predictors (unstable coronary syndromes, decompensated heart failure, severe valvular heart disease, or hemodynamically significant arrhythmias) should not undergo elective surgery without further workup or treatment. The ACP guidelines use the Detsky3 modified CRI and low‐risk variables to suggest any need for further testing depending on type of surgery (vascular or nonvascular). At times these 2 guidelines offer conflicting recommendations, with the ACC more likely than the ACP to recommend NIT. The RCRI, which was developed prospectively and has been validated, uses 6 predictors of major cardiac complicationshigh‐risk surgery, coronary artery disease, stroke, congestive heart failure, diabetes mellitus requiring insulin, and serum creatinine > 2 mg/dL. Patients with 0 or 1 risk factors are considered at low risk, those with 2 risk factors at moderate risk, and those with 3 or more risk factors at high risk (10% complication rate). Although the RCRI does not make recommendations about whether to test, it has been incorporated into a number of algorithms combining risk stratification with recommendations about noninvasive testing as well as use of perioperative beta‐blockers.710 0
|
DIAGNOSTIC CARDIAC TESTS
Tests should not be done if the results will not alter patient management. If further assessment is indicated based on the ACC/AHA algorithm, other risk indices,10 or criteria independent of the need for surgery, the physician must decide whether to do a noninvasive (eg, echocardiogram or stress test) or an invasive test (coronary angiography). Unless a patient has independent criteria for angiography or, occasionally, a very high prior probability of significant CAD based on multiple risk factors, noninvasive testing is usually the preferred first step. A resting echocardiogram is potentially useful for providing information about suspected valvular heart disease but is not a consistent predictor of ischemic events.
For ambulatory patients, exercise stress testing is usually preferred over pharmacologic testing; in the perioperative setting, the usefulness of exercise testing is limited by the indications for obtaining stress testing (namely, poor functional status) as well as its main limitation, patient inability to reach 85% of the target heart rate. As a result, pharmacologic stress testing should be the primary modality for patients requiring preoperative risk stratification. Pharmacologic stress testing can be done with nuclear imaging (dipyridamole or adenosine thallium) or echocardiography (dobutamine echocardiography). For the most part, the results are comparable,11, 12 with both having excellent negative predictive values (NPV > 95%) but poor positive predictive values (PPV < 20%); however, dobutamine echocardiography tends to have fewer false positives. Dipyridamole or adenosine testing is relatively contraindicated with bronchospasm and COPD but is preferred over exercise or dobutamine for patients with a left bundle‐branch block. Suspected critical aortic stenosis is a contraindication to stress testing. Positive noninvasive findings should result in prophylactic measures, either medical therapy or an invasive procedure.
CORONARY REVASCULARIZATION
Coronary Artery Bypass Grafting
Observational studies have shown that patients with CAD (in the CASS study) treated by coronary artery bypass grafting (CABG) surgery versus had a lower mortality (0.9% vs. 2.4%) and fewer nonfatal myocardial infarctions (0.7% vs. 1.1%) than patients treated with medical therapy who underwent noncardiac surgery months or years later.13 This protective effect of CABG lasted approximately 46 years; however, there was no benefit for low‐risk noncardiac procedures. Furthermore, the risk of perioperative mortality (3%) and morbidity associated with the CABG itself was not taken into account, which would have negated its potential benefit.
Percutaneous Coronary Intervention
Several reports suggested that a previous percutaneous coronary intervention (PCI) was also associated with a lower risk of perioperative mortality and nonfatal myocardial infarction (MI) compared to historical controls. Early studies suggested that noncardiac surgery could be performed as early as 710 days after balloon angioplasty (BA). As bare‐metal stents gradually replaced BA, subsequent reports highlighted the increased risk of noncardiac surgery within 2 weeks14 and then within 46 weeks15 after stenting. This was primarily because of in‐stent thrombosis associated with premature discontinuation of dual antiplatelet therapy or increased major bleeding if this therapy was continued. The current recommendation is to wait at least 46 weeks after inserting a bare‐metal stent and to discontinue clopidogrel aspirin at least 5 days before surgery. A recent review from the Mayo Clinic16 found BA to be reasonably safe if patients require surgery soon after cardiac intervention (after 2 weeks).
More recently drug‐eluting stents (DESs) have become the standard; however, the recommendations for antiplatelet therapy (in the absence of surgery) are for a minimum of 23 months after sirolimus‐coated stents and at least 6 months after stents with paclitaxel. There has been very little in the published literature on patients undergoing noncardiac surgery after drug‐eluting stents. A small retrospective review suggested that patients whose DES had been placed a median of 260 days before surgery had few cardiac events in the perioperative period.17 The recommendations of a French task force did not provide strong guidance, probably because of a lack of evidence.18 The only prospective study of stenting and noncardiac surgery involved continuing antiplatelet therapy (or stopping it less than 3 days before surgery) and using unfractionated heparin or enoxaparin in 103 patients. Despite this therapy, 5 patients died, 12 had myocardial infarctions, 22 had elevation of troponin, but only 4 had major bleeding. Patients with stenting less than 35 days before surgery were at the greatest risk.19 In view of these findings, if noncardiac surgery must be performed within 2 months and the patient is appropriate for PCI, balloon angioplasty or a bare‐metal stent is preferred over DES implantation. If a patient has a DES in place (particularly if it has been fewer than 6 months since implantation) and requires noncardiac surgery, the optimal approach would be to continue at least one if not both antiplatelet agents through surgery; if this is not possible, bridging therapy with intravenous IIB/IIIA receptor blockers has been a suggested approach.10
Revascularization Versus No Revascularization: the CARP Trial
The only randomized controlled study to compare invasive and noninvasive strategies was the Coronary Artery Revascularization Prophylaxis (CARP) trial.20 More than 5800 patients with stable cardiac symptoms scheduled for elective nonvascular surgery in VA hospitals were screened, approximately 20% underwent coronary angiography, and 510 patients (9% of the original group) were randomized to PCI/CABG or no revascularization. Revascularization was associated with 1.7% mortality and a 5.8% nonfatal MI rate, and an additional 4% died after successful revascularization while awaiting vascular surgery. Short‐term outcomes were similar in both the revascularization and no revascularization groups (3% 30‐day mortality and 8%12% perioperative nonfatal MI). The primary outcome, long‐term mortality, also did not differ between the groups (22% vs. 23%) after an average follow‐up of 2.7 years. The investigators concluded on the basis of this data that prophylactic revascularization could not be recommended for patients with stable CAD undergoing elective vascular surgery. Of note is that both groups of patients in the CARP trial were given intensive medical therapy, with 84% on beta‐blockers, 54% on statins, 51% on ACE inhibitors, and 73% on aspirin, which may have made it difficult to show any significant benefit of revascularization. Other limitations of that study are that it was underpowered to detect a short‐term benefit and excluded patients with unstable or more severe cardiac symptoms or disease (left main disease, aortic stenosis, and severe left ventricular dysfunction). In any case, the results of this support the ACC guidelines, which state that prophylactic revascularization is rarely necessary just to get the patient through surgery.
If the goal of risk stratification is to determine which patients are at increased risk and if revascularization fails to lower that risk, various medical therapies, including beta‐blockers, alpha‐agonists, and statins, should be considered as risk‐reduction strategies.
PHARMACOLOGIC STRATEGIES
Cardioprotection with Adrenergic Modulation and Statin Therapy
Support for adrenergic modulation (with beta‐blockers and alpha‐agonists) to prevent postoperative cardiac complications has been the subject of a number of reviews, including our own.7, 8, 21 Initial enthusiasm22, 23 has been tempered, however, as evidence has evolved.
The results of a randomized trial published in abstract form24 showed no significant difference in rates of a combined end point of mortality, myocardial infarction, heart failure, and ventricular arrhythmia 30 days after vascular surgery of 500 patients randomized to metoprolol or placebo. Furthermore, in a randomized trial of 107 aortic surgery patients with no history of coronary disease, metoprolol started on admission and continued for 7 days did not significantly reduce cardiac events.25 In addition, a well‐designed meta‐analysis suggested that there are too few data to definitively determine whether perioperative beta‐blockade is efficacious.26 Finally, the results of a rigorously analyzed observational trial using administrative data from nearly 700,000 patients suggested that perioperative beta‐blockade was protective (reduced mortality) only in higher‐risk patients (eg, RCRI 2 points). In those at lower risk, beta blockade was associated with a higher risk of complications, even if the lower‐risk patients had only 1 risk factor of either diabetes or coronary disease.27
Trials of alpha adrenergic agonists have also been summarized in at least 2 meta‐analyses. One of these meta‐analyses reported alpha‐2 agonists reduced mortality by nearly half and reduced postoperative myocardial infarction by a third in vascular patients, but had no benefit in others.28 Another meta‐analysis calculated that 83 patients needed to be treated with alpha‐agonists to prevent one cardiac event,29 a number higher than that for beta‐blockers.
Data on the effectiveness of statins is accumulating. The results of 5 observational trials3034 and 1 randomized study35 suggest that patients receiving statin therapy at the time of surgery (and afterward) have a lower risk of having a cardiac event and lower mortality, with relative reductions in risk between 80%30 and 30%.32 In the 1 randomized trial, of 100 vascular surgery patients, 20 mg/day of atorvastatin was begun 1 month before surgery and continued for 45 days,35 with beta‐blockers included per protocol. This protocol reduced the combined outcome of cardiac mortality, myocardial infarction, stroke, or unstable angina, but the overall number of events was very small (4 patients vs. 13 patients, P = .03). However, no patient required discontinuation of the drug because of side effects.
HOW SHOULD I INCORPORATE EVIDENCE INTO PRACTICE?
Target Patients Most Likely to Benefit
Recent trends in evidence increasingly support the idea that lower‐risk subgroups (such as those with the minor criteria employed by Mangano) may not benefit from perioperative beta‐blockers and that only higher‐risk subgroups should be targeted. This general approach was recommended in recent guidelines from the AHA‐ACC,36 as well as in an extensive review of perioperative cardiac risk management.10 The strongest recommendations were to continue beta‐blockers in patients already on them and to give them to patients scheduled for vascular surgery who had ischemia on a stress test. The ACC also stated that beta‐blockers were probably recommended for patients with known CAD or high cardiac risk scheduled for intermediate‐ to high‐risk surgery. Recommendations for other groups were weaker or lacked sufficient evidence.36 At this point, it seems prudent to target high‐risk patients (RCRI 2), as well as those who would require beta‐blockers or statin therapy regardless (eg, patients with known coronary artery disease). There are no data to suggest that dose titration of statins is required before surgery.
Be Aware of How Harm Might Be Produced
Notwithstanding its limitations, results from the recent observational trial from Lindenauer raise important questions about the effectiveness of beta‐blockers in practice. That is, are beta‐blockers safe and effective when used in surgical patients outside the tightly controlled setting of a randomized trial? It is apparent how titrating beta‐blockers to a target heart rate without careful clinical assessment (as occurred in most RCTs) might lead to beta‐blockers being used to treat tachycardia related to hypovolemia, pain, anemia, bleeding, or early sepsis. Interestingly, beta‐blockers may be associated with higher risk in other settings as well,37 so potential harm in the perioperative period are not completely surprising.
Use a Protocol That Sticks as Close to the Evidence as Possible
To stay as close as possible to what the evidence shows for the use of beta‐blockers, this drug should be started early enough to allow dose titration and continued for at least 7 days and optimally 30 days after surgery (indefinitely, if a patient requires it long term), working to ensure that patients are physiologically beta‐blocked (eg, heart rate 5565) for as much of the time that they are being treated as possible. Two recent studies demonstrated the importance of tight heart rate control38, 39higher doses of beta‐blockers and tight heart rate control were associated with reduced perioperative myocardial ischemia and troponin T release, which might obviate the need for preoperative cardiac testing in intermediate‐risk patients undergoing vascular surgery. A recent placebo‐controlled, randomized trial40 suggested that a simple strategy of 4 days of transdermal and oral clonidine reduced perioperative ischemia and mortality. Although this approach is very useful for patients who cannot take pills by mouth, it would necessitate a switch to beta‐blockers for patients who need them long term. In addition, use of clonidine may be associated with a higher risk of withdrawal than cardioselective beta‐blockers. No prospective trials have compared beta‐blockers and alpha‐2 agonists. Both produce hypotension and bradycardia, improve pain control, and rarely produce adverse pulmonary effects.41 At the least, consultants should be clear in their recommendations about the start and stop dates for beta‐blockers and should ensure a smooth outpatient transition of patients for whom long‐term statin or beta‐blocker therapy is needed.
Be Ready to Adjust Your Practice as the Evidence Continues to Evolve
Far too few patients have been randomized to beta‐blockers, adrenergic modulation, or statin therapy to date to provide a reasonable estimate of their effects on mortality. As a result, although it seems likely that some subgroups benefit from one or more of these therapies, the degree of risk requiredand an optimal dosing scheduleremains a subject of intense debate. The results of perioperative trials of adrenergic modulators have consistently provided evidence supporting their use in other patient populations, but larger studies may not confirm a beneficial effect. Ongoing Canadian (POISE) and European trials (DECREASE IV) should address sample size limitations and provide information critical for clinicians caring for patients in this era of rapidly evolving evidence.
- ,,,,,.Surveillance and prevention of major perioperative ischemic cardiac events in patients undergoing noncardiac surgery: A review.CMAJ.2005;173:779–788.
- ,,, et al.Multifactorial index of cardiac risk in noncardiac surgical procedures.N Engl J Med.1977;297:845–850.
- ,,,,.Cardiac assessment for patients undergoing noncardiac surgery. A multifactorial clinical risk index.Arch Intern Med.1986;146:2131–2134.
- ,.Perioperative assessment and management of risk from coronary artery disease.Ann Intern Med.1997;127:313–328.
- ,,, et al.ACC/AHA guideline update for perioperative cardiovascular evaluation for noncardiac surgery—executive summary a report of the American College of Cardiology/American Heart Association Task Force on Practice Guidelines (Committee to Update the 1996 Guidelines on Perioperative Cardiovascular Evaluation for Noncardiac Surgery).Circulation.2002;105:1257–1267.
- .Reducing cardiac risk in noncardiac surgery.N Engl J Med.1999;341:1838–1840.
- ,.beta‐Blockers and reduction of cardiac events in noncardiac surgery: scientific review.JAMA.2002;287:1435–1444.
- ,.Clinical practice. Lowering cardiac risk in noncardiac surgery.N Engl J Med.2001;345:1677–1682.
- ,,, et al.Predictors of cardiac events after major vascular surgery: Role of clinical characteristics, dobutamine echocardiography, and beta‐blocker therapy.JAMA.2001;285:1865–1873.
- ,.Assessing and reducing the cardiac risk of noncardiac surgery.Circulation.2006;113:1361–1376.
- ,,, et al.A meta‐analysis comparing the prognostic accuracy of six diagnostic tests for predicting perioperative cardiac risk in patients undergoing major vascular surgery.Heart.2003;89:1327–1334.
- ,,,.Exercise echocardiography or exercise SPECT imaging? A meta‐analysis of diagnostic test performance.JAMA.1998;280:913–920.
- ,,,,,.Cardiac risk of noncardiac surgery: influence of coronary disease and type of surgery in 3368 operations. CASS Investigators and University of Michigan Heart Care Program. Coronary Artery Surgery Study.Circulation.1997;96:1882–1887.
- ,,,,.Catastrophic outcomes of noncardiac surgery soon after coronary stenting.J Am Coll Cardiol.2000;35:1288–1294.
- ,,, et al.Clinical outcome of patients undergoing non‐cardiac surgery in the two months following coronary stenting.J Am Coll Cardiol.2003;42:234–240.
- ,,, et al.Outcome of patients undergoing balloon angioplasty in the two months prior to noncardiac surgery.Am J Cardiol.2005;96:512–514.
- ,,,,.Risk of noncardiac surgery after coronary drug‐eluting stent implantation.Am J Cardiol.2006;98:1212–1213.
- ,,,.Perioperative management of antiplatelet agents in patients with coronary stents: recommendations of a French Task Force.Br J Anaesth.2006;97:580–582.
- ,,,,,.Coronary artery stenting and non‐cardiac surgery—a prospective outcome study.Br J Anaesth.2006;96:686–693.
- ,,, et al.Coronary‐artery revascularization before elective major vascular surgery.N Engl J Med.2004;351:2795–2804.
- ,.Perioperative cardiac assessment for noncardiac surgery: eight steps to the best possible outcome.Circulation.2003;107:2771–2774.
- .Effect of atenolol on mortality and cardiovascular morbidity after noncardiac surgery.N Engl J Med.1997;336:1452; discussion1453–1454.
- ,,, et al.The effect of bisoprolol on perioperative mortality and myocardial infarction in high‐risk patients undergoing vascular surgery.Dutch Echocardiographic Cardiac Risk Evaluation Applying Stress Echocardiography Study Group.N Engl J Med.1999;341:1789–1794.
- ,,,,.Metoprolol after vascular surgery (MAVS).Can J Anesth.2004;51:A7.
- ,,,,.Perioperative beta‐blockade (POBBLE) for patients undergoing infrarenal vascular surgery: results of a randomized double‐blind controlled trial.J Vasc Surg.2005;41:602–609.
- ,,, et al.How strong is the evidence for the use of perioperative beta blockers in non‐cardiac surgery? Systematic review and meta‐analysis of randomised controlled trials.BMJ.2005;331:313–321.
- ,,,,,.Perioperative beta‐blocker therapy and mortality after major noncardiac surgery.N Engl J Med.2005;353:349–361.
- ,,.Alpha‐2 adrenergic agonists to prevent perioperative cardiovascular complications: a meta‐analysis.Am J Med.2003;114:742–752.
- ,,.Pharmacologic myocardial protection in patients undergoing noncardiac surgery: a quantitative systematic review.Anesth Analg.2003;97:623–633.
- ,,, et al.A combination of statins and beta‐blockers is independently associated with a reduction in the incidence of perioperative mortality and nonfatal myocardial infarction in patients undergoing abdominal aortic aneurysm surgery.Eur J Vasc Endovasc Surg.2004;28:343–352.
- ,,,,.Lipid‐lowering therapy and in‐hospital mortality following major noncardiac surgery.JAMA.2004;291:2092–2099.
- ,,, et al.Statins decrease perioperative cardiac complications in patients undergoing noncardiac vascular surgery The Statins for Risk Reduction in Surgery (StaRRS) study.J Am Coll Cardiol.2005;45:336–342.
- ,,, et al.Statins are associated with a reduced incidence of perioperative mortality in patients undergoing major noncardiac vascular surgery.Circulation.2003;107:1848–1851.
- ,,, et al.Effects of atorvastatin on early recurrent ischemic events in acute coronary syndromes: the MIRACL study: a randomized controlled trial.JAMA.2001;285:1711–1718.
- ,,, et al.Reduction in cardiovascular events after vascular surgery with atorvastatin: a randomized trial.J Vasc Surg.2004;39:967–975; discussion975–976.
- ,,, et al.ACC/AHA 2006 guideline update on perioperative cardiovascular evaluation for noncardiac surgery: focused update on perioperative beta‐blocker therapy: a report of the American College of Cardiology/American Heart Association Task Force on Practice Guidelines (Writing Committee to Update the 2002 Guidelines on Perioperative Cardiovascular Evaluation for Noncardiac Surgery): developed in collaboration with the American Society of Echocardiography, American Society of Nuclear Cardiology, Heart Rhythm Society, Society of Cardiovascular Anesthesiologists, Society for Cardiovascular Angiography and Interventions, and Society for Vascular Medicine and Biology.Circulation.2006;113:2662–2674.
- ,,.Atenolol in hypertension: is it a wise choice?Lancet.2004;364:1684–1689.
- ,,, et al.Should major vascular surgery be delayed because of preoperative cardiac testing in intermediate‐risk patients receiving beta‐blocker therapy with tight heart rate control?J Am Coll Cardiol.2006;48:964–969.
- ,,, et al.High‐dose beta‐blockers and tight heart rate control reduce myocardial ischemia and troponin T release in vascular surgery patients.Circulation.2006;114:1344–1349.
- ,,, et al.Effect of clonidine on cardiovascular morbidity and mortality after noncardiac surgery.Anesthesiology.2004;101:284–293.
- ,,.Cardioselective beta‐blockers in patients with reactive airway disease: a meta‐analysis.Ann Intern Med.2002;137:715–725.
- ,,.Does this patient have an abnormal systolic murmur?JAMA.1997;277:564–571.
Editorial
See one, do one, teach one is a refrain familiar to all physicians. Historically, most procedural training has occurred at the bedside. In this model, senior residents, subspecialty fellows, or faculty members would demonstrate procedural skills to junior trainees, who would subsequently practice the procedures on patients, often with uneven, risky results. Acquisition of procedural skills by residents and fellows on inpatient wards is suboptimal for at least 2 reasons beyond the risks to patient safety: (1) clinical priorities are more important than educational priorities in this setting, and (2) the patient, not the medical learner, is the most important person in the room.
Recently, several new factors have challenged the traditional medical education model. For a variety of reasons, general internists currently perform far fewer invasive procedures than they used to.1 A heightened focus on patient safety and quality raises questions about the qualifications needed to perform invasive procedures. Assessment requirements have also become more stringent. The Accreditation Council for Graduate Medical Education (ACGME) now requires the use of measures that yield reliable and valid data to document the competence of trainees performing invasive procedures.2 In 2006 these factors, and the challenge to educate, assess, and certify residents, prompted the American Board of Internal Medicine to revise its certification requirements and remove the need for technical proficiency in several procedures including paracentesis, central venous catheter placement, and thoracentesis.3, 4
Two studies reported in this issue of the Journal of Hospital Medicine highlight important issues about preparing residents to perform invasive procedures. These include the educational limits of routine clinical care and the challenge to design rigorous educational interventions that improve residents' skills. Miranda and colleagues5 designed a clinical trial to evaluate an educational intervention in which residents practiced insertion of subclavian and internal jugular venous catheters under the supervision of a hospitalist faculty member. The goal was to reduce the frequency of femoral venous catheters placed at their institution. Although residents demonstrated increased knowledge and confidence after the educational intervention, the actual number of subclavian and internal jugular venous catheter insertions was lower in the intervention group, and was rare overall. The intervention did not achieve the stated goal of reducing the number of femoral venous catheters placed by residents. This research highlights that residents cannot be trained to perform invasive procedures through clinical experience alone. In addition, it demonstrates that brief educational interventions are also insufficient. Whether a longer and more robust educational intervention might have shown different results is uncertain, but many experts believe that opportunities for deliberate practice6 using standardized and sustained treatments7 can be a powerful tool to boost the procedural skills of physicians.
At the same institution, Lucas and colleagues studied the impact of a procedural service on the number of invasive procedures performed on a general medicine inpatient service.8 They found a 48% increase in procedure attempts when the procedure service staffed by an experienced faulty member was available. However, no improvement in success rate or reduction in complications was demonstrated. Thus, opportunities for trainees to perform procedures increased, but the presence of a faculty member to provide direct supervision did not improve the quality of the procedures accomplished.
Together these reports highlight challenges and opportunities in training residents to perform invasive procedures. Both studies involved the procedural skills of residents. One used an educational intervention, the other featured faculty supervision. Both studies produced outcomes that suggest improved procedural training, but neither improved the actual quality of delivered care. A brief educational intervention increased resident confidence and knowledge but did not increase the quality or number of procedures performed by residents. Opportunities to perform invasive procedures increased dramatically when an experienced attending physician was available to supervise residents. However, more education was not provided, and the quality of procedures performed did not improve.
Given these limitations, how should physicians learn to perform invasive procedures? We endorse a systematic approach to achieve high levels of procedural skills in resident physicians. First, procedures should be carefully selected. Only those essential to future practice should be required. If possible, opportunities should be available for selected trainees to develop skills in performing additional procedures relevant to their future careers. An example would be the opportunity for residents in a hospitalist track to develop proficiency in central venous catheter insertion through clinical experience, didactic education, and rigorous skill assessment. Second, dedicated programs are needed to train and assess residents in procedural skills. Reliance on clinical experience alone is inadequate because of the low frequency at which most procedures are performed and the inability to standardize assessments in routine clinical practice.
Simulation technology is a powerful adjunct to traditional clinical training and has been demonstrated to be highly effective in developing procedural skills in disciplines such as endoscopy9 and laparoscopic surgery.10 At our institution, a simulation‐based training program has been used to help residents achieve11 and maintain12 a high level of skill in performing advanced cardiac life support procedures. We use simulation to provide opportunities for deliberate practice in a controlled environment in which immediate feedback is emphasized and mastery levels are reached. The rigorous curriculum is standardized, but learner progress is individualized depending on the practice time needed to achieve competency standards.
Most important, when training physicians to perform invasive procedures, it is critical to use interventions and training programs that can be linked to improvements in actual clinical care. The studies by Miranda et al. and Lucas et al. highlight the utility of focused educational programs to complement clinical training as well as the positive impact of direct faculty supervision. These results are important starting points for programs to consider as they train and certify residents in required procedural skills. However, much work remains to be done. These studies have revealed that improvements in patient care outcomes are not likely to occur unless robust, learner‐centered educational programs are combined with adequate opportunities for residents to perform procedures under appropriate supervision.
- ,.The declining number and variety of procedures done by general internists: a resurvey of members of the American College of Physicians.Ann Intern Med.2007;146:355–360.
- Accreditation Council for Graduate Medical Education. Outcome project: general competencies. Available at: http://www.acgme.org/outcome/comp/compFull.asp#1. Accessed January 28,2007.
- American Board of Internal Medicine. Requirements for certification in internal medicine. Available at: http://www.abim.org/cert/policiesim.shtm. Accessed January 28,2007.
- ,.What procedures should internists do?Ann Intern Med.2007;146:392–393.
- ,,,,,.Firm‐based trial to improve central venous catheter insertion practices.J Hosp Med.2007;2:135–142.
- .Deliberate practice and the acquisition and maintenance of expert performance in medicine and related domains.Acad Med.2004 Oct;79(10 Suppl):S70–S81.
- ,.Treatment strength and integrity: models and methods. In:Bootzin RR,McKnight PE, eds.Strengthening Research Methodology: Psychological Measurement and Evaluation.Washington, DC:American Psychological Association;2006:103–124.
- ,,, et al.Impact of a bedside procedure service on general medicine inpatients: a firm‐based trial.J Hosp Med.2007;2:143–149.
- ,,, et al.Multicenter, randomized, controlled trial of virtual‐reality simulator training in acquisition of competency in colonoscopy.Gastrointest Endosc.2006;64:361–368.
- ,,, et al.Laparoscopic skills are improved with LapMentor training: results of a randomized, double‐blinded study.Ann Surg.2006;243:854–860.
- ,,, et al.Mastery learning of advanced cardiac life support skills by internal medicine using simulation technology and deliberate practice.J Gen Intern Med.2006;21:251–256.
- ,,, et al.A longitudinal study of internal medicine residents' retention of advanced cardiac support life skills.Acad Med.2006;81(10 Suppl):S9–S12.
See one, do one, teach one is a refrain familiar to all physicians. Historically, most procedural training has occurred at the bedside. In this model, senior residents, subspecialty fellows, or faculty members would demonstrate procedural skills to junior trainees, who would subsequently practice the procedures on patients, often with uneven, risky results. Acquisition of procedural skills by residents and fellows on inpatient wards is suboptimal for at least 2 reasons beyond the risks to patient safety: (1) clinical priorities are more important than educational priorities in this setting, and (2) the patient, not the medical learner, is the most important person in the room.
Recently, several new factors have challenged the traditional medical education model. For a variety of reasons, general internists currently perform far fewer invasive procedures than they used to.1 A heightened focus on patient safety and quality raises questions about the qualifications needed to perform invasive procedures. Assessment requirements have also become more stringent. The Accreditation Council for Graduate Medical Education (ACGME) now requires the use of measures that yield reliable and valid data to document the competence of trainees performing invasive procedures.2 In 2006 these factors, and the challenge to educate, assess, and certify residents, prompted the American Board of Internal Medicine to revise its certification requirements and remove the need for technical proficiency in several procedures including paracentesis, central venous catheter placement, and thoracentesis.3, 4
Two studies reported in this issue of the Journal of Hospital Medicine highlight important issues about preparing residents to perform invasive procedures. These include the educational limits of routine clinical care and the challenge to design rigorous educational interventions that improve residents' skills. Miranda and colleagues5 designed a clinical trial to evaluate an educational intervention in which residents practiced insertion of subclavian and internal jugular venous catheters under the supervision of a hospitalist faculty member. The goal was to reduce the frequency of femoral venous catheters placed at their institution. Although residents demonstrated increased knowledge and confidence after the educational intervention, the actual number of subclavian and internal jugular venous catheter insertions was lower in the intervention group, and was rare overall. The intervention did not achieve the stated goal of reducing the number of femoral venous catheters placed by residents. This research highlights that residents cannot be trained to perform invasive procedures through clinical experience alone. In addition, it demonstrates that brief educational interventions are also insufficient. Whether a longer and more robust educational intervention might have shown different results is uncertain, but many experts believe that opportunities for deliberate practice6 using standardized and sustained treatments7 can be a powerful tool to boost the procedural skills of physicians.
At the same institution, Lucas and colleagues studied the impact of a procedural service on the number of invasive procedures performed on a general medicine inpatient service.8 They found a 48% increase in procedure attempts when the procedure service staffed by an experienced faulty member was available. However, no improvement in success rate or reduction in complications was demonstrated. Thus, opportunities for trainees to perform procedures increased, but the presence of a faculty member to provide direct supervision did not improve the quality of the procedures accomplished.
Together these reports highlight challenges and opportunities in training residents to perform invasive procedures. Both studies involved the procedural skills of residents. One used an educational intervention, the other featured faculty supervision. Both studies produced outcomes that suggest improved procedural training, but neither improved the actual quality of delivered care. A brief educational intervention increased resident confidence and knowledge but did not increase the quality or number of procedures performed by residents. Opportunities to perform invasive procedures increased dramatically when an experienced attending physician was available to supervise residents. However, more education was not provided, and the quality of procedures performed did not improve.
Given these limitations, how should physicians learn to perform invasive procedures? We endorse a systematic approach to achieve high levels of procedural skills in resident physicians. First, procedures should be carefully selected. Only those essential to future practice should be required. If possible, opportunities should be available for selected trainees to develop skills in performing additional procedures relevant to their future careers. An example would be the opportunity for residents in a hospitalist track to develop proficiency in central venous catheter insertion through clinical experience, didactic education, and rigorous skill assessment. Second, dedicated programs are needed to train and assess residents in procedural skills. Reliance on clinical experience alone is inadequate because of the low frequency at which most procedures are performed and the inability to standardize assessments in routine clinical practice.
Simulation technology is a powerful adjunct to traditional clinical training and has been demonstrated to be highly effective in developing procedural skills in disciplines such as endoscopy9 and laparoscopic surgery.10 At our institution, a simulation‐based training program has been used to help residents achieve11 and maintain12 a high level of skill in performing advanced cardiac life support procedures. We use simulation to provide opportunities for deliberate practice in a controlled environment in which immediate feedback is emphasized and mastery levels are reached. The rigorous curriculum is standardized, but learner progress is individualized depending on the practice time needed to achieve competency standards.
Most important, when training physicians to perform invasive procedures, it is critical to use interventions and training programs that can be linked to improvements in actual clinical care. The studies by Miranda et al. and Lucas et al. highlight the utility of focused educational programs to complement clinical training as well as the positive impact of direct faculty supervision. These results are important starting points for programs to consider as they train and certify residents in required procedural skills. However, much work remains to be done. These studies have revealed that improvements in patient care outcomes are not likely to occur unless robust, learner‐centered educational programs are combined with adequate opportunities for residents to perform procedures under appropriate supervision.
- ,.The declining number and variety of procedures done by general internists: a resurvey of members of the American College of Physicians.Ann Intern Med.2007;146:355–360.
- Accreditation Council for Graduate Medical Education. Outcome project: general competencies. Available at: http://www.acgme.org/outcome/comp/compFull.asp#1. Accessed January 28,2007.
- American Board of Internal Medicine. Requirements for certification in internal medicine. Available at: http://www.abim.org/cert/policiesim.shtm. Accessed January 28,2007.
- ,.What procedures should internists do?Ann Intern Med.2007;146:392–393.
- ,,,,,.Firm‐based trial to improve central venous catheter insertion practices.J Hosp Med.2007;2:135–142.
- .Deliberate practice and the acquisition and maintenance of expert performance in medicine and related domains.Acad Med.2004 Oct;79(10 Suppl):S70–S81.
- ,.Treatment strength and integrity: models and methods. In:Bootzin RR,McKnight PE, eds.Strengthening Research Methodology: Psychological Measurement and Evaluation.Washington, DC:American Psychological Association;2006:103–124.
- ,,, et al.Impact of a bedside procedure service on general medicine inpatients: a firm‐based trial.J Hosp Med.2007;2:143–149.
- ,,, et al.Multicenter, randomized, controlled trial of virtual‐reality simulator training in acquisition of competency in colonoscopy.Gastrointest Endosc.2006;64:361–368.
- ,,, et al.Laparoscopic skills are improved with LapMentor training: results of a randomized, double‐blinded study.Ann Surg.2006;243:854–860.
- ,,, et al.Mastery learning of advanced cardiac life support skills by internal medicine using simulation technology and deliberate practice.J Gen Intern Med.2006;21:251–256.
- ,,, et al.A longitudinal study of internal medicine residents' retention of advanced cardiac support life skills.Acad Med.2006;81(10 Suppl):S9–S12.
Improving Central Venous Catheterization
At times central venous catheters are essential to the delivery of appropriate medical care. Because catheter‐related complications are associated with limited operator experience,1 insertion technique,2 and venous site of insertion (eg, femoral, internal jugular, or subclavian vein),3 house staff training programs strive to provide their residents with appropriate training and oversight for this skill. Most quality improvement initiatives directed at reducing complications associated with central venous catheters have focused on patients in the intensive care unit (ICU).4, 5 However, in some hospitals more central venous catheters are inserted in patients not in the ICU,6 and practices that increase the risk of complications may be more common on wards.7
In our hospital, most catheters are placed in the femoral vein. Because femoral venous placement likely increases a patient's risk of thrombosis, hematoma, and bloodstream infection,8 we developed a program to change residents' choice of venous insertion site and improve their infection‐control practices during their general medicine ward rotation. The program provided simulated hands‐on experience in a simulation laboratory. We evaluated our intervention through a firm‐based clinical trial that compared the usual practice to our intervention. We compared infection‐control practices and resident choice of venous insertion site between the intervention and control groups; we also assessed residents' knowledge about catheter‐related complications, and we monitored patients for catheter‐related complications.
METHODS
Setting and Study Design
We conducted a prospective, firm‐based clinical trial approved by the institutional review board at Cook County Hospital, a 464‐bed public teaching hospital. We evaluated all central venous catheters inserted by residents on the general medicine service from November 15, 2004, to March 31, 2005. The internal medicine residency program assigns residents to 1 of 3 firms for their entire 3 years of training. We designated 1 firm as the intervention group; the other 2 firms constituted the control group.
Educational Intervention
At the beginning of each 4‐week general medicine ward rotation, intervention‐firm residents attended an educational and simulation laboratory session. Control‐firm residents received the usual ward orientation. We conducted 6 sessions, with total attendance of 40 intervention‐firm residents, or approximately 7 residents per session. A chief medical resident experienced in catheter placement and an attending internist led and supervised each 2‐hour training session. The sessions were conducted at the Simulation Laboratory of Rush University and included a presentation about indications for central venous catheter insertion, insertion techniques, common complications, and practice placing catheters in mannequins. During the hands‐on session, each participant observed the expert insert a triple‐lumen catheter in the mannequin's internal jugular and subclavian veins. Then, with supervision, each participant practiced catheter insertion using recommended infection‐control practices (eg, use of gloves, mask, and large drape, and chlorhexidine skin preparation).
Resident Survey
Before each session, we administered a survey that assessed residents' knowledge of insertion techniques and their confidence in placing catheters at each venous insertion site. To measure change in the confidence level of residents, we distributed an abbreviated survey 2 additional times, immediately after the session and at the end of the study period. We measured confidence with answers to survey questions, which were rated on a 5‐point Likert scale, from strongly disagree to strongly agree. In addition to measuring the change in residents' confidence, the final survey repeated knowledge assessment questions, evaluated residents' attitudes regarding venous insertion sites, and asked about potential strategies to improve insertion practices.
Central Venous Catheter Detection and Monitoring
At the end of each day, residents reported catheter insertions to chief residents during routine sign‐out rounds. If a catheter had been inserted, the chief resident interviewed the resident about type of catheter, venous insertion site, duration of attempt, patient location, immediate complications, number of inserters, inserter attendance at an educational session, inserter specialty, and professional designation (eg, resident, fellow, attending), indication for insertion, and adherence to infection‐control practices. For all insertion attempts, the research team reviewed the medical record and recorded patient characteristics that might influence venous insertion site (eg, thrombocytopenia, coagulopathy, and body mass index) and evaluated patients for insertion‐related complications.
We prospectively monitored patients for mechanical (ie, pneumothorax or hematoma), thromboembolic, or infectious complications. To evaluate for pneumothorax, postinsertion chest radiographs were reviewed by a physician‐investigator, and radiologists' interpretations and progress notes were reviewed. To evaluate for infectious or other mechanical complications, progress notes also were reviewed. We required radiographic confirmation of venous thromboembolism. To categorize potential bloodstream infections, we used Centers for Disease Control and Prevention definitions.9 All medical record and radiograph reviews were performed by investigators who were masked to patient firm assignment. We monitored patients until catheter removal or hospital discharge. After patient discharge, we reviewed the electronic record, including emergency room visits and repeat hospitalizations, for 30 days after the earlier of hospital discharge or catheter removal.
Statistics
Because we were aware that temporary dialysis catheters are sometimes placed in femoral veins to preserve the subclavian or internal jugular venous sites for more permanent tunneled intravascular catheters, our prespecified plans were to compare venous insertion sites between intervention and control groups after excluding temporary dialysis catheters. To more completely describe catheter use, we also collected data on temporary dialysis catheters, and we present the results both with and without inclusion of data on temporary dialysis catheters. If multiple residents attempted to insert a catheter, we would have used the group that the final inserter was in to determine intervention versus control group assignment; however, this never occurred.
To determine resident confidence in inserting catheters, we collapsed the responses of agree and strongly agree and of disagree and strongly disagree into single categories; thus, frequency of agreement was evaluated as a dichotomous outcome. To test whether residents' confidence changed between the 3 surveys, we analyzed responses using the matched‐pair signed rank test, with the initial survey used as the referent.
We dichotomized certain continuous variables using the following cut points: body mass index 30 kg/m2; coagulopathy, international normalized ratio (INR) > 1.5; thrombocytopenia, platelets < 100 109/L. Data were entered into a relational database (Microsoft Access, Microsoft Inc., Redmond, WA) and merged analyzed using Stata software, version 8.2 (Stata Corporation, College Station, TX).
RESULTS
Patient and Catheter Characteristics
Fifty‐four catheters were inserted in 48 patients during the study period, 16 (30%) in the intervention group and 38 (70%) in the control group. Mean number of catheters inserted per resident for each 4‐week rotation was 0.24; therefore, on average, a resident would insert 1 catheter every 4 general‐medicine rotations. Most catheters were inserted between 7:00 AM and 5:00 PM; the most common reason for insertion was to administer intravenous medications to a patient without intravenous access, followed by the need for a temporary dialysis catheter. Most catheters were inserted by the medicine team rather than radiology or a subspecialty service (Table 1). Most patient characteristics and reasons for insertion were similar between groups; however, more patients in the control group had thrombocytopenia (Table 1).
| Characteristic | Central venous catheters inserted | ||
|---|---|---|---|
| Intervention (n = 16), n (%) | Control (n = 38), n (%) | P | |
| |||
| Patient | |||
| Body mass index 30 kg/m2 | 5 (31) | 11 (29) | 1.0 |
| INR > 1.5 | 3 (19) | 3 (7.9) | 0.37 |
| Platelet count < 100k | 0 (0) | 9 (24) | 0.05 |
| Charlson index, mean (interquartile range) | 2 (24) | 2 (14) | 0.58 |
| Physician inserting catheter | |||
| Resident on general medicine servicea | 15 (100) | 34/37 (92) | 1.0 |
| Subspecialty fellow | 0 (0) | 2/37 (5.3) | 1.0 |
| Radiology fellow or attending | 0 (0) | 1/37 (2.6) | 1.0 |
| Reason for insertion | |||
| No intravenous access | 7 (44) | 19 (50) | 0.67 |
| Temporary dialysis catheterb | 7 (44) | 14 (37) | 0.63 |
| Total parenteral nutrition | 1 (6.2) | 3 (7.9) | 1.0 |
| Otherc | 1 (6.2) | 2 (5.3) | 1.0 |
| Time of day of insertion | |||
| Between 7 AM and 5 PM | 12/14 (86) | 25/37 (68) | 0.30 |
Insertion Practices
Femoral venous insertion was the most common type of catheter insertion (67%), followed by internal jugular (26%) and subclavian (7%); there were no differences in insertion site between the intervention and control groups (Table 2). When we excluded temporary dialysis catheters, 39% of central venous catheters were inserted in the internal jugular vein. Although a smaller proportion of catheters inserted by the intervention group were placed in a femoral vein, the difference was not significant (Table 2).
| Intervention (n = 16), n (%) | Control (n = 38), n (%) | Risk ratio (95% CI) | P | |
|---|---|---|---|---|
| ||||
| Self‐reported practices during CVC insertion | ||||
| Mask worn | 12 (75) | 13 (34) | 2.2 (1.33.7) | 0.008 |
| Large drape used | 15 (94) | 28 (74) | 1.3 (1.01.6) | 0.14 |
| Cap worn | 3 (19) | 5 (13) | 1.4 (0.45.3) | 0.6 |
| Gown worn | 8 (50) | 18 (47) | 1.1 (0.61.9) | 0.9 |
| Sterile gloves worn | 15 (94) | 36 (95) | 1.0 (0.81.2) | 1.0 |
| Venous insertion sitea | Difference (95% CI) | |||
| Femoral | 10 (62) | 26 (68) | 6% (34%22%) | 0.67 |
| Internal jugular | 5 (31) | 9 (24) | ||
| Subclavian | 1 (6.2) | 3 (7.9) | ||
| Excluding dialysis cathetersa | n = 9 | n = 24 | ||
| Femoral | 4 (44) | 14 (58) | 14% (52%24%) | 0.7 |
| Internal jugular | 5 (56) | 8 (33) | ||
| Subclavian | 0 (0) | 2 (8) | ||
For most insertions, residents reported using sterile gloves (94%) and a large drape (80%); however, most did not report use of a sterile gown (48%), mask (46%), or cap (15%). Residents in the intervention group were more likely to report use of a mask, and there was a trend toward increased use of large drapes (Table 2). No patient characteristics predicted femoral venous insertion (data not shown).
Complications
The most frequent complication was arterial puncture (n = 4); all four occurred during femoral venous insertion attempts. Compared to subclavian or internal jugular venous placement, there was a trend toward more mechanical complications among femoral catheters (Table 3). One episode of clinical sepsis occurred, in an intervention‐group patient who had femoral and internal jugular catheters, and no pneumothoraxes or episodes of venous thromboembolism occurred (Table 3). The overall incidence of bloodstream infection was 2.7 per 1000 central‐line days; there was no difference between the intervention and control groups (9.2 versus 0 per 1000 central‐line days; P = .29).
| Complication | Femoral (n = 36), n (%) | Subclavian or IJ (n = 18), n (%) | Difference (95% CI) |
|---|---|---|---|
| |||
| Mechanical (arterial puncture, hematoma, or pneumothorax)a | 4 (11) | 0 | 11% (1%21%) |
| Venous thromboembolismb | 0 (0) | 0 (0) | 0% |
| Infection rate (per 1000 central‐line days)c | 4.3 | 7.0 | 2.7 (1913) |
Survey Responses
Before the educational session, many residents did not recognize that femoral venous catheter insertions had a higher risk of arterial puncture or venous thrombosis (Table 4); by the final survey, residents were more likely to recognize the higher risk of these complications during femoral venous insertions. Most residents recognized the higher risk of infectious complications at the femoral site (Table 4).
| Respondents in Agreement, n (%) | |||
|---|---|---|---|
| Presession n = 35 | Postsession n = 34 | Follow‐up n = 35 | |
| |||
| Knowledge | |||
| Complications are most frequent at the femoral site | 27 (77%) | 30 (86%) | |
| Arterial puncture risk is lowest at the femoral sitea | 16 (46%) | 7 (21%)b | |
| Thrombosis risk is lowest at the femoral sitea | 11 (31%) | 6 (18%) | |
| Infection risk is lowest at the femoral site | 1/33 (3%) | 0 (0%) | |
| Attitudes | |||
| I feel confident:c | |||
| Inserting a femoral CVC | 53 | 59b | 89d |
| Inserting an internal jugular CVC | 41 | 71d | 40 |
| Inserting a subclavian CVC | 24 | 65d | 34d |
| Options to increase placement in jugular or subclavian veins | |||
| Availability of ultrasound machine | 31 (89) | ||
| Expert supervisor available to assist with placement | 30 (86) | ||
| Insert CVC within 2 weeks of educational session | 30 (86) | ||
| Rotation through a service that often places CVCsa | 26 (76) | ||
| I do not plan to use this skill after my residency | 4 (11) | ||
| Barriers to inserting a subclavian or internal jugular CVC | |||
| Preexisting internal jugular or subclavian CVC | 11 (31) | ||
| For temporary dialysis, desire to preserve site | 26 (74) | ||
| Practices | |||
| More likely to remove unnecessary catheter | 29 (83) | ||
| Improved infection‐control practices | 28 (80) | ||
| Increased motivation for internal jugular or subclavian venous insertion | 27 (78) | ||
| Less likely to place a CVC | 9 (26) | ||
| Internal jugular or subclavian CVC inserted for the first time after training | 7/30 (23) | ||
Residents overwhelmingly responded that the lecture was useful (95%), that mannequins provided a valuable skill‐building exercise (90%), and that the session should be incorporated into the training program (95%). Immediately after the session, residents had increased confidence about inserting a central venous catheter at any venous site, especially for internal jugular or subclavian insertions. By the final survey, the confidence of residents about inserting catheters in the internal jugular or subclavian veins had returned to baseline but had increased for femoral‐site insertions (Table 4).
Most residents in the intervention group agreed that the educational session motivated them to remove unnecessary catheters, improve insertion‐related infection‐control practices, and place the catheter in an internal jugular or subclavian vein; some agreed because of the educational session, they were less likely to place a central venous catheter. Some reported successfully inserting a central venous catheter in the subclavian or internal jugular vein for the first time (Table 4).
DISCUSSION
An educational session designed to teach residents appropriate central venous catheter insertion practices that included simulated hands‐on training increased knowledge about insertion‐related complications and improved certain infection‐control practices. Although residents' confidence in inserting subclavian or internal jugular catheters initially improved, our training session did not change the choice of venous insertion site from femoral to subclavian or internal jugular veins, possibly because there were few opportunities for residents to insert a catheter during the 4‐week general medical ward rotations. Thus, although an active educational intervention improved the knowledge and confidence of residents, it had a minimal effect on behavior (only improved certain infection‐control practices). Catheter‐associated complications were infrequent and similar in the intervention and control groups.
Central venous catheter insertion is a skill that many general internists do not perform10; however, until recently the American Board of Internal Medicine considered it a requisite skill for internal medicine residents, and most residents at our hospital reported a desire to learn this skill. Although in our study complications were infrequent, suggesting that a change in venous insertion site is unlikely to dramatically improve patient safety, we believe that residents should become skilled at inserting catheters in internal jugular or subclavian veins, the currently recommended optimal venous insertion.8
There is evidence that single educational interventions are unlikely to result in substantial, sustained behavioral change, especially passive educational programs.11 However, a previous study documented a change in provider behavior and possibly a reduction in bloodstream infections after a single hands‐on training session.12 Our hands‐on educational format was very popular and likely improved some infection‐control practices but did not change provider behavior about choice of venous insertion site. In other institutions, mentoring residents on appropriate catheter insertion technique has been accomplished by establishing a procedure service13 or by resident rotation in a high‐volume location (eg, cardiac catheterization laboratory).14 Another option to facilitate behavioral change would be to provide a portable ultrasound machine, as requested by our residents, which may reduce complication rates.15, 16 At our hospital, we decided to supplement hands‐on training with expert bedside supervision during catheter insertion; the expert is provided through a procedure service that is led by hospitalists. The procedure service has a dedicated portable ultrasound machine to assist with internal jugular vein cannulation.
By the end of our study period, residents' confidence in subclavian or internal jugular catheter insertions had returned to presession levels; however, they reported increased confidence in femoral venous catheter insertions. These findings suggest that the session increased residents' confidence with catheter insertions in general, but not specifically for venous sites for which they had no previous experience. For subclavian or internal jugular catheter insertions, their confidence decayed to the presession baseline, likely because of few opportunities to insert catheters in patients; on average, each resident inserts 1 central venous catheter on the general medicine wards approximately every 4 months.
Our survey found that our intervention changed residents' attitudes about infection‐control practices. In particular, intervention‐group residents reported that they were more likely to remove unnecessary catheters and that they had used a mask and large drape during catheter insertion. Use of full‐barrier precautions (ie, sterile gloves and gown, large sterile drape, cap, and mask) has been shown to reduce the risk of bloodstream infection2 and is included in national guidelines.17 Adherence to these guidelines has been included in successful quality improvement initiatives.4, 5, 18 Compared to internists' adherence to recommendations for infection control reported in another survey,10 residents who attended our educational session reported more use of large sterile drapes (94% vs. 35%) or masks (75% vs. 66%); however, they were less likely to use a sterile gown (50% vs. 72%). Use of a large sterile drape is common in our hospital, likely because the drape is included in the central venous catheter package. We suspect that at our hospital, poor adherence to certain recommendations (eg, using a sterile gown) was due in part to difficulty accessing supplies. Another possibility is that use of a cap, compared to use of large drapes, is perceived as not giving the patient much additional protection. In fact, there is no evidence that using a cap provides benefit beyond that of other, more intuitively beneficial recommended infection‐control practices, such as using sterile gloves and a large sterile drape. The procedure service has addressed the supply problem by stocking hard‐to‐find items on a procedure cart.
Only 2 clinically evident complications associated with catheter insertion occurred (one patient with clinical sepsis and one with a hematoma). Although it is possible that we missed minor complications, our rates were similar to those reported by other investigators: clinically diagnosed venous thromboembolism, 0%2.2%3, 19, 20; pneumothorax, 1.4%21; catheter‐associated primary bloodstream infection, 1‐6/1000 catheter‐days.22, 23 Comparing complication rates was hindered by variability in definitions, methods of ascertainment, and populations evaluated. For example, the rate of venous thromboembolism was dramatically higher when routine diagnostic imaging was used, and detection of catheter‐associated infections likely increased when catheter‐tip cultures were routinely performed. We required clinical evidence of complications, and our study differs from others in that we evaluated general medicine ward patients.
This study had several limitations. Placement of central venous catheters on general medicine wards was less frequent than we anticipated based on a brief period of pilot data collection; therefore, our study was not powered to detect relatively small changes in venous insertion sites or differences in complications. Also, because direct observation was not possible, we relied on self‐reported adherence to infection‐control practices. However, intervention residents' self‐reported poor adherence to gown, glove, and cap use suggests that their responses were unbiased.
An educational session focused on central venous catheter insertion practices was well received by residents, increased their knowledge about complications, and improved infection‐control practices, but had no effect on increasing use of subclavian or internal jugular veins for catheter insertion. Despite continued frequent use of femoral venous catheters, clinically apparent complications were infrequent. However, we believe it is important to teach residents optimal catheter insertion techniques, including preferential placement of catheters in subclavian or internal jugular veins. Therefore, the section of hospital medicine at our hospital initiated a procedure service that provides expert bedside supervision, including use of a portable ultrasound machine, for catheter insertions.
Acknowledgements
The authors acknowledge Kathleen Murray for data collection and form development; Donald Blom for assistance with determining bloodstream infection; Laura Sadowski for developing and leading the focus group session; Yannis Guerra for assistance with the educational sessions; Oksana Barilyak, Anand Despande, and Saurabh Sharma for assistance with data collection; and chief residents Rony Ghaoui, Sean Halleran, Priya Kansal, Parag Sampat, and Sunita Nathan for interviewing residents about catheter insertions.
- ,,,,.Central vein catheterization. Failure and complication rates by three percutaneous approaches.Arch Intern Med.1986;146:259–261.
- ,,, et al.Prevention of central venous catheter‐related infections by using maximal sterile barrier precautions during insertion.Infect Control Hosp Epidemiol.1994;15:231–238.
- ,,, et al.Complications of femoral and subclavian venous catheterization in critically ill patients: a randomized controlled trial.JAMA.2001;286:700–707.
- ,,, et al.Eliminating catheter‐related bloodstream infections in the intensive care unit.Crit Care Med.2004;32:2014–2020.
- ,,, et al.The effect of an education program on the incidence of central venous catheter‐associated bloodstream infection in a medical ICU.Chest.2004;126:1612–1618.
- ,,, et al.Prevalence of the use of central venous access devices within and outside of the intensive care unit: results of a survey among hospitals in the prevention epicenter program of the Centers for Disease Control and Prevention.Infect Control Hosp Epidemiol.2003;24:942–945.
- ,,,,,.Unnecessary use of central venous catheters: the need to look outside the intensive care unit.Infect Control Hosp Epidemiol.2004;25:266–268.
- ,.Preventing complications of central venous catheterization.N Engl J Med.2003;348:1123–1133.
- ,,,,.CDC definitions for nosocomial infections, 1988.Am J Infect Control.1988;16:128–140.
- ,,,.Why is it that internists do not follow guidelines for preventing intravascular catheter infections?Infect Control Hosp Epidemiol.2005;26:525–533.
- ,,, et al.Changing provider behavior: an overview of systematic reviews of interventions.Med Care.2001;39:II2–II45.
- ,,, et al.Education of physicians‐in‐training can decrease the risk for vascular catheter infection.Ann Intern Med.2000;132:641–648.
- ,, et al.Creation of an innovative inpatient medical procedure service and a method to evaluate house staff competency.J Gen Intern Med.2004;19:510–513.
- ,,,.A curricular initiative for internal medicine residents to enhance proficiency in internal jugular central venous line placement.Mayo Clin Proc.2005;80:212–218.
- ,,,,,.Improvement of internal jugular vein cannulation using an ultrasound‐guided technique.Intensive Care Med.1997;23:916–919.
- ,,.Facilitation of internal jugular venous cannulation using an audio‐guided Doppler ultrasound vascular access device: results from a prospective, dual‐center, randomized, crossover clinical study.Crit Care Med.1995;23:60–65.
- ,,, et al.Guidelines for the prevention of intravascular catheter‐related infections.MMWR Morb Mortal Wkly Rep.2002;1(RR10):1–26.
- ,,, et al.The impact of bedside behavior on catheter‐related bacteremia in the intensive care unit.Arch Surg.2004;139:131–136.
- ,,,,,.A prospective evaluation of the use of femoral venous catheters in critically ill adults.Crit Care Med.1997;25:1986–1989.
- ,,,,.Deep venous thrombosis caused by femoral venous catheters in critically ill adult patients.Chest.2000;117:178–183.
- ,,.Complications of central venous catheters: internal jugular versus subclavian access—a systematic review.Crit Care Med.2002;30:454–460.
- ,,,,,.Prospective evaluation of risk factors for bloodstream infection in patients receiving home infusion therapy.Ann Intern Med.1999;131:340–347.
- ,,,.Nosocomial infections in combined medical‐surgical intensive care units in the United States.Infect Control Hosp Epidemiol.2000;21:510–515.
At times central venous catheters are essential to the delivery of appropriate medical care. Because catheter‐related complications are associated with limited operator experience,1 insertion technique,2 and venous site of insertion (eg, femoral, internal jugular, or subclavian vein),3 house staff training programs strive to provide their residents with appropriate training and oversight for this skill. Most quality improvement initiatives directed at reducing complications associated with central venous catheters have focused on patients in the intensive care unit (ICU).4, 5 However, in some hospitals more central venous catheters are inserted in patients not in the ICU,6 and practices that increase the risk of complications may be more common on wards.7
In our hospital, most catheters are placed in the femoral vein. Because femoral venous placement likely increases a patient's risk of thrombosis, hematoma, and bloodstream infection,8 we developed a program to change residents' choice of venous insertion site and improve their infection‐control practices during their general medicine ward rotation. The program provided simulated hands‐on experience in a simulation laboratory. We evaluated our intervention through a firm‐based clinical trial that compared the usual practice to our intervention. We compared infection‐control practices and resident choice of venous insertion site between the intervention and control groups; we also assessed residents' knowledge about catheter‐related complications, and we monitored patients for catheter‐related complications.
METHODS
Setting and Study Design
We conducted a prospective, firm‐based clinical trial approved by the institutional review board at Cook County Hospital, a 464‐bed public teaching hospital. We evaluated all central venous catheters inserted by residents on the general medicine service from November 15, 2004, to March 31, 2005. The internal medicine residency program assigns residents to 1 of 3 firms for their entire 3 years of training. We designated 1 firm as the intervention group; the other 2 firms constituted the control group.
Educational Intervention
At the beginning of each 4‐week general medicine ward rotation, intervention‐firm residents attended an educational and simulation laboratory session. Control‐firm residents received the usual ward orientation. We conducted 6 sessions, with total attendance of 40 intervention‐firm residents, or approximately 7 residents per session. A chief medical resident experienced in catheter placement and an attending internist led and supervised each 2‐hour training session. The sessions were conducted at the Simulation Laboratory of Rush University and included a presentation about indications for central venous catheter insertion, insertion techniques, common complications, and practice placing catheters in mannequins. During the hands‐on session, each participant observed the expert insert a triple‐lumen catheter in the mannequin's internal jugular and subclavian veins. Then, with supervision, each participant practiced catheter insertion using recommended infection‐control practices (eg, use of gloves, mask, and large drape, and chlorhexidine skin preparation).
Resident Survey
Before each session, we administered a survey that assessed residents' knowledge of insertion techniques and their confidence in placing catheters at each venous insertion site. To measure change in the confidence level of residents, we distributed an abbreviated survey 2 additional times, immediately after the session and at the end of the study period. We measured confidence with answers to survey questions, which were rated on a 5‐point Likert scale, from strongly disagree to strongly agree. In addition to measuring the change in residents' confidence, the final survey repeated knowledge assessment questions, evaluated residents' attitudes regarding venous insertion sites, and asked about potential strategies to improve insertion practices.
Central Venous Catheter Detection and Monitoring
At the end of each day, residents reported catheter insertions to chief residents during routine sign‐out rounds. If a catheter had been inserted, the chief resident interviewed the resident about type of catheter, venous insertion site, duration of attempt, patient location, immediate complications, number of inserters, inserter attendance at an educational session, inserter specialty, and professional designation (eg, resident, fellow, attending), indication for insertion, and adherence to infection‐control practices. For all insertion attempts, the research team reviewed the medical record and recorded patient characteristics that might influence venous insertion site (eg, thrombocytopenia, coagulopathy, and body mass index) and evaluated patients for insertion‐related complications.
We prospectively monitored patients for mechanical (ie, pneumothorax or hematoma), thromboembolic, or infectious complications. To evaluate for pneumothorax, postinsertion chest radiographs were reviewed by a physician‐investigator, and radiologists' interpretations and progress notes were reviewed. To evaluate for infectious or other mechanical complications, progress notes also were reviewed. We required radiographic confirmation of venous thromboembolism. To categorize potential bloodstream infections, we used Centers for Disease Control and Prevention definitions.9 All medical record and radiograph reviews were performed by investigators who were masked to patient firm assignment. We monitored patients until catheter removal or hospital discharge. After patient discharge, we reviewed the electronic record, including emergency room visits and repeat hospitalizations, for 30 days after the earlier of hospital discharge or catheter removal.
Statistics
Because we were aware that temporary dialysis catheters are sometimes placed in femoral veins to preserve the subclavian or internal jugular venous sites for more permanent tunneled intravascular catheters, our prespecified plans were to compare venous insertion sites between intervention and control groups after excluding temporary dialysis catheters. To more completely describe catheter use, we also collected data on temporary dialysis catheters, and we present the results both with and without inclusion of data on temporary dialysis catheters. If multiple residents attempted to insert a catheter, we would have used the group that the final inserter was in to determine intervention versus control group assignment; however, this never occurred.
To determine resident confidence in inserting catheters, we collapsed the responses of agree and strongly agree and of disagree and strongly disagree into single categories; thus, frequency of agreement was evaluated as a dichotomous outcome. To test whether residents' confidence changed between the 3 surveys, we analyzed responses using the matched‐pair signed rank test, with the initial survey used as the referent.
We dichotomized certain continuous variables using the following cut points: body mass index 30 kg/m2; coagulopathy, international normalized ratio (INR) > 1.5; thrombocytopenia, platelets < 100 109/L. Data were entered into a relational database (Microsoft Access, Microsoft Inc., Redmond, WA) and merged analyzed using Stata software, version 8.2 (Stata Corporation, College Station, TX).
RESULTS
Patient and Catheter Characteristics
Fifty‐four catheters were inserted in 48 patients during the study period, 16 (30%) in the intervention group and 38 (70%) in the control group. Mean number of catheters inserted per resident for each 4‐week rotation was 0.24; therefore, on average, a resident would insert 1 catheter every 4 general‐medicine rotations. Most catheters were inserted between 7:00 AM and 5:00 PM; the most common reason for insertion was to administer intravenous medications to a patient without intravenous access, followed by the need for a temporary dialysis catheter. Most catheters were inserted by the medicine team rather than radiology or a subspecialty service (Table 1). Most patient characteristics and reasons for insertion were similar between groups; however, more patients in the control group had thrombocytopenia (Table 1).
| Characteristic | Central venous catheters inserted | ||
|---|---|---|---|
| Intervention (n = 16), n (%) | Control (n = 38), n (%) | P | |
| |||
| Patient | |||
| Body mass index 30 kg/m2 | 5 (31) | 11 (29) | 1.0 |
| INR > 1.5 | 3 (19) | 3 (7.9) | 0.37 |
| Platelet count < 100k | 0 (0) | 9 (24) | 0.05 |
| Charlson index, mean (interquartile range) | 2 (24) | 2 (14) | 0.58 |
| Physician inserting catheter | |||
| Resident on general medicine servicea | 15 (100) | 34/37 (92) | 1.0 |
| Subspecialty fellow | 0 (0) | 2/37 (5.3) | 1.0 |
| Radiology fellow or attending | 0 (0) | 1/37 (2.6) | 1.0 |
| Reason for insertion | |||
| No intravenous access | 7 (44) | 19 (50) | 0.67 |
| Temporary dialysis catheterb | 7 (44) | 14 (37) | 0.63 |
| Total parenteral nutrition | 1 (6.2) | 3 (7.9) | 1.0 |
| Otherc | 1 (6.2) | 2 (5.3) | 1.0 |
| Time of day of insertion | |||
| Between 7 AM and 5 PM | 12/14 (86) | 25/37 (68) | 0.30 |
Insertion Practices
Femoral venous insertion was the most common type of catheter insertion (67%), followed by internal jugular (26%) and subclavian (7%); there were no differences in insertion site between the intervention and control groups (Table 2). When we excluded temporary dialysis catheters, 39% of central venous catheters were inserted in the internal jugular vein. Although a smaller proportion of catheters inserted by the intervention group were placed in a femoral vein, the difference was not significant (Table 2).
| Intervention (n = 16), n (%) | Control (n = 38), n (%) | Risk ratio (95% CI) | P | |
|---|---|---|---|---|
| ||||
| Self‐reported practices during CVC insertion | ||||
| Mask worn | 12 (75) | 13 (34) | 2.2 (1.33.7) | 0.008 |
| Large drape used | 15 (94) | 28 (74) | 1.3 (1.01.6) | 0.14 |
| Cap worn | 3 (19) | 5 (13) | 1.4 (0.45.3) | 0.6 |
| Gown worn | 8 (50) | 18 (47) | 1.1 (0.61.9) | 0.9 |
| Sterile gloves worn | 15 (94) | 36 (95) | 1.0 (0.81.2) | 1.0 |
| Venous insertion sitea | Difference (95% CI) | |||
| Femoral | 10 (62) | 26 (68) | 6% (34%22%) | 0.67 |
| Internal jugular | 5 (31) | 9 (24) | ||
| Subclavian | 1 (6.2) | 3 (7.9) | ||
| Excluding dialysis cathetersa | n = 9 | n = 24 | ||
| Femoral | 4 (44) | 14 (58) | 14% (52%24%) | 0.7 |
| Internal jugular | 5 (56) | 8 (33) | ||
| Subclavian | 0 (0) | 2 (8) | ||
For most insertions, residents reported using sterile gloves (94%) and a large drape (80%); however, most did not report use of a sterile gown (48%), mask (46%), or cap (15%). Residents in the intervention group were more likely to report use of a mask, and there was a trend toward increased use of large drapes (Table 2). No patient characteristics predicted femoral venous insertion (data not shown).
Complications
The most frequent complication was arterial puncture (n = 4); all four occurred during femoral venous insertion attempts. Compared to subclavian or internal jugular venous placement, there was a trend toward more mechanical complications among femoral catheters (Table 3). One episode of clinical sepsis occurred, in an intervention‐group patient who had femoral and internal jugular catheters, and no pneumothoraxes or episodes of venous thromboembolism occurred (Table 3). The overall incidence of bloodstream infection was 2.7 per 1000 central‐line days; there was no difference between the intervention and control groups (9.2 versus 0 per 1000 central‐line days; P = .29).
| Complication | Femoral (n = 36), n (%) | Subclavian or IJ (n = 18), n (%) | Difference (95% CI) |
|---|---|---|---|
| |||
| Mechanical (arterial puncture, hematoma, or pneumothorax)a | 4 (11) | 0 | 11% (1%21%) |
| Venous thromboembolismb | 0 (0) | 0 (0) | 0% |
| Infection rate (per 1000 central‐line days)c | 4.3 | 7.0 | 2.7 (1913) |
Survey Responses
Before the educational session, many residents did not recognize that femoral venous catheter insertions had a higher risk of arterial puncture or venous thrombosis (Table 4); by the final survey, residents were more likely to recognize the higher risk of these complications during femoral venous insertions. Most residents recognized the higher risk of infectious complications at the femoral site (Table 4).
| Respondents in Agreement, n (%) | |||
|---|---|---|---|
| Presession n = 35 | Postsession n = 34 | Follow‐up n = 35 | |
| |||
| Knowledge | |||
| Complications are most frequent at the femoral site | 27 (77%) | 30 (86%) | |
| Arterial puncture risk is lowest at the femoral sitea | 16 (46%) | 7 (21%)b | |
| Thrombosis risk is lowest at the femoral sitea | 11 (31%) | 6 (18%) | |
| Infection risk is lowest at the femoral site | 1/33 (3%) | 0 (0%) | |
| Attitudes | |||
| I feel confident:c | |||
| Inserting a femoral CVC | 53 | 59b | 89d |
| Inserting an internal jugular CVC | 41 | 71d | 40 |
| Inserting a subclavian CVC | 24 | 65d | 34d |
| Options to increase placement in jugular or subclavian veins | |||
| Availability of ultrasound machine | 31 (89) | ||
| Expert supervisor available to assist with placement | 30 (86) | ||
| Insert CVC within 2 weeks of educational session | 30 (86) | ||
| Rotation through a service that often places CVCsa | 26 (76) | ||
| I do not plan to use this skill after my residency | 4 (11) | ||
| Barriers to inserting a subclavian or internal jugular CVC | |||
| Preexisting internal jugular or subclavian CVC | 11 (31) | ||
| For temporary dialysis, desire to preserve site | 26 (74) | ||
| Practices | |||
| More likely to remove unnecessary catheter | 29 (83) | ||
| Improved infection‐control practices | 28 (80) | ||
| Increased motivation for internal jugular or subclavian venous insertion | 27 (78) | ||
| Less likely to place a CVC | 9 (26) | ||
| Internal jugular or subclavian CVC inserted for the first time after training | 7/30 (23) | ||
Residents overwhelmingly responded that the lecture was useful (95%), that mannequins provided a valuable skill‐building exercise (90%), and that the session should be incorporated into the training program (95%). Immediately after the session, residents had increased confidence about inserting a central venous catheter at any venous site, especially for internal jugular or subclavian insertions. By the final survey, the confidence of residents about inserting catheters in the internal jugular or subclavian veins had returned to baseline but had increased for femoral‐site insertions (Table 4).
Most residents in the intervention group agreed that the educational session motivated them to remove unnecessary catheters, improve insertion‐related infection‐control practices, and place the catheter in an internal jugular or subclavian vein; some agreed because of the educational session, they were less likely to place a central venous catheter. Some reported successfully inserting a central venous catheter in the subclavian or internal jugular vein for the first time (Table 4).
DISCUSSION
An educational session designed to teach residents appropriate central venous catheter insertion practices that included simulated hands‐on training increased knowledge about insertion‐related complications and improved certain infection‐control practices. Although residents' confidence in inserting subclavian or internal jugular catheters initially improved, our training session did not change the choice of venous insertion site from femoral to subclavian or internal jugular veins, possibly because there were few opportunities for residents to insert a catheter during the 4‐week general medical ward rotations. Thus, although an active educational intervention improved the knowledge and confidence of residents, it had a minimal effect on behavior (only improved certain infection‐control practices). Catheter‐associated complications were infrequent and similar in the intervention and control groups.
Central venous catheter insertion is a skill that many general internists do not perform10; however, until recently the American Board of Internal Medicine considered it a requisite skill for internal medicine residents, and most residents at our hospital reported a desire to learn this skill. Although in our study complications were infrequent, suggesting that a change in venous insertion site is unlikely to dramatically improve patient safety, we believe that residents should become skilled at inserting catheters in internal jugular or subclavian veins, the currently recommended optimal venous insertion.8
There is evidence that single educational interventions are unlikely to result in substantial, sustained behavioral change, especially passive educational programs.11 However, a previous study documented a change in provider behavior and possibly a reduction in bloodstream infections after a single hands‐on training session.12 Our hands‐on educational format was very popular and likely improved some infection‐control practices but did not change provider behavior about choice of venous insertion site. In other institutions, mentoring residents on appropriate catheter insertion technique has been accomplished by establishing a procedure service13 or by resident rotation in a high‐volume location (eg, cardiac catheterization laboratory).14 Another option to facilitate behavioral change would be to provide a portable ultrasound machine, as requested by our residents, which may reduce complication rates.15, 16 At our hospital, we decided to supplement hands‐on training with expert bedside supervision during catheter insertion; the expert is provided through a procedure service that is led by hospitalists. The procedure service has a dedicated portable ultrasound machine to assist with internal jugular vein cannulation.
By the end of our study period, residents' confidence in subclavian or internal jugular catheter insertions had returned to presession levels; however, they reported increased confidence in femoral venous catheter insertions. These findings suggest that the session increased residents' confidence with catheter insertions in general, but not specifically for venous sites for which they had no previous experience. For subclavian or internal jugular catheter insertions, their confidence decayed to the presession baseline, likely because of few opportunities to insert catheters in patients; on average, each resident inserts 1 central venous catheter on the general medicine wards approximately every 4 months.
Our survey found that our intervention changed residents' attitudes about infection‐control practices. In particular, intervention‐group residents reported that they were more likely to remove unnecessary catheters and that they had used a mask and large drape during catheter insertion. Use of full‐barrier precautions (ie, sterile gloves and gown, large sterile drape, cap, and mask) has been shown to reduce the risk of bloodstream infection2 and is included in national guidelines.17 Adherence to these guidelines has been included in successful quality improvement initiatives.4, 5, 18 Compared to internists' adherence to recommendations for infection control reported in another survey,10 residents who attended our educational session reported more use of large sterile drapes (94% vs. 35%) or masks (75% vs. 66%); however, they were less likely to use a sterile gown (50% vs. 72%). Use of a large sterile drape is common in our hospital, likely because the drape is included in the central venous catheter package. We suspect that at our hospital, poor adherence to certain recommendations (eg, using a sterile gown) was due in part to difficulty accessing supplies. Another possibility is that use of a cap, compared to use of large drapes, is perceived as not giving the patient much additional protection. In fact, there is no evidence that using a cap provides benefit beyond that of other, more intuitively beneficial recommended infection‐control practices, such as using sterile gloves and a large sterile drape. The procedure service has addressed the supply problem by stocking hard‐to‐find items on a procedure cart.
Only 2 clinically evident complications associated with catheter insertion occurred (one patient with clinical sepsis and one with a hematoma). Although it is possible that we missed minor complications, our rates were similar to those reported by other investigators: clinically diagnosed venous thromboembolism, 0%2.2%3, 19, 20; pneumothorax, 1.4%21; catheter‐associated primary bloodstream infection, 1‐6/1000 catheter‐days.22, 23 Comparing complication rates was hindered by variability in definitions, methods of ascertainment, and populations evaluated. For example, the rate of venous thromboembolism was dramatically higher when routine diagnostic imaging was used, and detection of catheter‐associated infections likely increased when catheter‐tip cultures were routinely performed. We required clinical evidence of complications, and our study differs from others in that we evaluated general medicine ward patients.
This study had several limitations. Placement of central venous catheters on general medicine wards was less frequent than we anticipated based on a brief period of pilot data collection; therefore, our study was not powered to detect relatively small changes in venous insertion sites or differences in complications. Also, because direct observation was not possible, we relied on self‐reported adherence to infection‐control practices. However, intervention residents' self‐reported poor adherence to gown, glove, and cap use suggests that their responses were unbiased.
An educational session focused on central venous catheter insertion practices was well received by residents, increased their knowledge about complications, and improved infection‐control practices, but had no effect on increasing use of subclavian or internal jugular veins for catheter insertion. Despite continued frequent use of femoral venous catheters, clinically apparent complications were infrequent. However, we believe it is important to teach residents optimal catheter insertion techniques, including preferential placement of catheters in subclavian or internal jugular veins. Therefore, the section of hospital medicine at our hospital initiated a procedure service that provides expert bedside supervision, including use of a portable ultrasound machine, for catheter insertions.
Acknowledgements
The authors acknowledge Kathleen Murray for data collection and form development; Donald Blom for assistance with determining bloodstream infection; Laura Sadowski for developing and leading the focus group session; Yannis Guerra for assistance with the educational sessions; Oksana Barilyak, Anand Despande, and Saurabh Sharma for assistance with data collection; and chief residents Rony Ghaoui, Sean Halleran, Priya Kansal, Parag Sampat, and Sunita Nathan for interviewing residents about catheter insertions.
- ,,,,.Central vein catheterization. Failure and complication rates by three percutaneous approaches.Arch Intern Med.1986;146:259–261.
- ,,, et al.Prevention of central venous catheter‐related infections by using maximal sterile barrier precautions during insertion.Infect Control Hosp Epidemiol.1994;15:231–238.
- ,,, et al.Complications of femoral and subclavian venous catheterization in critically ill patients: a randomized controlled trial.JAMA.2001;286:700–707.
- ,,, et al.Eliminating catheter‐related bloodstream infections in the intensive care unit.Crit Care Med.2004;32:2014–2020.
- ,,, et al.The effect of an education program on the incidence of central venous catheter‐associated bloodstream infection in a medical ICU.Chest.2004;126:1612–1618.
- ,,, et al.Prevalence of the use of central venous access devices within and outside of the intensive care unit: results of a survey among hospitals in the prevention epicenter program of the Centers for Disease Control and Prevention.Infect Control Hosp Epidemiol.2003;24:942–945.
- ,,,,,.Unnecessary use of central venous catheters: the need to look outside the intensive care unit.Infect Control Hosp Epidemiol.2004;25:266–268.
- ,.Preventing complications of central venous catheterization.N Engl J Med.2003;348:1123–1133.
- ,,,,.CDC definitions for nosocomial infections, 1988.Am J Infect Control.1988;16:128–140.
- ,,,.Why is it that internists do not follow guidelines for preventing intravascular catheter infections?Infect Control Hosp Epidemiol.2005;26:525–533.
- ,,, et al.Changing provider behavior: an overview of systematic reviews of interventions.Med Care.2001;39:II2–II45.
- ,,, et al.Education of physicians‐in‐training can decrease the risk for vascular catheter infection.Ann Intern Med.2000;132:641–648.
- ,, et al.Creation of an innovative inpatient medical procedure service and a method to evaluate house staff competency.J Gen Intern Med.2004;19:510–513.
- ,,,.A curricular initiative for internal medicine residents to enhance proficiency in internal jugular central venous line placement.Mayo Clin Proc.2005;80:212–218.
- ,,,,,.Improvement of internal jugular vein cannulation using an ultrasound‐guided technique.Intensive Care Med.1997;23:916–919.
- ,,.Facilitation of internal jugular venous cannulation using an audio‐guided Doppler ultrasound vascular access device: results from a prospective, dual‐center, randomized, crossover clinical study.Crit Care Med.1995;23:60–65.
- ,,, et al.Guidelines for the prevention of intravascular catheter‐related infections.MMWR Morb Mortal Wkly Rep.2002;1(RR10):1–26.
- ,,, et al.The impact of bedside behavior on catheter‐related bacteremia in the intensive care unit.Arch Surg.2004;139:131–136.
- ,,,,,.A prospective evaluation of the use of femoral venous catheters in critically ill adults.Crit Care Med.1997;25:1986–1989.
- ,,,,.Deep venous thrombosis caused by femoral venous catheters in critically ill adult patients.Chest.2000;117:178–183.
- ,,.Complications of central venous catheters: internal jugular versus subclavian access—a systematic review.Crit Care Med.2002;30:454–460.
- ,,,,,.Prospective evaluation of risk factors for bloodstream infection in patients receiving home infusion therapy.Ann Intern Med.1999;131:340–347.
- ,,,.Nosocomial infections in combined medical‐surgical intensive care units in the United States.Infect Control Hosp Epidemiol.2000;21:510–515.
Copyright © 2007 Society of Hospital Medicine
Conflicting Measures of Hospital Quality / Halasyamani and Davis
National concerns about the quality of health care in the United States have prompted calls for transparent efforts to measure and report hospital performance to the public. Consumer groups, payers, and credentialing organizations now rate the quality of hospitals and health care through a variety of mechanisms, yielding a kaleidoscope of quality measurement scorecards. However, health care consumers have minimal information about how hospital quality rating systems compare with each other or which rating system might best address their information needs.
The Hospital Compare Web site was launched in April 2005 by the Hospital Quality Alliance (HQA), a public‐private collaboration among organizations, including the Centers for Medicare and Medicaid Services (CMS). The CMS describes Hospital Compare as information [that] measures how well hospitals care for their patients.1 A limited set of Hospital Compare data from 2004 were posted online in 2005 for more than 4200 hospitals, permitting community‐specific comparisons of hospitals' self‐reported standardized core measures that reflect quality of care for acute myocardial infarction (AMI), congestive heart failure (CHF), and community‐acquired pneumonia (CAP) in adult patients.
Other current hospital quality evaluation tools target payers and purchasers of health care. However, many of these evaluations require that institutions pay a fee for submitting their data to be benchmarked against other participating institutions or require that the requesting individual or organization pay a fee to examine a hospital's performance on a specific condition or procedure.
We examined Hospital Compare data alongside that of another hospital rating system that has existed for a longer period of time and is likely better known to the lay publicthe Best Hospitals lists published annually by U.S. News and World Report.2, 3 Together, Hospital Compare and Best Hospitals are hospital quality scorecards that offer consumers assessments of hospital performance on a national scale. However, their measures of hospital quality differ, and we investigated whether they would provide consumers with concordant assessments of hospital quality.
METHODS
Data Sources
Hospital Compare
Core measure performance data were obtained by the investigators from the Hospital Compare Web site.3 Information in the database was provided by hospitals for the period January‐June 2004. Hospitals self‐reported their performance on the core measures using standardized medical record abstraction programs. The measures reported are cumulative averages based on monthly performance summaries.
Fourteen core measures were used in the study to form 3 core measure sets (Table 1): the AMI set comprised 6 measures, the CHF set comprised 4 measures, and the CAP site comprised 4 measures. Of the 17 core measures available on the Hospital Compare Web site, core measures of timing of thrombolytic agents or percutaneous transluminal coronary angioplasty for patients with AMI were excluded from the analysis because fewer than 10% of institutions reported such measures. Data on the core measure about oxygenation measurement for CAP were also excluded because of minimal variation between hospitals (national mean = 98%; the national mean for all other measures was less than 92%).3
| Condition | Core Measures |
|---|---|
| |
| Acute myocardial infarction (AMI) |
|
| Congestive heart failure (CHF) |
|
| Community‐acquired pneumonia (CAP) |
|
Core measures that CMS defined as having too few cases (< 25) to reliably ascertain an estimate of hospital performance, or for which hospitals were not reporting data, were not eligible for analysis. To generate a composite score for each of the disease‐specific core measure sets, scores for all eligible core measures within each set were summed and then divided by the number of eligible measures available. This permitted standardization of the scores in the majority of instances when institutions did not report all eligible measures within a given set.
Best Hospitals
Ratings of hospitals were drawn from the 2004 and 2005 editions of the Best Hospitals listings of the U.S. News and World Report, the editions that most closely reflect performance data and physician survey data concurrent with Hospital Compare data analyzed for this study.4 In each year, ratings were developed for more than 2000 hospitals that met specific criteria related to teaching hospital status, medical school affiliation, or availability of specific technology‐related services.5 The Best Hospitals rating system is based on 3 central elements of evaluation: (a) reputation, judged by responses to a national mail survey of physicians asked to list the 5 hospitals best in their specialty for difficult cases, without economic or geographic considerations; (b) in‐hospital mortality rates for Medicare patients, adjusted for severity of illness; and (c) a combination of other factors, such as the nurse‐to‐patient ratio and the number of a set of predetermined key technologies available, as determined from institutions' responses to the American Hospital Association's annual survey.5
The 50 Best Hospitals for heart and heart surgery, 50 Best Hospitals for respiratory disorders, and all Honor Roll hospitals (as determined by breadth of institutional excellence, with top performance in 6 or more of 17 specialties) named in 2004 and 2005 were included in this study, except that National Jewish Medical and Research Center was listed as a Best Hospital for respiratory disorders in both years but did not report sufficient numbers of cases to have eligible core measures in Hospital Compare. Of note, there were 11 institutions newly listed as Best Hospitals for heart and heart surgery and 10 institutions newly listed as Best Hospitals for respiratory disorders in 2005 versus 2004; 14 hospitals made the Best Hospitals Honor Roll in 2004, and 2 others were added for 2005.
Data Analysis
To examine the internal validity of the Hospital Compare measures, we calculated pairwise correlation coefficients among the 14 core‐measure components, using all eligible data points. We then calculated Cronbach's , a measure of the internal consistency of scales of measures, to characterize each of the sets of Hospital Compare core measures separately (AMI, CHF, CAP). We also generated Cronbach's for a measure we called the combined core‐measures score, which we intended to be analogous to the Best Hospitals Honor Roll, defined as the AMI, CHF, and CAP measure sets scored together.
To compare Hospital Compare data with the Best Hospitals rankings (for heart and heart surgery, respiratory disorders, and the Honor Roll), we first established national quartile score cut points for each of the 3 Hospital Compare core measure sets and for the combined core measures, using all U.S. hospitals eligible for our analysis. We used quartiles to avoid the misclassification that would be more likely to occur with deciles (based on confidence intervals for the core measures provided by CMS).6
We calculated Hospital Compare scores for each institution listed as a Best Hospital in 2004 and 2005 and classified the Best Hospitals into scoring quartiles based on national score cut points (eg, if the national cutoff for AMI core measures for the top quartile was 95.2%, then a Best Hospital with an AMI score for the core‐measures set 95.2% was classified in the first [top] quartile). AMI and CHF core measure sets were used for comparison with the Best Hospitals for heart and heart surgery, the CAP core‐measure set was used for comparison with the Best Hospitals for respiratory disorders, and the combined core‐measure set was used for comparison with the Honor Roll hospitals.
Sensitivity Analyses
To investigate the effect of missing Hospital Compare data on our study findings, we conducted sensitivity analyses. We used only those institutions with complete data for the AMI, CHF, and CAP core measure sets to establish new quartile cut points and then reexamined the quartile distribution for institutions in the corresponding Best Hospitals lists. We also compared the Best Hospitals' Hospital Compare data completeness with that of all Hospital Compare institutions.
RESULTS
Core Performance Measures in Hospital Compare
Of 4203 hospitals that submitted core measures as part of Hospital Compare, 4126 had at least 1 core measure eligible for analysis (> 25 observations). Of these 4126 hospitals, 2165 (52.5%) had at least 1 eligible AMI core measure, and 398 (9.7%) had all 6 measures eligible for analysis; 3130 had at least 1 eligible CHF core measure (75.9%), and 289 (7.0%) had all 4 measures eligible for analysis; and 3462 (83.9%) had at least one eligible CAP core measure and 302 (7.3%) had all 4 measures eligible for analysis. For the combined core‐measure score, 2119 (51.4%) had at least 4 eligible measures, and 120 (2.9%) had all 14 measures eligible for analysis.
Pairwise correlation coefficients within each of the disease‐specific core measure sets was highest for the AMI measures, and was generally higher for measures that reflected similar clinical activities (eg, aspirin and ‐blocker at discharge for AMI care; tobacco cessation counseling for AMI, CHF, and CAP; Table 2). In general, the AMI and CHF performance measures correlated more strongly with each other than did the AMI or CHF measures with the CAP measures.
Internal consistency within each of the disease‐specific measures was moderate to strong, with Cronbach's = .83 for AMI, Cronbach's = .58 for CHF, and Cronbach's = .49 for CAP. For the combined performance measure set (all 14 core measures together), Cronbach's = .74.
Hospital Compare Scores for Institutions Listed as Best Hospitals
Best Hospitals for heart and heart surgery and for respiratory disorders in U.S. News and World Report in 2004 and 2005 exhibited a broad distribution of Hospital Compare core measure scores (Table 3). For none of the core measure sets did a majority of Best Hospitals score in the top quartile in either year.
| Hospital Compare Scores | Best Hospitals for Heart Disease: AMI Core Measures (n = 50 hospitals)* | Best Hospitals for Heart Disease: CHF Core Measures (n = 50 hospitals)* | Best Hospitals for Respiratory Disorders: CAP Core Measures (n = 49 hospitals)* | |||
|---|---|---|---|---|---|---|
| ||||||
| 2004 | 2005 | 2004 | 2005 | 2004 | 2005 | |
| First quartile | 20 (40%) | 15 (30%) | 19 (38%) | 19 (38%) | 5 (10%) | 7 (14%) |
| Second quartile | 16 (32%) | 21 (42%) | 14 (28%) | 15 (30%) | 8 (16%) | 6 (12%) |
| Third quartile | 11 (22%) | 10 (20%) | 11 (22%) | 12 (24%) | 13 (27%) | 15 (31%) |
| Fourth quartile | 3 (6%) | 4 (8%) | 6 (12%) | 4 (8%) | 23 (47%) | 21 (43%) |
Among the 50 hospitals identified as best for cardiac care, only 20 (40%) in the 2004 list and 15 (30%) in the 2005 list had AMI core‐measure scores in the top quartile nationally, and 14 (28%) scored below the national median in both years. Among those same 50 hospitals, only 19 (38%) had CHF core‐measure scores in the top quartile nationally in both years, whereas 17 (34%) scored below the national median in 2004 and 16 in 2005. On the CAP core measures, Best Hospitals for respiratory disorders generally scored poorly, with only 5 (10%) from the 2004 list and 7 (14%) from the 2005 list in the top quartile nationally and nearly half the institutions scoring in the bottom national quartile (Table 3).
For the 14 hospitals named to the 2004 Honor Roll of Best Hospitals, the comparison with the combined core‐measure score (AMI, CHF, and CAP together) revealed a similarly broad distribution of core measure performance. Only five hospitals scored in the top quartile, 2 in the second quartile, 5 in the third quartile, and 2 in the bottom quartile. The distribution for hospitals in the 2005 Honor Roll was similar (5‐3‐6‐2 by quartile).
Sensitivity Analyses
National quartile Hospital Compare core‐measure cut points were slightly lower (1%‐2% in absolute terms) for those institutions with complete data than for institutions overall; in other words, institutions reporting on all 17 measures were generally more likely to have somewhat lower scores. These differences were substantive enough to shift the distribution of Best Hospitals in 2004 and 2005 up to higher quartiles for the AMI and CHF Hospital Compare measures but not for the CAP measures. For example, using the complete data AMI cut points, 23 of the 50 Best Hospitals for cardiac care in 2005 scored in the top quartile, 16 in the second quartile, 6 in the third quartile, and 5 in the bottom quartile (compared with 15‐21‐10‐4; Table 3). With complete data CHF cut points, the distribution was 26, 11, 9, and 4 for the 2005 Best Hospitals for cardiac care from the top through bottom quartiles, respectively (compared with 19‐15‐12‐4; Table 3). Results for 2004 sensitivity analyses were similar.
Institutions named as Best Hospitals appeared more likely than institutions overall to have complete Hospital Compare data. Whereas fewer than 10% of institutions in Hospital Compare had complete data for the AMI, CHF, and CAP core measures, 60% of Best Hospitals for cardiac care in 2005 had complete data for AMI measures and 44% for CHF measures, whereas 32% of Best Hospitals for respiratory care had complete CAP data.
DISCUSSION
With the public release of Hospital Compare data for more than 4200 hospitals in April 2005, national efforts to report hospital quality to the public passed a major milestone. Our findings indicate that the separate Hospital Compare measures for AMI, CHF, and CAP care have moderate to strong internal consistency, which suggests they are capturing similar hospital‐level care behaviors across institutions for these 3 common conditions.
However, Hospital Compare scores are largely discordant with the Best Hospital rank lists for cardiac and respiratory disorders care. Several institutions listed as Best Hospitals nationally scored below the national median on disease‐specific Hospital Compare core measures, perhaps leaving data‐conscious consumers to wonder how to synthesize rating systems that employ different indicators and measure different aspects of health care delivery.
Lack of Agreement in Hospital Quality Measurement
Discordance between the Hospital Compare and Best Hospitals rating systems is not all that surprising, given that their methods of institutional assessment differ markedly. Although both approaches share the goal of allowing consumers a comparative look at institutional performance nationally, they clearly measure different aspects of hospital care.
Hospital Compare measures focus on the delivery of disease‐specific, evidence‐based practices for 3 acute medical conditions from the emergency department to discharge. In comparison, the Best Hospitals rankings emphasize the reputation and mortality data of hospitals and health systems across a variety of general and subspecialty care settings (including several in which core quality measures have not yet been developed), combined with factors related to nursing and technology availability that may also influence consumers' choices. Of note, the Best Hospitals rating approach has been criticized in the past for its strong reliance on physicians' ratings of institutional reputation, which may have little to do with functional measures of quality.7
In essence, the Hospital Compare measures indicate how hospitals perform for an average case, while Best Hospitals relies on reputation and focus on mortality to indicate how institutions perform on the toughest cases. The question at hand is: are these institutional quality measures complementary or contradictory? Our findings suggest that Hospital Compare and Best Hospitals measures offer consumers a mix of complementary and contradictory information, depending on the institution.
The ratings systems differ in other respects as well. In Hospital Compare, performance data are available for more than 4000 hospitals, which permits consumers to examine their local institutions, whereas the Best Hospitals lists offer information only on the top performers. On the other hand, the more established Best Hospitals listings have been published annually for the last 15 years,5 permitting some longitudinal evaluation of hospitals' quality consistency. Importantly, neither rating system includes measures of patient satisfaction with hospital care.
One dimension that both rating systems share is the migration of quality measurement from the local and institutional level to the national stage. Historically, health care quality measurement has been a local phenomenon, as institutions work to gain larger shares of their local markets. A few hospitals have marketed their care and services regionally or even nationally and internationally, but these institutionswhich previously primarily used their reputation rather than specific outcome metrics to reach beyond their local communitiesare a minority of U.S. hospitals.
Although Hospital Compare and Best Hospitals are both national in scope, only Hospital Compare allows consumers to understand the quality of care in most of their community hospitals and health systems. Other investigators analyzing the same data set have highlighted significant differences in hospital performance according to for‐profit status, academic status, and size (number of beds).8
However, it is not yet clear if and how hospital ratings influence consumers' health care decisions. In fact, some studies suggest that only a minority of patients are inclined to use performance reports in their decisions about health care.9, 10 Moreover, if illness is acute, the factors driving choice of hospital may be geographic proximity, bed availability, and payer contracts rather than performance measures.
These constraints on the utility of hospital quality metrics from the consumer perspective are reminders that such metrics may have other benefits. Specifically, ratings such as Hospital Compare and Best Hospitals, as well as others such as those of the Leapfrog Group11 and the Joint Commission on Accreditation of Healthcare Organizations,12 offer differing arrays of performance measures that may induce hospitals to improve their quality of care.1, 13 Institutions that score well or improve their scores over time can use such scores not only to benchmark their processes and outcomes but also to signal the comparative value of their care to the public. In the past, hospitals named to the Best Hospitals Honor Roll have trumpeted their achievements through plaques on their walls and in advertisements for their services. Whether institutions will do the same regarding their Hospital Compare scores remains to be seen.
Study Limitations
The chief limitation of this analysis is that not all hospitals reported data for the Hospital Compare core measures. We standardized the core‐measure sets for AMI, CHF, and CAP care for the number of measures reported in each set in order to include as many hospitals as possible in our analyses. Participation in Hospital Compare is voluntary (although strongly encouraged because of better Medicare reimbursement for institutions that participate), so it is possible that there was a systematic scoring bias in hospitals' incomplete reporting across all measures, that is, hospitals might not report specific core measure scores if they were particularly poor.13 That scale score medians were slightly lower for hospitals with complete data than for hospitals overall may indicate some reporting bias in the Hospital Compare data. Nevertheless, in the sensitivity analyses we performed using only those hospitals with complete data on the Hospital Compare core measures, comparisons with the Best Hospitals lists still predominantly indicated discordance between the rating systems.
Another limitation of this work is that we examined only 2 of several currently available hospital‐rating schemes. We chose to examine Hospital Compare because it is the first governmental effort to report specific hospital quality measures to the public, and we elected to look at Hospital Compare alongside the Best Hospitals lists because the latter are arguably the hospital ratings best known to the lay public.
A third potential limitation is that the Best Hospitals lists for 2004 were based in part on mortality figures and hospital survey data from 2002, which were the most recent data available at the time of the rankings; for the 2005 Best Hospitals lists, the most recent mortality and hospital survey data were collected in 2003.4 Hospital Compare scores were calculated on the basis of patients discharged in 2004, and therefore the ratings systems reflect somewhat different time frames. Nonetheless, we do not believe that this mismatch explains the extent of discordance between the 2 rating scales, particularly because there was such stability in the Best Hospital lists over the 2 years.
CONCLUSIONS
The Best Hospitals lists and Hospital Compare core measure scores agree only a minority of the time on the best institutions for the care of cardiac and respiratory conditions in the United States. Prominent, publicly reported hospital quality scorecards that paint discordant pictures of institutional performance potentially present a conundrum for physicians, patients, and payers with growing incentives to compare institutional quality.
If the movement to improve health care quality is to succeed, the challenge will be to harness the growing professional and lay interest in quality measurement to create rating scales that reflect the best aspects of Hospital Compare and the Best Hospitals lists, with the broadest inclusion of institutions and scope of conditions. For example, it would be more helpful to the public if the Best Hospitals lists included available Hospital Compare measures. It would also benefit consumers if Hospital Compare included more metrics about preventive and elective procedures, domains in which consumers can maximally exercise their choice of health care institutions. Moreover, voluntary reporting may constrain the quality effort. Only with mandatory reporting on quality measures will consistent and sufficient institutional accountability be achieved.
- .Public performance reports and the will for change.JAMA.2002;288:1523–1524.
- .Improving the quality of care—can we practice what we preach?N Engl J Med.2003;348:2681–2683.
- U.S. Department of Health and Human Services, Centers for Medicare and Medicaid Services. Hospital Compare. Available at: http://www.hospitalcompare.hhs.gov. Accessed May 12,2005.
- U.S. News and World Report. Best hospitals 2005. Available at: http://www.usnews.com/usnews/health/best‐hospitals/tophosp.htm. Accessed July 10,2005.
- . Best hospitals 2005: methodology behind the rankings. U.S. News and World Report. Available at: http://www.usnews.com/usnews/health/best‐hospitals/methodology.htm. Accessed July 10,2005.
- U.S. Department of Health and Human Services, Centers for Medicare and Medicaid Services. Hospital Compare: information for professionals. Available at: http://www.hospitalcompare.hhs.gov/Hospital/Static/Data‐Professionals.asp?dest=NAV|Home|DataDetails|ProfessionalInfo#TabTop. Accessed May 12,2005.
- ,,,.In search of America's best hospitals: the promise and reality of quality assessment.JAMA.1997;277:1152–1155.
- ,,,.Care in US hospitals—the Hospital Quality Alliance program.N Engl Jour Med.2005;353:265–274.
- ,.Use of public performance reports: a survey of patients undergoing cardiac surgery.JAMA.1998;279:1638–1642.
- Kaiser Family Foundation and Agency for Health Care Research and Quality.National Survey on Consumers' Experiences with Patient Safety and Quality Information.Washington, DC:Kaiser Family Foundation;2004.
- Leapfrog Group for Patient Safety. Available at: http://www.leapfroggroup.org. Accessed May 12,2005.
- Joint Commission on Accreditation of Healthcare Organizations. Quality check. Available at: http://www.jcaho.org/quality+check/index.htm. Accessed May 12,2005.
- ,.The unintended consequences of publicly reporting quality information.JAMA.2005;293:1239–1244.
National concerns about the quality of health care in the United States have prompted calls for transparent efforts to measure and report hospital performance to the public. Consumer groups, payers, and credentialing organizations now rate the quality of hospitals and health care through a variety of mechanisms, yielding a kaleidoscope of quality measurement scorecards. However, health care consumers have minimal information about how hospital quality rating systems compare with each other or which rating system might best address their information needs.
The Hospital Compare Web site was launched in April 2005 by the Hospital Quality Alliance (HQA), a public‐private collaboration among organizations, including the Centers for Medicare and Medicaid Services (CMS). The CMS describes Hospital Compare as information [that] measures how well hospitals care for their patients.1 A limited set of Hospital Compare data from 2004 were posted online in 2005 for more than 4200 hospitals, permitting community‐specific comparisons of hospitals' self‐reported standardized core measures that reflect quality of care for acute myocardial infarction (AMI), congestive heart failure (CHF), and community‐acquired pneumonia (CAP) in adult patients.
Other current hospital quality evaluation tools target payers and purchasers of health care. However, many of these evaluations require that institutions pay a fee for submitting their data to be benchmarked against other participating institutions or require that the requesting individual or organization pay a fee to examine a hospital's performance on a specific condition or procedure.
We examined Hospital Compare data alongside that of another hospital rating system that has existed for a longer period of time and is likely better known to the lay publicthe Best Hospitals lists published annually by U.S. News and World Report.2, 3 Together, Hospital Compare and Best Hospitals are hospital quality scorecards that offer consumers assessments of hospital performance on a national scale. However, their measures of hospital quality differ, and we investigated whether they would provide consumers with concordant assessments of hospital quality.
METHODS
Data Sources
Hospital Compare
Core measure performance data were obtained by the investigators from the Hospital Compare Web site.3 Information in the database was provided by hospitals for the period January‐June 2004. Hospitals self‐reported their performance on the core measures using standardized medical record abstraction programs. The measures reported are cumulative averages based on monthly performance summaries.
Fourteen core measures were used in the study to form 3 core measure sets (Table 1): the AMI set comprised 6 measures, the CHF set comprised 4 measures, and the CAP site comprised 4 measures. Of the 17 core measures available on the Hospital Compare Web site, core measures of timing of thrombolytic agents or percutaneous transluminal coronary angioplasty for patients with AMI were excluded from the analysis because fewer than 10% of institutions reported such measures. Data on the core measure about oxygenation measurement for CAP were also excluded because of minimal variation between hospitals (national mean = 98%; the national mean for all other measures was less than 92%).3
| Condition | Core Measures |
|---|---|
| |
| Acute myocardial infarction (AMI) |
|
| Congestive heart failure (CHF) |
|
| Community‐acquired pneumonia (CAP) |
|
Core measures that CMS defined as having too few cases (< 25) to reliably ascertain an estimate of hospital performance, or for which hospitals were not reporting data, were not eligible for analysis. To generate a composite score for each of the disease‐specific core measure sets, scores for all eligible core measures within each set were summed and then divided by the number of eligible measures available. This permitted standardization of the scores in the majority of instances when institutions did not report all eligible measures within a given set.
Best Hospitals
Ratings of hospitals were drawn from the 2004 and 2005 editions of the Best Hospitals listings of the U.S. News and World Report, the editions that most closely reflect performance data and physician survey data concurrent with Hospital Compare data analyzed for this study.4 In each year, ratings were developed for more than 2000 hospitals that met specific criteria related to teaching hospital status, medical school affiliation, or availability of specific technology‐related services.5 The Best Hospitals rating system is based on 3 central elements of evaluation: (a) reputation, judged by responses to a national mail survey of physicians asked to list the 5 hospitals best in their specialty for difficult cases, without economic or geographic considerations; (b) in‐hospital mortality rates for Medicare patients, adjusted for severity of illness; and (c) a combination of other factors, such as the nurse‐to‐patient ratio and the number of a set of predetermined key technologies available, as determined from institutions' responses to the American Hospital Association's annual survey.5
The 50 Best Hospitals for heart and heart surgery, 50 Best Hospitals for respiratory disorders, and all Honor Roll hospitals (as determined by breadth of institutional excellence, with top performance in 6 or more of 17 specialties) named in 2004 and 2005 were included in this study, except that National Jewish Medical and Research Center was listed as a Best Hospital for respiratory disorders in both years but did not report sufficient numbers of cases to have eligible core measures in Hospital Compare. Of note, there were 11 institutions newly listed as Best Hospitals for heart and heart surgery and 10 institutions newly listed as Best Hospitals for respiratory disorders in 2005 versus 2004; 14 hospitals made the Best Hospitals Honor Roll in 2004, and 2 others were added for 2005.
Data Analysis
To examine the internal validity of the Hospital Compare measures, we calculated pairwise correlation coefficients among the 14 core‐measure components, using all eligible data points. We then calculated Cronbach's , a measure of the internal consistency of scales of measures, to characterize each of the sets of Hospital Compare core measures separately (AMI, CHF, CAP). We also generated Cronbach's for a measure we called the combined core‐measures score, which we intended to be analogous to the Best Hospitals Honor Roll, defined as the AMI, CHF, and CAP measure sets scored together.
To compare Hospital Compare data with the Best Hospitals rankings (for heart and heart surgery, respiratory disorders, and the Honor Roll), we first established national quartile score cut points for each of the 3 Hospital Compare core measure sets and for the combined core measures, using all U.S. hospitals eligible for our analysis. We used quartiles to avoid the misclassification that would be more likely to occur with deciles (based on confidence intervals for the core measures provided by CMS).6
We calculated Hospital Compare scores for each institution listed as a Best Hospital in 2004 and 2005 and classified the Best Hospitals into scoring quartiles based on national score cut points (eg, if the national cutoff for AMI core measures for the top quartile was 95.2%, then a Best Hospital with an AMI score for the core‐measures set 95.2% was classified in the first [top] quartile). AMI and CHF core measure sets were used for comparison with the Best Hospitals for heart and heart surgery, the CAP core‐measure set was used for comparison with the Best Hospitals for respiratory disorders, and the combined core‐measure set was used for comparison with the Honor Roll hospitals.
Sensitivity Analyses
To investigate the effect of missing Hospital Compare data on our study findings, we conducted sensitivity analyses. We used only those institutions with complete data for the AMI, CHF, and CAP core measure sets to establish new quartile cut points and then reexamined the quartile distribution for institutions in the corresponding Best Hospitals lists. We also compared the Best Hospitals' Hospital Compare data completeness with that of all Hospital Compare institutions.
RESULTS
Core Performance Measures in Hospital Compare
Of 4203 hospitals that submitted core measures as part of Hospital Compare, 4126 had at least 1 core measure eligible for analysis (> 25 observations). Of these 4126 hospitals, 2165 (52.5%) had at least 1 eligible AMI core measure, and 398 (9.7%) had all 6 measures eligible for analysis; 3130 had at least 1 eligible CHF core measure (75.9%), and 289 (7.0%) had all 4 measures eligible for analysis; and 3462 (83.9%) had at least one eligible CAP core measure and 302 (7.3%) had all 4 measures eligible for analysis. For the combined core‐measure score, 2119 (51.4%) had at least 4 eligible measures, and 120 (2.9%) had all 14 measures eligible for analysis.
Pairwise correlation coefficients within each of the disease‐specific core measure sets was highest for the AMI measures, and was generally higher for measures that reflected similar clinical activities (eg, aspirin and ‐blocker at discharge for AMI care; tobacco cessation counseling for AMI, CHF, and CAP; Table 2). In general, the AMI and CHF performance measures correlated more strongly with each other than did the AMI or CHF measures with the CAP measures.
Internal consistency within each of the disease‐specific measures was moderate to strong, with Cronbach's = .83 for AMI, Cronbach's = .58 for CHF, and Cronbach's = .49 for CAP. For the combined performance measure set (all 14 core measures together), Cronbach's = .74.
Hospital Compare Scores for Institutions Listed as Best Hospitals
Best Hospitals for heart and heart surgery and for respiratory disorders in U.S. News and World Report in 2004 and 2005 exhibited a broad distribution of Hospital Compare core measure scores (Table 3). For none of the core measure sets did a majority of Best Hospitals score in the top quartile in either year.
| Hospital Compare Scores | Best Hospitals for Heart Disease: AMI Core Measures (n = 50 hospitals)* | Best Hospitals for Heart Disease: CHF Core Measures (n = 50 hospitals)* | Best Hospitals for Respiratory Disorders: CAP Core Measures (n = 49 hospitals)* | |||
|---|---|---|---|---|---|---|
| ||||||
| 2004 | 2005 | 2004 | 2005 | 2004 | 2005 | |
| First quartile | 20 (40%) | 15 (30%) | 19 (38%) | 19 (38%) | 5 (10%) | 7 (14%) |
| Second quartile | 16 (32%) | 21 (42%) | 14 (28%) | 15 (30%) | 8 (16%) | 6 (12%) |
| Third quartile | 11 (22%) | 10 (20%) | 11 (22%) | 12 (24%) | 13 (27%) | 15 (31%) |
| Fourth quartile | 3 (6%) | 4 (8%) | 6 (12%) | 4 (8%) | 23 (47%) | 21 (43%) |
Among the 50 hospitals identified as best for cardiac care, only 20 (40%) in the 2004 list and 15 (30%) in the 2005 list had AMI core‐measure scores in the top quartile nationally, and 14 (28%) scored below the national median in both years. Among those same 50 hospitals, only 19 (38%) had CHF core‐measure scores in the top quartile nationally in both years, whereas 17 (34%) scored below the national median in 2004 and 16 in 2005. On the CAP core measures, Best Hospitals for respiratory disorders generally scored poorly, with only 5 (10%) from the 2004 list and 7 (14%) from the 2005 list in the top quartile nationally and nearly half the institutions scoring in the bottom national quartile (Table 3).
For the 14 hospitals named to the 2004 Honor Roll of Best Hospitals, the comparison with the combined core‐measure score (AMI, CHF, and CAP together) revealed a similarly broad distribution of core measure performance. Only five hospitals scored in the top quartile, 2 in the second quartile, 5 in the third quartile, and 2 in the bottom quartile. The distribution for hospitals in the 2005 Honor Roll was similar (5‐3‐6‐2 by quartile).
Sensitivity Analyses
National quartile Hospital Compare core‐measure cut points were slightly lower (1%‐2% in absolute terms) for those institutions with complete data than for institutions overall; in other words, institutions reporting on all 17 measures were generally more likely to have somewhat lower scores. These differences were substantive enough to shift the distribution of Best Hospitals in 2004 and 2005 up to higher quartiles for the AMI and CHF Hospital Compare measures but not for the CAP measures. For example, using the complete data AMI cut points, 23 of the 50 Best Hospitals for cardiac care in 2005 scored in the top quartile, 16 in the second quartile, 6 in the third quartile, and 5 in the bottom quartile (compared with 15‐21‐10‐4; Table 3). With complete data CHF cut points, the distribution was 26, 11, 9, and 4 for the 2005 Best Hospitals for cardiac care from the top through bottom quartiles, respectively (compared with 19‐15‐12‐4; Table 3). Results for 2004 sensitivity analyses were similar.
Institutions named as Best Hospitals appeared more likely than institutions overall to have complete Hospital Compare data. Whereas fewer than 10% of institutions in Hospital Compare had complete data for the AMI, CHF, and CAP core measures, 60% of Best Hospitals for cardiac care in 2005 had complete data for AMI measures and 44% for CHF measures, whereas 32% of Best Hospitals for respiratory care had complete CAP data.
DISCUSSION
With the public release of Hospital Compare data for more than 4200 hospitals in April 2005, national efforts to report hospital quality to the public passed a major milestone. Our findings indicate that the separate Hospital Compare measures for AMI, CHF, and CAP care have moderate to strong internal consistency, which suggests they are capturing similar hospital‐level care behaviors across institutions for these 3 common conditions.
However, Hospital Compare scores are largely discordant with the Best Hospital rank lists for cardiac and respiratory disorders care. Several institutions listed as Best Hospitals nationally scored below the national median on disease‐specific Hospital Compare core measures, perhaps leaving data‐conscious consumers to wonder how to synthesize rating systems that employ different indicators and measure different aspects of health care delivery.
Lack of Agreement in Hospital Quality Measurement
Discordance between the Hospital Compare and Best Hospitals rating systems is not all that surprising, given that their methods of institutional assessment differ markedly. Although both approaches share the goal of allowing consumers a comparative look at institutional performance nationally, they clearly measure different aspects of hospital care.
Hospital Compare measures focus on the delivery of disease‐specific, evidence‐based practices for 3 acute medical conditions from the emergency department to discharge. In comparison, the Best Hospitals rankings emphasize the reputation and mortality data of hospitals and health systems across a variety of general and subspecialty care settings (including several in which core quality measures have not yet been developed), combined with factors related to nursing and technology availability that may also influence consumers' choices. Of note, the Best Hospitals rating approach has been criticized in the past for its strong reliance on physicians' ratings of institutional reputation, which may have little to do with functional measures of quality.7
In essence, the Hospital Compare measures indicate how hospitals perform for an average case, while Best Hospitals relies on reputation and focus on mortality to indicate how institutions perform on the toughest cases. The question at hand is: are these institutional quality measures complementary or contradictory? Our findings suggest that Hospital Compare and Best Hospitals measures offer consumers a mix of complementary and contradictory information, depending on the institution.
The ratings systems differ in other respects as well. In Hospital Compare, performance data are available for more than 4000 hospitals, which permits consumers to examine their local institutions, whereas the Best Hospitals lists offer information only on the top performers. On the other hand, the more established Best Hospitals listings have been published annually for the last 15 years,5 permitting some longitudinal evaluation of hospitals' quality consistency. Importantly, neither rating system includes measures of patient satisfaction with hospital care.
One dimension that both rating systems share is the migration of quality measurement from the local and institutional level to the national stage. Historically, health care quality measurement has been a local phenomenon, as institutions work to gain larger shares of their local markets. A few hospitals have marketed their care and services regionally or even nationally and internationally, but these institutionswhich previously primarily used their reputation rather than specific outcome metrics to reach beyond their local communitiesare a minority of U.S. hospitals.
Although Hospital Compare and Best Hospitals are both national in scope, only Hospital Compare allows consumers to understand the quality of care in most of their community hospitals and health systems. Other investigators analyzing the same data set have highlighted significant differences in hospital performance according to for‐profit status, academic status, and size (number of beds).8
However, it is not yet clear if and how hospital ratings influence consumers' health care decisions. In fact, some studies suggest that only a minority of patients are inclined to use performance reports in their decisions about health care.9, 10 Moreover, if illness is acute, the factors driving choice of hospital may be geographic proximity, bed availability, and payer contracts rather than performance measures.
These constraints on the utility of hospital quality metrics from the consumer perspective are reminders that such metrics may have other benefits. Specifically, ratings such as Hospital Compare and Best Hospitals, as well as others such as those of the Leapfrog Group11 and the Joint Commission on Accreditation of Healthcare Organizations,12 offer differing arrays of performance measures that may induce hospitals to improve their quality of care.1, 13 Institutions that score well or improve their scores over time can use such scores not only to benchmark their processes and outcomes but also to signal the comparative value of their care to the public. In the past, hospitals named to the Best Hospitals Honor Roll have trumpeted their achievements through plaques on their walls and in advertisements for their services. Whether institutions will do the same regarding their Hospital Compare scores remains to be seen.
Study Limitations
The chief limitation of this analysis is that not all hospitals reported data for the Hospital Compare core measures. We standardized the core‐measure sets for AMI, CHF, and CAP care for the number of measures reported in each set in order to include as many hospitals as possible in our analyses. Participation in Hospital Compare is voluntary (although strongly encouraged because of better Medicare reimbursement for institutions that participate), so it is possible that there was a systematic scoring bias in hospitals' incomplete reporting across all measures, that is, hospitals might not report specific core measure scores if they were particularly poor.13 That scale score medians were slightly lower for hospitals with complete data than for hospitals overall may indicate some reporting bias in the Hospital Compare data. Nevertheless, in the sensitivity analyses we performed using only those hospitals with complete data on the Hospital Compare core measures, comparisons with the Best Hospitals lists still predominantly indicated discordance between the rating systems.
Another limitation of this work is that we examined only 2 of several currently available hospital‐rating schemes. We chose to examine Hospital Compare because it is the first governmental effort to report specific hospital quality measures to the public, and we elected to look at Hospital Compare alongside the Best Hospitals lists because the latter are arguably the hospital ratings best known to the lay public.
A third potential limitation is that the Best Hospitals lists for 2004 were based in part on mortality figures and hospital survey data from 2002, which were the most recent data available at the time of the rankings; for the 2005 Best Hospitals lists, the most recent mortality and hospital survey data were collected in 2003.4 Hospital Compare scores were calculated on the basis of patients discharged in 2004, and therefore the ratings systems reflect somewhat different time frames. Nonetheless, we do not believe that this mismatch explains the extent of discordance between the 2 rating scales, particularly because there was such stability in the Best Hospital lists over the 2 years.
CONCLUSIONS
The Best Hospitals lists and Hospital Compare core measure scores agree only a minority of the time on the best institutions for the care of cardiac and respiratory conditions in the United States. Prominent, publicly reported hospital quality scorecards that paint discordant pictures of institutional performance potentially present a conundrum for physicians, patients, and payers with growing incentives to compare institutional quality.
If the movement to improve health care quality is to succeed, the challenge will be to harness the growing professional and lay interest in quality measurement to create rating scales that reflect the best aspects of Hospital Compare and the Best Hospitals lists, with the broadest inclusion of institutions and scope of conditions. For example, it would be more helpful to the public if the Best Hospitals lists included available Hospital Compare measures. It would also benefit consumers if Hospital Compare included more metrics about preventive and elective procedures, domains in which consumers can maximally exercise their choice of health care institutions. Moreover, voluntary reporting may constrain the quality effort. Only with mandatory reporting on quality measures will consistent and sufficient institutional accountability be achieved.
- .Public performance reports and the will for change.JAMA.2002;288:1523–1524.
- .Improving the quality of care—can we practice what we preach?N Engl J Med.2003;348:2681–2683.
- U.S. Department of Health and Human Services, Centers for Medicare and Medicaid Services. Hospital Compare. Available at: http://www.hospitalcompare.hhs.gov. Accessed May 12,2005.
- U.S. News and World Report. Best hospitals 2005. Available at: http://www.usnews.com/usnews/health/best‐hospitals/tophosp.htm. Accessed July 10,2005.
- . Best hospitals 2005: methodology behind the rankings. U.S. News and World Report. Available at: http://www.usnews.com/usnews/health/best‐hospitals/methodology.htm. Accessed July 10,2005.
- U.S. Department of Health and Human Services, Centers for Medicare and Medicaid Services. Hospital Compare: information for professionals. Available at: http://www.hospitalcompare.hhs.gov/Hospital/Static/Data‐Professionals.asp?dest=NAV|Home|DataDetails|ProfessionalInfo#TabTop. Accessed May 12,2005.
- ,,,.In search of America's best hospitals: the promise and reality of quality assessment.JAMA.1997;277:1152–1155.
- ,,,.Care in US hospitals—the Hospital Quality Alliance program.N Engl Jour Med.2005;353:265–274.
- ,.Use of public performance reports: a survey of patients undergoing cardiac surgery.JAMA.1998;279:1638–1642.
- Kaiser Family Foundation and Agency for Health Care Research and Quality.National Survey on Consumers' Experiences with Patient Safety and Quality Information.Washington, DC:Kaiser Family Foundation;2004.
- Leapfrog Group for Patient Safety. Available at: http://www.leapfroggroup.org. Accessed May 12,2005.
- Joint Commission on Accreditation of Healthcare Organizations. Quality check. Available at: http://www.jcaho.org/quality+check/index.htm. Accessed May 12,2005.
- ,.The unintended consequences of publicly reporting quality information.JAMA.2005;293:1239–1244.
Copyright © 2007 Society of Hospital Medicine
Impact of a Bedside Procedure Service
Inpatient bedside procedures are a major source of preventable adverse events in hospitals.1, 2 Unfortunately, many future inpatient physicians may lack the training3 and confidence4 to correct this problem. One proposed model for improving the teaching, performance, and evaluation of bedside procedures is a procedure service that is staffed by faculty who are experts at inpatient procedures.5 In a recent survey of internal medicine residents from our hospital, 86% (30 of 35) believed that expert supervision would improve central venous catheterization technique (Trick WE, personal communication).
Primary considerations in the development of a procedure service are the baseline demand for bedside procedures and whether a procedure service may affect this demand. Though variations in population‐based rates of some hospital procedures have been described,6, 7 there is little written on the demand for procedures performed at the bedsides of inpatients. Concomitant increases in demand and availability of other technologies810 suggest that improving the availability of bedside procedures may lead to an increase in their demand, regardless of whether such an increase benefits patients.11
Therefore, we sought to determine the impact of a bedside procedure service on the baseline number of paracenteses, thoracenteses, lumbar punctures (LPs), and central venous catheterizations (CVCs) performed on general medicine inpatients at our teaching hospital. In addition, we examined whether this service leads to more successful and safe procedure attempts.
METHODS
Design and Setting
In this prospective cohort study, the cohort was all patients admitted to the general medicine service at Cook County Hospital, a 500‐bed public teaching hospital in Chicago, Illinois, in January and February of 2006. The general medicine inpatient service is divided into 3 firms (A, B, and C), each with 4 separate teams of physicians and students. Admissions from the emergency department or other services in the hospital, such as intensive care units (which are closed and therefore staffed by separate teams of physicians), are distributed in sequence to on‐call teams from each firm. During the study period, the availability of a bedside procedure service varied by firm. Throughout the first 4 weeks, the service was available to only 1 of 3 firms (firm A). Then, during weeks 5 through 8, the service crossed over to the other 2 firms (firms B and C) and was unavailable to the original firm. Firm assignments for residents assigned to the inpatient service for all 8 weeks did not change. Of the 16 residents assigned to firm A during the first 4 weeks, when the procedure service was available, 3 remained on the wards during the second 4 weeks, when the procedure service was not available.
We chose to collect data on 4 bedside procedures: paracentesis, thoracentesis, LP, and CVC. Similar to those at other teaching hospitals, our residents informally acquire the skills to perform these procedures while assisting and being assisted by more experienced senior residents in a see one, do one, teach one apprenticeship model of learning.4 To improve the training and performance of these bedside procedures, the Department of Medicine piloted a bedside procedure service to teach procedural skills and assist residents during these procedures. Use of the service, though voluntary, was actively encouraged at residents' monthly orientation meetings and regular conferences.
One attending inpatient physician (J.A.) staffed the bedside procedure service, which was available during normal work hours on weekdays. Requests for procedures were made by general medicine residents through an online database and, after approval by the procedure service attending physician, were performed under his direct supervision. A hand‐carried ultrasound (MicroMaxx, Sonosite, Inc., Bothell, WA) that generates a 2‐dimensional gray‐scale image was used to both confirm the presence and location of fluid prior to paracentesis and thoracentesis and provide real‐time guidance during central venous catheterization. When the bedside procedure service was unavailable, residents performed bedside procedures in the usual fashion, typically without direct attending physician supervision. But if requested, an on‐call chief medical resident with access to a hand‐carried ultrasound device used by the intensive care unit was available for assistance at any time.
Subjects
The study subjects were all patients admitted to the general medical service during the 8‐week pilot period. Patients were excluded if they had been discharged before arrival on the medical wards or if they were under the care of the general medicine service for less than 6 hours before discharge or transfer to another service. We chose 6 hours because we reasoned that such brief admissions were not potential candidates for invasive bedside procedures.
Data Collection
Each morning an investigator contacted the senior residents who had admitted patients during the previous 24‐hour shift and confirmed that newly admitted patients were under the care of the general medicine service for more than 6 hours. To examine how the number of attempts may have been affected by procedures done in the emergency room or intensive care units before admission to the general medicine service, investigators also asked admitting residents whether a bedside procedure had been attempted in the 72 hours before admission. Every general medicine service resident was asked to fill out a brief data collection form after an attempt to perform any procedure on the general medical wards. In addition, chief residents asked each member of the general medicine service at mandatory sign‐out rounds at the end of each weekday whether any procedures had been attempted, and on weekend days investigators contacted senior residents from each general medicine service team.
We report on this quality assurance study, which was conducted during a pilot phase. This report has been reviewed and judged exempt by our institutional review board.
Primary OutcomeNumber of Procedure Attempts
For all bedside procedures attempted by residents on the general medical wards, investigators determined whether the residents were members of firms that were offered the bedside procedure service and, if so, whether the procedure service attending directly supervised the procedure attempt. Multiple procedure attempts of the same type were counted for an individual patient if (1) the procedure attempts did not occur during the same admissions and (2) neither the physicians attempting the procedure nor the primary indications for it were the same. Therefore, neither attempts performed after initially unsuccessful ones nor repeated procedures, such as large‐volume therapeutic paracentesis and thoracentesis, were counted twice. We reasoned that when these criteria were met, procedure attempts could be considered independently.
Secondary Outcomes
Investigators asked residents who attempted procedures to indicate whether (1) the indication for the procedure was solely diagnostic or was, at least in part, therapeutic; (2) the procedure was successful; and (3) there were any immediate major periprocedural complications. A procedure was considered to have been successfully performed if it fulfilled 2 criteria: it had to be completed during a single continuous attempt, even if multiple sites or procedure kits were used; and it had to fulfill the indication for it being done. For example, if the indication for thoracentesis was therapeutic, this procedure would be considered successful if it yielded a large enough volume of fluid to alleviate the patient's symptoms, but if the indication was diagnostic, then thoracentesis would be considered successful if it yielded enough fluid for laboratory processing. Residents were asked to report any periprocedural complications that they considered major; 2 illustrative examples were provided: a pneumothorax and severe bleeding.
Data Analyses
On the basis of earlier pilot data, we estimated that 8%10% of all admissions to the general medicine service underwent at least 1 procedure (paracentesis, thoracentesis, lumbar puncture, or central vein catheterization). We planned for a sample size of 1900 admissions, which would have 80% power to detect a clinically meaningful 50% relative increase in the mean number of bedside procedures with a double‐sided alpha error of 0.05. We used permutation tests to compare the mean number of procedures attempted between firms and bootstrap simulation to construct 95% confidence intervals for those means and the differences between and ratios of them. Fisher's exact test was used to compare proportions of successfully performed procedures and preadmission procedure attempts. All analyses were conducted with Stata Statistical Software, Release 9 (StataCorp, LP, College Station, TX).
RESULTS
Subjects
During this 8‐week pilot study, there were 2157 admissions to the general medicine service. Among these admissions, 216 were excluded from our study because the patients did not arrive on the medical wards or were not under the care of the general medicine service for at least 6 hours before discharge or before being transferred to another service. Of the remaining 1941 admissions, 935 were to firms with the bedside procedure service available, and 1006 were to firms without the service available (Fig. 1)
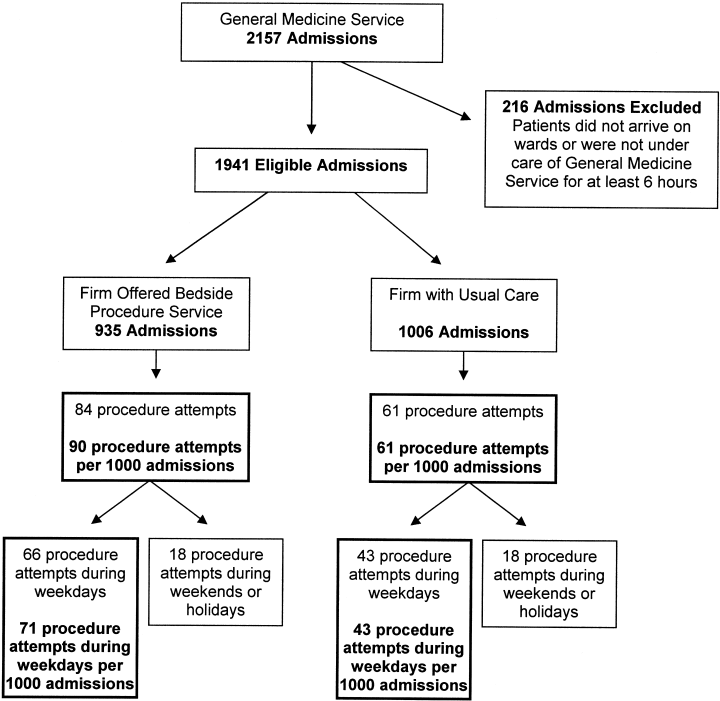
Primary OutcomeNumber of Procedure Attempts
Overall, 122 patients underwent 145 procedure attempts that met our criteria for independence. The mean number of procedure attempts in firms offered the bedside procedure service was 48% higher (90 versus 61 per 1000 admissions; RR 1.48, 95% CI 1.062.10; P = .030; Fig. 1). When procedures attempted on weekends and holidays were excluded, the relative increase in procedure attempts in firms offered the bedside procedure service was even higher (70 versus 43 per 1000 admissions; RR 1.63, 95% CI 1.092.49; P = .023; Fig. 1). When grouped according to whether procedure attempts occurred before or after crossover of the procedure service, the mean number of procedure attempts in firms was higher when the service was offered: firm A dropped from 84 to 70 per 1000 admissions (P = .58) after losing the service, whereas firms B and C increased from 57 to 94 per 1000 admissions (P = .025) on gaining the service. There were 40 procedure attempts performed on patients within 72 hours before admission, but there was no difference between firms in the proportions of these preadmission procedures (P = .43).
Secondary Outcomes
Table 1 shows how of each type of procedure contributed to the overall difference. Attempts of CVC and therapeutic paracentesis and thoracentesis accounted for 86% of the overall increase in procedure attempts for admissions to firms offered the bedside procedure service, whereas only 14% of this increase was a result of diagnostic procedures. There were no differences in the proportions of successfully performed procedures, whether grouped by firm (P = 1.0) or by direct supervision from the procedure service attending (P = .64; Table 2). There were 3 self‐reported major periprocedural complications; all were related to excessive bleeding from CVC attempts. Two occurred without direct supervision from the bedside procedure service attending, one hemomediastinum from an internal jugular CVC attempt and one groin hematoma from a femoral CVC attempt. The third, a groin hematoma from a femoral CVC attempt, occurred during direct supervision from the bedside procedure service attending.
| Bedside procedure and indication | Firms with bedside procedure service 935 admissions | Firms with usual care 1006 admissions | Absolute rate difference (proportion of overall difference)* |
|---|---|---|---|
| Total for entire study (total for weekend days and holidays) | |||
| |||
| Total | 90 (19) | 61 (18) | 29 (100%) |
| Thoracentesis | 30 (10) | 18 (7) | 12 (41%) |
| Diagnosis | 9 (5) | 6 (2) | 3 (9%) |
| Treatment | 21 (4) | 12 (5) | 9 (32%) |
| Paracentesis | 32 (5) | 25 (6) | 7 (25%) |
| Diagnosis | 9 (1) | 11 (3) | 2 (8%) |
| Treatment | 24 (4) | 14 (3) | 10 (33%) |
| Central venous catheterization | 17 (3) | 11 (4) | 6 (21%) |
| Lumbar puncture | 11 (1) | 7 (1) | 4 (13%) |
| Diagnosis | 10 (1) | 6 (1) | 4 (13%) |
| Treatment | 1 (0) | 1 (0) | 0 (0%) |
| Admission to firm with | P value of difference in proportions | ||||||
|---|---|---|---|---|---|---|---|
| Procedure service available | Usual care | ||||||
| Total attempts (n) | Successful | Total attempts (n) | Successful | ||||
| n | % | n | % | ||||
| |||||||
| Central venous catheterization | 16 | 13 | 81 | 11 | 9 | 82 | 1.00 |
| Paracentesis, thoracentesis, or lumbar puncture | 68 | 54 | 79 | 50 | 40 | 80 | 1.00 |
| Total | 84 | 67 | 80 | 61 | 49 | 80 | 1.00 |
| Procedure service attending | Pvalue of difference in proportions | ||||||
| Directly supervised | Did not directly supervise | ||||||
| Total attempts (n) | Successful | Total attempts (n) | Successful | ||||
| n | % | n | % | ||||
| Central venous catheterization | 10 | 10 | 100 | 17 | 12 | 71 | 0.28 |
| Paracentesis, thoracentesis, or lumbar puncture | 40 | 33 | 83 | 78 | 61 | 78 | 0.12 |
| Total | 50 | 43 | 86 | 95 | 73 | 77 | 0.64 |
DISCUSSION
We found that the mean number of bedside procedures increased by 48% (95% CI, 6% to 110%) from 61 to 90 per 1000 general medicine admissions when firms were offered a bedside procedure service. This suggests that a procedure service may lead to an increase in the number of procedures performed. For example, in our hospital, where 12,500 patients are admitted annually to the general medical service, 365 additional procedures per year (95% CI, 45840) may be performed if a procedure service is available. Despite this potential increase in demand, we were unable to demonstrate a parallel increase in bedside procedure success, even when the procedure service attending was directly supervising residents (Table 2). Though our conclusions may not be applicable to other settings, this study is, to our knowledge, the first to describe the demand for bedside procedures performed on general medicine inpatients at an urban teaching hospital and the first to demonstrate that this demand increases with the availability of a procedure service.
Because 86% of the observed increase in procedure attempts was due to therapeutic indications (Table 1), most of the observed difference may be due to undertreatment in the usual care cohort, overtreatment in the bedside procedure service cohort, or a combination of both. However, our study was not designed to determine if patients were undertreated because we did not review the appropriateness of physicians' decisions to not attempt procedures. And even though the bedside procedure service attending physician prospectively confirmed the appropriateness of each procedure attempt in that cohort, we did not examine what physicians' baseline treatment thresholds were or if they were lowered by the availability of the bedside procedure service.11 In other words, we cannot claim that the observed increase in procedure attempts was indicated based on patients' clinical factors. Nevertheless, the observed increase supports the important idea that discrete physician‐level decisions, in this case, whether to perform a bedside procedure, may be affected by broader system‐wide adoptions of new technologies like our bedside procedure service.12 Other nonclinical factors not observed in our study, such as fee‐for‐service compensation and variable physician‐level diagnostic and therapeutic thresholds, may also affect the rate of bedside procedures.
Our study had several limitations. We studied only one group of patients at one hospital: admissions to physicians in different settings may have different rates of bedside procedures. Our study design was observational. However, the predetermined sequential allocation of admissions and the varied assignments of the bedside procedure service during the study period should have limited selection bias. Our identification of procedure attempts, particularly in the usual care group, relied on resident physicians' self‐reports, and we cannot exclude a reporting bias. However, we believe that the daily interactions between investigators and residents from each team on the general medicine service limited the number of procedure attempts that went unrecorded. Finally, though sufficiently powered to determine our primary outcome, our study was underpowered to confirm statistical differences between firms in proportions of successfully performed procedures. For example, approximately 400 additional procedures (or more than 5000 additional admissions) would have been needed to sufficiently power the observed 9% increase in successful attempts that we observed with direct supervision by the procedure service attending (77% versus 86%; P = .64; Table 2). Our current sample size may be adequate in future research if success rates diverge as the experience of the procedure service attending increases. Though expert in performing bedside procedures, he had limited experience teaching them, particularly with the use of a hand‐carried ultrasound device. Just as there is a learning curve to gain the experience to successfully perform procedures,13 so may there be a learning curve to successfully teach procedures.14
Future research could address these limitations by more closely observing the decision‐making processes of physicians who order bedside procedures for general medicine inpatients in various settings. Our findings suggest that although patients' clinical circumstances are likely the most important consideration, nonclinical factors may also affect physicians' decisions.12 Like other multifaceted decision‐making processes of physicians,15 the complexity of this decision is important to examine because, as our pilot data suggest, a procedure service may not lead to more successful procedure attempts or reductions in the number of major complications. Although the cumulative expertise of our service or the innovative methods of training of other institutions may improve the performance of bedside procedures,5, 13 physicians' decisions about whether to order them will remain paramount, because any improvement in procedural competence will do little to reduce the relative danger of unnecessary procedures16 or the missed benefit of procedures left undone. Physicians of inpatients17, 18 should refine the indications for and anticipated benefits from these commonly performed invasive procedures.
- ,,, et al.The nature of adverse events in hospitalized patients: Results of the Harvard Medical Practice Study II.N Engl J Med.1991;324:377–384.
- ,,, et al.Cost of medical injuries in Utah and Colorado.Inquiry.36;255–264.
- ,,,.Procedural Skills Training in Internal Medicine Residencies: A Survey of Program Directors.Ann Intern Med1989;111:932–38.
- ,,, et al.Beyond the comfort zone: residents assess their comfort performing inpatient medicine procedures.Am J Med.2006;119:71.e17–.e24.
- ,,, et al.Creation of an innovative inpatient medical procedure service and a method to evaluate house staff competency.J Gen Intern Med.2004;19:510–513.
- ,,, et al.Variation in the use of cardiac procedures after acute myocardial infarction.N Engl J Med.1995;333:573–578.
- ,,.Frequency and morbidity of inpatient procedures: report of a pilot study from two teaching hospitals.Arch Intern Med.1978;138:1809–1811.
- ,.The impact of diagnostic testing on therapeutic interventions.JAMA.1996;275:1189–1191.
- ,,, et al.Does increased access to primary care reduce hospital readmissions?N Engl J Med.1996;334:1441–1447.
- ,,, et al.Coronary artery bypass graft surgery in Ontario and New York State: which rate is right?Ann Intern Med.1997;126:13–19.
- ,.Avoiding the unintended consequences of growth in medical care. How might more be worse?JAMA.1999;281:446–453.
- ,,.Professional uncertainty and the problem of supplier‐induced demand.Soc Sci Med.1982;811–824.
- ,,,.A curricular initiative for internal medicine residents to enhance proficiency in internal jugular central venous line placement.Mayo Clin Proc.2005;80:212–218.
- ,,, et al.Confidence of Academic General Internists and Family Physicians to Teach Ambulatory Procedures.J Gen Intern Med.2000;15:353–360.
- ,,, et al.The impact of evidence on physicians' inpatient treatment decisions.J Gen Intern Med.2004;19:402–409.
- .Medical care—is more always better?N Engl J Med.2003;349:1665–1667.
- ,.Point/counterpoint: should hospital medicine become a distinct specialty?Hospitalist.2005;9(1):15–19.
- ,,,,.The core competencies in hospital medicine: a framework for curriculum development by the Society of Hospital Medicine.J Hospital Med.2006;1:S1–S95.
Inpatient bedside procedures are a major source of preventable adverse events in hospitals.1, 2 Unfortunately, many future inpatient physicians may lack the training3 and confidence4 to correct this problem. One proposed model for improving the teaching, performance, and evaluation of bedside procedures is a procedure service that is staffed by faculty who are experts at inpatient procedures.5 In a recent survey of internal medicine residents from our hospital, 86% (30 of 35) believed that expert supervision would improve central venous catheterization technique (Trick WE, personal communication).
Primary considerations in the development of a procedure service are the baseline demand for bedside procedures and whether a procedure service may affect this demand. Though variations in population‐based rates of some hospital procedures have been described,6, 7 there is little written on the demand for procedures performed at the bedsides of inpatients. Concomitant increases in demand and availability of other technologies810 suggest that improving the availability of bedside procedures may lead to an increase in their demand, regardless of whether such an increase benefits patients.11
Therefore, we sought to determine the impact of a bedside procedure service on the baseline number of paracenteses, thoracenteses, lumbar punctures (LPs), and central venous catheterizations (CVCs) performed on general medicine inpatients at our teaching hospital. In addition, we examined whether this service leads to more successful and safe procedure attempts.
METHODS
Design and Setting
In this prospective cohort study, the cohort was all patients admitted to the general medicine service at Cook County Hospital, a 500‐bed public teaching hospital in Chicago, Illinois, in January and February of 2006. The general medicine inpatient service is divided into 3 firms (A, B, and C), each with 4 separate teams of physicians and students. Admissions from the emergency department or other services in the hospital, such as intensive care units (which are closed and therefore staffed by separate teams of physicians), are distributed in sequence to on‐call teams from each firm. During the study period, the availability of a bedside procedure service varied by firm. Throughout the first 4 weeks, the service was available to only 1 of 3 firms (firm A). Then, during weeks 5 through 8, the service crossed over to the other 2 firms (firms B and C) and was unavailable to the original firm. Firm assignments for residents assigned to the inpatient service for all 8 weeks did not change. Of the 16 residents assigned to firm A during the first 4 weeks, when the procedure service was available, 3 remained on the wards during the second 4 weeks, when the procedure service was not available.
We chose to collect data on 4 bedside procedures: paracentesis, thoracentesis, LP, and CVC. Similar to those at other teaching hospitals, our residents informally acquire the skills to perform these procedures while assisting and being assisted by more experienced senior residents in a see one, do one, teach one apprenticeship model of learning.4 To improve the training and performance of these bedside procedures, the Department of Medicine piloted a bedside procedure service to teach procedural skills and assist residents during these procedures. Use of the service, though voluntary, was actively encouraged at residents' monthly orientation meetings and regular conferences.
One attending inpatient physician (J.A.) staffed the bedside procedure service, which was available during normal work hours on weekdays. Requests for procedures were made by general medicine residents through an online database and, after approval by the procedure service attending physician, were performed under his direct supervision. A hand‐carried ultrasound (MicroMaxx, Sonosite, Inc., Bothell, WA) that generates a 2‐dimensional gray‐scale image was used to both confirm the presence and location of fluid prior to paracentesis and thoracentesis and provide real‐time guidance during central venous catheterization. When the bedside procedure service was unavailable, residents performed bedside procedures in the usual fashion, typically without direct attending physician supervision. But if requested, an on‐call chief medical resident with access to a hand‐carried ultrasound device used by the intensive care unit was available for assistance at any time.
Subjects
The study subjects were all patients admitted to the general medical service during the 8‐week pilot period. Patients were excluded if they had been discharged before arrival on the medical wards or if they were under the care of the general medicine service for less than 6 hours before discharge or transfer to another service. We chose 6 hours because we reasoned that such brief admissions were not potential candidates for invasive bedside procedures.
Data Collection
Each morning an investigator contacted the senior residents who had admitted patients during the previous 24‐hour shift and confirmed that newly admitted patients were under the care of the general medicine service for more than 6 hours. To examine how the number of attempts may have been affected by procedures done in the emergency room or intensive care units before admission to the general medicine service, investigators also asked admitting residents whether a bedside procedure had been attempted in the 72 hours before admission. Every general medicine service resident was asked to fill out a brief data collection form after an attempt to perform any procedure on the general medical wards. In addition, chief residents asked each member of the general medicine service at mandatory sign‐out rounds at the end of each weekday whether any procedures had been attempted, and on weekend days investigators contacted senior residents from each general medicine service team.
We report on this quality assurance study, which was conducted during a pilot phase. This report has been reviewed and judged exempt by our institutional review board.
Primary OutcomeNumber of Procedure Attempts
For all bedside procedures attempted by residents on the general medical wards, investigators determined whether the residents were members of firms that were offered the bedside procedure service and, if so, whether the procedure service attending directly supervised the procedure attempt. Multiple procedure attempts of the same type were counted for an individual patient if (1) the procedure attempts did not occur during the same admissions and (2) neither the physicians attempting the procedure nor the primary indications for it were the same. Therefore, neither attempts performed after initially unsuccessful ones nor repeated procedures, such as large‐volume therapeutic paracentesis and thoracentesis, were counted twice. We reasoned that when these criteria were met, procedure attempts could be considered independently.
Secondary Outcomes
Investigators asked residents who attempted procedures to indicate whether (1) the indication for the procedure was solely diagnostic or was, at least in part, therapeutic; (2) the procedure was successful; and (3) there were any immediate major periprocedural complications. A procedure was considered to have been successfully performed if it fulfilled 2 criteria: it had to be completed during a single continuous attempt, even if multiple sites or procedure kits were used; and it had to fulfill the indication for it being done. For example, if the indication for thoracentesis was therapeutic, this procedure would be considered successful if it yielded a large enough volume of fluid to alleviate the patient's symptoms, but if the indication was diagnostic, then thoracentesis would be considered successful if it yielded enough fluid for laboratory processing. Residents were asked to report any periprocedural complications that they considered major; 2 illustrative examples were provided: a pneumothorax and severe bleeding.
Data Analyses
On the basis of earlier pilot data, we estimated that 8%10% of all admissions to the general medicine service underwent at least 1 procedure (paracentesis, thoracentesis, lumbar puncture, or central vein catheterization). We planned for a sample size of 1900 admissions, which would have 80% power to detect a clinically meaningful 50% relative increase in the mean number of bedside procedures with a double‐sided alpha error of 0.05. We used permutation tests to compare the mean number of procedures attempted between firms and bootstrap simulation to construct 95% confidence intervals for those means and the differences between and ratios of them. Fisher's exact test was used to compare proportions of successfully performed procedures and preadmission procedure attempts. All analyses were conducted with Stata Statistical Software, Release 9 (StataCorp, LP, College Station, TX).
RESULTS
Subjects
During this 8‐week pilot study, there were 2157 admissions to the general medicine service. Among these admissions, 216 were excluded from our study because the patients did not arrive on the medical wards or were not under the care of the general medicine service for at least 6 hours before discharge or before being transferred to another service. Of the remaining 1941 admissions, 935 were to firms with the bedside procedure service available, and 1006 were to firms without the service available (Fig. 1)
Primary OutcomeNumber of Procedure Attempts
Overall, 122 patients underwent 145 procedure attempts that met our criteria for independence. The mean number of procedure attempts in firms offered the bedside procedure service was 48% higher (90 versus 61 per 1000 admissions; RR 1.48, 95% CI 1.062.10; P = .030; Fig. 1). When procedures attempted on weekends and holidays were excluded, the relative increase in procedure attempts in firms offered the bedside procedure service was even higher (70 versus 43 per 1000 admissions; RR 1.63, 95% CI 1.092.49; P = .023; Fig. 1). When grouped according to whether procedure attempts occurred before or after crossover of the procedure service, the mean number of procedure attempts in firms was higher when the service was offered: firm A dropped from 84 to 70 per 1000 admissions (P = .58) after losing the service, whereas firms B and C increased from 57 to 94 per 1000 admissions (P = .025) on gaining the service. There were 40 procedure attempts performed on patients within 72 hours before admission, but there was no difference between firms in the proportions of these preadmission procedures (P = .43).
Secondary Outcomes
Table 1 shows how of each type of procedure contributed to the overall difference. Attempts of CVC and therapeutic paracentesis and thoracentesis accounted for 86% of the overall increase in procedure attempts for admissions to firms offered the bedside procedure service, whereas only 14% of this increase was a result of diagnostic procedures. There were no differences in the proportions of successfully performed procedures, whether grouped by firm (P = 1.0) or by direct supervision from the procedure service attending (P = .64; Table 2). There were 3 self‐reported major periprocedural complications; all were related to excessive bleeding from CVC attempts. Two occurred without direct supervision from the bedside procedure service attending, one hemomediastinum from an internal jugular CVC attempt and one groin hematoma from a femoral CVC attempt. The third, a groin hematoma from a femoral CVC attempt, occurred during direct supervision from the bedside procedure service attending.
| Bedside procedure and indication | Firms with bedside procedure service 935 admissions | Firms with usual care 1006 admissions | Absolute rate difference (proportion of overall difference)* |
|---|---|---|---|
| Total for entire study (total for weekend days and holidays) | |||
| |||
| Total | 90 (19) | 61 (18) | 29 (100%) |
| Thoracentesis | 30 (10) | 18 (7) | 12 (41%) |
| Diagnosis | 9 (5) | 6 (2) | 3 (9%) |
| Treatment | 21 (4) | 12 (5) | 9 (32%) |
| Paracentesis | 32 (5) | 25 (6) | 7 (25%) |
| Diagnosis | 9 (1) | 11 (3) | 2 (8%) |
| Treatment | 24 (4) | 14 (3) | 10 (33%) |
| Central venous catheterization | 17 (3) | 11 (4) | 6 (21%) |
| Lumbar puncture | 11 (1) | 7 (1) | 4 (13%) |
| Diagnosis | 10 (1) | 6 (1) | 4 (13%) |
| Treatment | 1 (0) | 1 (0) | 0 (0%) |
| Admission to firm with | P value of difference in proportions | ||||||
|---|---|---|---|---|---|---|---|
| Procedure service available | Usual care | ||||||
| Total attempts (n) | Successful | Total attempts (n) | Successful | ||||
| n | % | n | % | ||||
| |||||||
| Central venous catheterization | 16 | 13 | 81 | 11 | 9 | 82 | 1.00 |
| Paracentesis, thoracentesis, or lumbar puncture | 68 | 54 | 79 | 50 | 40 | 80 | 1.00 |
| Total | 84 | 67 | 80 | 61 | 49 | 80 | 1.00 |
| Procedure service attending | Pvalue of difference in proportions | ||||||
| Directly supervised | Did not directly supervise | ||||||
| Total attempts (n) | Successful | Total attempts (n) | Successful | ||||
| n | % | n | % | ||||
| Central venous catheterization | 10 | 10 | 100 | 17 | 12 | 71 | 0.28 |
| Paracentesis, thoracentesis, or lumbar puncture | 40 | 33 | 83 | 78 | 61 | 78 | 0.12 |
| Total | 50 | 43 | 86 | 95 | 73 | 77 | 0.64 |
DISCUSSION
We found that the mean number of bedside procedures increased by 48% (95% CI, 6% to 110%) from 61 to 90 per 1000 general medicine admissions when firms were offered a bedside procedure service. This suggests that a procedure service may lead to an increase in the number of procedures performed. For example, in our hospital, where 12,500 patients are admitted annually to the general medical service, 365 additional procedures per year (95% CI, 45840) may be performed if a procedure service is available. Despite this potential increase in demand, we were unable to demonstrate a parallel increase in bedside procedure success, even when the procedure service attending was directly supervising residents (Table 2). Though our conclusions may not be applicable to other settings, this study is, to our knowledge, the first to describe the demand for bedside procedures performed on general medicine inpatients at an urban teaching hospital and the first to demonstrate that this demand increases with the availability of a procedure service.
Because 86% of the observed increase in procedure attempts was due to therapeutic indications (Table 1), most of the observed difference may be due to undertreatment in the usual care cohort, overtreatment in the bedside procedure service cohort, or a combination of both. However, our study was not designed to determine if patients were undertreated because we did not review the appropriateness of physicians' decisions to not attempt procedures. And even though the bedside procedure service attending physician prospectively confirmed the appropriateness of each procedure attempt in that cohort, we did not examine what physicians' baseline treatment thresholds were or if they were lowered by the availability of the bedside procedure service.11 In other words, we cannot claim that the observed increase in procedure attempts was indicated based on patients' clinical factors. Nevertheless, the observed increase supports the important idea that discrete physician‐level decisions, in this case, whether to perform a bedside procedure, may be affected by broader system‐wide adoptions of new technologies like our bedside procedure service.12 Other nonclinical factors not observed in our study, such as fee‐for‐service compensation and variable physician‐level diagnostic and therapeutic thresholds, may also affect the rate of bedside procedures.
Our study had several limitations. We studied only one group of patients at one hospital: admissions to physicians in different settings may have different rates of bedside procedures. Our study design was observational. However, the predetermined sequential allocation of admissions and the varied assignments of the bedside procedure service during the study period should have limited selection bias. Our identification of procedure attempts, particularly in the usual care group, relied on resident physicians' self‐reports, and we cannot exclude a reporting bias. However, we believe that the daily interactions between investigators and residents from each team on the general medicine service limited the number of procedure attempts that went unrecorded. Finally, though sufficiently powered to determine our primary outcome, our study was underpowered to confirm statistical differences between firms in proportions of successfully performed procedures. For example, approximately 400 additional procedures (or more than 5000 additional admissions) would have been needed to sufficiently power the observed 9% increase in successful attempts that we observed with direct supervision by the procedure service attending (77% versus 86%; P = .64; Table 2). Our current sample size may be adequate in future research if success rates diverge as the experience of the procedure service attending increases. Though expert in performing bedside procedures, he had limited experience teaching them, particularly with the use of a hand‐carried ultrasound device. Just as there is a learning curve to gain the experience to successfully perform procedures,13 so may there be a learning curve to successfully teach procedures.14
Future research could address these limitations by more closely observing the decision‐making processes of physicians who order bedside procedures for general medicine inpatients in various settings. Our findings suggest that although patients' clinical circumstances are likely the most important consideration, nonclinical factors may also affect physicians' decisions.12 Like other multifaceted decision‐making processes of physicians,15 the complexity of this decision is important to examine because, as our pilot data suggest, a procedure service may not lead to more successful procedure attempts or reductions in the number of major complications. Although the cumulative expertise of our service or the innovative methods of training of other institutions may improve the performance of bedside procedures,5, 13 physicians' decisions about whether to order them will remain paramount, because any improvement in procedural competence will do little to reduce the relative danger of unnecessary procedures16 or the missed benefit of procedures left undone. Physicians of inpatients17, 18 should refine the indications for and anticipated benefits from these commonly performed invasive procedures.
- ,,, et al.The nature of adverse events in hospitalized patients: Results of the Harvard Medical Practice Study II.N Engl J Med.1991;324:377–384.
- ,,, et al.Cost of medical injuries in Utah and Colorado.Inquiry.36;255–264.
- ,,,.Procedural Skills Training in Internal Medicine Residencies: A Survey of Program Directors.Ann Intern Med1989;111:932–38.
- ,,, et al.Beyond the comfort zone: residents assess their comfort performing inpatient medicine procedures.Am J Med.2006;119:71.e17–.e24.
- ,,, et al.Creation of an innovative inpatient medical procedure service and a method to evaluate house staff competency.J Gen Intern Med.2004;19:510–513.
- ,,, et al.Variation in the use of cardiac procedures after acute myocardial infarction.N Engl J Med.1995;333:573–578.
- ,,.Frequency and morbidity of inpatient procedures: report of a pilot study from two teaching hospitals.Arch Intern Med.1978;138:1809–1811.
- ,.The impact of diagnostic testing on therapeutic interventions.JAMA.1996;275:1189–1191.
- ,,, et al.Does increased access to primary care reduce hospital readmissions?N Engl J Med.1996;334:1441–1447.
- ,,, et al.Coronary artery bypass graft surgery in Ontario and New York State: which rate is right?Ann Intern Med.1997;126:13–19.
- ,.Avoiding the unintended consequences of growth in medical care. How might more be worse?JAMA.1999;281:446–453.
- ,,.Professional uncertainty and the problem of supplier‐induced demand.Soc Sci Med.1982;811–824.
- ,,,.A curricular initiative for internal medicine residents to enhance proficiency in internal jugular central venous line placement.Mayo Clin Proc.2005;80:212–218.
- ,,, et al.Confidence of Academic General Internists and Family Physicians to Teach Ambulatory Procedures.J Gen Intern Med.2000;15:353–360.
- ,,, et al.The impact of evidence on physicians' inpatient treatment decisions.J Gen Intern Med.2004;19:402–409.
- .Medical care—is more always better?N Engl J Med.2003;349:1665–1667.
- ,.Point/counterpoint: should hospital medicine become a distinct specialty?Hospitalist.2005;9(1):15–19.
- ,,,,.The core competencies in hospital medicine: a framework for curriculum development by the Society of Hospital Medicine.J Hospital Med.2006;1:S1–S95.
Copyright © 2007 Society of Hospital Medicine

NICU‐Based Influenza Vaccine
Influenza is a common infectious agent in the pediatric population, infecting 15% to 42% of preschool children, with a fatality rate of 3.8 per 100,000.13 Those with underlying respiratory and cardiac disease are more likely to require hospitalization and more susceptible to morbidity from the disease.47 Trivalent inactivated influenza vaccine is a safe, cost‐effective method of preventing influenza in children, with a seroconversion rate of up to 89%.810 Both the American Academy of Pediatrics and the Advisory Committee on Immunization Practices recommend that the influenza vaccine be administered to household contacts and out‐of‐home caretakers of infants up to 6 months of age.11 Also included in this high‐risk category are children with chronic respiratory and cardiac disease.8
The immunization rate in the indicated pediatric population ranges from 9% to 22%.12 Because most adults who meet eligible criteria are not vaccinated, it has been proposed that the NICU begin to administer the influenza vaccine to parents of high‐risk infants, eliminating commonly encountered obstacles to vaccine administration and preventing infection in these close contacts of infants, who likely serve as infectious agents of disease in the infants.13, 14
Yet the cost of instituting such a program remains a concern, especially given the recent shortages of the inactivated influenza vaccine, which have increased cost.15 The economic implications of instituting an inactivated influenza vaccination program for parents of patients in the NICU have not been fully evaluated. Given that upwards of 40,000 premature infants are admitted to intensive care units each year, an examination of cost savings is critical prior to implementing such a program.16
METHODS
Data and Assumptions
A 3‐ and 4‐tiered computer model (with the tiers reflecting the variables presence of lung disease, having siblings, and sibling immunization status and the fourth tier reflecting parental immunization in the NICU as a function of the immunization program) assessing influenza vaccination status of parents of a cohort of 2632 patients admitted to the New York Regional Perinatal Center NICU during the influenza season of 2003‐2004 was constructed using the viewpoint of a large multinetwork medical center predominantly serving a lower socioeconomic status population. The likelihood of influenza infection of an infant, the need for infant hospitalization, subsequent length of stay, and the need for the patient to have outpatient physician visits were based on the following clinical variables: lung disease in the infant (defined as a 28‐day‐old patient whose birth weight was less than 1500 g being oxygen dependent); having school‐age siblings, sibling vaccination status; parental vaccination status; and parental compliance. Variables of the model were based on published results when possible. For the purposes of this model, we assumed a 10% reduction in influenza infectivity for parents of children who were immunized in the absence of other confounders based on the risk of needing medical attention of children less than 6 months old for documented influenza with parental vaccination in the 9 states that make up the Emerging Infections Program Network of the Centers for Disease Control.1719 Infected patients younger than 6 months of age were also programmed to have a 10% chance of an outpatient hospitalization visit. No deaths were introduced in the cohort. An outline of the different groups into which patients were classified (before and after the influenza vaccination campaign) is outlined in Figure 1.

Direct Costs
Medical Costs
The average wholesale cost of a dose of influenza vaccine including administration was $15.20 Each parent received 1 dose of influenza vaccine administered during the influenza season (the 5 months from October thru February). In our model, the vaccine is administered by nurses, physicians, or physician‐extenders in a neonatal intensive care unit and thus does not require increased personnel to support the program. Hence, no increased costs were included for administration of the vaccine.
Siblings were not offered immunization in the NICU program. Most NICUs do not allow children younger than 13 years to visit during influenza and respiratory syncytial virus season to prevent infection of newborns. Immunization of younger siblings requires prior knowledge of their vaccination status, as those previously immunized require 1 dose of vaccine, whereas those less than 9 years old not immunized require 2 doses scheduled 1 month apart. As this was considered logistically difficult for a high‐acuity NICU, sibling immunization was deferred to that sibling's primary medical doctor, a policy consistent with that of the American Academy of Pediatrics Medical Home Initiative.
Infant Hospitalization for Influenza
Cost estimates were obtained from published data on the length of stay of infants with respiratory disease.21 In this series the average length of stay of former NICU patients with low socioeconomic status hospitalized for influenza was 4.5 4 days. Average hospital costs were estimated as $1508/day.22, 23 No intensive care unit days were factored into the current cost model. Hospitalization costs for each group were estimated by (number of infants in each group from the New York Regional Perinatal Center 2004 Database hospitalization rate of each group number of days hospitalized $1508/day). This estimation technique was previously validated and used.21
Intensive care unit cost was estimated as 2.5 times the cost of nonintensive care ($3770/day). Intensive care hospitalization for influenza is difficult to measure, as it correlates with bacterial superinfection, which has an incidence of 0.5/10,000 patients with documented influenza.5 However, in another study, ICU hospitalization of infected patients was 0.5%, which would translate to 13 patients in the studied group.18 The length of ICU stay was 1 day, and by univariate analysis, bacterial coinfection was again the highest predictor of ICU admission. These patients were admitted because positive results of outpatient blood cultures, signs of shock, and influenza were noted until several days into the hospitalization and may have been nosocomial in origin.18 Thus, costs are reported in the tables without intensive care unit stays for the 13 patients who may have required them in the model. But to acknowledge the role ICU admission plays in deferring costs, 2 cost‐estimate graphs were generated, 1 including ICU admission.
Outpatient Costs
For patients in each cohort who were unprotected from influenza because of parental or sibling immunization, a 10% increase in the number of outpatient medical visits was considered. Outpatient costs were tallied on the basis of average general pediatrician's salary of $68/hour.23 Duration of outpatient visits was estimated as 20 minutes with no accounting for extra nursing time. Hence, tallies were made by (number of unprotected infants 10% 20 minutes/visit $68/hour 1 hour/60 minutes). As 3% of actual cases of influenza in the group of those less than 6 months old can be misdiagnosed as clinical bacterial pneumonia, prescription costs were estimated as $3.20 for a 7‐day course of generic amoxicillin, which was the only prescribed antibiotic considered.
Indirect Costs
For each outpatient office visit, we used the cost‐estimation scheme outlined by Yount et al.20. We assumed that 1 parent accompanied the infant and 3 hours of lost work should be accounted for. Using the U.S. Bureau of Labor and Statistics 2002 average wage of $17/hour, lost wages for each extra outpatient visits were tabulated by (number of extra MD visits per group 3 hours $17/hour).24 No travel or transportation costs were considered.
Hospitalization
For each hospitalization, we assumed 1 parent stayed with an infant at bedside during the infant's inpatient stay. We calculated the average length of stay for patients with lung disease as 8 days and for those without lung disease as 4.5 days. Calculations were obtained using the following formula: (number of infants in each group from the New York Regional Perinatal Center 2004 Database hospitalization rate of each group number of days hospitalized $17/hour 8 work hours/day 5/7 workdays/week).
Sensitivity Analysis
We evaluated the sensitivity of the model to variations in the assumptions made. We varied the sibling immunization rate from 12% to 17% and the reduction in hospitalization for parents who received influenza vaccine from 10% to 20%. A summary of variables used in the analysis is included in Table 1.
| Compliance of parents offered influenza vaccine | 89% (17) |
| Seroconversion rate of vaccine recipients | 89% (17) |
| Percentage of siblings vaccinated | 12% (12) |
| Excess PMD visits of infected patients | 10% (7) |
| Hospitalization rate of lung disease patients without siblings | 10% (7) |
| Hospitalization rate of lung disease patients with siblings | 15% (7) |
| Length of hospitalization of Lung Disease patients | 8 days (7) |
| Hospitalization rate of nonlung disease patients without siblings | 7/1000 (19) |
| Hospitalization rate of nonlung disease patients with siblings | 19/1000 (19) |
| Length of hospitalization of nonlung disease patients | 4.5 days (19) |
RESULTS
Influenza Costs Prior to Implementation of NICU‐Based Parental Vaccination
Direct and indirect costs of influenza hospitalization of the NICU graduates are summarized in Table 2. The total per‐patient cost of influenza vaccination obtained in the NICU for the 2632 patients in the source data 1 one season was $181.20. NICU patients with lung disease and siblings who were not protected from or immunized for influenza demonstrated the greatest per capita inpatient cost, $1925/patient. Vaccination of patients without lung disease who had no siblings cost $51, the same amount that it cost to vaccinate patients without lung disease who had vaccinated siblings.
| Subgroup type | Cost per patient ($) | Direct costs ($) | Indirect dosts ($) |
|---|---|---|---|
| |||
| Patients with lung disease whose siblings were protected | 1284 | 10,857.60 | 699.42 |
| Patients with lung disease whose siblings were unprotected | 1925 | 142,958.40 | 9,170.29 |
| Patients with lung disease without siblings | 1284 | 63,939.20 | 4,118.85 |
| Patients without lung disease whose siblings were protected | 51 | 7,885.33 | 507.96 |
| Patients without lung disease whose siblings were unprotected | 137 | 179,347.19 | 11,553.25 |
| Patients without lung disease without siblings | 51 | 44,366.86 | 2,858.04 |
Outpatient costs of influenza hospitalization based on source data revealed summarized costs for 1 season of $6.80/patient. This reflected 245 excess primary care visits at a total cost of $5569.20. The cost of excess prescriptions of the antibiotic amoxicillin because of misdiagnoses. Indirect costs secondary to parent lost work hours while attending to their infants in the hospital totaled $12,530.70. Thus, the total cost of influenza in the source population for 1 season including inpatient, outpatient, direct, and indirect costs was $188/patient.
Influenza Costs after Implementation of an NICU‐Based Parental Vaccination Program
Direct and indirect costs of influenza hospitalization for neonates with lung disease are summarized in Table 3. The introduction of parental vaccination decreased the per‐patient cost in the cohort of patients with lung disease and unprotected siblings to $1732 from $1925. This group showed the largest cost savings compared with the costs for this group prior to introduction of the campaign.
| Subgroup type | Cost/patient ($) | Direct costs ($) | Indirect costs ($) |
|---|---|---|---|
| |||
| Patients with lung disease with protected siblings/unprotected parents | 1283 | 2412.80 | 154.49 |
| Patients with lung disease with protected siblings/protected parents | 1155 | 7600.32 | 486.66 |
| Patients with lung disease with unprotected siblings/protected parents | 1732 (Pre‐1925) | 102,604.32 | 6569.94 |
| Patients with lung disease with unprotected siblings/unprotected parents | 1925 | 28,953.60 | 1853.95 |
| Patients with lung disease without siblings/with protected parents | 1155 | 45,601.92 | 2919.97 |
| Patients with lung disease without siblings/with unprotected parents | 1283 | 13,270.40 | 849.73 |
Direct and indirect costs of influenza hospitalization for infants without lung disease are summarized in Table 4. The introduction of parental vaccination to disrupt the cycle of infectious transmission to infant decreased per‐patient costs in patients whose parents and siblings received vaccinations to $45. This reduction of $6/patient was the greatest savings among all the groups in the cohort without lung disease.
| Subgroup type | Cost/Patient ($) | Direct Costs ($) | Indirect Costs ($) |
|---|---|---|---|
| |||
| Patients without lung disease with protected siblings/unprotected parents | 51 | 1662.57 | 106.45 |
| Patients without lung disease with protected siblings/protected parents | 45 (pre‐51) | 5600.48 | 256.30 |
| Patients without lung disease with unprotected siblings/unprotected parents | 137 | 37,261.92 | 2385.51 |
| Patients without lung disease with unprotected siblings/protected parents | 123 | 127,876.74 | 8168.97 |
| Patients without lung disease without siblings/with protected parents | 45 | 31,215.60 | 1998.79 |
| Patients without lung disease without siblings/with unprotected parents | 51 | 9215.38 | 586.60 |
Outpatient costs were reduced after the introduction of the campaign to $1.40/patient, reflecting the decrease in the number of outpatient visits from 245 to 51. Thus, the total cost of influenza in the source population after the introduction of an NICU‐based parental vaccination campaign was $200/patient. The $193/patient savings in the lung disease cohort with unprotected siblings ($1925 vs. $1732) was not sufficient to cover the increased cost of the vaccine. For this population of 2632 NICU patients, administration of NICU‐based parental influenza cost $12 extra/patient.
Financial Modeling Based on Source Data
Using the financial model, cost per patient was determined using the same estimates of incidence of the variables (ie, lung disease, siblings); only the number of enrollees in the program was varied. The relationship of cost per patient with number of NICU patients is shown in Figure 2. Cost per patient was zero at 4000 patients. Beyond that point, cost savings occurred, increasing with number of NICU admissions.
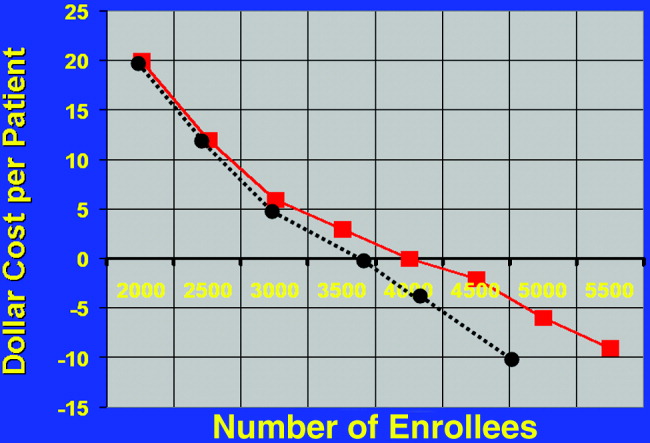
Estimating a 1‐day ICU admission rate of 0.5% at $3770/day reduces the required patient population for costs/patient to zero. This occurs at 3700 patients. Initially there is no added benefit with ICU admission, as the overall patient population is not large enough to support a significant ICU burden. As the population increases to 3000 patients, cost savings begin.
The relationship of variable immunization rates in siblings of the 2632 NICU patients in the source data is presented in Figure 3. Cost savings were not achieved until 37% of siblings had been immunized. A steep reduction in cost was seen as the immunization rate of siblings increased in the cohort. Marginal cost effectiveness was also increased in sibling immunization, meaning greater cost savings is achieved by immunizing a sibling of a high‐risk infant than by immunizing the parents, reflecting that siblings are more likely than parents to be vectors of disease in multichild households.
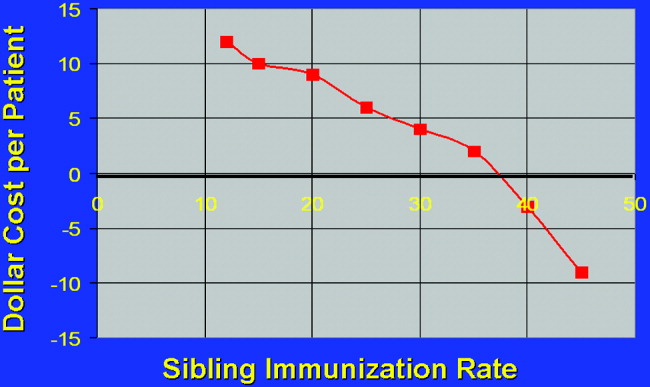
DISCUSSION
This is the first computer‐based model of the cost effectiveness of offering inactivated influenza vaccine to parents of patients in the NICU for the purpose of preventing illness in their offspring. Based on the source data, the study has demonstrated that offering immunization to parents in the NICU is not cost effective until the NICU population covered is at least 4000 patients. Cost effectiveness can also be reached in smaller populations by increasing the level of sibling immunization. These factors should be considered by public health specialists when mandating administration of influenza vaccine to parents in the NICU setting.
Cost‐effectiveness studies are limited by the variables chosen, by hospitalization rates, and by estimates made. Although we attempted to obtain hospitalization rates based on previously validated, published data, any variation in these rates will alter the cost‐savings model we constructed. For variables affecting the infectivity of and hospitalization for influenza, we chose lung disease, siblings with immunization rate, and parental immunization rate. Other variables, notably day care attendance, were not believed to highly influence infections due to respiratory pathogens.18
Another potential source of error in construction of the model is calculation of indirect costs. Although estimates of lost wages from work hours spent while a patient is hospitalized were calculated as an indirect cost, Leader et al. points out that there are also indirect costs after hospitalization secondary to increased outpatient physician surveillance.25 Furthermore, our model based lost wages on parents of patients earning an average salary of $17/hour. However, our source data represented the Regional Perinatal Center, a consortium of NICUs in New York City serving a primarily uninsured, indigent population. Hence, these estimates of lost wages may be overestimated.
Most cost‐utility analysis studies are performed to help compare public health policy policies across medical disciplines. Most data on adults and on children calculate the cost of quality‐of‐life‐adjusted year. In our study no such calculations were made because influenza was not thought to affect life long term. In other words, quality of life was not thought to be more likely to be affected by the variables NICU admission and birth weight than by the variable influenza infection, and these factors were considered in estimating hospitalization rates. Furthermore, because mortality from influenza is roughly 1 of every 100,000 for children less than 6 months old, no patients in the source data would have died, making quality‐of‐life‐adjusted year difficult to factor.26
Given a limited amount of medical resources, it is imperative to critically evaluate the economic implications of any widespread public health strategy. This cost analysis has demonstrated that the benefits of sponsoring NICU‐based immunization programs for parents will remain low unless the issue of sibling immunization is addressed or the number of patients in the cohort increases to a scale larger than any single traditional NICU may provide.
- ,.Interpandemic influenza in the Houston area, 1974‐1976.N Engl J Med.1978;298:587–592.
- ,,, et al.Burden of interpandemic influenza in children younger than 5 years: a 25‐year prospective study.J Infect Dis.2002;185:147–152.
- .Serious morbidity and mortality associated with influenza epidemics.Epidemiol Rev.1982;4:25–44.
- ,,, et al.Impact of respiratory virus infections on persons with chronic underlying conditions.JAMA.2000;283:499–505.
- ,,, et al.Influenza and the rates of hospitalization for respiratory disease among infants and young children.N Engl J Med.2000;342:232–239.
- ,,.Impact of influenza on morbidity in children with cystic fibrosis.J Paediatr Child Health.1991;27:308–311.
- ,,, et al.The burden of influenza illness in children with asthma and other chronic medical conditions.J Pediatr.2000;137:856–864.
- ,;Committee on Infectious Diseases.Technical report. Reduction of the influenza burden in children.Pediatrics.2002;110:e80. Available at: http://www.pediatrics.org/cgi/content/full/110/6/e80.
- ,,, et al.Clinical reactions and serologic responses after vaccination with while‐virus or split‐virus influenza vaccines in children aged 6 to 36 months.Pediatrics.1982;69:404–408.
- ,.Economic impact of influenza vaccination in preschool children.Pediatrics.2000;106:973–976.
- Committee on Infectious Disease Policy Statement.Reduction of the influenza burden in children.Pediatrics.2002;110:1246–1252.
- ,.Change in recommendation affects influenza vaccinations among children 6 to 59 months of age.Pediatrics.2004;114;948–952.
- ,,.Factors associated with influenza vaccination coverage among the elderly: role of health care personnel.Public Health.1996;110:163–168.
- ,.Optimizing long‐term care by administration of influenza vaccine to parents of NICU patients.J Perinatol.2004;24:273–274.
- ,.Reduction of the influenza burden in children: policy statement of the Committee on Infectious Diseases: American Academy of Pediatrics.Pediatrics.2002;110:1246–1252.
- National Center for Health Statistics. Incidence of prematurity data. Available at: http://www.marchofdimes.com/peristats. Accessed April 16,2006.
- Centers for Disease Control and Prevention (CDC).Estimated influenza vaccination coverage among adults and children—United States, September 1, 2004‐January 31, 2005.MMWR Morb Mortal Wkly Rep.2005;54:304–307.
- ,,, et al.Multistate surveillance for laboratory‐confirmed, influenza‐associated hospitalizations in children: 2003‐2004.Pediatr Infect Dis J.2006;25:395–400.
- .., et al.Population‐based surveillance for hospitalizations associated with respiratory syncytial virus, influenza virus, and parainfluenza viruses among young children.Pediatrics.2004;113:1758–1764.
- New York University Outpatient Pharmacy, personal communication.
- ,.Economic analysis of palivizumab in infants with congenital heart disease.Pediatrics.2004;114:1606–1611.
- Equitable Life Assurance Society of the United States.Hospital Daily Service Charges.New York, NY:Equitable Life Assurance Company,1982.
- ,,Hospital costs of pediatric intensive care.Crit Care Med.1999;27:2079–2085.
- U.S. Bureau of Labor Statistics. Employment and earnings2004. Available at: www.bls.gov/bls/wages.html.
- ,,,,,.Time and out‐of‐pocket costs associated with respiratory syncytial virus hospitalization of infants.Value Health.2003;6:100–106.
- ,,, et al.Influenza‐associated deaths among children in the United States.N Engl J Med.2005;353:2559–2569.
Influenza is a common infectious agent in the pediatric population, infecting 15% to 42% of preschool children, with a fatality rate of 3.8 per 100,000.13 Those with underlying respiratory and cardiac disease are more likely to require hospitalization and more susceptible to morbidity from the disease.47 Trivalent inactivated influenza vaccine is a safe, cost‐effective method of preventing influenza in children, with a seroconversion rate of up to 89%.810 Both the American Academy of Pediatrics and the Advisory Committee on Immunization Practices recommend that the influenza vaccine be administered to household contacts and out‐of‐home caretakers of infants up to 6 months of age.11 Also included in this high‐risk category are children with chronic respiratory and cardiac disease.8
The immunization rate in the indicated pediatric population ranges from 9% to 22%.12 Because most adults who meet eligible criteria are not vaccinated, it has been proposed that the NICU begin to administer the influenza vaccine to parents of high‐risk infants, eliminating commonly encountered obstacles to vaccine administration and preventing infection in these close contacts of infants, who likely serve as infectious agents of disease in the infants.13, 14
Yet the cost of instituting such a program remains a concern, especially given the recent shortages of the inactivated influenza vaccine, which have increased cost.15 The economic implications of instituting an inactivated influenza vaccination program for parents of patients in the NICU have not been fully evaluated. Given that upwards of 40,000 premature infants are admitted to intensive care units each year, an examination of cost savings is critical prior to implementing such a program.16
METHODS
Data and Assumptions
A 3‐ and 4‐tiered computer model (with the tiers reflecting the variables presence of lung disease, having siblings, and sibling immunization status and the fourth tier reflecting parental immunization in the NICU as a function of the immunization program) assessing influenza vaccination status of parents of a cohort of 2632 patients admitted to the New York Regional Perinatal Center NICU during the influenza season of 2003‐2004 was constructed using the viewpoint of a large multinetwork medical center predominantly serving a lower socioeconomic status population. The likelihood of influenza infection of an infant, the need for infant hospitalization, subsequent length of stay, and the need for the patient to have outpatient physician visits were based on the following clinical variables: lung disease in the infant (defined as a 28‐day‐old patient whose birth weight was less than 1500 g being oxygen dependent); having school‐age siblings, sibling vaccination status; parental vaccination status; and parental compliance. Variables of the model were based on published results when possible. For the purposes of this model, we assumed a 10% reduction in influenza infectivity for parents of children who were immunized in the absence of other confounders based on the risk of needing medical attention of children less than 6 months old for documented influenza with parental vaccination in the 9 states that make up the Emerging Infections Program Network of the Centers for Disease Control.1719 Infected patients younger than 6 months of age were also programmed to have a 10% chance of an outpatient hospitalization visit. No deaths were introduced in the cohort. An outline of the different groups into which patients were classified (before and after the influenza vaccination campaign) is outlined in Figure 1.
Direct Costs
Medical Costs
The average wholesale cost of a dose of influenza vaccine including administration was $15.20 Each parent received 1 dose of influenza vaccine administered during the influenza season (the 5 months from October thru February). In our model, the vaccine is administered by nurses, physicians, or physician‐extenders in a neonatal intensive care unit and thus does not require increased personnel to support the program. Hence, no increased costs were included for administration of the vaccine.
Siblings were not offered immunization in the NICU program. Most NICUs do not allow children younger than 13 years to visit during influenza and respiratory syncytial virus season to prevent infection of newborns. Immunization of younger siblings requires prior knowledge of their vaccination status, as those previously immunized require 1 dose of vaccine, whereas those less than 9 years old not immunized require 2 doses scheduled 1 month apart. As this was considered logistically difficult for a high‐acuity NICU, sibling immunization was deferred to that sibling's primary medical doctor, a policy consistent with that of the American Academy of Pediatrics Medical Home Initiative.
Infant Hospitalization for Influenza
Cost estimates were obtained from published data on the length of stay of infants with respiratory disease.21 In this series the average length of stay of former NICU patients with low socioeconomic status hospitalized for influenza was 4.5 4 days. Average hospital costs were estimated as $1508/day.22, 23 No intensive care unit days were factored into the current cost model. Hospitalization costs for each group were estimated by (number of infants in each group from the New York Regional Perinatal Center 2004 Database hospitalization rate of each group number of days hospitalized $1508/day). This estimation technique was previously validated and used.21
Intensive care unit cost was estimated as 2.5 times the cost of nonintensive care ($3770/day). Intensive care hospitalization for influenza is difficult to measure, as it correlates with bacterial superinfection, which has an incidence of 0.5/10,000 patients with documented influenza.5 However, in another study, ICU hospitalization of infected patients was 0.5%, which would translate to 13 patients in the studied group.18 The length of ICU stay was 1 day, and by univariate analysis, bacterial coinfection was again the highest predictor of ICU admission. These patients were admitted because positive results of outpatient blood cultures, signs of shock, and influenza were noted until several days into the hospitalization and may have been nosocomial in origin.18 Thus, costs are reported in the tables without intensive care unit stays for the 13 patients who may have required them in the model. But to acknowledge the role ICU admission plays in deferring costs, 2 cost‐estimate graphs were generated, 1 including ICU admission.
Outpatient Costs
For patients in each cohort who were unprotected from influenza because of parental or sibling immunization, a 10% increase in the number of outpatient medical visits was considered. Outpatient costs were tallied on the basis of average general pediatrician's salary of $68/hour.23 Duration of outpatient visits was estimated as 20 minutes with no accounting for extra nursing time. Hence, tallies were made by (number of unprotected infants 10% 20 minutes/visit $68/hour 1 hour/60 minutes). As 3% of actual cases of influenza in the group of those less than 6 months old can be misdiagnosed as clinical bacterial pneumonia, prescription costs were estimated as $3.20 for a 7‐day course of generic amoxicillin, which was the only prescribed antibiotic considered.
Indirect Costs
For each outpatient office visit, we used the cost‐estimation scheme outlined by Yount et al.20. We assumed that 1 parent accompanied the infant and 3 hours of lost work should be accounted for. Using the U.S. Bureau of Labor and Statistics 2002 average wage of $17/hour, lost wages for each extra outpatient visits were tabulated by (number of extra MD visits per group 3 hours $17/hour).24 No travel or transportation costs were considered.
Hospitalization
For each hospitalization, we assumed 1 parent stayed with an infant at bedside during the infant's inpatient stay. We calculated the average length of stay for patients with lung disease as 8 days and for those without lung disease as 4.5 days. Calculations were obtained using the following formula: (number of infants in each group from the New York Regional Perinatal Center 2004 Database hospitalization rate of each group number of days hospitalized $17/hour 8 work hours/day 5/7 workdays/week).
Sensitivity Analysis
We evaluated the sensitivity of the model to variations in the assumptions made. We varied the sibling immunization rate from 12% to 17% and the reduction in hospitalization for parents who received influenza vaccine from 10% to 20%. A summary of variables used in the analysis is included in Table 1.
| Compliance of parents offered influenza vaccine | 89% (17) |
| Seroconversion rate of vaccine recipients | 89% (17) |
| Percentage of siblings vaccinated | 12% (12) |
| Excess PMD visits of infected patients | 10% (7) |
| Hospitalization rate of lung disease patients without siblings | 10% (7) |
| Hospitalization rate of lung disease patients with siblings | 15% (7) |
| Length of hospitalization of Lung Disease patients | 8 days (7) |
| Hospitalization rate of nonlung disease patients without siblings | 7/1000 (19) |
| Hospitalization rate of nonlung disease patients with siblings | 19/1000 (19) |
| Length of hospitalization of nonlung disease patients | 4.5 days (19) |
RESULTS
Influenza Costs Prior to Implementation of NICU‐Based Parental Vaccination
Direct and indirect costs of influenza hospitalization of the NICU graduates are summarized in Table 2. The total per‐patient cost of influenza vaccination obtained in the NICU for the 2632 patients in the source data 1 one season was $181.20. NICU patients with lung disease and siblings who were not protected from or immunized for influenza demonstrated the greatest per capita inpatient cost, $1925/patient. Vaccination of patients without lung disease who had no siblings cost $51, the same amount that it cost to vaccinate patients without lung disease who had vaccinated siblings.
| Subgroup type | Cost per patient ($) | Direct costs ($) | Indirect dosts ($) |
|---|---|---|---|
| |||
| Patients with lung disease whose siblings were protected | 1284 | 10,857.60 | 699.42 |
| Patients with lung disease whose siblings were unprotected | 1925 | 142,958.40 | 9,170.29 |
| Patients with lung disease without siblings | 1284 | 63,939.20 | 4,118.85 |
| Patients without lung disease whose siblings were protected | 51 | 7,885.33 | 507.96 |
| Patients without lung disease whose siblings were unprotected | 137 | 179,347.19 | 11,553.25 |
| Patients without lung disease without siblings | 51 | 44,366.86 | 2,858.04 |
Outpatient costs of influenza hospitalization based on source data revealed summarized costs for 1 season of $6.80/patient. This reflected 245 excess primary care visits at a total cost of $5569.20. The cost of excess prescriptions of the antibiotic amoxicillin because of misdiagnoses. Indirect costs secondary to parent lost work hours while attending to their infants in the hospital totaled $12,530.70. Thus, the total cost of influenza in the source population for 1 season including inpatient, outpatient, direct, and indirect costs was $188/patient.
Influenza Costs after Implementation of an NICU‐Based Parental Vaccination Program
Direct and indirect costs of influenza hospitalization for neonates with lung disease are summarized in Table 3. The introduction of parental vaccination decreased the per‐patient cost in the cohort of patients with lung disease and unprotected siblings to $1732 from $1925. This group showed the largest cost savings compared with the costs for this group prior to introduction of the campaign.
| Subgroup type | Cost/patient ($) | Direct costs ($) | Indirect costs ($) |
|---|---|---|---|
| |||
| Patients with lung disease with protected siblings/unprotected parents | 1283 | 2412.80 | 154.49 |
| Patients with lung disease with protected siblings/protected parents | 1155 | 7600.32 | 486.66 |
| Patients with lung disease with unprotected siblings/protected parents | 1732 (Pre‐1925) | 102,604.32 | 6569.94 |
| Patients with lung disease with unprotected siblings/unprotected parents | 1925 | 28,953.60 | 1853.95 |
| Patients with lung disease without siblings/with protected parents | 1155 | 45,601.92 | 2919.97 |
| Patients with lung disease without siblings/with unprotected parents | 1283 | 13,270.40 | 849.73 |
Direct and indirect costs of influenza hospitalization for infants without lung disease are summarized in Table 4. The introduction of parental vaccination to disrupt the cycle of infectious transmission to infant decreased per‐patient costs in patients whose parents and siblings received vaccinations to $45. This reduction of $6/patient was the greatest savings among all the groups in the cohort without lung disease.
| Subgroup type | Cost/Patient ($) | Direct Costs ($) | Indirect Costs ($) |
|---|---|---|---|
| |||
| Patients without lung disease with protected siblings/unprotected parents | 51 | 1662.57 | 106.45 |
| Patients without lung disease with protected siblings/protected parents | 45 (pre‐51) | 5600.48 | 256.30 |
| Patients without lung disease with unprotected siblings/unprotected parents | 137 | 37,261.92 | 2385.51 |
| Patients without lung disease with unprotected siblings/protected parents | 123 | 127,876.74 | 8168.97 |
| Patients without lung disease without siblings/with protected parents | 45 | 31,215.60 | 1998.79 |
| Patients without lung disease without siblings/with unprotected parents | 51 | 9215.38 | 586.60 |
Outpatient costs were reduced after the introduction of the campaign to $1.40/patient, reflecting the decrease in the number of outpatient visits from 245 to 51. Thus, the total cost of influenza in the source population after the introduction of an NICU‐based parental vaccination campaign was $200/patient. The $193/patient savings in the lung disease cohort with unprotected siblings ($1925 vs. $1732) was not sufficient to cover the increased cost of the vaccine. For this population of 2632 NICU patients, administration of NICU‐based parental influenza cost $12 extra/patient.
Financial Modeling Based on Source Data
Using the financial model, cost per patient was determined using the same estimates of incidence of the variables (ie, lung disease, siblings); only the number of enrollees in the program was varied. The relationship of cost per patient with number of NICU patients is shown in Figure 2. Cost per patient was zero at 4000 patients. Beyond that point, cost savings occurred, increasing with number of NICU admissions.
Estimating a 1‐day ICU admission rate of 0.5% at $3770/day reduces the required patient population for costs/patient to zero. This occurs at 3700 patients. Initially there is no added benefit with ICU admission, as the overall patient population is not large enough to support a significant ICU burden. As the population increases to 3000 patients, cost savings begin.
The relationship of variable immunization rates in siblings of the 2632 NICU patients in the source data is presented in Figure 3. Cost savings were not achieved until 37% of siblings had been immunized. A steep reduction in cost was seen as the immunization rate of siblings increased in the cohort. Marginal cost effectiveness was also increased in sibling immunization, meaning greater cost savings is achieved by immunizing a sibling of a high‐risk infant than by immunizing the parents, reflecting that siblings are more likely than parents to be vectors of disease in multichild households.
DISCUSSION
This is the first computer‐based model of the cost effectiveness of offering inactivated influenza vaccine to parents of patients in the NICU for the purpose of preventing illness in their offspring. Based on the source data, the study has demonstrated that offering immunization to parents in the NICU is not cost effective until the NICU population covered is at least 4000 patients. Cost effectiveness can also be reached in smaller populations by increasing the level of sibling immunization. These factors should be considered by public health specialists when mandating administration of influenza vaccine to parents in the NICU setting.
Cost‐effectiveness studies are limited by the variables chosen, by hospitalization rates, and by estimates made. Although we attempted to obtain hospitalization rates based on previously validated, published data, any variation in these rates will alter the cost‐savings model we constructed. For variables affecting the infectivity of and hospitalization for influenza, we chose lung disease, siblings with immunization rate, and parental immunization rate. Other variables, notably day care attendance, were not believed to highly influence infections due to respiratory pathogens.18
Another potential source of error in construction of the model is calculation of indirect costs. Although estimates of lost wages from work hours spent while a patient is hospitalized were calculated as an indirect cost, Leader et al. points out that there are also indirect costs after hospitalization secondary to increased outpatient physician surveillance.25 Furthermore, our model based lost wages on parents of patients earning an average salary of $17/hour. However, our source data represented the Regional Perinatal Center, a consortium of NICUs in New York City serving a primarily uninsured, indigent population. Hence, these estimates of lost wages may be overestimated.
Most cost‐utility analysis studies are performed to help compare public health policy policies across medical disciplines. Most data on adults and on children calculate the cost of quality‐of‐life‐adjusted year. In our study no such calculations were made because influenza was not thought to affect life long term. In other words, quality of life was not thought to be more likely to be affected by the variables NICU admission and birth weight than by the variable influenza infection, and these factors were considered in estimating hospitalization rates. Furthermore, because mortality from influenza is roughly 1 of every 100,000 for children less than 6 months old, no patients in the source data would have died, making quality‐of‐life‐adjusted year difficult to factor.26
Given a limited amount of medical resources, it is imperative to critically evaluate the economic implications of any widespread public health strategy. This cost analysis has demonstrated that the benefits of sponsoring NICU‐based immunization programs for parents will remain low unless the issue of sibling immunization is addressed or the number of patients in the cohort increases to a scale larger than any single traditional NICU may provide.
- ,.Interpandemic influenza in the Houston area, 1974‐1976.N Engl J Med.1978;298:587–592.
- ,,, et al.Burden of interpandemic influenza in children younger than 5 years: a 25‐year prospective study.J Infect Dis.2002;185:147–152.
- .Serious morbidity and mortality associated with influenza epidemics.Epidemiol Rev.1982;4:25–44.
- ,,, et al.Impact of respiratory virus infections on persons with chronic underlying conditions.JAMA.2000;283:499–505.
- ,,, et al.Influenza and the rates of hospitalization for respiratory disease among infants and young children.N Engl J Med.2000;342:232–239.
- ,,.Impact of influenza on morbidity in children with cystic fibrosis.J Paediatr Child Health.1991;27:308–311.
- ,,, et al.The burden of influenza illness in children with asthma and other chronic medical conditions.J Pediatr.2000;137:856–864.
- ,;Committee on Infectious Diseases.Technical report. Reduction of the influenza burden in children.Pediatrics.2002;110:e80. Available at: http://www.pediatrics.org/cgi/content/full/110/6/e80.
- ,,, et al.Clinical reactions and serologic responses after vaccination with while‐virus or split‐virus influenza vaccines in children aged 6 to 36 months.Pediatrics.1982;69:404–408.
- ,.Economic impact of influenza vaccination in preschool children.Pediatrics.2000;106:973–976.
- Committee on Infectious Disease Policy Statement.Reduction of the influenza burden in children.Pediatrics.2002;110:1246–1252.
- ,.Change in recommendation affects influenza vaccinations among children 6 to 59 months of age.Pediatrics.2004;114;948–952.
- ,,.Factors associated with influenza vaccination coverage among the elderly: role of health care personnel.Public Health.1996;110:163–168.
- ,.Optimizing long‐term care by administration of influenza vaccine to parents of NICU patients.J Perinatol.2004;24:273–274.
- ,.Reduction of the influenza burden in children: policy statement of the Committee on Infectious Diseases: American Academy of Pediatrics.Pediatrics.2002;110:1246–1252.
- National Center for Health Statistics. Incidence of prematurity data. Available at: http://www.marchofdimes.com/peristats. Accessed April 16,2006.
- Centers for Disease Control and Prevention (CDC).Estimated influenza vaccination coverage among adults and children—United States, September 1, 2004‐January 31, 2005.MMWR Morb Mortal Wkly Rep.2005;54:304–307.
- ,,, et al.Multistate surveillance for laboratory‐confirmed, influenza‐associated hospitalizations in children: 2003‐2004.Pediatr Infect Dis J.2006;25:395–400.
- .., et al.Population‐based surveillance for hospitalizations associated with respiratory syncytial virus, influenza virus, and parainfluenza viruses among young children.Pediatrics.2004;113:1758–1764.
- New York University Outpatient Pharmacy, personal communication.
- ,.Economic analysis of palivizumab in infants with congenital heart disease.Pediatrics.2004;114:1606–1611.
- Equitable Life Assurance Society of the United States.Hospital Daily Service Charges.New York, NY:Equitable Life Assurance Company,1982.
- ,,Hospital costs of pediatric intensive care.Crit Care Med.1999;27:2079–2085.
- U.S. Bureau of Labor Statistics. Employment and earnings2004. Available at: www.bls.gov/bls/wages.html.
- ,,,,,.Time and out‐of‐pocket costs associated with respiratory syncytial virus hospitalization of infants.Value Health.2003;6:100–106.
- ,,, et al.Influenza‐associated deaths among children in the United States.N Engl J Med.2005;353:2559–2569.
Copyright © 2007 Society of Hospital Medicine