User login
Clinical Operations Research: A New Frontier for Inquiry in Academic Health Systems
Patient throughput in healthcare systems is increasingly important to policymakers, hospital leaders, clinicians, and patients alike. In 1983, Congress passed legislation instructing the Centers for Medicare and Medicaid Services (CMS) to implement the “prospective payment system,” which sets reimbursement for CMS hospitalizations to a fixed rate, regardless of the length of stay (LOS). Policy changes such as this coupled with increased market consolidation (ie, fewer hospitals for more patients) and increased patient acuity have created significant challenges for hospital leaders to manage patient throughput and reduce or maintain LOS.1 Additionally, emergency department (ED) overcrowding and intensive care unit (ICU) capacity strain studies have demonstrated associations with adverse patient outcomes and quality of care.2-5 Finally, and perhaps most importantly, the impact of these forces on clinicians and patients has compromised the patient-clinician relationship and patient experience. As patient throughput is important to multiple stakeholders, novel approaches to understanding and mitigating bottlenecks are imperative.
The article by Mishra and colleagues in this month’s issue of the Journal of Hospital Medicine (JHM) describes one such novel methodology to evaluate patient throughput at a major academic hospital.6 The authors utilized process mapping, time and motion study, and hospital data to simulate four discrete future states for internal medicine patients that were under consideration for implementation at their institution: (1) localizing housestaff teams and patients to specific wards; (2) adding an additional 26-bed ward; (3) adding an additional hospitalist team; and (4) adding an additional ward and team and allowing for four additional patient admissions per day. Each of these approaches improved certain metrics with the tradeoff of worsening other metrics. Interestingly, geographic localization of housestaff teams and patients alone (Future State 1) resulted in decreased rounding time and patient dispersion but increased LOS and ED boarding time. Adding an additional ward (Future State 2) had the opposite effect (ie, decreased LOS and ED boarding time but increased rounding time and patient dispersion). Adding an additional hospitalist team (Future State 3) did not change LOS or ED boarding time but reduced patient dispersion and team census. Finally, adding both a ward and hospitalist team (Future State 4) reduced LOS and ED boarding time but increased rounding time and patient dispersion. These results provide a compelling case for modeling changes in clinical operations to weigh the risks and benefits of each approach with hospital priorities prior to implementation of one strategy versus another.
This study is an important step forward in bringing a rigorous scientific approach to clinical operations. If every academic center, or potentially every hospital, were to implement the approach described in this study, the potential for improvement in patient outcomes, quality metrics, and cost reduction that have been the intents of policymakers for over 30 years could be dramatic. But even if this approach were implemented (or possibly as a result of implementation), additional aspects of hospital operations might be uncovered given the infancy of this critical field. Indeed, we can think of at least five additional factors and approaches to consider as next steps to move this field forward. First, as the authors noted, multiple additional simulation inputs could be considered, including multidisciplinary workflow (eg, housestaff, hospitalists, nurses, clinical pharmacists, respiratory therapists, social workers, case managers, physical and occupational therapists, speech and language pathologists, etc.) and allowing for patients to transfer wards and teams during their hospitalizations. Second, qualitative investigation regarding clinician burnout, multidisciplinary cohesiveness, and patient satisfaction are crucial to implementation success. Third, repeat time and motion studies would aid in assessing for changes in time spent with patients and for educational purposes under the new care models. Fourth, medicine wards and teams do not operate in isolation within a hospital. It would be important to evaluate the impact of such changes on other wards and services, as all hospital wards and services are interdependent. And finally, determining costs associated with these models is critical for hospital leadership, resource allocation, implementation, and sustainability. For example, Future State 4 would increase admissions by 1,080 per year, but would that offset the cost of opening a new ward and hiring additional clinicians?
In addition, the authors feature the profoundly important concept of “geographic localization.” This construct has been investigated primarily among critically ill patients. Geographic dispersion has been shown to be associated with adverse clinical outcomes and quality metrics.7 Although this has begun to be studied among ward patients,8 the authors take this a step further by modeling future states incorporating geographic localization. Future State 4 resulted in the best overall outcomes but increased rounding time and patient dispersion, although these differences were not statistically significant. This piques our curiosity about the possibility of a fifth future state: adding geographic localization to Future State 4. Adding a new ward and new clinician team might provide a
Indeed, these results raise much broader and interesting questions surrounding ward capacity strain, that is, when patients’ demand for clinical resources exceeds availability.9 At our institution, we conducted a study to define the construct of ward capacity strain and demonstrated that among patients admitted to wards from EDs and ICUs in three University of Pennsylvania Health System hospitals, selected measures of patient volume, staff workload, and overall acuity were associated with longer ED and ICU boarding times. These same factors accounted for decreased patient throughput to varying, but sometimes large, degrees.10 We subsequently used this same definition of ward capacity strain to evaluate the association with 30-day hospital readmissions. We demonstrated that ward capacity strain metrics improved prediction of 30-day hospital readmission risk in nearly one out of three hospital wards, with medications administered, hospital discharges, and census being three of the five strongest predictors of 30-day hospital readmissions.11 These findings from our own institution further underscore the importance of the work by Mishra et al. and suggest future directions that could combine different measures of hospital throughput and patient outcomes into a more data-driven process for optimizing hospital resources, supporting the efforts of clinicians, and providing high-quality patient care.
This study is a breakthrough in the scientific rigor of hospital operations. It will lay the groundwork for a multitude of subsequent questions and studies that will move clinical operations into evidence-based practices. We find this work exciting and inspiring. We look forward to additional work from Mishra et al. and look forward to applying similar approaches to clinical operations at our institution.
Disclosures
The authors have nothing to disclose.
Funding
Dr. Kohn was supported by NIH/NHLBI F32 HL139107-01.
1. Centers for Medicare & Medicaid Services Prospective Payment Systems. https://www.cms.gov/Medicare/Medicare-Fee-for-Service-Payment/ProspMedicareFeeSvcPmtGen/index.html. Accessed September 26, 2018.
2. Rose L, Scales DC, Atzema C, et al. Emergency department length of stay for critical care admissions. A population-based study. Ann Am Thorac Soc. 2016;13(8):1324-1332. doi: 10.1513/AnnalsATS.201511-773OC. PubMed
3. Pines JM, Localio AR, Hollander JE, et al. The impact of emergency department crowding measures on time to antibiotics for patients with community-acquired pneumonia. Ann Emerg Med. 2007;50(5):510-516. doi: 10.1016/j.annemergmed.2007.07.021. PubMed
4. Gabler NB, Ratcliffe SJ, Wagner J, et al. Mortality among patients admitted to strained intensive care units. Am J Respir Crit Care Med. 2013;188(7):800-806. doi: 10.1164/rccm.201304-0622OC. PubMed
5. Weissman GE, Gabler NB, Brown SE, Halpern SD. Intensive care unit capacity strain and adherence to prophylaxis guidelines. J Crit Care. 2015;30(6):1303-1309. doi: 10.1016/j.jcrc.2015.08.015. PubMed
6. Mishra V, Tu S-P, Heim J, Masters H, Hall L. Predicting the future: using simulation modeling to forecast patient flow on general medicine units. J Hosp Med. 2018. In Press. PubMed
7. Vishnupriya K, Falade O, Workneh A, et al. Does sepsis treatment differ between primary and overflow intensive care units? J Hosp Med. 2012;7(8):600-605. doi: 10.1002/jhm.1955. PubMed
8. Bai AD, Srivastava S, Tomlinson GA, Smith CA, Bell CM, Gill SS. Mortality of hospitalised internal medicine patients bedspaced to non-internal medicine inpatient units: retrospective cohort study. BMJ Qual Saf. 2018;27(1):11-20. PubMed
9. Halpern SD. ICU capacity strain and the quality and allocation of critical care. Curr Opin Crit Care. 2011;17(6):648-657. doi: 10.1097/MCC.0b013e32834c7a53. PubMed
10. Kohn R, Bayes B, Ratcliffe SJ, Halpern SD, Kerlin MP. Ward capacity strain: Defining a new construct based on ED boarding time and ICU transfers. Am J Respir Crit Care Med. 2017;195:A7085.
11. Kohn R, Harhay MO, Bayes B, et al. Ward capacity strain: A novel predictor of 30-day hospital readmissions. J Gen Intern Med. 2018. doi: 10.1007/s11606-018-4564-x. PubMed
Patient throughput in healthcare systems is increasingly important to policymakers, hospital leaders, clinicians, and patients alike. In 1983, Congress passed legislation instructing the Centers for Medicare and Medicaid Services (CMS) to implement the “prospective payment system,” which sets reimbursement for CMS hospitalizations to a fixed rate, regardless of the length of stay (LOS). Policy changes such as this coupled with increased market consolidation (ie, fewer hospitals for more patients) and increased patient acuity have created significant challenges for hospital leaders to manage patient throughput and reduce or maintain LOS.1 Additionally, emergency department (ED) overcrowding and intensive care unit (ICU) capacity strain studies have demonstrated associations with adverse patient outcomes and quality of care.2-5 Finally, and perhaps most importantly, the impact of these forces on clinicians and patients has compromised the patient-clinician relationship and patient experience. As patient throughput is important to multiple stakeholders, novel approaches to understanding and mitigating bottlenecks are imperative.
The article by Mishra and colleagues in this month’s issue of the Journal of Hospital Medicine (JHM) describes one such novel methodology to evaluate patient throughput at a major academic hospital.6 The authors utilized process mapping, time and motion study, and hospital data to simulate four discrete future states for internal medicine patients that were under consideration for implementation at their institution: (1) localizing housestaff teams and patients to specific wards; (2) adding an additional 26-bed ward; (3) adding an additional hospitalist team; and (4) adding an additional ward and team and allowing for four additional patient admissions per day. Each of these approaches improved certain metrics with the tradeoff of worsening other metrics. Interestingly, geographic localization of housestaff teams and patients alone (Future State 1) resulted in decreased rounding time and patient dispersion but increased LOS and ED boarding time. Adding an additional ward (Future State 2) had the opposite effect (ie, decreased LOS and ED boarding time but increased rounding time and patient dispersion). Adding an additional hospitalist team (Future State 3) did not change LOS or ED boarding time but reduced patient dispersion and team census. Finally, adding both a ward and hospitalist team (Future State 4) reduced LOS and ED boarding time but increased rounding time and patient dispersion. These results provide a compelling case for modeling changes in clinical operations to weigh the risks and benefits of each approach with hospital priorities prior to implementation of one strategy versus another.
This study is an important step forward in bringing a rigorous scientific approach to clinical operations. If every academic center, or potentially every hospital, were to implement the approach described in this study, the potential for improvement in patient outcomes, quality metrics, and cost reduction that have been the intents of policymakers for over 30 years could be dramatic. But even if this approach were implemented (or possibly as a result of implementation), additional aspects of hospital operations might be uncovered given the infancy of this critical field. Indeed, we can think of at least five additional factors and approaches to consider as next steps to move this field forward. First, as the authors noted, multiple additional simulation inputs could be considered, including multidisciplinary workflow (eg, housestaff, hospitalists, nurses, clinical pharmacists, respiratory therapists, social workers, case managers, physical and occupational therapists, speech and language pathologists, etc.) and allowing for patients to transfer wards and teams during their hospitalizations. Second, qualitative investigation regarding clinician burnout, multidisciplinary cohesiveness, and patient satisfaction are crucial to implementation success. Third, repeat time and motion studies would aid in assessing for changes in time spent with patients and for educational purposes under the new care models. Fourth, medicine wards and teams do not operate in isolation within a hospital. It would be important to evaluate the impact of such changes on other wards and services, as all hospital wards and services are interdependent. And finally, determining costs associated with these models is critical for hospital leadership, resource allocation, implementation, and sustainability. For example, Future State 4 would increase admissions by 1,080 per year, but would that offset the cost of opening a new ward and hiring additional clinicians?
In addition, the authors feature the profoundly important concept of “geographic localization.” This construct has been investigated primarily among critically ill patients. Geographic dispersion has been shown to be associated with adverse clinical outcomes and quality metrics.7 Although this has begun to be studied among ward patients,8 the authors take this a step further by modeling future states incorporating geographic localization. Future State 4 resulted in the best overall outcomes but increased rounding time and patient dispersion, although these differences were not statistically significant. This piques our curiosity about the possibility of a fifth future state: adding geographic localization to Future State 4. Adding a new ward and new clinician team might provide a
Indeed, these results raise much broader and interesting questions surrounding ward capacity strain, that is, when patients’ demand for clinical resources exceeds availability.9 At our institution, we conducted a study to define the construct of ward capacity strain and demonstrated that among patients admitted to wards from EDs and ICUs in three University of Pennsylvania Health System hospitals, selected measures of patient volume, staff workload, and overall acuity were associated with longer ED and ICU boarding times. These same factors accounted for decreased patient throughput to varying, but sometimes large, degrees.10 We subsequently used this same definition of ward capacity strain to evaluate the association with 30-day hospital readmissions. We demonstrated that ward capacity strain metrics improved prediction of 30-day hospital readmission risk in nearly one out of three hospital wards, with medications administered, hospital discharges, and census being three of the five strongest predictors of 30-day hospital readmissions.11 These findings from our own institution further underscore the importance of the work by Mishra et al. and suggest future directions that could combine different measures of hospital throughput and patient outcomes into a more data-driven process for optimizing hospital resources, supporting the efforts of clinicians, and providing high-quality patient care.
This study is a breakthrough in the scientific rigor of hospital operations. It will lay the groundwork for a multitude of subsequent questions and studies that will move clinical operations into evidence-based practices. We find this work exciting and inspiring. We look forward to additional work from Mishra et al. and look forward to applying similar approaches to clinical operations at our institution.
Disclosures
The authors have nothing to disclose.
Funding
Dr. Kohn was supported by NIH/NHLBI F32 HL139107-01.
1. Centers for Medicare & Medicaid Services Prospective Payment Systems. https://www.cms.gov/Medicare/Medicare-Fee-for-Service-Payment/ProspMedicareFeeSvcPmtGen/index.html. Accessed September 26, 2018.
2. Rose L, Scales DC, Atzema C, et al. Emergency department length of stay for critical care admissions. A population-based study. Ann Am Thorac Soc. 2016;13(8):1324-1332. doi: 10.1513/AnnalsATS.201511-773OC. PubMed
3. Pines JM, Localio AR, Hollander JE, et al. The impact of emergency department crowding measures on time to antibiotics for patients with community-acquired pneumonia. Ann Emerg Med. 2007;50(5):510-516. doi: 10.1016/j.annemergmed.2007.07.021. PubMed
4. Gabler NB, Ratcliffe SJ, Wagner J, et al. Mortality among patients admitted to strained intensive care units. Am J Respir Crit Care Med. 2013;188(7):800-806. doi: 10.1164/rccm.201304-0622OC. PubMed
5. Weissman GE, Gabler NB, Brown SE, Halpern SD. Intensive care unit capacity strain and adherence to prophylaxis guidelines. J Crit Care. 2015;30(6):1303-1309. doi: 10.1016/j.jcrc.2015.08.015. PubMed
6. Mishra V, Tu S-P, Heim J, Masters H, Hall L. Predicting the future: using simulation modeling to forecast patient flow on general medicine units. J Hosp Med. 2018. In Press. PubMed
7. Vishnupriya K, Falade O, Workneh A, et al. Does sepsis treatment differ between primary and overflow intensive care units? J Hosp Med. 2012;7(8):600-605. doi: 10.1002/jhm.1955. PubMed
8. Bai AD, Srivastava S, Tomlinson GA, Smith CA, Bell CM, Gill SS. Mortality of hospitalised internal medicine patients bedspaced to non-internal medicine inpatient units: retrospective cohort study. BMJ Qual Saf. 2018;27(1):11-20. PubMed
9. Halpern SD. ICU capacity strain and the quality and allocation of critical care. Curr Opin Crit Care. 2011;17(6):648-657. doi: 10.1097/MCC.0b013e32834c7a53. PubMed
10. Kohn R, Bayes B, Ratcliffe SJ, Halpern SD, Kerlin MP. Ward capacity strain: Defining a new construct based on ED boarding time and ICU transfers. Am J Respir Crit Care Med. 2017;195:A7085.
11. Kohn R, Harhay MO, Bayes B, et al. Ward capacity strain: A novel predictor of 30-day hospital readmissions. J Gen Intern Med. 2018. doi: 10.1007/s11606-018-4564-x. PubMed
© 2019 Society of Hospital Medicine
The Interplay between Financial Incentives, Institutional Culture, and Physician Behavior: An Incompletely Understood Relationship Worth Elucidating
The United States spends approximately 18% of its gross domestic product on healthcare, nearly double the average expenditure by other high-income countries.1 This increased financial investment does not consistently correlate with better care, as quality outcomes in the US rank well below many developed nations that spend far less on clinical care on a per capita basis.1,2 These troubling and unsustainable spending trends have compelled national and regional policymakers, health system leaders, and researchers to search for ways to curb healthcare spending and improve healthcare value.
Approximately 32% of overall healthcare spending in the US occurs in hospitals,3 and there is broad acknowledgment that inpatient care can be delivered more cost effectively.4 In recent years, numerous policy interventions – including Medicare’s hospital readmission reductions program, hospital-acquired condition reductions program, hospital value-based purchasing program, and the Bundled Payment for Care Improvement program – have been implemented in an effort to improve the quality and costs of inpatient care.4,5
These policies attempt to increase care value by utilizing innovative reimbursement techniques designed to hold clinical systems financially accountable for outcomes and spending. They are designed to move our system away from the traditional fee-for-service paradigm, which encourages overuse and has been identified as a major driver of bloated healthcare costs in the US.6,7 The success of certain national payment reform pilots, such as the Comprehensive Care for Joint Replacement Model, indicate that payment models which hold clinicians and systems accountable hold promise for both reducing costs and improving outcomes.8
However, to influence clinical outcomes and costs, these national payment reforms must prompt local changes in how care is delivered and financed. Understanding systems- and clinician-level factors that enable the delivery of higher value care is, therefore, paramount for effectively translating national policies into local improvements in care value. Among hospitalists and hospital-based clinicians, institutional and clinical cultures represent an important lever for influencing physician practice patterns and, by extension, the quality and costs of care. Hospital and departmental cultures have been shown to influence physician behaviors profoundly in ways that improve quality and value, primarily via top-down initiatives focused on education and improving awareness. Examples of cultural success stories include efforts to reduce unnecessary utilization of diagnostic testing,9 improve adoption of hand-washing techniques on wards,10 and translate education about high-value care into sustained increases in the delivery of high-value clinical services.11
In “The Association of Hospitals Productivity Payments and High-Value Care Culture,” Gupta et al. present the results of a study examining associations between how hospitals compensate their hospitalists – specifically the provision of performance-based incentives – and the strength of a hospital’s high-value care culture.12 The authors administered the High-Value Care Culture SurveyTM (HVCCS), a validated survey instrument designed to assess the degree to which a hospital’s culture promotes the delivery of high-value care, to 255 hospitalists across 12 hospitals, including safety-net, community, and university-based hospitals. The hospitals’ predominant physician compensation models were grouped into three categories: salary model (no performance-based bonus), salary model with a productivity adjustment (ie, a bonus based on clinical volumes), and a salary model with a quality/value adjustment (ie, a bonus for delivering higher value care). The authors found that hospitalists who were salaried but also received productivity adjustments reported significantly lower mean HVCCS scores than salaried hospitalists who did not receive bonuses or adjustments. Compared with salaried hospitalists, hospitalists receiving compensation via salary plus value-based adjustments were nonsignificantly more likely to have higher HVCCS scores.
How are we to interpret these results? While we must be exceedingly careful about presuming causal mechanisms underlying these associations, they are nonetheless intriguing and should prompt further discussion about the relationship between payment incentives, provider behavior, and organizational culture. One potential explanation for these findings is that hospitals that rely on high clinical volumes to drive their financial performance may use productivity bonuses as a way to align hospitalists’ incentives with those of their institution, thereby promoting volume at the expense of value.
Behavioral economics theory provides an alternative lens through which to interpret the work of Gupta et al. The relationship between incentives and nonfinancial sources of personal motivation remain an important consideration in financial incentive design.13 A basic concept in behavioral economics is that there are two fundamental types of motivation of human behavior: extrinsic motivation, where people are motivated to act by the prospect of material rewards or punishments, and intrinsic motivation, a source of motivation that leads people to behave in ways that do not produce an obvious personal or material reward.13 Substantial evidence indicates that external rewards can have counterproductive effects on an individual’s intrinsic motivation, leading to a “crowding-out” effect that decreases the individual’s internal drive. When the “crowding-out” effect occurs, behaviors may be motivated by a desire to follow the rules, rather than true intrinsic drive. This change in the underlying forces motivating behavior can have a negative impact on self-esteem and result in a perceived loss of professional autonomy.13,14 Perhaps more than any other professional group, healthcare professionals are fueled by intrinsic motivation and a yearning for professional autonomy. It is therefore plausible that doctors are particularly sensitive to, and disturbed by, the feeling that external rewards are “crowding out” this internal drive. Thus, the inverse association between productivity payments – volume-based rewards – and HVCCS scores may reflect this tension between intrinsic and extrinsic drives.
Of course, we need to interpret the authors’ findings cautiously in light of the cross-sectional study design and the potential for residual confounding. Indeed, the presence of an association between how hospitalists are compensated and their perceptions of the degree to which their institution’s culture promotes the delivery of high-value care does not prove that these two things are causally linked. Additionally, the small sample size limits the generalizability of these findings and efforts to draw robust conclusions from this work regarding the interplay between how a hospital pays its physicians, hospital culture, and the value of care delivered in this institution. Moreover, a more rigorous characterization of the nature of productivity payments compared with value-based performance payments and pure salaried wages would have been extremely useful to help interpret the likelihood that these payment models influenced the behavior of clinicians and perceptions of culture. In particular, how payment models define “productivity” and “quality” thresholds for achieving performance-based payments and the degree of control that physicians have on achieving them are critical determinants of the power of these incentives to influence clinician behavior and of clinicians’ perceptions of the degree to which their institution cultivates a high-value culture.14
Despite these limitations, this study raises a number of interesting hypotheses regarding the relationship between clinician payment models, incentive design, and clinical culture that warrant further investigation. For example, how do financial incentives designed to improve the value of inpatient care actually influence the practice patterns of hospitalists? Surprisingly little is known about this topic. Does the physician payment model design generally and implementation of targeted financial incentives for delivering higher value care in particular directly influence clinical culture? If so, how? Also, does the cultural effect actually undermine the goals of the financial incentive?
More broadly, systematic efforts to evaluate how clinical and hospital cultures impact the ability of financial incentives to motivate desired changes in clinicians’ behaviors will help healthcare leaders use financial incentives more effectively to motivate the delivery of higher quality, more cost-effective care. Increasing use and evaluation of different alternative payment models across hospitals nationwide represents an opportunity to characterize associations between different payment models and the delivery of high-quality, cost-effective care.15 Parallel efforts to characterize the clinical culture of these hospitals could help to better understand if and how hospital culture mediates this relationship. Moreover, because inpatient care is increasing and, in many hospitals, primarily provided by multidisciplinary teams, additional research is needed to understand how different payment models influence inpatient clinical team performance.
The connection between culture, financial incentives, and value-based care remains difficult to determine, but essential to clarify. Gupta et al. demonstrated that how a clinical system pays its physicians appears to be associated with physicians’ perceptions of how strongly the hospital’s culture emphasizes the delivery of high-value care. Work culture is a profound determinant of employee happiness, satisfaction, and productivity. The consistent delivery of high-value care is undoubtedly harder in clinical cultures that do not prize and support this end. Health system leaders focused on improving care value would be wise to pay close attention to their employees’ perceptions of their culture – and use these perceptions as one of several measures of their progress toward enabling their organization to deliver higher value care consistently.
Disclosures
Dr. Blumenthal is the Associate Chief Medical Officer of Devoted Health. Dr. Bergethon has nothing to disclose.
1. Papanicolas I, Woskie LR, Jha AK. Health care spending in the United States and other high-income countries. JAMA. 2018;319(10):1024-1039. doi: 10.1001/jama.2018.1150. PubMed
2. Fullman N, Yearwood J, Abay SM, et al. Measuring performance on the Healthcare Access and Quality Index for 195 countries and territories and selected subnational locations: a systematic analysis from the Global Burden of Disease Study 2016. Lancet. 2018;391(10136):2236-2271. doi: 10.1016/S0140-6736(18)30994-2. PubMed
3. Hartman M, Martin AB, Espinosa N, Catlin A, National Health Expenditure Accounts Team. National health care spending in 2016: spending and enrollment growth slow after initial coverage expansions. Health Aff. 2017;37(1):150-160. doi: 10.1377/hlthaff.2017.1655. PubMed
4. Nussbaum S, McClellan M, Metlay G. Principles for a framework for alternative payment models. JAMA. 2018;319(7):653-654. doi: 10.1001/jama.2017.20226. PubMed
5. Morden NE, Colla CH, Sequist TD, Rosenthal MB. Choosing wisely- the politics and economics of labeling low-value services. N Engl J Med. 2014;370(7):589-592. doi: 10.1056/NEJMp1314965. PubMed
6. Laugesen MJ, Glied SA. Higher fees paid to US physicians drive higher spending for physician services compared to other countries. Health Aff. 2011;30(9):1647-1656. doi: 10.1377/hlthaff.2010.0204. PubMed
7. Korda H, Eldridge GN. Payment incentives and integrated care delivery: Levers for health system reform and cost containment. Inquiry. 2011;48(4):277-287. doi: 10.5034/inquiryjrnl_48.04.01. PubMed
8. Dummit LA, Kahvecioglu D, Marrufo G, et al. Association between hospital participation in a Medicare bundled payment initiative and payments and quality outcomes for lower extremity joint replacement episodes. JAMA. 2016;316(12):1267-1278. doi: 10.1001/jama.2016.12717. PubMed
9. Korenstein D, Husain S, Gennarelli R, White C, Masciale J, Roman B. Impact of clinical specialty on attitudes regarding overuse of inpatient laboratory testing. J Hosp Med. 2018;E1-E4. doi: 10.12788/jhm.2978. PubMed
10. Jain R, Kralovic SM, Evans ME, et al. Veterans Affairs initiative to prevent methicillin-resistant Staphylococcus aureus infections. N Engl J Med. 2011;364(15):1419-1430. doi: 10.1056/NEJMoa1007474. PubMed
11. Stammen LA, Stalmeijer RE, Paternotte E, et al. Training physicians to provide high-value, cost-conscious care a systematic review. JAMA. 2015;314(22):2384-2400. doi: 10.1001/jama.2015.16353. PubMed
12. Gupta R, Steers N, Moriates C, Ong M. Association between hospitalist productivity payments and high-value care culture [published online ahead of print October 31, 2018]. J Hosp Med. 2018. In press. doi: 10.12788/jhm.3084. PubMed
13. Marshall M, Harrison S. It’s about more than money: financial incentives and internal motivation. Qual Saf Health Care. 2005;14(1):4-5. doi: 10.1136/qshc.2004.013193. PubMed
14. Conrad DA. The theory of value-based payment incentives and their application to health care. Health Serv Res. 2015;50(Suppl 2):2057-2089. doi: 10.1111/1475-6773.12408. PubMed
15. Schwartz AL, Chernew ME, Landon BE, McWilliams JM. Changes in low-value services in year 1 of the medicare pioneer accountable care organization program. JAMA Intern Med. 2015;175(11):1815-1825. doi: 10.1001/jamainternmed.2016.2827. PubMed
The United States spends approximately 18% of its gross domestic product on healthcare, nearly double the average expenditure by other high-income countries.1 This increased financial investment does not consistently correlate with better care, as quality outcomes in the US rank well below many developed nations that spend far less on clinical care on a per capita basis.1,2 These troubling and unsustainable spending trends have compelled national and regional policymakers, health system leaders, and researchers to search for ways to curb healthcare spending and improve healthcare value.
Approximately 32% of overall healthcare spending in the US occurs in hospitals,3 and there is broad acknowledgment that inpatient care can be delivered more cost effectively.4 In recent years, numerous policy interventions – including Medicare’s hospital readmission reductions program, hospital-acquired condition reductions program, hospital value-based purchasing program, and the Bundled Payment for Care Improvement program – have been implemented in an effort to improve the quality and costs of inpatient care.4,5
These policies attempt to increase care value by utilizing innovative reimbursement techniques designed to hold clinical systems financially accountable for outcomes and spending. They are designed to move our system away from the traditional fee-for-service paradigm, which encourages overuse and has been identified as a major driver of bloated healthcare costs in the US.6,7 The success of certain national payment reform pilots, such as the Comprehensive Care for Joint Replacement Model, indicate that payment models which hold clinicians and systems accountable hold promise for both reducing costs and improving outcomes.8
However, to influence clinical outcomes and costs, these national payment reforms must prompt local changes in how care is delivered and financed. Understanding systems- and clinician-level factors that enable the delivery of higher value care is, therefore, paramount for effectively translating national policies into local improvements in care value. Among hospitalists and hospital-based clinicians, institutional and clinical cultures represent an important lever for influencing physician practice patterns and, by extension, the quality and costs of care. Hospital and departmental cultures have been shown to influence physician behaviors profoundly in ways that improve quality and value, primarily via top-down initiatives focused on education and improving awareness. Examples of cultural success stories include efforts to reduce unnecessary utilization of diagnostic testing,9 improve adoption of hand-washing techniques on wards,10 and translate education about high-value care into sustained increases in the delivery of high-value clinical services.11
In “The Association of Hospitals Productivity Payments and High-Value Care Culture,” Gupta et al. present the results of a study examining associations between how hospitals compensate their hospitalists – specifically the provision of performance-based incentives – and the strength of a hospital’s high-value care culture.12 The authors administered the High-Value Care Culture SurveyTM (HVCCS), a validated survey instrument designed to assess the degree to which a hospital’s culture promotes the delivery of high-value care, to 255 hospitalists across 12 hospitals, including safety-net, community, and university-based hospitals. The hospitals’ predominant physician compensation models were grouped into three categories: salary model (no performance-based bonus), salary model with a productivity adjustment (ie, a bonus based on clinical volumes), and a salary model with a quality/value adjustment (ie, a bonus for delivering higher value care). The authors found that hospitalists who were salaried but also received productivity adjustments reported significantly lower mean HVCCS scores than salaried hospitalists who did not receive bonuses or adjustments. Compared with salaried hospitalists, hospitalists receiving compensation via salary plus value-based adjustments were nonsignificantly more likely to have higher HVCCS scores.
How are we to interpret these results? While we must be exceedingly careful about presuming causal mechanisms underlying these associations, they are nonetheless intriguing and should prompt further discussion about the relationship between payment incentives, provider behavior, and organizational culture. One potential explanation for these findings is that hospitals that rely on high clinical volumes to drive their financial performance may use productivity bonuses as a way to align hospitalists’ incentives with those of their institution, thereby promoting volume at the expense of value.
Behavioral economics theory provides an alternative lens through which to interpret the work of Gupta et al. The relationship between incentives and nonfinancial sources of personal motivation remain an important consideration in financial incentive design.13 A basic concept in behavioral economics is that there are two fundamental types of motivation of human behavior: extrinsic motivation, where people are motivated to act by the prospect of material rewards or punishments, and intrinsic motivation, a source of motivation that leads people to behave in ways that do not produce an obvious personal or material reward.13 Substantial evidence indicates that external rewards can have counterproductive effects on an individual’s intrinsic motivation, leading to a “crowding-out” effect that decreases the individual’s internal drive. When the “crowding-out” effect occurs, behaviors may be motivated by a desire to follow the rules, rather than true intrinsic drive. This change in the underlying forces motivating behavior can have a negative impact on self-esteem and result in a perceived loss of professional autonomy.13,14 Perhaps more than any other professional group, healthcare professionals are fueled by intrinsic motivation and a yearning for professional autonomy. It is therefore plausible that doctors are particularly sensitive to, and disturbed by, the feeling that external rewards are “crowding out” this internal drive. Thus, the inverse association between productivity payments – volume-based rewards – and HVCCS scores may reflect this tension between intrinsic and extrinsic drives.
Of course, we need to interpret the authors’ findings cautiously in light of the cross-sectional study design and the potential for residual confounding. Indeed, the presence of an association between how hospitalists are compensated and their perceptions of the degree to which their institution’s culture promotes the delivery of high-value care does not prove that these two things are causally linked. Additionally, the small sample size limits the generalizability of these findings and efforts to draw robust conclusions from this work regarding the interplay between how a hospital pays its physicians, hospital culture, and the value of care delivered in this institution. Moreover, a more rigorous characterization of the nature of productivity payments compared with value-based performance payments and pure salaried wages would have been extremely useful to help interpret the likelihood that these payment models influenced the behavior of clinicians and perceptions of culture. In particular, how payment models define “productivity” and “quality” thresholds for achieving performance-based payments and the degree of control that physicians have on achieving them are critical determinants of the power of these incentives to influence clinician behavior and of clinicians’ perceptions of the degree to which their institution cultivates a high-value culture.14
Despite these limitations, this study raises a number of interesting hypotheses regarding the relationship between clinician payment models, incentive design, and clinical culture that warrant further investigation. For example, how do financial incentives designed to improve the value of inpatient care actually influence the practice patterns of hospitalists? Surprisingly little is known about this topic. Does the physician payment model design generally and implementation of targeted financial incentives for delivering higher value care in particular directly influence clinical culture? If so, how? Also, does the cultural effect actually undermine the goals of the financial incentive?
More broadly, systematic efforts to evaluate how clinical and hospital cultures impact the ability of financial incentives to motivate desired changes in clinicians’ behaviors will help healthcare leaders use financial incentives more effectively to motivate the delivery of higher quality, more cost-effective care. Increasing use and evaluation of different alternative payment models across hospitals nationwide represents an opportunity to characterize associations between different payment models and the delivery of high-quality, cost-effective care.15 Parallel efforts to characterize the clinical culture of these hospitals could help to better understand if and how hospital culture mediates this relationship. Moreover, because inpatient care is increasing and, in many hospitals, primarily provided by multidisciplinary teams, additional research is needed to understand how different payment models influence inpatient clinical team performance.
The connection between culture, financial incentives, and value-based care remains difficult to determine, but essential to clarify. Gupta et al. demonstrated that how a clinical system pays its physicians appears to be associated with physicians’ perceptions of how strongly the hospital’s culture emphasizes the delivery of high-value care. Work culture is a profound determinant of employee happiness, satisfaction, and productivity. The consistent delivery of high-value care is undoubtedly harder in clinical cultures that do not prize and support this end. Health system leaders focused on improving care value would be wise to pay close attention to their employees’ perceptions of their culture – and use these perceptions as one of several measures of their progress toward enabling their organization to deliver higher value care consistently.
Disclosures
Dr. Blumenthal is the Associate Chief Medical Officer of Devoted Health. Dr. Bergethon has nothing to disclose.
1. Papanicolas I, Woskie LR, Jha AK. Health care spending in the United States and other high-income countries. JAMA. 2018;319(10):1024-1039. doi: 10.1001/jama.2018.1150. PubMed
2. Fullman N, Yearwood J, Abay SM, et al. Measuring performance on the Healthcare Access and Quality Index for 195 countries and territories and selected subnational locations: a systematic analysis from the Global Burden of Disease Study 2016. Lancet. 2018;391(10136):2236-2271. doi: 10.1016/S0140-6736(18)30994-2. PubMed
3. Hartman M, Martin AB, Espinosa N, Catlin A, National Health Expenditure Accounts Team. National health care spending in 2016: spending and enrollment growth slow after initial coverage expansions. Health Aff. 2017;37(1):150-160. doi: 10.1377/hlthaff.2017.1655. PubMed
4. Nussbaum S, McClellan M, Metlay G. Principles for a framework for alternative payment models. JAMA. 2018;319(7):653-654. doi: 10.1001/jama.2017.20226. PubMed
5. Morden NE, Colla CH, Sequist TD, Rosenthal MB. Choosing wisely- the politics and economics of labeling low-value services. N Engl J Med. 2014;370(7):589-592. doi: 10.1056/NEJMp1314965. PubMed
6. Laugesen MJ, Glied SA. Higher fees paid to US physicians drive higher spending for physician services compared to other countries. Health Aff. 2011;30(9):1647-1656. doi: 10.1377/hlthaff.2010.0204. PubMed
7. Korda H, Eldridge GN. Payment incentives and integrated care delivery: Levers for health system reform and cost containment. Inquiry. 2011;48(4):277-287. doi: 10.5034/inquiryjrnl_48.04.01. PubMed
8. Dummit LA, Kahvecioglu D, Marrufo G, et al. Association between hospital participation in a Medicare bundled payment initiative and payments and quality outcomes for lower extremity joint replacement episodes. JAMA. 2016;316(12):1267-1278. doi: 10.1001/jama.2016.12717. PubMed
9. Korenstein D, Husain S, Gennarelli R, White C, Masciale J, Roman B. Impact of clinical specialty on attitudes regarding overuse of inpatient laboratory testing. J Hosp Med. 2018;E1-E4. doi: 10.12788/jhm.2978. PubMed
10. Jain R, Kralovic SM, Evans ME, et al. Veterans Affairs initiative to prevent methicillin-resistant Staphylococcus aureus infections. N Engl J Med. 2011;364(15):1419-1430. doi: 10.1056/NEJMoa1007474. PubMed
11. Stammen LA, Stalmeijer RE, Paternotte E, et al. Training physicians to provide high-value, cost-conscious care a systematic review. JAMA. 2015;314(22):2384-2400. doi: 10.1001/jama.2015.16353. PubMed
12. Gupta R, Steers N, Moriates C, Ong M. Association between hospitalist productivity payments and high-value care culture [published online ahead of print October 31, 2018]. J Hosp Med. 2018. In press. doi: 10.12788/jhm.3084. PubMed
13. Marshall M, Harrison S. It’s about more than money: financial incentives and internal motivation. Qual Saf Health Care. 2005;14(1):4-5. doi: 10.1136/qshc.2004.013193. PubMed
14. Conrad DA. The theory of value-based payment incentives and their application to health care. Health Serv Res. 2015;50(Suppl 2):2057-2089. doi: 10.1111/1475-6773.12408. PubMed
15. Schwartz AL, Chernew ME, Landon BE, McWilliams JM. Changes in low-value services in year 1 of the medicare pioneer accountable care organization program. JAMA Intern Med. 2015;175(11):1815-1825. doi: 10.1001/jamainternmed.2016.2827. PubMed
© 2019 Society of Hospital Medicine
Discharge by Noon: The Time Has Come for More Times to be the Right Time
Hospitalists have become well versed in campaigns championing safe, efficient, and timely discharges, as well as in the pragmatic challenges of achieving them. Successfully discharging a patient from the hospital requires synchronizing several elements; as a result, improvement efforts focus on promoting shared mental models and team identification of early discharges. The urgency for timely discharges, much like (and unlike1) hotel check-out times, becomes increasingly relevant when hospitals are functioning at or beyond full capacity. As inpatient medical care grows increasingly more specialized, promoting high-quality discharges theoretically allows for not only more beds, but also that the right bed is available for the right patient at the right time. In addition, financial realities in terms of reimbursement and the high cost of adding capacity imply that hospitals need to maximize throughput from the beds they already have. For these reasons, hospital administrators and operational leaders have focused on early discharges as a goal—and have often used discharge before noon (DCBN) as the metric to measure performance.
In this issue of the Journal of Hospital Medicine, Destino et al. reported that it is possible to achieve a higher percentage of early discharges, which allowed for decompression of post-anesthesia care and emergency areas without a measurable negative impact on patient or family satisfaction or length of stay (LOS).2 The improvement they report is remarkable. However, it will be important for them to report back, as quality improvement projects often revert to prior state unless the processes are reinforced and embedded in hospital culture. In addition, what goes unreported in Destino et al. are the unmeasured and unanticipated outcomes related to focusing on a single, laudable goal. This study and others have yet to confirm that systems have enough resiliency to improve discharge timeliness without diverting resources from other aspects of care.3 In other words, can inpatient teams do everything at the same time without sacrificing quality; ie, improve discharge timeliness, accept and admit new patients faster, respond to deteriorating patients, spend enough time with patients and families to meet their needs (and validated survey expectations), and in educational settings, meet the learning needs of trainees?4 This may prove to be true if implementation techniques are individualized to hospitals, services, and units and are incorporated into existing workflows, minimizing extraneous “asks” on already overtaxed providers. Evidence to support this would go a long way in engaging stakeholders to prioritize quality discharges.
In this issue, too, James, et al. ask the question “if DCBN is a good indicator of shorter LOS or is DCBN an arbitrary indicator.”5 The answer may be yes, no, both, maybe, and it depends. Certainly, no pathophysiological reasons exist for a certain time of day to be the “right” time for discharge. The key question for hospitalists and health systems leaders is whether setting time goals leads clinicians to delay discharges of medically and logistically ready patients in the afternoon or evening, particularly if the metric is linked to monetary performance incentives. This is also likely a matter of degrees, ie, set the DCBN goal at 80%-100% and gaming is much more likely; set the goal at 20%-30% and this might reflect a realistic range and be less likely to incentivize gaming. Notably, the hospital in the James study did not have a DCBN goal. It would be interesting to see what would happen in that hospital or another hospital before and after implementing a DCBN goal—and further assess a dose-response curve. Another approach would be to perform qualitative analysis of readiness for discharge via chart reviews and determine if patients could have left in the afternoon or evening but might have been delayed to buff up the performance on the DCBN metric.
James et al. additionally demonstrate differences for medical and surgical patients, underscoring that a DCBN goal is unlikely to yield the same results in different patient cohorts or settings. The authors note several workflow reasons for this variation, but other considerations are regularity of timelines for recovery being different for surgical patients, role of elective admissions scheduled in advance, and the potential use of conditional orders (ie, orders entered before dawn that nurses can activate as patients meet criteria).
Much as we have adopted cultural changes over the years to raise awareness regarding patient safety such as nosocomial infections and hand hygiene, an emphasis on high-quality discharges too needs to become integral to hospital practices to sustain performance and any associated metrics. As to what to measure? A validated “medical readiness to discharge” may be the gold standard but may be difficult to attain. Until then, carefully constructed approaches to prioritizing early discharges through proactive planning, shared mental models, interdisciplinary teamwork, and appropriate incentives to those who do it well could yield the results we want as hospitalists, as patients, and as families.
Disclosures
Dr. Kane and Dr. Fieldston have nothing to disclose.
1. Iantorno S, Fieldston E. Hospitals are not hotels: high-quality discharges occur around the clock. JAMA Pediatr. 2013;167(7):596-597. doi: 10.1001/jamapediatrics.2013.2252. PubMed
2. Destino L BD, Acuna C, Asch S, Platchek T. Improving patient flow: analysis of an initiative to improve early discharge. J Hosp Med. 2019;14(1):22-27. doi: 10.12788/JHM.3133.
3. Lorch SA, Millman AM, Zhang X, et.al. Impact of admission-day crowding on the length of stay of pediatric hospitalizations. Pediatrics. 2008;121(4):e718-e730. doi: 10.1542/peds.2007-1280. PubMed
4. Haferbecker D, Fakeye O, Medina SP, Fieldston ES. Perceptions of educational experience and inpatient workload among pediatric residents. Hosp Pediatri. 2013;3(3):276-284. doi: 10.1542/hpeds.2012-0068. PubMed
5. James H, Steiner MJ, Holmes GM, Stephens JR. The association of discharge before noon and length of stay in hospitalized pediatric patients. J Hosp Med. 2019:14(1):28-32. doi: 10.12788/jhm.3111.
6. White CM, Statile AM, White DL, et al. Using quality improvement to optimize paediatric discharge efficiency. BMJ Qual Saf. 2014;23(5):428-436. doi: 10.1136/bmjqs-2013-002556.
Hospitalists have become well versed in campaigns championing safe, efficient, and timely discharges, as well as in the pragmatic challenges of achieving them. Successfully discharging a patient from the hospital requires synchronizing several elements; as a result, improvement efforts focus on promoting shared mental models and team identification of early discharges. The urgency for timely discharges, much like (and unlike1) hotel check-out times, becomes increasingly relevant when hospitals are functioning at or beyond full capacity. As inpatient medical care grows increasingly more specialized, promoting high-quality discharges theoretically allows for not only more beds, but also that the right bed is available for the right patient at the right time. In addition, financial realities in terms of reimbursement and the high cost of adding capacity imply that hospitals need to maximize throughput from the beds they already have. For these reasons, hospital administrators and operational leaders have focused on early discharges as a goal—and have often used discharge before noon (DCBN) as the metric to measure performance.
In this issue of the Journal of Hospital Medicine, Destino et al. reported that it is possible to achieve a higher percentage of early discharges, which allowed for decompression of post-anesthesia care and emergency areas without a measurable negative impact on patient or family satisfaction or length of stay (LOS).2 The improvement they report is remarkable. However, it will be important for them to report back, as quality improvement projects often revert to prior state unless the processes are reinforced and embedded in hospital culture. In addition, what goes unreported in Destino et al. are the unmeasured and unanticipated outcomes related to focusing on a single, laudable goal. This study and others have yet to confirm that systems have enough resiliency to improve discharge timeliness without diverting resources from other aspects of care.3 In other words, can inpatient teams do everything at the same time without sacrificing quality; ie, improve discharge timeliness, accept and admit new patients faster, respond to deteriorating patients, spend enough time with patients and families to meet their needs (and validated survey expectations), and in educational settings, meet the learning needs of trainees?4 This may prove to be true if implementation techniques are individualized to hospitals, services, and units and are incorporated into existing workflows, minimizing extraneous “asks” on already overtaxed providers. Evidence to support this would go a long way in engaging stakeholders to prioritize quality discharges.
In this issue, too, James, et al. ask the question “if DCBN is a good indicator of shorter LOS or is DCBN an arbitrary indicator.”5 The answer may be yes, no, both, maybe, and it depends. Certainly, no pathophysiological reasons exist for a certain time of day to be the “right” time for discharge. The key question for hospitalists and health systems leaders is whether setting time goals leads clinicians to delay discharges of medically and logistically ready patients in the afternoon or evening, particularly if the metric is linked to monetary performance incentives. This is also likely a matter of degrees, ie, set the DCBN goal at 80%-100% and gaming is much more likely; set the goal at 20%-30% and this might reflect a realistic range and be less likely to incentivize gaming. Notably, the hospital in the James study did not have a DCBN goal. It would be interesting to see what would happen in that hospital or another hospital before and after implementing a DCBN goal—and further assess a dose-response curve. Another approach would be to perform qualitative analysis of readiness for discharge via chart reviews and determine if patients could have left in the afternoon or evening but might have been delayed to buff up the performance on the DCBN metric.
James et al. additionally demonstrate differences for medical and surgical patients, underscoring that a DCBN goal is unlikely to yield the same results in different patient cohorts or settings. The authors note several workflow reasons for this variation, but other considerations are regularity of timelines for recovery being different for surgical patients, role of elective admissions scheduled in advance, and the potential use of conditional orders (ie, orders entered before dawn that nurses can activate as patients meet criteria).
Much as we have adopted cultural changes over the years to raise awareness regarding patient safety such as nosocomial infections and hand hygiene, an emphasis on high-quality discharges too needs to become integral to hospital practices to sustain performance and any associated metrics. As to what to measure? A validated “medical readiness to discharge” may be the gold standard but may be difficult to attain. Until then, carefully constructed approaches to prioritizing early discharges through proactive planning, shared mental models, interdisciplinary teamwork, and appropriate incentives to those who do it well could yield the results we want as hospitalists, as patients, and as families.
Disclosures
Dr. Kane and Dr. Fieldston have nothing to disclose.
1. Iantorno S, Fieldston E. Hospitals are not hotels: high-quality discharges occur around the clock. JAMA Pediatr. 2013;167(7):596-597. doi: 10.1001/jamapediatrics.2013.2252. PubMed
2. Destino L BD, Acuna C, Asch S, Platchek T. Improving patient flow: analysis of an initiative to improve early discharge. J Hosp Med. 2019;14(1):22-27. doi: 10.12788/JHM.3133.
3. Lorch SA, Millman AM, Zhang X, et.al. Impact of admission-day crowding on the length of stay of pediatric hospitalizations. Pediatrics. 2008;121(4):e718-e730. doi: 10.1542/peds.2007-1280. PubMed
4. Haferbecker D, Fakeye O, Medina SP, Fieldston ES. Perceptions of educational experience and inpatient workload among pediatric residents. Hosp Pediatri. 2013;3(3):276-284. doi: 10.1542/hpeds.2012-0068. PubMed
5. James H, Steiner MJ, Holmes GM, Stephens JR. The association of discharge before noon and length of stay in hospitalized pediatric patients. J Hosp Med. 2019:14(1):28-32. doi: 10.12788/jhm.3111.
6. White CM, Statile AM, White DL, et al. Using quality improvement to optimize paediatric discharge efficiency. BMJ Qual Saf. 2014;23(5):428-436. doi: 10.1136/bmjqs-2013-002556.
© 2019 Society of Hospital Medicine
Predicting the Future: Using Simulation Modeling to Forecast Patient Flow on General Medicine Units
Hospitals are complex adaptive systems within which practitioners, technology, physical resources, and other components adapt interdependently to attempt to best meet the needs of patients.1 Hospitals must provide a stable, dependable level of care while also surging to respond to times of high demand, such as patient emergencies or swells in patient volume. Given the critical and resource-intensive nature of this work, optimizing the system is essential; however, because of the complexity of the system, making changes can result in unexpected and possibly deleterious effects. We need to approach change in hospital processes carefully and thoughtfully.
The Institute of Medicine, the National Academy of Engineering, and the President’s Council of Advisors on Science and Technology have recommended the application of systems engineering approaches to improve health care delivery.2,3 Systems engineering seeks to coordinate, synchronize, and integrate complex systems of people, information, materials, technology, and financial resources.4,5 To determine how complex systems can be improved, engineers apply analytic methods to describe how such systems operate and what the impact of changes might be. These methodologies have improved patient care and reduced costs at several hospitals.6 For example, a decision support system that combined simulation, optimization, and machine learning methods in an emergency department (ED) resulted in a 33% reduction in length of stay (LOS) and a 28% decrease in ED readmissions.7 Other strategies to improve patient flow include shaping demand (decreasing variation in surgical scheduling, relocating low acuity care ED visit to primary care, etc.), redesigning systems (early discharges, improving efficiency, and coordination of hospital discharge process, decreasing care variation, etc.), or aligning capacity and demand. Another approach, real-time demand capacity (RTDC), is based on management principles and queuing and constraint theory and has been implemented successfully in a variety of health care organizations. RTDC represents a promising approach to improve hospitalwide patient flow and can be integrated into current bed management processes.8 Unfortunately, many of these approaches are not well known to clinicians and would benefit from greater awareness and input from healthcare practitioners.
One systems engineering tool that can be used to describe, analyze, and evaluate proposed changes in care is simulation.9 Simulation creates a model within which what-if scenarios (ie, adjusting various inputs into the simulation) allow researchers to define the likelihood of consequences from various courses of action and determine the optimal change to a system. Such analyses can predict the impact of a proposed change on patients and healthcare practitioners.10-13
A critical concern for hospitals that simulation may help address is managing the volume of inpatients. A high inpatient census is necessary for financial solvency, yet too high a census of inpatients or an unexpected surge in acuity can overwhelm hospital resources. Many hospitals, pressured by growing numbers of increasingly complex patients, have seen medical inpatients spread across multiple nonmedical nursing units (NUs) of their institution such that a particular medical team may have only a couple patients assigned to each nursing unit.14 This dispersion may hinder communication between physicians and nurses and limits the time physicians have to interact with patients.15 Additionally, coordination of care may become more challenging for discharge planning.16 Aligning medical teams with NUs may benefit the quality and efficiency of care or may create a barrier to patient flow, which worsens these problems.15,17 Alternatively, hospitals might meet the increasing demands for care by choosing to add capacity by opening new NUs or hiring additional healthcare providers.
This article describes the application of simulation to model the interconnected variables and subsequent future states created by several possible
METHODS
Setting and Present State
Virginia Commonwealth University (VCU) is a 865-bed tertiary academic medical center, with inpatient care activities spread between four connected buildings and 50 different NUs. The occupancy rate had been over 92% during the time period of this project with admission volume limited primarily by the capacity of the facility. Three of the NUs were primarily allocated to general medicine (GIM) patients. However, over the years, GIM inpatients grew to over 7500 admissions annually, resulting in nearly 50% of GIM patients being admitted to a non-GIM nursing unit.
Additionally, patients on each medical team had a high degree of spread across NUs due to several factors. Admissions and discharges from the hospital did not align across the day. While discharges clumped in the late afternoon, admission occurred throughout the day with a surge in the later afternoon. This mismatch frequently led to patients waiting in the ED for a bed, medical team, or both, and patients were typically assigned to the first available bed and team. For medical team assignments, newly admitted patients were distributed relatively equally across five hospitalist teams and five housestaff teams (that include residents, interns, and medical students). This steady distribution of patients through the day supported meeting housestaff work-hour restrictions of 80 hours each week.18 Yet, as a result of the high occupancy rate, the patterns of patient admissions and discharges, and the distribution of patients among medical teams and across NUs, medical teams and NUs rarely shared more than a few patients.
Leaders at our institution outlined several possible options to address these challenges, including aligning medical teams with NU, adding an additional hospitalist team, or adding an additional nursing unit. In addition, institutional leaders were concerned about the impact of continued growth in admission volume and the impact of patient dispersion on trainees and students. The overall goal of creating a simulation model was to determine the impact of an increased volume of patients and these possible strategic decisions on operational metrics, including number of patients waiting in the ED, ED boarding time per patient, time in system per patient (ED boarding time plus inpatient LOS), team utilization, and rounding travel time.
Simulation Modeling
To model the impact of some possible system changes on patient care, we applied Kelton and Law’s simulation study framework,19 including data collection; model building and validation; and what-if scenario testing (Figure 1).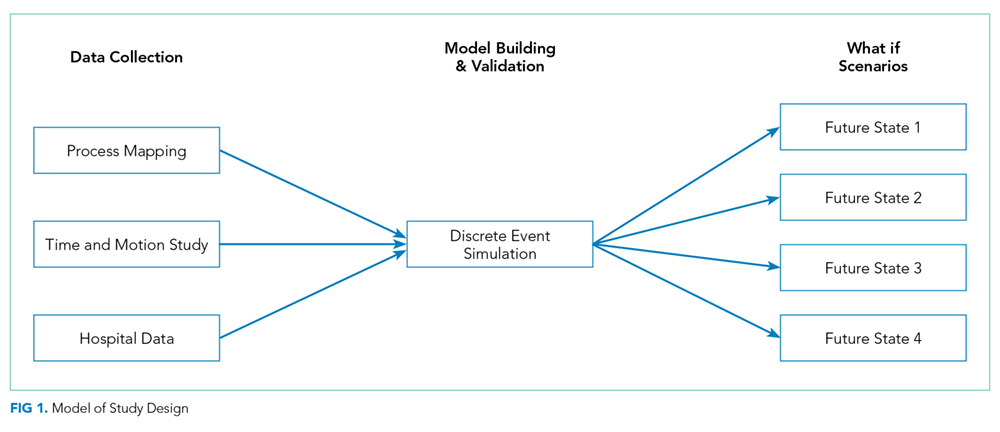
Data Collection
Process Flow Map
We created a complex process flow map of patient care activities on medical teams. The map was developed by four general medicine physicians (R.C., H.M., V.M., and S.P.T.) who all provided medical care on the hospital-based services and ensured expert input on the patient care activities captured by the simulation modeling.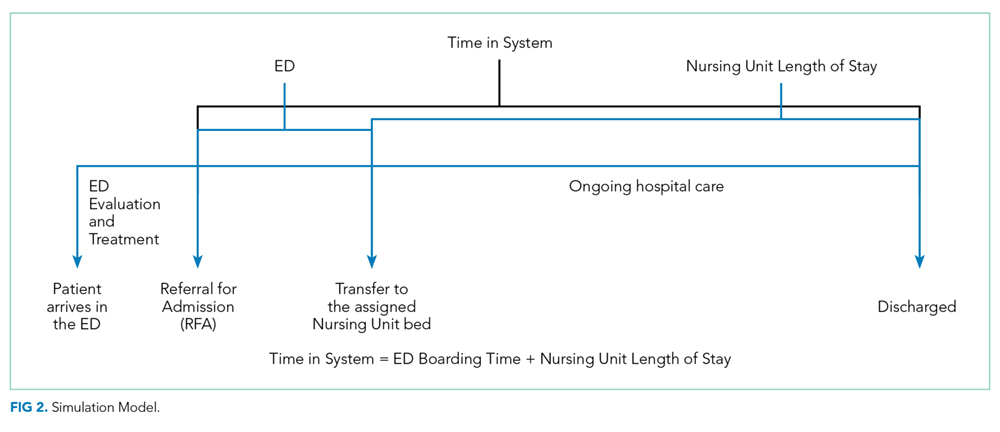
Time and Motion Studies
Time and motion study is a well-established technique used to evaluate the efficiency of work processes.20,21 Originally applied to increase productivity in manufacturing, this technique uses first-hand observations to measure the time allotted to different work tasks to systematically analyze workflow.22 Workflow in healthcare, like manufacturing tasks, tends to have a repetitive pattern, making time and motion studies a highly applicable tool.
A research assistant observed a total of 30 hospitalist work cycles to describe the work of our inpatient clinicians. A work cycle, defined as one complete process flow,23 began when the hospitalist started a daytime shift of patient care and concluded after the physician “signed out” to the physician who was assuming responsibility for ongoing medical care of the patients (ie, cross-coverage). Time spent on different activities identified by the process flow map was captured throughout the cycle. These activities included time spent traveling to evaluate patients located on different NUs. To minimize disruptions in patient care and adhere to privacy standards, no observations were conducted in patient rooms, and details of computer work were not recorded. To ensure stable estimates of the mean and standard deviation of the time spent at each step, at least 30 cycles of observation are recommended. Thus, 300 hours of observations over the course of 30 separate days were collected.
Hospital Data
We extracted admission and discharge data from the electronic health records (EHR) for general medicine patients admitted from the ED for the calendar year 2013. These records were used to establish means and standard deviations for admission date and time, distribution of patients across NUs, and LOS.
Model Building and Internal Validation
On the basis of these data inputs and using SIMIO® Simulation Software version 7, we constructed a discrete event simulation (DES) model representing the patient care activities of general medicine teams. Each patient was assigned a bed on a nursing unit through a probability distribution based on prior EHR data and then randomly assigned to a general medicine team. We replicated the model 200 times, and each model ran for 365 days. Each team was limited to 16 assigned patients, the maximum number of patients per housestaff team allowed by VCU protocol; henceforth, this number is referred to as team-patient capacity. The model assumed patients remained on the assigned nursing unit and medical team for the entirety of their hospital stay and that each patient was seen by their assigned medical team every day. The results of the present state model, including mean number of patients on each nursing unit, mean team census, patient dispersion (ie, the number of NUs on which each medical team had patients), and team utilization (ie, mean team census divided by team patient capacity), were compared with actual data from 2013 to internally validate the model.
What-If Scenario Testing
We constructed four what-if scenarios based on possible strategic directions identified by leadership. These models evaluated:
- constraining patients on housestaff (but not hospitalist) teams to the three general medicine NUs (Future State 1),
- increasing bed capacity for general medicine patients by adding one additional nursing unit of 26 beds (Future State 2),
- increasing the number of general medicine teams by adding one additional hospitalist team of up to 16 patients (Future State 3),
- modeling the impact of increased patient admissions from 21 per day to 25 per day while also adding a nursing unit and an additional medical team (Future State 4).
For Future States 1-3, admission volume was held constant. The model generated nursing unit LOS using a random continuous exponential probability distribution with a mean of 133 hours to match the LOS distribution derived from health system data. As patients entered the system for admission, the model assigned a bed to the patient, but the patient could not move to the assigned bed until a bed and care team were both available. We were only interested in the steady-state behavior of the system, so collecting performance statistics only after the model had been populated and steady state had been achieved was important.
Table 1 summarizes the input data, fixed, and dynamic variable for each future state model.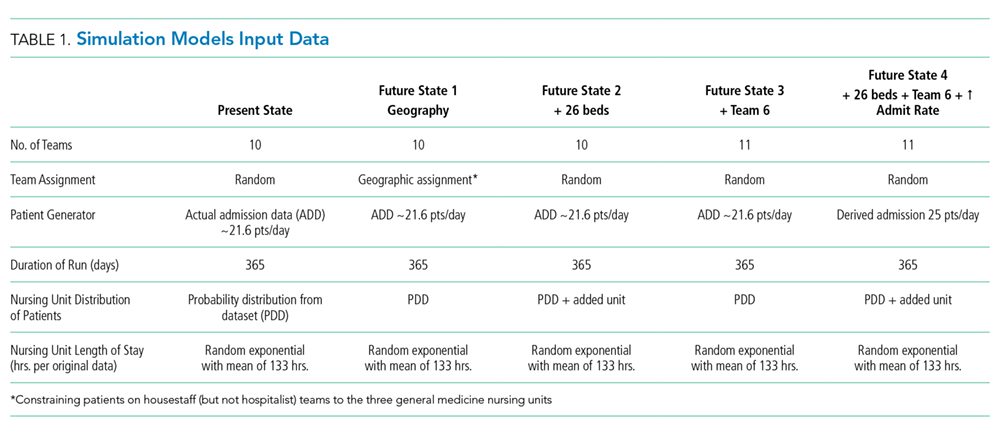
We examined the impact of these scenarios on the following variables (Table 2): (1) average time in system; (2) average number of patients waiting for a bed; (3) average ED boarding time; (4) total daily general medicine census; (5) average housestaff team census per team; (6) average hospitalist team census per team; (7) average combined housestaff and hospitalist team census per team; (8) average housestaff team utilization (ie, mean team census divided by team patient capacity of 16); (9) average hospitalist team utilization (ie, mean team census divided by team patient capacity of 16); (10) average nursing unit utilization (ie, mean nursing unit census divided by maximum number of patients that can be cared for on each nursing unit); (11) patient dispersion to NUs (ie, average number of NUs on which each general medicine team has patients); 12) estimated average rounding time per general medicine team.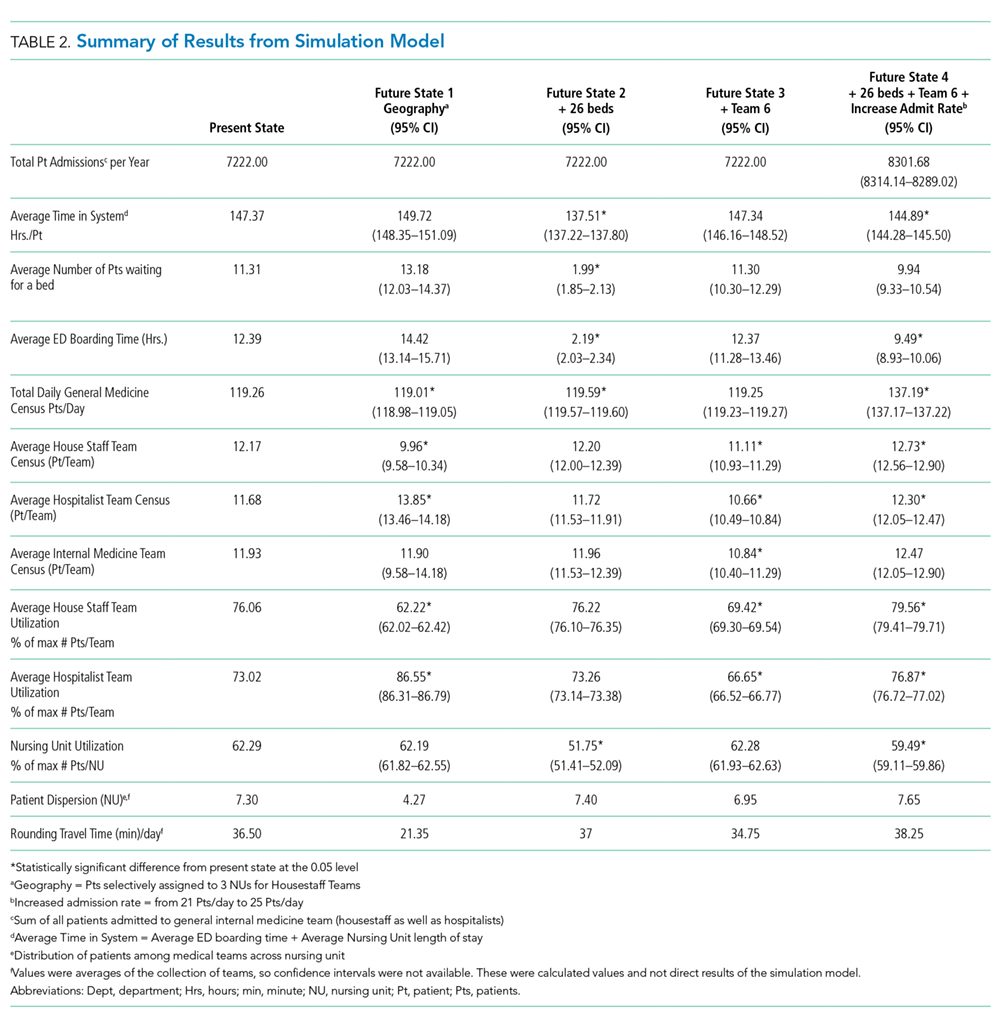
Of note, the average time in the system included time patients spent waiting for bed and team assignments (ED boarding time) in addition to the time they spent in the assigned nursing unit (nursing LOS). The difference between the nursing LOS (ie, time on the nursing unit) and total time in the system is one indicator of system efficiency around hospital admission.
The Institutional Review Board of Virginia Commonwealth University approved this study.
RESULTS
Time and Motion Data
The mean time spent with each patient was nine minutes. The mean time traveling between NUs Healthcare Quality for Children and Adolescents with Suicidality Admitted to Acute Care Hospitals in the United States was five minutes. Average rounding time was noted to be two hours, 53 minutes. Thirty-seven minutes, about ~21% of the time, was wasted in traveling. Each team, on average, traveled to seven different NUs to round on their daily census, averaging 1.6 patients in each nursing unit.
Hospital Data
Between January 1, 2011 to December 31, 2013, a total of 7,902 patients were admitted to the general medicine teams, spanning 23 NU. The average number of admissions per day was 21.6, and the average nursing unit LOS was 133 hours. Average team census was derived from historical data across all GIM team for 2013 and was noted to be 11.5 patients per team, and these patients were spread over seven NU.
Model Validation
The mean number of patients admitted to different NUs was estimated from the simulation model then compared with the EHR data from 2013. None were statistically different (P > .05), which signified that the validated simulation model is similar to the EHR data from 2013 despite the underlying assumptions.
Model Outputs
Analysis of the models indicated that steady-state (based upon hospital census) was realized at approximately 800 hours or after 680 patients were admitted to the GIM teams. Statistics collection, therefore, was started after 800 hours of simulated time and reflected the admission of the remaining 7222 patients in the model validation sample (Table 2).
In the model, the total daily general medicine patient census was 119.26. Average time in the system per patient was noted to be 147.37 hours, which was 14.37 hours more than the average nursing unit LOS of 133 hours. Average number of patients waiting for a bed was noted to be 11.31, while the average wait time for a patient to get a bed was 12.39 hours.
Average housestaff team and hospitalist team utilization were 76.06% and 73.02%, respectively, with average team utilization of 74.54% (range: 72.88%-76.19%). Housestaff team and hospitalist team averaged 12.17 and 11.68 patients per care team, respectively. General medicine teams had patients on 7.30 NUs on average. GIM teams rounding travel time was 36.5 minutes.
What-If Scenario Testing
Simulation outputs for the four future states are summarized in Table 2. With Future State 1, through which patients were selectively assigned to housestaff teams aligned with three NUs, the average time in the system per patient increased by 2.35 hours, with 1.87 more patients waiting for a bed and waiting for 2.03 more hours as compared with the present state. A marked disparity was observed in hospitalist and housestaff team utilization of 62.22% and 86.55% respectively. Patient dispersion to various NUs significantly decreased, and rounding time correspondingly decreased by approximately 41%.
Future State 2, adding a nursing unit, decreased average time in the system per patient by 9.86 hours, with 9.32 fewer patients waiting for a bed as compared with the present state. A slight increase in patient dispersion and rounding time was observed. Overall, patients spent 137.51 hours in the system, which demonstrated improved efficiency of the system.
Future State 3, adding an additional medical team, interestingly did not have a significant effect on patients’ average time in system or the number of patients waiting for a bed even though a decrease occurred in average team census, team utilization, and patient dispersion.
Finally, Future State 4, increasing admissions while also adding a nursing unit and a hospitalist team, resulted in an increase in admission volume while maintaining similar utilization rates for teams and NU. Patients spent about 2.48 hours less in the system, while only 9.94 patients were noted to be waiting for a bed as compared with 11.21 patients in the present state model. The total daily general medicine patient census was noted to be 137.19. Average team census and average team utilization were noted to be similar to those of the present state model, while admissions were up by approximately 1,080 per year. Both patient dispersion and rounding were slightly worsened.
Sensitivity Analysis
Overall, average time in system was most affected by the number of patient arrivals. This became particularly significant as the volume of patient arrivals approached and exceeded the capacity of the rounding teams. Adding a nursing unit had more impact on decreasing average time in the system than adding a medical team or aligning teams with NUs under the conditions defined by the model. However, under different conditions, such as increasing admission volume, the relative benefit of different approaches may vary.
DISCUSSION
Given that hospitals are large, complex systems,2 the impact of system-level changes can have unpredictable and potentially deleterious effects. Simulation provides a technique for modeling the impact of changes to understand the ramifications of these interventions more thoroughly.3 In this study, we describe the process of building a simulation model for the admission and discharge of patients from general medicine services in a tertiary care hospital, internally validating this model, and examining the outcomes from several potential changes to the system.
The outcomes for these what-if scenarios provided some important insights about the secondary effect of system changes and the need for multiple, simultaneous interventions. Given that hospitals often function at near capacity, adding a hospitalist team or nursing unit might be seen as a reasonable strategy to improve the system metrics, number of patient discharges, or average LOS. On the basis of our analysis, adding a nursing unit would have more benefit than adding a hospitalist team. Leaders who want to increase capacity may need to consider both adding a hospitalist team and a nursing unit, and model the impact of each choice as described with a simulation.
Additionally, assigning patients to medical teams aligned with NUs seems theoretically appealing to improve interprofessional communication and decrease the time spent in transit between patients by physicians. While our findings supported a decrease in rounding time and patient dispersion, the teams not aligned with a nursing unit (ie, the hospitalists) exceeded 80% utilization, the threshold at which efficiency is known to decrease.24 Potentially, benefits resulting from teams being aligned with NUs were offset by decrements in performance of the teams not aligned with NU. If medical teams and NUs become aligned, then a higher number of teams may be necessary to maintain patient throughput.
Simulation models identify these unexpected consequences prior to investing resources in a significant change; however, modeling is not simple. Simulation models depend on the characteristics of the model and the quality of the input data. For example, we used an expert approach to map physician workflow as an underpinning of the model, but we may have missed an important variation in physician workflow. Understanding this variation could strengthen the model and provide some testable variables for future study. Likewise, understanding nursing workflow and how variation in physician workflow shapes nursing workflow, and vice versa, is worth exploring.
Other data could also be added to, and help interpret, the outputs of this model. For example, the impact of various levels of team and unit utilization on diversion time for the hospital ED may help determine whether adding team capacity or unit capacity is more beneficial for the system. Likewise, aligning medical teams with NUs seems to hinder patient throughput on this analysis, but benefits in patient satisfaction or decreased readmissions might improve reimbursement and outweigh the revenue lost from throughput. Underpinning each of these types of decisions is a need to model the system well and thoughtfully choose the inputs, processes, and outputs. Pursuing a new strategic decision usually involves cost; simulation modeling provides data to help leaders weigh the benefits in terms of the needed investment.
The major limitations of the study stem from these choices. Our study focused on matching capacity and demand while limiting other changes in the system, such as changes in nursing unit LOS. Future work to quantify the relationship of other variables on parameters, such as the impact of decreased team dispersion on LOS, early discharges, and decreasing care variation, would make future models more robust. This model does not consider other strategies to improve patient flow, such as shaping demand, adaptive team assignment algorithms, or creating surge capacity. We also used only hospitalist time and motion data in our model; housestaff workflow is likely different. In addition, we modeled all patients as having a general level of nursing care and did not account for admissions or transfers to intensive care units or other services. These parameters could be added in future iterations. Finally, the biggest limitation in any simulation is the underlying assumptions made to construct the model. While we validated the model retrospectively, prospective validation and refinement should also be performed with attention to how the model functions under extreme conditions, such as a very high patient load.
CONCLUSION
Major system changes are expensive and must be made carefully. Systems engineering techniques, such as DES, provide techniques to estimate the impact of changes on pertinent care delivery variables. Results from this study underscore the complexity of patient care delivery and how simulation models can integrate multiple system components to provide a data-driven approach to inform decision making in a complex system.
Acknowledgments
The simulation software used in this study was awarded as an educational software grant from SIMIO®. We would like to acknowledge support from the Department of Internal Medicine at Virginia Commonwealth University for this project and thank Lena Rivera for her assistance with the manuscript preparation.
Dislosures
Dr. Heim recived a consulting fee for programming guidance from Virginia Commonwealth University. All other authors have nothing to disclose.
1. James BC. Learning opportunities for health care. In: Grossmann C, Goolsby WA, Olsen LA, McGinnis JM, eds. Engineering a Learning Healthcare System: A Look at the Future: Workshop Summary. Washington, DC: National Academies Press; 2011:31-46. PubMed
2. Reid PP, Compton WD, Grossman J, Fanjiang G. Building a Better Delivery System: A New Engineering/Health Care Partnership. Washington, DC: National Academy of Engineering and Institute of Medicine, National Academies Press; 2005. PubMed
3. President’s Council of Advisors on Science and Technology (US). Report to the President, better health care and lower costs: accelerating improvement through systems engineering. Washington, DC; 2014.
4. Kossiakoff A, Sweet W. Systems Engineering Principles and Practice. New York: Wiley; 2003.
5. Kopach-Konrad R, Lawley M, Criswell M, et al. Applying systems engineering principles in improving health care delivery. J Gen Intern Med. 2007;22(Suppl 3):431-437. doi: 10.1007/s11606-007-0292-3. PubMed
6. Weed J. Factory efficiency comes to the hospital. The New York Times; July 9, 2010.
7. Lee EK, Atallah HY, Wright MD, et al. Transforming hospital emergency department workflow and patient care. Interfaces. 2015;45(1):58-82. doi: 10.1287/inte.2014.0788.
8. Resar R, Nolan K, Kaczynski D, Jensen K. Using real-time demand capacity management to improve hospitalwide patient flow. Joint Comm J Qual Patient Saf. 2011;37(5):217-227. doi: 10.1016/S1553-7250(11)37029-8. PubMed
9. McJoynt TA, Hirzallah MA, Satele DV et al. Building a protocol expressway: the case of Mayo Clinic Cancer Center. J Clin Oncol. 2009;27(23):3855-3860. doi: 10.1200/JCO.2008.21.4338. PubMed
10. Blanchard BS, Fabrycky WJ. Systems Engineering and Analysis. 5th ed. Englewood Cliffs: Prentice Hall; 2010.
11. Segev D, Levi R, Dunn PF, Sandberg WS. Modeling the impact of changing patient transportation systems on peri-operative process performance in a large hospital: insights from a computer simulation study. Health Care Manag Sci. 2012;15(2):155-169. doi: 10.1007/s10729-012-9191-1. PubMed
12. Schoenmeyr T, Dunn PF, Gamarnik D, et al. A model for understanding the impacts of demand and capacity on waiting time to enter a congested recovery room. Anesthesiology. 2009;110(6):1293-1304. doi: 10.1097/ALN.0b013e3181a16983 PubMed
13. Levin SR, Dittus R, Aronsky D, et al. Optimizing cardiology capacity to reduce emergency department boarding: a systems engineering approach. Am Heart J. 2008;156(6):1202-1209. doi: 10.1016/j.ahj.2008.07.007. PubMed
14. Bryson C, Boynton G, Stepczynski A, et al. Geographical assignment of hospitalists in an urban teaching hospital: feasibility and impact on efficiency and provider satisfaction. Hosp Pract. 2017;45(4):135-142. doi: 10.1080/21548331.2017.1353884. PubMed
15. Artenstein AW, Higgins TL, Seiler A, et al. Promoting high value inpatient care via a coaching model of structured, interdisciplinary team rounds. Br J Hosp Med (Lond). 2015;76(1):41-45. doi: 10.12968/hmed.2015.76.1.41. PubMed
16. O’Leary KJ, Wayne DB, Landler MP, et al. Impact of localizing physicians to hospital units on nurse-physician communication and agreement on the plan of care. J Gen Intern Med. 2009;24(11):1223-1227. doi: 10.1007/s11606-009-1113-7. PubMed
17. Dunn AS, Reyna M, Radbill B, et al. The impact of bedside interdisciplinary rounds on length of stay and complications. J Hosp Med. 2017;12(3):137-142. doi: 10.12788/jhm.2695. PubMed
18. Accreditation Council for Graduate Medical Education. Common program requirements. Chicago, IL; 2011.
19. Eldabi T, Irani Z, Paul RJ. A proposed approach for modelling health-care systems for understanding. J Manag Med. 2002;16(2-3):170-187. PubMed
20. Block L, Habicht R, Wu AW, et al. In the wake of the 2003 and 2011 duty hours regulations, how do internal medicine interns spend their time? J Gen Intern Med. 2013;28(8):1042-1047. doi: 10.1007/s11606-013-2376-6. PubMed
21. Tipping MD, Forth VE, Magill DB, Englert K, Williams MV. Systematic review of time studies evaluating physicians in the hospital setting. J Hosp Med. 2010;5(6):353-359. doi: 10.1002/jhm.647. PubMed
22. Cady R, Finkelstein S, Lindgren B, et al. Exploring the translational impact of a home telemonitoring intervention using time-motion study. Telemed J e Health. 2010;16(5):576-584. doi: 10.1089/tmj.2009.0148. PubMed
23. Rother M, Shook J. Learning to See: Value Stream Mapping to Add Value and Eliminate Muda. Cambridge, MA: Lean Enterprise Institute, Inc; 2009.
24. Terwiesch C, Diwas KC, Kahn JM. Working with capacity limitations: operations management in critical care. Crit Care. 2011;15(4):308. doi: 10.1186/cc10217. PubMed
Hospitals are complex adaptive systems within which practitioners, technology, physical resources, and other components adapt interdependently to attempt to best meet the needs of patients.1 Hospitals must provide a stable, dependable level of care while also surging to respond to times of high demand, such as patient emergencies or swells in patient volume. Given the critical and resource-intensive nature of this work, optimizing the system is essential; however, because of the complexity of the system, making changes can result in unexpected and possibly deleterious effects. We need to approach change in hospital processes carefully and thoughtfully.
The Institute of Medicine, the National Academy of Engineering, and the President’s Council of Advisors on Science and Technology have recommended the application of systems engineering approaches to improve health care delivery.2,3 Systems engineering seeks to coordinate, synchronize, and integrate complex systems of people, information, materials, technology, and financial resources.4,5 To determine how complex systems can be improved, engineers apply analytic methods to describe how such systems operate and what the impact of changes might be. These methodologies have improved patient care and reduced costs at several hospitals.6 For example, a decision support system that combined simulation, optimization, and machine learning methods in an emergency department (ED) resulted in a 33% reduction in length of stay (LOS) and a 28% decrease in ED readmissions.7 Other strategies to improve patient flow include shaping demand (decreasing variation in surgical scheduling, relocating low acuity care ED visit to primary care, etc.), redesigning systems (early discharges, improving efficiency, and coordination of hospital discharge process, decreasing care variation, etc.), or aligning capacity and demand. Another approach, real-time demand capacity (RTDC), is based on management principles and queuing and constraint theory and has been implemented successfully in a variety of health care organizations. RTDC represents a promising approach to improve hospitalwide patient flow and can be integrated into current bed management processes.8 Unfortunately, many of these approaches are not well known to clinicians and would benefit from greater awareness and input from healthcare practitioners.
One systems engineering tool that can be used to describe, analyze, and evaluate proposed changes in care is simulation.9 Simulation creates a model within which what-if scenarios (ie, adjusting various inputs into the simulation) allow researchers to define the likelihood of consequences from various courses of action and determine the optimal change to a system. Such analyses can predict the impact of a proposed change on patients and healthcare practitioners.10-13
A critical concern for hospitals that simulation may help address is managing the volume of inpatients. A high inpatient census is necessary for financial solvency, yet too high a census of inpatients or an unexpected surge in acuity can overwhelm hospital resources. Many hospitals, pressured by growing numbers of increasingly complex patients, have seen medical inpatients spread across multiple nonmedical nursing units (NUs) of their institution such that a particular medical team may have only a couple patients assigned to each nursing unit.14 This dispersion may hinder communication between physicians and nurses and limits the time physicians have to interact with patients.15 Additionally, coordination of care may become more challenging for discharge planning.16 Aligning medical teams with NUs may benefit the quality and efficiency of care or may create a barrier to patient flow, which worsens these problems.15,17 Alternatively, hospitals might meet the increasing demands for care by choosing to add capacity by opening new NUs or hiring additional healthcare providers.
This article describes the application of simulation to model the interconnected variables and subsequent future states created by several possible
METHODS
Setting and Present State
Virginia Commonwealth University (VCU) is a 865-bed tertiary academic medical center, with inpatient care activities spread between four connected buildings and 50 different NUs. The occupancy rate had been over 92% during the time period of this project with admission volume limited primarily by the capacity of the facility. Three of the NUs were primarily allocated to general medicine (GIM) patients. However, over the years, GIM inpatients grew to over 7500 admissions annually, resulting in nearly 50% of GIM patients being admitted to a non-GIM nursing unit.
Additionally, patients on each medical team had a high degree of spread across NUs due to several factors. Admissions and discharges from the hospital did not align across the day. While discharges clumped in the late afternoon, admission occurred throughout the day with a surge in the later afternoon. This mismatch frequently led to patients waiting in the ED for a bed, medical team, or both, and patients were typically assigned to the first available bed and team. For medical team assignments, newly admitted patients were distributed relatively equally across five hospitalist teams and five housestaff teams (that include residents, interns, and medical students). This steady distribution of patients through the day supported meeting housestaff work-hour restrictions of 80 hours each week.18 Yet, as a result of the high occupancy rate, the patterns of patient admissions and discharges, and the distribution of patients among medical teams and across NUs, medical teams and NUs rarely shared more than a few patients.
Leaders at our institution outlined several possible options to address these challenges, including aligning medical teams with NU, adding an additional hospitalist team, or adding an additional nursing unit. In addition, institutional leaders were concerned about the impact of continued growth in admission volume and the impact of patient dispersion on trainees and students. The overall goal of creating a simulation model was to determine the impact of an increased volume of patients and these possible strategic decisions on operational metrics, including number of patients waiting in the ED, ED boarding time per patient, time in system per patient (ED boarding time plus inpatient LOS), team utilization, and rounding travel time.
Simulation Modeling
To model the impact of some possible system changes on patient care, we applied Kelton and Law’s simulation study framework,19 including data collection; model building and validation; and what-if scenario testing (Figure 1).
Data Collection
Process Flow Map
We created a complex process flow map of patient care activities on medical teams. The map was developed by four general medicine physicians (R.C., H.M., V.M., and S.P.T.) who all provided medical care on the hospital-based services and ensured expert input on the patient care activities captured by the simulation modeling.
Time and Motion Studies
Time and motion study is a well-established technique used to evaluate the efficiency of work processes.20,21 Originally applied to increase productivity in manufacturing, this technique uses first-hand observations to measure the time allotted to different work tasks to systematically analyze workflow.22 Workflow in healthcare, like manufacturing tasks, tends to have a repetitive pattern, making time and motion studies a highly applicable tool.
A research assistant observed a total of 30 hospitalist work cycles to describe the work of our inpatient clinicians. A work cycle, defined as one complete process flow,23 began when the hospitalist started a daytime shift of patient care and concluded after the physician “signed out” to the physician who was assuming responsibility for ongoing medical care of the patients (ie, cross-coverage). Time spent on different activities identified by the process flow map was captured throughout the cycle. These activities included time spent traveling to evaluate patients located on different NUs. To minimize disruptions in patient care and adhere to privacy standards, no observations were conducted in patient rooms, and details of computer work were not recorded. To ensure stable estimates of the mean and standard deviation of the time spent at each step, at least 30 cycles of observation are recommended. Thus, 300 hours of observations over the course of 30 separate days were collected.
Hospital Data
We extracted admission and discharge data from the electronic health records (EHR) for general medicine patients admitted from the ED for the calendar year 2013. These records were used to establish means and standard deviations for admission date and time, distribution of patients across NUs, and LOS.
Model Building and Internal Validation
On the basis of these data inputs and using SIMIO® Simulation Software version 7, we constructed a discrete event simulation (DES) model representing the patient care activities of general medicine teams. Each patient was assigned a bed on a nursing unit through a probability distribution based on prior EHR data and then randomly assigned to a general medicine team. We replicated the model 200 times, and each model ran for 365 days. Each team was limited to 16 assigned patients, the maximum number of patients per housestaff team allowed by VCU protocol; henceforth, this number is referred to as team-patient capacity. The model assumed patients remained on the assigned nursing unit and medical team for the entirety of their hospital stay and that each patient was seen by their assigned medical team every day. The results of the present state model, including mean number of patients on each nursing unit, mean team census, patient dispersion (ie, the number of NUs on which each medical team had patients), and team utilization (ie, mean team census divided by team patient capacity), were compared with actual data from 2013 to internally validate the model.
What-If Scenario Testing
We constructed four what-if scenarios based on possible strategic directions identified by leadership. These models evaluated:
- constraining patients on housestaff (but not hospitalist) teams to the three general medicine NUs (Future State 1),
- increasing bed capacity for general medicine patients by adding one additional nursing unit of 26 beds (Future State 2),
- increasing the number of general medicine teams by adding one additional hospitalist team of up to 16 patients (Future State 3),
- modeling the impact of increased patient admissions from 21 per day to 25 per day while also adding a nursing unit and an additional medical team (Future State 4).
For Future States 1-3, admission volume was held constant. The model generated nursing unit LOS using a random continuous exponential probability distribution with a mean of 133 hours to match the LOS distribution derived from health system data. As patients entered the system for admission, the model assigned a bed to the patient, but the patient could not move to the assigned bed until a bed and care team were both available. We were only interested in the steady-state behavior of the system, so collecting performance statistics only after the model had been populated and steady state had been achieved was important.
Table 1 summarizes the input data, fixed, and dynamic variable for each future state model.
We examined the impact of these scenarios on the following variables (Table 2): (1) average time in system; (2) average number of patients waiting for a bed; (3) average ED boarding time; (4) total daily general medicine census; (5) average housestaff team census per team; (6) average hospitalist team census per team; (7) average combined housestaff and hospitalist team census per team; (8) average housestaff team utilization (ie, mean team census divided by team patient capacity of 16); (9) average hospitalist team utilization (ie, mean team census divided by team patient capacity of 16); (10) average nursing unit utilization (ie, mean nursing unit census divided by maximum number of patients that can be cared for on each nursing unit); (11) patient dispersion to NUs (ie, average number of NUs on which each general medicine team has patients); 12) estimated average rounding time per general medicine team.
Of note, the average time in the system included time patients spent waiting for bed and team assignments (ED boarding time) in addition to the time they spent in the assigned nursing unit (nursing LOS). The difference between the nursing LOS (ie, time on the nursing unit) and total time in the system is one indicator of system efficiency around hospital admission.
The Institutional Review Board of Virginia Commonwealth University approved this study.
RESULTS
Time and Motion Data
The mean time spent with each patient was nine minutes. The mean time traveling between NUs Healthcare Quality for Children and Adolescents with Suicidality Admitted to Acute Care Hospitals in the United States was five minutes. Average rounding time was noted to be two hours, 53 minutes. Thirty-seven minutes, about ~21% of the time, was wasted in traveling. Each team, on average, traveled to seven different NUs to round on their daily census, averaging 1.6 patients in each nursing unit.
Hospital Data
Between January 1, 2011 to December 31, 2013, a total of 7,902 patients were admitted to the general medicine teams, spanning 23 NU. The average number of admissions per day was 21.6, and the average nursing unit LOS was 133 hours. Average team census was derived from historical data across all GIM team for 2013 and was noted to be 11.5 patients per team, and these patients were spread over seven NU.
Model Validation
The mean number of patients admitted to different NUs was estimated from the simulation model then compared with the EHR data from 2013. None were statistically different (P > .05), which signified that the validated simulation model is similar to the EHR data from 2013 despite the underlying assumptions.
Model Outputs
Analysis of the models indicated that steady-state (based upon hospital census) was realized at approximately 800 hours or after 680 patients were admitted to the GIM teams. Statistics collection, therefore, was started after 800 hours of simulated time and reflected the admission of the remaining 7222 patients in the model validation sample (Table 2).
In the model, the total daily general medicine patient census was 119.26. Average time in the system per patient was noted to be 147.37 hours, which was 14.37 hours more than the average nursing unit LOS of 133 hours. Average number of patients waiting for a bed was noted to be 11.31, while the average wait time for a patient to get a bed was 12.39 hours.
Average housestaff team and hospitalist team utilization were 76.06% and 73.02%, respectively, with average team utilization of 74.54% (range: 72.88%-76.19%). Housestaff team and hospitalist team averaged 12.17 and 11.68 patients per care team, respectively. General medicine teams had patients on 7.30 NUs on average. GIM teams rounding travel time was 36.5 minutes.
What-If Scenario Testing
Simulation outputs for the four future states are summarized in Table 2. With Future State 1, through which patients were selectively assigned to housestaff teams aligned with three NUs, the average time in the system per patient increased by 2.35 hours, with 1.87 more patients waiting for a bed and waiting for 2.03 more hours as compared with the present state. A marked disparity was observed in hospitalist and housestaff team utilization of 62.22% and 86.55% respectively. Patient dispersion to various NUs significantly decreased, and rounding time correspondingly decreased by approximately 41%.
Future State 2, adding a nursing unit, decreased average time in the system per patient by 9.86 hours, with 9.32 fewer patients waiting for a bed as compared with the present state. A slight increase in patient dispersion and rounding time was observed. Overall, patients spent 137.51 hours in the system, which demonstrated improved efficiency of the system.
Future State 3, adding an additional medical team, interestingly did not have a significant effect on patients’ average time in system or the number of patients waiting for a bed even though a decrease occurred in average team census, team utilization, and patient dispersion.
Finally, Future State 4, increasing admissions while also adding a nursing unit and a hospitalist team, resulted in an increase in admission volume while maintaining similar utilization rates for teams and NU. Patients spent about 2.48 hours less in the system, while only 9.94 patients were noted to be waiting for a bed as compared with 11.21 patients in the present state model. The total daily general medicine patient census was noted to be 137.19. Average team census and average team utilization were noted to be similar to those of the present state model, while admissions were up by approximately 1,080 per year. Both patient dispersion and rounding were slightly worsened.
Sensitivity Analysis
Overall, average time in system was most affected by the number of patient arrivals. This became particularly significant as the volume of patient arrivals approached and exceeded the capacity of the rounding teams. Adding a nursing unit had more impact on decreasing average time in the system than adding a medical team or aligning teams with NUs under the conditions defined by the model. However, under different conditions, such as increasing admission volume, the relative benefit of different approaches may vary.
DISCUSSION
Given that hospitals are large, complex systems,2 the impact of system-level changes can have unpredictable and potentially deleterious effects. Simulation provides a technique for modeling the impact of changes to understand the ramifications of these interventions more thoroughly.3 In this study, we describe the process of building a simulation model for the admission and discharge of patients from general medicine services in a tertiary care hospital, internally validating this model, and examining the outcomes from several potential changes to the system.
The outcomes for these what-if scenarios provided some important insights about the secondary effect of system changes and the need for multiple, simultaneous interventions. Given that hospitals often function at near capacity, adding a hospitalist team or nursing unit might be seen as a reasonable strategy to improve the system metrics, number of patient discharges, or average LOS. On the basis of our analysis, adding a nursing unit would have more benefit than adding a hospitalist team. Leaders who want to increase capacity may need to consider both adding a hospitalist team and a nursing unit, and model the impact of each choice as described with a simulation.
Additionally, assigning patients to medical teams aligned with NUs seems theoretically appealing to improve interprofessional communication and decrease the time spent in transit between patients by physicians. While our findings supported a decrease in rounding time and patient dispersion, the teams not aligned with a nursing unit (ie, the hospitalists) exceeded 80% utilization, the threshold at which efficiency is known to decrease.24 Potentially, benefits resulting from teams being aligned with NUs were offset by decrements in performance of the teams not aligned with NU. If medical teams and NUs become aligned, then a higher number of teams may be necessary to maintain patient throughput.
Simulation models identify these unexpected consequences prior to investing resources in a significant change; however, modeling is not simple. Simulation models depend on the characteristics of the model and the quality of the input data. For example, we used an expert approach to map physician workflow as an underpinning of the model, but we may have missed an important variation in physician workflow. Understanding this variation could strengthen the model and provide some testable variables for future study. Likewise, understanding nursing workflow and how variation in physician workflow shapes nursing workflow, and vice versa, is worth exploring.
Other data could also be added to, and help interpret, the outputs of this model. For example, the impact of various levels of team and unit utilization on diversion time for the hospital ED may help determine whether adding team capacity or unit capacity is more beneficial for the system. Likewise, aligning medical teams with NUs seems to hinder patient throughput on this analysis, but benefits in patient satisfaction or decreased readmissions might improve reimbursement and outweigh the revenue lost from throughput. Underpinning each of these types of decisions is a need to model the system well and thoughtfully choose the inputs, processes, and outputs. Pursuing a new strategic decision usually involves cost; simulation modeling provides data to help leaders weigh the benefits in terms of the needed investment.
The major limitations of the study stem from these choices. Our study focused on matching capacity and demand while limiting other changes in the system, such as changes in nursing unit LOS. Future work to quantify the relationship of other variables on parameters, such as the impact of decreased team dispersion on LOS, early discharges, and decreasing care variation, would make future models more robust. This model does not consider other strategies to improve patient flow, such as shaping demand, adaptive team assignment algorithms, or creating surge capacity. We also used only hospitalist time and motion data in our model; housestaff workflow is likely different. In addition, we modeled all patients as having a general level of nursing care and did not account for admissions or transfers to intensive care units or other services. These parameters could be added in future iterations. Finally, the biggest limitation in any simulation is the underlying assumptions made to construct the model. While we validated the model retrospectively, prospective validation and refinement should also be performed with attention to how the model functions under extreme conditions, such as a very high patient load.
CONCLUSION
Major system changes are expensive and must be made carefully. Systems engineering techniques, such as DES, provide techniques to estimate the impact of changes on pertinent care delivery variables. Results from this study underscore the complexity of patient care delivery and how simulation models can integrate multiple system components to provide a data-driven approach to inform decision making in a complex system.
Acknowledgments
The simulation software used in this study was awarded as an educational software grant from SIMIO®. We would like to acknowledge support from the Department of Internal Medicine at Virginia Commonwealth University for this project and thank Lena Rivera for her assistance with the manuscript preparation.
Dislosures
Dr. Heim recived a consulting fee for programming guidance from Virginia Commonwealth University. All other authors have nothing to disclose.
1. James BC. Learning opportunities for health care. In: Grossmann C, Goolsby WA, Olsen LA, McGinnis JM, eds. Engineering a Learning Healthcare System: A Look at the Future: Workshop Summary. Washington, DC: National Academies Press; 2011:31-46. PubMed
2. Reid PP, Compton WD, Grossman J, Fanjiang G. Building a Better Delivery System: A New Engineering/Health Care Partnership. Washington, DC: National Academy of Engineering and Institute of Medicine, National Academies Press; 2005. PubMed
3. President’s Council of Advisors on Science and Technology (US). Report to the President, better health care and lower costs: accelerating improvement through systems engineering. Washington, DC; 2014.
4. Kossiakoff A, Sweet W. Systems Engineering Principles and Practice. New York: Wiley; 2003.
5. Kopach-Konrad R, Lawley M, Criswell M, et al. Applying systems engineering principles in improving health care delivery. J Gen Intern Med. 2007;22(Suppl 3):431-437. doi: 10.1007/s11606-007-0292-3. PubMed
6. Weed J. Factory efficiency comes to the hospital. The New York Times; July 9, 2010.
7. Lee EK, Atallah HY, Wright MD, et al. Transforming hospital emergency department workflow and patient care. Interfaces. 2015;45(1):58-82. doi: 10.1287/inte.2014.0788.
8. Resar R, Nolan K, Kaczynski D, Jensen K. Using real-time demand capacity management to improve hospitalwide patient flow. Joint Comm J Qual Patient Saf. 2011;37(5):217-227. doi: 10.1016/S1553-7250(11)37029-8. PubMed
9. McJoynt TA, Hirzallah MA, Satele DV et al. Building a protocol expressway: the case of Mayo Clinic Cancer Center. J Clin Oncol. 2009;27(23):3855-3860. doi: 10.1200/JCO.2008.21.4338. PubMed
10. Blanchard BS, Fabrycky WJ. Systems Engineering and Analysis. 5th ed. Englewood Cliffs: Prentice Hall; 2010.
11. Segev D, Levi R, Dunn PF, Sandberg WS. Modeling the impact of changing patient transportation systems on peri-operative process performance in a large hospital: insights from a computer simulation study. Health Care Manag Sci. 2012;15(2):155-169. doi: 10.1007/s10729-012-9191-1. PubMed
12. Schoenmeyr T, Dunn PF, Gamarnik D, et al. A model for understanding the impacts of demand and capacity on waiting time to enter a congested recovery room. Anesthesiology. 2009;110(6):1293-1304. doi: 10.1097/ALN.0b013e3181a16983 PubMed
13. Levin SR, Dittus R, Aronsky D, et al. Optimizing cardiology capacity to reduce emergency department boarding: a systems engineering approach. Am Heart J. 2008;156(6):1202-1209. doi: 10.1016/j.ahj.2008.07.007. PubMed
14. Bryson C, Boynton G, Stepczynski A, et al. Geographical assignment of hospitalists in an urban teaching hospital: feasibility and impact on efficiency and provider satisfaction. Hosp Pract. 2017;45(4):135-142. doi: 10.1080/21548331.2017.1353884. PubMed
15. Artenstein AW, Higgins TL, Seiler A, et al. Promoting high value inpatient care via a coaching model of structured, interdisciplinary team rounds. Br J Hosp Med (Lond). 2015;76(1):41-45. doi: 10.12968/hmed.2015.76.1.41. PubMed
16. O’Leary KJ, Wayne DB, Landler MP, et al. Impact of localizing physicians to hospital units on nurse-physician communication and agreement on the plan of care. J Gen Intern Med. 2009;24(11):1223-1227. doi: 10.1007/s11606-009-1113-7. PubMed
17. Dunn AS, Reyna M, Radbill B, et al. The impact of bedside interdisciplinary rounds on length of stay and complications. J Hosp Med. 2017;12(3):137-142. doi: 10.12788/jhm.2695. PubMed
18. Accreditation Council for Graduate Medical Education. Common program requirements. Chicago, IL; 2011.
19. Eldabi T, Irani Z, Paul RJ. A proposed approach for modelling health-care systems for understanding. J Manag Med. 2002;16(2-3):170-187. PubMed
20. Block L, Habicht R, Wu AW, et al. In the wake of the 2003 and 2011 duty hours regulations, how do internal medicine interns spend their time? J Gen Intern Med. 2013;28(8):1042-1047. doi: 10.1007/s11606-013-2376-6. PubMed
21. Tipping MD, Forth VE, Magill DB, Englert K, Williams MV. Systematic review of time studies evaluating physicians in the hospital setting. J Hosp Med. 2010;5(6):353-359. doi: 10.1002/jhm.647. PubMed
22. Cady R, Finkelstein S, Lindgren B, et al. Exploring the translational impact of a home telemonitoring intervention using time-motion study. Telemed J e Health. 2010;16(5):576-584. doi: 10.1089/tmj.2009.0148. PubMed
23. Rother M, Shook J. Learning to See: Value Stream Mapping to Add Value and Eliminate Muda. Cambridge, MA: Lean Enterprise Institute, Inc; 2009.
24. Terwiesch C, Diwas KC, Kahn JM. Working with capacity limitations: operations management in critical care. Crit Care. 2011;15(4):308. doi: 10.1186/cc10217. PubMed
© 2019 Society of Hospital Medicine
Nudging Providers to Improve Sleep for Hospitalized Patients
It is 5:45
In this edition of the Journal of Hospital Medicine, Arora et al. present a single-center, pre–post analysis of an intervention designed to improve sleep for hospitalized patients.5 The SIESTA (Sleep for Inpatients: Empowering Staff to Act) intervention was composed of the following three components: provider education on patient sleep, Electronic Health Record (EHR) promotion of sleep-friendly order entry, and empowerment of nurses to actively protect patient sleep. Education and changes to order entry were implemented in two hospital units, but only one received the additional nurse-empowerment intervention. Results were compared for six months pre- and post-intervention. Although the authors found increases in sleep-friendly orders in both units, nighttime room entries and patient-reported sleep disturbance decreased only in the nurse-empowerment unit.
Previous studies assessing both pharmacologic sleep aids as well as bundled nonpharmacologic interventions have demonstrated mixed results and focused primarily on ICU populations.6,7 What sets this study apart from prior interventions aimed at improving patient sleep is the novelty and implications of their successful intervention. In this study, the authors used the EHR and nursing huddles to “nudge” providers to protect their patients’ sleep. The “nudge” concept, first studied in behavioral economics and more recently applied to healthcare, represents ways to present choices that positively influence behavior without restricting options.8 This study incorporates two distinct nudges, one that utilized the EMR to adjust the default timing of orders for vital sign procurement and delivery of VTE-prophylaxis, and another that made sleep part of the default checklist for nursing huddles. This study suggests that nudges altered both physician and nurse behavior and encouraged improvements in process measures, if not clinical outcomes, around patient sleep.
A key insight and strength of this study was to engage and empower nurses to promote better sleep for patients. In particular, nurses in the sleep-enhanced unit suggested—during the course of the intervention—that sleep protection be added as a default item in daily huddles. As illustrated in the Figure, the timing of this suggestion corresponded with an inflection point in reducing patient room disruptions at night. This simple, low-cost nudge sustained sleep improvement while the effect of the initial higher-cost intervention using pocket cards and posters had begun to fade. This is not a randomized clinical trial, but rather a pragmatic assessment of a rigorous quality improvement initiative. Although more follow-up time, particularly after the nurse-empowerment intervention was adjusted, would be helpful to assess the durability of their intervention, we applaud the authors for demonstrating adaptability and efforts for ongoing engagement, as is needed in real-world quality improvement initiatives.
There are additional factors that disrupt patient sleep that were not targeted in this study but could very well respond to nudges. Recently, Wesselius et al. showed that patient-reported nocturnal awakenings were frequently due to toilet visits and awakening by hospital staff.9 Perhaps nudges could be implemented to reduce unnecessary overnight intravenous fluids, prevent late dosing of diuretics, and delay the default timing of standard morning phlebotomy orders.
Although this study by Arora et al. makes a very meaningful contribution to the literature on sleep and hospitalization, it also raises unanswered questions.5 First and foremost, while the pragmatic nature of this study should inspire other hospitals to attempt similar sleep promotion interventions, the use of a pre–post design (rather than a randomized, control design) leaves room for future studies to explore causality more rigorously. Second, although this study has demonstrated significant uptake in standardized order sets to improve sleep (and a corresponding decrease in patient-reported disruptions), future studies should also explore more distal and more challenging outcomes of care. These could include length of stay, incidence of delirium (especially in older adults), and frequency of readmission after discharge. Finally, more longitudinal data to explore the sustainability of order set usage and reported or observed interruptions would be useful to guide hospitals that would like to follow the example set by the SIESTA study.
Notwithstanding these limitations, there is an incredible opportunity for nudges and technology to combine to change the paradigms of clinical care. One of the outcomes of this study was to reduce nocturnal room entry for clinical tasks such as obtaining vital signs. It is worth considering whether providers even need to enter patient rooms to obtain vital signs. The technology now exists to measure vitals passively and continuously via low-impact wearable devices. Milani et al. employed the use of such devices, as well as other techniques, including red-enriched light and sensors that warned staff in clinical areas when noises exceeded acceptable thresholds for sleep, and demonstrated decreases in hospital length of stay and readmission rates.4
Arora et al. present a compelling study of utilizing nudges to influence physician and nurse behavior.5 They show that rigorous quality improvement initiatives can be studied and disseminated in a compelling manner. Their study calls appropriate attention to the need for improving patient sleep and provides us with additional tools that can be used in these efforts. Future research is needed to determine whether the changes observed in process measures will translate into meaningful effects on clinical outcomes and to continue to identify ways to curb some of the toxicities of hospital care.
Disclosures
The authors have nothing to disclose.
1. Krumholz HM. Post hospital syndrome: A condition of generalized risk. N Engl J Med. 2013;368(2):100-102. doi: 10.1056/NEJMp1212324. PubMed
2. Pisani MA, Friese RS, Gehlback BK, Schwab RJ, Weinhouse GL, Jones SF. Sleep in the intensive care unit. Am J Respir Crit Care Med. 2015;191(7):731-738. doi: 10.1164/rccm.201411-2099CI. PubMed
3. Judson T, Johnson K, Bieraugel K, et al. Sleep is vital: improving sleep by reducing unnecessary nocturnal vital signs [abstract]. https://www.shmabstracts.com/abstract/sleep-is-vital-improving-sleep-by-reducing-unnecessary-nocturnal-vital-signs/
4. Milani RV, Bober RM, Lavie CJ, Wilt JK, Milani AR, White CJ. Reducing hospital toxicity: impact on patient outcomes. Am J Med. 2018;131(8):961-966. doi: 10.1016/j.amjmed.2018.04.013. PubMed
5. Arora VM, Machado N, Anderson SL, Desai N, et al. Effectiveness of SIESTA on objective and subjective metrics of nighttime hospital sleep disruptors. J Hosp Med. 2019:14(1):38-41. doi: 10.12788/jhm.3091
6. Hu RF, Jiang XY, Chen J, et al. Non-pharmacologic treatments for sleep promotion in the intensive care unit. Cochrane Database Syst Rev. 2015(10):CD008808. doi: 10.1002/14651858.CD008808.pub2.
7. Lewis SR, Pritchard MW, Schofield-Robinson OJ, Alderson P, Smith AF. Melatonin for the promotion of sleep in adults in the intensive care unit. Cochrane Database Syst Rev. 2018;(5):CD012455. doi: 10.1002/14651858.CD012455.pub2. PubMed
8. Patel MS, Volpp KG, Asch DA. Nudge units to improve the delivery of health care. N Engl J Med. 2018;378:214-216. doi: 10.1056/NEJMp1712984. PubMed
9. Wesselius HM, van den Ende ES, Alsma J, et al. Quality and quantity of sleep and factor associated with sleep disturbance in hospitalized patients. JAMA Intern Med. 2018;178(9):1201-1208. doi: 10.1001/jamainternmed.2018.2669. PubMed
It is 5:45
In this edition of the Journal of Hospital Medicine, Arora et al. present a single-center, pre–post analysis of an intervention designed to improve sleep for hospitalized patients.5 The SIESTA (Sleep for Inpatients: Empowering Staff to Act) intervention was composed of the following three components: provider education on patient sleep, Electronic Health Record (EHR) promotion of sleep-friendly order entry, and empowerment of nurses to actively protect patient sleep. Education and changes to order entry were implemented in two hospital units, but only one received the additional nurse-empowerment intervention. Results were compared for six months pre- and post-intervention. Although the authors found increases in sleep-friendly orders in both units, nighttime room entries and patient-reported sleep disturbance decreased only in the nurse-empowerment unit.
Previous studies assessing both pharmacologic sleep aids as well as bundled nonpharmacologic interventions have demonstrated mixed results and focused primarily on ICU populations.6,7 What sets this study apart from prior interventions aimed at improving patient sleep is the novelty and implications of their successful intervention. In this study, the authors used the EHR and nursing huddles to “nudge” providers to protect their patients’ sleep. The “nudge” concept, first studied in behavioral economics and more recently applied to healthcare, represents ways to present choices that positively influence behavior without restricting options.8 This study incorporates two distinct nudges, one that utilized the EMR to adjust the default timing of orders for vital sign procurement and delivery of VTE-prophylaxis, and another that made sleep part of the default checklist for nursing huddles. This study suggests that nudges altered both physician and nurse behavior and encouraged improvements in process measures, if not clinical outcomes, around patient sleep.
A key insight and strength of this study was to engage and empower nurses to promote better sleep for patients. In particular, nurses in the sleep-enhanced unit suggested—during the course of the intervention—that sleep protection be added as a default item in daily huddles. As illustrated in the Figure, the timing of this suggestion corresponded with an inflection point in reducing patient room disruptions at night. This simple, low-cost nudge sustained sleep improvement while the effect of the initial higher-cost intervention using pocket cards and posters had begun to fade. This is not a randomized clinical trial, but rather a pragmatic assessment of a rigorous quality improvement initiative. Although more follow-up time, particularly after the nurse-empowerment intervention was adjusted, would be helpful to assess the durability of their intervention, we applaud the authors for demonstrating adaptability and efforts for ongoing engagement, as is needed in real-world quality improvement initiatives.
There are additional factors that disrupt patient sleep that were not targeted in this study but could very well respond to nudges. Recently, Wesselius et al. showed that patient-reported nocturnal awakenings were frequently due to toilet visits and awakening by hospital staff.9 Perhaps nudges could be implemented to reduce unnecessary overnight intravenous fluids, prevent late dosing of diuretics, and delay the default timing of standard morning phlebotomy orders.
Although this study by Arora et al. makes a very meaningful contribution to the literature on sleep and hospitalization, it also raises unanswered questions.5 First and foremost, while the pragmatic nature of this study should inspire other hospitals to attempt similar sleep promotion interventions, the use of a pre–post design (rather than a randomized, control design) leaves room for future studies to explore causality more rigorously. Second, although this study has demonstrated significant uptake in standardized order sets to improve sleep (and a corresponding decrease in patient-reported disruptions), future studies should also explore more distal and more challenging outcomes of care. These could include length of stay, incidence of delirium (especially in older adults), and frequency of readmission after discharge. Finally, more longitudinal data to explore the sustainability of order set usage and reported or observed interruptions would be useful to guide hospitals that would like to follow the example set by the SIESTA study.
Notwithstanding these limitations, there is an incredible opportunity for nudges and technology to combine to change the paradigms of clinical care. One of the outcomes of this study was to reduce nocturnal room entry for clinical tasks such as obtaining vital signs. It is worth considering whether providers even need to enter patient rooms to obtain vital signs. The technology now exists to measure vitals passively and continuously via low-impact wearable devices. Milani et al. employed the use of such devices, as well as other techniques, including red-enriched light and sensors that warned staff in clinical areas when noises exceeded acceptable thresholds for sleep, and demonstrated decreases in hospital length of stay and readmission rates.4
Arora et al. present a compelling study of utilizing nudges to influence physician and nurse behavior.5 They show that rigorous quality improvement initiatives can be studied and disseminated in a compelling manner. Their study calls appropriate attention to the need for improving patient sleep and provides us with additional tools that can be used in these efforts. Future research is needed to determine whether the changes observed in process measures will translate into meaningful effects on clinical outcomes and to continue to identify ways to curb some of the toxicities of hospital care.
Disclosures
The authors have nothing to disclose.
1. Krumholz HM. Post hospital syndrome: A condition of generalized risk. N Engl J Med. 2013;368(2):100-102. doi: 10.1056/NEJMp1212324. PubMed
2. Pisani MA, Friese RS, Gehlback BK, Schwab RJ, Weinhouse GL, Jones SF. Sleep in the intensive care unit. Am J Respir Crit Care Med. 2015;191(7):731-738. doi: 10.1164/rccm.201411-2099CI. PubMed
3. Judson T, Johnson K, Bieraugel K, et al. Sleep is vital: improving sleep by reducing unnecessary nocturnal vital signs [abstract]. https://www.shmabstracts.com/abstract/sleep-is-vital-improving-sleep-by-reducing-unnecessary-nocturnal-vital-signs/
4. Milani RV, Bober RM, Lavie CJ, Wilt JK, Milani AR, White CJ. Reducing hospital toxicity: impact on patient outcomes. Am J Med. 2018;131(8):961-966. doi: 10.1016/j.amjmed.2018.04.013. PubMed
5. Arora VM, Machado N, Anderson SL, Desai N, et al. Effectiveness of SIESTA on objective and subjective metrics of nighttime hospital sleep disruptors. J Hosp Med. 2019:14(1):38-41. doi: 10.12788/jhm.3091
6. Hu RF, Jiang XY, Chen J, et al. Non-pharmacologic treatments for sleep promotion in the intensive care unit. Cochrane Database Syst Rev. 2015(10):CD008808. doi: 10.1002/14651858.CD008808.pub2.
7. Lewis SR, Pritchard MW, Schofield-Robinson OJ, Alderson P, Smith AF. Melatonin for the promotion of sleep in adults in the intensive care unit. Cochrane Database Syst Rev. 2018;(5):CD012455. doi: 10.1002/14651858.CD012455.pub2. PubMed
8. Patel MS, Volpp KG, Asch DA. Nudge units to improve the delivery of health care. N Engl J Med. 2018;378:214-216. doi: 10.1056/NEJMp1712984. PubMed
9. Wesselius HM, van den Ende ES, Alsma J, et al. Quality and quantity of sleep and factor associated with sleep disturbance in hospitalized patients. JAMA Intern Med. 2018;178(9):1201-1208. doi: 10.1001/jamainternmed.2018.2669. PubMed
© 2019 Society of Hospital Medicine
Prenatal valproate and ADHD
Also today, one expert calls for better ways to preserve beta cell function in youth, synthetic opioids drive a spike in the number of fatal overdoses, and mothers may play a role in the link between depression in fathers and daughters.
Amazon Alexa
Apple Podcasts
Google Podcasts
Spotify
Also today, one expert calls for better ways to preserve beta cell function in youth, synthetic opioids drive a spike in the number of fatal overdoses, and mothers may play a role in the link between depression in fathers and daughters.
Amazon Alexa
Apple Podcasts
Google Podcasts
Spotify
Also today, one expert calls for better ways to preserve beta cell function in youth, synthetic opioids drive a spike in the number of fatal overdoses, and mothers may play a role in the link between depression in fathers and daughters.
Amazon Alexa
Apple Podcasts
Google Podcasts
Spotify

Quick tips: How to get your study published
SAN DIEGO – Looking to get your study published in a top medical journal? Bob Löwenberg, MD, PhD, editor-in-chief of Blood, says to start thinking about what appeals to readers.

“What do readers want? They want important information with impact in a clinical or biological sense,” Dr. Löwenberg of Erasmus University Rotterdam (the Netherlands) said at the annual meeting of the American Society of Hematology. “Usually they want to get novel information – new and cutting-edge insights, if possible. And readers want to receive access to information that is right. This is about quality.”
Dr. Löwenberg offered several tips for getting published:
- Make sure your paper has a “clear message” that comes across in both its title and a concisely written abstract. “When your colleagues are going to scan the journal, they should say ‘Hey, this is an interesting title’ or ‘This is an interesting abstract,’ ” Dr. Löwenberg said.
- Avoid jargon and slang. And don’t fill your paper with abbreviations because that will make it unreadable.
- Don’t just cut and paste the abstract from your meeting submission. Update the information and rewrite it before submitting it. “The abstract is so important because it is the part of your manuscript that’s copied by reference systems,” Dr. Löwenberg said. “It’s more broadly published than your manuscript. Write it in such a way that it tells your entire story in a minimal number of words, without changing the overall message of your paper, and in clear language.”
- Focus on providing important background in the introduction, which usually summarizes existing research.
- “Distill the essentials” in the discussion section. “Don’t repeat the results. Discuss the importance of your findings in relation to the state-of-the-art information that you have presented in the introduction,” he said.
- Beware of plagiarism, which includes “self-plagiarism” – duplicating your own previous research without acknowledgment.
- Understand new rules regarding data-sharing requirements developed by the International Committee of Medical Journal Editors. In order to be considered for publication by the committee’s member journals, clinical trials that begin enrolling participants as of Jan. 1, 2019, must include a data-sharing plan in the trial’s registration.
- Don’t be surprised if your paper is turned down. “We all have experience with rejected papers,” he said. “This is part of the game.”
If you are rejected, you may wish to send a rebuttal – a form of appeal – to the journal. Consider this option if the journal “clearly misunderstood or misrepresented the paper,” he said. “Be polite, try to be unemotional and clear, and never [write] it the same day as when you are still angry about this decision.” Once you send a rebuttal, wait for at least a week for a response. If one doesn’t come, he said, feel free to submit the paper elsewhere.
Dr. Löwenberg reported having no relevant financial disclosures.
SAN DIEGO – Looking to get your study published in a top medical journal? Bob Löwenberg, MD, PhD, editor-in-chief of Blood, says to start thinking about what appeals to readers.
“What do readers want? They want important information with impact in a clinical or biological sense,” Dr. Löwenberg of Erasmus University Rotterdam (the Netherlands) said at the annual meeting of the American Society of Hematology. “Usually they want to get novel information – new and cutting-edge insights, if possible. And readers want to receive access to information that is right. This is about quality.”
Dr. Löwenberg offered several tips for getting published:
- Make sure your paper has a “clear message” that comes across in both its title and a concisely written abstract. “When your colleagues are going to scan the journal, they should say ‘Hey, this is an interesting title’ or ‘This is an interesting abstract,’ ” Dr. Löwenberg said.
- Avoid jargon and slang. And don’t fill your paper with abbreviations because that will make it unreadable.
- Don’t just cut and paste the abstract from your meeting submission. Update the information and rewrite it before submitting it. “The abstract is so important because it is the part of your manuscript that’s copied by reference systems,” Dr. Löwenberg said. “It’s more broadly published than your manuscript. Write it in such a way that it tells your entire story in a minimal number of words, without changing the overall message of your paper, and in clear language.”
- Focus on providing important background in the introduction, which usually summarizes existing research.
- “Distill the essentials” in the discussion section. “Don’t repeat the results. Discuss the importance of your findings in relation to the state-of-the-art information that you have presented in the introduction,” he said.
- Beware of plagiarism, which includes “self-plagiarism” – duplicating your own previous research without acknowledgment.
- Understand new rules regarding data-sharing requirements developed by the International Committee of Medical Journal Editors. In order to be considered for publication by the committee’s member journals, clinical trials that begin enrolling participants as of Jan. 1, 2019, must include a data-sharing plan in the trial’s registration.
- Don’t be surprised if your paper is turned down. “We all have experience with rejected papers,” he said. “This is part of the game.”
If you are rejected, you may wish to send a rebuttal – a form of appeal – to the journal. Consider this option if the journal “clearly misunderstood or misrepresented the paper,” he said. “Be polite, try to be unemotional and clear, and never [write] it the same day as when you are still angry about this decision.” Once you send a rebuttal, wait for at least a week for a response. If one doesn’t come, he said, feel free to submit the paper elsewhere.
Dr. Löwenberg reported having no relevant financial disclosures.
EXPERT ANALYSIS FROM ASH 2018
FDA approves new ALL treatment for children, young adults
The in pediatric and young adult patients aged 1 month to 21 years.

Calaspargase pegol-mknl is an asparagine-specific enzyme intended to provide a longer interval between doses, compared with other available pegaspargase products. The recommended dosage of calaspargase pegol-mknl is 2,500 units/m2 given no more frequently than every 21 days.
The FDA said it approved calaspargase pegol-mknl because the drug maintained nadir serum asparaginase activity above the level of 0.1 U/mL when given at 2,500 U/m2 every 3 weeks.
Calaspargase pegol-mknl was evaluated in Study DFCI 11-001, a trial of 237 children and adolescents with newly diagnosed ALL or lymphoblastic lymphoma. The patients’ median age was 5 years.
Study participants received calaspargase pegol-mknl at 2,500 U/m2 (n = 118) or pegaspargase at 2,500 U/m2 (n = 119) as part of a Dana-Farber Cancer Institute ALL Consortium backbone therapy. The median duration of exposure was 8 months for both calaspargase pegol-mknl and pegaspargase. Among the patients with B-cell lineage ALL, the complete remission rate was 98% in the calaspargase pegol-mknl arm and 99% in the pegaspargase arm. Estimated overall survival rates were comparable between the arms.
Common grade 3 or higher adverse events in the calaspargase pegol-mknl and pegaspargase arms included elevated transaminase (52% and 66%, respectively), bilirubin increase (20% and 25%), pancreatitis (18% and 24%), and abnormal clotting studies (14% and 21%). There was one fatal adverse event among patients on calaspargase pegol-mknl – multiorgan failure in the setting of chronic pancreatitis associated with a pancreatic pseudocyst.
The safety of calaspargase pegol-mknl was also evaluated in Study AALL07P4, a trial of patients with newly diagnosed, high-risk B-precursor ALL. The patients received calaspargase pegol-mknl at 2,500 U/m2 (n = 43) or 2,100 U/m2 (n = 68) or pegaspargase at 2,500 U/m2 (n = 52) as a component of an augmented Berlin-Frankfurt-Münster regimen. The patients’ median age was 11 years. The median duration of exposure was 7 months for both calaspargase pegol-mknl and pegaspargase. There were 3 induction deaths among the 111 patients who received calaspargase pegol-mknl (2.8%) but no induction deaths among the 52 patients treated with pegaspargase.
Additional details on these studies and calaspargase pegol-mknl can be found in the drug’s prescribing information. Calaspargase pegol-mknl is a product of Servier.
The in pediatric and young adult patients aged 1 month to 21 years.
Calaspargase pegol-mknl is an asparagine-specific enzyme intended to provide a longer interval between doses, compared with other available pegaspargase products. The recommended dosage of calaspargase pegol-mknl is 2,500 units/m2 given no more frequently than every 21 days.
The FDA said it approved calaspargase pegol-mknl because the drug maintained nadir serum asparaginase activity above the level of 0.1 U/mL when given at 2,500 U/m2 every 3 weeks.
Calaspargase pegol-mknl was evaluated in Study DFCI 11-001, a trial of 237 children and adolescents with newly diagnosed ALL or lymphoblastic lymphoma. The patients’ median age was 5 years.
Study participants received calaspargase pegol-mknl at 2,500 U/m2 (n = 118) or pegaspargase at 2,500 U/m2 (n = 119) as part of a Dana-Farber Cancer Institute ALL Consortium backbone therapy. The median duration of exposure was 8 months for both calaspargase pegol-mknl and pegaspargase. Among the patients with B-cell lineage ALL, the complete remission rate was 98% in the calaspargase pegol-mknl arm and 99% in the pegaspargase arm. Estimated overall survival rates were comparable between the arms.
Common grade 3 or higher adverse events in the calaspargase pegol-mknl and pegaspargase arms included elevated transaminase (52% and 66%, respectively), bilirubin increase (20% and 25%), pancreatitis (18% and 24%), and abnormal clotting studies (14% and 21%). There was one fatal adverse event among patients on calaspargase pegol-mknl – multiorgan failure in the setting of chronic pancreatitis associated with a pancreatic pseudocyst.
The safety of calaspargase pegol-mknl was also evaluated in Study AALL07P4, a trial of patients with newly diagnosed, high-risk B-precursor ALL. The patients received calaspargase pegol-mknl at 2,500 U/m2 (n = 43) or 2,100 U/m2 (n = 68) or pegaspargase at 2,500 U/m2 (n = 52) as a component of an augmented Berlin-Frankfurt-Münster regimen. The patients’ median age was 11 years. The median duration of exposure was 7 months for both calaspargase pegol-mknl and pegaspargase. There were 3 induction deaths among the 111 patients who received calaspargase pegol-mknl (2.8%) but no induction deaths among the 52 patients treated with pegaspargase.
Additional details on these studies and calaspargase pegol-mknl can be found in the drug’s prescribing information. Calaspargase pegol-mknl is a product of Servier.
Don’t leave vaginal hysterectomies behind, surgeon urges
LAS VEGAS –

While “younger trainees are seeing fewer vaginal procedures being done and have less confidence to do the procedure,” research suggests that the vaginal approach can offer major benefits, compared with the alternatives, Rosanne M. Kho, MD, of the Cleveland Clinic, said at the Pelvic Anatomy and Gynecologic Surgery Symposium.
Dr. Kho pointed to several studies suggesting a decline in vaginal hysterectomies as laparoscopic and robot procedures become more common. One study compared hysterectomy surgery approaches during 2007-2010 and found a sharp rise in robotic procedures (0.5% to 10%) and a big decrease in abdominal procedures (from 54% to 40%). The rate of laparoscopic procedures grew (from 24% to 30%), while vaginal procedures dipped slightly (22% to 20%) (JAMA. 2013 Feb 20;309[7]:689-98). Another study tracked hysterectomy strategies at Pittsburgh’s Magee-Womens Hospital in almost 14,000 women during 2000-2010. It found that vaginal hysterectomy rates fell from 22% to 17% while laparoscopic rates grew remarkably from 3% to 43%. Open procedures fell dramatically from 75% to 36% (Am J Obstet Gynecol. 2013 Apr. doi: 10.1016/j.ajog.2013.01.022).
These findings are “telling me that surgeons are steering away from the vaginal approach because the laparoscopic and robotic approach are much more appealing,” Dr. Koh said at the meeting, which was jointly provided by Global Academy for Medical Education and the University of Cincinnati. Global Academy and this news organization are owned by the same company.
Specifically, it appears that surgeons think the vaginal hysterectomy is more “challenging” and “cumbersome,” Dr. Kho said, and they lack inadequate training.
Why should vaginal hysterectomy still be considered? Dr. Kho pointed to two pieces of evidence:
- Expert opinion. A 2017 committee opinion from the American College of Obstetricians and Gynecologists examined routes of hysterectomy in benign disease and declared that, despite the decrease in its use, “evidence supports the opinion that [when feasible] vaginal hysterectomy is associated with better outcomes” than are laparoscopic or abdominal hysterectomy. Also, the decision to perform a salpingo-oophorectomy is not necessarily a contraindication to performing a vaginal hysterectomy, according to the committee opinion (Obstet Gynecol. 2017 Jun;129[6]:e155-e9).The opinion also says, “the vaginal approach is preferred among the minimally invasive approaches. Laparoscopic hysterectomy is a preferable alternative to open abdominal hysterectomy for those patients in whom a vaginal hysterectomy is not indicated or feasible. Although minimally invasive approaches to hysterectomy are the preferred route, open abdominal hysterectomy remains an important surgical option for some patients.”
- Randomized, controlled studies. A 2015 Cochrane Library systematic review examined 47 randomized, controlled trials and found that “vaginal hysterectomy should be performed whenever possible. Where vaginal hysterectomy is not possible, both a laparoscopic approach and abdominal hysterectomy have their pros and cons, and these should be incorporated in the decision-making process” (Cochrane Database Syst Rev. 2015 Aug 12. doi: 10.1002/14651858.CD003677.pub5).
What if a patient has an enlarged uterus? Dr. Kho coauthored a 2017 review that suggested that vaginal hysterectomy may be appropriate in this case. Her report found that in women with large uteri, “vaginal hysterectomy is preferred over laparoscopic and laparoscopic assistance with less operative time and hospital cost. In morbidly obese patients with large uteri, total laparoscopic hysterectomy is superior to vaginal hysterectomy with lesser odds of blood transfusion and lower length of hospital stay” (Clin Obstet Gynecol. 2017 Jun;60[2]:286-95).
What about the removal of fallopian tubes – salpingectomy – during vaginal hysterectomy? Dr. Kho highlighted a 2017 decision analysis that said these procedures are frequently performed for cancer prevention during laparoscopic and open hysterectomies “but [fallopian tubes] are not routinely removed during vaginal hysterectomy because of perceptions of increased morbidity, difficulty, or inadequate surgical training.”
The analysis, however, determined that “salpingectomy should routinely be performed with vaginal hysterectomy because it was the dominant and therefore cost-effective strategy. Complications are minimally increased, but the trade-off with cancer prevention is highly favorable.” (Am J Obstet Gynecol. 2017 Nov;217[5]:603.e1-603.e6).
Dr. Kho reported consulting for AbbVie, Olympus, and Applied Medical.
LAS VEGAS –
While “younger trainees are seeing fewer vaginal procedures being done and have less confidence to do the procedure,” research suggests that the vaginal approach can offer major benefits, compared with the alternatives, Rosanne M. Kho, MD, of the Cleveland Clinic, said at the Pelvic Anatomy and Gynecologic Surgery Symposium.
Dr. Kho pointed to several studies suggesting a decline in vaginal hysterectomies as laparoscopic and robot procedures become more common. One study compared hysterectomy surgery approaches during 2007-2010 and found a sharp rise in robotic procedures (0.5% to 10%) and a big decrease in abdominal procedures (from 54% to 40%). The rate of laparoscopic procedures grew (from 24% to 30%), while vaginal procedures dipped slightly (22% to 20%) (JAMA. 2013 Feb 20;309[7]:689-98). Another study tracked hysterectomy strategies at Pittsburgh’s Magee-Womens Hospital in almost 14,000 women during 2000-2010. It found that vaginal hysterectomy rates fell from 22% to 17% while laparoscopic rates grew remarkably from 3% to 43%. Open procedures fell dramatically from 75% to 36% (Am J Obstet Gynecol. 2013 Apr. doi: 10.1016/j.ajog.2013.01.022).
These findings are “telling me that surgeons are steering away from the vaginal approach because the laparoscopic and robotic approach are much more appealing,” Dr. Koh said at the meeting, which was jointly provided by Global Academy for Medical Education and the University of Cincinnati. Global Academy and this news organization are owned by the same company.
Specifically, it appears that surgeons think the vaginal hysterectomy is more “challenging” and “cumbersome,” Dr. Kho said, and they lack inadequate training.
Why should vaginal hysterectomy still be considered? Dr. Kho pointed to two pieces of evidence:
- Expert opinion. A 2017 committee opinion from the American College of Obstetricians and Gynecologists examined routes of hysterectomy in benign disease and declared that, despite the decrease in its use, “evidence supports the opinion that [when feasible] vaginal hysterectomy is associated with better outcomes” than are laparoscopic or abdominal hysterectomy. Also, the decision to perform a salpingo-oophorectomy is not necessarily a contraindication to performing a vaginal hysterectomy, according to the committee opinion (Obstet Gynecol. 2017 Jun;129[6]:e155-e9).The opinion also says, “the vaginal approach is preferred among the minimally invasive approaches. Laparoscopic hysterectomy is a preferable alternative to open abdominal hysterectomy for those patients in whom a vaginal hysterectomy is not indicated or feasible. Although minimally invasive approaches to hysterectomy are the preferred route, open abdominal hysterectomy remains an important surgical option for some patients.”
- Randomized, controlled studies. A 2015 Cochrane Library systematic review examined 47 randomized, controlled trials and found that “vaginal hysterectomy should be performed whenever possible. Where vaginal hysterectomy is not possible, both a laparoscopic approach and abdominal hysterectomy have their pros and cons, and these should be incorporated in the decision-making process” (Cochrane Database Syst Rev. 2015 Aug 12. doi: 10.1002/14651858.CD003677.pub5).
What if a patient has an enlarged uterus? Dr. Kho coauthored a 2017 review that suggested that vaginal hysterectomy may be appropriate in this case. Her report found that in women with large uteri, “vaginal hysterectomy is preferred over laparoscopic and laparoscopic assistance with less operative time and hospital cost. In morbidly obese patients with large uteri, total laparoscopic hysterectomy is superior to vaginal hysterectomy with lesser odds of blood transfusion and lower length of hospital stay” (Clin Obstet Gynecol. 2017 Jun;60[2]:286-95).
What about the removal of fallopian tubes – salpingectomy – during vaginal hysterectomy? Dr. Kho highlighted a 2017 decision analysis that said these procedures are frequently performed for cancer prevention during laparoscopic and open hysterectomies “but [fallopian tubes] are not routinely removed during vaginal hysterectomy because of perceptions of increased morbidity, difficulty, or inadequate surgical training.”
The analysis, however, determined that “salpingectomy should routinely be performed with vaginal hysterectomy because it was the dominant and therefore cost-effective strategy. Complications are minimally increased, but the trade-off with cancer prevention is highly favorable.” (Am J Obstet Gynecol. 2017 Nov;217[5]:603.e1-603.e6).
Dr. Kho reported consulting for AbbVie, Olympus, and Applied Medical.
EXPERT ANALYSIS FROM PAGS
Clinical trial: Surgical glue for hernia repair
A observational, prospective trial is underway to study the use of Cyanoacrylate Fixation for Laparoscopic Repair of Inguinal Hernias, a multicenter registry, is currently enrolling patients for laparoscopic inguinal hernia repair using surgical tissue glue for mesh fixation.

The trial expects to enroll 1,000 patients and to be completed by December 2019. The primary outcome is postoperative pain evaluated by patient self-assessment using a visual analog scale. Secondary outcomes include intraoperative and postoperative complications, analgesic intake, postoperative quality of life, recurrences, and longer-term complications.
Included in the participant group are adult patients of both sexes with primary inguinal hernia. Exclusions include patients with recurrent inguinal hernia, patients previously treated with Lichtenstein technique, those allergic to the components of the tissue glue, and those whose life expectancy is under 1 year. The patients will be followed up to 1 year.
For further information about to the study, go to clinicaltrials.gov (NCT01669837).
A observational, prospective trial is underway to study the use of Cyanoacrylate Fixation for Laparoscopic Repair of Inguinal Hernias, a multicenter registry, is currently enrolling patients for laparoscopic inguinal hernia repair using surgical tissue glue for mesh fixation.
The trial expects to enroll 1,000 patients and to be completed by December 2019. The primary outcome is postoperative pain evaluated by patient self-assessment using a visual analog scale. Secondary outcomes include intraoperative and postoperative complications, analgesic intake, postoperative quality of life, recurrences, and longer-term complications.
Included in the participant group are adult patients of both sexes with primary inguinal hernia. Exclusions include patients with recurrent inguinal hernia, patients previously treated with Lichtenstein technique, those allergic to the components of the tissue glue, and those whose life expectancy is under 1 year. The patients will be followed up to 1 year.
For further information about to the study, go to clinicaltrials.gov (NCT01669837).