User login
Optimizing Well-being, Practice Culture, and Professional Thriving in an Era of Turbulence
In 2010, the Journal of Hospital Medicine published an article proposing a “talent facilitation” framework for addressing physician workforce challenges.1 Since then, continuous changes in healthcare work environments and shifts in relevant policies have intensified a sense of clinician workforce crisis in the United States,2,3 often described as an epidemic of burnout. Unfortunately, hospital medicine remains among the specialties most impacted by high burnout rates and related turnover.4-6
THE HEALTHCARE TALENT IMPERATIVE
Despite efforts to address the sustainability of careers in hospital medicine, common approaches remain mostly reactive. Existing research on burnout is largely descriptive, focusing on the magnitude of the problem,3 the links between burnout and diminished productivity or turnover,7 and the negative impact of burnout on patient care.8.9 Improvement efforts often focus on rescuing individuals from burnout, rather than prevention.10 While evidence exists that both individually targeted interventions (eg, mindfulness-based stress reduction) and institutional changes (eg, improvements in the operation of care teams) can reduce burnout, efforts to promote individuals’ resilience appear to have limited impact.11,12
Given our field’s reputation for innovation, we believe hospitalist groups must lead the way in developing practical solutions that enhance the well-being of their members, by doing more than exhorting clinicians to “heal themselves” or imploring executives to fix care delivery systems. In this article, we describe an approach to increase resilience and well-being in a large, academic hospital medicine practice and offer an emerging list of best practices.
FROM BURNOUT TO WELL-BEING—A PARADIGM SHIFT
Maslach et al. demonstrated that burnout reflects an individual’s experience of emotional exhaustion, depersonalization of human interactions, and decreased sense of accomplishment at work.13 Updated frameworks emphasize that well-being and lower burnout arise from workflow efficiency, a surrounding culture of wellness, and attention to individual resilience.14 Emerging evidence suggests that burnout and well-being are, in part, a collective experience.15 As outlined in the recently published “Charter on Physician Well-being,”16 this realization creates an opportunity for clinical groups to enhance collective well-being—or thriving—rather than asking individuals to take personal responsibility for resilience or waiting for a top-down system redesign to fix drivers of burnout.
APPLYING THE NEW PARADIGM TO HOSPITAL MEDICINE
In 2013, our academic hospital medicine group set a new vision: To become the best in the nation by being an outstanding place to work. We held an inclusive divisional strategic planning retreat, which focused on clarifying the group’s six core values and exploring how to translate the values into structures, processes, and behaviors that reinforced, rather than undermined, a positive work environment. We used these initial themes to create 16 novel interventions from 2014-2017 (Figure).
Notably, we pursued this work without explicit support or interference from senior leaders in our institution. There were no competing organizational efforts addressing hospitalist efficiency, turnover, or burnout until 2017 (Excellence in Communication, described below). Furthermore, we avoided individually targeted resilience efforts based on feedback from our group that “requiring resilience activities is like blaming the victim.” Intervention participation was not mandatory, out of respect for individual choice and to avoid impeding hospitalists’ daily work.
Before designing interventions, we created a measurement tool to assess our existing culture and track evolution over time (available upon request). We utilized the instrument to provoke emotional responses, surface paradoxes, uncover assumptions, and engage the group in iterative dialog that informed and calibrated interventions. The instrument itself drew from validated elements of existing tools to quantify perceptions across nine domains: meaningful work, autonomy, professional development, logistical support, health, fulfillment outside of work, collegiality, organizational learning, and safety culture.
Several subsequent interventions focused on the emotional experience of work. For example, we developed a formal mechanism (Something Awesome) for members to share the experience of positive emotions during daily work (eg, gratitude and awe) for five minutes at monthly group meetings. We created a Collaborative Case Review process, allowing members to submit concerning cases for nonpunitive discussion and coaching among peers. Finally, we created Above and Beyond Awards, through which members’ written praise of peers’ extraordinary efforts were distributed to the entire group.
We also pursued interventions designed to increase empathy and translate it to action. These included leader rounding on our clinical units, which sought to recognize and thank individuals for daily work and to uncover exigent needs, such as food or assistance with conflict resolution between services. We created “Flash Mobs” or group conversations, which are facilitated by a leader and convened in the hospital, in order to hear from people and discuss topics of concern in real time, such as increased patient volumes. Likewise, we established “The Incubator,” a half-day meeting held four to six times annually when selected clinical faculty applied design thinking techniques to create, test, and implement ideas to enhance workplace experience (eg, supplying healthy food to our common work space at low cost).
Another key focus was professional development for group members. Examples included a three-year development program for new faculty (LaunchPad), increasing the number of available leadership roles for aspiring leaders, modifying annual reviews to focus on increasing individuals’ strengths-based work rather than solely grading performance, and creating a peer-support coaching program for newly hired members. In 2017, we began offering members a full shift credit to attend the hospital’s four-hour Excellence in Communication course, which covers six high-yield skills that increase efficiency, efficacy, and joy in practice.
Finally, we revised a number of structures and operational processes within our group’s control. We created a task force to address the needs of new parents and acquired a lactation room in the hospital. Instead of only covering offsite conference attendance (our old policy), we enhanced autonomy regarding use of continuing education dollars to allow faculty to fund any activity supporting their clinical practice. Finally, we applied quality improvement methodology to redesign the clinical schedule. This included blending value-stream mapping, software solutions, and a values-based framework to analyze proposed changes through the lens of waste elimination, IT feasibility, and whether the proposed changes aligned with the group’s core values.
IMPACT ON GROUP CULTURE AND WELL-BEING
We examined the impact of these tactics on workplace experience over a four-year period (Figure). In 2014, 30% of group members reported psychological safety, 24% had become more callous toward people in their current job, and 45% were experiencing burnout. By 2017, 59% felt a sense of psychological safety (69% increase), 15% had become more callous toward people (38% decrease), and 33% were experiencing burnout (27% decrease). Average annual turnover in the five years before the first survey was 13.2%; turnover declined during the intervention period to 6.6% (adjusted for increased number of positions). While few comprehensive models exist for calculating well-being program return on investment, the American Medical Association’s calculator17 demonstrated our group’s cost of burnout plus turnover in 2013 was $464,385 per year (assumptions in Appendix 1). We spent $343,517 on the 16 interventions between 2013 and 2017, representing an average annual cost of $86,000: $190,094 to buy-down clinical time for new leadership roles, $133,023 to fund time for the Incubator, $2,500 on gifts and awards, $4,900 on program supplies, and $10,000 on leadership training.
BEST PRACTICES FOR HOSPITALIST GROUPS
Based on the current literature and our experience, hospital medicine groups seeking to improve culture, resilience, and well-being should:
- Collaborate to define the group’s sense of purpose. Mission and vision are important, but most of the focus should be on surfacing, naming, and agreeing upon the group’s essential core values—the beliefs that inform whether hospitalists see the workplace as attractive, fair, and sustainable. Utilizing an expert, neutral facilitator is helpful.
- Assess culture—including, but not limited to, individual burnout and well-being—using preexisting questions from validated instruments. As culture is a product of systems, team climate, and leadership, measurement should include these domains.
- Monitor and share anonymous data from the assessment regularly (at least annually) as soon as possible after survey results are available. The data should drive inclusive, open, nonjudgmental dialog among group members and leaders in order to clarify, explore, and refine what the data mean.
- Undertake improvement efforts that emerge from the steps above, with a balanced focus on the three domains of well-being: efficiency of practice, culture of wellness, and personal resilience. Modify the number and intensity of interventions based on the group’s readiness and ability to control change in these domains. For example, some groups may have more excitement and ability to work on factors impacting the efficiency of practice, such as electronic health record templates, while others may wish to enhance opportunities for collegial interaction during the workday.
- Strive for codesign. Group members must be an integral part of the solution, rather than simply raise complaints with the expectation that leaders will devise solutions. Ideally, group members should have time, funding, or titles to lead improvement efforts.
- Opportunities to improve resilience and well-being should be widely available to all group members, but should not be mandatory.
CONCLUSION
The healthcare industry will continue to grapple with high rates of burnout and rapid change for the foreseeable future. We believe significant improvements in burnout rates and workplace experience can result from hospitalist-led interventions designed to improve experience of work among hospitalist clinicians, even as we await broader and necessary systematic efforts to address structural drivers of professional satisfaction. This work is vital if we are to honor our field’s history of productive innovation and navigate dynamic change in healthcare by attracting, engaging, developing, and retaining our most valuable asset: our people.
Disclosures
The authors declare they have no conflicts of interest/competing interests.
1. Kneeland PP, Kneeland C, Wachter RM. Bleeding talent: a lesson from industry on embracing physician workforce challenges. J Hosp Med. 2010;5(5):306-310. doi: 10.1002/jhm.594. PubMed
2. Shanafelt TD, Balch CM, Bechamps G, et al. Burnout and medical errors among American surgeons. Ann Surg. 2010;251(6):995-1000. doi: 10.1097/SLA.0b013e3181bfdab3. PubMed
3. Roberts DL, Shanafelt TD, Dyrbye LN, West CP. A national comparison of burnout and work-life balance among internal medicine hospitalists and outpatient general internists. J Hosp Med. 2014;9(3):176-181. doi: 10.1002/jhm.2146. PubMed
4. Shanafelt TD, Hasan O, Dyrbye LN, et al. Changes in burnout and satisfaction with work-life balance in physicians and the General US Working population between 2011 and 2014. Mayo Clin Proc. 2015;90(12):1600-1613. doi: 10.1016/j.mayocp.2015.08.023. PubMed
5. Vuong K. Turnover rate for hospitalist groups trending downward. The Hospitalist. http://www.thehospitalist.org/hospitalist/article/130462/turnover-rate-hospitalist-groups-trending-downward; 2017, Feb 1.
6. Hinami K, Whelan CT, Wolosin RJ, Miller JA, Wetterneck TB. Worklife and satisfaction of hospitalists: toward flourishing careers. J Gen Intern Med. 2012;27(1):28-36. doi: 10.1007/s11606-011-1780-z. PubMed
7. Farr C. Siren song of tech lures New Doctors away from medicine. Shots. Health news from NPR. https://www.npr.org/sections/health-shots/2015/07/19/423882899/siren-song-of-tech-lures-new-doctors-away-from-medicine; 2015, July 19.
8. Shanafelt TD, Balch CM, Bechamps G, et al. Burnout and medical errors among American surgeons. Ann Surg. 2010;251(6):995-1000. doi: 10.1097/SLA.0b013e3181bfdab3. PubMed
9. Dewa CS, Loong D, Bonato S, Thanh NX, Jacobs P. How does burnout affect physician productivity? A systematic literature review. BMC Health Serv Res. 2014;14:325. doi: 10.1186/1472-6963-14-325. PubMed
10. Panagioti M, Geraghty K, Johnson J, et al. Association between physician burnout and patient safety, professionalism, and patient satisfaction: A systematic review and meta-analysis. JAMA Intern Med. 2018;178(10):1317-1330. doi: 10.1001/jamainternmed.2018.3713. PubMed
11. Hall LH, Johnson J, Watt I, Tsipa A, O’Connor DB. Healthcare staff wellbeing, burnout, and patient safety: A systematic review PLOS ONE. 2016;11(7):e0159015. doi: 10.1371/journal.pone.0159015. PubMed
12. Panagioti M, Panagopoulou E, Bower P, et al. Controlled interventions to reduce burnout in physicians: A systematic review and meta-analysis. JAMA Intern Med. 2017;177(2):195-205. doi: 10.1001/jamainternmed.2016.7674. PubMed
13. West CP, Dyrbye LN, Erwin PJ, Shanafelt TD. Interventions to prevent and reduce physician burnout: a systematic review and meta-analysis. Lancet. 2016;388(10057):2272-2281. doi: 10.1016/S0140-6736(16)31279-X. PubMed
14. Maslach C, Schaufeli WB, Leiter MP. Job Burnout. Annu Rev Psychol. 2001;52:397-422. doi: 10.1146/annurev.psych.52.1.397. PubMed
15. Bohman B, Dyrbye L, Sinsky CA, et al. Physician well-being: the reciprocity of practice efficiency, culture of wellness, and personal resilience. NEJM Catalyst. 2017 Aug.
16. Sexton JB, Adair KC, Leonard MW, et al. Providing feedback following Leadership WalkRounds is associated with better patient safety culture, higher employee engagement and lower burnout. BMJ Qual Saf. 2018;27(4):261-270. doi: 10.1136/bmjqs-2016-006399. PubMed
17. Thomas LR, Ripp JA, West CP. Charter on physician well-being. JAMA. 2018;319(15):1541-1542. doi: 10.1001/jama.2018.1331. PubMed
18. American Medical Association. Nine Steps to Creating the Organizational Foundation for Joy in Medicine: culture of Wellness—track the business case for well-being. https://www.stepsforward.org/modules/joy-in-medicine.
In 2010, the Journal of Hospital Medicine published an article proposing a “talent facilitation” framework for addressing physician workforce challenges.1 Since then, continuous changes in healthcare work environments and shifts in relevant policies have intensified a sense of clinician workforce crisis in the United States,2,3 often described as an epidemic of burnout. Unfortunately, hospital medicine remains among the specialties most impacted by high burnout rates and related turnover.4-6
THE HEALTHCARE TALENT IMPERATIVE
Despite efforts to address the sustainability of careers in hospital medicine, common approaches remain mostly reactive. Existing research on burnout is largely descriptive, focusing on the magnitude of the problem,3 the links between burnout and diminished productivity or turnover,7 and the negative impact of burnout on patient care.8.9 Improvement efforts often focus on rescuing individuals from burnout, rather than prevention.10 While evidence exists that both individually targeted interventions (eg, mindfulness-based stress reduction) and institutional changes (eg, improvements in the operation of care teams) can reduce burnout, efforts to promote individuals’ resilience appear to have limited impact.11,12
Given our field’s reputation for innovation, we believe hospitalist groups must lead the way in developing practical solutions that enhance the well-being of their members, by doing more than exhorting clinicians to “heal themselves” or imploring executives to fix care delivery systems. In this article, we describe an approach to increase resilience and well-being in a large, academic hospital medicine practice and offer an emerging list of best practices.
FROM BURNOUT TO WELL-BEING—A PARADIGM SHIFT
Maslach et al. demonstrated that burnout reflects an individual’s experience of emotional exhaustion, depersonalization of human interactions, and decreased sense of accomplishment at work.13 Updated frameworks emphasize that well-being and lower burnout arise from workflow efficiency, a surrounding culture of wellness, and attention to individual resilience.14 Emerging evidence suggests that burnout and well-being are, in part, a collective experience.15 As outlined in the recently published “Charter on Physician Well-being,”16 this realization creates an opportunity for clinical groups to enhance collective well-being—or thriving—rather than asking individuals to take personal responsibility for resilience or waiting for a top-down system redesign to fix drivers of burnout.
APPLYING THE NEW PARADIGM TO HOSPITAL MEDICINE
In 2013, our academic hospital medicine group set a new vision: To become the best in the nation by being an outstanding place to work. We held an inclusive divisional strategic planning retreat, which focused on clarifying the group’s six core values and exploring how to translate the values into structures, processes, and behaviors that reinforced, rather than undermined, a positive work environment. We used these initial themes to create 16 novel interventions from 2014-2017 (Figure).
Notably, we pursued this work without explicit support or interference from senior leaders in our institution. There were no competing organizational efforts addressing hospitalist efficiency, turnover, or burnout until 2017 (Excellence in Communication, described below). Furthermore, we avoided individually targeted resilience efforts based on feedback from our group that “requiring resilience activities is like blaming the victim.” Intervention participation was not mandatory, out of respect for individual choice and to avoid impeding hospitalists’ daily work.
Before designing interventions, we created a measurement tool to assess our existing culture and track evolution over time (available upon request). We utilized the instrument to provoke emotional responses, surface paradoxes, uncover assumptions, and engage the group in iterative dialog that informed and calibrated interventions. The instrument itself drew from validated elements of existing tools to quantify perceptions across nine domains: meaningful work, autonomy, professional development, logistical support, health, fulfillment outside of work, collegiality, organizational learning, and safety culture.
Several subsequent interventions focused on the emotional experience of work. For example, we developed a formal mechanism (Something Awesome) for members to share the experience of positive emotions during daily work (eg, gratitude and awe) for five minutes at monthly group meetings. We created a Collaborative Case Review process, allowing members to submit concerning cases for nonpunitive discussion and coaching among peers. Finally, we created Above and Beyond Awards, through which members’ written praise of peers’ extraordinary efforts were distributed to the entire group.
We also pursued interventions designed to increase empathy and translate it to action. These included leader rounding on our clinical units, which sought to recognize and thank individuals for daily work and to uncover exigent needs, such as food or assistance with conflict resolution between services. We created “Flash Mobs” or group conversations, which are facilitated by a leader and convened in the hospital, in order to hear from people and discuss topics of concern in real time, such as increased patient volumes. Likewise, we established “The Incubator,” a half-day meeting held four to six times annually when selected clinical faculty applied design thinking techniques to create, test, and implement ideas to enhance workplace experience (eg, supplying healthy food to our common work space at low cost).
Another key focus was professional development for group members. Examples included a three-year development program for new faculty (LaunchPad), increasing the number of available leadership roles for aspiring leaders, modifying annual reviews to focus on increasing individuals’ strengths-based work rather than solely grading performance, and creating a peer-support coaching program for newly hired members. In 2017, we began offering members a full shift credit to attend the hospital’s four-hour Excellence in Communication course, which covers six high-yield skills that increase efficiency, efficacy, and joy in practice.
Finally, we revised a number of structures and operational processes within our group’s control. We created a task force to address the needs of new parents and acquired a lactation room in the hospital. Instead of only covering offsite conference attendance (our old policy), we enhanced autonomy regarding use of continuing education dollars to allow faculty to fund any activity supporting their clinical practice. Finally, we applied quality improvement methodology to redesign the clinical schedule. This included blending value-stream mapping, software solutions, and a values-based framework to analyze proposed changes through the lens of waste elimination, IT feasibility, and whether the proposed changes aligned with the group’s core values.
IMPACT ON GROUP CULTURE AND WELL-BEING
We examined the impact of these tactics on workplace experience over a four-year period (Figure). In 2014, 30% of group members reported psychological safety, 24% had become more callous toward people in their current job, and 45% were experiencing burnout. By 2017, 59% felt a sense of psychological safety (69% increase), 15% had become more callous toward people (38% decrease), and 33% were experiencing burnout (27% decrease). Average annual turnover in the five years before the first survey was 13.2%; turnover declined during the intervention period to 6.6% (adjusted for increased number of positions). While few comprehensive models exist for calculating well-being program return on investment, the American Medical Association’s calculator17 demonstrated our group’s cost of burnout plus turnover in 2013 was $464,385 per year (assumptions in Appendix 1). We spent $343,517 on the 16 interventions between 2013 and 2017, representing an average annual cost of $86,000: $190,094 to buy-down clinical time for new leadership roles, $133,023 to fund time for the Incubator, $2,500 on gifts and awards, $4,900 on program supplies, and $10,000 on leadership training.
BEST PRACTICES FOR HOSPITALIST GROUPS
Based on the current literature and our experience, hospital medicine groups seeking to improve culture, resilience, and well-being should:
- Collaborate to define the group’s sense of purpose. Mission and vision are important, but most of the focus should be on surfacing, naming, and agreeing upon the group’s essential core values—the beliefs that inform whether hospitalists see the workplace as attractive, fair, and sustainable. Utilizing an expert, neutral facilitator is helpful.
- Assess culture—including, but not limited to, individual burnout and well-being—using preexisting questions from validated instruments. As culture is a product of systems, team climate, and leadership, measurement should include these domains.
- Monitor and share anonymous data from the assessment regularly (at least annually) as soon as possible after survey results are available. The data should drive inclusive, open, nonjudgmental dialog among group members and leaders in order to clarify, explore, and refine what the data mean.
- Undertake improvement efforts that emerge from the steps above, with a balanced focus on the three domains of well-being: efficiency of practice, culture of wellness, and personal resilience. Modify the number and intensity of interventions based on the group’s readiness and ability to control change in these domains. For example, some groups may have more excitement and ability to work on factors impacting the efficiency of practice, such as electronic health record templates, while others may wish to enhance opportunities for collegial interaction during the workday.
- Strive for codesign. Group members must be an integral part of the solution, rather than simply raise complaints with the expectation that leaders will devise solutions. Ideally, group members should have time, funding, or titles to lead improvement efforts.
- Opportunities to improve resilience and well-being should be widely available to all group members, but should not be mandatory.
CONCLUSION
The healthcare industry will continue to grapple with high rates of burnout and rapid change for the foreseeable future. We believe significant improvements in burnout rates and workplace experience can result from hospitalist-led interventions designed to improve experience of work among hospitalist clinicians, even as we await broader and necessary systematic efforts to address structural drivers of professional satisfaction. This work is vital if we are to honor our field’s history of productive innovation and navigate dynamic change in healthcare by attracting, engaging, developing, and retaining our most valuable asset: our people.
Disclosures
The authors declare they have no conflicts of interest/competing interests.
1. Kneeland PP, Kneeland C, Wachter RM. Bleeding talent: a lesson from industry on embracing physician workforce challenges. J Hosp Med. 2010;5(5):306-310. doi: 10.1002/jhm.594. PubMed
2. Shanafelt TD, Balch CM, Bechamps G, et al. Burnout and medical errors among American surgeons. Ann Surg. 2010;251(6):995-1000. doi: 10.1097/SLA.0b013e3181bfdab3. PubMed
3. Roberts DL, Shanafelt TD, Dyrbye LN, West CP. A national comparison of burnout and work-life balance among internal medicine hospitalists and outpatient general internists. J Hosp Med. 2014;9(3):176-181. doi: 10.1002/jhm.2146. PubMed
4. Shanafelt TD, Hasan O, Dyrbye LN, et al. Changes in burnout and satisfaction with work-life balance in physicians and the General US Working population between 2011 and 2014. Mayo Clin Proc. 2015;90(12):1600-1613. doi: 10.1016/j.mayocp.2015.08.023. PubMed
5. Vuong K. Turnover rate for hospitalist groups trending downward. The Hospitalist. http://www.thehospitalist.org/hospitalist/article/130462/turnover-rate-hospitalist-groups-trending-downward; 2017, Feb 1.
6. Hinami K, Whelan CT, Wolosin RJ, Miller JA, Wetterneck TB. Worklife and satisfaction of hospitalists: toward flourishing careers. J Gen Intern Med. 2012;27(1):28-36. doi: 10.1007/s11606-011-1780-z. PubMed
7. Farr C. Siren song of tech lures New Doctors away from medicine. Shots. Health news from NPR. https://www.npr.org/sections/health-shots/2015/07/19/423882899/siren-song-of-tech-lures-new-doctors-away-from-medicine; 2015, July 19.
8. Shanafelt TD, Balch CM, Bechamps G, et al. Burnout and medical errors among American surgeons. Ann Surg. 2010;251(6):995-1000. doi: 10.1097/SLA.0b013e3181bfdab3. PubMed
9. Dewa CS, Loong D, Bonato S, Thanh NX, Jacobs P. How does burnout affect physician productivity? A systematic literature review. BMC Health Serv Res. 2014;14:325. doi: 10.1186/1472-6963-14-325. PubMed
10. Panagioti M, Geraghty K, Johnson J, et al. Association between physician burnout and patient safety, professionalism, and patient satisfaction: A systematic review and meta-analysis. JAMA Intern Med. 2018;178(10):1317-1330. doi: 10.1001/jamainternmed.2018.3713. PubMed
11. Hall LH, Johnson J, Watt I, Tsipa A, O’Connor DB. Healthcare staff wellbeing, burnout, and patient safety: A systematic review PLOS ONE. 2016;11(7):e0159015. doi: 10.1371/journal.pone.0159015. PubMed
12. Panagioti M, Panagopoulou E, Bower P, et al. Controlled interventions to reduce burnout in physicians: A systematic review and meta-analysis. JAMA Intern Med. 2017;177(2):195-205. doi: 10.1001/jamainternmed.2016.7674. PubMed
13. West CP, Dyrbye LN, Erwin PJ, Shanafelt TD. Interventions to prevent and reduce physician burnout: a systematic review and meta-analysis. Lancet. 2016;388(10057):2272-2281. doi: 10.1016/S0140-6736(16)31279-X. PubMed
14. Maslach C, Schaufeli WB, Leiter MP. Job Burnout. Annu Rev Psychol. 2001;52:397-422. doi: 10.1146/annurev.psych.52.1.397. PubMed
15. Bohman B, Dyrbye L, Sinsky CA, et al. Physician well-being: the reciprocity of practice efficiency, culture of wellness, and personal resilience. NEJM Catalyst. 2017 Aug.
16. Sexton JB, Adair KC, Leonard MW, et al. Providing feedback following Leadership WalkRounds is associated with better patient safety culture, higher employee engagement and lower burnout. BMJ Qual Saf. 2018;27(4):261-270. doi: 10.1136/bmjqs-2016-006399. PubMed
17. Thomas LR, Ripp JA, West CP. Charter on physician well-being. JAMA. 2018;319(15):1541-1542. doi: 10.1001/jama.2018.1331. PubMed
18. American Medical Association. Nine Steps to Creating the Organizational Foundation for Joy in Medicine: culture of Wellness—track the business case for well-being. https://www.stepsforward.org/modules/joy-in-medicine.
© 2019 Society of Hospital Medicine
Negative Urinalyses in Febrile Infants Age 7 to 60 Days Treated for Urinary Tract Infection
The sensitivity of the urinalysis (UA) in young infants has been reported to be in the 75% to 85% range.1-4 This suboptimal sensitivity has prevented a widespread adoption of the UA as a true screening test for urinary tract infection (UTI). Although infants with a positive urine culture and a negative UA may have asymptomatic bacteriuria (AB) or contamination,5-7 they are often treated for UTI.
Due to these concerns, the American Academy of Pediatrics (AAP) recommended in their 2011 UTI Practice Guidelines that UA criteria should be incorporated into the definition of UTI.1 However, these guidelines were intended for the 2-24 month age range, leaving a gap in our understanding of the appropriate management of infants <2 months. It is unknown how UA results influence the current management of UTI in young, febrile infants. Using data from a large, nationally representative quality improvement project surrounding the management of febrile infants, this investigation aimed to examine how frequently infants are treated for UTI despite having normal UAs and to determine whether infant and hospital characteristics are different in infants treated for UTI with a positive UA as compared to those treated for UTI with a negative UA.
METHODS
Subjects and Setting
This is a secondary analysis of the AAP’s Reducing Excessive Variability in the Infant Sepsis Evaluation (REVISE) project that involved 20,570 well-appearing infants 7-60 days of age evaluated in the emergency department and/or inpatient setting for fever ≥38◦C without a source between September 2015 and November 2017 at 124 community- and university-based hospitals in the United States. Data were collected via chart review and entered into a standardized tool for the project. This project was deemed exempt by the AAP Institutional Review Board. Because all data were de-identified, some sites did not require Institutional Review Board approval while others required data sharing agreements.
Variables and Definitions
A positive UA was defined as having any leukocyte esterase, positive nitrites, or >5 white blood cells (WBCs) per high power field. Treatment for UTI was defined using the question “Did the urine culture grow an organism that was treated as a pathogen with a full course of antibiotics?” Subjects treated for meningitis or bacteremia were excluded in order to focus on uncomplicated UTI. “Abnormal inflammatory markers” were defined as having a WBC count <5,000 or >15,000 cells/mm3, an absolute band count ≥ 1,500 cells/mm3, a band to neutrophil ratio of >0.2, cerebrospinal fluid (CSF) WBC count of >8/mm3, a positive CSF gram stain, or an elevated C-reactive protein or procalcitonin level, as defined by the institutional range. Although technically not an “inflammatory marker,” CSF gram stain was included in this composite variable because in the rare cases that it is positive, the result would likely influence risk stratification and immediate management. Infants’ ages were categorized as either 7-30 days or 31-60 days. Hospital length-of-stay (LOS) was recorded to the nearest hour and infants who were not hospitalized were assigned a LOS of 0 hours. Hospital characteristics were determined through a survey completed by site leads.
Statistics
Proportions were compared using chi-square test. We used multilevel mixed-effects logistic regression to determine associations between patients and hospital characteristics and UA-positivity in subjects treated for UTI. We accounted for the hospital clustering effect with a random effect that did not vary with patient characteristics. We “marginalized” the regression coefficients to reflect the average effect across hospitals.8,9 We tested the overall importance of the hospital clustering effect on the treatment by comparing our multilevel model to a single-level model without hospital random effects using the likelihood ratio test.
RESULTS
A total of 20,570 infants from 124 hospitals were enrolled in the REVISE project, and 648 (3.2%) were treated for bacteremia and/or meningitis. Of the remaining 19,922 infants, 2,407 (12.1%) were treated for UTI, of whom 2,298 (95.5%) had an initial UA performed. Urine cultures were obtained by catheterization or suprapubic aspirate in 90.3% and “other/unknown” in 9.7% of these 2,298 subjects.
UAs were negative in 337/2,298 (14.7%) treated subjects. UA-negative subjects were more likely to be 7-30 days old (adjusted odds ratio [aOR] 1.3, 95% CI 1.02-1.7) and have upper respiratory symptoms (aOR 1.7, 95% CI 1.3-2.3) and were less likely to have abnormal inflammatory markers (aOR 0.3, 95% CI 0.3-0.4) than UA+ subjects (Table). Even after accounting for the hospital characteristics depicted in the Table, treatment of UA-negative UTI was affected by the hospital (P < .001), and the intraclass correlation coefficient was 6% (95% CI, 3% to 14%). The Figure illustrates substantial site variability in the proportion of infants treated for UTIs that were UA-negative, ranging from 0% to 35% in hospitals with ≥20 UTI cases.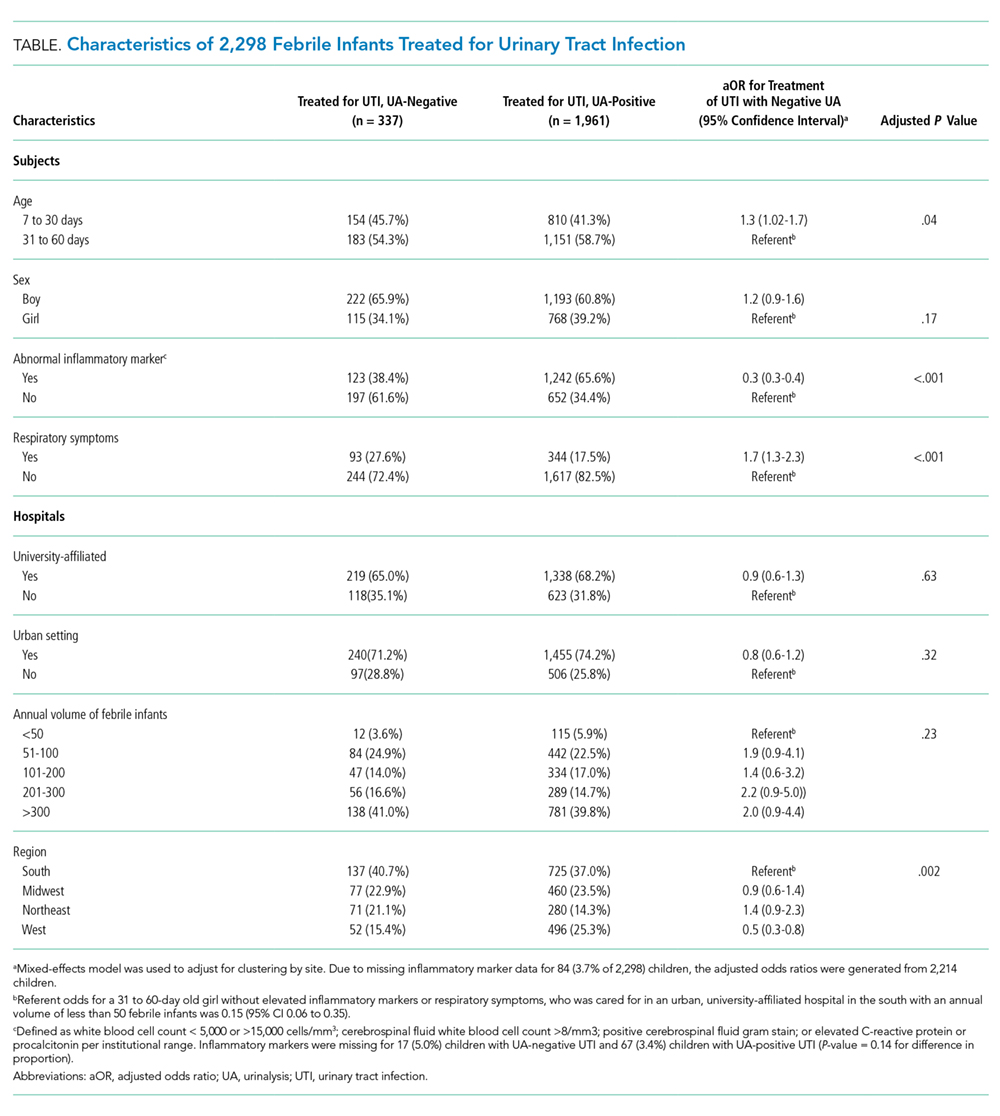
There was no significant difference in the proportion of catheterized specimens in infants treated for UTIs with negative versus positive UAs (90% vs 92%, P = .26). The median hospital (interquartile range) LOS in infants treated for UTI with positive UAs was 58 (45-78) hours, compared to 54 (38-76) hours in infants treated for UTI with negative UAs and 34 (0-49) hours in infants who were not treated for UTI, meningitis, or bacteremia.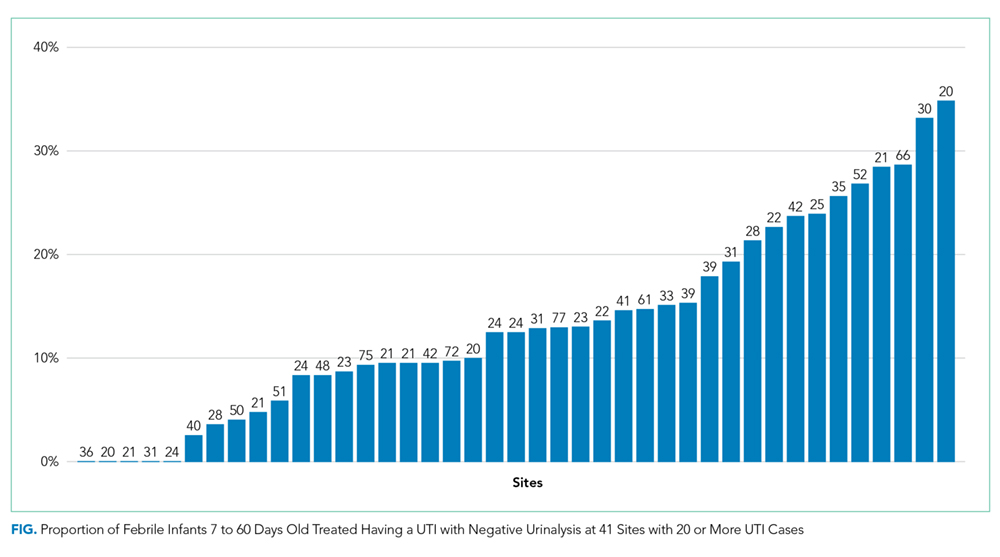
DISCUSSION
In this large, nationally representative sample of febrile infants 7-60 days of age, we demonstrate that nearly 15% of young febrile infants who are treated for UTIs have normal UAs. This proportion varied considerably among hospitals, suggesting that there are institutional differences in the approach to the UA. Infants treated for UA-negative UTIs were more likely to have respiratory symptoms and less likely to have abnormal inflammatory markers than infants treated for UA-positive UTIs, indicating that these infants are either developing a milder inflammatory response to their underlying illness and/or might not have true UTIs (eg due to AB or contamination).
The AAP recently updated their UTI practice parameter to recommend inclusion of UA results as diagnostic criteria for UTI.1 However, the fact that these guidelines do not include infants <2 months creates a gap in our understanding of the appropriate diagnostic criteria in this age group, as reflected by the site variability demonstrated in our investigation. The fact that up to 35% of infants treated for UTI at these different sites have normal UAs suggests that many practitioners continue to treat positive urine cultures regardless of UA values.
Several prior studies provide insight into the clinical significance of a positive urine culture in the absence of pyuria. Wettergren et al.6,7,10 reported growth from suprapubic aspirate in 1.4% of infants who were screened periodically with urine cultures obtained by bag at well-child checks over the course of the first year (with a point prevalence as high as 1.5% in boys aged 0.25 to 1.9 months).10 These infants were not more likely to have subsequent UTIs7 or renal damage6 than infants without asymptomatic growth, leading the authors to conclude that this growth likely represented AB. These findings emphasize that the probability of a positive urine culture in any infant, even asymptomatic infants, is not insignificant.
Hoberman et al.11 demonstrated that dimercaptosuccinic acid scans did not reveal signs of pyelonephritis in 14/15 children < 2 years of age with urine cultures growing >50,000 CFU/mL but no pyuria on UA, and concluded that AB was the most likely explanation for this combination of findings. Schroeder et al.5 and Tzimenatos et al.12 examined infants <2-3 months with UTI and bacteremia caused by the same organism (and hence a true infection that cannot be explained by AB or contamination) and demonstrated that the UA sensitivity in this population was 99.5% and 100%, respectively, suggesting that the prior lower estimates of UA sensitivity in UTI in general, may have been biased by inclusion of positive urine cultures that did not represent UTI.
On the other hand, Shaikh et al.13 recently demonstrated that the sensitivity of the UA appears to vary by organism, with lower reported sensitivity in non-Escherichia coli organisms, leading the authors to conclude that this variability is evidence of suboptimal UA sensitivity. However, an alternative explanation for their findings is that non-E coli organisms may be more likely to cause AB or contamination.14 The fact that follow-up suprapubic aspirates on infants with untreated catheterized cultures yielding these organisms are often negative supports this alternative explanation.15
The median LOS in infants with UA-negative UTI was nearly one day longer than infants not treated for serious bacterial infection. These infants may have also undergone urinary imaging and possibly prophylactic antibiotics, indicating high resource burden created by this subgroup of infants. Expanding AAP UTI guidelines to infants <2 months of age would likely reduce resource utilization, but continued research is needed to assess the safety of this approach. Young infants have immature immune systems and may not develop a timely inflammatory response to UTI, which raises concerns about missing bacterial infections.
Our investigation has several strengths, including the large, nationally representative sample that includes both children’s and non-children’s hospitals. Similar febrile infant investigations of this size have previously been possible only using administrative databases, but our investigation required chart review for all enrolled infants, ensuring that the subjects were febrile, well-appearing, and were treated for UTI. However, our findings are limited in that data were collected primarily as part of a quality improvement initiative, and some of our thresholds for “abnormal” laboratory values might be controversial. For example, urine WBC thresholds differ across studies, and our CSF WBC threshold of >8/mm3 may be somewhat low given prior reports that values slightly above this threshold might be normal in infants under one month of age.16 The original intent of the inflammatory marker composite variable was to aid in risk stratification, but we were unable to collect granular data for all potentially relevant variables. In planning the REVISE project, we attempted to create straightforward, unambiguous variables to facilitate the anticipated high volume of chart reviews. Although patients categorized as having UTI might not have had true UTIs, by linking the “UTI” variable to practitioner management (rather than UA and microbiologic definitions), our data reflect real-world practice.
Acknowledgments
The authors would like to thank all of the site directors who participated in the REVISE project, and Brittany Jennings, Naji Hattar, Faiza Wasif, and Vanessa Shorte at the American Academy of Pediatrics for their leadership and management.
Disclosures
Dr. Schroeder has received honoraria for grand rounds presentations on the subject of urinary tract infections, and Dr. Biondi has received consulting fees from McKesson Inc. The other authors have no financial relationships to disclose.
1. Roberts KB. Urinary tract infection: Clinical practice guideline for the diagnosis and management of the initial UTI in febrile infants and children 2 to 24 months. Pediatrics. 2011;128(3):595-610. doi: 10.1542/peds.2011-1330. PubMed
2. Bachur R, Harper MB. Reliability of the urinalysis for predicting urinary tract infections in young febrile children. Arch Pediatr Adolesc Med. 2001;155(1):60. doi: 10.1001/archpedi.155.1.60. PubMed
3. Bonadio W, Maida G. Urinary tract infection in outpatient febrile infants younger than 30 days of age. Pediatr Infect Dis J. 2014;33(4):342-344. doi: 10.1097/inf.0000000000000110. PubMed
4. Hoberman A, Wald ER. Urinary tract infections in young febrile children. Pediatr Infect Dis J. 1997;16(1):11-17. doi: 10.1097/00006454-199701000-00004. PubMed
5. Schroeder AR, Chang PW, Shen MW, Biondi EA, Greenhow TL. Diagnostic accuracy of the urinalysis for urinary tract infection in infants <3 months of age. Pediatrics. 2015;135(6). doi: 10.1542/peds.2015-0012d. PubMed
6. Wettergren B, Hellstrom M, Stokland E, Jodal U. Six-year follow up of infants with bacteriuria on screening. BMJ. 1990;301(6756):845-848. doi: 10.1136/bmj.301.6756.845. PubMed
7. Wettergren B, Jodal U. Spontaneous clearance of asymptomatic bacteriuria in infants. Acta Paediatrica. 1990;79(3):300-304. doi: 10.1111/j.1651-2227.1990.tb11460.x. PubMed
8. Hedeker D, Toit SHCD, Demirtas H, Gibbons RD. A note on the marginalization of regression parameters from mixed models of binary outcomes. Biometrics. 2017;74(1):354-361. doi: 10.1111/biom.12707. PubMed
9. Neuhaus JM, Kalbfleisch JD, Hauck WW. A comparison of cluster-specific and population-averaged approaches for analyzing correlated binary data. Int Stat Rev. 1991;59(1):25. doi: 10.2307/1403572.
10. Wettergren B, Jodal U, Jonasson G. Epidemiology of bacteriuria during the first year of life. Acta Paediatrica. 1985;74(6):925-933. doi: 10.1111/j.1651-2227.1985.tb10059.x. PubMed
11. Hoberman A, Wald ER, Reynolds EA, Penchansky L, Charron M. Is urine culture necessary to rule out urinary tract infection in young febrile children? Pediatr Infect Dis J. 1996;15(4):304-309. doi: 10.1097/00006454-199604000-00005. PubMed
12. Tzimenatos L, Mahajan P, Dayan PS, et al. Accuracy of the urinalysis for urinary tract infections in febrile infants 60 days and younger. Pediatrics. 2018;141(2). doi: 10.1542/peds.2017-3068. PubMed
13. Shaikh N, Shope TR, Hoberman A, Vigliotti A, Kurs-Lasky M, Martin JM. Association between uropathogen and pyuria. Pediatrics. 2016;138(1). doi: 10.1542/peds.2016-0087. PubMed
14. Schroeder AR. UTI and faulty gold standards. Pediatrics. 2017;139(3). doi: 10.1542/peds.2016-3814a. PubMed
15. Eliacik K, Kanik A, Yavascan O, et al. A comparison of bladder catheterization and suprapubic aspiration methods for urine sample collection from infants with a suspected urinary tract infection. Clinical Pediatrics. 2016;55(9):819-824. doi: 10.1177/0009922815608278. PubMed
16. Thomson J, Sucharew H, Cruz AT, et al. Cerebrospinal fluid reference values for young infants undergoing lumbar puncture. Pediatrics. 2018;141(3). doi: 10.1542/peds.2017-3405. PubMed
The sensitivity of the urinalysis (UA) in young infants has been reported to be in the 75% to 85% range.1-4 This suboptimal sensitivity has prevented a widespread adoption of the UA as a true screening test for urinary tract infection (UTI). Although infants with a positive urine culture and a negative UA may have asymptomatic bacteriuria (AB) or contamination,5-7 they are often treated for UTI.
Due to these concerns, the American Academy of Pediatrics (AAP) recommended in their 2011 UTI Practice Guidelines that UA criteria should be incorporated into the definition of UTI.1 However, these guidelines were intended for the 2-24 month age range, leaving a gap in our understanding of the appropriate management of infants <2 months. It is unknown how UA results influence the current management of UTI in young, febrile infants. Using data from a large, nationally representative quality improvement project surrounding the management of febrile infants, this investigation aimed to examine how frequently infants are treated for UTI despite having normal UAs and to determine whether infant and hospital characteristics are different in infants treated for UTI with a positive UA as compared to those treated for UTI with a negative UA.
METHODS
Subjects and Setting
This is a secondary analysis of the AAP’s Reducing Excessive Variability in the Infant Sepsis Evaluation (REVISE) project that involved 20,570 well-appearing infants 7-60 days of age evaluated in the emergency department and/or inpatient setting for fever ≥38◦C without a source between September 2015 and November 2017 at 124 community- and university-based hospitals in the United States. Data were collected via chart review and entered into a standardized tool for the project. This project was deemed exempt by the AAP Institutional Review Board. Because all data were de-identified, some sites did not require Institutional Review Board approval while others required data sharing agreements.
Variables and Definitions
A positive UA was defined as having any leukocyte esterase, positive nitrites, or >5 white blood cells (WBCs) per high power field. Treatment for UTI was defined using the question “Did the urine culture grow an organism that was treated as a pathogen with a full course of antibiotics?” Subjects treated for meningitis or bacteremia were excluded in order to focus on uncomplicated UTI. “Abnormal inflammatory markers” were defined as having a WBC count <5,000 or >15,000 cells/mm3, an absolute band count ≥ 1,500 cells/mm3, a band to neutrophil ratio of >0.2, cerebrospinal fluid (CSF) WBC count of >8/mm3, a positive CSF gram stain, or an elevated C-reactive protein or procalcitonin level, as defined by the institutional range. Although technically not an “inflammatory marker,” CSF gram stain was included in this composite variable because in the rare cases that it is positive, the result would likely influence risk stratification and immediate management. Infants’ ages were categorized as either 7-30 days or 31-60 days. Hospital length-of-stay (LOS) was recorded to the nearest hour and infants who were not hospitalized were assigned a LOS of 0 hours. Hospital characteristics were determined through a survey completed by site leads.
Statistics
Proportions were compared using chi-square test. We used multilevel mixed-effects logistic regression to determine associations between patients and hospital characteristics and UA-positivity in subjects treated for UTI. We accounted for the hospital clustering effect with a random effect that did not vary with patient characteristics. We “marginalized” the regression coefficients to reflect the average effect across hospitals.8,9 We tested the overall importance of the hospital clustering effect on the treatment by comparing our multilevel model to a single-level model without hospital random effects using the likelihood ratio test.
RESULTS
A total of 20,570 infants from 124 hospitals were enrolled in the REVISE project, and 648 (3.2%) were treated for bacteremia and/or meningitis. Of the remaining 19,922 infants, 2,407 (12.1%) were treated for UTI, of whom 2,298 (95.5%) had an initial UA performed. Urine cultures were obtained by catheterization or suprapubic aspirate in 90.3% and “other/unknown” in 9.7% of these 2,298 subjects.
UAs were negative in 337/2,298 (14.7%) treated subjects. UA-negative subjects were more likely to be 7-30 days old (adjusted odds ratio [aOR] 1.3, 95% CI 1.02-1.7) and have upper respiratory symptoms (aOR 1.7, 95% CI 1.3-2.3) and were less likely to have abnormal inflammatory markers (aOR 0.3, 95% CI 0.3-0.4) than UA+ subjects (Table). Even after accounting for the hospital characteristics depicted in the Table, treatment of UA-negative UTI was affected by the hospital (P < .001), and the intraclass correlation coefficient was 6% (95% CI, 3% to 14%). The Figure illustrates substantial site variability in the proportion of infants treated for UTIs that were UA-negative, ranging from 0% to 35% in hospitals with ≥20 UTI cases.
There was no significant difference in the proportion of catheterized specimens in infants treated for UTIs with negative versus positive UAs (90% vs 92%, P = .26). The median hospital (interquartile range) LOS in infants treated for UTI with positive UAs was 58 (45-78) hours, compared to 54 (38-76) hours in infants treated for UTI with negative UAs and 34 (0-49) hours in infants who were not treated for UTI, meningitis, or bacteremia.
DISCUSSION
In this large, nationally representative sample of febrile infants 7-60 days of age, we demonstrate that nearly 15% of young febrile infants who are treated for UTIs have normal UAs. This proportion varied considerably among hospitals, suggesting that there are institutional differences in the approach to the UA. Infants treated for UA-negative UTIs were more likely to have respiratory symptoms and less likely to have abnormal inflammatory markers than infants treated for UA-positive UTIs, indicating that these infants are either developing a milder inflammatory response to their underlying illness and/or might not have true UTIs (eg due to AB or contamination).
The AAP recently updated their UTI practice parameter to recommend inclusion of UA results as diagnostic criteria for UTI.1 However, the fact that these guidelines do not include infants <2 months creates a gap in our understanding of the appropriate diagnostic criteria in this age group, as reflected by the site variability demonstrated in our investigation. The fact that up to 35% of infants treated for UTI at these different sites have normal UAs suggests that many practitioners continue to treat positive urine cultures regardless of UA values.
Several prior studies provide insight into the clinical significance of a positive urine culture in the absence of pyuria. Wettergren et al.6,7,10 reported growth from suprapubic aspirate in 1.4% of infants who were screened periodically with urine cultures obtained by bag at well-child checks over the course of the first year (with a point prevalence as high as 1.5% in boys aged 0.25 to 1.9 months).10 These infants were not more likely to have subsequent UTIs7 or renal damage6 than infants without asymptomatic growth, leading the authors to conclude that this growth likely represented AB. These findings emphasize that the probability of a positive urine culture in any infant, even asymptomatic infants, is not insignificant.
Hoberman et al.11 demonstrated that dimercaptosuccinic acid scans did not reveal signs of pyelonephritis in 14/15 children < 2 years of age with urine cultures growing >50,000 CFU/mL but no pyuria on UA, and concluded that AB was the most likely explanation for this combination of findings. Schroeder et al.5 and Tzimenatos et al.12 examined infants <2-3 months with UTI and bacteremia caused by the same organism (and hence a true infection that cannot be explained by AB or contamination) and demonstrated that the UA sensitivity in this population was 99.5% and 100%, respectively, suggesting that the prior lower estimates of UA sensitivity in UTI in general, may have been biased by inclusion of positive urine cultures that did not represent UTI.
On the other hand, Shaikh et al.13 recently demonstrated that the sensitivity of the UA appears to vary by organism, with lower reported sensitivity in non-Escherichia coli organisms, leading the authors to conclude that this variability is evidence of suboptimal UA sensitivity. However, an alternative explanation for their findings is that non-E coli organisms may be more likely to cause AB or contamination.14 The fact that follow-up suprapubic aspirates on infants with untreated catheterized cultures yielding these organisms are often negative supports this alternative explanation.15
The median LOS in infants with UA-negative UTI was nearly one day longer than infants not treated for serious bacterial infection. These infants may have also undergone urinary imaging and possibly prophylactic antibiotics, indicating high resource burden created by this subgroup of infants. Expanding AAP UTI guidelines to infants <2 months of age would likely reduce resource utilization, but continued research is needed to assess the safety of this approach. Young infants have immature immune systems and may not develop a timely inflammatory response to UTI, which raises concerns about missing bacterial infections.
Our investigation has several strengths, including the large, nationally representative sample that includes both children’s and non-children’s hospitals. Similar febrile infant investigations of this size have previously been possible only using administrative databases, but our investigation required chart review for all enrolled infants, ensuring that the subjects were febrile, well-appearing, and were treated for UTI. However, our findings are limited in that data were collected primarily as part of a quality improvement initiative, and some of our thresholds for “abnormal” laboratory values might be controversial. For example, urine WBC thresholds differ across studies, and our CSF WBC threshold of >8/mm3 may be somewhat low given prior reports that values slightly above this threshold might be normal in infants under one month of age.16 The original intent of the inflammatory marker composite variable was to aid in risk stratification, but we were unable to collect granular data for all potentially relevant variables. In planning the REVISE project, we attempted to create straightforward, unambiguous variables to facilitate the anticipated high volume of chart reviews. Although patients categorized as having UTI might not have had true UTIs, by linking the “UTI” variable to practitioner management (rather than UA and microbiologic definitions), our data reflect real-world practice.
Acknowledgments
The authors would like to thank all of the site directors who participated in the REVISE project, and Brittany Jennings, Naji Hattar, Faiza Wasif, and Vanessa Shorte at the American Academy of Pediatrics for their leadership and management.
Disclosures
Dr. Schroeder has received honoraria for grand rounds presentations on the subject of urinary tract infections, and Dr. Biondi has received consulting fees from McKesson Inc. The other authors have no financial relationships to disclose.
1. Roberts KB. Urinary tract infection: Clinical practice guideline for the diagnosis and management of the initial UTI in febrile infants and children 2 to 24 months. Pediatrics. 2011;128(3):595-610. doi: 10.1542/peds.2011-1330. PubMed
2. Bachur R, Harper MB. Reliability of the urinalysis for predicting urinary tract infections in young febrile children. Arch Pediatr Adolesc Med. 2001;155(1):60. doi: 10.1001/archpedi.155.1.60. PubMed
3. Bonadio W, Maida G. Urinary tract infection in outpatient febrile infants younger than 30 days of age. Pediatr Infect Dis J. 2014;33(4):342-344. doi: 10.1097/inf.0000000000000110. PubMed
4. Hoberman A, Wald ER. Urinary tract infections in young febrile children. Pediatr Infect Dis J. 1997;16(1):11-17. doi: 10.1097/00006454-199701000-00004. PubMed
5. Schroeder AR, Chang PW, Shen MW, Biondi EA, Greenhow TL. Diagnostic accuracy of the urinalysis for urinary tract infection in infants <3 months of age. Pediatrics. 2015;135(6). doi: 10.1542/peds.2015-0012d. PubMed
6. Wettergren B, Hellstrom M, Stokland E, Jodal U. Six-year follow up of infants with bacteriuria on screening. BMJ. 1990;301(6756):845-848. doi: 10.1136/bmj.301.6756.845. PubMed
7. Wettergren B, Jodal U. Spontaneous clearance of asymptomatic bacteriuria in infants. Acta Paediatrica. 1990;79(3):300-304. doi: 10.1111/j.1651-2227.1990.tb11460.x. PubMed
8. Hedeker D, Toit SHCD, Demirtas H, Gibbons RD. A note on the marginalization of regression parameters from mixed models of binary outcomes. Biometrics. 2017;74(1):354-361. doi: 10.1111/biom.12707. PubMed
9. Neuhaus JM, Kalbfleisch JD, Hauck WW. A comparison of cluster-specific and population-averaged approaches for analyzing correlated binary data. Int Stat Rev. 1991;59(1):25. doi: 10.2307/1403572.
10. Wettergren B, Jodal U, Jonasson G. Epidemiology of bacteriuria during the first year of life. Acta Paediatrica. 1985;74(6):925-933. doi: 10.1111/j.1651-2227.1985.tb10059.x. PubMed
11. Hoberman A, Wald ER, Reynolds EA, Penchansky L, Charron M. Is urine culture necessary to rule out urinary tract infection in young febrile children? Pediatr Infect Dis J. 1996;15(4):304-309. doi: 10.1097/00006454-199604000-00005. PubMed
12. Tzimenatos L, Mahajan P, Dayan PS, et al. Accuracy of the urinalysis for urinary tract infections in febrile infants 60 days and younger. Pediatrics. 2018;141(2). doi: 10.1542/peds.2017-3068. PubMed
13. Shaikh N, Shope TR, Hoberman A, Vigliotti A, Kurs-Lasky M, Martin JM. Association between uropathogen and pyuria. Pediatrics. 2016;138(1). doi: 10.1542/peds.2016-0087. PubMed
14. Schroeder AR. UTI and faulty gold standards. Pediatrics. 2017;139(3). doi: 10.1542/peds.2016-3814a. PubMed
15. Eliacik K, Kanik A, Yavascan O, et al. A comparison of bladder catheterization and suprapubic aspiration methods for urine sample collection from infants with a suspected urinary tract infection. Clinical Pediatrics. 2016;55(9):819-824. doi: 10.1177/0009922815608278. PubMed
16. Thomson J, Sucharew H, Cruz AT, et al. Cerebrospinal fluid reference values for young infants undergoing lumbar puncture. Pediatrics. 2018;141(3). doi: 10.1542/peds.2017-3405. PubMed
© 2019 Society of Hospital Medicine
Deimplementation of Routine Chest X-rays in Adult Intensive Care Units
Despite increased awareness of Choosing Wisely (CW)® recommendations to reduce low-value care,1 there is limited published data about strategies to implement these guidelines or evidence that they have influenced ordering patterns or reduced healthcare spending
In ICUs, CXR ordering strategies may be routine (daily) or on-demand (with clinical indication). The former strategy’s principal advantage is the potential to detect life-threatening situations that may otherwise escape diagnosis.11 Disadvantages include cost, radiation exposure, patient inconvenience, false-positive workups, and low diagnostic and therapeutic value.12,13 On-demand strategies may safely reduce CXR ordering by 32% to 45%.11-17 Based on this evidence, the Critical Care Societies Collaborative and the American College of Radiology have recommended on-demand CXR ordering.18,19 Here, we describe the effectiveness of an intervention to reduce CXR ordering in two ICUs while evaluating the deimplementation strategies using a validated framework.
METHODS
Setting and Design
Vanderbilt University Medical Center (VUMC) is an academic referral center in Nashville, Tennessee. The cardiovascular ICU (CVICU) has 27 beds and the medical ICU (MICU) has 34 beds. Acute care nurse practitioners (ACNPs) and two critical care physicians staff the CVICU; cardiology fellows, anesthesia critical care fellows, and transplant and cardiac surgeons are also active in patient care. The MICU is staffed by two critical care physicians who supervise one team of ACNPs and two teams of medical residents who rotate through the unit every two weeks. Each MICU team is assigned a fellow in pulmonary and critical care.
We conducted a prospective, nonrandomized study in these units from October 2015 to June 2016. The VUMC Institutional Review Board approved the intervention as a quality improvement (QI) activity, waiving the requirement for informed consent.
Intervention
Following the top CW recommendation of the Critical Care Societies Collaborative—“Don’t order diagnostic tests at regular intervals (such as every day), but rather in response to specific clinical questions.”19—the VUMC resident-led CW Steering Committee designed a multifaceted approach to reduce ordering of routine CXRs in ICUs. The intervention included a didactic session on CW and proper CXR ordering practices, peer champions, data audits, and feedback to providers through weekly e-mails (see Supplemental Materials, 1 – Resident Presentation and 2 – CXR Flyer). 20
In September 2015, CVICU and MICU teams received a didactic session highlighting CW, current CXR ordering rates, and the plan for reducing CXR ordering. On October 5, 2015, teams began receiving weekly e-mails with ordering rates defined as CXRs ordered per patient per day and a brief rationale for reducing unnecessary CXRs. To encourage friendly competition, we provided weekly rates to the MICU teams, allowing for transparent benchmarking against one another. A similar competition strategy was not used in the CVICU due to the lack of multiple teams.
In the CVICU, two ACNPs volunteered as peer champions. These champions coordinated data feedback and advocated for the intervention among their colleagues. In the MICU, three internal medicine residents volunteered as peer champions and fulfilled similar roles.
To facilitate deimplementation, we conducted two Plan-Do-Study-Act (PDSA) cycles, the first from November to mid-December 2015 and the second from mid-December 2015 to mid-January 2016. During these cycles, we tailored our deimplementation strategy based on barriers identified by the peer champions and ICU leaders (described in the Qualitative Results section). Peer champions and the CW Steering Committee generated potential solutions by conversing with stakeholders and using the Expert Recommendations for Implementing Change (ERIC).20 Interventions included disseminating promotional flyers, holding meetings with stakeholders, and providing monthly CXR ordering rates. After the PDSA cycles, we continued reexamining the deimplementation efforts by reviewing ordering rates and soliciting feedback from ICU leaders and peer champions. However, no significant changes to the intervention were made during this time.
Quantitative Evaluation
We extracted data from VUMC’s Enterprise Data Warehouse during the intervention period (October 5, 2015 to May 24, 2016) and a historical control period (October 1, 2014 to October 4, 2015). Within each ICU, descriptive statistics were used to compare patient cohorts in the baseline and intervention periods by age, sex, and race.
The primary outcome was CXRs ordered per patient per day by hospital unit (CVICU or MICU). The baseline period included all data between October 1, 2014 and September 15, 2015. To account for priming of providers from didactic education, we allowed a washout period from September 16, 2015 to October 4, 2015. As a preliminary analysis, we compared CXR rates in the baseline and intervention periods using Wilcoxon rank-sum tests. We then conducted interrupted time-series analyses with segmented linear regression to assess differences in linear trends in CXR rates over the two periods. To account for different staffing models in the MICU, we stratified the impact of the intervention by team—medical resident (physician) or ACNP. R version 3.4.0 was used for statistical analysis.21
Qualitative Evaluation
Our qualitative evaluation consisted of embedded observation and semistructured interviews with stakeholders. The qualitative portion was guided by the Consolidated Framework for Implementation Research (CFIR), a widely used framework for design and evaluation of improvement initiatives that helped us to determine major facilitators and barriers to implementation.22,23
Embedded Observation
From November 2015 to January 2016, we observed morning rounds in the CVICU and MICU one to two times weekly to understand factors facilitating and inhibiting uptake of the intervention. Observations were recorded and organized using a CFIR-based template and directed toward understanding interactions among team members (eg, the decision-making process hierarchy), team workflows and decision-making processes, process of ordering CXRs, and providers’ knowledge and perceptions of the CXR intervention (see Supplemental Material, 3 – CFIR Table).22,23 After rounds, ICU team members were invited to share suggestions for improving the intervention. All observations occurred during and shortly following morning rounds when the vast majority of routine CXRs are ordered; we did not evaluate night or evening workflows. In the spirit of continuous improvement, we evaluated data in real-time.
Semistructured Interviews
Based on the direct observations, we developed semistructured interview questions to further evaluate provider perspectives (eg, “Do you believe ICU patients need a daily CXR?”) and constructs aligning with CFIR (eg, “intervention source—internally vs externally developed;” see Supplemental Material, 4 – Interview Questions).
Stakeholders from both ICUs were recruited through e-mail and in-person requests to participate in semistructured interviews. In the CVICU, we interviewed critical care physicians, anesthesia critical care fellows, and ACNPs. In the MICU, we interviewed medical students, interns, residents, critical care fellows, attending intensivist physicians, and ACNPs. We also interviewed X-ray technologists who routinely perform portable films in the units.
RESULTS
Quantitative Results

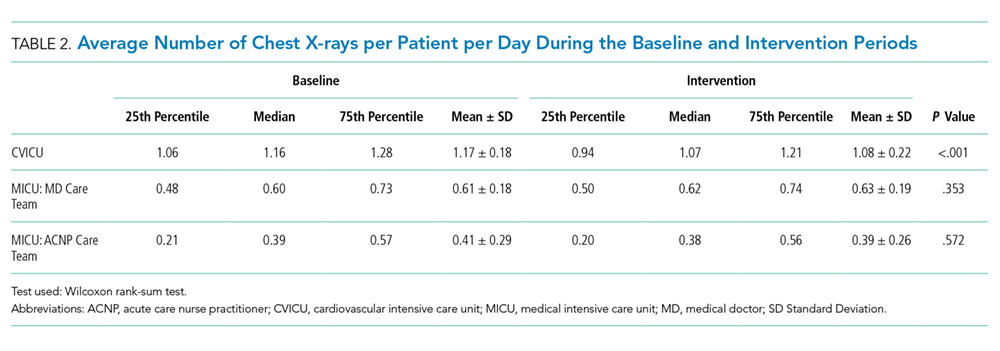
Cardiovascular Intensive Care Unit
The median baseline CXR ordering rate in the CVICU was 1.16 CXRs per patient per day, with interquartile range (IQR) 1.06-1.28. During the intervention period, the rate dropped to 1.07 (IQR 0.94-1.21; P < .001; Table 2). The time-series analysis suggested an essentially flat trend during the baseline period, followed by a small but significant drop in ordering rates during the intervention period (P < .001; Table 3 and Figure 1). Ordering rates appeared to increase slightly over the course of the intervention period, but this slight upward trend was not significantly different from the flat trend seen during the baseline period.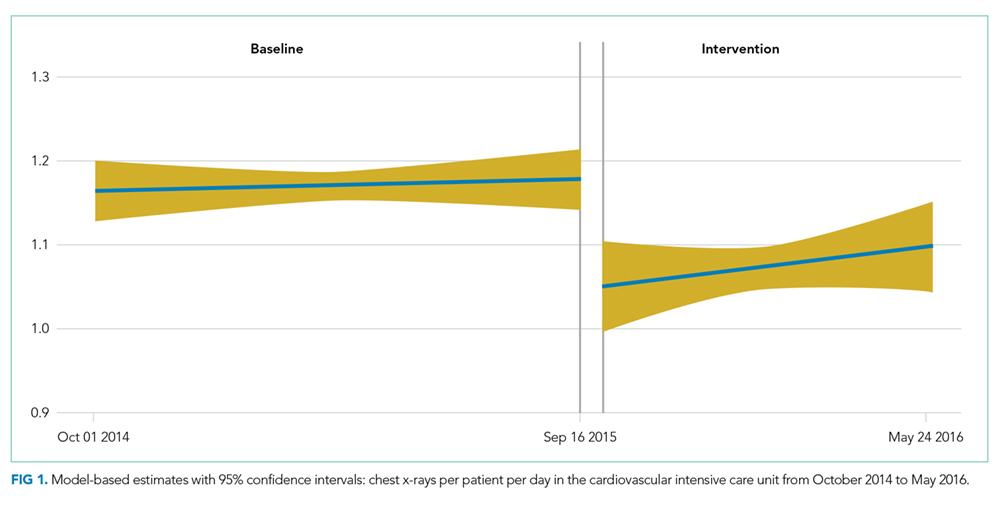
Medical Intensive Care Unit
For both physician and ACPN teams, the median baseline CXR ordering rates in the MICU were much lower than the baseline rate in the CVICU (Table 2). For the MICU physician care team, the baseline CXR ordering rate was 0.60 CXRs per patient per day (IQR 0.48-0.73). For the ACNP team, the median rate was 0.39 CXRs per patient per day (IQR 0.21-0.57). Both rates stayed approximately the same during the intervention period (Table 2). The time-series analysis suggested a statistically significant but very slight downward trend in CXR ordering rates during the baseline period, in the physician (P = .011) and ACNP (P = .022) teams (Table 3, Figure 2). Under this model, a small increase in CXR ordering initially occurred during the intervention period for both physician and ACNP teams (P = .010 and P = .055, respectively), after which the rates declined slightly. Trends in ordering rates during the intervention period were not significantly different from the slight downward trends seen during the baseline period.
Qualitative Results
We identified 25 of 39 CFIR constructs as relevant to the initiative (see Supplemental Materials, 3 – CFIR Table.) We determined the major facilitators of deimplementation to be peer champion discussions about CXR ordering on rounds and weekly data feedback, particularly if accompanied by in-person follow-up.
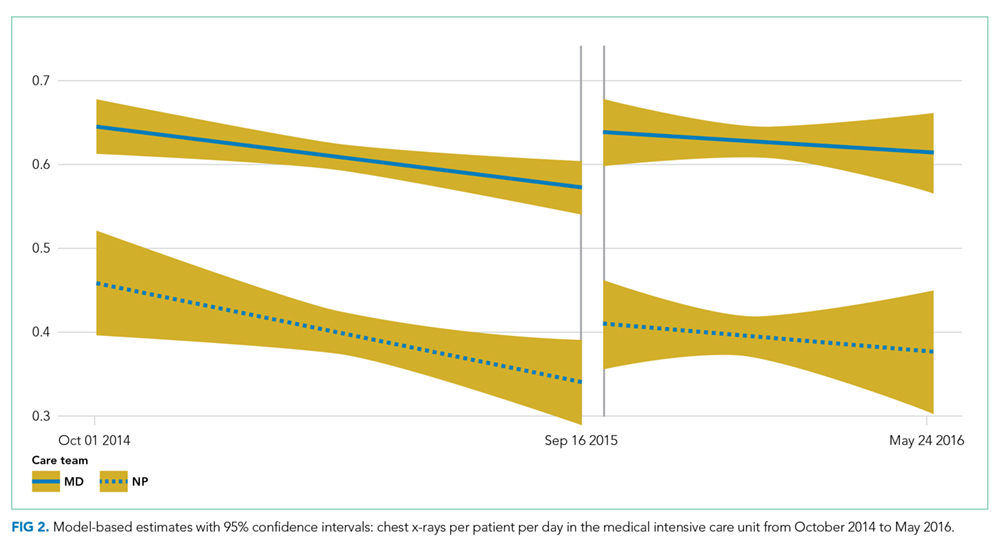
We also noted differences in CXR ordering rationales and decisions between the units. Generally, residents in the MICU and ACNPs in the CVICU made decisions to order CXRs. However, decisions were influenced by the expectations of attending physicians. While CVICU providers tended to order CXRs reflexively as part of morning labs, MICU providers—in particular, ACNPs who had been trained on indications for proper CXR ordering—generally ordered CXRs for specific indications (eg, worsening respiratory status). Of note, MICU ACNPs reported the use of bedside ultrasound as an alternate imaging modality and a reason for their higher threshold to order CXRs.
Deimplementation barriers in both units included the need to identify goal CXR ordering rates and the intervention’s limited visibility. To address these barriers, we conducted PDSA cycles and used the CFIR and ERIC to generate potential solutions.24 We established a goal of a 20% absolute reduction in the CVICU, added monthly CXR rates to weekly e-mail reports to better account for variations in patient populations and ordering practices, and circulated materials to promote on-demand CXR ordering. Promotional materials contained guidelines on CXR ordering and five “Frequently Held Misconceptions” about ordering practices with succinct, evidence-based explanations (see Supplemental Material, 2 – CXR Flyer).
Approximately four months after the start of intervention, some CVICU physicians became concerned that on-demand CXR ordering might be inappropriate for high-risk surgical patients, including those who are undergoing or have undergone heart transplants, lung transplants, or left-ventricular assist device placement. This concern arose following two adverse outcomes, which were not attributed to the CXR initiative, but which heightened concerns about patient safety. A rise in CXR ordering then occurred, and CVICU providers requested that we perform an analysis of these high-risk groups. While segmented linear regression in this subgroup suggested that average daily CXR ordering rates did decrease among the high-risk group at the start of the intervention period (P = .001), the difference between the rates in the two periods was not significant using the Wilcoxon rank-sum test. Exclusion of these patients from the main analysis did not alter the interpretation of the findings reported above for the CVICU.
DISCUSSION
A deimplementation intervention using provider education, peer champions, and data feedback was associated with fewer CXRs in the CVICU (P < .001) but not in the MICU. The CFIR-guided qualitative analysis was valuable for evaluating our deimplementation strategy and for identifying differences between the two ICUs.
Relatively few studies have demonstrated effective interventions that address CW recommendations.25-28 However, three population-level analyses of insurance claims show mixed results.3,4,29 Experts have thus proposed using implementation science to improve uptake of CW recommendations.2,3,7,8 Our study demonstrates the effectiveness of this approach. As expected, providers largely endorsed an on-demand CXR ordering strategy. Using the CFIR, however, we discovered barriers (eg, concern that data feedback did not reflect variations in patients’ needs). Using methods from implementation science allowed us to diagnose and tailor our approaches.
Our qualitative evaluation suggested that the intervention was ineffective mostly due to CFIR’s “inner setting” constructs, including resident fatigue, competing priorities, and decreased investment in QI projects because of the rotating nature of providers in training. Baseline CXR ordering rates in the MICU were also considerably lower than in the CVICU. We observed that CVICU providers ordered many CXRs following the placement of lines or tubes and that ACNPs in the MICU had received education on appropriate CXR ordering practices and had access to an alternate imaging modality in ultrasound. These factors may partially explain the difference in baseline rates.
As noted in a study of cardiac stress testing guidelines, the existence of high-value care recommendations does not mean overuse.30 Indeed, the lack of significant CXR over-ordering in the MICU highlights the importance of baseline measurement and partnering with information technology departments to create the best possible data feedback systems.30-32 Our experience shows that these systems should provide sufficient pre-implementation data (ideally >1 year), such that teams selecting QI projects can ensure that a project is a good use of institutional resources and change capital.
To inform future work, we informally assessed program costs and savings. We estimate the initiative cost $1,600, including $1,000 for curriculum development and teaching time, $300 for educational materials, and $300 for CXR tracking dashboard development. Hospital charges and reimbursements for CXR vary widely.33 We calculated savings using a range of rates, from a conservative $23 (the Medicare reimbursement rate for single-view CXR, CPT code 71010, global fee) to $50 (an approximate blended reimbursement rate across payers).34,35 In the CVICU, we estimate that 51 CXRs were avoided each month, saving $1,173-$2,550 per month or $9,384-$20,400 over eight months of follow-up. Annualizing these figures, we estimate net savings of $12,476-$29,000 in the first year in a 27-bed ICU. Costs to continue the program include education of new employees, booster training, and dashboard maintenance for an estimated annual cost of $1,000. It is difficult to estimate effectiveness over time, but if we conservatively assume that 30 CXRs were avoided each month, then the projected savings would be $8,280-$18,000 per year or an annual net savings of $7,280-$17,000 in the ICU. Although these amounts are modest, providing trainees with experiential learning opportunities in high-value care is valuable in its own right, meets curricular goals, may result in spill-over effects to other diagnostic and therapeutic decisions, and may influence long-term practice patterns. Institutional decisions to pursue projects such as this should take into account these potential benefits.
This evaluation is not without limitations. First, the study was conducted in a single tertiary-care hospital, potentially limiting its generalizability.36 Second, the study design lacked a concurrent control group, and observed outcomes may have been influenced by broader CXR utilization trends, increased awareness of low-value care generally or from previous CW projects at VUMC, seasonal effects, or the Hawthorne effect. Third, the study outcome was all CXRs ordered, rather than CXRs that were unnecessary or not clinically indicated. We chose all CXRs because it was more pragmatic, did not require clinical case review, and could be incorporated promptly into dashboards, enabling timely performance feedback. Other performance measures have taken a similar tack (eg, tracking all-cause readmissions rather than preventable readmissions). Given this approach, we did not track clinical indications for CXRs (eg, central line placement). Fourth, although we compared resident and APRN orders, we did not collect data on other provider characteristics such as years in/out of training or board certification status. These considerations should be addressed in future research.
Finally, the increase in CVICU CXR ordering at the end of the intervention period, which occurred following two adverse events, raises concerns about sustainability. While unrelated to CXR orders, the events resulted in increased ordering of diagnostic tests and showed the difficulty of deimplementation in ICUs. Indeed, some CVICU providers argued that on-demand CXR ordering represented minimal potential cost savings and had not been studied among heart and lung transplant patients. Subsequently, Tonna et al. have shown that on-demand CXR ordering can be safely implemented among such patients.37 Also similar to our study, Tonna et al. observed an initial decrease in CXR ordering, followed by a gradual increase toward baseline ordering rates. These findings highlight the need for sustained awareness and interventions and for the careful selection of high-value projects.
In conclusion, our study shows that a deimplementation intervention based on CW recommendations can reduce CXR ordering and that ongoing evaluation of contextual factors provides insights for both real-time modifications of current interventions and the design of future interventions. We found that messaging about reducing unnecessary tests works well when discussions are framed at the unit level but may be counterproductive if used to question individual ordering decisions.38 Additional lessons learned include the value of participation on rounds to build trust among stakeholders, the utility of monthly rather than weekly statistics for feedback, stakeholder input and peer champions, and differences in approach with physician and ACNP audiences.
Acknowledgments
The authors thank the VUMC Choosing Wisely committee; Mr. Bill Harrell in Advanced Data Analytics for developing the Tableau platform used in our data feedback strategy; Emily Feld, MD, Jerry Zifodya, MD, and Ryan Kindle, MD for assisting with data feedback to providers in the MICU; Todd Rice, MD, Director of the MICU, for his support of the initiative; and Beth Prusaczyk, PhD, MSW and David Stevenson, PhD for providing feedback on earlier drafts of this manuscript.
Disclosures
Dr. Kripalani reports personal fees from Verustat, personal fees from SAI Interactive, and equity from Bioscape Digital, outside the submitted work. All other authors have nothing to disclose.
Funding
This work was supported by an Innovation Grant from the Alliance for Academic Internal Medicine (AAIM, 2016) and by the Departments of Internal Medicine and Graduate Medical Education at Vanderbilt University Medical Center. The AAIM did not have a role in the study design, data collection, data analysis, data interpretation, or manuscript writing.
1. Cassel CK, Guest JA. Choosing Wisely: Helping physicians and patients make smart decisions about their care. JAMA. 2012;307(17):1801-1802.
2. Gonzales R, Cattamanchi A. Changing clinician behavior when less is more. JAMA Intern Med. 2015;175(12):1921-1922.
3. Rosenberg A, Agiro A, Gottlieb M, et al. Early trends among seven recommendations from the Choosing Wisely campaign. JAMA Intern Med. 2015;175(12):1913-1920.
4. Hong AS, Ross-Degnan D, Zhang F, Wharam JF. Small decline in low-value back imaging associated with the ‘Choosing Wisely’ campaign, 2012-14. Health Aff (Millwood). 2017;36(4):671-679. doi: 10.1377/hlthaff.2016.1263.
5. Parks AL, O’Malley PG. From choosing wisely to practicing value—more to the story. JAMA Intern Med. 2016;176(10):1571-1572.
6. Johnson PT, Pahwa AK, Feldman LS, Ziegelstein RC, Hellmann DB. Advancing high-value health care: a new AJM column dedicated to cost-conscious care quality improvement. Am J Med. 2017;130(6):619-621. doi: 10.1016/j.amjmed.2016.12.018.
7. Eccles MP, Mittman BS. Welcome to implementation science. Implement Sci. 2006;1:1. doi: 10.1186/1748-5908-1-1.
8. Bhatia RS, Levinson W, Shortt S, et al. Measuring the effect of Choosing Wisely: an integrated framework to assess campaign impact on low-value care. BMJ Qual Saf. 2015;24:523-531. doi: 10.1136/bmjqs-2015-004070.
9. Selby K, Barnes GD. Learning to de-adopt ineffective healthcare practices. Am J Med. 2018;131(7):721-722. doi: 10.1016/j.amjmed.2018.03.014.
10. Curran GM, Bauer M, Mittman B, Pyne JM, Stetler C. Effectiveness-implementation hybrid designs. Med Care. 2012;50(3):217-226. doi: 10.1097/MLR.0b013e3182408812.
11. Ganapathy A, Adhikari NK, Spiegelman J, Scales DC. Routine chest x-rays in intensive care units: a systematic review and meta-analysis. Crit Care. 2012;16(2):R68. doi: 10.1186/cc11321.
12. Graat ME, Kröner A, Spronk PE, et al. Elimination of daily routine chest radiographs in a mixed medical-surgical intensive care unit. Intensive Care Med. 2007;33(4):639-644. doi: 10.1007/s00134-007-0542-1.
13. Hendrikse KA, Gratama JWC, Ten Hove W, Rommes JH, Schultz MJ, Spronk PE. Low value of routine chest radiographs in a mixed medical-surgical ICU. Chest. 2007;132(3):823-828. doi: 10.1378/chest.07-1162.
14. Clec’h C, Simon P, Hamdi A, et al. Are daily routine chest radiographs useful in critically ill, mechanically ventilated patients? A randomized study. Intensive Care Med. 2008;34(2):264-270. doi: 10.1007/s00134-007-0919-1.
15. Oba Y, Zaza T. Abandoning daily routine chest radiography in the intensive care unit: meta-analysis. Radiology. 2010;255(2):386-395. doi: 10.1148/radiol.10090946.
16. Mets O, Spronk PE, Binnekade J, Stoker J, de Mol BAJM, Schultz MJ. Elimination of daily routine chest radiographs does not change on-demand radiography practice in post-cardiothoracic surgery patients. J Thorac Cardiovasc Surg. 2007;134(1):139-144. doi: 10.1016/j.jtcvs.2007.02.029.
17. Hejblum G, Chalumeau-Lemoine L, Ioos V, et al. Comparison of routine and on-demand prescription of chest radiographs in mechanically ventilated adults: a multicentre, cluster-randomised, two-period crossover study. Lancet. 2009;374(9702):1687-1693. doi: 10.1016/S0140-6736(09)61459-8.
18. McComb BL, Chung JH, Crabtree TD, et al. ACR appropriateness criteria® routine chest radiography. J Thorac Imaging. 2016;31(2):W13-W15. doi: 10.1097/RTI.0000000000000200.
19. Halpern SD, Becker D, Curtis JR, et al. An official American Thoracic Society/American Association of Critical-Care Nurses/American College of Chest Physicians/Society of Critical Care Medicine policy statement: the Choosing Wisely® top 5 list in critical care medicine. Am J Respir Crit Care Med. 2014;190(7):818-826. doi: 10.1164/rccm.201407-1317ST.
20. Powell BJ, Waltz TJ, Chinman MJ, et al. A refined compilation of implementation strategies: Results from the Expert Recommendations for Implementing Change (ERIC) project. Implement Sci. 2015;10:21. doi: 10.1186/s13012-015-0209-1.
21. R [computer program]. Version 3.4.0. Vienna, Austria: R Foundation for Statistical Computing; 2013.
22. Damschroder LJ, Aron DC, Keith RE, Kirsh SR, Alexander JA, Lowery JC. Fostering implementation of health services research findings into practice: a consolidated framework for advancing implementation science. Implement Sci. 2009;4:50. doi: 10.1186/1748-5908-4-50.
23. Kirk MA, Kelley C, Yankey N, Birken SA, Abadie B, Damschroder L. A systematic review of the use of the Consolidated Framework for Implementation Research. Implement Sci. 2016;11:72. doi: 10.1186/s13012-016-0437-z.
24. Speroff T, James BC, Nelson EC, Headrick LA, Brommels M, Reed JE. Guidelines for appraisal and publication of PDSA quality improvement. Qual Manag Health Care. 2014;13(1):33-39. doi: 10.1097/00019514-200401000-00003.
25. Corson AH, Fan VS, White T, et al. A multifaceted hospitalist quality improvement intervention: Decreased frequency of common labs. J Hosp Med. 2015;10(6):390-395. doi: 10.1002/jhm.2354.
26. Ferrari R. Evaluation of the Canadian Rheumatology Association Choosing Wisely recommendation concerning anti-nuclear antibody (ANA) testing. Clin Rheumatol. 2015;34(9):1551-1556. doi: 10.1007/s10067-015-2985-z.
27. Ferrari R, Prosser C. Testing vitamin D levels and choosing wisely. JAMA Intern Med. 2016;176(7):1019-1020.
28. Iams W, Heck J, Kapp M, et al. A multidisciplinary housestaff-led initiative to safely reduce daily laboratory testing. Acad Med. 2016;91(6):813-820. doi: 10.1097/ACM.0000000000001149.
29. Kost A, Genao I, Lee JW, Smith SR. Clinical decisions made in primary care clinics before and after Choosing WiselyTM. J Am Board Fam Med. 2015;28(4):471-474. doi: 10.3122/jabfm.2015.05.140332.
30. Kerr EA, Chen J, Sussman JB, Klamerus ML, Nallamothu BK. Stress testing before low-risk surgery: so many recommendations, so little overuse. JAMA Intern Med. 2015;175(4):645-647. doi: 10.1001/jamainternmed.2014.7877.
31. Colla CH, Morden NE, Sequist TD, Schpero WL, Rosenthal MB. Choosing wisely: prevalence and correlates of low-value health care services in the United States. J Gen Intern Med. 2014;30(2):221-228. doi: 10.1007/s11606-014-3070-z.
32. Shetty KD, Meeker D, Schneider EC, Hussey PS, Damberg CL. Evaluating the feasibility and utility of translating Choosing Wisely recommendations into e-Measures. Healthcare. 2015;3(1):24-37. doi: 10.1016/j.hjdsi.2014.12.002.
33. Woodland DC, Cooper CR, Rashid MF, et al. Routine chest X-ray is unnecessary after ultrasound-guided central venous line placement in the operating room. J Crit Care. 2018;46:13-16. doi: 10.1016/j.jcrc.2018.03.027.
34. Krause TM, Ukhanova M, Revere FL. Private carriers’ physician payment rates compared with Medicare and Medicaid. Tex Med. 2016;112(6):e1.
35. American College of Radiology. Medicare physician fee schedule. Available at https://www.acr.org/Advocacy-and-Economics/Radiology-Economics/Medicare-Medicaid/MPFS. Accessed October 15, 2018.
36. Siegel MD, Rubinowitz AN. Routine daily vs on-demand chest radiographs in intensive care. Lancet. 2009;374(9702):1656-1658. doi: 10.1016/S0140-6736(09)61632-9.
37. Tonna JE, Kawamoto K, Presson AP, et al. Single intervention for a reduction in portable chest radiography (pCXR) in cardiovascular and surgical/trauma ICUs and associated outcomes. J Crit Care. 2018;44:18-23. doi: 10.1016/j.jcrc.2017.10.003.
38. Wolfson D, Santa J, Slass L. Engaging physicians and consumers in conversations about treatment overuse and waste: a short history of the choosing wisely campaign. Acad Med. 2014;89(7):990-995. doi: 10.1097/ACM.0000000000000270.
Despite increased awareness of Choosing Wisely (CW)® recommendations to reduce low-value care,1 there is limited published data about strategies to implement these guidelines or evidence that they have influenced ordering patterns or reduced healthcare spending
In ICUs, CXR ordering strategies may be routine (daily) or on-demand (with clinical indication). The former strategy’s principal advantage is the potential to detect life-threatening situations that may otherwise escape diagnosis.11 Disadvantages include cost, radiation exposure, patient inconvenience, false-positive workups, and low diagnostic and therapeutic value.12,13 On-demand strategies may safely reduce CXR ordering by 32% to 45%.11-17 Based on this evidence, the Critical Care Societies Collaborative and the American College of Radiology have recommended on-demand CXR ordering.18,19 Here, we describe the effectiveness of an intervention to reduce CXR ordering in two ICUs while evaluating the deimplementation strategies using a validated framework.
METHODS
Setting and Design
Vanderbilt University Medical Center (VUMC) is an academic referral center in Nashville, Tennessee. The cardiovascular ICU (CVICU) has 27 beds and the medical ICU (MICU) has 34 beds. Acute care nurse practitioners (ACNPs) and two critical care physicians staff the CVICU; cardiology fellows, anesthesia critical care fellows, and transplant and cardiac surgeons are also active in patient care. The MICU is staffed by two critical care physicians who supervise one team of ACNPs and two teams of medical residents who rotate through the unit every two weeks. Each MICU team is assigned a fellow in pulmonary and critical care.
We conducted a prospective, nonrandomized study in these units from October 2015 to June 2016. The VUMC Institutional Review Board approved the intervention as a quality improvement (QI) activity, waiving the requirement for informed consent.
Intervention
Following the top CW recommendation of the Critical Care Societies Collaborative—“Don’t order diagnostic tests at regular intervals (such as every day), but rather in response to specific clinical questions.”19—the VUMC resident-led CW Steering Committee designed a multifaceted approach to reduce ordering of routine CXRs in ICUs. The intervention included a didactic session on CW and proper CXR ordering practices, peer champions, data audits, and feedback to providers through weekly e-mails (see Supplemental Materials, 1 – Resident Presentation and 2 – CXR Flyer). 20
In September 2015, CVICU and MICU teams received a didactic session highlighting CW, current CXR ordering rates, and the plan for reducing CXR ordering. On October 5, 2015, teams began receiving weekly e-mails with ordering rates defined as CXRs ordered per patient per day and a brief rationale for reducing unnecessary CXRs. To encourage friendly competition, we provided weekly rates to the MICU teams, allowing for transparent benchmarking against one another. A similar competition strategy was not used in the CVICU due to the lack of multiple teams.
In the CVICU, two ACNPs volunteered as peer champions. These champions coordinated data feedback and advocated for the intervention among their colleagues. In the MICU, three internal medicine residents volunteered as peer champions and fulfilled similar roles.
To facilitate deimplementation, we conducted two Plan-Do-Study-Act (PDSA) cycles, the first from November to mid-December 2015 and the second from mid-December 2015 to mid-January 2016. During these cycles, we tailored our deimplementation strategy based on barriers identified by the peer champions and ICU leaders (described in the Qualitative Results section). Peer champions and the CW Steering Committee generated potential solutions by conversing with stakeholders and using the Expert Recommendations for Implementing Change (ERIC).20 Interventions included disseminating promotional flyers, holding meetings with stakeholders, and providing monthly CXR ordering rates. After the PDSA cycles, we continued reexamining the deimplementation efforts by reviewing ordering rates and soliciting feedback from ICU leaders and peer champions. However, no significant changes to the intervention were made during this time.
Quantitative Evaluation
We extracted data from VUMC’s Enterprise Data Warehouse during the intervention period (October 5, 2015 to May 24, 2016) and a historical control period (October 1, 2014 to October 4, 2015). Within each ICU, descriptive statistics were used to compare patient cohorts in the baseline and intervention periods by age, sex, and race.
The primary outcome was CXRs ordered per patient per day by hospital unit (CVICU or MICU). The baseline period included all data between October 1, 2014 and September 15, 2015. To account for priming of providers from didactic education, we allowed a washout period from September 16, 2015 to October 4, 2015. As a preliminary analysis, we compared CXR rates in the baseline and intervention periods using Wilcoxon rank-sum tests. We then conducted interrupted time-series analyses with segmented linear regression to assess differences in linear trends in CXR rates over the two periods. To account for different staffing models in the MICU, we stratified the impact of the intervention by team—medical resident (physician) or ACNP. R version 3.4.0 was used for statistical analysis.21
Qualitative Evaluation
Our qualitative evaluation consisted of embedded observation and semistructured interviews with stakeholders. The qualitative portion was guided by the Consolidated Framework for Implementation Research (CFIR), a widely used framework for design and evaluation of improvement initiatives that helped us to determine major facilitators and barriers to implementation.22,23
Embedded Observation
From November 2015 to January 2016, we observed morning rounds in the CVICU and MICU one to two times weekly to understand factors facilitating and inhibiting uptake of the intervention. Observations were recorded and organized using a CFIR-based template and directed toward understanding interactions among team members (eg, the decision-making process hierarchy), team workflows and decision-making processes, process of ordering CXRs, and providers’ knowledge and perceptions of the CXR intervention (see Supplemental Material, 3 – CFIR Table).22,23 After rounds, ICU team members were invited to share suggestions for improving the intervention. All observations occurred during and shortly following morning rounds when the vast majority of routine CXRs are ordered; we did not evaluate night or evening workflows. In the spirit of continuous improvement, we evaluated data in real-time.
Semistructured Interviews
Based on the direct observations, we developed semistructured interview questions to further evaluate provider perspectives (eg, “Do you believe ICU patients need a daily CXR?”) and constructs aligning with CFIR (eg, “intervention source—internally vs externally developed;” see Supplemental Material, 4 – Interview Questions).
Stakeholders from both ICUs were recruited through e-mail and in-person requests to participate in semistructured interviews. In the CVICU, we interviewed critical care physicians, anesthesia critical care fellows, and ACNPs. In the MICU, we interviewed medical students, interns, residents, critical care fellows, attending intensivist physicians, and ACNPs. We also interviewed X-ray technologists who routinely perform portable films in the units.
RESULTS
Quantitative Results
Cardiovascular Intensive Care Unit
The median baseline CXR ordering rate in the CVICU was 1.16 CXRs per patient per day, with interquartile range (IQR) 1.06-1.28. During the intervention period, the rate dropped to 1.07 (IQR 0.94-1.21; P < .001; Table 2). The time-series analysis suggested an essentially flat trend during the baseline period, followed by a small but significant drop in ordering rates during the intervention period (P < .001; Table 3 and Figure 1). Ordering rates appeared to increase slightly over the course of the intervention period, but this slight upward trend was not significantly different from the flat trend seen during the baseline period.
Medical Intensive Care Unit
For both physician and ACPN teams, the median baseline CXR ordering rates in the MICU were much lower than the baseline rate in the CVICU (Table 2). For the MICU physician care team, the baseline CXR ordering rate was 0.60 CXRs per patient per day (IQR 0.48-0.73). For the ACNP team, the median rate was 0.39 CXRs per patient per day (IQR 0.21-0.57). Both rates stayed approximately the same during the intervention period (Table 2). The time-series analysis suggested a statistically significant but very slight downward trend in CXR ordering rates during the baseline period, in the physician (P = .011) and ACNP (P = .022) teams (Table 3, Figure 2). Under this model, a small increase in CXR ordering initially occurred during the intervention period for both physician and ACNP teams (P = .010 and P = .055, respectively), after which the rates declined slightly. Trends in ordering rates during the intervention period were not significantly different from the slight downward trends seen during the baseline period.
Qualitative Results
We identified 25 of 39 CFIR constructs as relevant to the initiative (see Supplemental Materials, 3 – CFIR Table.) We determined the major facilitators of deimplementation to be peer champion discussions about CXR ordering on rounds and weekly data feedback, particularly if accompanied by in-person follow-up.
We also noted differences in CXR ordering rationales and decisions between the units. Generally, residents in the MICU and ACNPs in the CVICU made decisions to order CXRs. However, decisions were influenced by the expectations of attending physicians. While CVICU providers tended to order CXRs reflexively as part of morning labs, MICU providers—in particular, ACNPs who had been trained on indications for proper CXR ordering—generally ordered CXRs for specific indications (eg, worsening respiratory status). Of note, MICU ACNPs reported the use of bedside ultrasound as an alternate imaging modality and a reason for their higher threshold to order CXRs.
Deimplementation barriers in both units included the need to identify goal CXR ordering rates and the intervention’s limited visibility. To address these barriers, we conducted PDSA cycles and used the CFIR and ERIC to generate potential solutions.24 We established a goal of a 20% absolute reduction in the CVICU, added monthly CXR rates to weekly e-mail reports to better account for variations in patient populations and ordering practices, and circulated materials to promote on-demand CXR ordering. Promotional materials contained guidelines on CXR ordering and five “Frequently Held Misconceptions” about ordering practices with succinct, evidence-based explanations (see Supplemental Material, 2 – CXR Flyer).
Approximately four months after the start of intervention, some CVICU physicians became concerned that on-demand CXR ordering might be inappropriate for high-risk surgical patients, including those who are undergoing or have undergone heart transplants, lung transplants, or left-ventricular assist device placement. This concern arose following two adverse outcomes, which were not attributed to the CXR initiative, but which heightened concerns about patient safety. A rise in CXR ordering then occurred, and CVICU providers requested that we perform an analysis of these high-risk groups. While segmented linear regression in this subgroup suggested that average daily CXR ordering rates did decrease among the high-risk group at the start of the intervention period (P = .001), the difference between the rates in the two periods was not significant using the Wilcoxon rank-sum test. Exclusion of these patients from the main analysis did not alter the interpretation of the findings reported above for the CVICU.
DISCUSSION
A deimplementation intervention using provider education, peer champions, and data feedback was associated with fewer CXRs in the CVICU (P < .001) but not in the MICU. The CFIR-guided qualitative analysis was valuable for evaluating our deimplementation strategy and for identifying differences between the two ICUs.
Relatively few studies have demonstrated effective interventions that address CW recommendations.25-28 However, three population-level analyses of insurance claims show mixed results.3,4,29 Experts have thus proposed using implementation science to improve uptake of CW recommendations.2,3,7,8 Our study demonstrates the effectiveness of this approach. As expected, providers largely endorsed an on-demand CXR ordering strategy. Using the CFIR, however, we discovered barriers (eg, concern that data feedback did not reflect variations in patients’ needs). Using methods from implementation science allowed us to diagnose and tailor our approaches.
Our qualitative evaluation suggested that the intervention was ineffective mostly due to CFIR’s “inner setting” constructs, including resident fatigue, competing priorities, and decreased investment in QI projects because of the rotating nature of providers in training. Baseline CXR ordering rates in the MICU were also considerably lower than in the CVICU. We observed that CVICU providers ordered many CXRs following the placement of lines or tubes and that ACNPs in the MICU had received education on appropriate CXR ordering practices and had access to an alternate imaging modality in ultrasound. These factors may partially explain the difference in baseline rates.
As noted in a study of cardiac stress testing guidelines, the existence of high-value care recommendations does not mean overuse.30 Indeed, the lack of significant CXR over-ordering in the MICU highlights the importance of baseline measurement and partnering with information technology departments to create the best possible data feedback systems.30-32 Our experience shows that these systems should provide sufficient pre-implementation data (ideally >1 year), such that teams selecting QI projects can ensure that a project is a good use of institutional resources and change capital.
To inform future work, we informally assessed program costs and savings. We estimate the initiative cost $1,600, including $1,000 for curriculum development and teaching time, $300 for educational materials, and $300 for CXR tracking dashboard development. Hospital charges and reimbursements for CXR vary widely.33 We calculated savings using a range of rates, from a conservative $23 (the Medicare reimbursement rate for single-view CXR, CPT code 71010, global fee) to $50 (an approximate blended reimbursement rate across payers).34,35 In the CVICU, we estimate that 51 CXRs were avoided each month, saving $1,173-$2,550 per month or $9,384-$20,400 over eight months of follow-up. Annualizing these figures, we estimate net savings of $12,476-$29,000 in the first year in a 27-bed ICU. Costs to continue the program include education of new employees, booster training, and dashboard maintenance for an estimated annual cost of $1,000. It is difficult to estimate effectiveness over time, but if we conservatively assume that 30 CXRs were avoided each month, then the projected savings would be $8,280-$18,000 per year or an annual net savings of $7,280-$17,000 in the ICU. Although these amounts are modest, providing trainees with experiential learning opportunities in high-value care is valuable in its own right, meets curricular goals, may result in spill-over effects to other diagnostic and therapeutic decisions, and may influence long-term practice patterns. Institutional decisions to pursue projects such as this should take into account these potential benefits.
This evaluation is not without limitations. First, the study was conducted in a single tertiary-care hospital, potentially limiting its generalizability.36 Second, the study design lacked a concurrent control group, and observed outcomes may have been influenced by broader CXR utilization trends, increased awareness of low-value care generally or from previous CW projects at VUMC, seasonal effects, or the Hawthorne effect. Third, the study outcome was all CXRs ordered, rather than CXRs that were unnecessary or not clinically indicated. We chose all CXRs because it was more pragmatic, did not require clinical case review, and could be incorporated promptly into dashboards, enabling timely performance feedback. Other performance measures have taken a similar tack (eg, tracking all-cause readmissions rather than preventable readmissions). Given this approach, we did not track clinical indications for CXRs (eg, central line placement). Fourth, although we compared resident and APRN orders, we did not collect data on other provider characteristics such as years in/out of training or board certification status. These considerations should be addressed in future research.
Finally, the increase in CVICU CXR ordering at the end of the intervention period, which occurred following two adverse events, raises concerns about sustainability. While unrelated to CXR orders, the events resulted in increased ordering of diagnostic tests and showed the difficulty of deimplementation in ICUs. Indeed, some CVICU providers argued that on-demand CXR ordering represented minimal potential cost savings and had not been studied among heart and lung transplant patients. Subsequently, Tonna et al. have shown that on-demand CXR ordering can be safely implemented among such patients.37 Also similar to our study, Tonna et al. observed an initial decrease in CXR ordering, followed by a gradual increase toward baseline ordering rates. These findings highlight the need for sustained awareness and interventions and for the careful selection of high-value projects.
In conclusion, our study shows that a deimplementation intervention based on CW recommendations can reduce CXR ordering and that ongoing evaluation of contextual factors provides insights for both real-time modifications of current interventions and the design of future interventions. We found that messaging about reducing unnecessary tests works well when discussions are framed at the unit level but may be counterproductive if used to question individual ordering decisions.38 Additional lessons learned include the value of participation on rounds to build trust among stakeholders, the utility of monthly rather than weekly statistics for feedback, stakeholder input and peer champions, and differences in approach with physician and ACNP audiences.
Acknowledgments
The authors thank the VUMC Choosing Wisely committee; Mr. Bill Harrell in Advanced Data Analytics for developing the Tableau platform used in our data feedback strategy; Emily Feld, MD, Jerry Zifodya, MD, and Ryan Kindle, MD for assisting with data feedback to providers in the MICU; Todd Rice, MD, Director of the MICU, for his support of the initiative; and Beth Prusaczyk, PhD, MSW and David Stevenson, PhD for providing feedback on earlier drafts of this manuscript.
Disclosures
Dr. Kripalani reports personal fees from Verustat, personal fees from SAI Interactive, and equity from Bioscape Digital, outside the submitted work. All other authors have nothing to disclose.
Funding
This work was supported by an Innovation Grant from the Alliance for Academic Internal Medicine (AAIM, 2016) and by the Departments of Internal Medicine and Graduate Medical Education at Vanderbilt University Medical Center. The AAIM did not have a role in the study design, data collection, data analysis, data interpretation, or manuscript writing.
1. Cassel CK, Guest JA. Choosing Wisely: Helping physicians and patients make smart decisions about their care. JAMA. 2012;307(17):1801-1802.
2. Gonzales R, Cattamanchi A. Changing clinician behavior when less is more. JAMA Intern Med. 2015;175(12):1921-1922.
3. Rosenberg A, Agiro A, Gottlieb M, et al. Early trends among seven recommendations from the Choosing Wisely campaign. JAMA Intern Med. 2015;175(12):1913-1920.
4. Hong AS, Ross-Degnan D, Zhang F, Wharam JF. Small decline in low-value back imaging associated with the ‘Choosing Wisely’ campaign, 2012-14. Health Aff (Millwood). 2017;36(4):671-679. doi: 10.1377/hlthaff.2016.1263.
5. Parks AL, O’Malley PG. From choosing wisely to practicing value—more to the story. JAMA Intern Med. 2016;176(10):1571-1572.
6. Johnson PT, Pahwa AK, Feldman LS, Ziegelstein RC, Hellmann DB. Advancing high-value health care: a new AJM column dedicated to cost-conscious care quality improvement. Am J Med. 2017;130(6):619-621. doi: 10.1016/j.amjmed.2016.12.018.
7. Eccles MP, Mittman BS. Welcome to implementation science. Implement Sci. 2006;1:1. doi: 10.1186/1748-5908-1-1.
8. Bhatia RS, Levinson W, Shortt S, et al. Measuring the effect of Choosing Wisely: an integrated framework to assess campaign impact on low-value care. BMJ Qual Saf. 2015;24:523-531. doi: 10.1136/bmjqs-2015-004070.
9. Selby K, Barnes GD. Learning to de-adopt ineffective healthcare practices. Am J Med. 2018;131(7):721-722. doi: 10.1016/j.amjmed.2018.03.014.
10. Curran GM, Bauer M, Mittman B, Pyne JM, Stetler C. Effectiveness-implementation hybrid designs. Med Care. 2012;50(3):217-226. doi: 10.1097/MLR.0b013e3182408812.
11. Ganapathy A, Adhikari NK, Spiegelman J, Scales DC. Routine chest x-rays in intensive care units: a systematic review and meta-analysis. Crit Care. 2012;16(2):R68. doi: 10.1186/cc11321.
12. Graat ME, Kröner A, Spronk PE, et al. Elimination of daily routine chest radiographs in a mixed medical-surgical intensive care unit. Intensive Care Med. 2007;33(4):639-644. doi: 10.1007/s00134-007-0542-1.
13. Hendrikse KA, Gratama JWC, Ten Hove W, Rommes JH, Schultz MJ, Spronk PE. Low value of routine chest radiographs in a mixed medical-surgical ICU. Chest. 2007;132(3):823-828. doi: 10.1378/chest.07-1162.
14. Clec’h C, Simon P, Hamdi A, et al. Are daily routine chest radiographs useful in critically ill, mechanically ventilated patients? A randomized study. Intensive Care Med. 2008;34(2):264-270. doi: 10.1007/s00134-007-0919-1.
15. Oba Y, Zaza T. Abandoning daily routine chest radiography in the intensive care unit: meta-analysis. Radiology. 2010;255(2):386-395. doi: 10.1148/radiol.10090946.
16. Mets O, Spronk PE, Binnekade J, Stoker J, de Mol BAJM, Schultz MJ. Elimination of daily routine chest radiographs does not change on-demand radiography practice in post-cardiothoracic surgery patients. J Thorac Cardiovasc Surg. 2007;134(1):139-144. doi: 10.1016/j.jtcvs.2007.02.029.
17. Hejblum G, Chalumeau-Lemoine L, Ioos V, et al. Comparison of routine and on-demand prescription of chest radiographs in mechanically ventilated adults: a multicentre, cluster-randomised, two-period crossover study. Lancet. 2009;374(9702):1687-1693. doi: 10.1016/S0140-6736(09)61459-8.
18. McComb BL, Chung JH, Crabtree TD, et al. ACR appropriateness criteria® routine chest radiography. J Thorac Imaging. 2016;31(2):W13-W15. doi: 10.1097/RTI.0000000000000200.
19. Halpern SD, Becker D, Curtis JR, et al. An official American Thoracic Society/American Association of Critical-Care Nurses/American College of Chest Physicians/Society of Critical Care Medicine policy statement: the Choosing Wisely® top 5 list in critical care medicine. Am J Respir Crit Care Med. 2014;190(7):818-826. doi: 10.1164/rccm.201407-1317ST.
20. Powell BJ, Waltz TJ, Chinman MJ, et al. A refined compilation of implementation strategies: Results from the Expert Recommendations for Implementing Change (ERIC) project. Implement Sci. 2015;10:21. doi: 10.1186/s13012-015-0209-1.
21. R [computer program]. Version 3.4.0. Vienna, Austria: R Foundation for Statistical Computing; 2013.
22. Damschroder LJ, Aron DC, Keith RE, Kirsh SR, Alexander JA, Lowery JC. Fostering implementation of health services research findings into practice: a consolidated framework for advancing implementation science. Implement Sci. 2009;4:50. doi: 10.1186/1748-5908-4-50.
23. Kirk MA, Kelley C, Yankey N, Birken SA, Abadie B, Damschroder L. A systematic review of the use of the Consolidated Framework for Implementation Research. Implement Sci. 2016;11:72. doi: 10.1186/s13012-016-0437-z.
24. Speroff T, James BC, Nelson EC, Headrick LA, Brommels M, Reed JE. Guidelines for appraisal and publication of PDSA quality improvement. Qual Manag Health Care. 2014;13(1):33-39. doi: 10.1097/00019514-200401000-00003.
25. Corson AH, Fan VS, White T, et al. A multifaceted hospitalist quality improvement intervention: Decreased frequency of common labs. J Hosp Med. 2015;10(6):390-395. doi: 10.1002/jhm.2354.
26. Ferrari R. Evaluation of the Canadian Rheumatology Association Choosing Wisely recommendation concerning anti-nuclear antibody (ANA) testing. Clin Rheumatol. 2015;34(9):1551-1556. doi: 10.1007/s10067-015-2985-z.
27. Ferrari R, Prosser C. Testing vitamin D levels and choosing wisely. JAMA Intern Med. 2016;176(7):1019-1020.
28. Iams W, Heck J, Kapp M, et al. A multidisciplinary housestaff-led initiative to safely reduce daily laboratory testing. Acad Med. 2016;91(6):813-820. doi: 10.1097/ACM.0000000000001149.
29. Kost A, Genao I, Lee JW, Smith SR. Clinical decisions made in primary care clinics before and after Choosing WiselyTM. J Am Board Fam Med. 2015;28(4):471-474. doi: 10.3122/jabfm.2015.05.140332.
30. Kerr EA, Chen J, Sussman JB, Klamerus ML, Nallamothu BK. Stress testing before low-risk surgery: so many recommendations, so little overuse. JAMA Intern Med. 2015;175(4):645-647. doi: 10.1001/jamainternmed.2014.7877.
31. Colla CH, Morden NE, Sequist TD, Schpero WL, Rosenthal MB. Choosing wisely: prevalence and correlates of low-value health care services in the United States. J Gen Intern Med. 2014;30(2):221-228. doi: 10.1007/s11606-014-3070-z.
32. Shetty KD, Meeker D, Schneider EC, Hussey PS, Damberg CL. Evaluating the feasibility and utility of translating Choosing Wisely recommendations into e-Measures. Healthcare. 2015;3(1):24-37. doi: 10.1016/j.hjdsi.2014.12.002.
33. Woodland DC, Cooper CR, Rashid MF, et al. Routine chest X-ray is unnecessary after ultrasound-guided central venous line placement in the operating room. J Crit Care. 2018;46:13-16. doi: 10.1016/j.jcrc.2018.03.027.
34. Krause TM, Ukhanova M, Revere FL. Private carriers’ physician payment rates compared with Medicare and Medicaid. Tex Med. 2016;112(6):e1.
35. American College of Radiology. Medicare physician fee schedule. Available at https://www.acr.org/Advocacy-and-Economics/Radiology-Economics/Medicare-Medicaid/MPFS. Accessed October 15, 2018.
36. Siegel MD, Rubinowitz AN. Routine daily vs on-demand chest radiographs in intensive care. Lancet. 2009;374(9702):1656-1658. doi: 10.1016/S0140-6736(09)61632-9.
37. Tonna JE, Kawamoto K, Presson AP, et al. Single intervention for a reduction in portable chest radiography (pCXR) in cardiovascular and surgical/trauma ICUs and associated outcomes. J Crit Care. 2018;44:18-23. doi: 10.1016/j.jcrc.2017.10.003.
38. Wolfson D, Santa J, Slass L. Engaging physicians and consumers in conversations about treatment overuse and waste: a short history of the choosing wisely campaign. Acad Med. 2014;89(7):990-995. doi: 10.1097/ACM.0000000000000270.
© 2019 Society of Hospital Medicine
Hire Hard, Manage Easy
The socio-adaptive (or “nontechnical”) aspects of healthcare including leadership, followership, mentorship, culture, teamwork, and communication are not formally taught in medical training. Yet, they are critical to our daily lives as Hospitalists. The LPD series features brief “pearls of wisdom” that highlight these important lessons.
“If you can hire people whose passion intersects with the job, they won’t require any supervision at all. They will manage themselves better than anyone could ever manage them. Their fire comes from within, not from without.”
—Stephen Covey
When you initiate a quality or performance improvement project, you want to find someone who can help you do the necessary work and find that someone quickly. But be warned: leaders must learn to go slow when hiring for their team. Do not settle on whoever has available time or interest—they may have time to give or be eager for a reason.
We see this unfold in several ways. For example, individuals are sometimes “offered” up for a role: “This person has experience reviewing charts and abstracting data—and they have some time available. Would you like to hire them?” Similarly, eager students or faculty may be willing to jump on a project with you—“I am looking to join a project,” or “Yes, I can help with that,” are all too often heard in this context. Both scenarios share in common one truth: easy availability and willingness to help make it tempting to say, “Sure.”
While some of these individuals might be ideal, many are not. When hiring, you have to think hard about the role and an individual’s skill set that makes them well suited for it. Based on experience, we can tell you that once you go “soft” by selecting a suboptimal candidate, you are in trouble for at least three reasons. First, hiring the right people is the key to achieving success for your initiative. And success in your project reflects directly on you. People will make inferences about you based on the people you surround yourself with: if they are terrific, the assumption—right or wrong—is that you are as well. Second, we tend to compensate for underperforming employees, often at great cost to ourselves or others. When data collection for a project does not go well, we have found ourselves behind the screen filling in various portions of a data collection form. For example, a colleague once told us, “I hired this person to help, but they ended up needing so much assistance that it was often easier for me and others to do the work. The environment quickly became toxic.”
Third, it is often difficult to remove an underperforming employee or have them change positions. Health organizations (especially universities or other public institutions) can be rigid that way. An infection prevention leader told us of waiting a whole year to fill a crucial vacancy before she found the right person. It was ultimately the right decision, she said, adding, “My life is so much better.”
How can you be sure you have found the right person? Regardless of whether you are hiring for a permanent or temporary position, staff or faculty member, we recommend the following:
- Ensure recruits meet with several people. The more eyes on a candidate, the better. Often, someone will catch something you may not—and having many people involved helps get the team invested in the success of your hire.
- Standardize and solicit feedback. For example, we use a standardized template to garner feedback on administrative recruits, project managers, and faculty. This way, we all are evaluating potential colleagues through the same structured approach.
- Ensure skills match the role. For example, an ethnographic study would benefit from someone skilled in qualitative methods. Similarly, a project manager experienced in clinical trials would be best suited for patient recruitment and managing investigators at several sites. Identifying what is clearly needed in the role is a key step in hiring.
Management guru Jim Collins writes: “The moment you feel the need to tightly manage someone, you’ve made a hiring mistake. The best people don’t need to be managed. Guided, taught, led—yes. But not tightly managed.”1 True in management, and true in the world of healthcare. Hire Hard. In the long run, you will be able to manage easy.
Disclosures
Drs. Chopra and Saint are co-authors of the upcoming book, “Thirty Rules for Healthcare Leaders,” from which this article is adapted. Both authors have no other relevant conflicts of interest.
1. Collins J. Recruitment and Selection. In: Garner E, ed. The Art of Managing People. 550 quotes on how to get the best out of others. Eric Garner & Ventus Publishing ApS. 2012;39. https://bookboon.com/en/the-art-of-managing-people-ebook. Accessed January 7, 2019.
The socio-adaptive (or “nontechnical”) aspects of healthcare including leadership, followership, mentorship, culture, teamwork, and communication are not formally taught in medical training. Yet, they are critical to our daily lives as Hospitalists. The LPD series features brief “pearls of wisdom” that highlight these important lessons.
“If you can hire people whose passion intersects with the job, they won’t require any supervision at all. They will manage themselves better than anyone could ever manage them. Their fire comes from within, not from without.”
—Stephen Covey
When you initiate a quality or performance improvement project, you want to find someone who can help you do the necessary work and find that someone quickly. But be warned: leaders must learn to go slow when hiring for their team. Do not settle on whoever has available time or interest—they may have time to give or be eager for a reason.
We see this unfold in several ways. For example, individuals are sometimes “offered” up for a role: “This person has experience reviewing charts and abstracting data—and they have some time available. Would you like to hire them?” Similarly, eager students or faculty may be willing to jump on a project with you—“I am looking to join a project,” or “Yes, I can help with that,” are all too often heard in this context. Both scenarios share in common one truth: easy availability and willingness to help make it tempting to say, “Sure.”
While some of these individuals might be ideal, many are not. When hiring, you have to think hard about the role and an individual’s skill set that makes them well suited for it. Based on experience, we can tell you that once you go “soft” by selecting a suboptimal candidate, you are in trouble for at least three reasons. First, hiring the right people is the key to achieving success for your initiative. And success in your project reflects directly on you. People will make inferences about you based on the people you surround yourself with: if they are terrific, the assumption—right or wrong—is that you are as well. Second, we tend to compensate for underperforming employees, often at great cost to ourselves or others. When data collection for a project does not go well, we have found ourselves behind the screen filling in various portions of a data collection form. For example, a colleague once told us, “I hired this person to help, but they ended up needing so much assistance that it was often easier for me and others to do the work. The environment quickly became toxic.”
Third, it is often difficult to remove an underperforming employee or have them change positions. Health organizations (especially universities or other public institutions) can be rigid that way. An infection prevention leader told us of waiting a whole year to fill a crucial vacancy before she found the right person. It was ultimately the right decision, she said, adding, “My life is so much better.”
How can you be sure you have found the right person? Regardless of whether you are hiring for a permanent or temporary position, staff or faculty member, we recommend the following:
- Ensure recruits meet with several people. The more eyes on a candidate, the better. Often, someone will catch something you may not—and having many people involved helps get the team invested in the success of your hire.
- Standardize and solicit feedback. For example, we use a standardized template to garner feedback on administrative recruits, project managers, and faculty. This way, we all are evaluating potential colleagues through the same structured approach.
- Ensure skills match the role. For example, an ethnographic study would benefit from someone skilled in qualitative methods. Similarly, a project manager experienced in clinical trials would be best suited for patient recruitment and managing investigators at several sites. Identifying what is clearly needed in the role is a key step in hiring.
Management guru Jim Collins writes: “The moment you feel the need to tightly manage someone, you’ve made a hiring mistake. The best people don’t need to be managed. Guided, taught, led—yes. But not tightly managed.”1 True in management, and true in the world of healthcare. Hire Hard. In the long run, you will be able to manage easy.
Disclosures
Drs. Chopra and Saint are co-authors of the upcoming book, “Thirty Rules for Healthcare Leaders,” from which this article is adapted. Both authors have no other relevant conflicts of interest.
1. Collins J. Recruitment and Selection. In: Garner E, ed. The Art of Managing People. 550 quotes on how to get the best out of others. Eric Garner & Ventus Publishing ApS. 2012;39. https://bookboon.com/en/the-art-of-managing-people-ebook. Accessed January 7, 2019.
1. Collins J. Recruitment and Selection. In: Garner E, ed. The Art of Managing People. 550 quotes on how to get the best out of others. Eric Garner & Ventus Publishing ApS. 2012;39. https://bookboon.com/en/the-art-of-managing-people-ebook. Accessed January 7, 2019.
© 2019 Society of Hospital Medicine
Introducing Leadership & Professional Development: A New Series in JHM
“I cannot say whether things will get better if we change; what I can say is they must change if they are to get better.”
—Georg C. Lichtenburg
Leading change is never easy. Many a physician has joined a committee, hired a promising project manager, assumed responsibility for an operational or clinical task—only to have it painfully falter or agonizingly fail. Unfortunately, some of us become disillusioned with the process, donning our white coats to return to the safe ensconce of clinical work rather than take on another perilous change or leadership task. But ask those that have tried and failed and those that have succeeded and they will tell you this: the lessons learned in the journey were invaluable.
Academic medical centers and healthcare organizations are increasingly turning to hospitalists to assume a myriad of leadership roles. With very little formal training, many of us jump in to improve organizational culture, financial accountability, and patient safety, literally building the bridge as we walk on it. The practical knowledge and know-how gleaned in efforts during these endeavors are perhaps just as important as evidence-based medicine. And yet, few venues to share and disseminate these insights currently exist.
This void represents the motivation behind the new Journal series entitled, “Leadership & Professional Development” or “LPD.” In these brief excerpts, lessons on leadership/followership, mentorship/menteeship, leading change and professional development will be shared using a conversational and pragmatic tone. Like a clinical case, pearls to help you navigate development and organizational challenges will be shared. The goal is simple: read an LPD and walk away with an “a-ha,” a new tool, or a strategy that you can use ASAP. For example, in the debut LPD—Hire Hard1—we emphasize a cardinal rule for hiring: wait for the right person. Waiting is not easy, but it is well worth it in the long run—the right person will make your job that much better. Remember the aphorism: A’s hire A’s while B’s hire C’s.
Many other nuggets of wisdom can fit an LPD model. For example, when it comes to stress, a technique that brings mindfulness to your day—one you can practice with every patient encounter—might be the ticket.2 Interested in mentoring? You’ll need to know the Six Golden Rules.3 And don’t forget about emotional intelligence, tight-loose-tight management or the tree-climbing monkey! Don’t know what these are? Time to read an LPD or two to find out!
As you might have guessed—some of these pieces are already written. They come from a book that my colleague, Sanjay Saint and I have been busy writing for over a year. The book distills much of what we have learned as clinicians, researchers and administrators into a collection we call, “Thirty Leadership Rules for Healthcare Providers.” But LPD is not an advert for the book; rather, our contributions will only account for some of the series. We hope this venue will become a platform in where readers like you can offer “pearls” to the broader community. The rules are simple: coin a rule/pearl, open with an illustrative quote, frame it in 650 words with no more than five references, and write it so that a reader can apply it to their work tomorrow. And don’t worry—we on the editorial team will help you craft th
Disclosures
Dr. Chopra has nothing to disclose.
1. Chopra V, Saint S. Hire Hard. Manage Easy. J Hosp Med. 2019;14(2):74. doi: 10.12788/jhm.3158.
2. Gilmartin H, Saint S, Rogers M, et al. Pilot randomised controlled trial to improve hand hygiene through mindful moments. BMJ Qual Saf. 2018;27(10):799-806. PubMed
3. Chopra V, Saint S. What Mentors Wish Their Mentees Knew. Harvard Business Review. 2017. https://hbr.org/2017/11/what-mentors-wish-their-mentees-knew. Accessed December 17, 2018. PubMed
“I cannot say whether things will get better if we change; what I can say is they must change if they are to get better.”
—Georg C. Lichtenburg
Leading change is never easy. Many a physician has joined a committee, hired a promising project manager, assumed responsibility for an operational or clinical task—only to have it painfully falter or agonizingly fail. Unfortunately, some of us become disillusioned with the process, donning our white coats to return to the safe ensconce of clinical work rather than take on another perilous change or leadership task. But ask those that have tried and failed and those that have succeeded and they will tell you this: the lessons learned in the journey were invaluable.
Academic medical centers and healthcare organizations are increasingly turning to hospitalists to assume a myriad of leadership roles. With very little formal training, many of us jump in to improve organizational culture, financial accountability, and patient safety, literally building the bridge as we walk on it. The practical knowledge and know-how gleaned in efforts during these endeavors are perhaps just as important as evidence-based medicine. And yet, few venues to share and disseminate these insights currently exist.
This void represents the motivation behind the new Journal series entitled, “Leadership & Professional Development” or “LPD.” In these brief excerpts, lessons on leadership/followership, mentorship/menteeship, leading change and professional development will be shared using a conversational and pragmatic tone. Like a clinical case, pearls to help you navigate development and organizational challenges will be shared. The goal is simple: read an LPD and walk away with an “a-ha,” a new tool, or a strategy that you can use ASAP. For example, in the debut LPD—Hire Hard1—we emphasize a cardinal rule for hiring: wait for the right person. Waiting is not easy, but it is well worth it in the long run—the right person will make your job that much better. Remember the aphorism: A’s hire A’s while B’s hire C’s.
Many other nuggets of wisdom can fit an LPD model. For example, when it comes to stress, a technique that brings mindfulness to your day—one you can practice with every patient encounter—might be the ticket.2 Interested in mentoring? You’ll need to know the Six Golden Rules.3 And don’t forget about emotional intelligence, tight-loose-tight management or the tree-climbing monkey! Don’t know what these are? Time to read an LPD or two to find out!
As you might have guessed—some of these pieces are already written. They come from a book that my colleague, Sanjay Saint and I have been busy writing for over a year. The book distills much of what we have learned as clinicians, researchers and administrators into a collection we call, “Thirty Leadership Rules for Healthcare Providers.” But LPD is not an advert for the book; rather, our contributions will only account for some of the series. We hope this venue will become a platform in where readers like you can offer “pearls” to the broader community. The rules are simple: coin a rule/pearl, open with an illustrative quote, frame it in 650 words with no more than five references, and write it so that a reader can apply it to their work tomorrow. And don’t worry—we on the editorial team will help you craft th
Disclosures
Dr. Chopra has nothing to disclose.
1. Chopra V, Saint S. Hire Hard. Manage Easy. J Hosp Med. 2019;14(2):74. doi: 10.12788/jhm.3158.
2. Gilmartin H, Saint S, Rogers M, et al. Pilot randomised controlled trial to improve hand hygiene through mindful moments. BMJ Qual Saf. 2018;27(10):799-806. PubMed
3. Chopra V, Saint S. What Mentors Wish Their Mentees Knew. Harvard Business Review. 2017. https://hbr.org/2017/11/what-mentors-wish-their-mentees-knew. Accessed December 17, 2018. PubMed
© 2019 Society of Hospital Medicine
A Protean Protein
A 39-year-old man presented to a neurologist with three weeks of progressive leg weakness associated with numbness in his feet and fingertips. His medical history included hypertriglyceridemia, hypogonadism, and gout. He was taking fenofibrate and colchicine as needed. There was no family history of neurologic issues. He did not smoke or drink alcohol.
The patient appeared well with a heart rate of 76 beats per minute, blood pressure 133/72 mm Hg, temperature 36.6°C, respiratory rate 16 breaths per minute, and oxygen saturation 100% on room air. His cardiopulmonary and abdominal examinations were normal. His skin was warm and dry without rashes. On neurologic examination, upper extremity strength and sensation was normal. Bilateral hip flexion, knee flexion, and knee extension strength was 4/5; bilateral ankle dorsiflexion and plantar flexion strength was 3/5. Reflexes were trace in the arms and absent at the patellae and ankles. He had symmetric, length-dependent reduction in vibration, pinprick, and light touch sensation in his legs.
Peripheral neuropathy presenting with ascending symmetric motor and sensory deficits progressing over three weeks raises the suspicion of an acquired inflammatory demyelinating polyneuropathy (AIDP), a variant of Guillain-Barre Syndrome. Alternative causes of acute polyneuropathy include thiamine (B1) deficiency, vasculitis, sarcoidosis, or malignancy, particularly lymphoma and multiple myeloma. Further evaluation should include electromyography, nerve conduction studies, lumbar puncture with cerebrospinal fluid (CSF) protein, glucose, and cell count differential. Follow-up laboratory testing based on results of the above may include serum protein electrophoresis (SPEP), serum free light chains (sFLC), vitamin B12, human immunodeficiency virus (HIV), hepatitis B and C testing, antinuclear antibody, and erythrocyte sedimentation rate.
Electromyography and nerve conduction studies revealed a sensorimotor mixed axonal/demyelinating polyneuropathy in all extremities. CSF analysis found one white cell per mm3, glucose of 93 mg/dL, and protein of 313 mg/dL. Magnetic resonance imaging (MRI) of the spine without contrast showed normal cord parenchyma. The vitamin B12 level was 441 pg/mL (normal >200 pg/mL). Antibodies to HIV-1, HIV-2, hepatitis C virus, and Borrelia burgdorferi were negative. Serum protein electrophoresis (SPEP) and immunofixation were normal.
The patient received two courses of intravenous immunoglobulin (IVIG) for suspected AIDP. His weakness progressed over the next several weeks to the point that he required a wheelchair.
Progression of symptoms beyond three weeks and lack of response to IVIG are atypical for AIDP. Alternate diagnoses for a sensorimotor polyneuropathy should be considered. Causes of subacute or chronic demyelinating polyneuropathy include inflammatory conditions (chronic inflammatory demyelinating polyneuropathy [CIDP], connective-tissue disorders), paraprotein disorders (myeloma, amyloidosis, lymphoplasmacytic lymphoma), paraneoplastic syndromes, infectious diseases (HIV, Lyme disease), infiltrative disorders (sarcoidosis), medications or toxins, and hereditary disorders. Of these etiologies, the first three seem the most likely given the history and clinical course, the negative HIV and Lyme testing, and the absence of exposures and family history. Normal SPEP and immunofixation make paraprotein disorders less likely, but sFLC testing should be sent to evaluate for a light chain-only paraprotein. A paraneoplastic antibody panel and a CT of the chest, abdomen, and pelvis should be ordered to evaluate for sarcoidosis, lymphoma, or other malignancies. Although a peripheral nerve biopsy would further classify the polyneuropathy, it is of low diagnostic yield in patients with subacute and chronic distal symmetric polyneuropathies and is associated with significant morbidity. In the absence of history or physical exam findings to narrow the differential diagnosis for polyneuropathy, testing for paraneoplastic antibodies and imaging is appropriate.
The patient tested negative for antiganglioside GM1 and antimyelin-associated glycoprotein antibodies. Urine arsenic, lead, and mercury levels were normal. Tests for serum antinuclear antibody, rapid plasmin reagin, and a paraneoplastic neuropathy panel including amphiphysin antibody, CV2 antibody, and Hu auto-antibody were negative. Repeat electrodiagnostic testing was consistent with CIDP. The patient received prednisone 60 mg daily for six weeks and was then tapered to 30 mg daily over six weeks. Concurrently, he underwent twelve cycles of plasma exchange. His strength improved, and he could walk with a cane; however, weakness recurred when steroids were further tapered.
He was maintained on prednisone 50 mg daily. Over the next year, the patient’s lower extremities became flaccid and severely atrophied. He developed hyperpigmented patches on his trunk, severe gastroesophageal reflux disease (GERD), dysphonia, and gynecomastia. He had lost 60 pounds since symptom onset. He was prescribed levothyroxine for subclinical hypothyroidism (thyroid stimulating hormone 12.63 µIU/mL [normal 0.10-5.50 µIU/mL], free thyroxine 0.8 ng/dL [0.8-1.7 ng/dL]).
At this point, the diagnosis of CIDP should be questioned, and additional investigation is warranted. Although improvement was initially observed with plasma exchange and steroids, subsequent progression of symptoms despite prednisone suggests a nonimmune-mediated etiology, such as a neoplastic or infiltrative process. Conversely, negative serologic testing for paraneoplastic antibodies may be due to an antibody that has not been well characterized.
While prednisone could explain GERD and gynecomastia, the weight loss, dysphonia, and subclinical hypothyroidism may offer clues to the diagnosis underlying the neurological symptoms. Weight loss raises suspicion of a hypercatabolic process such as cancer, cachexia, systemic inflammation, heart failure, or chronic obstructive pulmonary disease. Causes of dysphonia relevant to this presentation include neurologic dysfunction related to malignant invasion of the vagus nerve or demyelinating disease. Subclinical hypothyroidism due to chronic autoimmune thyroiditis seems most likely in the absence of a medication effect or thyroid injury, yet infiltrative disorders of the thyroid (eg, amyloidosis, sarcoidosis, lymphoma) should also be considered. A diagnosis that unifies the neurologic and nonneurologic findings would be desirable; lymphoma with paraneoplastic peripheral neuropathy manifesting as CIDP seems most likely. As of yet, CT of the chest, abdomen, and pelvis or an 18-Fluoro-deoxyglucose positron emission tomography (FDG-PET) scan have not been obtained and would be helpful to evaluate for underlying malignancy. Further evaluation for a paraprotein disorder that includes sFLC is also still indicated to rule out a paraneoplastic disorder that may be associated with polyneuropathy.
Repeat SPEP and serum immunofixation were normal. sFLC assay showed elevated levels of both kappa and lambda light chains with a ratio of 0.61 (reference range: 0.26-1.25). Urine protein electrophoresis (UPEP) from a 24-hour specimen showed a homogenous band in the gamma region, but urine immunofixation demonstrated polyclonal light chains. The plasma vascular endothelial growth factor (VEGF) level was 612 pg/mL (reference range, 31-86 pg/mL).
CT imaging of the chest, abdomen, and pelvis with contrast demonstrated an enlarged liver and spleen and possible splenic infarcts. A skeletal survey and whole-body FGD-PET scan were normal. The patient declined bone marrow biopsy.
Polyneuropathy secondary to a monoclonal protein was previously considered, and an SPEP was normal. Full evaluation for a monoclonal protein additionally requires sFLC testing. If clinical suspicion remains high after a negative result, 24-hour UPEP and urine immunofixation should be obtained. Normal results in this case argue against the presence of a monoclonal protein.
The presence of a monoclonal protein and polyneuropathy are mandatory diagnostic criteria for POEMS syndrome (polyneuropathy, organomegaly, endocrinopathy, monoclonal protein, and skin changes), a plasma cell proliferative disorder. Major diagnostic criteria include osteosclerotic bone lesions, Castleman’s disease, and markedly elevated VEGF levels. Castleman’s disease is a lymphoproliferative disorder characterized by angiofollicular lymphoid hyperplasia that results in lymphadenopathy in one or multiple lymph node regions. Imaging studies reveal organomegaly, one of many minor criteria, but not bone lesions or lymphadenopathy. A diagnosis of POEMS syndrome requires the presence of both mandatory, one major, and one minor criteria. Since only one of two of the mandatory criteria are met at this point, a diagnosis of POEMS syndrome cannot be made.
Eighteen months after symptom onset, the patient presented to the emergency department with dyspnea, orthopnea, and lower extremity edema. B-type natriuretic peptide was 1564 pg/mL. Transthoracic echocardiography showed a severely dilated and hypertrophied left ventricle. Left ventricular ejection fraction was 20%. A furosemide infusion was initiated. Angiography of the coronary vessels was not performed. Congo red stain of an abdominal adipose biopsy was negative for amyloid.
On hospital day five, he developed gangrenous changes in his right first toe. CT angiography of the abdomen and lower extremities demonstrated patent three vessel runoff to the foot with an infrarenal aortic thrombus. Heparin infusion was started. On hospital day 10, the patient developed expressive aphasia and somnolence, prompting intubation for airway protection. MRI and MR angiography (MRA) of the brain and cerebral vessels revealed multiple bilateral acute ischemic strokes (Figure 1) without flow limiting stenosis in cerebral vessels.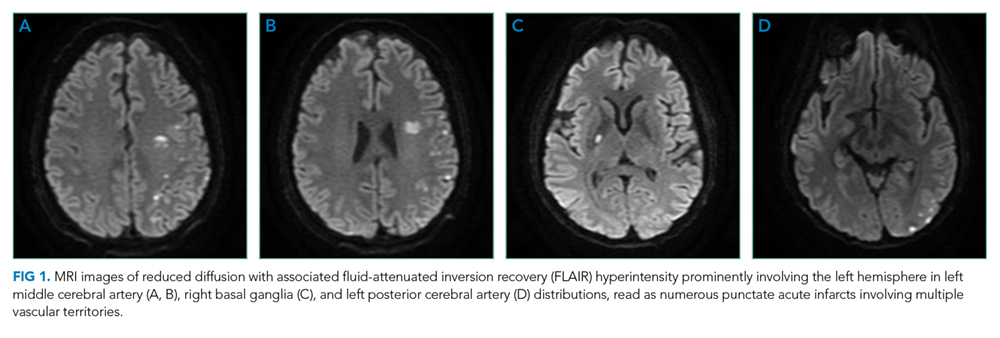
These clinical developments lead to an important opportunity to rethink this patient’s working diagnosis. The new diagnosis of heart failure in this young patient with polyneuropathy raises suspicion for an infiltrative cardiomyopathy such as amyloidosis, sarcoidosis, or Fabry disease. Of these, Fabry disease is the least likely because it is typically characterized by a painful burning sensation in response to specific triggers. Although polyneuropathy and heart failure may be concurrently observed with both sarcoidosis and amyloidosis, the absence of an apparent arrhythmia make amyloidosis the more likely of these two diagnoses. The development of an arterial thrombus and multiple strokes may represent emboli from a cardiac thrombus.
Cardiac imaging and tissue biopsy of the heart or other affected organs would distinguish between these diagnostic possibilities. An abdominal adipose biopsy negative for amyloid does not rule out amyloidosis, as the test is approximately 80% sensitive when cardiac amyloidosis is present and varies depending on the etiology of the amyloid protein (ie, light chain vs transthyretin). Evaluation of cardiac amyloid in the setting of peripheral neuropathy should include echocardiography (as was performed here) and repeat testing for a monoclonal protein.
If clinical suspicion of a paraprotein-associated disorder remains high and both SPEP and sFLC are normal, it is important to obtain a 24-hour UPEP and immunofixation. A monoclonal protein can be overlooked by SPEP and serum immunofixation if the monoclonal protein is composed only of a light chain or if the monoclonal protein is IgD or IgE. In these rare circumstances, sFLC analysis or 24-hour UPEP and immunofixation should mitigate the potential for a falsely negative SPEP/IFE. These studies are normal in this case, which argues against the presence of a monoclonal protein.
Transesophageal echocardiography showed grade IV atheromatous plaque within the descending thoracic aorta with mobile elements suggesting a superimposed thrombus; there was no intracardiac shunt or thrombus. MRA of the neck and great vessels was normal.
Testing for heparin-induced thrombocytopenia (HIT) was sent due to thrombocytopenia and the presence of thrombosis. An immunoassay for antiheparin-platelet factor 4 (anti-PF4) antibodies was substantially positive (optical density 2.178); however, functional testing with a washed platelet heparin-induced platelet activation assay was negative. Anticoagulation was changed to argatroban due to concern for HIT. Dry gangrenous changes developed in all distal toes on the right foot and three toes on the left foot. A right radial artery thrombus formed at the site of a prior arterial line.
Thrombocytopenia that develops between the fifth and tenth day following heparin exposure in a patient with new thromboses is consistent with HIT. However, the patient’s infrarenal aortic thrombus preceded the initiation of heparin, and negative functional testing undermines the diagnosis of HIT in this case. Therefore, the arterial thromboses may be related to an underlying unifying diagnosis.
A third SPEP showed a 0.1 g/dL M-spike in the gamma region, but standard immunofixation did not reveal a monoclonal protein (Figure 2). However, a specific request for immunofixation testing using IgD antisera detected an IgD heavy chain. A lambda chain comprising 3% of urine protein was detected on 24-hour urine immunofixation but was not detectable by serum immunofixation. Bone marrow biopsy demonstrated plasma cells comprising 5% of bone marrow cellularity (Figure 3); flow cytometry of the aspirate demonstrated an abnormal lambda-restricted plasma cell population.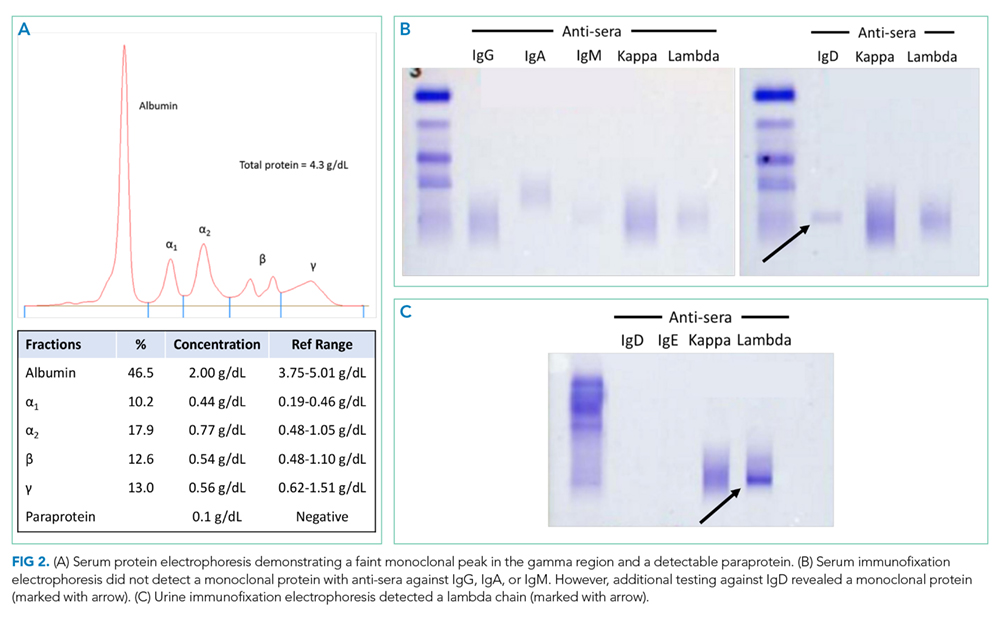
When a monoclonal protein is identified but does not react with standard antisera to detect IgG, IgM, and IgA, immunofixation with IgD and IgE antisera are necessary to rule out a monoclonal IgD or IgE protein. The underlying IgD isotype coupled with its low abundance made detection of this monoclonal protein especially challenging. With the discovery of a monoclonal protein in the context of polyneuropathy, the mandatory criteria of POEMS syndrome are met. The elevated VEGF level and hypothyroidism meet major and minor criteria, respectively. Arterial thromboses and heart failure are other features that may be observed in cases of POEMS syndrome.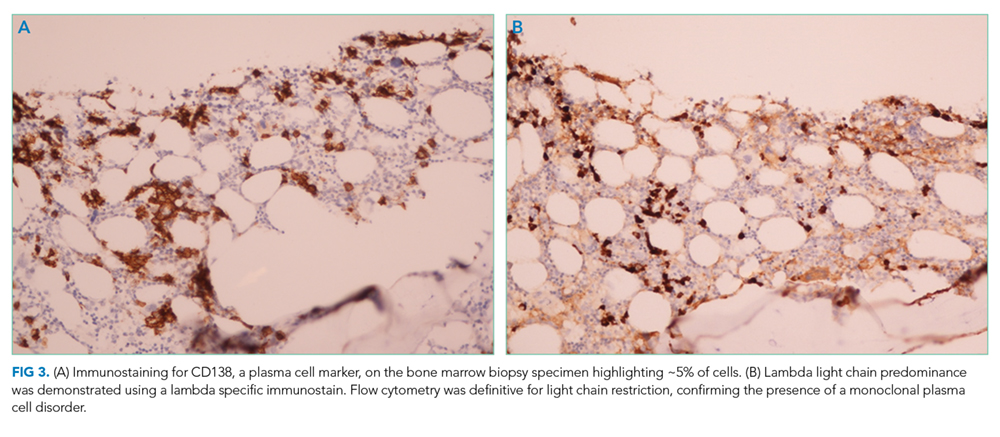
POEMS syndrome (polyneuropathy, organomegaly, endocrinopathy, M protein, and skin changes) was diagnosed. Prednisone was continued, and weekly cyclophosphamide was initiated. After six weeks, the VEGF level remained elevated, and a neurologic examination showed minimal improvement. Due to poor respiratory muscle strength and difficulty managing secretions, he underwent percutaneous tracheostomy and gastrostomy tube placement. Unfortunately, his condition further deteriorated and he subsequently died of sepsis from pneumonia.
An autopsy revealed acute bronchopneumonia and multiple acute and subacute cerebral infarctions. There was extensive peripheral mixed axonal/demyelinating neuropathy, hepatosplenomegaly, atrophy of the thyroid and adrenal glands, hyperpigmented patches and thickened integument, and severe aortic and coronary atherosclerotic disease with a healed myocardial infarction.
DISCUSSION
POEMS syndrome1 is a rare constellation of clinical and laboratory findings resulting from an underlying plasma cell proliferative disorder. This paraneoplastic syndrome is characterized by the chronic overproduction of proinflammatory and proangiogenic cytokines, including VEGF, which are postulated to drive its manifestations,2 though the exact pathogenesis is not understood. Some of the disease’s most common features are summarized by its name: polyneuropathy, organomegaly, endocrinopathy, monoclonal plasma cell disorder, and skin changes.3
The International Myeloma Working Group (IMWG) diagnostic criteria1 (Table) require the presence of both mandatory criteria (polyneuropathy and monoclonal plasma cell proliferation), plus at least one major and one minor criterion. Delayed diagnosis or misdiagnosis of this protean disorder is often driven by its rarity and clinical overlap with other paraprotein-associated polyneuropathies. These include amyloidosis, cryoglobulinemia, and monoclonal gammopathy of undetermined significance (MGUS), which can all produce antibodies directed against neural antigens. In addition, polyneuropathy is often the first and most striking manifestation of POEMS syndrome, fostering confusion with CIDP as both disorders are subacute, symmetric, motor-dominant, mixed axonal/demyelinating polyneuropathies.4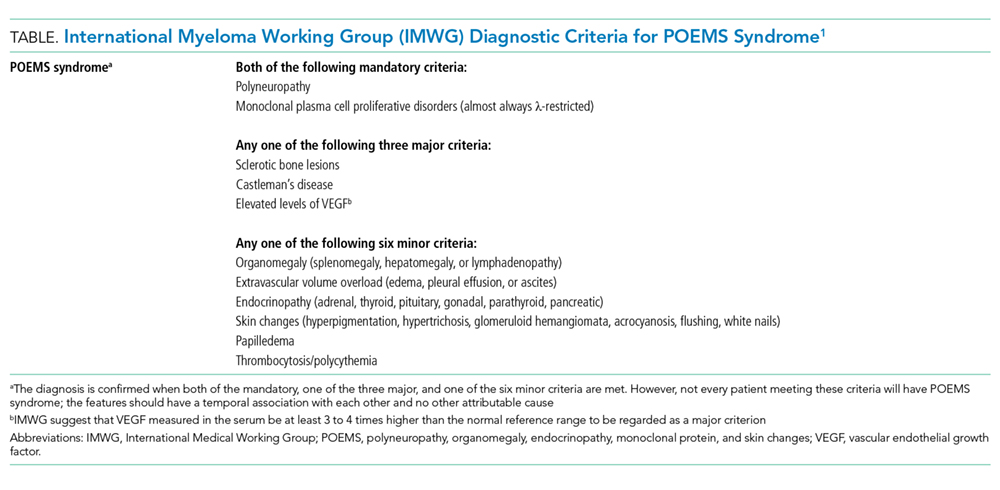
IgD and IgE monoclonal gammopathies are extremely rare. IgD myeloma, for instance, accounts for 2% of multiple myeloma cases, and IgE myeloma has been reported fewer than 50 times.5 IgD is secreted only in very small amounts, ordinarily representing 0.25% of the immunoglobulins in serum, while the majority is found in the plasma membranes of mature B-cells.6 These monoclonal gammopathies often escape detection for two reasons: (1) the very low paraprotein concentration produces undetectable or small M-protein levels on electrophoresis,5 and (2) immunofixation is routinely performed without antisera against IgD and IgE heavy chains.7
While this case depicts a rare manifestation of a rare disease, the principles underlying its elusive diagnosis are routinely encountered. Recognition of the specific limitations of the SPEP, UPEP, sFLC, and immunofixation tests, outlined below, can assist the hospitalist when suspicion for paraproteinemia is high.
First, low levels of monoclonal proteins may be associated with a normal SPEP. Accordingly, suspicion of a plasma cell dyscrasia should prompt serum immunofixation, even when the electrophoretic pattern appears normal.8
Second, laboratories routinely perform immunofixation with antisera against IgG, IgA, and IgM heavy chains and kappa and lambda light chains, whereas testing with IgD or IgE antisera must be specifically requested. Thus, clinicians should screen for the presence of IgD and IgE in patients with an apparently free monoclonal immunoglobulin light chain in the serum or with a monoclonal serum protein and negative immunofixation. In this case, the paraprotein was not detected on the first two serum electrophoreses, likely due to a low serum concentration, then missed on immunofixation due to a lack of IgD antiserum. On admission to the hospital, this patient had a very low paraprotein concentration (0.1 g/dL) on SPEP, and the lab initially reported negative immunofixation. When asked to test specifically for IgD and IgE, the lab ran a more comprehensive immunofixation revealing IgD heavy chain paraprotein.
Third, this case illustrates the limitations of the sFLC assay. IMWG guidelines specify that sFLC assay in combination with SPEP and serum immunofixation is sufficient to screen for monoclonal plasma cell proliferative disorders other than light chain amyloidosis (which requires all the serum tests as well as 24-hour urine immunofixation).9 Though the sFLC assay has been demonstrated to be more sensitive than urine analysis for detecting monoclonal free light chains,10 it is still subject to false negatives. Polyclonal gammopathy or reduced renal clearance with accumulation of free light chains in the serum may mask the presence of low levels of monoclonal sFLC,11 the latter of which likely explains why the sFLC ratio was repeatedly normal in this case. In these circumstances, monoclonal free light chains can be identified by urine studies.11 In this case, 24-hour urine immunofixation detected the excess light chain that was not evident on the sFLC assay. Even with these pitfalls in mind, there is still no evident explanation as to why the 24-hour urine studies done prior to the patient’s hospital admission did not reveal a monoclonal light chain.
This case also highlights the thrombotic diathesis in POEMS syndrome. Although the patient was treated with argatroban for suspected HIT, it is likely that the HIT antibody result was a false positive, and his thrombi were better explained by POEMS syndrome in and of itself. Coronary, limb, and cerebral artery thromboses have been linked to POEMS syndrome,12,13 all of which were present in this case. Laboratory testing for HIT involves an immunoassay to detect circulating HIT antibody and a functional assay to measure platelet activity in the presence of patient serum and heparin. The immunoassay binds anti-PF4/heparin complex irrespective of its ability to activate platelets. The presence of nonspecific antibodies may lead to cross-reactions with the immunoassay test components, which has been demonstrated in cases of MGUS.14 In this case, elevated production of monoclonal antibodies by plasma cells may have led to false-positive results. With moderate to high clinical suspicion of HIT, the combination of a positive immunoassay and negative functional assay (as in this case) make the diagnosis of HIT indeterminate.15
TEACHING POINTS
- If a monoclonal protein is suggested by SPEP but cannot be identified by standard immunofixation, request immunofixation for IgD or IgE. Screen patients for IgD and IgE paraproteins before making a diagnosis of light chain multiple myeloma.
- Polyclonal gammopathy or reduced renal clearance with accumulation of free light chains in the serum may mask the presence of low levels of monoclonal FLC and result in a normal sFLC ratio.
- Thrombosis is a less-recognized but documented feature of POEMS syndrome which may be mediated by the overproduction of proinflammatory and proangiogenic cytokines, though the precise pathogenesis is unknown.
Acknowledgment
The authors thank Dr. Theodore Kurtz and Dr. Anne Deucher from the department of laboratory medicine at the University of California, San Francisco for providing their respective expertise in clinical chemistry and hematopathology.
Disclosures
The authors have no conflicts of interests to disclose.
1. Rajkumar SV, Dimopoulos MA, Palumbo A, et al. International Myeloma Working Group. International Myeloma Working Group updated criteria for the diagnosis of multiple myeloma. Lancet Oncol. 2014;15(12):e538-ee548. doi: 10.1016/S1470-2045(14)70442-5.
1. Rajkumar SV, Dimopoulos MA, Palumbo A, et al. International Myeloma Working Group. International Myeloma Working Group updated criteria for the diagnosis of multiple myeloma. Lancet Oncol. 2014;15(12):e538-ee548. doi: 10.1016/S1470-2045(14)70442-5. PubMed
2. Watanabe O, Arimura K, Kitajima I, Osame M, Maruyama I. Greatly raised vascular endothelial growth factor (VEGF) in POEMS syndrome. Lancet. 1996;347(9002):702. doi: 10.1016/S0140-6736(96)91261-1. PubMed
3. Dispenzieri A. How I treat POEMS syndrome. Blood. 2012;119(24):5650-5658. doi: 10.1182/blood-2012-03-378992. PubMed
4. Nasu S, Misawa S, Sekiguchi Y, et al. Different neurological and physiological profiles in POEMS syndrome and chronic inflammatory demyelinating polyneuropathy. J Neurol Neurosurg Psychiatry. 2012;83(5):476-479. doi: 10.1136/jnnp-2011-301706. PubMed
5. Pandey S, Kyle RA. Unusual myelomas: a review of IgD and IgE variants. Oncology. 2013;27(8):798-803. PubMed
6. Vladutiu AO. Immunoglobulin D: properties, measurement, and clinical relevance. Clin Diagn Lab Immunol. 2000;7(2):131-140. doi: 10.1128/CDLI.7.2.131-140.2000. PubMed
7. Sinclair D, Cranfield T. IgD myeloma: A potential missed diagnosis. Ann Clin Biochem. 2001;38(5):564-565. doi: 10.1177/000456320103800517. PubMed
8. Dimopoulos M, Kyle R, Fermand JP, et al. Consensus recommendations for standard investigative workup: report of the International Myeloma Workshop Consensus Panel 3. Blood. 2011;117(18):4701-4705. doi: 10.1182/blood-2010-10-299529. PubMed
9. Dispenzieri A, Kyle R, Merlini G, et al. International Myeloma Working Group. International Myeloma Working Group guidelines for serum-free light chain analysis in multiple myeloma and related disorders. Leukemia. 2009;23(2):215-224. doi: 10.1038/leu.2008.307. PubMed
10. Dejoie T, Attal M, Moreau P, Harousseau JL, Avet-Loiseau H. Comparison of serum free light chain and urine electrophoresis for the detection of the light chain component of monoclonal immunoglobulins in light chain and intact immunoglobulin multiple myeloma. Haematologica. 2016;101(3):356-362. doi: 10.3324/haematol.2015.126797. PubMed
11. Levinson SS. Polyclonal free light chain of Ig may interfere with interpretation of monoclonal free light chain κ/λ ratio. Ann Clin Lab Sci. 2010;40(4):348-353. PubMed
12. Dispenzieri A, Kyle RA, Lacy MQ, et al. POEMS syndrome: definitions and long-term outcome. Blood. 2003;101(7):2496-2506. doi: 10.1182/blood-2002-07-2299. PubMed
13. Dupont SA, Dispenzieri A, Mauermann ML, Rabinstein AA, Brown RD. Cerebral infarction in POEMS syndrome: incidence, risk factors, and imaging characteristics. Neurology. 2009;73(16):1308-1312. doi: 10.1212/WNL.0b013e3181bd136b. PubMed
14. Markovic I, Debeljak Z, Bosnjak B, Marijanovic M. False positive immunoassay for heparin-induced thrombocytopenia in the presence of monoclonal gammopathy: a case report. Biochemia Medica. 2017;27(3):030801. doi: 10.11613/BM.2017.030801. PubMed
15. Cuker A, Cines DB. How I treat heparin-induced thrombocytopenia. Blood. 2012;119(10):2209-2218. doi: 10.1182/blood-2011-11-376293. PubMed
A 39-year-old man presented to a neurologist with three weeks of progressive leg weakness associated with numbness in his feet and fingertips. His medical history included hypertriglyceridemia, hypogonadism, and gout. He was taking fenofibrate and colchicine as needed. There was no family history of neurologic issues. He did not smoke or drink alcohol.
The patient appeared well with a heart rate of 76 beats per minute, blood pressure 133/72 mm Hg, temperature 36.6°C, respiratory rate 16 breaths per minute, and oxygen saturation 100% on room air. His cardiopulmonary and abdominal examinations were normal. His skin was warm and dry without rashes. On neurologic examination, upper extremity strength and sensation was normal. Bilateral hip flexion, knee flexion, and knee extension strength was 4/5; bilateral ankle dorsiflexion and plantar flexion strength was 3/5. Reflexes were trace in the arms and absent at the patellae and ankles. He had symmetric, length-dependent reduction in vibration, pinprick, and light touch sensation in his legs.
Peripheral neuropathy presenting with ascending symmetric motor and sensory deficits progressing over three weeks raises the suspicion of an acquired inflammatory demyelinating polyneuropathy (AIDP), a variant of Guillain-Barre Syndrome. Alternative causes of acute polyneuropathy include thiamine (B1) deficiency, vasculitis, sarcoidosis, or malignancy, particularly lymphoma and multiple myeloma. Further evaluation should include electromyography, nerve conduction studies, lumbar puncture with cerebrospinal fluid (CSF) protein, glucose, and cell count differential. Follow-up laboratory testing based on results of the above may include serum protein electrophoresis (SPEP), serum free light chains (sFLC), vitamin B12, human immunodeficiency virus (HIV), hepatitis B and C testing, antinuclear antibody, and erythrocyte sedimentation rate.
Electromyography and nerve conduction studies revealed a sensorimotor mixed axonal/demyelinating polyneuropathy in all extremities. CSF analysis found one white cell per mm3, glucose of 93 mg/dL, and protein of 313 mg/dL. Magnetic resonance imaging (MRI) of the spine without contrast showed normal cord parenchyma. The vitamin B12 level was 441 pg/mL (normal >200 pg/mL). Antibodies to HIV-1, HIV-2, hepatitis C virus, and Borrelia burgdorferi were negative. Serum protein electrophoresis (SPEP) and immunofixation were normal.
The patient received two courses of intravenous immunoglobulin (IVIG) for suspected AIDP. His weakness progressed over the next several weeks to the point that he required a wheelchair.
Progression of symptoms beyond three weeks and lack of response to IVIG are atypical for AIDP. Alternate diagnoses for a sensorimotor polyneuropathy should be considered. Causes of subacute or chronic demyelinating polyneuropathy include inflammatory conditions (chronic inflammatory demyelinating polyneuropathy [CIDP], connective-tissue disorders), paraprotein disorders (myeloma, amyloidosis, lymphoplasmacytic lymphoma), paraneoplastic syndromes, infectious diseases (HIV, Lyme disease), infiltrative disorders (sarcoidosis), medications or toxins, and hereditary disorders. Of these etiologies, the first three seem the most likely given the history and clinical course, the negative HIV and Lyme testing, and the absence of exposures and family history. Normal SPEP and immunofixation make paraprotein disorders less likely, but sFLC testing should be sent to evaluate for a light chain-only paraprotein. A paraneoplastic antibody panel and a CT of the chest, abdomen, and pelvis should be ordered to evaluate for sarcoidosis, lymphoma, or other malignancies. Although a peripheral nerve biopsy would further classify the polyneuropathy, it is of low diagnostic yield in patients with subacute and chronic distal symmetric polyneuropathies and is associated with significant morbidity. In the absence of history or physical exam findings to narrow the differential diagnosis for polyneuropathy, testing for paraneoplastic antibodies and imaging is appropriate.
The patient tested negative for antiganglioside GM1 and antimyelin-associated glycoprotein antibodies. Urine arsenic, lead, and mercury levels were normal. Tests for serum antinuclear antibody, rapid plasmin reagin, and a paraneoplastic neuropathy panel including amphiphysin antibody, CV2 antibody, and Hu auto-antibody were negative. Repeat electrodiagnostic testing was consistent with CIDP. The patient received prednisone 60 mg daily for six weeks and was then tapered to 30 mg daily over six weeks. Concurrently, he underwent twelve cycles of plasma exchange. His strength improved, and he could walk with a cane; however, weakness recurred when steroids were further tapered.
He was maintained on prednisone 50 mg daily. Over the next year, the patient’s lower extremities became flaccid and severely atrophied. He developed hyperpigmented patches on his trunk, severe gastroesophageal reflux disease (GERD), dysphonia, and gynecomastia. He had lost 60 pounds since symptom onset. He was prescribed levothyroxine for subclinical hypothyroidism (thyroid stimulating hormone 12.63 µIU/mL [normal 0.10-5.50 µIU/mL], free thyroxine 0.8 ng/dL [0.8-1.7 ng/dL]).
At this point, the diagnosis of CIDP should be questioned, and additional investigation is warranted. Although improvement was initially observed with plasma exchange and steroids, subsequent progression of symptoms despite prednisone suggests a nonimmune-mediated etiology, such as a neoplastic or infiltrative process. Conversely, negative serologic testing for paraneoplastic antibodies may be due to an antibody that has not been well characterized.
While prednisone could explain GERD and gynecomastia, the weight loss, dysphonia, and subclinical hypothyroidism may offer clues to the diagnosis underlying the neurological symptoms. Weight loss raises suspicion of a hypercatabolic process such as cancer, cachexia, systemic inflammation, heart failure, or chronic obstructive pulmonary disease. Causes of dysphonia relevant to this presentation include neurologic dysfunction related to malignant invasion of the vagus nerve or demyelinating disease. Subclinical hypothyroidism due to chronic autoimmune thyroiditis seems most likely in the absence of a medication effect or thyroid injury, yet infiltrative disorders of the thyroid (eg, amyloidosis, sarcoidosis, lymphoma) should also be considered. A diagnosis that unifies the neurologic and nonneurologic findings would be desirable; lymphoma with paraneoplastic peripheral neuropathy manifesting as CIDP seems most likely. As of yet, CT of the chest, abdomen, and pelvis or an 18-Fluoro-deoxyglucose positron emission tomography (FDG-PET) scan have not been obtained and would be helpful to evaluate for underlying malignancy. Further evaluation for a paraprotein disorder that includes sFLC is also still indicated to rule out a paraneoplastic disorder that may be associated with polyneuropathy.
Repeat SPEP and serum immunofixation were normal. sFLC assay showed elevated levels of both kappa and lambda light chains with a ratio of 0.61 (reference range: 0.26-1.25). Urine protein electrophoresis (UPEP) from a 24-hour specimen showed a homogenous band in the gamma region, but urine immunofixation demonstrated polyclonal light chains. The plasma vascular endothelial growth factor (VEGF) level was 612 pg/mL (reference range, 31-86 pg/mL).
CT imaging of the chest, abdomen, and pelvis with contrast demonstrated an enlarged liver and spleen and possible splenic infarcts. A skeletal survey and whole-body FGD-PET scan were normal. The patient declined bone marrow biopsy.
Polyneuropathy secondary to a monoclonal protein was previously considered, and an SPEP was normal. Full evaluation for a monoclonal protein additionally requires sFLC testing. If clinical suspicion remains high after a negative result, 24-hour UPEP and urine immunofixation should be obtained. Normal results in this case argue against the presence of a monoclonal protein.
The presence of a monoclonal protein and polyneuropathy are mandatory diagnostic criteria for POEMS syndrome (polyneuropathy, organomegaly, endocrinopathy, monoclonal protein, and skin changes), a plasma cell proliferative disorder. Major diagnostic criteria include osteosclerotic bone lesions, Castleman’s disease, and markedly elevated VEGF levels. Castleman’s disease is a lymphoproliferative disorder characterized by angiofollicular lymphoid hyperplasia that results in lymphadenopathy in one or multiple lymph node regions. Imaging studies reveal organomegaly, one of many minor criteria, but not bone lesions or lymphadenopathy. A diagnosis of POEMS syndrome requires the presence of both mandatory, one major, and one minor criteria. Since only one of two of the mandatory criteria are met at this point, a diagnosis of POEMS syndrome cannot be made.
Eighteen months after symptom onset, the patient presented to the emergency department with dyspnea, orthopnea, and lower extremity edema. B-type natriuretic peptide was 1564 pg/mL. Transthoracic echocardiography showed a severely dilated and hypertrophied left ventricle. Left ventricular ejection fraction was 20%. A furosemide infusion was initiated. Angiography of the coronary vessels was not performed. Congo red stain of an abdominal adipose biopsy was negative for amyloid.
On hospital day five, he developed gangrenous changes in his right first toe. CT angiography of the abdomen and lower extremities demonstrated patent three vessel runoff to the foot with an infrarenal aortic thrombus. Heparin infusion was started. On hospital day 10, the patient developed expressive aphasia and somnolence, prompting intubation for airway protection. MRI and MR angiography (MRA) of the brain and cerebral vessels revealed multiple bilateral acute ischemic strokes (Figure 1) without flow limiting stenosis in cerebral vessels.
These clinical developments lead to an important opportunity to rethink this patient’s working diagnosis. The new diagnosis of heart failure in this young patient with polyneuropathy raises suspicion for an infiltrative cardiomyopathy such as amyloidosis, sarcoidosis, or Fabry disease. Of these, Fabry disease is the least likely because it is typically characterized by a painful burning sensation in response to specific triggers. Although polyneuropathy and heart failure may be concurrently observed with both sarcoidosis and amyloidosis, the absence of an apparent arrhythmia make amyloidosis the more likely of these two diagnoses. The development of an arterial thrombus and multiple strokes may represent emboli from a cardiac thrombus.
Cardiac imaging and tissue biopsy of the heart or other affected organs would distinguish between these diagnostic possibilities. An abdominal adipose biopsy negative for amyloid does not rule out amyloidosis, as the test is approximately 80% sensitive when cardiac amyloidosis is present and varies depending on the etiology of the amyloid protein (ie, light chain vs transthyretin). Evaluation of cardiac amyloid in the setting of peripheral neuropathy should include echocardiography (as was performed here) and repeat testing for a monoclonal protein.
If clinical suspicion of a paraprotein-associated disorder remains high and both SPEP and sFLC are normal, it is important to obtain a 24-hour UPEP and immunofixation. A monoclonal protein can be overlooked by SPEP and serum immunofixation if the monoclonal protein is composed only of a light chain or if the monoclonal protein is IgD or IgE. In these rare circumstances, sFLC analysis or 24-hour UPEP and immunofixation should mitigate the potential for a falsely negative SPEP/IFE. These studies are normal in this case, which argues against the presence of a monoclonal protein.
Transesophageal echocardiography showed grade IV atheromatous plaque within the descending thoracic aorta with mobile elements suggesting a superimposed thrombus; there was no intracardiac shunt or thrombus. MRA of the neck and great vessels was normal.
Testing for heparin-induced thrombocytopenia (HIT) was sent due to thrombocytopenia and the presence of thrombosis. An immunoassay for antiheparin-platelet factor 4 (anti-PF4) antibodies was substantially positive (optical density 2.178); however, functional testing with a washed platelet heparin-induced platelet activation assay was negative. Anticoagulation was changed to argatroban due to concern for HIT. Dry gangrenous changes developed in all distal toes on the right foot and three toes on the left foot. A right radial artery thrombus formed at the site of a prior arterial line.
Thrombocytopenia that develops between the fifth and tenth day following heparin exposure in a patient with new thromboses is consistent with HIT. However, the patient’s infrarenal aortic thrombus preceded the initiation of heparin, and negative functional testing undermines the diagnosis of HIT in this case. Therefore, the arterial thromboses may be related to an underlying unifying diagnosis.
A third SPEP showed a 0.1 g/dL M-spike in the gamma region, but standard immunofixation did not reveal a monoclonal protein (Figure 2). However, a specific request for immunofixation testing using IgD antisera detected an IgD heavy chain. A lambda chain comprising 3% of urine protein was detected on 24-hour urine immunofixation but was not detectable by serum immunofixation. Bone marrow biopsy demonstrated plasma cells comprising 5% of bone marrow cellularity (Figure 3); flow cytometry of the aspirate demonstrated an abnormal lambda-restricted plasma cell population.
When a monoclonal protein is identified but does not react with standard antisera to detect IgG, IgM, and IgA, immunofixation with IgD and IgE antisera are necessary to rule out a monoclonal IgD or IgE protein. The underlying IgD isotype coupled with its low abundance made detection of this monoclonal protein especially challenging. With the discovery of a monoclonal protein in the context of polyneuropathy, the mandatory criteria of POEMS syndrome are met. The elevated VEGF level and hypothyroidism meet major and minor criteria, respectively. Arterial thromboses and heart failure are other features that may be observed in cases of POEMS syndrome.
POEMS syndrome (polyneuropathy, organomegaly, endocrinopathy, M protein, and skin changes) was diagnosed. Prednisone was continued, and weekly cyclophosphamide was initiated. After six weeks, the VEGF level remained elevated, and a neurologic examination showed minimal improvement. Due to poor respiratory muscle strength and difficulty managing secretions, he underwent percutaneous tracheostomy and gastrostomy tube placement. Unfortunately, his condition further deteriorated and he subsequently died of sepsis from pneumonia.
An autopsy revealed acute bronchopneumonia and multiple acute and subacute cerebral infarctions. There was extensive peripheral mixed axonal/demyelinating neuropathy, hepatosplenomegaly, atrophy of the thyroid and adrenal glands, hyperpigmented patches and thickened integument, and severe aortic and coronary atherosclerotic disease with a healed myocardial infarction.
DISCUSSION
POEMS syndrome1 is a rare constellation of clinical and laboratory findings resulting from an underlying plasma cell proliferative disorder. This paraneoplastic syndrome is characterized by the chronic overproduction of proinflammatory and proangiogenic cytokines, including VEGF, which are postulated to drive its manifestations,2 though the exact pathogenesis is not understood. Some of the disease’s most common features are summarized by its name: polyneuropathy, organomegaly, endocrinopathy, monoclonal plasma cell disorder, and skin changes.3
The International Myeloma Working Group (IMWG) diagnostic criteria1 (Table) require the presence of both mandatory criteria (polyneuropathy and monoclonal plasma cell proliferation), plus at least one major and one minor criterion. Delayed diagnosis or misdiagnosis of this protean disorder is often driven by its rarity and clinical overlap with other paraprotein-associated polyneuropathies. These include amyloidosis, cryoglobulinemia, and monoclonal gammopathy of undetermined significance (MGUS), which can all produce antibodies directed against neural antigens. In addition, polyneuropathy is often the first and most striking manifestation of POEMS syndrome, fostering confusion with CIDP as both disorders are subacute, symmetric, motor-dominant, mixed axonal/demyelinating polyneuropathies.4
IgD and IgE monoclonal gammopathies are extremely rare. IgD myeloma, for instance, accounts for 2% of multiple myeloma cases, and IgE myeloma has been reported fewer than 50 times.5 IgD is secreted only in very small amounts, ordinarily representing 0.25% of the immunoglobulins in serum, while the majority is found in the plasma membranes of mature B-cells.6 These monoclonal gammopathies often escape detection for two reasons: (1) the very low paraprotein concentration produces undetectable or small M-protein levels on electrophoresis,5 and (2) immunofixation is routinely performed without antisera against IgD and IgE heavy chains.7
While this case depicts a rare manifestation of a rare disease, the principles underlying its elusive diagnosis are routinely encountered. Recognition of the specific limitations of the SPEP, UPEP, sFLC, and immunofixation tests, outlined below, can assist the hospitalist when suspicion for paraproteinemia is high.
First, low levels of monoclonal proteins may be associated with a normal SPEP. Accordingly, suspicion of a plasma cell dyscrasia should prompt serum immunofixation, even when the electrophoretic pattern appears normal.8
Second, laboratories routinely perform immunofixation with antisera against IgG, IgA, and IgM heavy chains and kappa and lambda light chains, whereas testing with IgD or IgE antisera must be specifically requested. Thus, clinicians should screen for the presence of IgD and IgE in patients with an apparently free monoclonal immunoglobulin light chain in the serum or with a monoclonal serum protein and negative immunofixation. In this case, the paraprotein was not detected on the first two serum electrophoreses, likely due to a low serum concentration, then missed on immunofixation due to a lack of IgD antiserum. On admission to the hospital, this patient had a very low paraprotein concentration (0.1 g/dL) on SPEP, and the lab initially reported negative immunofixation. When asked to test specifically for IgD and IgE, the lab ran a more comprehensive immunofixation revealing IgD heavy chain paraprotein.
Third, this case illustrates the limitations of the sFLC assay. IMWG guidelines specify that sFLC assay in combination with SPEP and serum immunofixation is sufficient to screen for monoclonal plasma cell proliferative disorders other than light chain amyloidosis (which requires all the serum tests as well as 24-hour urine immunofixation).9 Though the sFLC assay has been demonstrated to be more sensitive than urine analysis for detecting monoclonal free light chains,10 it is still subject to false negatives. Polyclonal gammopathy or reduced renal clearance with accumulation of free light chains in the serum may mask the presence of low levels of monoclonal sFLC,11 the latter of which likely explains why the sFLC ratio was repeatedly normal in this case. In these circumstances, monoclonal free light chains can be identified by urine studies.11 In this case, 24-hour urine immunofixation detected the excess light chain that was not evident on the sFLC assay. Even with these pitfalls in mind, there is still no evident explanation as to why the 24-hour urine studies done prior to the patient’s hospital admission did not reveal a monoclonal light chain.
This case also highlights the thrombotic diathesis in POEMS syndrome. Although the patient was treated with argatroban for suspected HIT, it is likely that the HIT antibody result was a false positive, and his thrombi were better explained by POEMS syndrome in and of itself. Coronary, limb, and cerebral artery thromboses have been linked to POEMS syndrome,12,13 all of which were present in this case. Laboratory testing for HIT involves an immunoassay to detect circulating HIT antibody and a functional assay to measure platelet activity in the presence of patient serum and heparin. The immunoassay binds anti-PF4/heparin complex irrespective of its ability to activate platelets. The presence of nonspecific antibodies may lead to cross-reactions with the immunoassay test components, which has been demonstrated in cases of MGUS.14 In this case, elevated production of monoclonal antibodies by plasma cells may have led to false-positive results. With moderate to high clinical suspicion of HIT, the combination of a positive immunoassay and negative functional assay (as in this case) make the diagnosis of HIT indeterminate.15
TEACHING POINTS
- If a monoclonal protein is suggested by SPEP but cannot be identified by standard immunofixation, request immunofixation for IgD or IgE. Screen patients for IgD and IgE paraproteins before making a diagnosis of light chain multiple myeloma.
- Polyclonal gammopathy or reduced renal clearance with accumulation of free light chains in the serum may mask the presence of low levels of monoclonal FLC and result in a normal sFLC ratio.
- Thrombosis is a less-recognized but documented feature of POEMS syndrome which may be mediated by the overproduction of proinflammatory and proangiogenic cytokines, though the precise pathogenesis is unknown.
Acknowledgment
The authors thank Dr. Theodore Kurtz and Dr. Anne Deucher from the department of laboratory medicine at the University of California, San Francisco for providing their respective expertise in clinical chemistry and hematopathology.
Disclosures
The authors have no conflicts of interests to disclose.
1. Rajkumar SV, Dimopoulos MA, Palumbo A, et al. International Myeloma Working Group. International Myeloma Working Group updated criteria for the diagnosis of multiple myeloma. Lancet Oncol. 2014;15(12):e538-ee548. doi: 10.1016/S1470-2045(14)70442-5.
1. Rajkumar SV, Dimopoulos MA, Palumbo A, et al. International Myeloma Working Group. International Myeloma Working Group updated criteria for the diagnosis of multiple myeloma. Lancet Oncol. 2014;15(12):e538-ee548. doi: 10.1016/S1470-2045(14)70442-5. PubMed
2. Watanabe O, Arimura K, Kitajima I, Osame M, Maruyama I. Greatly raised vascular endothelial growth factor (VEGF) in POEMS syndrome. Lancet. 1996;347(9002):702. doi: 10.1016/S0140-6736(96)91261-1. PubMed
3. Dispenzieri A. How I treat POEMS syndrome. Blood. 2012;119(24):5650-5658. doi: 10.1182/blood-2012-03-378992. PubMed
4. Nasu S, Misawa S, Sekiguchi Y, et al. Different neurological and physiological profiles in POEMS syndrome and chronic inflammatory demyelinating polyneuropathy. J Neurol Neurosurg Psychiatry. 2012;83(5):476-479. doi: 10.1136/jnnp-2011-301706. PubMed
5. Pandey S, Kyle RA. Unusual myelomas: a review of IgD and IgE variants. Oncology. 2013;27(8):798-803. PubMed
6. Vladutiu AO. Immunoglobulin D: properties, measurement, and clinical relevance. Clin Diagn Lab Immunol. 2000;7(2):131-140. doi: 10.1128/CDLI.7.2.131-140.2000. PubMed
7. Sinclair D, Cranfield T. IgD myeloma: A potential missed diagnosis. Ann Clin Biochem. 2001;38(5):564-565. doi: 10.1177/000456320103800517. PubMed
8. Dimopoulos M, Kyle R, Fermand JP, et al. Consensus recommendations for standard investigative workup: report of the International Myeloma Workshop Consensus Panel 3. Blood. 2011;117(18):4701-4705. doi: 10.1182/blood-2010-10-299529. PubMed
9. Dispenzieri A, Kyle R, Merlini G, et al. International Myeloma Working Group. International Myeloma Working Group guidelines for serum-free light chain analysis in multiple myeloma and related disorders. Leukemia. 2009;23(2):215-224. doi: 10.1038/leu.2008.307. PubMed
10. Dejoie T, Attal M, Moreau P, Harousseau JL, Avet-Loiseau H. Comparison of serum free light chain and urine electrophoresis for the detection of the light chain component of monoclonal immunoglobulins in light chain and intact immunoglobulin multiple myeloma. Haematologica. 2016;101(3):356-362. doi: 10.3324/haematol.2015.126797. PubMed
11. Levinson SS. Polyclonal free light chain of Ig may interfere with interpretation of monoclonal free light chain κ/λ ratio. Ann Clin Lab Sci. 2010;40(4):348-353. PubMed
12. Dispenzieri A, Kyle RA, Lacy MQ, et al. POEMS syndrome: definitions and long-term outcome. Blood. 2003;101(7):2496-2506. doi: 10.1182/blood-2002-07-2299. PubMed
13. Dupont SA, Dispenzieri A, Mauermann ML, Rabinstein AA, Brown RD. Cerebral infarction in POEMS syndrome: incidence, risk factors, and imaging characteristics. Neurology. 2009;73(16):1308-1312. doi: 10.1212/WNL.0b013e3181bd136b. PubMed
14. Markovic I, Debeljak Z, Bosnjak B, Marijanovic M. False positive immunoassay for heparin-induced thrombocytopenia in the presence of monoclonal gammopathy: a case report. Biochemia Medica. 2017;27(3):030801. doi: 10.11613/BM.2017.030801. PubMed
15. Cuker A, Cines DB. How I treat heparin-induced thrombocytopenia. Blood. 2012;119(10):2209-2218. doi: 10.1182/blood-2011-11-376293. PubMed
© 2019 Society of Hospital Medicine
Ethical Considerations in the Care of Hospitalized Patients with Opioid Use and Injection Drug Use Disorders
“Lord have mercy on me, was the kneeling drunkard’s plea.”
—Johnny Cash
The Diagnostic and Statistical Manual of the American Psychiatric Association defines opioid-use disorder (OUD) as a problematic pattern of prescription and/or illicit opioid medication use leading to clinically significant impairment or distress.1 Compared with their non-OUD counterparts, patients with OUD have poorer overall health and worse health service outcomes, including higher rates of morbidity, mortality, HIV and HCV transmission, and 30-day readmissions.2 With the rate of fatal overdoses from opioids at crisis levels, leading scientific and professional organizations have declared OUD to be a public health emergency in the United States.3
The opioid epidemic affects hospitalists through the rising incidence of hospitalization, not only as a result of OUD’s indirect complications, but also its direct effects of intoxication and withdrawal.4 In caring for patients with OUD, hospitalists are often presented with many ethical dilemmas. Whether the dilemma involves timing and circumstances of discharge or the permission to leave the hospital floor, they often involve elements of mutual mistrust. In qualitative ethnographic studies, patients with OUD report not trusting that the medical staff will take their concerns of inadequately treated pain and other needs seriously. Providers may mistrust the patient’s report of pain and withhold treatment for OUD for nonclinical reasons.5 Here, we examine two ethical dilemmas specific to OUD in hospitalized patients. Our aim in describing these dilemmas is to help hospitalists recognize that targeting issues of mistrust may assist them to deliver better care to hospitalized patients with OUD.
DISCHARGING HOSPITALIZED PATIENTS WITH OUD
In the inpatient setting, ethical dilemmas surrounding discharge are common among people who inject drugs (PWID). These patients have disproportionately high rates of soft tissue and systemic infections, such as endocarditis and osteomyelitis, and subsequently often require long-term, outpatient parenteral antibiotic therapy (OPAT).6 From both the clinical and ethical perspectives, discharging PWID requiring OPAT to an unsupervised setting or continuing inpatient hospitalization to prevent a potential adverse event are equally imperfect solutions.
These patients may be clinically stable, suitable for discharge, and prefer to be discharged, but the practitioner’s concerns regarding untoward complications frequently override the patient’s wishes. Valid reasons for this exercise of what could be considered soft-paternalism are considered when physicians unilaterally decide what is best for patients, including refusal of community agencies to provide OPAT to PWID, inadequate social support and/or health literacy to administer the therapy, or varying degrees of homelessness that can affect timely follow-up. However, surveys of both hospitalists and infectious disease specialists also indicate that they may avoid discharge because of concerns the PWID will tamper with the intravenous (IV) catheter to inject drugs.7 This reluctance to discharge otherwise socially and medically suitable patients increases length of stay,7 decreases patient satisfaction, and could lead to misuse of limited hospital resources.
Both patient mistrust and stigmatization may contribute to this dilemma. Healthcare professionals have been shown to share and reflect a long-standing bias in their attitudes toward patients with substance-use disorders and OUD, in particular.8 Studies of providers’ attitudes are limited but suggest that legal concerns over liability and professional sanctions,9 reluctance to contribute to the development or relapse of addiction,10 and a strong psychological investment in not being deceived by the patient11 may influence physicians’ decisions about care.
Closely supervising IV antibiotic therapy for all PWID may not reflect current medical knowledge and may imply a moral assessment of patients’ culpability and lack of will power to resist using drugs.12 No evidence is available to suggest that inpatient parenteral antibiotic treatment offers superior adherence, and emerging evidence showing that carefully selected patients with an injection drug-use history can be safely and effectively treated as outpatients has been obtained.13,14 Ho et al. found high rates of treatment success in patients with adequate housing, a reliable guardian, and willingness to comply with appropriate IV catheter use.13 Although the study by Buehrle et al. found higher rates of OPAT failure among PWIDs, 25% of these failures were due to adverse drug reactions and only 2% were due to documented line manipulations.14 This research suggests that disposition to alternative settings for OPAT in PWID may be feasible, reasonable, and deserving of further study. Rather than treating PWIDs as a homogenous group of increased risk, contextualizing care based on individual risk stratification promotes more patient-centered care that is medically appropriate and potentially more cost efficient. A
Patient-centered approaches that respond to the individual needs of patients have altered the care delivery model in order to improve health services outcomes. In developing an alternative care model to inpatient treatment in PWID who required OPAT, Jafari et al.15 evaluated a community model of care that provided a home-like residence as an alternative to hospitalization where patients could receive OPAT in a medically and socially supportive environment. This environment, which included RN and mental health staff for substance-use counseling, wound care, medication management, and IV therapy, demonstrated lower rates of against medical advice (AMA) discharge and higher patient satisfaction compared with hospitalization.15
MOBILITY OFF OF THE HOSPITAL FLOOR FOR HOSPITALIZED PATIENTS WITH OUD
Ethical dilemmas may also arise when patients with OUD desire greater mobility in the hospital. Although some inpatients may be permitted to leave the floor, some treatment teams may believe that patients with OUD leave the floor to use drugs and that the patient’s IV will facilitate such behavior. Nursing and medical staff may also believe that, if they agree to a request to leave the floor, they are complicit in any potential drug use or harmful consequences resulting from this use. For their part, patients may have a desire for more mobility because of the sometimes unpleasant constraints of hospitalization, which are not unique to these patients16 or to distract them from their cravings. Patients, unable to tolerate the restriction emotionally or believing they are being treated unfairly, even punitively, may leave AMA rather than complete needed medical care. Once more, distrust of the patient and fear of liability may lead hospital staff to respond in counterproductive ways.
Addressing this dilemma depends, in part on creating an environment where PWID and patients with OUD are treated fairly and appropriately for their underlying illness. Such treatment includes ensuring withdrawal symptoms and pain are adequately treated, building trust by empathically addressing patients’ needs and preferences,17 and having a systematic (ie, policy-based) approach for requests to leave the floor. Th
Efforts to adequately treat withdrawal symptoms in the hospital setting have shown promise in maintaining patient engagement, reducing the rate of AMA discharges, and improving follow up with outpatient medical and substance-use treatment.18 Because physicians consistently cite the lack of advanced training in addiction medicine as a treatment limitation,12 training may go a long way in closing this knowledge and skill gap. Furthermore, systematic efforts to better educate and train hospitalists in the care of patients with addiction can improve both knowledge and attitudes about caring for this vulnerable population,19 thereby enhancing therapeutic relationships and patient centeredness. Finally, institutional policies promoting fair, systematic, and transparent guidance are needed for front-line practitioners to manage the legal, clinical, and ethical ambiguities involved when PWID wish to leave the hospital floor.
ENHANCING CARE DELIVERY TO PATIENTS WITH OUD
In addressing the mistrust some staff may have toward the patients described in the preceding ethical dilemmas, the use of universal precautions is an ethical and efficacious approach that balances reliance on patients’ veracity with due diligence in objective clinical assessments.20 These universal precautions, which are grounded in mutual respect and responsibility between physician and patient, include a set of strategies originally established in infectious disease practice and adapted to the management of chronic pain particularly when opioids are used.21 They are based on the recognition that identifying which patients prescribed opioids will develop an OUD or misuse opioids is difficult. Hence, the safest and least-stigmatizing approach is to treat all patients as individuals who could potentially be at risk. This is an ethically strong approach that seeks to balance the competing values of patent safety and patient centeredness, and involves taking a substance-use history from all patients admitted to the hospital and routinely checking state prescription-drug monitoring programs among other steps. Although self-reporting, at least of prescription-drug misuse, is fairly reliable,22 establishing expectations for mutual respect when working with patients with OUD and other addictive disorders is more likely to garner valid reports and a positive alliance. Once this relationship is established, the practitioner can respond to problematic behaviors with clear, compassionate limit setting.
From a broader perspective, a hospital system and culture that is unable to promote trust and adequately treat pain and withdrawal can create a “risk environment” for PWID.23 When providers are inadequately trained in the management of pain and addiction, or there is a shortage of addiction specialists, or inadequate policy guidance for managing the care of these patients, this can result in AMA discharges and reduced willingness to seek future care. Viewing this problem more expansively may persuade healthcare professionals that patients alone are not entirely responsible for the outcomes related to their illness but that modifying practices and structure at the hospital level has the potential to mitigate harm to this vulnerable population.
As inpatient team leaders, hospitalists have the unique opportunity to address the opioid crisis by enhancing the quality of care provided to hospitalized patients with OUD. This enhancement can be accomplished by destigmatizing substance-use disorders, establishing relationships of trust, and promoting remedies to structural deficiencies in the healthcare system that contribute to the problem. These approaches have the potential to enhance not only the care of patients with OUD but also the satisfaction of the treatment team caring for these patients.24 Su
Disclosures
The authors have no conflicts of interest to disclose, financial or otherwise. The views expressed in this article are those of the authors and do not necessarily reflect the position or policy of the U.S. Department of Veterans Affairs, the U.S. Government, or the VA National Center for Ethics in Health Care.
1. Hasin DS, O’Brien CP, Auriacombe M, et al. DSM-5 criteria for substance use disorders: recommendations and rationale. Am J Psychiatry. 2013;170(8):834-851. doi:10.1176/appi.ajp.2013.12060782. PubMed
2. Donroe JH, Holt SR, Tetrault JM. Caring for patients with opioid use disorder in the hospital. CMAJ. 2016;188(17-18):1232-1239. doi:10.1503/cmaj.160290. PubMed
3. National Institute on Drug Abuse. Opioid Overdose Crisis 2018. https://www.drugabuse.gov/drugs-abuse/opioids/opioid-overdose-crisis. Last updated March 2018. Accessed July 1, 2018.
4. Kerr T, Wood E, Grafstein E, et al. High rates of primary care and emergency department use among injection drug users in Vancouver. J Public Health. (Oxf). 2005;27(1):62-66. doi:10.1093/pubmed/fdh189. PubMed
5. Merrill JO, Rhodes LA, Deyo RA, Marlatt GA, Bradley KA. Mutual mistrust in the medical care of drug users: the keys to the “narc” cabinet. J Gen Intern Med. 2002;17(5):327-333. doi:10.1007/s11606-002-0034-5. PubMed
6. DP Levine PB. Infections in Injection Drug Users. In: Mandell GL BJ, Dolin R, eds. Mandell, Douglas, and Bennett’s Principles and Practice of Infectious Diseases. 6th ed. Philadelphia: Churchill Livingstone; 2005.
7. Fanucchi L, Leedy N, Li J, Thornton AC. Perceptions and practices of physicians regarding outpatient parenteral antibiotic therapy in persons who inject drugs. J Hosp Med. 2016;11(8):581-582. doi:10.1002/jhm.2582. PubMed
8. van Boekel LC, Brouwers EP, van Weeghel J, Garretsen HF. Stigma among health professionals towards patients with substance use disorders and its consequences for healthcare delivery: systematic review. Drug Alcohol Depend. 2013;131(1-2):23-35. doi:10.1016/j.drugalcdep.2013.02.018. PubMed
9. Fishman SM. Risk of the view through the keyhole: there is much more to physician reactions to the DEA than the number of formal actions. Pain Med. 2006;7(4):360-362; discussion 365-366. doi:10.1111/j.1526-4637.2006.00194.x. PubMed
10. Jamison RN, Sheehan KA, Scanlan E, Matthews M, Ross EL. Beliefs and attitudes about opioid prescribing and chronic pain management: survey of primary care providers. J Opioid Manag. 2014;10(6):375-382. doi:10.5055/jom.2014.0234. PubMed
11. Beach SR, Taylor JB, Kontos N. Teaching psychiatric trainees to “think dirty”: uncovering hidden motivations and deception. Psychosomatics. 2017;58(5):474-482. doi:10.1016/j.psym.2017.04.005. PubMed
12. Wakeman SE, Pham-Kanter G, Donelan K. Attitudes, practices, and preparedness to care for patients with substance use disorder: results from a survey of general internists. Subst Abus. 2016;37(4):635-641. doi:10.1080/08897077.2016.1187240. PubMed
13. Ho J, Archuleta S, Sulaiman Z, Fisher D. Safe and successful treatment of intravenous drug users with a peripherally inserted central catheter in an outpatient parenteral antibiotic treatment service. J Antimicrob Chemother. 2010;65(12):2641-2644. doi:10.1093/jac/dkq355. PubMed
14. Buehrle DJ, Shields RK, Shah N, Shoff C, Sheridan K. Risk factors associated with outpatient parenteral antibiotic therapy program failure among intravenous drug users. Open Forum Infect Dis. 2017;4(3):ofx102. doi:10.1093/ofid/ofx102. PubMed
15. Jafari S, Joe R, Elliot D, Nagji A, Hayden S, Marsh DC. A community care model of intravenous antibiotic therapy for injection drug users with deep tissue infection for “reduce leaving against medical advice.” Int J Ment Health Addict. 2015;13:49-58. doi:10.1007/s11469-014-9511-4. PubMed
16. Detsky AS, Krumholz HM. Reducing the trauma of hospitalization. JAMA. 2014;311(21):2169-2170. doi:10.1001/jama.2014.3695. PubMed
17. Joosten EA, De Jong CA, de Weert-van Oene GH, Sensky T, van der Staak CP. Shared decision-making: increases autonomy in substance-dependent patients. Subst Use Misuse. 2011;46(8):1037-1038. doi:10.3109/10826084.2011.552931. PubMed
18. Chan AC, Palepu A, Guh DP, et al. HIV-positive injection drug users who leave the hospital against medical advice: the mitigating role of methadone and social support. J Acquir Immune Defic Syndr. 2004;35(1):56-59. doi:10.1097/00126334-200401010-00008. PubMed
19. Englander H, Collins D, Perry SP, Rabinowitz M, Phoutrides E, Nicolaidis C. “We’ve learned it’s a medical illness, not a moral choice”: qualitative study of the effects of a multicomponent addiction intervention on hospital providers’ attitudes and experiences. J Hosp Med. 2018;13(11) 752-758. doi:10.12788/jhm.2993. PubMed
20. Kaye AD, Jones MR, Kaye AM, et al. Prescription opioid abuse in chronic pain: an updated review of opioid abuse predictors and strategies to curb opioid abuse (part 2). Pain Physician. 2017;20(2S):S111-S133. PubMed
21. Gourlay DL, Heit HA, Almahrezi A. Universal precautions in pain medicine: a rational approach to the treatment of chronic pain. Pain Med. 2005;6(2):107-112. doi: 10.1111/j.1526-4637.2005.05031.x. PubMed
22. Smith M, Rosenblum A, Parrino M, Fong C, Colucci S. Validity of self-reported misuse of prescription opioid analgesics. Subst Use Misuse. 2010;45(10):1509-1524. doi:10.3109/10826081003682107. PubMed
23. McNeil R, Small W, Wood E, Kerr T. Hospitals as a ‘risk environment’: an ethno-epidemiological study of voluntary and involuntary discharge from hospital against medical advice among people who inject drugs. Soc Sci Med. 2014;105:59-66. doi:10.1016/j.socscimed.2014.01.010. PubMed
24. Sullivan MD, Leigh J, Gaster B. Brief report: Training internists in shared decision making about chronic opioid treatment for noncancer pain. J Gen Intern Med. 2006;21(4):360-362. doi:10.1111/j.1525-1497.2006.00352.x. PubMed
“Lord have mercy on me, was the kneeling drunkard’s plea.”
—Johnny Cash
The Diagnostic and Statistical Manual of the American Psychiatric Association defines opioid-use disorder (OUD) as a problematic pattern of prescription and/or illicit opioid medication use leading to clinically significant impairment or distress.1 Compared with their non-OUD counterparts, patients with OUD have poorer overall health and worse health service outcomes, including higher rates of morbidity, mortality, HIV and HCV transmission, and 30-day readmissions.2 With the rate of fatal overdoses from opioids at crisis levels, leading scientific and professional organizations have declared OUD to be a public health emergency in the United States.3
The opioid epidemic affects hospitalists through the rising incidence of hospitalization, not only as a result of OUD’s indirect complications, but also its direct effects of intoxication and withdrawal.4 In caring for patients with OUD, hospitalists are often presented with many ethical dilemmas. Whether the dilemma involves timing and circumstances of discharge or the permission to leave the hospital floor, they often involve elements of mutual mistrust. In qualitative ethnographic studies, patients with OUD report not trusting that the medical staff will take their concerns of inadequately treated pain and other needs seriously. Providers may mistrust the patient’s report of pain and withhold treatment for OUD for nonclinical reasons.5 Here, we examine two ethical dilemmas specific to OUD in hospitalized patients. Our aim in describing these dilemmas is to help hospitalists recognize that targeting issues of mistrust may assist them to deliver better care to hospitalized patients with OUD.
DISCHARGING HOSPITALIZED PATIENTS WITH OUD
In the inpatient setting, ethical dilemmas surrounding discharge are common among people who inject drugs (PWID). These patients have disproportionately high rates of soft tissue and systemic infections, such as endocarditis and osteomyelitis, and subsequently often require long-term, outpatient parenteral antibiotic therapy (OPAT).6 From both the clinical and ethical perspectives, discharging PWID requiring OPAT to an unsupervised setting or continuing inpatient hospitalization to prevent a potential adverse event are equally imperfect solutions.
These patients may be clinically stable, suitable for discharge, and prefer to be discharged, but the practitioner’s concerns regarding untoward complications frequently override the patient’s wishes. Valid reasons for this exercise of what could be considered soft-paternalism are considered when physicians unilaterally decide what is best for patients, including refusal of community agencies to provide OPAT to PWID, inadequate social support and/or health literacy to administer the therapy, or varying degrees of homelessness that can affect timely follow-up. However, surveys of both hospitalists and infectious disease specialists also indicate that they may avoid discharge because of concerns the PWID will tamper with the intravenous (IV) catheter to inject drugs.7 This reluctance to discharge otherwise socially and medically suitable patients increases length of stay,7 decreases patient satisfaction, and could lead to misuse of limited hospital resources.
Both patient mistrust and stigmatization may contribute to this dilemma. Healthcare professionals have been shown to share and reflect a long-standing bias in their attitudes toward patients with substance-use disorders and OUD, in particular.8 Studies of providers’ attitudes are limited but suggest that legal concerns over liability and professional sanctions,9 reluctance to contribute to the development or relapse of addiction,10 and a strong psychological investment in not being deceived by the patient11 may influence physicians’ decisions about care.
Closely supervising IV antibiotic therapy for all PWID may not reflect current medical knowledge and may imply a moral assessment of patients’ culpability and lack of will power to resist using drugs.12 No evidence is available to suggest that inpatient parenteral antibiotic treatment offers superior adherence, and emerging evidence showing that carefully selected patients with an injection drug-use history can be safely and effectively treated as outpatients has been obtained.13,14 Ho et al. found high rates of treatment success in patients with adequate housing, a reliable guardian, and willingness to comply with appropriate IV catheter use.13 Although the study by Buehrle et al. found higher rates of OPAT failure among PWIDs, 25% of these failures were due to adverse drug reactions and only 2% were due to documented line manipulations.14 This research suggests that disposition to alternative settings for OPAT in PWID may be feasible, reasonable, and deserving of further study. Rather than treating PWIDs as a homogenous group of increased risk, contextualizing care based on individual risk stratification promotes more patient-centered care that is medically appropriate and potentially more cost efficient. A
Patient-centered approaches that respond to the individual needs of patients have altered the care delivery model in order to improve health services outcomes. In developing an alternative care model to inpatient treatment in PWID who required OPAT, Jafari et al.15 evaluated a community model of care that provided a home-like residence as an alternative to hospitalization where patients could receive OPAT in a medically and socially supportive environment. This environment, which included RN and mental health staff for substance-use counseling, wound care, medication management, and IV therapy, demonstrated lower rates of against medical advice (AMA) discharge and higher patient satisfaction compared with hospitalization.15
MOBILITY OFF OF THE HOSPITAL FLOOR FOR HOSPITALIZED PATIENTS WITH OUD
Ethical dilemmas may also arise when patients with OUD desire greater mobility in the hospital. Although some inpatients may be permitted to leave the floor, some treatment teams may believe that patients with OUD leave the floor to use drugs and that the patient’s IV will facilitate such behavior. Nursing and medical staff may also believe that, if they agree to a request to leave the floor, they are complicit in any potential drug use or harmful consequences resulting from this use. For their part, patients may have a desire for more mobility because of the sometimes unpleasant constraints of hospitalization, which are not unique to these patients16 or to distract them from their cravings. Patients, unable to tolerate the restriction emotionally or believing they are being treated unfairly, even punitively, may leave AMA rather than complete needed medical care. Once more, distrust of the patient and fear of liability may lead hospital staff to respond in counterproductive ways.
Addressing this dilemma depends, in part on creating an environment where PWID and patients with OUD are treated fairly and appropriately for their underlying illness. Such treatment includes ensuring withdrawal symptoms and pain are adequately treated, building trust by empathically addressing patients’ needs and preferences,17 and having a systematic (ie, policy-based) approach for requests to leave the floor. Th
Efforts to adequately treat withdrawal symptoms in the hospital setting have shown promise in maintaining patient engagement, reducing the rate of AMA discharges, and improving follow up with outpatient medical and substance-use treatment.18 Because physicians consistently cite the lack of advanced training in addiction medicine as a treatment limitation,12 training may go a long way in closing this knowledge and skill gap. Furthermore, systematic efforts to better educate and train hospitalists in the care of patients with addiction can improve both knowledge and attitudes about caring for this vulnerable population,19 thereby enhancing therapeutic relationships and patient centeredness. Finally, institutional policies promoting fair, systematic, and transparent guidance are needed for front-line practitioners to manage the legal, clinical, and ethical ambiguities involved when PWID wish to leave the hospital floor.
ENHANCING CARE DELIVERY TO PATIENTS WITH OUD
In addressing the mistrust some staff may have toward the patients described in the preceding ethical dilemmas, the use of universal precautions is an ethical and efficacious approach that balances reliance on patients’ veracity with due diligence in objective clinical assessments.20 These universal precautions, which are grounded in mutual respect and responsibility between physician and patient, include a set of strategies originally established in infectious disease practice and adapted to the management of chronic pain particularly when opioids are used.21 They are based on the recognition that identifying which patients prescribed opioids will develop an OUD or misuse opioids is difficult. Hence, the safest and least-stigmatizing approach is to treat all patients as individuals who could potentially be at risk. This is an ethically strong approach that seeks to balance the competing values of patent safety and patient centeredness, and involves taking a substance-use history from all patients admitted to the hospital and routinely checking state prescription-drug monitoring programs among other steps. Although self-reporting, at least of prescription-drug misuse, is fairly reliable,22 establishing expectations for mutual respect when working with patients with OUD and other addictive disorders is more likely to garner valid reports and a positive alliance. Once this relationship is established, the practitioner can respond to problematic behaviors with clear, compassionate limit setting.
From a broader perspective, a hospital system and culture that is unable to promote trust and adequately treat pain and withdrawal can create a “risk environment” for PWID.23 When providers are inadequately trained in the management of pain and addiction, or there is a shortage of addiction specialists, or inadequate policy guidance for managing the care of these patients, this can result in AMA discharges and reduced willingness to seek future care. Viewing this problem more expansively may persuade healthcare professionals that patients alone are not entirely responsible for the outcomes related to their illness but that modifying practices and structure at the hospital level has the potential to mitigate harm to this vulnerable population.
As inpatient team leaders, hospitalists have the unique opportunity to address the opioid crisis by enhancing the quality of care provided to hospitalized patients with OUD. This enhancement can be accomplished by destigmatizing substance-use disorders, establishing relationships of trust, and promoting remedies to structural deficiencies in the healthcare system that contribute to the problem. These approaches have the potential to enhance not only the care of patients with OUD but also the satisfaction of the treatment team caring for these patients.24 Su
Disclosures
The authors have no conflicts of interest to disclose, financial or otherwise. The views expressed in this article are those of the authors and do not necessarily reflect the position or policy of the U.S. Department of Veterans Affairs, the U.S. Government, or the VA National Center for Ethics in Health Care.
1. Hasin DS, O’Brien CP, Auriacombe M, et al. DSM-5 criteria for substance use disorders: recommendations and rationale. Am J Psychiatry. 2013;170(8):834-851. doi:10.1176/appi.ajp.2013.12060782. PubMed
2. Donroe JH, Holt SR, Tetrault JM. Caring for patients with opioid use disorder in the hospital. CMAJ. 2016;188(17-18):1232-1239. doi:10.1503/cmaj.160290. PubMed
3. National Institute on Drug Abuse. Opioid Overdose Crisis 2018. https://www.drugabuse.gov/drugs-abuse/opioids/opioid-overdose-crisis. Last updated March 2018. Accessed July 1, 2018.
4. Kerr T, Wood E, Grafstein E, et al. High rates of primary care and emergency department use among injection drug users in Vancouver. J Public Health. (Oxf). 2005;27(1):62-66. doi:10.1093/pubmed/fdh189. PubMed
5. Merrill JO, Rhodes LA, Deyo RA, Marlatt GA, Bradley KA. Mutual mistrust in the medical care of drug users: the keys to the “narc” cabinet. J Gen Intern Med. 2002;17(5):327-333. doi:10.1007/s11606-002-0034-5. PubMed
6. DP Levine PB. Infections in Injection Drug Users. In: Mandell GL BJ, Dolin R, eds. Mandell, Douglas, and Bennett’s Principles and Practice of Infectious Diseases. 6th ed. Philadelphia: Churchill Livingstone; 2005.
7. Fanucchi L, Leedy N, Li J, Thornton AC. Perceptions and practices of physicians regarding outpatient parenteral antibiotic therapy in persons who inject drugs. J Hosp Med. 2016;11(8):581-582. doi:10.1002/jhm.2582. PubMed
8. van Boekel LC, Brouwers EP, van Weeghel J, Garretsen HF. Stigma among health professionals towards patients with substance use disorders and its consequences for healthcare delivery: systematic review. Drug Alcohol Depend. 2013;131(1-2):23-35. doi:10.1016/j.drugalcdep.2013.02.018. PubMed
9. Fishman SM. Risk of the view through the keyhole: there is much more to physician reactions to the DEA than the number of formal actions. Pain Med. 2006;7(4):360-362; discussion 365-366. doi:10.1111/j.1526-4637.2006.00194.x. PubMed
10. Jamison RN, Sheehan KA, Scanlan E, Matthews M, Ross EL. Beliefs and attitudes about opioid prescribing and chronic pain management: survey of primary care providers. J Opioid Manag. 2014;10(6):375-382. doi:10.5055/jom.2014.0234. PubMed
11. Beach SR, Taylor JB, Kontos N. Teaching psychiatric trainees to “think dirty”: uncovering hidden motivations and deception. Psychosomatics. 2017;58(5):474-482. doi:10.1016/j.psym.2017.04.005. PubMed
12. Wakeman SE, Pham-Kanter G, Donelan K. Attitudes, practices, and preparedness to care for patients with substance use disorder: results from a survey of general internists. Subst Abus. 2016;37(4):635-641. doi:10.1080/08897077.2016.1187240. PubMed
13. Ho J, Archuleta S, Sulaiman Z, Fisher D. Safe and successful treatment of intravenous drug users with a peripherally inserted central catheter in an outpatient parenteral antibiotic treatment service. J Antimicrob Chemother. 2010;65(12):2641-2644. doi:10.1093/jac/dkq355. PubMed
14. Buehrle DJ, Shields RK, Shah N, Shoff C, Sheridan K. Risk factors associated with outpatient parenteral antibiotic therapy program failure among intravenous drug users. Open Forum Infect Dis. 2017;4(3):ofx102. doi:10.1093/ofid/ofx102. PubMed
15. Jafari S, Joe R, Elliot D, Nagji A, Hayden S, Marsh DC. A community care model of intravenous antibiotic therapy for injection drug users with deep tissue infection for “reduce leaving against medical advice.” Int J Ment Health Addict. 2015;13:49-58. doi:10.1007/s11469-014-9511-4. PubMed
16. Detsky AS, Krumholz HM. Reducing the trauma of hospitalization. JAMA. 2014;311(21):2169-2170. doi:10.1001/jama.2014.3695. PubMed
17. Joosten EA, De Jong CA, de Weert-van Oene GH, Sensky T, van der Staak CP. Shared decision-making: increases autonomy in substance-dependent patients. Subst Use Misuse. 2011;46(8):1037-1038. doi:10.3109/10826084.2011.552931. PubMed
18. Chan AC, Palepu A, Guh DP, et al. HIV-positive injection drug users who leave the hospital against medical advice: the mitigating role of methadone and social support. J Acquir Immune Defic Syndr. 2004;35(1):56-59. doi:10.1097/00126334-200401010-00008. PubMed
19. Englander H, Collins D, Perry SP, Rabinowitz M, Phoutrides E, Nicolaidis C. “We’ve learned it’s a medical illness, not a moral choice”: qualitative study of the effects of a multicomponent addiction intervention on hospital providers’ attitudes and experiences. J Hosp Med. 2018;13(11) 752-758. doi:10.12788/jhm.2993. PubMed
20. Kaye AD, Jones MR, Kaye AM, et al. Prescription opioid abuse in chronic pain: an updated review of opioid abuse predictors and strategies to curb opioid abuse (part 2). Pain Physician. 2017;20(2S):S111-S133. PubMed
21. Gourlay DL, Heit HA, Almahrezi A. Universal precautions in pain medicine: a rational approach to the treatment of chronic pain. Pain Med. 2005;6(2):107-112. doi: 10.1111/j.1526-4637.2005.05031.x. PubMed
22. Smith M, Rosenblum A, Parrino M, Fong C, Colucci S. Validity of self-reported misuse of prescription opioid analgesics. Subst Use Misuse. 2010;45(10):1509-1524. doi:10.3109/10826081003682107. PubMed
23. McNeil R, Small W, Wood E, Kerr T. Hospitals as a ‘risk environment’: an ethno-epidemiological study of voluntary and involuntary discharge from hospital against medical advice among people who inject drugs. Soc Sci Med. 2014;105:59-66. doi:10.1016/j.socscimed.2014.01.010. PubMed
24. Sullivan MD, Leigh J, Gaster B. Brief report: Training internists in shared decision making about chronic opioid treatment for noncancer pain. J Gen Intern Med. 2006;21(4):360-362. doi:10.1111/j.1525-1497.2006.00352.x. PubMed
© 2019 Society of Hospital Medicine
Association of Weekend Admission and Weekend Discharge with Length of Stay and 30-Day Readmission in Children’s Hospitals
Increasingly, metrics such as length of stay (LOS) and readmissions are being utilized in the United States to assess quality of healthcare because these factors may represent opportunities to reduce cost and improve healthcare delivery.1-8 However, the relatively low rate of pediatric readmissions,9 coupled with limited data regarding recommended LOS or best practices to prevent readmissions in children, challenges the ability of hospitals to safely reduce LOS and readmission rates for children.10–12
In adults, weekend admission is associated with prolonged LOS, increased readmission rates, and increased risk of mortality.13-21 This association is referred to as the “weekend effect.” While the weekend effect has been examined in children, the results of these studies have been variable, with some studies supporting this association and others refuting it.22-31 In contrast to patient demographic and clinical characteristics that are known to affect LOS and readmissions,32 the weekend effect represents a potentially modifiable aspect of a hospitalization that could be targeted to improve healthcare delivery.
With increasing national attention toward improving quality of care and reducing LOS and healthcare costs, more definitive evidence of the weekend effect is necessary to prioritize resource use at both the local and national levels. Therefore, we sought to determine the association of weekend admission and weekend discharge on LOS and 30-day readmissions, respectively, among a national cohort of children. We hypothesized that children admitted on the weekend would have longer LOS, whereas those discharged on the weekend would have higher readmission rates.
METHODS
Study Design and Data Source
We conducted a multicenter, retrospective, cross-sectional study. Data were obtained from the Pediatric Health Information System (PHIS), an administrative and billing database of 46 free-standing tertiary care pediatric hospitals affiliated with the Children’s Hospital Association (Lenexa, Kansas). Patient data are de-identified within PHIS; however, encrypted patient identifiers allow individual patients to be followed across visits. This study was not considered human subjects research by the policies of the Cincinnati Children’s Hospital Institutional Review Board.
Participants
We included hospitalizations to a PHIS-participating hospital for children aged 0-17 years between October 1, 2014 and September 30, 2015. We excluded children who were transferred from/to another institution, left against medical advice, or died in the hospital because these indications may result in incomplete LOS information and would not consistently contribute to readmission rates. We also excluded birth hospitalizations and children admitted for planned procedures. Birth hospitalizations were defined as hospitalizations that began on the day of birth.
Main Exposures
No standard definition of weekend admission or discharge was identified in the literature.33 Thus, we defined a weekend admission as an admission between 3:00
Main Outcomes
Our outcomes included LOS for weekend admission and 30-day readmissions for weekend discharge. LOS, measured in hours, was defined using the reported admission and discharge times. Readmissions were defined as a return to the same hospital within the subsequent 30 days following discharge.
Patient Demographics and Other Study Variables
Patient demographics included age, gender, race/ethnicity, payer, and median household income quartile based on the patient’s home ZIP code. Other study variables included presence of a complex chronic condition (CCC),34 technology dependence,34 number of chronic conditions of any complexity, admission through the emergency department, intensive care unit (ICU) admission, and case mix index. ICU admission and case mix index were chosen as markers for severity of illness. ICU admission was defined as any child who incurred ICU charges at any time following admission. Case mix index in PHIS is a relative weight assigned to each discharge based on the All-Patient Refined Diagnostic Group (APR-DRG; 3M) assignment and APR-DRG severity of illness, which ranges from 1 (minor) to 4 (extreme). The weights are derived by the Children’s Hospital Association from the HCUP KID 2012 database as the ratio of the average cost for discharges within a specific APR-DRG severity of illness combination to the average cost for all discharges in the database.
Statistical Analysis
Continuous variables were summarized with medians and interquartile ranges, while categorical variables were summarized with frequencies and percentages. Differences in admission and discharge characteristics between weekend and weekday were assessed using Wilcoxon rank sum tests for continuous variables and chi-square tests of association for categorical variables. We used generalized linear mixed modeling (GLMM) techniques to assess the impact of weekend admission on LOS and weekend discharge on readmission, adjusting for important patient demographic and clinical characteristics. Furthermore, we used GLMM point estimates to describe the variation across hospitals of the impact of weekday versus weekend care on LOS and readmissions. We assumed an underlying log-normal distribution for LOS and an underlying binomial distribution for 30-day readmission. All GLMMs included a random intercept for each hospital to account for patient clustering within a hospital. All statistical analyses were performed using SAS v.9.4 (SAS Institute, Cary, North Carolina), and P values <.05 were considered statistically significant.
RESULTS
We identified 390,745 hospitalizations that met inclusion criteria (Supplementary Figure 1). The median LOS among our cohort was 41 hours (interquartile range [IQR] 24-71) and the median 30-day readmission rate was 8.2% (IQR 7.2-9.4).
Admission Demographics for Weekends and Weekdays
Among the included hospitalizations, 92,266 (23.6%) admissions occurred on a weekend (Supplementary Table 1). Overall, a higher percentage of children <5 years of age were admitted on a weekend compared with those admitted on a weekday (53.3% vs 49.1%, P < .001). We observed a small but statistically significant difference in the proportion of weekend versus weekday admissions according to gender, race/ethnicity, payer, and median household income quartile. Children with medical complexity and those with technology dependence were admitted less frequently on a weekend. A higher proportion of children were admitted through the emergency department on a weekend and a higher frequency of ICU utilization was observed for children admitted on a weekend compared with those admitted on a weekday.
Association Between Study Variables and Length of Stay
In comparing adjusted LOS for weekend versus weekday admissions across 43 hospitals, not only did LOS vary across hospitals (P < .001), but the association between LOS and weekend versus weekday care also varied across hospitals (P < .001) (Figure 1). Weekend admission was associated with a significantly longer LOS at eight (18.6%) hospitals and a significantly shorter LOS at four (9.3%) hospitals with nonstatistically significant differences at the remaining hospitals.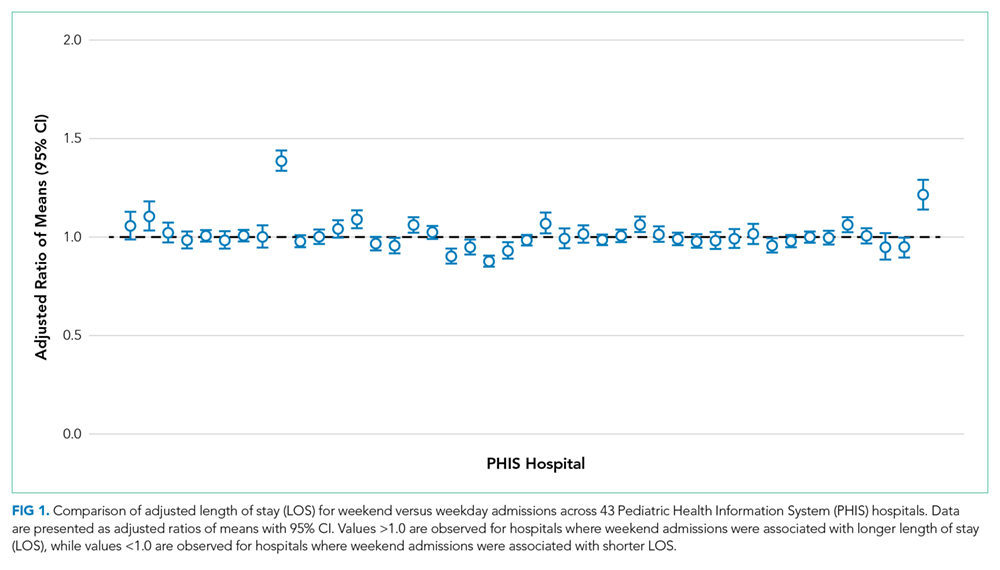
In adjusted analyses, we observed that infants ≤30 days of age, on average, had an adjusted LOS that was 24% longer than that of 15- to 17-year-olds, while children aged 1-14 years had an adjusted LOS that was 6%-18% shorter (Table 1). ICU utilization, admission through the emergency department, and number of chronic conditions had the greatest association with LOS. As the number of chronic conditions increased, the LOS increased. No association was found between weekend versus weekday admission and LOS (adjusted LOS [95% CI]: weekend 63.70 [61.01-66.52] hours versus weekday 63.40 [60.73-66.19] hours, P = .112).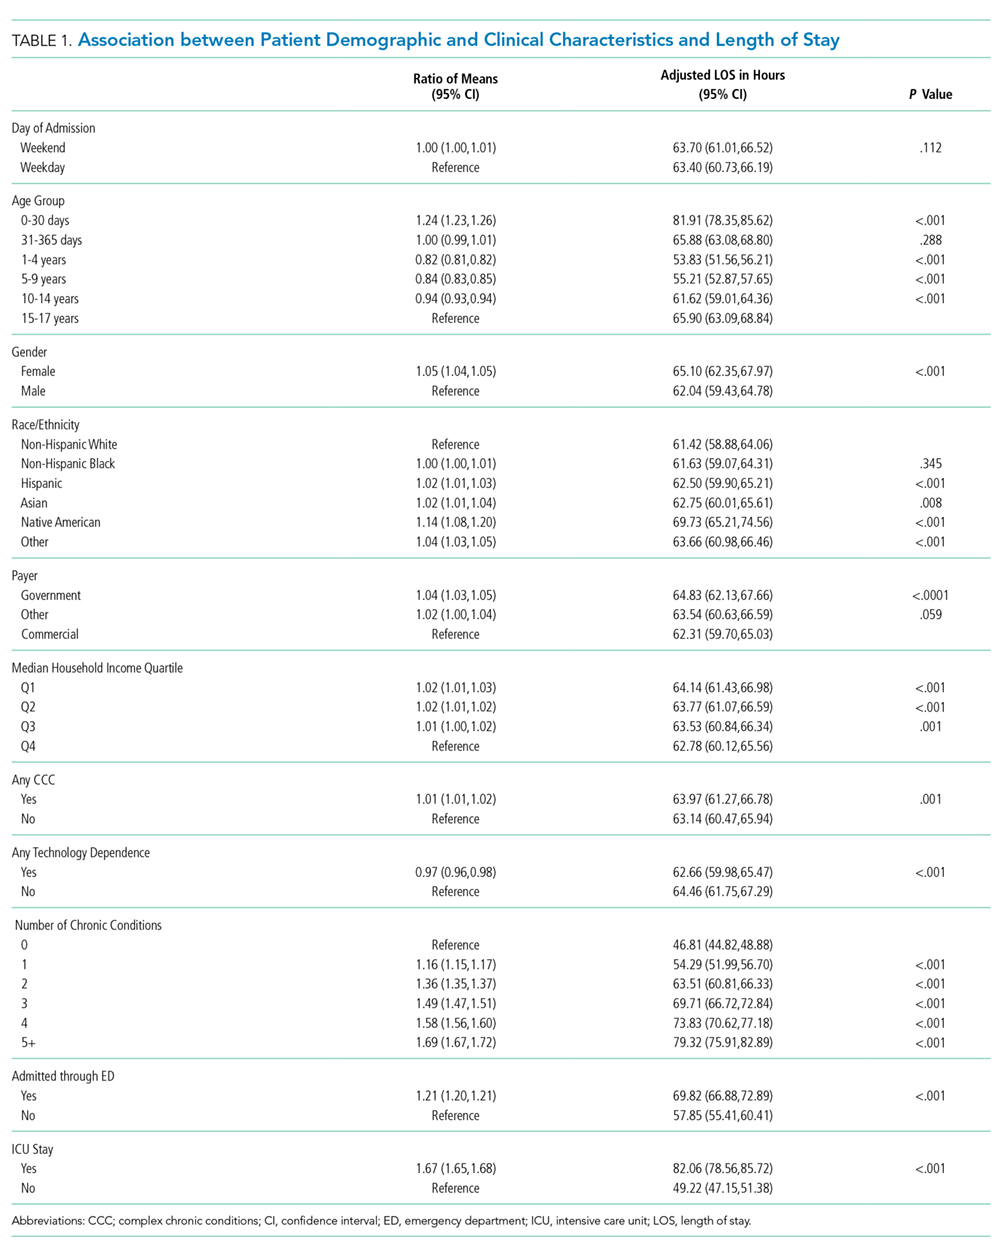
Discharge Demographics for Weekends and Weekdays
Of the included hospitalizations, 127,421 (32.6%) discharges occurred on a weekend (Supplementary Table 2). Overall, a greater percentage of weekend discharges comprised children <5 years of age compared with the percentage of weekday discharges for children <5 years of age (51.5% vs 49.5%, P < .001). No statistically significant differences were found in gender, payer, or median household income quartile between those children discharged on a weekend versus those discharged on a weekday. We found small, statistically significant differences in the proportion of weekend versus weekday discharges according to race/ethnicity, with fewer non-Hispanic white children being discharged on the weekend versus weekday. Children with medical complexity, technology dependence, and patients with ICU utilization were less frequently discharged on a weekend compared with those discharged on a weekday.
Association Between Study Variables and Readmissions
In comparing the adjusted odds of readmissions for weekend versus weekday discharges across 43 PHIS hospitals, we observed significant variation (P < .001) in readmission rates from hospital to hospital (Figure 2). However, the direction of impact of weekend care on readmissions was similar (P = .314) across hospitals (ie, for 37 of 43 hospitals, the readmission rate was greater for weekend discharges compared with that for weekday discharges). For 17 (39.5%) of 43 hospitals, weekend discharge was associated with a significantly higher readmission rate, while the differences between weekday and weekend discharge were not statistically significant for the remaining hospitals.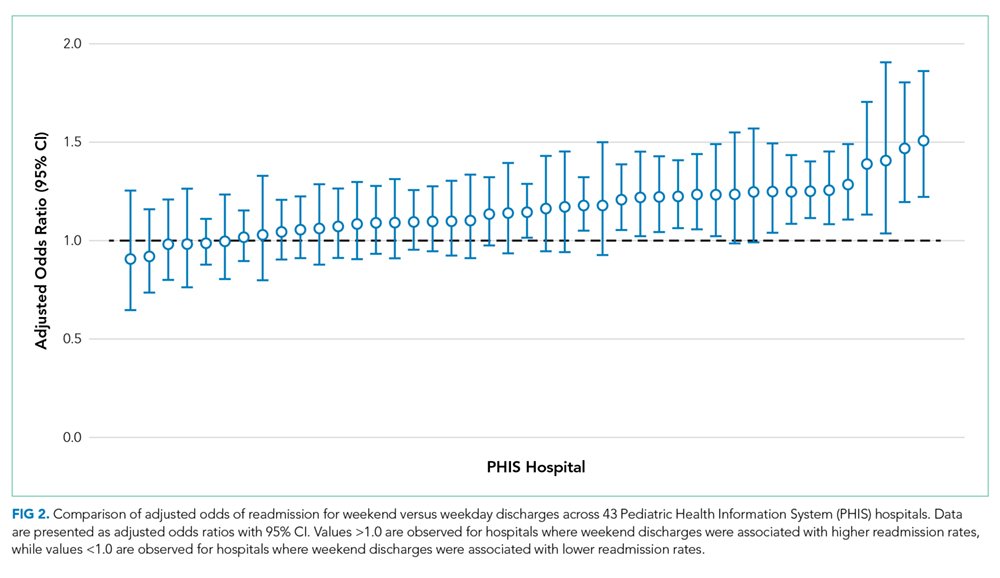
In adjusted analyses, we observed that infants <1 year were more likely to be readmitted compared with 15- to 17-year-olds, while children 5-14 years of age were less likely to be readmitted (Table 2). Medical complexity and the number of chronic conditions had the greatest association with readmissions, with increased likelihood of readmission observed as the number of chronic conditions increased. Weekend discharge was associated with increased probability of readmission compared with weekday discharge (adjusted probability of readmission [95% CI]: weekend 0.13 [0.12-0.13] vs weekday 0.11 [0.11-0.12], P < .001).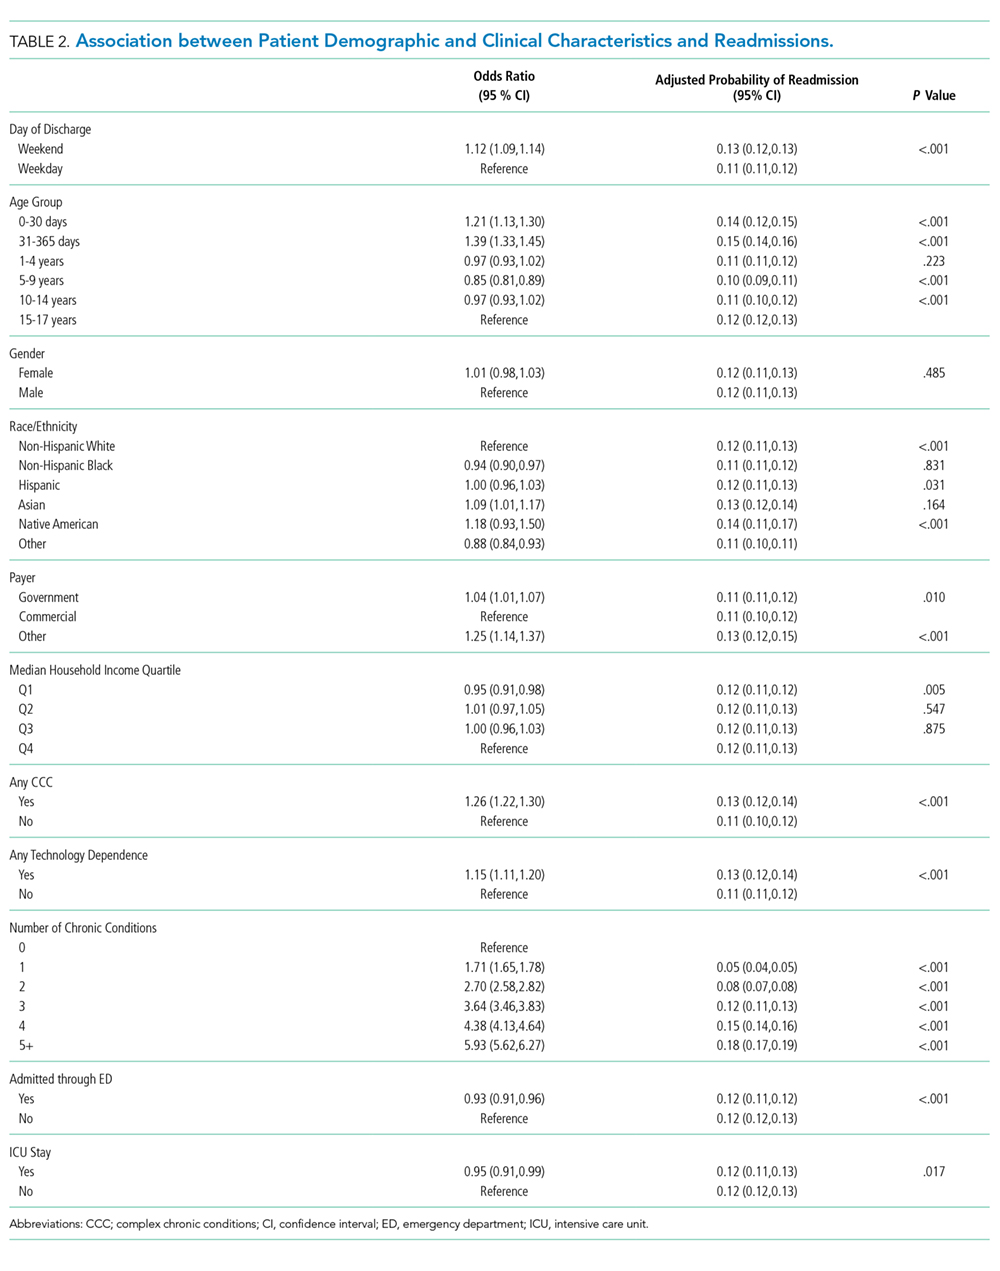
DISCUSSION
While the reasons for the weekend effect are unclear, data supporting this difference have been observed across many diverse patient groups and health systems both nationally and internationally.13-27,31 Weekend care is thought to differ from weekday care because of differences in physician and nurse staffing, availability of ancillary services, access to diagnostic testing and therapeutic interventions, ability to arrange outpatient follow-up, and individual patient clinical factors, including acuity of illness. Few studies have assessed the effect of weekend discharges on patient or system outcomes. Among children within a single health system, readmission risk was associated with weekend admission but not with weekend discharge.22 This observation suggests that if differential care exists, then it occurs during initial clinical management rather than during discharge planning. Consequently, understanding the interaction of weekend admission and LOS is important. In addition, the relative paucity of pediatric data examining a weekend discharge effect limits the ability to generalize these findings across other hospitals or health systems.
In contrast to prior work, we observed a modest increased risk for readmission among those discharged on the weekend in a large sample of children. Auger and Davis reported a lack of association between weekend discharge and readmissions at one tertiary care children’s hospital, citing reduced discharge volumes on the weekend, especially among children with medical complexity, as a possible driver for their observation.22 The inclusion of a much larger population across 43 hospitals in our study may explain our different findings compared with previous research. In addition, the inclusion/exclusion criteria differed between the two studies; we excluded index admissions for planned procedures in this study (which are more likely to occur during the week), which may have contributed to the differing conclusions. Although Auger and Davis suggest that differences in initial clinical management may be responsible for the weekend effect,22 our observations suggest that discharge planning practices may also contribute to readmission risk. For example, a family’s inability to access compounded medications at a local pharmacy or to access primary care following discharge could reasonably contribute to treatment failure and increased readmission risk. Attention to improving and standardizing discharge practices may alleviate differences in readmission risk among children discharged on a weekend.
Individual patient characteristics greatly influence LOS and readmission risk. Congruent with prior studies, medical complexity and technology dependence were among the factors in our study that had the strongest association with LOS and readmission risk.32 As with prior studies22, we observed that children with medical complexity and technology dependence were less frequently admitted and discharged on a weekend than on a weekday, which suggests that physicians may avoid complicated discharges on the weekend. Children with medical complexity present a unique challenge to physicians when assessing discharge readiness, given that these children frequently require careful coordination of durable medical equipment, obtainment of special medication preparations, and possibly the resumption or establishment of home health services. Notably, we cannot discern from our data what proportion of discharges may be delayed over the weekend secondary to challenges involved in coordinating care for children with medical complexity. Future investigations aimed at assessing physician decision making and discharge readiness in relation to discharge timing among children with medical complexity may establish this relationship more clearly.
We observed substantial variation in LOS and readmission risk across 43 tertiary care children’s hospitals. Since the 1970s, numerous studies have reported worse outcomes among patients admitted on the weekend. While the majority of studies support the weekend effect, several recent studies suggest that patients admitted on the weekend are at no greater risk of adverse outcomes than those admitted during the week.35-37 Our work builds on the existing literature, demonstrating a complex and variable relationship between weekend admission/discharge, LOS, and readmission risk across hospitals. Notably, while many hospitals in our study experienced a significant weekend effect in LOS or readmission risk, only four hospitals experienced a statistically significant weekend effect for both LOS and readmission risk (three hospitals experienced increased risk for both, while one hospital experienced increased readmission risk but decreased LOS). Future investigations of the weekend effect should focus on exploring the differences in admission/discharge practices and staffing patterns of hospitals that did or did not experience a weekend effect.
This study has several limitations
CONCLUSION
In a study of 43 children’s hospitals, children discharged on the weekend had a slightly increased readmission risk compared with children discharged on a weekday. Wide variation in the weekend effect on LOS and readmission risk was evident across hospitals. Individual patient characteristics had a greater impact on LOS and readmission risk than the weekend effect. Future investigations aimed at understanding which factors contribute most strongly to a weekend effect within individual hospitals (eg, differences in institutional admission/discharge practices) may help alleviate the weekend effect and improve healthcare quality.
Acknowledgments
This manuscript resulted from “Paper in a Day,” a Pediatric Research in Inpatient Settings (PRIS) Network-sponsored workshop presented at the Pediatric Hospital Medicine 2017 annual meeting. Workshop participants learned how to ask and answer a health services research question and efficiently prepare a manuscript for publication. The following are the members of the PRIS Network who contributed to this work: Jessica L. Bettenhausen, MD; Rebecca M. Cantu, MD, MPH; Jillian M Cotter, MD; Megan Deisz, MD; Teresa Frazer, MD; Pratichi Goenka, MD; Ashley Jenkins, MD; Kathryn E. Kyler, MD; Janet T. Lau, MD; Brian E. Lee, MD; Christiane Lenzen, MD; Trisha Marshall, MD; John M. Morrison MD, PhD; Lauren Nassetta, MD; Raymond Parlar-Chun, MD; Sonya Tang Girdwood MD, PhD; Tony R Tarchichi, MD; Irina G. Trifonova, MD; Jacqueline M. Walker, MD, MHPE; and Susan C. Walley, MD. See appendix for contact information for members of the PRIS Network
Funding
The authors have no financial relationships relevant to this article to disclose.
Disclosures
The authors have no conflicts of interest to disclose.
1. Crossing the Quality Chasm: The IOM Health Care Quality Initiative : Health and Medicine Division. http://www.nationalacademies.org/hmd/Global/News%20Announcements/Crossing-the-Quality-Chasm-The-IOM-Health-Care-Quality-Initiative.aspx. Accessed November 20, 2017.
2. Institute for Healthcare Improvement: IHI Home Page. http://www.ihi.org:80/Pages/default.aspx. Accessed November 20, 2017.
3. Berry JG, Zaslavsky AM, Toomey SL, et al. Recognizing differences in hospital quality performance for pediatric inpatient care. Pediatrics. 2015;136(2):251-262. doi:10.1542/peds.2014-3131
4. NQF: All-Cause Admissions and Readmissions Measures - Final Report. http://www.qualityforum.org/Publications/2015/04/All-Cause_Admissions_and_Readmissions_Measures_-_Final_Report.aspx. Accessed March 24, 2018.
5. Hospital Inpatient Potentially Preventable Readmissions Information and Reports. https://www.illinois.gov/hfs/MedicalProviders/hospitals/PPRReports/Pages/default.aspx. Accessed November 6, 2016.
6. Potentially Preventable Readmissions in Texas Medicaid and CHIP Programs - Fiscal Year 2013 | Texas Health and Human Services. https://hhs.texas.gov/reports/2016/08/potentially-preventable-readmissions-texas-medicaid-and-chip-programs-fiscal-year. Accessed November 6, 2016.
7. Statewide Planning and Research Cooperative System. http://www.health.ny.gov/statistics/sparcs/sb/. Accessed November 6, 2016.
8. HCA Implements Potentially Preventable Readmission (PPR) Adjustments. Wash State Hosp Assoc. http://www.wsha.org/articles/hca-implements-potentially-preventable-readmission-ppr-adjustments/. Accessed November 8, 2016.
9. Berry JG, Toomey SL, Zaslavsky AM, et al. Pediatric readmission prevalence and variability across hospitals. JAMA. 2013;309(4):372-380. doi:10.1001/jama.2012.188351 PubMed
10. Bardach NS, Vittinghoff E, Asteria-Peñaloza R, et al. Measuring hospital quality using pediatric readmission and revisit rates. Pediatrics. 2013;132(3):429-436. doi:10.1542/peds.2012-3527 PubMed
11. Berry JG, Blaine K, Rogers J, et al. A framework of pediatric hospital discharge care informed by legislation, research, and practice. JAMA Pediatr. 2014;168(10):955-962; quiz 965-966. doi:10.1001/jamapediatrics.2014.891 PubMed
12. Auger KA, Simon TD, Cooperberg D, et al. Summary of STARNet: seamless transitions and (Re)admissions network. Pediatrics. 2015;135(1):164. doi:10.1542/peds.2014-1887 PubMed
13. Freemantle N, Ray D, McNulty D, et al. Increased mortality associated with weekend hospital admission: a case for expanded seven day services? BMJ. 2015;351:h4596. doi:10.1136/bmj.h4596 PubMed
14. Schilling PL, Campbell DA, Englesbe MJ, Davis MM. A comparison of in-hospital mortality risk conferred by high hospital occupancy, differences in nurse staffing levels, weekend admission, and seasonal influenza. Med Care. 2010;48(3):224-232. doi:10.1097/MLR.0b013e3181c162c0 PubMed
15. Cram P, Hillis SL, Barnett M, Rosenthal GE. Effects of weekend admission and hospital teaching status on in-hospital mortality. Am J Med. 2004;117(3):151-157. doi:10.1016/j.amjmed.2004.02.035 PubMed
16. Zapf MAC, Kothari AN, Markossian T, et al. The “weekend effect” in urgent general operative procedures. Surgery. 2015;158(2):508-514. doi:10.1016/j.surg.2015.02.024 PubMed
17. Freemantle N, Richardson M, Wood J, et al. Weekend hospitalization and additional risk of death: an analysis of inpatient data. J R Soc Med. 2012;105(2):74-84. doi:10.1258/jrsm.2012.120009 PubMed
18. Bell CM, Redelmeier DA. Mortality among patients admitted to hospitals on weekends as compared with weekdays. N Engl J Med. 2001;345(9):663-668. doi:10.1056/NEJMsa003376 PubMed
19. Coiera E, Wang Y, Magrabi F, Concha OP, Gallego B, Runciman W. Predicting the cumulative risk of death during hospitalization by modeling weekend, weekday and diurnal mortality risks. BMC Health Serv Res. 2014;14:226. doi:10.1186/1472-6963-14-226 PubMed
20. Powell ES, Khare RK, Courtney DM, Feinglass J. The weekend effect for patients with sepsis presenting to the emergency department. J Emerg Med. 2013;45(5):641-648. doi:10.1016/j.jemermed.2013.04.042 PubMed
21. Ananthakrishnan AN, McGinley EL, Saeian K. Outcomes of weekend admissions for upper gastrointestinal hemorrhage: a nationwide analysis. Clin Gastroenterol Hepatol Off Clin Pract J Am Gastroenterol Assoc. 2009;7(3):296-302e1. doi:10.1016/j.cgh.2008.08.013 PubMed
22. Auger KA, Davis MM. Pediatric weekend admission and increased unplanned readmission rates. J Hosp Med. 2015;10(11):743-745. doi:10.1002/jhm.2426 PubMed
23. Goldstein SD, Papandria DJ, Aboagye J, et al. The “weekend effect” in pediatric surgery - increased mortality for children undergoing urgent surgery during the weekend. J Pediatr Surg. 2014;49(7):1087-1091. doi:10.1016/j.jpedsurg.2014.01.001 PubMed
24. Adil MM, Vidal G, Beslow LA. Weekend effect in children with stroke in the nationwide inpatient sample. Stroke. 2016;47(6):1436-1443. doi:10.1161/STROKEAHA.116.013453 PubMed
25. McCrory MC, Spaeder MC, Gower EW, et al. Time of admission to the PICU and mortality. Pediatr Crit Care Med J Soc Crit Care Med World Fed Pediatr Intensive Crit Care Soc. 2017;18(10):915-923. doi:10.1097/PCC.0000000000001268 PubMed
26. Mangold WD. Neonatal mortality by the day of the week in the 1974-75 Arkansas live birth cohort. Am J Public Health. 1981;71(6):601-605. PubMed
27. MacFarlane A. Variations in number of births and perinatal mortality by day of week in England and Wales. Br Med J. 1978;2(6153):1670-1673. PubMed
28. McShane P, Draper ES, McKinney PA, McFadzean J, Parslow RC, Paediatric intensive care audit network (PICANet). Effects of out-of-hours and winter admissions and number of patients per unit on mortality in pediatric intensive care. J Pediatr. 2013;163(4):1039-1044.e5. doi:10.1016/j.jpeds.2013.03.061 PubMed
29. Hixson ED, Davis S, Morris S, Harrison AM. Do weekends or evenings matter in a pediatric intensive care unit? Pediatr Crit Care Med J Soc Crit Care Med World Fed Pediatr Intensive Crit Care Soc. 2005;6(5):523-530. PubMed
30. Gonzalez KW, Dalton BGA, Weaver KL, Sherman AK, St Peter SD, Snyder CL. Effect of timing of cannulation on outcome for pediatric extracorporeal life support. Pediatr Surg Int. 2016;32(7):665-669. doi:10.1007/s00383-016-3901-6 PubMed
31. Desai V, Gonda D, Ryan SL, et al. The effect of weekend and after-hours surgery on morbidity and mortality rates in pediatric neurosurgery patients. J Neurosurg Pediatr. 2015;16(6):726-731. doi:10.3171/2015.6.PEDS15184 PubMed
32. Berry JG, Hall DE, Kuo DZ, et al. Hospital utilization and characteristics of patients experiencing recurrent readmissions within children’s hospitals. JAMA. 2011;305(7):682-690. doi:10.1001/jama.2011.122 PubMed
33. Hoshijima H, Takeuchi R, Mihara T, et al. Weekend versus weekday admission and short-term mortality: A meta-analysis of 88 cohort studies including 56,934,649 participants. Medicine (Baltimore). 2017;96(17):e6685. doi:10.1097/MD.0000000000006685 PubMed
34. Feudtner C, Feinstein JA, Zhong W, Hall M, Dai D. Pediatric complex chronic conditions classification system version 2: updated for ICD-10 and complex medical technology dependence and transplantation. BMC Pediatr. 2014;14:199. doi:10.1186/1471-2431-14-199 PubMed
35. Li L, Rothwell PM, Oxford Vascular Study. Biases in detection of apparent “weekend effect” on outcome with administrative coding data: population based study of stroke. BMJ. 2016;353:i2648. doi: https://doi.org/10.1136/bmj.i2648 PubMed
36. Bray BD, Cloud GC, James MA, et al. Weekly variation in health-care quality by day and time of admission: a nationwide, registry-based, prospective cohort study of acute stroke care. The Lancet. 2016;388(10040):170-177. doi:10.1016/S0140-6736(16)30443-3 PubMed
37. Ko SQ, Strom JB, Shen C, Yeh RW. Mortality, Length of Stay, and Cost of Weekend Admissions. J Hosp Med. 2018. doi:10.12788/jhm.2906 PubMed
38. Tubbs-Cooley HL, Cimiotti JP, Silber JH, Sloane DM, Aiken LH. An observational study of nurse staffing ratios and hospital readmission among children admitted for common conditions. BMJ Qual Saf. 2013;22(9):735-742. doi:10.1136/bmjqs-2012-001610 PubMed
39. Ong M, Bostrom A, Vidyarthi A, McCulloch C, Auerbach A. House staff team workload and organization effects on patient outcomes in an academic general internal medicine inpatient service. Arch Intern Med. 2007;167(1):47-52. doi:10.1001/archinte.167.1.47 PubMed
Increasingly, metrics such as length of stay (LOS) and readmissions are being utilized in the United States to assess quality of healthcare because these factors may represent opportunities to reduce cost and improve healthcare delivery.1-8 However, the relatively low rate of pediatric readmissions,9 coupled with limited data regarding recommended LOS or best practices to prevent readmissions in children, challenges the ability of hospitals to safely reduce LOS and readmission rates for children.10–12
In adults, weekend admission is associated with prolonged LOS, increased readmission rates, and increased risk of mortality.13-21 This association is referred to as the “weekend effect.” While the weekend effect has been examined in children, the results of these studies have been variable, with some studies supporting this association and others refuting it.22-31 In contrast to patient demographic and clinical characteristics that are known to affect LOS and readmissions,32 the weekend effect represents a potentially modifiable aspect of a hospitalization that could be targeted to improve healthcare delivery.
With increasing national attention toward improving quality of care and reducing LOS and healthcare costs, more definitive evidence of the weekend effect is necessary to prioritize resource use at both the local and national levels. Therefore, we sought to determine the association of weekend admission and weekend discharge on LOS and 30-day readmissions, respectively, among a national cohort of children. We hypothesized that children admitted on the weekend would have longer LOS, whereas those discharged on the weekend would have higher readmission rates.
METHODS
Study Design and Data Source
We conducted a multicenter, retrospective, cross-sectional study. Data were obtained from the Pediatric Health Information System (PHIS), an administrative and billing database of 46 free-standing tertiary care pediatric hospitals affiliated with the Children’s Hospital Association (Lenexa, Kansas). Patient data are de-identified within PHIS; however, encrypted patient identifiers allow individual patients to be followed across visits. This study was not considered human subjects research by the policies of the Cincinnati Children’s Hospital Institutional Review Board.
Participants
We included hospitalizations to a PHIS-participating hospital for children aged 0-17 years between October 1, 2014 and September 30, 2015. We excluded children who were transferred from/to another institution, left against medical advice, or died in the hospital because these indications may result in incomplete LOS information and would not consistently contribute to readmission rates. We also excluded birth hospitalizations and children admitted for planned procedures. Birth hospitalizations were defined as hospitalizations that began on the day of birth.
Main Exposures
No standard definition of weekend admission or discharge was identified in the literature.33 Thus, we defined a weekend admission as an admission between 3:00
Main Outcomes
Our outcomes included LOS for weekend admission and 30-day readmissions for weekend discharge. LOS, measured in hours, was defined using the reported admission and discharge times. Readmissions were defined as a return to the same hospital within the subsequent 30 days following discharge.
Patient Demographics and Other Study Variables
Patient demographics included age, gender, race/ethnicity, payer, and median household income quartile based on the patient’s home ZIP code. Other study variables included presence of a complex chronic condition (CCC),34 technology dependence,34 number of chronic conditions of any complexity, admission through the emergency department, intensive care unit (ICU) admission, and case mix index. ICU admission and case mix index were chosen as markers for severity of illness. ICU admission was defined as any child who incurred ICU charges at any time following admission. Case mix index in PHIS is a relative weight assigned to each discharge based on the All-Patient Refined Diagnostic Group (APR-DRG; 3M) assignment and APR-DRG severity of illness, which ranges from 1 (minor) to 4 (extreme). The weights are derived by the Children’s Hospital Association from the HCUP KID 2012 database as the ratio of the average cost for discharges within a specific APR-DRG severity of illness combination to the average cost for all discharges in the database.
Statistical Analysis
Continuous variables were summarized with medians and interquartile ranges, while categorical variables were summarized with frequencies and percentages. Differences in admission and discharge characteristics between weekend and weekday were assessed using Wilcoxon rank sum tests for continuous variables and chi-square tests of association for categorical variables. We used generalized linear mixed modeling (GLMM) techniques to assess the impact of weekend admission on LOS and weekend discharge on readmission, adjusting for important patient demographic and clinical characteristics. Furthermore, we used GLMM point estimates to describe the variation across hospitals of the impact of weekday versus weekend care on LOS and readmissions. We assumed an underlying log-normal distribution for LOS and an underlying binomial distribution for 30-day readmission. All GLMMs included a random intercept for each hospital to account for patient clustering within a hospital. All statistical analyses were performed using SAS v.9.4 (SAS Institute, Cary, North Carolina), and P values <.05 were considered statistically significant.
RESULTS
We identified 390,745 hospitalizations that met inclusion criteria (Supplementary Figure 1). The median LOS among our cohort was 41 hours (interquartile range [IQR] 24-71) and the median 30-day readmission rate was 8.2% (IQR 7.2-9.4).
Admission Demographics for Weekends and Weekdays
Among the included hospitalizations, 92,266 (23.6%) admissions occurred on a weekend (Supplementary Table 1). Overall, a higher percentage of children <5 years of age were admitted on a weekend compared with those admitted on a weekday (53.3% vs 49.1%, P < .001). We observed a small but statistically significant difference in the proportion of weekend versus weekday admissions according to gender, race/ethnicity, payer, and median household income quartile. Children with medical complexity and those with technology dependence were admitted less frequently on a weekend. A higher proportion of children were admitted through the emergency department on a weekend and a higher frequency of ICU utilization was observed for children admitted on a weekend compared with those admitted on a weekday.
Association Between Study Variables and Length of Stay
In comparing adjusted LOS for weekend versus weekday admissions across 43 hospitals, not only did LOS vary across hospitals (P < .001), but the association between LOS and weekend versus weekday care also varied across hospitals (P < .001) (Figure 1). Weekend admission was associated with a significantly longer LOS at eight (18.6%) hospitals and a significantly shorter LOS at four (9.3%) hospitals with nonstatistically significant differences at the remaining hospitals.
In adjusted analyses, we observed that infants ≤30 days of age, on average, had an adjusted LOS that was 24% longer than that of 15- to 17-year-olds, while children aged 1-14 years had an adjusted LOS that was 6%-18% shorter (Table 1). ICU utilization, admission through the emergency department, and number of chronic conditions had the greatest association with LOS. As the number of chronic conditions increased, the LOS increased. No association was found between weekend versus weekday admission and LOS (adjusted LOS [95% CI]: weekend 63.70 [61.01-66.52] hours versus weekday 63.40 [60.73-66.19] hours, P = .112).
Discharge Demographics for Weekends and Weekdays
Of the included hospitalizations, 127,421 (32.6%) discharges occurred on a weekend (Supplementary Table 2). Overall, a greater percentage of weekend discharges comprised children <5 years of age compared with the percentage of weekday discharges for children <5 years of age (51.5% vs 49.5%, P < .001). No statistically significant differences were found in gender, payer, or median household income quartile between those children discharged on a weekend versus those discharged on a weekday. We found small, statistically significant differences in the proportion of weekend versus weekday discharges according to race/ethnicity, with fewer non-Hispanic white children being discharged on the weekend versus weekday. Children with medical complexity, technology dependence, and patients with ICU utilization were less frequently discharged on a weekend compared with those discharged on a weekday.
Association Between Study Variables and Readmissions
In comparing the adjusted odds of readmissions for weekend versus weekday discharges across 43 PHIS hospitals, we observed significant variation (P < .001) in readmission rates from hospital to hospital (Figure 2). However, the direction of impact of weekend care on readmissions was similar (P = .314) across hospitals (ie, for 37 of 43 hospitals, the readmission rate was greater for weekend discharges compared with that for weekday discharges). For 17 (39.5%) of 43 hospitals, weekend discharge was associated with a significantly higher readmission rate, while the differences between weekday and weekend discharge were not statistically significant for the remaining hospitals.
In adjusted analyses, we observed that infants <1 year were more likely to be readmitted compared with 15- to 17-year-olds, while children 5-14 years of age were less likely to be readmitted (Table 2). Medical complexity and the number of chronic conditions had the greatest association with readmissions, with increased likelihood of readmission observed as the number of chronic conditions increased. Weekend discharge was associated with increased probability of readmission compared with weekday discharge (adjusted probability of readmission [95% CI]: weekend 0.13 [0.12-0.13] vs weekday 0.11 [0.11-0.12], P < .001).
DISCUSSION
While the reasons for the weekend effect are unclear, data supporting this difference have been observed across many diverse patient groups and health systems both nationally and internationally.13-27,31 Weekend care is thought to differ from weekday care because of differences in physician and nurse staffing, availability of ancillary services, access to diagnostic testing and therapeutic interventions, ability to arrange outpatient follow-up, and individual patient clinical factors, including acuity of illness. Few studies have assessed the effect of weekend discharges on patient or system outcomes. Among children within a single health system, readmission risk was associated with weekend admission but not with weekend discharge.22 This observation suggests that if differential care exists, then it occurs during initial clinical management rather than during discharge planning. Consequently, understanding the interaction of weekend admission and LOS is important. In addition, the relative paucity of pediatric data examining a weekend discharge effect limits the ability to generalize these findings across other hospitals or health systems.
In contrast to prior work, we observed a modest increased risk for readmission among those discharged on the weekend in a large sample of children. Auger and Davis reported a lack of association between weekend discharge and readmissions at one tertiary care children’s hospital, citing reduced discharge volumes on the weekend, especially among children with medical complexity, as a possible driver for their observation.22 The inclusion of a much larger population across 43 hospitals in our study may explain our different findings compared with previous research. In addition, the inclusion/exclusion criteria differed between the two studies; we excluded index admissions for planned procedures in this study (which are more likely to occur during the week), which may have contributed to the differing conclusions. Although Auger and Davis suggest that differences in initial clinical management may be responsible for the weekend effect,22 our observations suggest that discharge planning practices may also contribute to readmission risk. For example, a family’s inability to access compounded medications at a local pharmacy or to access primary care following discharge could reasonably contribute to treatment failure and increased readmission risk. Attention to improving and standardizing discharge practices may alleviate differences in readmission risk among children discharged on a weekend.
Individual patient characteristics greatly influence LOS and readmission risk. Congruent with prior studies, medical complexity and technology dependence were among the factors in our study that had the strongest association with LOS and readmission risk.32 As with prior studies22, we observed that children with medical complexity and technology dependence were less frequently admitted and discharged on a weekend than on a weekday, which suggests that physicians may avoid complicated discharges on the weekend. Children with medical complexity present a unique challenge to physicians when assessing discharge readiness, given that these children frequently require careful coordination of durable medical equipment, obtainment of special medication preparations, and possibly the resumption or establishment of home health services. Notably, we cannot discern from our data what proportion of discharges may be delayed over the weekend secondary to challenges involved in coordinating care for children with medical complexity. Future investigations aimed at assessing physician decision making and discharge readiness in relation to discharge timing among children with medical complexity may establish this relationship more clearly.
We observed substantial variation in LOS and readmission risk across 43 tertiary care children’s hospitals. Since the 1970s, numerous studies have reported worse outcomes among patients admitted on the weekend. While the majority of studies support the weekend effect, several recent studies suggest that patients admitted on the weekend are at no greater risk of adverse outcomes than those admitted during the week.35-37 Our work builds on the existing literature, demonstrating a complex and variable relationship between weekend admission/discharge, LOS, and readmission risk across hospitals. Notably, while many hospitals in our study experienced a significant weekend effect in LOS or readmission risk, only four hospitals experienced a statistically significant weekend effect for both LOS and readmission risk (three hospitals experienced increased risk for both, while one hospital experienced increased readmission risk but decreased LOS). Future investigations of the weekend effect should focus on exploring the differences in admission/discharge practices and staffing patterns of hospitals that did or did not experience a weekend effect.
This study has several limitations
CONCLUSION
In a study of 43 children’s hospitals, children discharged on the weekend had a slightly increased readmission risk compared with children discharged on a weekday. Wide variation in the weekend effect on LOS and readmission risk was evident across hospitals. Individual patient characteristics had a greater impact on LOS and readmission risk than the weekend effect. Future investigations aimed at understanding which factors contribute most strongly to a weekend effect within individual hospitals (eg, differences in institutional admission/discharge practices) may help alleviate the weekend effect and improve healthcare quality.
Acknowledgments
This manuscript resulted from “Paper in a Day,” a Pediatric Research in Inpatient Settings (PRIS) Network-sponsored workshop presented at the Pediatric Hospital Medicine 2017 annual meeting. Workshop participants learned how to ask and answer a health services research question and efficiently prepare a manuscript for publication. The following are the members of the PRIS Network who contributed to this work: Jessica L. Bettenhausen, MD; Rebecca M. Cantu, MD, MPH; Jillian M Cotter, MD; Megan Deisz, MD; Teresa Frazer, MD; Pratichi Goenka, MD; Ashley Jenkins, MD; Kathryn E. Kyler, MD; Janet T. Lau, MD; Brian E. Lee, MD; Christiane Lenzen, MD; Trisha Marshall, MD; John M. Morrison MD, PhD; Lauren Nassetta, MD; Raymond Parlar-Chun, MD; Sonya Tang Girdwood MD, PhD; Tony R Tarchichi, MD; Irina G. Trifonova, MD; Jacqueline M. Walker, MD, MHPE; and Susan C. Walley, MD. See appendix for contact information for members of the PRIS Network
Funding
The authors have no financial relationships relevant to this article to disclose.
Disclosures
The authors have no conflicts of interest to disclose.
1. Crossing the Quality Chasm: The IOM Health Care Quality Initiative : Health and Medicine Division. http://www.nationalacademies.org/hmd/Global/News%20Announcements/Crossing-the-Quality-Chasm-The-IOM-Health-Care-Quality-Initiative.aspx. Accessed November 20, 2017.
2. Institute for Healthcare Improvement: IHI Home Page. http://www.ihi.org:80/Pages/default.aspx. Accessed November 20, 2017.
3. Berry JG, Zaslavsky AM, Toomey SL, et al. Recognizing differences in hospital quality performance for pediatric inpatient care. Pediatrics. 2015;136(2):251-262. doi:10.1542/peds.2014-3131
4. NQF: All-Cause Admissions and Readmissions Measures - Final Report. http://www.qualityforum.org/Publications/2015/04/All-Cause_Admissions_and_Readmissions_Measures_-_Final_Report.aspx. Accessed March 24, 2018.
5. Hospital Inpatient Potentially Preventable Readmissions Information and Reports. https://www.illinois.gov/hfs/MedicalProviders/hospitals/PPRReports/Pages/default.aspx. Accessed November 6, 2016.
6. Potentially Preventable Readmissions in Texas Medicaid and CHIP Programs - Fiscal Year 2013 | Texas Health and Human Services. https://hhs.texas.gov/reports/2016/08/potentially-preventable-readmissions-texas-medicaid-and-chip-programs-fiscal-year. Accessed November 6, 2016.
7. Statewide Planning and Research Cooperative System. http://www.health.ny.gov/statistics/sparcs/sb/. Accessed November 6, 2016.
8. HCA Implements Potentially Preventable Readmission (PPR) Adjustments. Wash State Hosp Assoc. http://www.wsha.org/articles/hca-implements-potentially-preventable-readmission-ppr-adjustments/. Accessed November 8, 2016.
9. Berry JG, Toomey SL, Zaslavsky AM, et al. Pediatric readmission prevalence and variability across hospitals. JAMA. 2013;309(4):372-380. doi:10.1001/jama.2012.188351 PubMed
10. Bardach NS, Vittinghoff E, Asteria-Peñaloza R, et al. Measuring hospital quality using pediatric readmission and revisit rates. Pediatrics. 2013;132(3):429-436. doi:10.1542/peds.2012-3527 PubMed
11. Berry JG, Blaine K, Rogers J, et al. A framework of pediatric hospital discharge care informed by legislation, research, and practice. JAMA Pediatr. 2014;168(10):955-962; quiz 965-966. doi:10.1001/jamapediatrics.2014.891 PubMed
12. Auger KA, Simon TD, Cooperberg D, et al. Summary of STARNet: seamless transitions and (Re)admissions network. Pediatrics. 2015;135(1):164. doi:10.1542/peds.2014-1887 PubMed
13. Freemantle N, Ray D, McNulty D, et al. Increased mortality associated with weekend hospital admission: a case for expanded seven day services? BMJ. 2015;351:h4596. doi:10.1136/bmj.h4596 PubMed
14. Schilling PL, Campbell DA, Englesbe MJ, Davis MM. A comparison of in-hospital mortality risk conferred by high hospital occupancy, differences in nurse staffing levels, weekend admission, and seasonal influenza. Med Care. 2010;48(3):224-232. doi:10.1097/MLR.0b013e3181c162c0 PubMed
15. Cram P, Hillis SL, Barnett M, Rosenthal GE. Effects of weekend admission and hospital teaching status on in-hospital mortality. Am J Med. 2004;117(3):151-157. doi:10.1016/j.amjmed.2004.02.035 PubMed
16. Zapf MAC, Kothari AN, Markossian T, et al. The “weekend effect” in urgent general operative procedures. Surgery. 2015;158(2):508-514. doi:10.1016/j.surg.2015.02.024 PubMed
17. Freemantle N, Richardson M, Wood J, et al. Weekend hospitalization and additional risk of death: an analysis of inpatient data. J R Soc Med. 2012;105(2):74-84. doi:10.1258/jrsm.2012.120009 PubMed
18. Bell CM, Redelmeier DA. Mortality among patients admitted to hospitals on weekends as compared with weekdays. N Engl J Med. 2001;345(9):663-668. doi:10.1056/NEJMsa003376 PubMed
19. Coiera E, Wang Y, Magrabi F, Concha OP, Gallego B, Runciman W. Predicting the cumulative risk of death during hospitalization by modeling weekend, weekday and diurnal mortality risks. BMC Health Serv Res. 2014;14:226. doi:10.1186/1472-6963-14-226 PubMed
20. Powell ES, Khare RK, Courtney DM, Feinglass J. The weekend effect for patients with sepsis presenting to the emergency department. J Emerg Med. 2013;45(5):641-648. doi:10.1016/j.jemermed.2013.04.042 PubMed
21. Ananthakrishnan AN, McGinley EL, Saeian K. Outcomes of weekend admissions for upper gastrointestinal hemorrhage: a nationwide analysis. Clin Gastroenterol Hepatol Off Clin Pract J Am Gastroenterol Assoc. 2009;7(3):296-302e1. doi:10.1016/j.cgh.2008.08.013 PubMed
22. Auger KA, Davis MM. Pediatric weekend admission and increased unplanned readmission rates. J Hosp Med. 2015;10(11):743-745. doi:10.1002/jhm.2426 PubMed
23. Goldstein SD, Papandria DJ, Aboagye J, et al. The “weekend effect” in pediatric surgery - increased mortality for children undergoing urgent surgery during the weekend. J Pediatr Surg. 2014;49(7):1087-1091. doi:10.1016/j.jpedsurg.2014.01.001 PubMed
24. Adil MM, Vidal G, Beslow LA. Weekend effect in children with stroke in the nationwide inpatient sample. Stroke. 2016;47(6):1436-1443. doi:10.1161/STROKEAHA.116.013453 PubMed
25. McCrory MC, Spaeder MC, Gower EW, et al. Time of admission to the PICU and mortality. Pediatr Crit Care Med J Soc Crit Care Med World Fed Pediatr Intensive Crit Care Soc. 2017;18(10):915-923. doi:10.1097/PCC.0000000000001268 PubMed
26. Mangold WD. Neonatal mortality by the day of the week in the 1974-75 Arkansas live birth cohort. Am J Public Health. 1981;71(6):601-605. PubMed
27. MacFarlane A. Variations in number of births and perinatal mortality by day of week in England and Wales. Br Med J. 1978;2(6153):1670-1673. PubMed
28. McShane P, Draper ES, McKinney PA, McFadzean J, Parslow RC, Paediatric intensive care audit network (PICANet). Effects of out-of-hours and winter admissions and number of patients per unit on mortality in pediatric intensive care. J Pediatr. 2013;163(4):1039-1044.e5. doi:10.1016/j.jpeds.2013.03.061 PubMed
29. Hixson ED, Davis S, Morris S, Harrison AM. Do weekends or evenings matter in a pediatric intensive care unit? Pediatr Crit Care Med J Soc Crit Care Med World Fed Pediatr Intensive Crit Care Soc. 2005;6(5):523-530. PubMed
30. Gonzalez KW, Dalton BGA, Weaver KL, Sherman AK, St Peter SD, Snyder CL. Effect of timing of cannulation on outcome for pediatric extracorporeal life support. Pediatr Surg Int. 2016;32(7):665-669. doi:10.1007/s00383-016-3901-6 PubMed
31. Desai V, Gonda D, Ryan SL, et al. The effect of weekend and after-hours surgery on morbidity and mortality rates in pediatric neurosurgery patients. J Neurosurg Pediatr. 2015;16(6):726-731. doi:10.3171/2015.6.PEDS15184 PubMed
32. Berry JG, Hall DE, Kuo DZ, et al. Hospital utilization and characteristics of patients experiencing recurrent readmissions within children’s hospitals. JAMA. 2011;305(7):682-690. doi:10.1001/jama.2011.122 PubMed
33. Hoshijima H, Takeuchi R, Mihara T, et al. Weekend versus weekday admission and short-term mortality: A meta-analysis of 88 cohort studies including 56,934,649 participants. Medicine (Baltimore). 2017;96(17):e6685. doi:10.1097/MD.0000000000006685 PubMed
34. Feudtner C, Feinstein JA, Zhong W, Hall M, Dai D. Pediatric complex chronic conditions classification system version 2: updated for ICD-10 and complex medical technology dependence and transplantation. BMC Pediatr. 2014;14:199. doi:10.1186/1471-2431-14-199 PubMed
35. Li L, Rothwell PM, Oxford Vascular Study. Biases in detection of apparent “weekend effect” on outcome with administrative coding data: population based study of stroke. BMJ. 2016;353:i2648. doi: https://doi.org/10.1136/bmj.i2648 PubMed
36. Bray BD, Cloud GC, James MA, et al. Weekly variation in health-care quality by day and time of admission: a nationwide, registry-based, prospective cohort study of acute stroke care. The Lancet. 2016;388(10040):170-177. doi:10.1016/S0140-6736(16)30443-3 PubMed
37. Ko SQ, Strom JB, Shen C, Yeh RW. Mortality, Length of Stay, and Cost of Weekend Admissions. J Hosp Med. 2018. doi:10.12788/jhm.2906 PubMed
38. Tubbs-Cooley HL, Cimiotti JP, Silber JH, Sloane DM, Aiken LH. An observational study of nurse staffing ratios and hospital readmission among children admitted for common conditions. BMJ Qual Saf. 2013;22(9):735-742. doi:10.1136/bmjqs-2012-001610 PubMed
39. Ong M, Bostrom A, Vidyarthi A, McCulloch C, Auerbach A. House staff team workload and organization effects on patient outcomes in an academic general internal medicine inpatient service. Arch Intern Med. 2007;167(1):47-52. doi:10.1001/archinte.167.1.47 PubMed
© 2018 Society of Hospital Medicine
Identifying Observation Stays in Medicare Data: Policy Implications of a Definition
Medicare observation stays are increasingly common. From 2006 to 2012, Medicare observation stays increased by 88%,1 whereas inpatient discharges decreased by 13.9%.2 In 2012, 1.7 million Medicare observation stays were recorded, and an additional 700,000 inpatient stays were preceded by observation services; the latter represented a 96% increase in status change since 2006.1 Yet no standard research methodology for identifying observation stays exists, including methods to identify and properly characterize “status change” events, which are hospital stays where initial and final inpatient or outpatient (observation) statuses differ.
With the increasing number of hospitalized patients classified as observation, a standard methodology for Medicare claims research is needed so that observation stays can be consistently identified and potentially included in future quality measures and outcomes. Existing research studies and government reports use widely varying criteria to identify observation stays, often lack detailed methods on observation stay case finding, and contain limited information on how status changes between inpatient and outpatient (observation) statuses are incorporated. This variability in approach may lead to omission and/or miscategorization of events and raises concern about the comparability of prior work.
This study aimed to determine the claims patterns of Medicare observation stays, define comprehensive claims-based methodology for future Medicare observation research and data reporting, and identify policy implications of such definition. We are poised to do this work because of our access to the nationally generalizable Centers for Medicare & Medicaid Services (CMS) linked Part A inpatient and outpatient data sets for 2013 and 2014, as well as our prior expertise in hospital observation research and Medicare claims studies.
METHODS
General Methods and Data Source
A 2014 national 20% random sample Part A and B Medicare data set was used. In accordance with the Centers for Medicare & Medicaid (CMS) data use agreement, all included beneficiaries had at least 1 acute care inpatient hospitalization. Included beneficiaries were enrolled for 12 months prior to their first 2014 inpatient stay. Those with Medicare Advantage or railroad benefits were excluded because of incomplete data per prior methods.3 The University of Wisconsin Institutional Review Board approved this study.
Comparison of Methods
The PubMED query “Medicare AND (observation OR observation unit),” limited to English and publication between January 1, 2010 and October 1, 2017, was conducted to determine the universe of prior observation stay definitions used in research for comparison (Appendix).4-20 The Office of Inspector General report,21 the Research Data Assistance Center (ResDAC),22 and Medicare Claims Processing Manual (MCPM)23 were also included. Methods stated in each publication were used to extrapolate observation stay case finding to the study data set.
Observation Stay Case Finding
Inpatient and outpatient revenue centers were queried for observation revenue center (ORC) codes identified by ResDAC,22 including 0760 (Treatment or observation room - general classification), 0761 (Treatment or observation room - treatment room), 0762 (Treatment or observation room – observation room), and 0769 (Treatment or observation room – other) occurring within 30 days of an inpatient stay. Healthcare Common Procedure Coding System (HCPCS) codes G0378 (Hospital observation service, per hour) and G0379 (Direct referral of patient for hospital observation care) were included per MCPM.23 A combination of these ORC and HCPCS codes was also used to identify observation stays in every Medicare claims observation study since 2010. When more than one ORC code per event was found, each ORC was recorded as part of that event. Presence of HCPCS G0378 and/or G0379 was determined for each event in association with event ORC(s), as was association of ORC codes with inpatient claims. In this manuscript, “observation stay” refers to an observation hospital stay, and “event” refers to a hospitalization that may include inpatient and/or outpatient (observation) services and ORC codes.
Status Change
All ORC codes found in the inpatient revenue center were assumed to represent status changes from outpatient (observation) to inpatient, as ORC codes may remain in claims data when the status changes to inpatient.24 Therefore, all events with ORC codes in the inpatient revenue center were considered inpatient hospitalizations.
For each ORC code found in the outpatient revenue center and also associated with an inpatient claim, timing of the ORC code in the inpatient claim was grouped into four categories to determine events with the final status of outpatient (observation stay). ResDAC defines the “From” date as “…the first day on the billing statement covering services rendered to the beneficiary.”24 For most hospitals, this is a three-day period prior to an inpatient admission where outpatient services are included in the Part A claim.25 We defined Category 1 as ORC codes occurring prior to claim “From” date; Category 2 as ORC codes on the inpatient “From” date, between the inpatient “From” date and admission date, or on the admission date; Category 3 as ORC codes between admission and discharge dates; and Category 4 as ORC codes occurring on or after the discharge date. Given that Category 4 represents the final hospitalization status, we considered Category 4 ORC codes in the outpatient revenue center associated with inpatient claims to be observation stays that had undergone a status change from inpatient to outpatient (observation).
University of Wisconsin Method
After excluding ORC codes in the inpatient revenue center as true inpatient hospitalizations, we defined an observation stay as 0760 and/or 0761 and/or 0762 and/or 0769 in the outpatient revenue center and having no association with an inpatient claim. To address a status change from inpatient to outpatient (observation), for those ORC codes in the outpatient revenue center also associated with an inpatient claim, claims with ORC codes in Category 4 were also considered observation stays.
RESULTS
Of 1,667,660 hospital events, 125,920 (7.6%) had an ORC code within 30 days of an inpatient hospitalization, of which 50,418 (3.0%) were found in the inpatient revenue center and 75,502 (4.5%) were from the outpatient revenue center. A total of 59,529 (47.3%) ORC codes occurred with an inpatient claim (50,418 in the inpatient revenue center and 9,111 in the outpatient revenue center), 5,628 (4.5%) had more than one ORC code on a single hospitalization, and more than 90% of codes were 0761 or 0762. These results illustrated variability in claims submissions as measured by the claims themselves and demonstrated a high rate of status changes (Table).
Observation stay definitions varied in the literature, with different methods capturing variable numbers of observation stays (Figure, Appendix). No methods clearly identified how to categorize events with status changes, directly addressed ORC codes in the inpatient revenue center, or discussed events with more than one ORC code. As such, some assumptions were made to extrapolate observation stay case findings as detailed in the Figure (see also Appendix). Notably, reference 4 methods were obtained via personal communication with the manuscript’s first author. The University of Wisconsin definition offers a comprehensive definition that classifies status change events, yielding 72,858 of 75,502 (96.5%) potential observation events as observation stays (Figure). These observation stays include 66,391 stays with ORC codes in the outpatient revenue center without status change or relation to inpatient claim, and 6467 (71.0%) of 9111 events with ORC codes in the outpatient revenue center were associated with an inpatient claim where ORC code(s) is located in Category 4.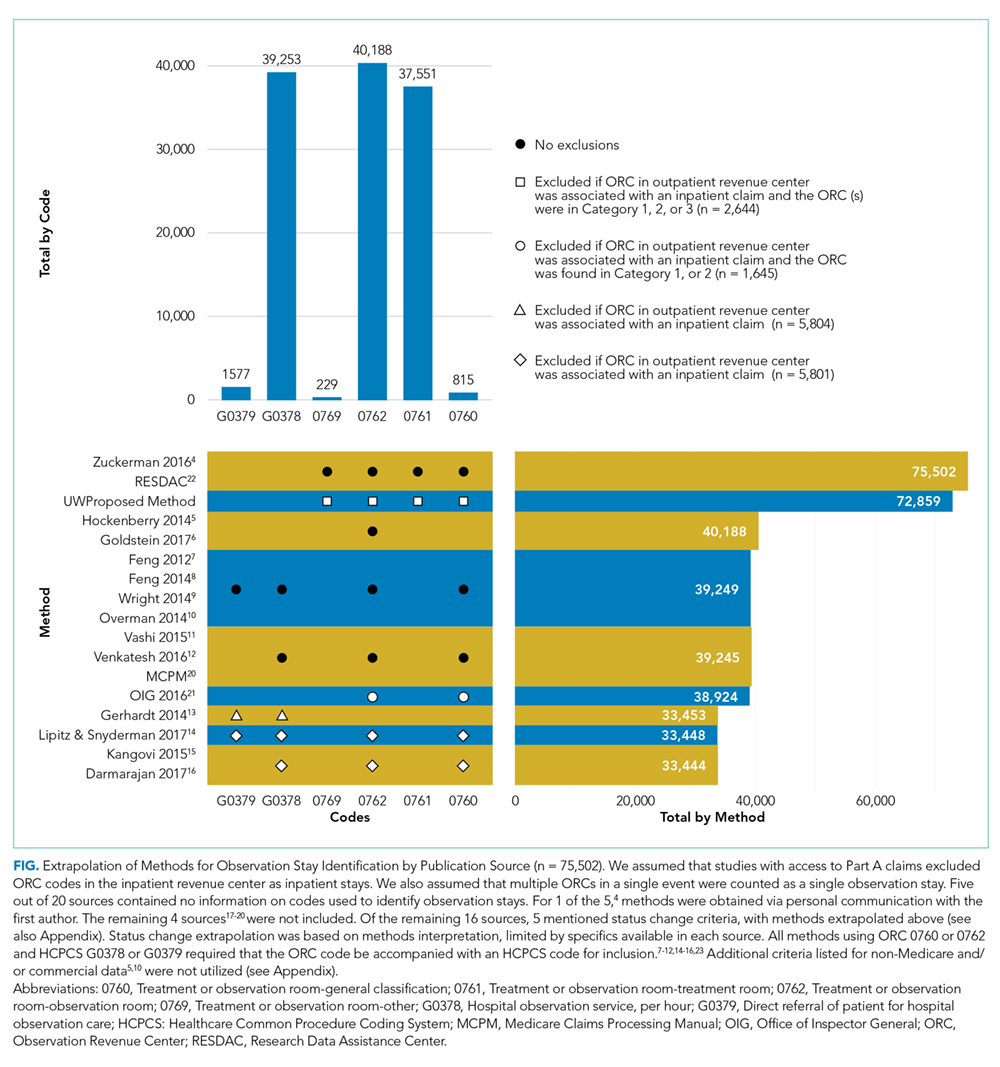
CONCLUSIONS
This study confirmed the importance of a standard observation stay case finding methodology. Variability in prior methodology resulted in studies that may have included less than half of potential observation stays. In addition, most studies did not include, or were unclear, on how to address the increasing number of status changes. Others may have erroneously included hospitalizations that were ultimately billed as inpatient, and some publications lacked sufficient detailed methodology to extrapolate results with absolute certainty, a limitation of our comparative results. Although excluding some ORC codes in the outpatient revenue center associated with inpatient claims may possibly miss some observation stays, or including certain ORC codes, such as 0761 (treatment or observation room - treatment room), may erroneously include a different type of observation stay, the proposed University of Wisconsin method could be used as a comprehensive and reproducible method for observation stay case finding, including encounters with status change.
This study has other important policy implications. More than 90% of ORC codes were either 0761 or 0762, and in almost one in 20 claims, two or more distinct codes were identified. Given the lack of clinical relevance of terms “treatment” or “observation” room, and the frequency of more than 1 ORC code per claim, CMS may consider simplification to a single ORC code. Studies of observation encounter length of stay by hour may require G0378 in addition to an ORC code to define an observation stay, but doing so eliminates nearly half of observation claims. Additionally, G0379 adds minimal value to G0378 in case finding.
Finally, this study illustrates overall confusion with outpatient (observation) and inpatient status designations, with almost half (47.3%) of all hospitalizations with ORC codes also associated with an inpatient claim, demonstrating a high status change rate. More than 40% of all nurse case manager job postings are now for status determination work, shifting duties from patient care and quality improvement.26 We previously demonstrated a need for 5.1 FTE combined physician, attorney, and other personnel to manage the status, audit, and appeals process per institution.27 The frequency of status changes and personnel needed to maintain a two-tiered billing system argues for a single hospital status.
In summary, our study highlights the need for federal observation policy reform. We propose a standardized and reproducible approach for Medicare observation claims research, including status changes that can be used for further studies of observation stays.
Acknowledgments
The authors thank Jinn-ing Liou for analyst support, Jen Birstler for figure creation, and Carol Hermann for technical support. This work was supported by the National Institute on Minority Health and Health Disparities of the National Institutes of Health under Award Number R01MD010243 (Dr. Kind).
Disclosures
The authors have no relevant conflicts of interest to disclose.Funding: This work was supported by the National Institute on Minority Health and Health Disparities of the National Institutes of Health under Award Number R01MD010243 (
1. MedPAC Report to Congress. June 2015, Chapter 7. Hospital short-stay policy issues. http://medpac.gov/docs/default-source/reports/june-2015-report-to-the-congress-medicare-and-the-health-care-delivery-system.pdf?sfvrsn=0. Accessed December 21, 2017.
2. MedPAC Report to Congress. March 2017, Chapter 3. Hospital inpatient and outpatient services. http://medpac.gov/docs/default-source/reports/mar17_entirereport224610adfa9c665e80adff00009edf9c.pdf?sfvrsn=0. Accessed December 21, 2017.
3. Kind A, Jencks S, Crock J, et al. Neighborhood socioecomonic disadvantage and 30-day reshospitalization: a retrospective cohort study. Ann Intern Med. 2014;161(11):765-774. doi: 10.7326/M13-2946. PubMed
4. Zuckerman R, Sheingold S, Orav E, Ruhter J, Epstein A. Readmissions, observation, and the Hospital Readmissions Reduction Program. NEJM. 2016;374(16):1543-1551. doi: 10.1056/NEJMsa1513024. PubMed
5. Hockenberry J, Mutter R, Barrett M, Parlato J, Ross M. Factors associated with prolonged observation services stays and the impact of long stays on patient cost. Health Serv Res. 2014;49(3):893-909. 10.1111/1475-6773.12143. PubMed
6. Goldstein J, Zhang Z, Schwartz S, Hicks L. Observation status, poverty, and high financial liability among Medicare beneficiaries. Am J Med. 2017;131(1):e9-101.e15. doi: 10.1016/j.amjmed.2017.07.013. PubMed
7. Feng Z, Wright B, Mor V. Sharp rise in Medicare enrollees being held in hospitals for observation raises concerns about causes and consequences. Health Aff. 2012;31(6):1251-1259. doi: 10.1377/hlthaff.2012.0129. PubMed
8. Feng Z, Jung H-Y, Wright B, Mor V. The origin and disposition of Medicare observation stays. Med Care. 2014;52(9):796-800. doi: 10.1097/MLR.0000000000000179 PubMed
9. Wright B, Jung H-Y, Feng Z, Mor V. Hospital, patient, and local health system characteristics associated with the prevalence and duration of observation care. HSR. 2014;49(4):1088-1107. doi: 10.1111/1475-6773.12166. PubMed
10. Overman R, Freburger J, Assimon M, Li X, Brookhart MA. Observation stays in administrative claims databases: underestimation of hospitalized cases. Pharmacoepidemiol Drug Saf. 2014;23(9):902-910. doi: 10.1002/pds.3647. PubMed
11. Vashi A, Cafardi S, Powers C, Ross J, Shrank W. Observation encounters and subsequent nursing facility stays. Am J Manag Care. 2015;21(4):e276-e281. PubMed
12. Venkatesh A, Wang C, Ross J, et al. Hospital use of observation stays: cross-sectional study of the impact on readmission rates. Med Care. 2016;54(12):1070-1077. doi: 10.1097/MLR.0000000000000601 PubMed
13. Gerhardt G, Yemane A, Apostle K, Oelschlaeger A, Rollins E, Brennan N. Evaluating whether changes in utilization of hospital outpatient services contributed to lower Medicare readmission rate. MMRR. 2014;4(1):E1-E13. doi: 10.5600/mmrr2014-004-01-b03 PubMed
14. Lipitz-Snyderman A, Klotz A, Gennarelli R, Groeger J. A population-based assessment of emergency department observation status for older adults with cancer. J Natl Compr Canc Netw. 2017;15(10):1234-1239. doi: 10.6004/jnccn.2017.0160. PubMed
15. Kangovi S, Cafardi S, Smith R, Kulkarni R, Grande D. Patient financial responsibility for observation care. J Hosp Med. 2015;10:718-723. doi: 10.1002/jhm.2436. PubMed
16. Dharmarajan K, Qin L, Bierlein M, et al. Outcomes after observation stays among older adult Medicare beneficiaries in the USA: retrospective cohort study. BMJ. 2017;357:j2616. doi: 10.1136/bmj.j2616 PubMed
17. Baier R, Gardner R, Coleman E, Jencks S, Mor V, Gravenstein S. Shifting the dialogue from hospital readmissions to unplanned care. Am J Manag Care. 2013;19(6):450-453. PubMed
18. Cafardi S, Pines J, Deb P, Powers C, Shrank W. Increased observation services in Medicare beneficiaries with chest pain. Am J Emergency Med. 2016;34(1):16-19. doi: 10.1016/j.ajem.2015.08.049. PubMed
19. Nuckols T, Fingar K, Barrett M, Steiner C, Stocks C, Owens P. The shifting landscape in utilization of inpatient, observation, and emergency department services across payors. J Hosp Med. 2017;12(6):443-446. doi: 10.12788/jhm.2751. PubMed
20. Wright B, Jung H-Y, Feng Z, Mor V. Trends in observation care among Medicare fee-for-service beneficiaries at critical access hospitals, 2007-2009. J Rural Health. 2013;29(1):s1-s6. doi: 10.1111/jrh.12007 PubMed
21. Office of Inspector General. Vulnerabilites remain under Medicare’s 2-Midnight hospital policy. 12-9-2016. https://oig.hhs.gov/oei/reports/oei-02-15-00020.asp. Accessed December 27, 2017. PubMed
22. Research Data Assistance Center (ResDAC). Revenue center table. https://www.resdac.org/sites/resdac.umn.edu/files/Revenue%20Center%20Table.txt. Accessed December 26, 2017.
23. Medicare Claims Processing Manual, Chapter 4, Section 290, Outpatient Observation Services. https://www.cms.gov/Regulations-and-Guidance/Guidance/Manuals/downloads/clm104c04.pdf. Accessed December 26, 2017.
24. Research Data Assistance Center (ResDAC). Identifying observation stays for those beneficiaries admitted to the hospital. https://www.resdac.org/resconnect/articles/172. Accessed December 27, 2017.
25. Medicare Claims Processing Manual, Chapter 3, Section 40.B. Outpatient services treated as inpatient services. https://www.cms.gov/Regulations-and-Guidance/Guidance/Manuals/Downloads/clm104c03.pdf. Accessed December 26, 2017.
26. Reynolds J. Another look at roles and functions: has hospital case management lost its way? Prof Case Manag. 2013;18(5):246-254. doi: 10.1097/NCM.0b013e31829c8aa8. PubMed
27. Sheehy A, Locke C, Engel J, et al. Recovery audit contractor audit and appeals at three academic medical centers. J Hosp Med. 2015;10(4):212-219. doi: 10.1002/jhm.2332. PubMed
Medicare observation stays are increasingly common. From 2006 to 2012, Medicare observation stays increased by 88%,1 whereas inpatient discharges decreased by 13.9%.2 In 2012, 1.7 million Medicare observation stays were recorded, and an additional 700,000 inpatient stays were preceded by observation services; the latter represented a 96% increase in status change since 2006.1 Yet no standard research methodology for identifying observation stays exists, including methods to identify and properly characterize “status change” events, which are hospital stays where initial and final inpatient or outpatient (observation) statuses differ.
With the increasing number of hospitalized patients classified as observation, a standard methodology for Medicare claims research is needed so that observation stays can be consistently identified and potentially included in future quality measures and outcomes. Existing research studies and government reports use widely varying criteria to identify observation stays, often lack detailed methods on observation stay case finding, and contain limited information on how status changes between inpatient and outpatient (observation) statuses are incorporated. This variability in approach may lead to omission and/or miscategorization of events and raises concern about the comparability of prior work.
This study aimed to determine the claims patterns of Medicare observation stays, define comprehensive claims-based methodology for future Medicare observation research and data reporting, and identify policy implications of such definition. We are poised to do this work because of our access to the nationally generalizable Centers for Medicare & Medicaid Services (CMS) linked Part A inpatient and outpatient data sets for 2013 and 2014, as well as our prior expertise in hospital observation research and Medicare claims studies.
METHODS
General Methods and Data Source
A 2014 national 20% random sample Part A and B Medicare data set was used. In accordance with the Centers for Medicare & Medicaid (CMS) data use agreement, all included beneficiaries had at least 1 acute care inpatient hospitalization. Included beneficiaries were enrolled for 12 months prior to their first 2014 inpatient stay. Those with Medicare Advantage or railroad benefits were excluded because of incomplete data per prior methods.3 The University of Wisconsin Institutional Review Board approved this study.
Comparison of Methods
The PubMED query “Medicare AND (observation OR observation unit),” limited to English and publication between January 1, 2010 and October 1, 2017, was conducted to determine the universe of prior observation stay definitions used in research for comparison (Appendix).4-20 The Office of Inspector General report,21 the Research Data Assistance Center (ResDAC),22 and Medicare Claims Processing Manual (MCPM)23 were also included. Methods stated in each publication were used to extrapolate observation stay case finding to the study data set.
Observation Stay Case Finding
Inpatient and outpatient revenue centers were queried for observation revenue center (ORC) codes identified by ResDAC,22 including 0760 (Treatment or observation room - general classification), 0761 (Treatment or observation room - treatment room), 0762 (Treatment or observation room – observation room), and 0769 (Treatment or observation room – other) occurring within 30 days of an inpatient stay. Healthcare Common Procedure Coding System (HCPCS) codes G0378 (Hospital observation service, per hour) and G0379 (Direct referral of patient for hospital observation care) were included per MCPM.23 A combination of these ORC and HCPCS codes was also used to identify observation stays in every Medicare claims observation study since 2010. When more than one ORC code per event was found, each ORC was recorded as part of that event. Presence of HCPCS G0378 and/or G0379 was determined for each event in association with event ORC(s), as was association of ORC codes with inpatient claims. In this manuscript, “observation stay” refers to an observation hospital stay, and “event” refers to a hospitalization that may include inpatient and/or outpatient (observation) services and ORC codes.
Status Change
All ORC codes found in the inpatient revenue center were assumed to represent status changes from outpatient (observation) to inpatient, as ORC codes may remain in claims data when the status changes to inpatient.24 Therefore, all events with ORC codes in the inpatient revenue center were considered inpatient hospitalizations.
For each ORC code found in the outpatient revenue center and also associated with an inpatient claim, timing of the ORC code in the inpatient claim was grouped into four categories to determine events with the final status of outpatient (observation stay). ResDAC defines the “From” date as “…the first day on the billing statement covering services rendered to the beneficiary.”24 For most hospitals, this is a three-day period prior to an inpatient admission where outpatient services are included in the Part A claim.25 We defined Category 1 as ORC codes occurring prior to claim “From” date; Category 2 as ORC codes on the inpatient “From” date, between the inpatient “From” date and admission date, or on the admission date; Category 3 as ORC codes between admission and discharge dates; and Category 4 as ORC codes occurring on or after the discharge date. Given that Category 4 represents the final hospitalization status, we considered Category 4 ORC codes in the outpatient revenue center associated with inpatient claims to be observation stays that had undergone a status change from inpatient to outpatient (observation).
University of Wisconsin Method
After excluding ORC codes in the inpatient revenue center as true inpatient hospitalizations, we defined an observation stay as 0760 and/or 0761 and/or 0762 and/or 0769 in the outpatient revenue center and having no association with an inpatient claim. To address a status change from inpatient to outpatient (observation), for those ORC codes in the outpatient revenue center also associated with an inpatient claim, claims with ORC codes in Category 4 were also considered observation stays.
RESULTS
Of 1,667,660 hospital events, 125,920 (7.6%) had an ORC code within 30 days of an inpatient hospitalization, of which 50,418 (3.0%) were found in the inpatient revenue center and 75,502 (4.5%) were from the outpatient revenue center. A total of 59,529 (47.3%) ORC codes occurred with an inpatient claim (50,418 in the inpatient revenue center and 9,111 in the outpatient revenue center), 5,628 (4.5%) had more than one ORC code on a single hospitalization, and more than 90% of codes were 0761 or 0762. These results illustrated variability in claims submissions as measured by the claims themselves and demonstrated a high rate of status changes (Table).
Observation stay definitions varied in the literature, with different methods capturing variable numbers of observation stays (Figure, Appendix). No methods clearly identified how to categorize events with status changes, directly addressed ORC codes in the inpatient revenue center, or discussed events with more than one ORC code. As such, some assumptions were made to extrapolate observation stay case findings as detailed in the Figure (see also Appendix). Notably, reference 4 methods were obtained via personal communication with the manuscript’s first author. The University of Wisconsin definition offers a comprehensive definition that classifies status change events, yielding 72,858 of 75,502 (96.5%) potential observation events as observation stays (Figure). These observation stays include 66,391 stays with ORC codes in the outpatient revenue center without status change or relation to inpatient claim, and 6467 (71.0%) of 9111 events with ORC codes in the outpatient revenue center were associated with an inpatient claim where ORC code(s) is located in Category 4.
CONCLUSIONS
This study confirmed the importance of a standard observation stay case finding methodology. Variability in prior methodology resulted in studies that may have included less than half of potential observation stays. In addition, most studies did not include, or were unclear, on how to address the increasing number of status changes. Others may have erroneously included hospitalizations that were ultimately billed as inpatient, and some publications lacked sufficient detailed methodology to extrapolate results with absolute certainty, a limitation of our comparative results. Although excluding some ORC codes in the outpatient revenue center associated with inpatient claims may possibly miss some observation stays, or including certain ORC codes, such as 0761 (treatment or observation room - treatment room), may erroneously include a different type of observation stay, the proposed University of Wisconsin method could be used as a comprehensive and reproducible method for observation stay case finding, including encounters with status change.
This study has other important policy implications. More than 90% of ORC codes were either 0761 or 0762, and in almost one in 20 claims, two or more distinct codes were identified. Given the lack of clinical relevance of terms “treatment” or “observation” room, and the frequency of more than 1 ORC code per claim, CMS may consider simplification to a single ORC code. Studies of observation encounter length of stay by hour may require G0378 in addition to an ORC code to define an observation stay, but doing so eliminates nearly half of observation claims. Additionally, G0379 adds minimal value to G0378 in case finding.
Finally, this study illustrates overall confusion with outpatient (observation) and inpatient status designations, with almost half (47.3%) of all hospitalizations with ORC codes also associated with an inpatient claim, demonstrating a high status change rate. More than 40% of all nurse case manager job postings are now for status determination work, shifting duties from patient care and quality improvement.26 We previously demonstrated a need for 5.1 FTE combined physician, attorney, and other personnel to manage the status, audit, and appeals process per institution.27 The frequency of status changes and personnel needed to maintain a two-tiered billing system argues for a single hospital status.
In summary, our study highlights the need for federal observation policy reform. We propose a standardized and reproducible approach for Medicare observation claims research, including status changes that can be used for further studies of observation stays.
Acknowledgments
The authors thank Jinn-ing Liou for analyst support, Jen Birstler for figure creation, and Carol Hermann for technical support. This work was supported by the National Institute on Minority Health and Health Disparities of the National Institutes of Health under Award Number R01MD010243 (Dr. Kind).
Disclosures
The authors have no relevant conflicts of interest to disclose.Funding: This work was supported by the National Institute on Minority Health and Health Disparities of the National Institutes of Health under Award Number R01MD010243 (
1. MedPAC Report to Congress. June 2015, Chapter 7. Hospital short-stay policy issues. http://medpac.gov/docs/default-source/reports/june-2015-report-to-the-congress-medicare-and-the-health-care-delivery-system.pdf?sfvrsn=0. Accessed December 21, 2017.
2. MedPAC Report to Congress. March 2017, Chapter 3. Hospital inpatient and outpatient services. http://medpac.gov/docs/default-source/reports/mar17_entirereport224610adfa9c665e80adff00009edf9c.pdf?sfvrsn=0. Accessed December 21, 2017.
3. Kind A, Jencks S, Crock J, et al. Neighborhood socioecomonic disadvantage and 30-day reshospitalization: a retrospective cohort study. Ann Intern Med. 2014;161(11):765-774. doi: 10.7326/M13-2946. PubMed
4. Zuckerman R, Sheingold S, Orav E, Ruhter J, Epstein A. Readmissions, observation, and the Hospital Readmissions Reduction Program. NEJM. 2016;374(16):1543-1551. doi: 10.1056/NEJMsa1513024. PubMed
5. Hockenberry J, Mutter R, Barrett M, Parlato J, Ross M. Factors associated with prolonged observation services stays and the impact of long stays on patient cost. Health Serv Res. 2014;49(3):893-909. 10.1111/1475-6773.12143. PubMed
6. Goldstein J, Zhang Z, Schwartz S, Hicks L. Observation status, poverty, and high financial liability among Medicare beneficiaries. Am J Med. 2017;131(1):e9-101.e15. doi: 10.1016/j.amjmed.2017.07.013. PubMed
7. Feng Z, Wright B, Mor V. Sharp rise in Medicare enrollees being held in hospitals for observation raises concerns about causes and consequences. Health Aff. 2012;31(6):1251-1259. doi: 10.1377/hlthaff.2012.0129. PubMed
8. Feng Z, Jung H-Y, Wright B, Mor V. The origin and disposition of Medicare observation stays. Med Care. 2014;52(9):796-800. doi: 10.1097/MLR.0000000000000179 PubMed
9. Wright B, Jung H-Y, Feng Z, Mor V. Hospital, patient, and local health system characteristics associated with the prevalence and duration of observation care. HSR. 2014;49(4):1088-1107. doi: 10.1111/1475-6773.12166. PubMed
10. Overman R, Freburger J, Assimon M, Li X, Brookhart MA. Observation stays in administrative claims databases: underestimation of hospitalized cases. Pharmacoepidemiol Drug Saf. 2014;23(9):902-910. doi: 10.1002/pds.3647. PubMed
11. Vashi A, Cafardi S, Powers C, Ross J, Shrank W. Observation encounters and subsequent nursing facility stays. Am J Manag Care. 2015;21(4):e276-e281. PubMed
12. Venkatesh A, Wang C, Ross J, et al. Hospital use of observation stays: cross-sectional study of the impact on readmission rates. Med Care. 2016;54(12):1070-1077. doi: 10.1097/MLR.0000000000000601 PubMed
13. Gerhardt G, Yemane A, Apostle K, Oelschlaeger A, Rollins E, Brennan N. Evaluating whether changes in utilization of hospital outpatient services contributed to lower Medicare readmission rate. MMRR. 2014;4(1):E1-E13. doi: 10.5600/mmrr2014-004-01-b03 PubMed
14. Lipitz-Snyderman A, Klotz A, Gennarelli R, Groeger J. A population-based assessment of emergency department observation status for older adults with cancer. J Natl Compr Canc Netw. 2017;15(10):1234-1239. doi: 10.6004/jnccn.2017.0160. PubMed
15. Kangovi S, Cafardi S, Smith R, Kulkarni R, Grande D. Patient financial responsibility for observation care. J Hosp Med. 2015;10:718-723. doi: 10.1002/jhm.2436. PubMed
16. Dharmarajan K, Qin L, Bierlein M, et al. Outcomes after observation stays among older adult Medicare beneficiaries in the USA: retrospective cohort study. BMJ. 2017;357:j2616. doi: 10.1136/bmj.j2616 PubMed
17. Baier R, Gardner R, Coleman E, Jencks S, Mor V, Gravenstein S. Shifting the dialogue from hospital readmissions to unplanned care. Am J Manag Care. 2013;19(6):450-453. PubMed
18. Cafardi S, Pines J, Deb P, Powers C, Shrank W. Increased observation services in Medicare beneficiaries with chest pain. Am J Emergency Med. 2016;34(1):16-19. doi: 10.1016/j.ajem.2015.08.049. PubMed
19. Nuckols T, Fingar K, Barrett M, Steiner C, Stocks C, Owens P. The shifting landscape in utilization of inpatient, observation, and emergency department services across payors. J Hosp Med. 2017;12(6):443-446. doi: 10.12788/jhm.2751. PubMed
20. Wright B, Jung H-Y, Feng Z, Mor V. Trends in observation care among Medicare fee-for-service beneficiaries at critical access hospitals, 2007-2009. J Rural Health. 2013;29(1):s1-s6. doi: 10.1111/jrh.12007 PubMed
21. Office of Inspector General. Vulnerabilites remain under Medicare’s 2-Midnight hospital policy. 12-9-2016. https://oig.hhs.gov/oei/reports/oei-02-15-00020.asp. Accessed December 27, 2017. PubMed
22. Research Data Assistance Center (ResDAC). Revenue center table. https://www.resdac.org/sites/resdac.umn.edu/files/Revenue%20Center%20Table.txt. Accessed December 26, 2017.
23. Medicare Claims Processing Manual, Chapter 4, Section 290, Outpatient Observation Services. https://www.cms.gov/Regulations-and-Guidance/Guidance/Manuals/downloads/clm104c04.pdf. Accessed December 26, 2017.
24. Research Data Assistance Center (ResDAC). Identifying observation stays for those beneficiaries admitted to the hospital. https://www.resdac.org/resconnect/articles/172. Accessed December 27, 2017.
25. Medicare Claims Processing Manual, Chapter 3, Section 40.B. Outpatient services treated as inpatient services. https://www.cms.gov/Regulations-and-Guidance/Guidance/Manuals/Downloads/clm104c03.pdf. Accessed December 26, 2017.
26. Reynolds J. Another look at roles and functions: has hospital case management lost its way? Prof Case Manag. 2013;18(5):246-254. doi: 10.1097/NCM.0b013e31829c8aa8. PubMed
27. Sheehy A, Locke C, Engel J, et al. Recovery audit contractor audit and appeals at three academic medical centers. J Hosp Med. 2015;10(4):212-219. doi: 10.1002/jhm.2332. PubMed
© 2019 Society of Hospital Medicine
SPRINT MIND with extension planned
Also today, medical ethics and economics, PTSD after traumatic brain injury may be predicted by race and ethnicity, and aspirin for primary cardiovascular prevention.
Amazon Alexa
Apple Podcasts
Google Podcasts
Spotify
Also today, medical ethics and economics, PTSD after traumatic brain injury may be predicted by race and ethnicity, and aspirin for primary cardiovascular prevention.
Amazon Alexa
Apple Podcasts
Google Podcasts
Spotify
Also today, medical ethics and economics, PTSD after traumatic brain injury may be predicted by race and ethnicity, and aspirin for primary cardiovascular prevention.
Amazon Alexa
Apple Podcasts
Google Podcasts
Spotify