User login
Moving On
After seven years at the helm of the Journal of Hospital Medicine, I am both pleased to hand over the reins and sad to let them go. My time as Editor in Chief has been wonderful, challenging, and fulfilling.
When I began my tenure, JHM managed approximately 350 papers annually, and published 10 times per year. We had no social media presence, a developing editorial sense (and developing Editor in Chief), and a pool of hard-working and passionate Editors. As of this year, we have handled more than 700 papers and are publishing content monthly, online only, and online first. Our dedicated team is deeply passionate about making every paper better through interaction with the authors—whether we accept it for publication or not.
JHM has added a presence on Facebook and Twitter, launched a Twitter Journal Club as a regular offering (#JHMChat), added visual abstracts to our Tweets and Facebook postings, and researched how these novel approaches increase not only the Journal’s social media presence but also its public face. Our efforts in social media were trendsetting in peer-reviewed literature, and the Editors who lead those efforts—Vineet Arora and Charlie Wray—are asked to consult for other journals regularly.
We launched two new series— Choosing Wisely®: Next Steps, and Choosing Wisely®: Things We Do For No Reason—with help from the ABIM Foundation and visionary Editors, Andy Masica, Ann Sheehy, and Lenny Feldman. These papers have pushed Hospitalists and Hospital Medicine to think carefully about the simple things we do every day, to think broadly about how to move past the initial ‘low-hanging fruit’ of value improvement, and point us towards policy and intervention approaches that are disruptive rather than incremental.
A special thank you to Som Mookherjee, Brian Harte, Dan Hunt, and Read Pierce who ably developed the Clinical Care Conundrums and Review series. They are assisted by teams of national correspondents and many contributors who’ve submitted work for those series.
I have been blessed by a team of more than a dozen Associate Editors who have ably, expeditiously, and collegially managed more than 2,000 papers. These Editors work out of a sense of altruism and commitment to Hospital Medicine and have made huge individual contributions to JHM through their reviewing expertise and ensuring that the editorial sense for JHM is as broad and innovative as our field.
Finally, I must thank my core team of Senior Deputy Editors who have shouldered the majority of editorial work, mentored Editors (including me) and Peer Reviewers, and provided strategic guidance.
How peer-reviewed journals are published is changing rapidly. Setting aside the questions of how we consume our medical literature and the transition from paper to digital, old financial models depending on subscriptions and advertising are either dying or evolving into something very different. The challenge is that the new model is very unclear and the old model based on ads and subscriptions is clearly nonviable but is the primary way to support the work of producing a journal. Moving from the current model to one based on clicks, views, or downloads will come down to who will derive benefit from those clicks/downloads, who will be willing to pay to read and learn from the work of authors, or who views that activity as being worthy enough advertise somewhere in that process or to monetize the data garnered from readers’ activities. In addition, many journals, including JHM, are supported by professional societies. While professional societies have a goal to serve their members, the goal of the peer-reviewed journal is to independently and broadly represent the field. One must reflect the other, but space between the two will always be required.
The speed with which research takes place is too slow, and the process of getting evidence into print (much less adopted) is even slower. But, this too is changing; the role of peer review and the publication process is evolving. In order to speed the potential discovery of new innovations, prepublication repositories (such as BioRxViv) are gaining popularity; well-publicized scandals around peer reviewing rings 1 have not gone unnoticed, and have produced greater interest in using prepublication comments and online discussions as early forms of review. As a result, the disintermediation between scientist and ‘evidence’ is paralleling the disintermediation between events and messengers elsewhere. One need only review Twitter for a moment to get a sense for how crowdsourcing can lead to evidence (or news) generation for good or ill. I agree that while the end of journals (as we understand them now) is upon us, these are also opportunities for JHM as it enters its new phase and a place for leadership. 2
I am proud of what we have done at JHM in the last seven years. We have grown substantially. We have innovated and provided great service to our authors and the field of Hospital Medicine. Our growth and forward-looking approaches to social media and our digital footprint put the journal on a great path towards adapting to the trends in Hospital Medicine research and peer-reviewed publishing. Our focus on being doctors who care for patients and our teams—not just doctors who care for hospitals—is supporting the field and our practice. I look forward to seeing where JHM goes next.
1. Retraction Watch. BioMedCentral retracting 43 papers for fake peer reviews. March 26, 2015; http://retractionwatch.com/2015/03/26/biomed-central-retracting-43-papers-for-fake-peer-review/. Accessed November 12, 2018.
2. Krumholz HM. The End of Journals. Circ Cardiovasc Qual Outcomes. 2015;8(6):533-534. doi: 10.1161/CIRCOUTCOMES.115.002415. PubMed
After seven years at the helm of the Journal of Hospital Medicine, I am both pleased to hand over the reins and sad to let them go. My time as Editor in Chief has been wonderful, challenging, and fulfilling.
When I began my tenure, JHM managed approximately 350 papers annually, and published 10 times per year. We had no social media presence, a developing editorial sense (and developing Editor in Chief), and a pool of hard-working and passionate Editors. As of this year, we have handled more than 700 papers and are publishing content monthly, online only, and online first. Our dedicated team is deeply passionate about making every paper better through interaction with the authors—whether we accept it for publication or not.
JHM has added a presence on Facebook and Twitter, launched a Twitter Journal Club as a regular offering (#JHMChat), added visual abstracts to our Tweets and Facebook postings, and researched how these novel approaches increase not only the Journal’s social media presence but also its public face. Our efforts in social media were trendsetting in peer-reviewed literature, and the Editors who lead those efforts—Vineet Arora and Charlie Wray—are asked to consult for other journals regularly.
We launched two new series— Choosing Wisely®: Next Steps, and Choosing Wisely®: Things We Do For No Reason—with help from the ABIM Foundation and visionary Editors, Andy Masica, Ann Sheehy, and Lenny Feldman. These papers have pushed Hospitalists and Hospital Medicine to think carefully about the simple things we do every day, to think broadly about how to move past the initial ‘low-hanging fruit’ of value improvement, and point us towards policy and intervention approaches that are disruptive rather than incremental.
A special thank you to Som Mookherjee, Brian Harte, Dan Hunt, and Read Pierce who ably developed the Clinical Care Conundrums and Review series. They are assisted by teams of national correspondents and many contributors who’ve submitted work for those series.
I have been blessed by a team of more than a dozen Associate Editors who have ably, expeditiously, and collegially managed more than 2,000 papers. These Editors work out of a sense of altruism and commitment to Hospital Medicine and have made huge individual contributions to JHM through their reviewing expertise and ensuring that the editorial sense for JHM is as broad and innovative as our field.
Finally, I must thank my core team of Senior Deputy Editors who have shouldered the majority of editorial work, mentored Editors (including me) and Peer Reviewers, and provided strategic guidance.
How peer-reviewed journals are published is changing rapidly. Setting aside the questions of how we consume our medical literature and the transition from paper to digital, old financial models depending on subscriptions and advertising are either dying or evolving into something very different. The challenge is that the new model is very unclear and the old model based on ads and subscriptions is clearly nonviable but is the primary way to support the work of producing a journal. Moving from the current model to one based on clicks, views, or downloads will come down to who will derive benefit from those clicks/downloads, who will be willing to pay to read and learn from the work of authors, or who views that activity as being worthy enough advertise somewhere in that process or to monetize the data garnered from readers’ activities. In addition, many journals, including JHM, are supported by professional societies. While professional societies have a goal to serve their members, the goal of the peer-reviewed journal is to independently and broadly represent the field. One must reflect the other, but space between the two will always be required.
The speed with which research takes place is too slow, and the process of getting evidence into print (much less adopted) is even slower. But, this too is changing; the role of peer review and the publication process is evolving. In order to speed the potential discovery of new innovations, prepublication repositories (such as BioRxViv) are gaining popularity; well-publicized scandals around peer reviewing rings 1 have not gone unnoticed, and have produced greater interest in using prepublication comments and online discussions as early forms of review. As a result, the disintermediation between scientist and ‘evidence’ is paralleling the disintermediation between events and messengers elsewhere. One need only review Twitter for a moment to get a sense for how crowdsourcing can lead to evidence (or news) generation for good or ill. I agree that while the end of journals (as we understand them now) is upon us, these are also opportunities for JHM as it enters its new phase and a place for leadership. 2
I am proud of what we have done at JHM in the last seven years. We have grown substantially. We have innovated and provided great service to our authors and the field of Hospital Medicine. Our growth and forward-looking approaches to social media and our digital footprint put the journal on a great path towards adapting to the trends in Hospital Medicine research and peer-reviewed publishing. Our focus on being doctors who care for patients and our teams—not just doctors who care for hospitals—is supporting the field and our practice. I look forward to seeing where JHM goes next.
1. Retraction Watch. BioMedCentral retracting 43 papers for fake peer reviews. March 26, 2015; http://retractionwatch.com/2015/03/26/biomed-central-retracting-43-papers-for-fake-peer-review/. Accessed November 12, 2018.
2. Krumholz HM. The End of Journals. Circ Cardiovasc Qual Outcomes. 2015;8(6):533-534. doi: 10.1161/CIRCOUTCOMES.115.002415. PubMed
© 2018 Society of Hospital Medicine
Barriers to Early Hospital Discharge: A Cross-Sectional Study at Five Academic Hospitals
Hospital discharges frequently occur in the afternoon or evening hours.1-5 Late discharges can adversely affect patient flow throughout the hospital,3,6-9 which, in turn, can result in delays in care,10-16 more medication errors,17 increased mortality,18-20 longer lengths of stay,20-22 higher costs,23 and lower patient satisfaction.24
Various interventions have been employed in the attempts to find ways of moving discharge times to earlier in the day, including preparing the discharge paperwork and medications the previous night,25 using checklists,1,25 team huddles,2 providing real-time feedback to unit staff,1 and employing multidisciplinary teamwork.1,2,6,25,26
The purpose of this study was to identify and determine the relative frequency of barriers to writing discharge orders in the hopes of identifying issues that might be addressed by targeted interventions. We also assessed the effects of daily team census, patients being on teaching versus nonteaching services, and how daily rounds were structured at the time that the discharge orders were written.
METHODS
Study Design, Setting, and Participants
We conducted a prospective, cross-sectional survey of house-staff and attending physicians on general medicine teaching and nonteaching services from November 13, 2014, through May 31, 2016. The study was conducted at the following five hospitals: Denver Health Medical Center (DHMC) and Presbyterian/Saint Luke’s Medical Center (PSL) in Denver, Colorado; Ronald Reagan University (UCLA) and Los Angeles County/University of Southern California Medical Center (LAC+USC) in Los Angeles, California; and Harborview Medical Center (HMC) in Seattle, Washington. The study was approved by the Colorado Multi-Institutional Review Board as well as by the review boards of the other participating sites.
Data Collection
The results of the focus groups composed of attending physicians at DHMC were used to develop our initial data collection template. Additional sites joining the study provided feedback, leading to modifications (Appendix 1).
Physicians were surveyed at three different time points on study days that were selected according to the convenience of the investigators. The sampling occurred only on weekdays and was done based on the investigators’ availability. Investigators would attempt to survey as many teams as they were able to but, secondary to feasibility, not all teams could be surveyed on study days. The specific time points varied as a function of physician workflows but were standardized as much as possible to occur in the early morning, around noon, and midafternoon on weekdays. Physicians were contacted either in person or by telephone for verbal consent prior to administering the first survey. All general medicine teams were eligible. For teaching teams, the order of contact was resident, intern, and then attending based on which physician was available at the time of the survey and on which member of the team was thought to know the patients the best. For the nonteaching services, the attending physicians were contacted.
During the initial survey, the investigators assessed the provider role (ie, attending or housestaff), whether the service was a teaching or a nonteaching service, and the starting patient census on that service primarily based on interviewing the provider of record for the team and looking at team census lists. Physicians were asked about their rounding style (ie, sickest patients first, patients likely to be discharged first, room-by-room, most recently admitted patients first, patients on the team the longest, or other) and then to identify all patients they thought would be definite discharges sometime during the day of the survey. Definite discharges were defined as patients whom the provider thought were either currently ready for discharge or who had only minor barriers that, if unresolved, would not prevent same-day discharge. They were asked if the discharge order had been entered and, if not, what was preventing them from doing so, if the discharge could in their opinion have occurred the day prior and, if so, why this did not occur. We also obtained the date and time of the admission and discharge orders, the actual discharge time, as well as the length of stay either through chart review (majority of sites) or from data warehouses (Denver Health and Presbyterian St. Lukes had length of stay data retrieved from their data warehouse).
Physicians were also asked to identify all patients whom they thought might possibly be discharged that day. Possible discharges were defined as patients with barriers to discharge that, if unresolved, would prevent same-day discharge. For each of these, the physicians were asked to list whatever issues needed to be resolved prior to placing the discharge order (Appendix 1).
The second survey was administered late morning on the same day, typically between 11
The third survey was administered midafternoon, typically around 3 PM similar to the first two surveys, with the exception that the third survey did not attempt to identify new definite or possible discharges.
Sample Size
We stopped collecting data after obtaining a convenience sample of 5% of total discharges at each study site or on the study end date, which was May 31, 2016, whichever came first.
Data Analysis
Data were collected and managed using a secure, web-based application electronic data capture tool (REDCap), hosted at Denver Health. REDCap (Research Electronic Data Capture, Nashville, Tennessee) is designed to support data collection for research studies.27 Data were then analyzed using SAS Enterprise Guide 5.1 (SAS Institute, Inc., Cary, North Carolina). All data entered into REDCap were reviewed by the principal investigator to ensure that data were not missing, and when there were missing data, a query was sent to verify if the data were retrievable. If retrievable, then the data would be entered. The volume of missing data that remained is described in our results.
Continuous variables were described using means and standard deviations (SD) or medians and interquartile ranges (IQR) based on tests of normality. Differences in the time that the discharge orders were placed in the electronic medical record according to morning patient census, teaching versus nonteaching service, and rounding style were compared using the Wilcoxon rank sum test. Linear regression was used to evaluate the effect of patient census on discharge order time. P < .05 was considered as significant.
RESULTS
We conducted 1,584 patient evaluations through surveys of 254 physicians over 156 days. Given surveys coincided with the existing work we had full participation (ie, 100% participation) and no dropout during the study days. Median (IQR) survey time points were 8:30
The characteristics of the five hospitals participating in the study, the patients’ final discharge status, the types of physicians surveyed, the services on which they were working, the rounding styles employed, and the median starting daily census are summarized in Table 1. The majority of the physicians surveyed were housestaff working on teaching services, and only a small minority structured rounds such that patients ready for discharge were seen first.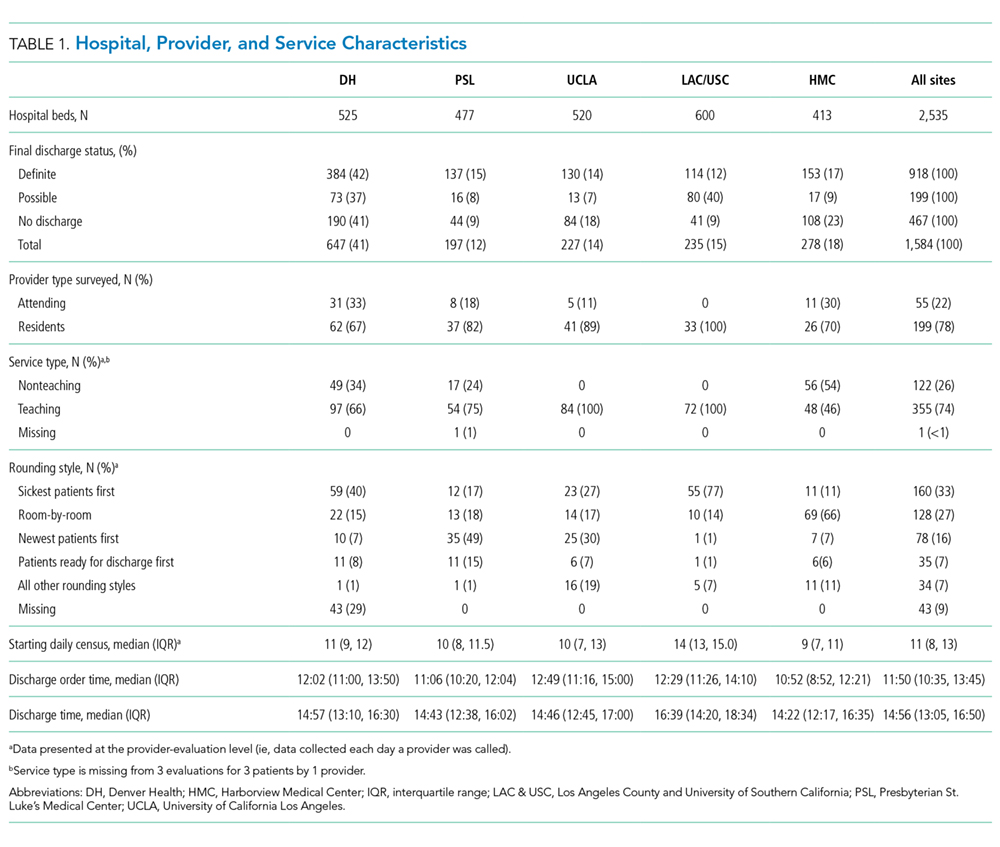
Over the course of the three surveys, 949 patients were identified as being definite discharges at any time point, and the large majority of these (863, 91%) were discharged on the day of the survey. The median (IQR) time that the discharge orders were written was 11:50
During the initial morning survey, 314 patients were identified as being definite discharges for that day (representing approximately 6% of the total number of patients being cared for, or 33% of the patients identified as definite discharges throughout the day). Of these, the physicians thought that 44 (<1% of the total number of patients being cared for on the services) could have been discharged on the previous day. The most frequent reasons cited for why these patients were not discharged on the previous day were “Patient did not want to leave” (n = 15, 34%), “Too late in the day” (n = 10, 23%), and “No ride” (n = 9, 20%). The remaining 10 patients (23%) had a variety of reasons related to system or social issues (ie, shelter not available, miscommunication).
At the morning time point, the most common barriers to discharge identified were that the physicians had not finished rounding on their team of patients and that the housestaff needed to staff their patients with their attending. At noon, caring for other patients and tending to the discharge processes were most commonly cited, and in the afternoon, the most common barriers were that the physicians were in the process of completing the discharge paperwork for those patients or were discharging other patients (Table 2). When comparing barriers on teaching to nonteaching teams, a higher proportion of teaching teams were still rounding on all patients and were working on discharge paperwork at the second survey. Barriers cited by sites were similar; however, the frequency at which the barriers were mentioned varied (data not shown).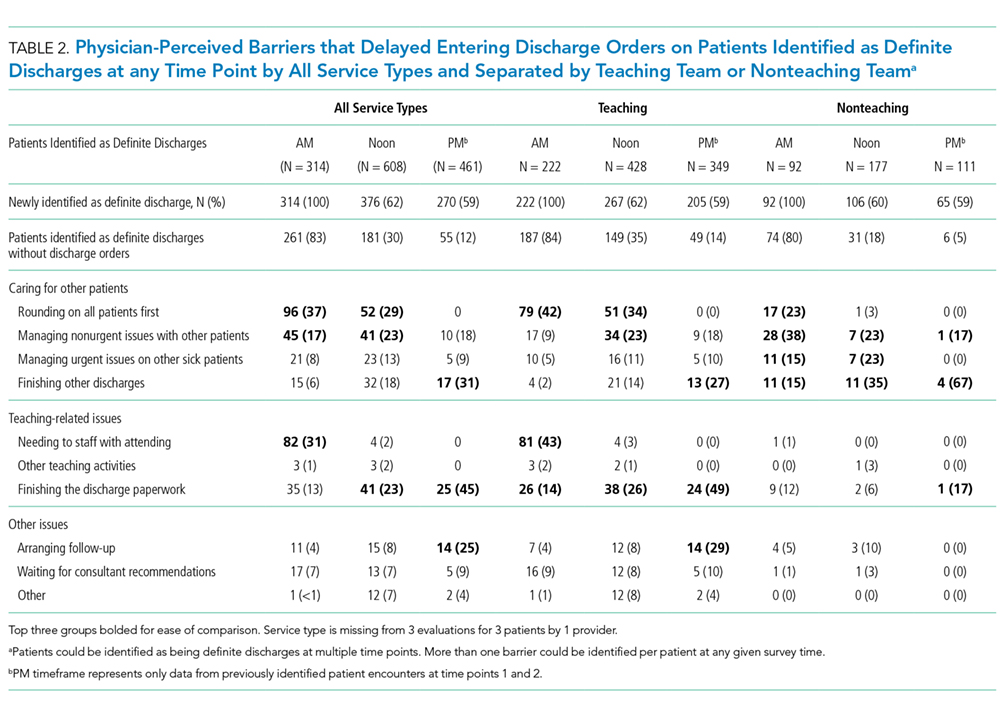
The physicians identified 1,237 patients at any time point as being possible discharges during the day of the survey and these had a mean (±SD) of 1.3 (±0.5) barriers cited for why these patients were possible rather than definite discharges. The most common were that clinical improvement was needed, one or more pending issues related to their care needed to be resolved, and/or awaiting pending test results. The need to see clinical improvement generally decreased throughout the day as did the need to staff patients with an attending physician, but barriers related to consultant recommendations or completing procedures increased (Table 3). Of the 1,237 patients ever identified as possible discharges, 594 (48%) became a definite discharge by the third call and 444 (36%) became a no discharge as their final status. As with definite discharges, barriers cited by sites were similar; however, the frequency at which the barriers were mentioned varied.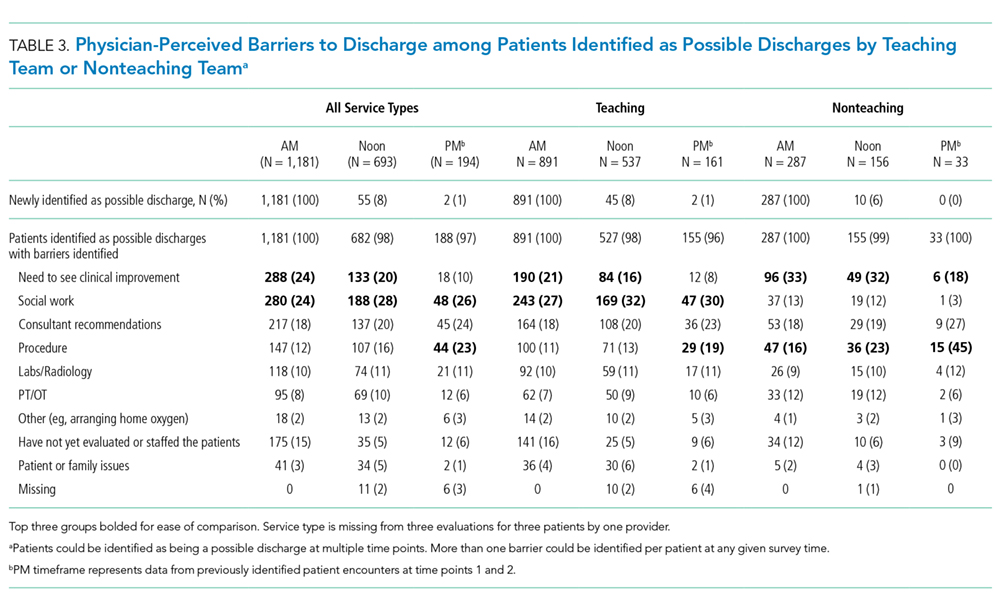
Among the 949 and 1,237 patients who were ever identified as definite or possible discharges, respectively, at any time point during the study day, 28 (3%) and 444 (36%), respectively, had their discharge status changed to no discharge, most commonly because their clinical condition either worsened or expected improvements did not occur or that barriers pertaining to social work, physical therapy, or occupational therapy were not resolved.
The median time that the discharge orders were entered into the electronic medical record was 43 minutes earlier if patients were on teams with a lower versus a higher starting census (P = .0003), 48 minutes earlier if they were seen by physicians whose rounding style was to see patients first who potentially could be discharged (P = .0026), and 58 minutes earlier if they were on nonteaching versus teaching services (P < .0001; Table 4). For every one-person increase in census, the discharge order time increased by 6 minutes (β = 5.6, SE = 1.6, P = .0003).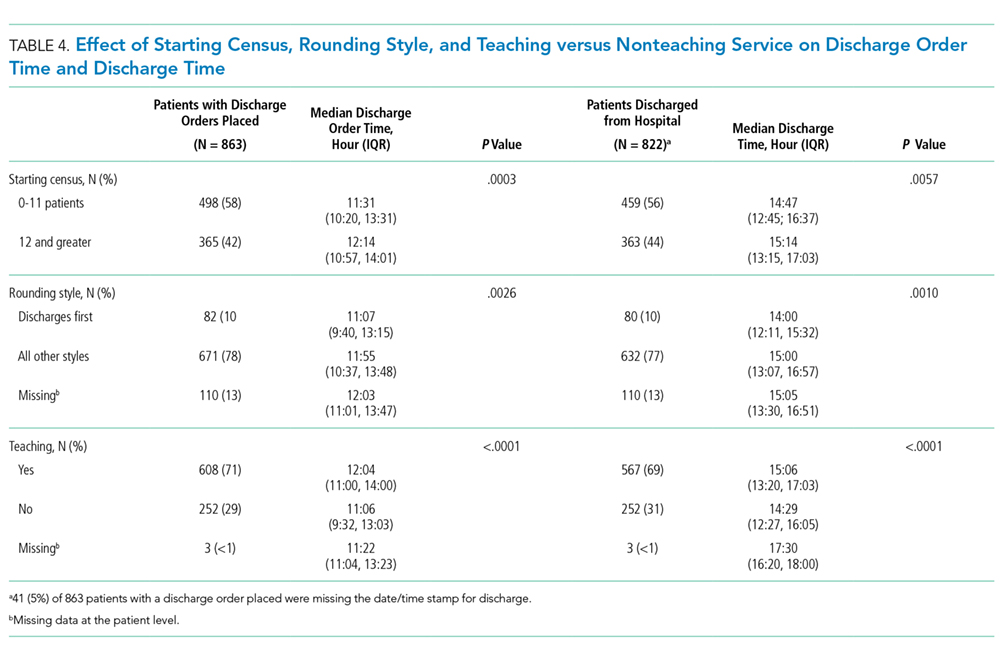
DISCUSSION
The important findings of this study are that (1) the large majority of issues thought to delay discharging patients identified as definite discharges were related to physicians caring for other patients on their team, (2) although 91% of patients ever identified as being definite discharges were discharged on the day of the survey, only 48% of those identified as possible discharges became definite discharges by the afternoon time point, largely because the anticipated clinical improvement did not occur or care being provided by ancillary services had not been completed, and (3) discharge orders on patients identified as definite discharges were written on average 50 minutes earlier by physicians on teams with a smaller starting patient census, on nonteaching services, or when the rounding style was to see patients ready for discharges first.
Previous research has reported that physician-perceived barriers to discharge were extrinsic to providers and even extrinsic to the hospital setting (eg, awaiting subacute nursing placement and transportation).28,29 However, many of the barriers that we identified were related directly to the providers’ workload and rounding styles and whether the patients were on teaching versus nonteaching services. We also found that delays in the ability of hospital services to complete care also contributed to delayed discharges.
Our observational data suggest that delays resulting from caring for other patients might be reduced by changing rounding styles such that patients ready for discharge are seen first and are discharged prior to seeing other patients on the team, as previously reported by Beck et al.30 Intuitively, this would seem to be a straightforward way of freeing up beds earlier in the day, but such a change will, of necessity, lead to delaying care for other patients, which, in turn, could increase their length of stays. Durvasula et al. suggested that discharges could be moved to earlier in the day by completing orders and paperwork the day prior to discharge.25 Such an approach might be effective on an Obstetrical or elective Orthopedic service on which patients predictably are hospitalized for a fixed number of days (or even hours) but may be less relevant to patients on internal medicine services where lengths of stay are less predictable. Interventions to improve discharge times have resulted in earlier discharge times in some studies,2,4 but the overall length of stay either did not decrease25 or increased31 in others. Werthheimer et al.1 did find earlier discharge times, but other interventions also occurred during the study period (eg, extending social work services to include weekends).1,32
We found that discharge times were approximately 50 minutes earlier on teams with a smaller starting census, on nonteaching compared with teaching services, or when the attending’s rounding style was to see patients ready for discharges first. Although 50 minutes may seem like a small change in discharge time, Khanna et al.33 found that when discharges occur even 1 hour earlier, hospital overcrowding is reduced. To have a lower team census would require having more teams and more providers to staff these teams, raising cost-effectiveness concerns. Moving to more nonteaching services could represent a conflict with respect to one of the missions of teaching hospitals and raises a cost-benefit issue as several teaching hospitals receive substantial funding in support of their teaching activities and housestaff would have to be replaced with more expensive providers.
Delays attributable to ancillary services indicate imbalances between demand and availability of these services. Inappropriate demand and inefficiencies could be reduced by systems redesign, but in at least some instances, additional resources will be needed to add staff, increase space, or add additional equipment.
Our study has several limitations. First, we surveyed only physicians working in university-affiliated hospitals, and three of these were public safety-net hospitals. Accordingly, our results may not be generalizable to different patient populations. Second, we surveyed only physicians, and Minichiello et al.29 found that barriers to discharge perceived by physicians were different from those of other staff. Third, our data were observational and were collected only on weekdays. Fourth, we did not differentiate interns from residents, and thus, potentially the level of training could have affected these results. Similarly, the decision for a “possible” and a “definite” discharge is likely dependent on the knowledge base of the participant, such that less experienced participants may have had differing perspectives than someone with more experience. Fifth, the sites did vary based on the infrastructure and support but also had several similarities. All sites had social work and case management involved in care, although at some sites, they were assigned according to team and at others according to geographic location. Similarly, rounding times varied. Most of the services surveyed did not utilize advanced practice providers (the exception was the nonteaching services at Denver Health, and their presence was variable). These differences in staffing models could also have affected these results.
Our study also has a number of strengths. First, we assessed the barriers at five different hospitals. Second, we collected real-time data related to specific barriers at multiple time points throughout the day, allowing us to assess the dynamic nature of identifying patients as being ready or nearly ready for discharge. Third, we assessed the perceptions of barriers to discharge from physicians working on teaching as well as nonteaching services and from physicians utilizing a variety of rounding styles. Fourth, we had a very high participation rate (100%), probably due to the fact that our study was strategically aligned with participants’ daily work activities.
In conclusion, we found two distinct categories of issues that physicians perceived as most commonly delaying writing discharge orders on their patients. The first pertained to patients thought to definitely be ready for discharge and was related to the physicians having to care for other patients on their team. The second pertained to patients identified as possibly ready for discharge and was related to the need for care to be completed by a variety of ancillary services. Addressing each of these barriers would require different interventions and a need to weigh the potential improvements that could be achieved against the increased costs and/or delays in care for other patients that may result.
Disclosures
The authors report no conflicts of interest relevant to this work.
1. Wertheimer B, Jacobs RE, Bailey M, et al. Discharge before noon: an achievable hospital goal. J Hosp Med. 2014;9(4):210-214. doi: 10.1002/jhm.2154. PubMed
2. Kane M, Weinacker A, Arthofer R, et al. A multidisciplinary initiative to increase inpatient discharges before noon. J Nurs Adm. 2016;46(12):630-635. doi: 10.1097/NNA.0000000000000418. PubMed
3. Khanna S, Sier D, Boyle J, Zeitz K. Discharge timeliness and its impact on hospital crowding and emergency department flow performance. Emerg Med Australas. 2016;28(2):164-170. doi: 10.1111/1742-6723.12543. PubMed
4. Kravet SJ, Levine RB, Rubin HR, Wright SM. Discharging patients earlier in the day: a concept worth evaluating. Health Care Manag (Frederick). 2007;26:142-146. doi: 10.1097/01.HCM.0000268617.33491.60. PubMed
5. Khanna S, Boyle J, Good N, Lind J. Impact of admission and discharge peak times on hospital overcrowding. Stud Health Technol Inform. 2011;168:82-88. doi: 10.3233/978-1-60750-791-8-82. PubMed
6. McGowan JE, Truwit JD, Cipriano P, et al. Operating room efficiency and hospital capacity: factors affecting operating room use during maximum hospital census. J Am Coll Surg. 2007;204(5):865-871; discussion 71-72. doi: 10.1016/j.jamcollsurg.2007.01.052 PubMed
7. Khanna S, Boyle J, Good N, Lind J. Early discharge and its effect on ED length of stay and access block. Stud Health Technol Inform. 2012;178:92-98. doi: 10.3233/978-1-61499-078-9-92 PubMed
8. Powell ES, Khare RK, Venkatesh AK, Van Roo BD, Adams JG, Reinhardt G. The relationship between inpatient discharge timing and emergency department boarding. J Emerg Med. 2012;42(2):186-196. doi: 10.1016/j.jemermed.2010.06.028. PubMed
9. Wertheimer B, Jacobs RE, Iturrate E, Bailey M, Hochman K. Discharge before noon: Effect on throughput and sustainability. J Hosp Med. 2015;10(10):664-669. doi: 10.1002/jhm.2412. PubMed
10. Sikka R, Mehta S, Kaucky C, Kulstad EB. ED crowding is associated with an increased time to pneumonia treatment. Am J Emerg Med. 2010;28(7):809-812. doi: 10.1016/j.ajem.2009.06.023. PubMed
11. Coil CJ, Flood JD, Belyeu BM, Young P, Kaji AH, Lewis RJ. The effect of emergency department boarding on order completion. Ann Emerg Med. 2016;67:730-736 e2. doi: 10.1016/j.annemergmed.2015.09.018. PubMed
12. Gaieski DF, Agarwal AK, Mikkelsen ME, et al. The impact of ED crowding on early interventions and mortality in patients with severe sepsis. Am J Emerg Med. 2017;35:953-960. doi: 10.1016/j.ajem.2017.01.061. PubMed
13. Pines JM, Localio AR, Hollander JE, et al. The impact of emergency department crowding measures on time to antibiotics for patients with community-acquired pneumonia. Ann Emerg Med. 2007;50(5):510-516. doi: 10.1016/j.annemergmed.2007.07.021. PubMed
14. Hwang U, Richardson L, Livote E, Harris B, Spencer N, Sean Morrison R. Emergency department crowding and decreased quality of pain care. Acad Emerg Med. 2008;15:1248-1255. doi: 10.1111/j.1553-2712.2008.00267.x. PubMed
15. Mills AM, Shofer FS, Chen EH, Hollander JE, Pines JM. The association between emergency department crowding and analgesia administration in acute abdominal pain patients. Acad Emerg Med. 2009;16:603-608. doi: 10.1111/j.1553-2712.2009.00441.x. PubMed
16. Pines JM, Shofer FS, Isserman JA, Abbuhl SB, Mills AM. The effect of emergency department crowding on analgesia in patients with back pain in two hospitals. Acad Emerg Med. 2010;17(3):276-283. doi: 10.1111/j.1553-2712.2009.00676.x. PubMed
17. Kulstad EB, Sikka R, Sweis RT, Kelley KM, Rzechula KH. ED overcrowding is associated with an increased frequency of medication errors. Am J Emerg Med. 2010;28:304-309. doi: 10.1016/j.ajem.2008.12.014. PubMed
18. Richardson DB. Increase in patient mortality at 10 days associated with emergency department overcrowding. Med J Aust. 2006;184(5):213-216. PubMed
19. Hoot NR, Aronsky D. Systematic review of emergency department crowding: causes, effects, and solutions. Ann Emerg Med. 2008;52(2):126-136. doi: 10.1016/j.annemergmed.2008.03.014. PubMed
20. Singer AJ, Thode HC, Jr., Viccellio P, Pines JM. The association between length of emergency department boarding and mortality. Acad Emerg Med. 2011;18(12):1324-1329. doi: 10.1111/j.1553-2712.2011.01236.x. PubMed
21. White BA, Biddinger PD, Chang Y, Grabowski B, Carignan S, Brown DF. Boarding inpatients in the emergency department increases discharged patient length of stay. J Emerg Med. 2013;44(1):230-235. doi: 10.1016/j.jemermed.2012.05.007. PubMed
22. Forster AJ, Stiell I, Wells G, Lee AJ, van Walraven C. The effect of hospital occupancy on emergency department length of stay and patient disposition. Acad Emerg Med. 2003;10(2):127-133. doi: 10.1197/aemj.10.2.127. PubMed
23. Foley M, Kifaieh N, Mallon WK. Financial impact of emergency department crowding. West J Emerg Med. 2011;12(2):192-197. PubMed
24. Pines JM, Iyer S, Disbot M, Hollander JE, Shofer FS, Datner EM. The effect of emergency department crowding on patient satisfaction for admitted patients. Acad Emerg Med. 2008;15(9):825-831. doi: 10.1111/j.1553-2712.2008.00200.x. PubMed
25. Durvasula R, Kayihan A, Del Bene S, et al. A multidisciplinary care pathway significantly increases the number of early morning discharges in a large academic medical center. Qual Manag Health Care. 2015;24:45-51. doi: 10.1097/QMH.0000000000000049. PubMed
26. Cho HJ, Desai N, Florendo A, et al. E-DIP: Early Discharge Project. A Model for Throughput and Early Discharge for 1-Day Admissions. BMJ Qual Improv Rep. 2016;5(1): pii: u210035.w4128. doi: 10.1136/bmjquality.u210035.w4128. PubMed
27. Harris PA, Taylor R, Thielke R, Payne J, Gonzalez N, Conde JG. Research electronic data capture (REDCap)--a metadata-driven methodology and workflow process for providing translational research informatics support. J Biomed Inform. 2009;42(2):377-381. doi: 10.1016/j.jbi.2008.08.010. PubMed
28. Patel H, Fang MC, Mourad M, et al. Hospitalist and internal medicine leaders’ perspectives of early discharge challenges at academic medical centers. J Hosp Med. 2018;13(6):388-391. doi: 10.12788/jhm.2885. PubMed
29. Minichiello TM, Auerbach AD, Wachter RM. Caregiver perceptions of the reasons for delayed hospital discharge. Eff Clin Pract. 2001;4(6):250-255. PubMed
30. Beck MJ, Okerblom D, Kumar A, Bandyopadhyay S, Scalzi LV. Lean intervention improves patient discharge times, improves emergency department throughput and reduces congestion. Hosp Pract (1995). 2016;44(5):252-259. doi: 10.1080/21548331.2016.1254559. PubMed
31. Rajkomar A, Valencia V, Novelero M, Mourad M, Auerbach A. The association between discharge before noon and length of stay in medical and surgical patients. J Hosp Med. 2016;11(12):859-861. doi: 10.1002/jhm.2529. PubMed
32. Shine D. Discharge before noon: an urban legend. Am J Med. 2015;128(5):445-446. doi: 10.1016/j.amjmed.2014.12.011. PubMed 33. Khanna S, Boyle J, Good N, Lind J. Unravelling relationships: Hospital occupancy levels, discharge timing and emergency department access block. Emerg Med Australas. 2012;24(5):510-517. doi: 10.1111/j.1742-6723.2012.01587.x. PubMed
Hospital discharges frequently occur in the afternoon or evening hours.1-5 Late discharges can adversely affect patient flow throughout the hospital,3,6-9 which, in turn, can result in delays in care,10-16 more medication errors,17 increased mortality,18-20 longer lengths of stay,20-22 higher costs,23 and lower patient satisfaction.24
Various interventions have been employed in the attempts to find ways of moving discharge times to earlier in the day, including preparing the discharge paperwork and medications the previous night,25 using checklists,1,25 team huddles,2 providing real-time feedback to unit staff,1 and employing multidisciplinary teamwork.1,2,6,25,26
The purpose of this study was to identify and determine the relative frequency of barriers to writing discharge orders in the hopes of identifying issues that might be addressed by targeted interventions. We also assessed the effects of daily team census, patients being on teaching versus nonteaching services, and how daily rounds were structured at the time that the discharge orders were written.
METHODS
Study Design, Setting, and Participants
We conducted a prospective, cross-sectional survey of house-staff and attending physicians on general medicine teaching and nonteaching services from November 13, 2014, through May 31, 2016. The study was conducted at the following five hospitals: Denver Health Medical Center (DHMC) and Presbyterian/Saint Luke’s Medical Center (PSL) in Denver, Colorado; Ronald Reagan University (UCLA) and Los Angeles County/University of Southern California Medical Center (LAC+USC) in Los Angeles, California; and Harborview Medical Center (HMC) in Seattle, Washington. The study was approved by the Colorado Multi-Institutional Review Board as well as by the review boards of the other participating sites.
Data Collection
The results of the focus groups composed of attending physicians at DHMC were used to develop our initial data collection template. Additional sites joining the study provided feedback, leading to modifications (Appendix 1).
Physicians were surveyed at three different time points on study days that were selected according to the convenience of the investigators. The sampling occurred only on weekdays and was done based on the investigators’ availability. Investigators would attempt to survey as many teams as they were able to but, secondary to feasibility, not all teams could be surveyed on study days. The specific time points varied as a function of physician workflows but were standardized as much as possible to occur in the early morning, around noon, and midafternoon on weekdays. Physicians were contacted either in person or by telephone for verbal consent prior to administering the first survey. All general medicine teams were eligible. For teaching teams, the order of contact was resident, intern, and then attending based on which physician was available at the time of the survey and on which member of the team was thought to know the patients the best. For the nonteaching services, the attending physicians were contacted.
During the initial survey, the investigators assessed the provider role (ie, attending or housestaff), whether the service was a teaching or a nonteaching service, and the starting patient census on that service primarily based on interviewing the provider of record for the team and looking at team census lists. Physicians were asked about their rounding style (ie, sickest patients first, patients likely to be discharged first, room-by-room, most recently admitted patients first, patients on the team the longest, or other) and then to identify all patients they thought would be definite discharges sometime during the day of the survey. Definite discharges were defined as patients whom the provider thought were either currently ready for discharge or who had only minor barriers that, if unresolved, would not prevent same-day discharge. They were asked if the discharge order had been entered and, if not, what was preventing them from doing so, if the discharge could in their opinion have occurred the day prior and, if so, why this did not occur. We also obtained the date and time of the admission and discharge orders, the actual discharge time, as well as the length of stay either through chart review (majority of sites) or from data warehouses (Denver Health and Presbyterian St. Lukes had length of stay data retrieved from their data warehouse).
Physicians were also asked to identify all patients whom they thought might possibly be discharged that day. Possible discharges were defined as patients with barriers to discharge that, if unresolved, would prevent same-day discharge. For each of these, the physicians were asked to list whatever issues needed to be resolved prior to placing the discharge order (Appendix 1).
The second survey was administered late morning on the same day, typically between 11
The third survey was administered midafternoon, typically around 3 PM similar to the first two surveys, with the exception that the third survey did not attempt to identify new definite or possible discharges.
Sample Size
We stopped collecting data after obtaining a convenience sample of 5% of total discharges at each study site or on the study end date, which was May 31, 2016, whichever came first.
Data Analysis
Data were collected and managed using a secure, web-based application electronic data capture tool (REDCap), hosted at Denver Health. REDCap (Research Electronic Data Capture, Nashville, Tennessee) is designed to support data collection for research studies.27 Data were then analyzed using SAS Enterprise Guide 5.1 (SAS Institute, Inc., Cary, North Carolina). All data entered into REDCap were reviewed by the principal investigator to ensure that data were not missing, and when there were missing data, a query was sent to verify if the data were retrievable. If retrievable, then the data would be entered. The volume of missing data that remained is described in our results.
Continuous variables were described using means and standard deviations (SD) or medians and interquartile ranges (IQR) based on tests of normality. Differences in the time that the discharge orders were placed in the electronic medical record according to morning patient census, teaching versus nonteaching service, and rounding style were compared using the Wilcoxon rank sum test. Linear regression was used to evaluate the effect of patient census on discharge order time. P < .05 was considered as significant.
RESULTS
We conducted 1,584 patient evaluations through surveys of 254 physicians over 156 days. Given surveys coincided with the existing work we had full participation (ie, 100% participation) and no dropout during the study days. Median (IQR) survey time points were 8:30
The characteristics of the five hospitals participating in the study, the patients’ final discharge status, the types of physicians surveyed, the services on which they were working, the rounding styles employed, and the median starting daily census are summarized in Table 1. The majority of the physicians surveyed were housestaff working on teaching services, and only a small minority structured rounds such that patients ready for discharge were seen first.
Over the course of the three surveys, 949 patients were identified as being definite discharges at any time point, and the large majority of these (863, 91%) were discharged on the day of the survey. The median (IQR) time that the discharge orders were written was 11:50
During the initial morning survey, 314 patients were identified as being definite discharges for that day (representing approximately 6% of the total number of patients being cared for, or 33% of the patients identified as definite discharges throughout the day). Of these, the physicians thought that 44 (<1% of the total number of patients being cared for on the services) could have been discharged on the previous day. The most frequent reasons cited for why these patients were not discharged on the previous day were “Patient did not want to leave” (n = 15, 34%), “Too late in the day” (n = 10, 23%), and “No ride” (n = 9, 20%). The remaining 10 patients (23%) had a variety of reasons related to system or social issues (ie, shelter not available, miscommunication).
At the morning time point, the most common barriers to discharge identified were that the physicians had not finished rounding on their team of patients and that the housestaff needed to staff their patients with their attending. At noon, caring for other patients and tending to the discharge processes were most commonly cited, and in the afternoon, the most common barriers were that the physicians were in the process of completing the discharge paperwork for those patients or were discharging other patients (Table 2). When comparing barriers on teaching to nonteaching teams, a higher proportion of teaching teams were still rounding on all patients and were working on discharge paperwork at the second survey. Barriers cited by sites were similar; however, the frequency at which the barriers were mentioned varied (data not shown).
The physicians identified 1,237 patients at any time point as being possible discharges during the day of the survey and these had a mean (±SD) of 1.3 (±0.5) barriers cited for why these patients were possible rather than definite discharges. The most common were that clinical improvement was needed, one or more pending issues related to their care needed to be resolved, and/or awaiting pending test results. The need to see clinical improvement generally decreased throughout the day as did the need to staff patients with an attending physician, but barriers related to consultant recommendations or completing procedures increased (Table 3). Of the 1,237 patients ever identified as possible discharges, 594 (48%) became a definite discharge by the third call and 444 (36%) became a no discharge as their final status. As with definite discharges, barriers cited by sites were similar; however, the frequency at which the barriers were mentioned varied.
Among the 949 and 1,237 patients who were ever identified as definite or possible discharges, respectively, at any time point during the study day, 28 (3%) and 444 (36%), respectively, had their discharge status changed to no discharge, most commonly because their clinical condition either worsened or expected improvements did not occur or that barriers pertaining to social work, physical therapy, or occupational therapy were not resolved.
The median time that the discharge orders were entered into the electronic medical record was 43 minutes earlier if patients were on teams with a lower versus a higher starting census (P = .0003), 48 minutes earlier if they were seen by physicians whose rounding style was to see patients first who potentially could be discharged (P = .0026), and 58 minutes earlier if they were on nonteaching versus teaching services (P < .0001; Table 4). For every one-person increase in census, the discharge order time increased by 6 minutes (β = 5.6, SE = 1.6, P = .0003).
DISCUSSION
The important findings of this study are that (1) the large majority of issues thought to delay discharging patients identified as definite discharges were related to physicians caring for other patients on their team, (2) although 91% of patients ever identified as being definite discharges were discharged on the day of the survey, only 48% of those identified as possible discharges became definite discharges by the afternoon time point, largely because the anticipated clinical improvement did not occur or care being provided by ancillary services had not been completed, and (3) discharge orders on patients identified as definite discharges were written on average 50 minutes earlier by physicians on teams with a smaller starting patient census, on nonteaching services, or when the rounding style was to see patients ready for discharges first.
Previous research has reported that physician-perceived barriers to discharge were extrinsic to providers and even extrinsic to the hospital setting (eg, awaiting subacute nursing placement and transportation).28,29 However, many of the barriers that we identified were related directly to the providers’ workload and rounding styles and whether the patients were on teaching versus nonteaching services. We also found that delays in the ability of hospital services to complete care also contributed to delayed discharges.
Our observational data suggest that delays resulting from caring for other patients might be reduced by changing rounding styles such that patients ready for discharge are seen first and are discharged prior to seeing other patients on the team, as previously reported by Beck et al.30 Intuitively, this would seem to be a straightforward way of freeing up beds earlier in the day, but such a change will, of necessity, lead to delaying care for other patients, which, in turn, could increase their length of stays. Durvasula et al. suggested that discharges could be moved to earlier in the day by completing orders and paperwork the day prior to discharge.25 Such an approach might be effective on an Obstetrical or elective Orthopedic service on which patients predictably are hospitalized for a fixed number of days (or even hours) but may be less relevant to patients on internal medicine services where lengths of stay are less predictable. Interventions to improve discharge times have resulted in earlier discharge times in some studies,2,4 but the overall length of stay either did not decrease25 or increased31 in others. Werthheimer et al.1 did find earlier discharge times, but other interventions also occurred during the study period (eg, extending social work services to include weekends).1,32
We found that discharge times were approximately 50 minutes earlier on teams with a smaller starting census, on nonteaching compared with teaching services, or when the attending’s rounding style was to see patients ready for discharges first. Although 50 minutes may seem like a small change in discharge time, Khanna et al.33 found that when discharges occur even 1 hour earlier, hospital overcrowding is reduced. To have a lower team census would require having more teams and more providers to staff these teams, raising cost-effectiveness concerns. Moving to more nonteaching services could represent a conflict with respect to one of the missions of teaching hospitals and raises a cost-benefit issue as several teaching hospitals receive substantial funding in support of their teaching activities and housestaff would have to be replaced with more expensive providers.
Delays attributable to ancillary services indicate imbalances between demand and availability of these services. Inappropriate demand and inefficiencies could be reduced by systems redesign, but in at least some instances, additional resources will be needed to add staff, increase space, or add additional equipment.
Our study has several limitations. First, we surveyed only physicians working in university-affiliated hospitals, and three of these were public safety-net hospitals. Accordingly, our results may not be generalizable to different patient populations. Second, we surveyed only physicians, and Minichiello et al.29 found that barriers to discharge perceived by physicians were different from those of other staff. Third, our data were observational and were collected only on weekdays. Fourth, we did not differentiate interns from residents, and thus, potentially the level of training could have affected these results. Similarly, the decision for a “possible” and a “definite” discharge is likely dependent on the knowledge base of the participant, such that less experienced participants may have had differing perspectives than someone with more experience. Fifth, the sites did vary based on the infrastructure and support but also had several similarities. All sites had social work and case management involved in care, although at some sites, they were assigned according to team and at others according to geographic location. Similarly, rounding times varied. Most of the services surveyed did not utilize advanced practice providers (the exception was the nonteaching services at Denver Health, and their presence was variable). These differences in staffing models could also have affected these results.
Our study also has a number of strengths. First, we assessed the barriers at five different hospitals. Second, we collected real-time data related to specific barriers at multiple time points throughout the day, allowing us to assess the dynamic nature of identifying patients as being ready or nearly ready for discharge. Third, we assessed the perceptions of barriers to discharge from physicians working on teaching as well as nonteaching services and from physicians utilizing a variety of rounding styles. Fourth, we had a very high participation rate (100%), probably due to the fact that our study was strategically aligned with participants’ daily work activities.
In conclusion, we found two distinct categories of issues that physicians perceived as most commonly delaying writing discharge orders on their patients. The first pertained to patients thought to definitely be ready for discharge and was related to the physicians having to care for other patients on their team. The second pertained to patients identified as possibly ready for discharge and was related to the need for care to be completed by a variety of ancillary services. Addressing each of these barriers would require different interventions and a need to weigh the potential improvements that could be achieved against the increased costs and/or delays in care for other patients that may result.
Disclosures
The authors report no conflicts of interest relevant to this work.
1. Wertheimer B, Jacobs RE, Bailey M, et al. Discharge before noon: an achievable hospital goal. J Hosp Med. 2014;9(4):210-214. doi: 10.1002/jhm.2154. PubMed
2. Kane M, Weinacker A, Arthofer R, et al. A multidisciplinary initiative to increase inpatient discharges before noon. J Nurs Adm. 2016;46(12):630-635. doi: 10.1097/NNA.0000000000000418. PubMed
3. Khanna S, Sier D, Boyle J, Zeitz K. Discharge timeliness and its impact on hospital crowding and emergency department flow performance. Emerg Med Australas. 2016;28(2):164-170. doi: 10.1111/1742-6723.12543. PubMed
4. Kravet SJ, Levine RB, Rubin HR, Wright SM. Discharging patients earlier in the day: a concept worth evaluating. Health Care Manag (Frederick). 2007;26:142-146. doi: 10.1097/01.HCM.0000268617.33491.60. PubMed
5. Khanna S, Boyle J, Good N, Lind J. Impact of admission and discharge peak times on hospital overcrowding. Stud Health Technol Inform. 2011;168:82-88. doi: 10.3233/978-1-60750-791-8-82. PubMed
6. McGowan JE, Truwit JD, Cipriano P, et al. Operating room efficiency and hospital capacity: factors affecting operating room use during maximum hospital census. J Am Coll Surg. 2007;204(5):865-871; discussion 71-72. doi: 10.1016/j.jamcollsurg.2007.01.052 PubMed
7. Khanna S, Boyle J, Good N, Lind J. Early discharge and its effect on ED length of stay and access block. Stud Health Technol Inform. 2012;178:92-98. doi: 10.3233/978-1-61499-078-9-92 PubMed
8. Powell ES, Khare RK, Venkatesh AK, Van Roo BD, Adams JG, Reinhardt G. The relationship between inpatient discharge timing and emergency department boarding. J Emerg Med. 2012;42(2):186-196. doi: 10.1016/j.jemermed.2010.06.028. PubMed
9. Wertheimer B, Jacobs RE, Iturrate E, Bailey M, Hochman K. Discharge before noon: Effect on throughput and sustainability. J Hosp Med. 2015;10(10):664-669. doi: 10.1002/jhm.2412. PubMed
10. Sikka R, Mehta S, Kaucky C, Kulstad EB. ED crowding is associated with an increased time to pneumonia treatment. Am J Emerg Med. 2010;28(7):809-812. doi: 10.1016/j.ajem.2009.06.023. PubMed
11. Coil CJ, Flood JD, Belyeu BM, Young P, Kaji AH, Lewis RJ. The effect of emergency department boarding on order completion. Ann Emerg Med. 2016;67:730-736 e2. doi: 10.1016/j.annemergmed.2015.09.018. PubMed
12. Gaieski DF, Agarwal AK, Mikkelsen ME, et al. The impact of ED crowding on early interventions and mortality in patients with severe sepsis. Am J Emerg Med. 2017;35:953-960. doi: 10.1016/j.ajem.2017.01.061. PubMed
13. Pines JM, Localio AR, Hollander JE, et al. The impact of emergency department crowding measures on time to antibiotics for patients with community-acquired pneumonia. Ann Emerg Med. 2007;50(5):510-516. doi: 10.1016/j.annemergmed.2007.07.021. PubMed
14. Hwang U, Richardson L, Livote E, Harris B, Spencer N, Sean Morrison R. Emergency department crowding and decreased quality of pain care. Acad Emerg Med. 2008;15:1248-1255. doi: 10.1111/j.1553-2712.2008.00267.x. PubMed
15. Mills AM, Shofer FS, Chen EH, Hollander JE, Pines JM. The association between emergency department crowding and analgesia administration in acute abdominal pain patients. Acad Emerg Med. 2009;16:603-608. doi: 10.1111/j.1553-2712.2009.00441.x. PubMed
16. Pines JM, Shofer FS, Isserman JA, Abbuhl SB, Mills AM. The effect of emergency department crowding on analgesia in patients with back pain in two hospitals. Acad Emerg Med. 2010;17(3):276-283. doi: 10.1111/j.1553-2712.2009.00676.x. PubMed
17. Kulstad EB, Sikka R, Sweis RT, Kelley KM, Rzechula KH. ED overcrowding is associated with an increased frequency of medication errors. Am J Emerg Med. 2010;28:304-309. doi: 10.1016/j.ajem.2008.12.014. PubMed
18. Richardson DB. Increase in patient mortality at 10 days associated with emergency department overcrowding. Med J Aust. 2006;184(5):213-216. PubMed
19. Hoot NR, Aronsky D. Systematic review of emergency department crowding: causes, effects, and solutions. Ann Emerg Med. 2008;52(2):126-136. doi: 10.1016/j.annemergmed.2008.03.014. PubMed
20. Singer AJ, Thode HC, Jr., Viccellio P, Pines JM. The association between length of emergency department boarding and mortality. Acad Emerg Med. 2011;18(12):1324-1329. doi: 10.1111/j.1553-2712.2011.01236.x. PubMed
21. White BA, Biddinger PD, Chang Y, Grabowski B, Carignan S, Brown DF. Boarding inpatients in the emergency department increases discharged patient length of stay. J Emerg Med. 2013;44(1):230-235. doi: 10.1016/j.jemermed.2012.05.007. PubMed
22. Forster AJ, Stiell I, Wells G, Lee AJ, van Walraven C. The effect of hospital occupancy on emergency department length of stay and patient disposition. Acad Emerg Med. 2003;10(2):127-133. doi: 10.1197/aemj.10.2.127. PubMed
23. Foley M, Kifaieh N, Mallon WK. Financial impact of emergency department crowding. West J Emerg Med. 2011;12(2):192-197. PubMed
24. Pines JM, Iyer S, Disbot M, Hollander JE, Shofer FS, Datner EM. The effect of emergency department crowding on patient satisfaction for admitted patients. Acad Emerg Med. 2008;15(9):825-831. doi: 10.1111/j.1553-2712.2008.00200.x. PubMed
25. Durvasula R, Kayihan A, Del Bene S, et al. A multidisciplinary care pathway significantly increases the number of early morning discharges in a large academic medical center. Qual Manag Health Care. 2015;24:45-51. doi: 10.1097/QMH.0000000000000049. PubMed
26. Cho HJ, Desai N, Florendo A, et al. E-DIP: Early Discharge Project. A Model for Throughput and Early Discharge for 1-Day Admissions. BMJ Qual Improv Rep. 2016;5(1): pii: u210035.w4128. doi: 10.1136/bmjquality.u210035.w4128. PubMed
27. Harris PA, Taylor R, Thielke R, Payne J, Gonzalez N, Conde JG. Research electronic data capture (REDCap)--a metadata-driven methodology and workflow process for providing translational research informatics support. J Biomed Inform. 2009;42(2):377-381. doi: 10.1016/j.jbi.2008.08.010. PubMed
28. Patel H, Fang MC, Mourad M, et al. Hospitalist and internal medicine leaders’ perspectives of early discharge challenges at academic medical centers. J Hosp Med. 2018;13(6):388-391. doi: 10.12788/jhm.2885. PubMed
29. Minichiello TM, Auerbach AD, Wachter RM. Caregiver perceptions of the reasons for delayed hospital discharge. Eff Clin Pract. 2001;4(6):250-255. PubMed
30. Beck MJ, Okerblom D, Kumar A, Bandyopadhyay S, Scalzi LV. Lean intervention improves patient discharge times, improves emergency department throughput and reduces congestion. Hosp Pract (1995). 2016;44(5):252-259. doi: 10.1080/21548331.2016.1254559. PubMed
31. Rajkomar A, Valencia V, Novelero M, Mourad M, Auerbach A. The association between discharge before noon and length of stay in medical and surgical patients. J Hosp Med. 2016;11(12):859-861. doi: 10.1002/jhm.2529. PubMed
32. Shine D. Discharge before noon: an urban legend. Am J Med. 2015;128(5):445-446. doi: 10.1016/j.amjmed.2014.12.011. PubMed33. Khanna S, Boyle J, Good N, Lind J. Unravelling relationships: Hospital occupancy levels, discharge timing and emergency department access block. Emerg Med Australas. 2012;24(5):510-517. doi: 10.1111/j.1742-6723.2012.01587.x. PubMed

Predictors of Clinically Significant Echocardiography Findings in Older Adults with Syncope: A Secondary Analysis
Syncope, defined as a transient loss of consciousness and postural tone followed by complete, spontaneous return to neurological baseline, accounts for over 1 million (or approximately 1%) of all emergency department (ED) visits per year in the United States (US).12 Given the breadth of etiologies for syncope, including certain life-threatening conditions, extensive diagnostic evaluation and hospitalization for this complaint is common.3-7 The estimated costs of syncope-related hospitalizations are over $2.4 billion annually in the US.8
The 2011 American College of Cardiology Foundation appropriate use criteria for echocardiography state that syncope is an appropriate indication for transthoracic echocardiography (TTE) even when there are no other symptoms or signs of cardiovascular disease.9 This broad recommendation may be appropriate since a finding of severe valvular disease would generally merit consultation with a cardiothoracic surgeon to assess the potential for surgical intervention.10 However, routine use of echocardiogram in all syncope patients could result in increased healthcare costs, patient discomfort, and incidental findings of unclear significance, while rarely changing diagnosis or management.11,12
In an attempt to reduce potentially unnecessary TTE testing, several studies have tried to identify patients at very low risk of structural heart disease.13-17 These investigations suggest that TTE is not indicated in syncope patients with a normal ECG and a normal cardiac exam. However, this literature is limited by retrospective study design and/or small sample sizes. The 2017 American Heart Association/American College of Cardiology/Heart Rhythm Society syncope guidelines recommend TTE for a patient in whom structural heart disease is suspected, but they are not explicit about how to make this determination. 18 Thus, it is still unclear which syncope patients require TTE since a standardized approach to assessing risk of clinically significant findings on TTE has not yet been rigorously developed.
The objective of this study was to develop a risk-stratification tool to identify older adults at very low risk of having a major, clinically significant finding on rest TTE after presenting to the ED with syncope or near-syncope. Using clinical, ECG, and cardiac biomarker data, we created the ROMEO (Risk Of Major Echocardiography findings in Older adults with syncope) score to help optimize resource utilization for syncope.
METHODS
Study Design and Setting
We conducted a large, multicenter, prospective, observational cohort study of older adults who presented to an ED with syncope or near-syncope (ClinicalTrials.gov identifier: NCT01802398). The study was approved by the institutional review boards at all sites and written informed consent was obtained from all participating subjects. The study was conducted at 11 academic EDs across the US (See Appendix Table 1).
Study Population
Patient inclusion criteria for eligibility were age ≥60 years with a complaint of syncope or near-syncope. Syncope was defined as transient loss of consciousness, associated with postural loss of tone, with immediate, spontaneous, and complete recovery. Near syncope was defined as the sensation of imminent loss of consciousness. Patients were excluded if their symptoms were thought to be due to intoxication, seizure, stroke, head trauma, or hypoglycemia. Additional exclusion criteria were the need for medical intervention to restore consciousness (eg, defibrillation), new or worsening confusion, and inability to obtain informed consent from the patient or a legally authorized representative.
This analysis included only patients who received a TTE during the index visit (either in the ED, observation unit, or while admitted to the hospital). This dataset was also used for other analyses addressing questions relevant to the ED management of syncope.
Measurements
All patients underwent a standardized history, physical examination, laboratory, and 12-lead ECG testing. Trained research assistants (RA) directly queried patients about symptoms associated with the syncopal episode. Data on the patient’s past medical history, medications, and physical examination findings were collected prospectively from treating providers.
Research staff obtained blood samples for testing at a core laboratory (University of Rochester, Rochester, NY). Two assays were performed using the Roche Elecsys platform: N-terminal pro B-type natriuretic peptide (NT-proBNP) and the 5th generation high-sensitivity cardiac troponin T (hs-TnT). NT-proBNP was classified as abnormal above a cutoff of 125 pg/mL. Hs-TnT was classified as abnormal above the 99th percentile for a reference population (14 pg/mL). Although hs-TnT was not approved by the U.S. Food and Drug Administration (FDA) at the time of the study, we anticipated that this assay would receive approval and be integrated into future standard of care (FDA approval was granted in January 2017). Rest TTEs were ordered at the discretion of the treating providers.
Outcome Measures
The primary outcome for this secondary analysis was a major, clinically significant finding on TTE.13,14,16,19 These included severe aortic stenosis (<1 cm2), severe mitral stenosis, severe aortic/mitral regurgitation, reduced ejection fraction (defined either quantitatively as less than 45% or qualitatively as “severe left ventricular dysfunction”), hypertrophic cardiomyopathy with outflow tract obstruction, severe pulmonary hypertension, right ventricular dysfunction/strain, large pericardial effusion, atrial myxoma, or regional wall motion abnormalities.
All echocardiogram reports were independently reviewed by two research physicians. Discrepant reviews were resolved by the research physicians and two of the study investigators (BS, CB). Of note, all the TTEs obtained were formal echocardiographic studies, not bedside ultrasonography performed by the emergency physician.
Candidate Predictors
Potential candidate predictors were identified through a prior expert panel process.20,21 Candidate predictors included age, sex, abnormal heart sounds, exertional syncope, shortness of breath, chest pain, near-syncope, family history of sudden cardiac death, high (>180 mm Hg) or low (<90 mm Hg) systolic blood pressure, abnormal ECG, elevated hs-TnT, elevated NT-proBNP, and history of the following: hypertension, cardiac dysrhythmia, renal failure, diabetes, congestive heart failure (CHF), and coronary artery disease (CAD).
The first obtained ECG was abstracted by one of five research study physicians blinded to all clinical data. Research study physicians demonstrated high interrater reliability (kappa > 0.80) in distinguishing normal from abnormal ECGs in a training set of 50 ECGs. Abnormal ECG interpretations included nonsinus rhythms (including paced rhythms), multiple premature ventricular complexes, sinus bradycardias (≤40 bpm), ventricular hypertrophies, short PR segment intervals (<100 milliseconds [ms]), axis deviations, first degree blocks (>200 ms), complete bundle branch blocks, Brugada patterns, Wolff-Parkinson-White patterns, abnormal QRS duration (>120 ms) or abnormal QTc prolongations (>450 ms), and Q/ST/T segment abnormalities suggestive of acute or chronic ischemia.
Statistical Analysis
We calculated descriptive statistics for each predictor variable, stratified by the presence or absence of TTE findings. Chi-square and t-tests were used to test associations between categorical or continuous variables and TTE findings using a significance level of 0.05 and 2-sided hypothesis testing. To identify a robust set of predictors of the primary outcome, we used multivariate logistic regression with the LASSO (Least Absolute Shrinkage and Selection Operator) to fit a parsimonious model.22 The LASSO selects variables and shrinks the associated coefficients to avoid overfitting.23-25 We then used a bootstrap to generate confidence intervals for coefficient estimates. Cases with missing echocardiography reports were excluded from the analysis. Bootstrap results were summarized as the percentage of bootstrap iterations in which each variable’s coefficient was 1) chosen and negative, 2) shrunk to zero, or 3) chosen and positive.
We assessed different weighting schemes to generate a risk score from significant variables identified by regression modeling. These included weighting by regression coefficients rounded to the nearest integer and simple summation of the presence or absence of each variable.
Based on these results, a predictive score was developed to risk stratify patients on their probability of major, clinically significant findings on TTE. The sensitivity and specificity of a score of zero to predict findings on TTE was calculated. For confidence intervals, we used Wilson’s method for binomial confidence intervals.26 The receiver operating characteristic (ROC) curve and its associated area under the curve (AUC) were calculated, and a confidence interval for the AUC was obtained through bootstrap resampling with 2,000 iterations. As part of our sensitivity analyses, we also calculated the ROC curve and AUC after excluding the patients with a known history of CHF and significant finding on TTE. Data analyses were performed in R.27 Two sensitivity analyses were performed: 1) we used multiple imputation to impute 1,000 complete data sets and then used the same LASSO methodology as with the complete data to assess whether incorporating missing data changed the results; and 2) we simulated a conventional troponin assay by raising the positive threshold for hs-TnT to >30 pg/mL (corresponding to the limit of detection for conventional troponin).28
RESULTS
Characteristics of Study Subjects
Patient screening occurred from April 2013 to September 2016. There were 6,930 patients who met eligibility criteria, of whom 3,686 (53%) consented and enrolled in the study (See Figure 1). Of these, 995 (27%) received TTE. The mean age of patients receiving TTE was 74 years; 55% were male. Characteristics of patients obtaining and not obtaining TTE are presented in Appendix Table 2. Patients who received TTE were more likely to be older, have abnormal heart sounds, abnormal EKGs, elevated hs-TnT, elevated NT-proBNP, and have a history of CHF. Of the 995 subjects receiving TTE, 215 (21.6%) had a major, clinically significant finding.
Main Results
Univariate analysis identified 14 variables significantly associated with major findings on TTE. These included male gender, shortness of breath, abnormal heart sounds, history of renal failure, diabetes, CHF, CAD, abnormal ECG, and elevated cardiac biomarkers, among others (See Table 1). The most common major finding on TTE was regional wall motion abnormality, followed by reduced left ventricular ejection fraction (See Table 2). Of the 995 patients who received TTE, 20 (2%) were discharged directly from the ED, 444 (45%) were observed, and 531 (53%) were admitted. On average, patients who received TTE had a longer length of stay than did those that did not (3.4 days vs 1.9 days).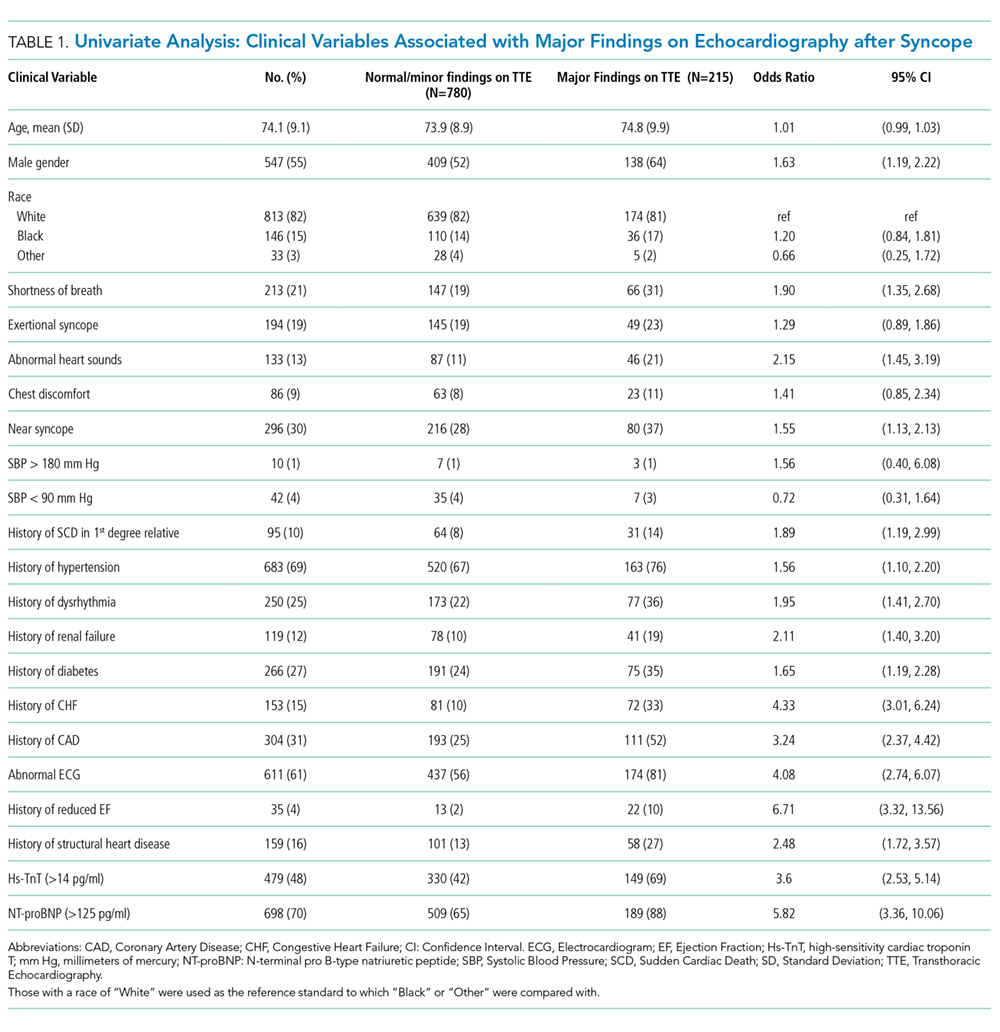
LASSO multivariable logistic regression produced five predictors associated with major findings on TTE: 1) history of CHF, 2) history of CAD, 3) abnormal ECG, 4) hs-TnT above 14 pg/mL, and 5) NT-proBNP above 125 pg/mL (See Table 3).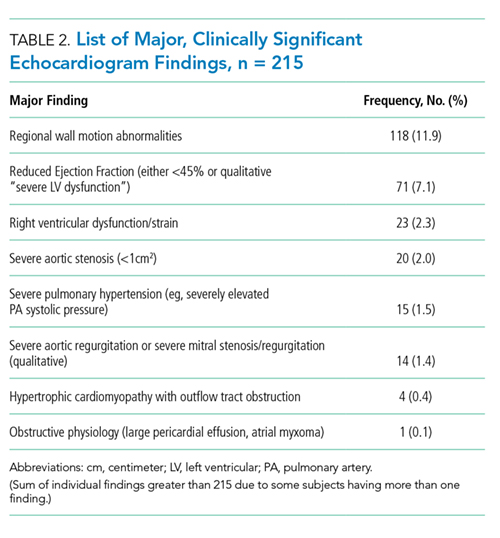
These five high-risk clinical variables retained their importance after multivariate analysis and form the ROMEO score.
The sensitivity and specificity of a ROMEO score of zero for excluding major findings on TTE was 99.5% (95% CI: 97.4%-99.9%) and 15.4% (95% CI: 13.0%-18.1%), respectively. Patients with a ROMEO score of 0 were at very low risk of having a major finding on TTE: 0.8% (95% CI: 0.02%-4.5%; Appendix Table 3). Only one out of 121 patients with none of the ROMEO criteria was found to have a major finding on TTE (regional wall motion abnormality). Patients with a score of 1 or more were at moderate-to-high risk of having a major finding (7.3% to 55.6%).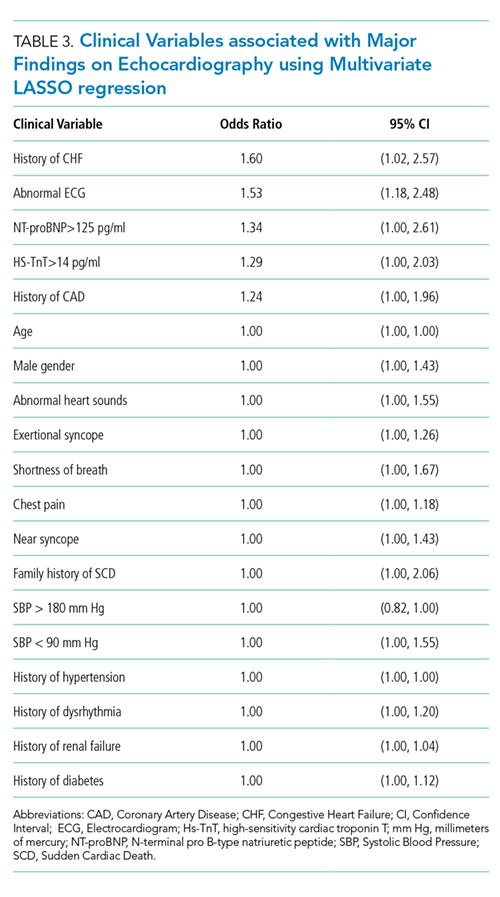
There was a linear relationship between the ROMEO score and probability of major findings on TTE (See Appendix Figure 1). The AUC was 0.77 (95% CI = 0.72-0.79) indicating good accuracy of the combination of the five high-risk clinical variables to predict major findings on TTE (See Appendix Figure 2). After excluding the 72 patients with known CHF and significant findings on TTE, the AUC was similar: 0.73 (95% CI: 0.69-0.77). There were 139 patients with at least one missing variable (14%) (See Appendix Table 4). A multiple imputation sensitivity analysis identified the same five high-risk clinical variables in 85% of imputations.
There were 253 patients with high-sensitivity troponin levels between 15 and 30 pg/mL (inclusive). Using a higher hs-TnT threshold (>30 pg/mL) to simulate a conventional troponin assay again identified the same five high-risk variables along with shortness of breath as a potential sixth variable though with an odds ratio approaching unity (See Appendix Table 5). The ROMEO score would have missed two additional patients with major findings if the troponin cutoff were raised to 30 pg/mL from 14 pg/mL, ie, it would have identified 212/215 (98.6%) of the major findings rather than 214/215 (99.5%).
DISCUSSION
Older adults with syncope often present to the ED and undergo a variety of diagnostic tests, including TTE, and a significant proportion are admitted to the hospital.2 There is currently no standardized, evidence-based approach to guide TTE ordering for these patients. Using a large, prospective dataset of syncope patients, we sought to develop a risk-stratification tool to help clinicians identify which syncope patients would be at very low risk for clinically significant findings on TTE. We found that in the absence of these five high-risk clinical variables, the rate of significant findings on TTE in our sample was less than 1%. All five high-risk variables included in the tool remained predictive in our sensitivity analyses, speaking to the robustness of our model.
Other retrospective, and smaller prospective, studies have identified a combination of low-risk criteria including: a normal ECG alone,15 a normal physical exam and normal ECG,14,17 a negative cardiac history and normal ECG.16 Han et al. performed a chart review of 241 patients presenting to the ED with syncope and identified three risk factors for abnormal TTE findings using multiple logistic regression: age, abnormal ECG, and BNP greater than 100 pg/mL.13 While these studies’ results are generally consistent with ours, the retrospective nature and small sample size of these studies limit the generalizability of these results. Thus, using a large, multicenter prospective dataset, we derived a clinical decision instrument (the ROMEO score) to determine which older adults with syncope are at very low risk for major, clinically significant findings on TTE.
Our results add to the recent American College of Cardiology/American Heart Association/Heart Rhythm Society guidelines on the management of syncope which recommend TTE in “selected patients presenting with syncope if structural heart disease is suspected.”18 Our risk-stratification tool offers a simple, standardized approach to determine specifically when to defer TTE testing.
Our findings can guide clinicians in deciding when to obtain TTE for ED syncope patients in the following way: Older adults presenting with syncope or near-syncope to the ED who have none of the ROMEO criteria are at extremely low risk for clinically significant findings on TTE and thus need not undergo such testing solely because of the syncopal event. Patients who have only one or more high-risk clinical variables are at higher risk (7.3%-56%) of significant TTE findings. In this subset, other factors, (eg, physician gestalt, recent previous echocardiography, patient preference, availability of echocardiography) can help guide TTE ordering. Patients with a greater number of high-risk variables may benefit from a more urgent echocardiographic evaluation.
Although on average, patients undergoing TTE had a longer length of stay than those that did not, this finding does not necessarily imply that ordering a TTE was the cause of the increased length of stay. It is possible that this positive association was due to greater underlying medical complexity or acuity of illness that resulted in a greater likelihood of admission/observation, and in turn, a greater length of stay.
Prior to implementation, our results should be externally validated in other clinical settings. In the interim, this risk-stratification tool may be used by clinicians, in conjunction with clinical judgement, to help guide the appropriate use of TTE in older adults presenting with syncope.
Our study has certain limitations. As we only enrolled patients 60 years and older, our findings may not necessarily be valid in younger populations of syncope patients. However, structural heart disease is less common in younger patients and is generally more of a concern for clinicians when evaluating syncope patients in the older age range.29 In our study, 47% of eligible patients declined to participate and thus sampling bias may have occurred. TTEs were ordered at the discretion of treating providers, which was likely subject to physician, institutional, and regional variation; the prevalence of major TTE findings may be lower in the overall cohort than in patients who received TTE. Prior TTE reports were not available; therefore, we were not able to determine if these major findings were previously known. Importantly, we did not perform an internal or external validation of the ROMEO score due to time and resource constraints. Thus, this study represents a derivation of the score solely and would require external validation prior to clinical implementation. Also, to calculate the ROMEO score, both an hs-TnT and NT-proBNP level must be obtained. Thus, the cost savings of any potential reduction in TTE ordering may be partially offset by the costs of increased laboratory testing. Lastly, hs-TnT assays are not currently widely available in hospitals in the United States; earlier generation cardiac troponin assays may not be a perfect substitute for hs-TnT assays. Our sensitivity analysis using an elevated threshold for hs-TnT attempted to mitigate this limitation and resulted in similar findings.
In summary, this risk-stratification tool, using five simple criteria, could help clinicians determine which older adult syncope patients can safely forgo TTE. If validated, this tool could help optimize resource utilization, and increase the value of healthcare for patients presenting with syncope.
Acknowledgments
The authors would like to thank the research assistants at all 11 sites who enrolled patients and collected data for this study.
Disclosures
Dr. Adler has received research funding from Roche. Dr. Bastani has received research funding from Radiometer and Portola and has been a consultant for Portola. Dr. Baugh has received advisory board and speaker’s fees from Roche, research funding from Janssen and Boehringer Ingelheim, and consulting and advisory board fees from Janssen. Dr. Casterino has received funding from Astra Zeneca. Dr. Clark has received research funding from Radiometer, Ortho Clinical Trials, Janssen, Pfizer, NIH, Portola, Biocryst, Glaxo Smith Klein, Hospital Quality Foundation, and Abbott. She is a consultant for Portola, Janssen, and Hospital Quality Foundation. Dr. Diercks is a consultant for Siemens, Janssen, and Roche has received institutional research support from Novartis, Ortho Scientific, and Roche. Dr. Hollander has received research funding from Alere, Siemens, Roche, Portola, and Trinity. Dr. Hollander has also received royalties from UpToDate. Dr. Nishijima has received an honorarium from Pfizer. Dr. Storrow is a consultant for Siemens and Quidel, has received speaking fees from MCM Education, and is on the Data and Safety Monitoring Board for Trevena. Dr. Sun is a consultant for Medtronic. The other authors report no relevant conflicts of interest.
Funding
This project was supported by the National Heart, Lung, And Blood Institute of the National Institutes of Health under Award Number R01 HL111033. Dr. Probst is supported by the National Heart, Lung, And Blood Institute of the National Institutes of Health under Award Number K23HL132052-02. The content is solely the responsibility of the authors and does not necessarily represent the official views of the National Institutes of Health. Roche Diagnostics supplied the high-sensitivity troponin-T assays. The sponsoring organizations had no role in the design and conduct of the study; collection, management, analysis, and interpretation of the data; and preparation, or review of the manuscript.
1. Sun BC, Emond JA, Camargo CA, Jr. Characteristics and admission patterns of patients presenting with syncope to U.S. emergency departments, 1992-2000. Acad Emerg Med. 2004;11(10):1029-1034. doi: 10.1197/j.aem.2004.05.032. PubMed
2. Probst MA, Kanzaria HK, Gbedemah M, Richardson LD, Sun BC. National trends in resource utilization associated with ED visits for syncope. Am J Emerg Med. 2015;33(8):998-1001. doi: 10.1016/j.ajem.2015.04.030. PubMed
3. Kapoor WN, Karpf M, Maher Y, Miller RA, Levey GS. Syncope of unknown origin. The need for a more cost-effective approach to its diagnosis evaluation. JAMA. 1982;247(19):2687-2691. doi: 10.1001/jama.247.19.2687. PubMed
4. Pires LA, Ganji JR, Jarandila R, Steele R. Diagnostic patterns and temporal trends in the evaluation of adult patients hospitalized with syncope. Arch Intern Med. 2001;161(15):1889-1895. doi: 10.1001/archinte.161.15.1889. PubMed
5. Quinn JV, Stiell IG, McDermott DA, Sellers KL, Kohn MA, Wells GA. Derivation of the San Francisco Syncope Rule to predict patients with short-term serious outcomes. Ann Emerg Med. 2004;43(2):224-232. doi: 10.1016/S0196064403008230. PubMed
6. Linzer M, Yang EH, Estes NA, 3rd, Wang P, Vorperian VR, Kapoor WN. Diagnosing syncope. Part 1: Value of history, physical examination, and electrocardiography. Clinical Efficacy Assessment Project of the American College of Physicians. Ann Intern Med. 1997;126(12):989-996. doi: 10.7326/0003-4819-126-12-199706150-00012. PubMed
7. Linzer M, Yang EH, Estes NA, 3rd, Wang P, Vorperian VR, Kapoor WN. Diagnosing syncope. Part 2: Unexplained syncope. Clinical Efficacy Assessment Project of the American College of Physicians. Ann Intern Med. 1997;127(1):76-86. doi: 10.7326/0003-4819-127-1-199707010-00014. PubMed
8. Sun BC, Emond JA, Camargo CA, Jr. Direct medical costs of syncope-related hospitalizations in the United States. Am J Cardiol. 2005;95(5):668-671. doi: 10.1016/j.amjcard.2004.11.013. PubMed
9. American College of Cardiology Foundation. Appropriate Use Criteria Task F, American Society of Echocardiography, American Heart Association, et al. ACCF/ASE/AHA/ASNC/HFSA/HRS/SCAI/SCCM/SCCT/SCMR 2011 Appropriate Use Criteria for Echocardiography. A Report of the American College of Cardiology Foundation Appropriate Use Criteria Task Force, American Society of Echocardiography, American Heart Association, American Society of Nuclear Cardiology, Heart Failure Society of America, Heart Rhythm Society, Society for Cardiovascular Angiography and Interventions, Society of Critical Care Medicine, Society of Cardiovascular Computed Tomography, and Society for Cardiovascular Magnetic Resonance Endorsed by the American College of Chest Physicians. J Am Coll Cardiol. 2011;57(9):1126-1166. doi: 10.1016/j.echo.2010.12.008.
10. Maganti K, Rigolin VH, Sarano ME, Bonow RO. Valvular heart disease: diagnosis and management. Mayo Clin Proc. 2010;85(5):483-500. doi: 10.4065/mcp.2009.0706. PubMed
11. Mendu ML, McAvay G, Lampert R, Stoehr J, Tinetti ME. Yield of diagnostic tests in evaluating syncopal episodes in older patients. Arch Intern Med. 2009;169(14):1299-1305. doi: 10.1001/archinternmed.2009.204. PubMed
12. Madeira CL, Craig MJ, Donohoe A, Stephens JR. Things we do for no reason: echocardiogram in unselected patients with syncope. J Hosp Med. 2017;12(12):984–988. doi: http://dx.doi.org/10.12788/jhm.2864. PubMed
13. Han SK, Yeom SR, Lee SH, et al. Transthoracic echocardiogram in syncope patients with normal initial evaluation. Am J Emerg Med. 2017;35(2):281-284. doi: 10.1016/j.ajem.2016.10.078. PubMed
14. Chang NL, Shah P, Bajaj S, Virk H, Bikkina M, Shamoon F. Diagnostic yield of echocardiography in syncope patients with normal ECG. Cardiol Res Pract. 2016;2016:1251637. doi: http://dx.doi.org/10.1155/2016/1251637. PubMed
15. Anderson KL, Limkakeng A, Damuth E, Chandra A. Cardiac evaluation for structural abnormalities may not be required in patients presenting with syncope and a normal ECG result in an observation unit setting. Ann Emerg Med. 2012;60(4):478–84.e1. doi: 10.1016/j.annemergmed.2012.04.023. PubMed
16. Sarasin FP, Junod AF, Carballo D, Slama S, Unger PF, Louis-Simonet M. Role of echocardiography in the evaluation of syncope: a prospective study. Heart. 2002;88(4):363-367. doi: 10.1136/heart.88.4.363. PubMed
17. Recchia D, Barzilai B. Echocardiography in the evaluation of patients with syncope. J Gen Intern Med. 1995;10(12):649-655. doi: 10.1007/BF02602755. PubMed
18. Shen WK, Sheldon RS, Benditt DG, et al. ACC/AHA/HRS guideline for the evaluation and management of patients With syncope: executive summary: A report of the American College of Cardiology/American Heart Association Task Force on Clinical Practice Guidelines and the Heart Rhythm Society. J Am Coll Cardiol. 2017;2017(70(5)):620-663. PubMed
19. Chiu DT, Shapiro NI, Sun BC, Mottley JL, Grossman SA. Are echocardiography, telemetry, ambulatory electrocardiography monitoring, and cardiac enzymes in emergency department patients presenting with syncope useful tests? A preliminary investigation. J Emerg Med. 2014;47(1):113-118. doi: 10.1016/j.jemermed.2014.01.018. PubMed
20. Sun BC, Costantino G, Barbic F, et al. Priorities for emergency department syncope research. Ann Emerg Med. 2014;64(6):649–55.e2. doi: 10.1016/j.annemergmed.2014.04.014. PubMed
21. Sun BC, Derose SF, Liang LJ, et al. Predictors of 30-day serious events in older patients with syncope. Ann Emerg Med. 2009;54(6):769–778.e1-5. doi: 10.1016/j.annemergmed.2009.07.027. PubMed
22. Tibshirani R. Regression shrinkage and selection via the lasso. J R Stat Soc. 1996;58(1):267-288.
23. Friedman J, Hastie T, Tibshirani R. He Elements of Statistical Learning;Vol 1. New York, NY: Springer-Verlag; 2001. PubMed
24. Friedman J, Hastie T, Tibshirani R. Regularization paths for generalized linear models via coordinate descent. J Stat Softw. 2010;33(1):1-22. doi: 10.18637/jss.v033.i01. PubMed
25. James G, Witten D, Hastie T, Tibshirani R. An Introduction to Statistical Learning;Vol 112. New York, NY: Springer-Verlag; 2013.
26. Wilson EB. Probable inference, the law of succession, and statistical inference. J Am Stat Assoc. 1927 ;22(158):209-212. doi: 10.1080/01621459.1927.10502953. PubMed
27. R Core Team (2018). R: A language and environment for statistical computing. R Foundation for Statistical Computing, Vienna, Austria. URL http://www.R-project.org/.
28. Chew DP, Zeitz C, Worthley M, et al. Randomized comparison of high-sensitivity troponin reporting in undifferentiated chest pain assessment. Circ Cardiovasc Qual Outcomes. 2016;9(5):542-553. doi: 10.1161/CIRCOUTCOMES.115.002488. PubMed
29. Chen RS, Bivens MJ, Grossman SA. Diagnosis and management of valvular heart disease in emergency medicine. Emerg Med Clin North Am. 2011;29(4):801–10, vii. doi: 10.1016/j.emc.2011.08.001. PubMed
Syncope, defined as a transient loss of consciousness and postural tone followed by complete, spontaneous return to neurological baseline, accounts for over 1 million (or approximately 1%) of all emergency department (ED) visits per year in the United States (US).12 Given the breadth of etiologies for syncope, including certain life-threatening conditions, extensive diagnostic evaluation and hospitalization for this complaint is common.3-7 The estimated costs of syncope-related hospitalizations are over $2.4 billion annually in the US.8
The 2011 American College of Cardiology Foundation appropriate use criteria for echocardiography state that syncope is an appropriate indication for transthoracic echocardiography (TTE) even when there are no other symptoms or signs of cardiovascular disease.9 This broad recommendation may be appropriate since a finding of severe valvular disease would generally merit consultation with a cardiothoracic surgeon to assess the potential for surgical intervention.10 However, routine use of echocardiogram in all syncope patients could result in increased healthcare costs, patient discomfort, and incidental findings of unclear significance, while rarely changing diagnosis or management.11,12
In an attempt to reduce potentially unnecessary TTE testing, several studies have tried to identify patients at very low risk of structural heart disease.13-17 These investigations suggest that TTE is not indicated in syncope patients with a normal ECG and a normal cardiac exam. However, this literature is limited by retrospective study design and/or small sample sizes. The 2017 American Heart Association/American College of Cardiology/Heart Rhythm Society syncope guidelines recommend TTE for a patient in whom structural heart disease is suspected, but they are not explicit about how to make this determination. 18 Thus, it is still unclear which syncope patients require TTE since a standardized approach to assessing risk of clinically significant findings on TTE has not yet been rigorously developed.
The objective of this study was to develop a risk-stratification tool to identify older adults at very low risk of having a major, clinically significant finding on rest TTE after presenting to the ED with syncope or near-syncope. Using clinical, ECG, and cardiac biomarker data, we created the ROMEO (Risk Of Major Echocardiography findings in Older adults with syncope) score to help optimize resource utilization for syncope.
METHODS
Study Design and Setting
We conducted a large, multicenter, prospective, observational cohort study of older adults who presented to an ED with syncope or near-syncope (ClinicalTrials.gov identifier: NCT01802398). The study was approved by the institutional review boards at all sites and written informed consent was obtained from all participating subjects. The study was conducted at 11 academic EDs across the US (See Appendix Table 1).
Study Population
Patient inclusion criteria for eligibility were age ≥60 years with a complaint of syncope or near-syncope. Syncope was defined as transient loss of consciousness, associated with postural loss of tone, with immediate, spontaneous, and complete recovery. Near syncope was defined as the sensation of imminent loss of consciousness. Patients were excluded if their symptoms were thought to be due to intoxication, seizure, stroke, head trauma, or hypoglycemia. Additional exclusion criteria were the need for medical intervention to restore consciousness (eg, defibrillation), new or worsening confusion, and inability to obtain informed consent from the patient or a legally authorized representative.
This analysis included only patients who received a TTE during the index visit (either in the ED, observation unit, or while admitted to the hospital). This dataset was also used for other analyses addressing questions relevant to the ED management of syncope.
Measurements
All patients underwent a standardized history, physical examination, laboratory, and 12-lead ECG testing. Trained research assistants (RA) directly queried patients about symptoms associated with the syncopal episode. Data on the patient’s past medical history, medications, and physical examination findings were collected prospectively from treating providers.
Research staff obtained blood samples for testing at a core laboratory (University of Rochester, Rochester, NY). Two assays were performed using the Roche Elecsys platform: N-terminal pro B-type natriuretic peptide (NT-proBNP) and the 5th generation high-sensitivity cardiac troponin T (hs-TnT). NT-proBNP was classified as abnormal above a cutoff of 125 pg/mL. Hs-TnT was classified as abnormal above the 99th percentile for a reference population (14 pg/mL). Although hs-TnT was not approved by the U.S. Food and Drug Administration (FDA) at the time of the study, we anticipated that this assay would receive approval and be integrated into future standard of care (FDA approval was granted in January 2017). Rest TTEs were ordered at the discretion of the treating providers.
Outcome Measures
The primary outcome for this secondary analysis was a major, clinically significant finding on TTE.13,14,16,19 These included severe aortic stenosis (<1 cm2), severe mitral stenosis, severe aortic/mitral regurgitation, reduced ejection fraction (defined either quantitatively as less than 45% or qualitatively as “severe left ventricular dysfunction”), hypertrophic cardiomyopathy with outflow tract obstruction, severe pulmonary hypertension, right ventricular dysfunction/strain, large pericardial effusion, atrial myxoma, or regional wall motion abnormalities.
All echocardiogram reports were independently reviewed by two research physicians. Discrepant reviews were resolved by the research physicians and two of the study investigators (BS, CB). Of note, all the TTEs obtained were formal echocardiographic studies, not bedside ultrasonography performed by the emergency physician.
Candidate Predictors
Potential candidate predictors were identified through a prior expert panel process.20,21 Candidate predictors included age, sex, abnormal heart sounds, exertional syncope, shortness of breath, chest pain, near-syncope, family history of sudden cardiac death, high (>180 mm Hg) or low (<90 mm Hg) systolic blood pressure, abnormal ECG, elevated hs-TnT, elevated NT-proBNP, and history of the following: hypertension, cardiac dysrhythmia, renal failure, diabetes, congestive heart failure (CHF), and coronary artery disease (CAD).
The first obtained ECG was abstracted by one of five research study physicians blinded to all clinical data. Research study physicians demonstrated high interrater reliability (kappa > 0.80) in distinguishing normal from abnormal ECGs in a training set of 50 ECGs. Abnormal ECG interpretations included nonsinus rhythms (including paced rhythms), multiple premature ventricular complexes, sinus bradycardias (≤40 bpm), ventricular hypertrophies, short PR segment intervals (<100 milliseconds [ms]), axis deviations, first degree blocks (>200 ms), complete bundle branch blocks, Brugada patterns, Wolff-Parkinson-White patterns, abnormal QRS duration (>120 ms) or abnormal QTc prolongations (>450 ms), and Q/ST/T segment abnormalities suggestive of acute or chronic ischemia.
Statistical Analysis
We calculated descriptive statistics for each predictor variable, stratified by the presence or absence of TTE findings. Chi-square and t-tests were used to test associations between categorical or continuous variables and TTE findings using a significance level of 0.05 and 2-sided hypothesis testing. To identify a robust set of predictors of the primary outcome, we used multivariate logistic regression with the LASSO (Least Absolute Shrinkage and Selection Operator) to fit a parsimonious model.22 The LASSO selects variables and shrinks the associated coefficients to avoid overfitting.23-25 We then used a bootstrap to generate confidence intervals for coefficient estimates. Cases with missing echocardiography reports were excluded from the analysis. Bootstrap results were summarized as the percentage of bootstrap iterations in which each variable’s coefficient was 1) chosen and negative, 2) shrunk to zero, or 3) chosen and positive.
We assessed different weighting schemes to generate a risk score from significant variables identified by regression modeling. These included weighting by regression coefficients rounded to the nearest integer and simple summation of the presence or absence of each variable.
Based on these results, a predictive score was developed to risk stratify patients on their probability of major, clinically significant findings on TTE. The sensitivity and specificity of a score of zero to predict findings on TTE was calculated. For confidence intervals, we used Wilson’s method for binomial confidence intervals.26 The receiver operating characteristic (ROC) curve and its associated area under the curve (AUC) were calculated, and a confidence interval for the AUC was obtained through bootstrap resampling with 2,000 iterations. As part of our sensitivity analyses, we also calculated the ROC curve and AUC after excluding the patients with a known history of CHF and significant finding on TTE. Data analyses were performed in R.27 Two sensitivity analyses were performed: 1) we used multiple imputation to impute 1,000 complete data sets and then used the same LASSO methodology as with the complete data to assess whether incorporating missing data changed the results; and 2) we simulated a conventional troponin assay by raising the positive threshold for hs-TnT to >30 pg/mL (corresponding to the limit of detection for conventional troponin).28
RESULTS
Characteristics of Study Subjects
Patient screening occurred from April 2013 to September 2016. There were 6,930 patients who met eligibility criteria, of whom 3,686 (53%) consented and enrolled in the study (See Figure 1). Of these, 995 (27%) received TTE. The mean age of patients receiving TTE was 74 years; 55% were male. Characteristics of patients obtaining and not obtaining TTE are presented in Appendix Table 2. Patients who received TTE were more likely to be older, have abnormal heart sounds, abnormal EKGs, elevated hs-TnT, elevated NT-proBNP, and have a history of CHF. Of the 995 subjects receiving TTE, 215 (21.6%) had a major, clinically significant finding.
Main Results
Univariate analysis identified 14 variables significantly associated with major findings on TTE. These included male gender, shortness of breath, abnormal heart sounds, history of renal failure, diabetes, CHF, CAD, abnormal ECG, and elevated cardiac biomarkers, among others (See Table 1). The most common major finding on TTE was regional wall motion abnormality, followed by reduced left ventricular ejection fraction (See Table 2). Of the 995 patients who received TTE, 20 (2%) were discharged directly from the ED, 444 (45%) were observed, and 531 (53%) were admitted. On average, patients who received TTE had a longer length of stay than did those that did not (3.4 days vs 1.9 days).
LASSO multivariable logistic regression produced five predictors associated with major findings on TTE: 1) history of CHF, 2) history of CAD, 3) abnormal ECG, 4) hs-TnT above 14 pg/mL, and 5) NT-proBNP above 125 pg/mL (See Table 3).
These five high-risk clinical variables retained their importance after multivariate analysis and form the ROMEO score.
The sensitivity and specificity of a ROMEO score of zero for excluding major findings on TTE was 99.5% (95% CI: 97.4%-99.9%) and 15.4% (95% CI: 13.0%-18.1%), respectively. Patients with a ROMEO score of 0 were at very low risk of having a major finding on TTE: 0.8% (95% CI: 0.02%-4.5%; Appendix Table 3). Only one out of 121 patients with none of the ROMEO criteria was found to have a major finding on TTE (regional wall motion abnormality). Patients with a score of 1 or more were at moderate-to-high risk of having a major finding (7.3% to 55.6%).
There was a linear relationship between the ROMEO score and probability of major findings on TTE (See Appendix Figure 1). The AUC was 0.77 (95% CI = 0.72-0.79) indicating good accuracy of the combination of the five high-risk clinical variables to predict major findings on TTE (See Appendix Figure 2). After excluding the 72 patients with known CHF and significant findings on TTE, the AUC was similar: 0.73 (95% CI: 0.69-0.77). There were 139 patients with at least one missing variable (14%) (See Appendix Table 4). A multiple imputation sensitivity analysis identified the same five high-risk clinical variables in 85% of imputations.
There were 253 patients with high-sensitivity troponin levels between 15 and 30 pg/mL (inclusive). Using a higher hs-TnT threshold (>30 pg/mL) to simulate a conventional troponin assay again identified the same five high-risk variables along with shortness of breath as a potential sixth variable though with an odds ratio approaching unity (See Appendix Table 5). The ROMEO score would have missed two additional patients with major findings if the troponin cutoff were raised to 30 pg/mL from 14 pg/mL, ie, it would have identified 212/215 (98.6%) of the major findings rather than 214/215 (99.5%).
DISCUSSION
Older adults with syncope often present to the ED and undergo a variety of diagnostic tests, including TTE, and a significant proportion are admitted to the hospital.2 There is currently no standardized, evidence-based approach to guide TTE ordering for these patients. Using a large, prospective dataset of syncope patients, we sought to develop a risk-stratification tool to help clinicians identify which syncope patients would be at very low risk for clinically significant findings on TTE. We found that in the absence of these five high-risk clinical variables, the rate of significant findings on TTE in our sample was less than 1%. All five high-risk variables included in the tool remained predictive in our sensitivity analyses, speaking to the robustness of our model.
Other retrospective, and smaller prospective, studies have identified a combination of low-risk criteria including: a normal ECG alone,15 a normal physical exam and normal ECG,14,17 a negative cardiac history and normal ECG.16 Han et al. performed a chart review of 241 patients presenting to the ED with syncope and identified three risk factors for abnormal TTE findings using multiple logistic regression: age, abnormal ECG, and BNP greater than 100 pg/mL.13 While these studies’ results are generally consistent with ours, the retrospective nature and small sample size of these studies limit the generalizability of these results. Thus, using a large, multicenter prospective dataset, we derived a clinical decision instrument (the ROMEO score) to determine which older adults with syncope are at very low risk for major, clinically significant findings on TTE.
Our results add to the recent American College of Cardiology/American Heart Association/Heart Rhythm Society guidelines on the management of syncope which recommend TTE in “selected patients presenting with syncope if structural heart disease is suspected.”18 Our risk-stratification tool offers a simple, standardized approach to determine specifically when to defer TTE testing.
Our findings can guide clinicians in deciding when to obtain TTE for ED syncope patients in the following way: Older adults presenting with syncope or near-syncope to the ED who have none of the ROMEO criteria are at extremely low risk for clinically significant findings on TTE and thus need not undergo such testing solely because of the syncopal event. Patients who have only one or more high-risk clinical variables are at higher risk (7.3%-56%) of significant TTE findings. In this subset, other factors, (eg, physician gestalt, recent previous echocardiography, patient preference, availability of echocardiography) can help guide TTE ordering. Patients with a greater number of high-risk variables may benefit from a more urgent echocardiographic evaluation.
Although on average, patients undergoing TTE had a longer length of stay than those that did not, this finding does not necessarily imply that ordering a TTE was the cause of the increased length of stay. It is possible that this positive association was due to greater underlying medical complexity or acuity of illness that resulted in a greater likelihood of admission/observation, and in turn, a greater length of stay.
Prior to implementation, our results should be externally validated in other clinical settings. In the interim, this risk-stratification tool may be used by clinicians, in conjunction with clinical judgement, to help guide the appropriate use of TTE in older adults presenting with syncope.
Our study has certain limitations. As we only enrolled patients 60 years and older, our findings may not necessarily be valid in younger populations of syncope patients. However, structural heart disease is less common in younger patients and is generally more of a concern for clinicians when evaluating syncope patients in the older age range.29 In our study, 47% of eligible patients declined to participate and thus sampling bias may have occurred. TTEs were ordered at the discretion of treating providers, which was likely subject to physician, institutional, and regional variation; the prevalence of major TTE findings may be lower in the overall cohort than in patients who received TTE. Prior TTE reports were not available; therefore, we were not able to determine if these major findings were previously known. Importantly, we did not perform an internal or external validation of the ROMEO score due to time and resource constraints. Thus, this study represents a derivation of the score solely and would require external validation prior to clinical implementation. Also, to calculate the ROMEO score, both an hs-TnT and NT-proBNP level must be obtained. Thus, the cost savings of any potential reduction in TTE ordering may be partially offset by the costs of increased laboratory testing. Lastly, hs-TnT assays are not currently widely available in hospitals in the United States; earlier generation cardiac troponin assays may not be a perfect substitute for hs-TnT assays. Our sensitivity analysis using an elevated threshold for hs-TnT attempted to mitigate this limitation and resulted in similar findings.
In summary, this risk-stratification tool, using five simple criteria, could help clinicians determine which older adult syncope patients can safely forgo TTE. If validated, this tool could help optimize resource utilization, and increase the value of healthcare for patients presenting with syncope.
Acknowledgments
The authors would like to thank the research assistants at all 11 sites who enrolled patients and collected data for this study.
Disclosures
Dr. Adler has received research funding from Roche. Dr. Bastani has received research funding from Radiometer and Portola and has been a consultant for Portola. Dr. Baugh has received advisory board and speaker’s fees from Roche, research funding from Janssen and Boehringer Ingelheim, and consulting and advisory board fees from Janssen. Dr. Casterino has received funding from Astra Zeneca. Dr. Clark has received research funding from Radiometer, Ortho Clinical Trials, Janssen, Pfizer, NIH, Portola, Biocryst, Glaxo Smith Klein, Hospital Quality Foundation, and Abbott. She is a consultant for Portola, Janssen, and Hospital Quality Foundation. Dr. Diercks is a consultant for Siemens, Janssen, and Roche has received institutional research support from Novartis, Ortho Scientific, and Roche. Dr. Hollander has received research funding from Alere, Siemens, Roche, Portola, and Trinity. Dr. Hollander has also received royalties from UpToDate. Dr. Nishijima has received an honorarium from Pfizer. Dr. Storrow is a consultant for Siemens and Quidel, has received speaking fees from MCM Education, and is on the Data and Safety Monitoring Board for Trevena. Dr. Sun is a consultant for Medtronic. The other authors report no relevant conflicts of interest.
Funding
This project was supported by the National Heart, Lung, And Blood Institute of the National Institutes of Health under Award Number R01 HL111033. Dr. Probst is supported by the National Heart, Lung, And Blood Institute of the National Institutes of Health under Award Number K23HL132052-02. The content is solely the responsibility of the authors and does not necessarily represent the official views of the National Institutes of Health. Roche Diagnostics supplied the high-sensitivity troponin-T assays. The sponsoring organizations had no role in the design and conduct of the study; collection, management, analysis, and interpretation of the data; and preparation, or review of the manuscript.
1. Sun BC, Emond JA, Camargo CA, Jr. Characteristics and admission patterns of patients presenting with syncope to U.S. emergency departments, 1992-2000. Acad Emerg Med. 2004;11(10):1029-1034. doi: 10.1197/j.aem.2004.05.032. PubMed
2. Probst MA, Kanzaria HK, Gbedemah M, Richardson LD, Sun BC. National trends in resource utilization associated with ED visits for syncope. Am J Emerg Med. 2015;33(8):998-1001. doi: 10.1016/j.ajem.2015.04.030. PubMed
3. Kapoor WN, Karpf M, Maher Y, Miller RA, Levey GS. Syncope of unknown origin. The need for a more cost-effective approach to its diagnosis evaluation. JAMA. 1982;247(19):2687-2691. doi: 10.1001/jama.247.19.2687. PubMed
4. Pires LA, Ganji JR, Jarandila R, Steele R. Diagnostic patterns and temporal trends in the evaluation of adult patients hospitalized with syncope. Arch Intern Med. 2001;161(15):1889-1895. doi: 10.1001/archinte.161.15.1889. PubMed
5. Quinn JV, Stiell IG, McDermott DA, Sellers KL, Kohn MA, Wells GA. Derivation of the San Francisco Syncope Rule to predict patients with short-term serious outcomes. Ann Emerg Med. 2004;43(2):224-232. doi: 10.1016/S0196064403008230. PubMed
6. Linzer M, Yang EH, Estes NA, 3rd, Wang P, Vorperian VR, Kapoor WN. Diagnosing syncope. Part 1: Value of history, physical examination, and electrocardiography. Clinical Efficacy Assessment Project of the American College of Physicians. Ann Intern Med. 1997;126(12):989-996. doi: 10.7326/0003-4819-126-12-199706150-00012. PubMed
7. Linzer M, Yang EH, Estes NA, 3rd, Wang P, Vorperian VR, Kapoor WN. Diagnosing syncope. Part 2: Unexplained syncope. Clinical Efficacy Assessment Project of the American College of Physicians. Ann Intern Med. 1997;127(1):76-86. doi: 10.7326/0003-4819-127-1-199707010-00014. PubMed
8. Sun BC, Emond JA, Camargo CA, Jr. Direct medical costs of syncope-related hospitalizations in the United States. Am J Cardiol. 2005;95(5):668-671. doi: 10.1016/j.amjcard.2004.11.013. PubMed
9. American College of Cardiology Foundation. Appropriate Use Criteria Task F, American Society of Echocardiography, American Heart Association, et al. ACCF/ASE/AHA/ASNC/HFSA/HRS/SCAI/SCCM/SCCT/SCMR 2011 Appropriate Use Criteria for Echocardiography. A Report of the American College of Cardiology Foundation Appropriate Use Criteria Task Force, American Society of Echocardiography, American Heart Association, American Society of Nuclear Cardiology, Heart Failure Society of America, Heart Rhythm Society, Society for Cardiovascular Angiography and Interventions, Society of Critical Care Medicine, Society of Cardiovascular Computed Tomography, and Society for Cardiovascular Magnetic Resonance Endorsed by the American College of Chest Physicians. J Am Coll Cardiol. 2011;57(9):1126-1166. doi: 10.1016/j.echo.2010.12.008.
10. Maganti K, Rigolin VH, Sarano ME, Bonow RO. Valvular heart disease: diagnosis and management. Mayo Clin Proc. 2010;85(5):483-500. doi: 10.4065/mcp.2009.0706. PubMed
11. Mendu ML, McAvay G, Lampert R, Stoehr J, Tinetti ME. Yield of diagnostic tests in evaluating syncopal episodes in older patients. Arch Intern Med. 2009;169(14):1299-1305. doi: 10.1001/archinternmed.2009.204. PubMed
12. Madeira CL, Craig MJ, Donohoe A, Stephens JR. Things we do for no reason: echocardiogram in unselected patients with syncope. J Hosp Med. 2017;12(12):984–988. doi: http://dx.doi.org/10.12788/jhm.2864. PubMed
13. Han SK, Yeom SR, Lee SH, et al. Transthoracic echocardiogram in syncope patients with normal initial evaluation. Am J Emerg Med. 2017;35(2):281-284. doi: 10.1016/j.ajem.2016.10.078. PubMed
14. Chang NL, Shah P, Bajaj S, Virk H, Bikkina M, Shamoon F. Diagnostic yield of echocardiography in syncope patients with normal ECG. Cardiol Res Pract. 2016;2016:1251637. doi: http://dx.doi.org/10.1155/2016/1251637. PubMed
15. Anderson KL, Limkakeng A, Damuth E, Chandra A. Cardiac evaluation for structural abnormalities may not be required in patients presenting with syncope and a normal ECG result in an observation unit setting. Ann Emerg Med. 2012;60(4):478–84.e1. doi: 10.1016/j.annemergmed.2012.04.023. PubMed
16. Sarasin FP, Junod AF, Carballo D, Slama S, Unger PF, Louis-Simonet M. Role of echocardiography in the evaluation of syncope: a prospective study. Heart. 2002;88(4):363-367. doi: 10.1136/heart.88.4.363. PubMed
17. Recchia D, Barzilai B. Echocardiography in the evaluation of patients with syncope. J Gen Intern Med. 1995;10(12):649-655. doi: 10.1007/BF02602755. PubMed
18. Shen WK, Sheldon RS, Benditt DG, et al. ACC/AHA/HRS guideline for the evaluation and management of patients With syncope: executive summary: A report of the American College of Cardiology/American Heart Association Task Force on Clinical Practice Guidelines and the Heart Rhythm Society. J Am Coll Cardiol. 2017;2017(70(5)):620-663. PubMed
19. Chiu DT, Shapiro NI, Sun BC, Mottley JL, Grossman SA. Are echocardiography, telemetry, ambulatory electrocardiography monitoring, and cardiac enzymes in emergency department patients presenting with syncope useful tests? A preliminary investigation. J Emerg Med. 2014;47(1):113-118. doi: 10.1016/j.jemermed.2014.01.018. PubMed
20. Sun BC, Costantino G, Barbic F, et al. Priorities for emergency department syncope research. Ann Emerg Med. 2014;64(6):649–55.e2. doi: 10.1016/j.annemergmed.2014.04.014. PubMed
21. Sun BC, Derose SF, Liang LJ, et al. Predictors of 30-day serious events in older patients with syncope. Ann Emerg Med. 2009;54(6):769–778.e1-5. doi: 10.1016/j.annemergmed.2009.07.027. PubMed
22. Tibshirani R. Regression shrinkage and selection via the lasso. J R Stat Soc. 1996;58(1):267-288.
23. Friedman J, Hastie T, Tibshirani R. He Elements of Statistical Learning;Vol 1. New York, NY: Springer-Verlag; 2001. PubMed
24. Friedman J, Hastie T, Tibshirani R. Regularization paths for generalized linear models via coordinate descent. J Stat Softw. 2010;33(1):1-22. doi: 10.18637/jss.v033.i01. PubMed
25. James G, Witten D, Hastie T, Tibshirani R. An Introduction to Statistical Learning;Vol 112. New York, NY: Springer-Verlag; 2013.
26. Wilson EB. Probable inference, the law of succession, and statistical inference. J Am Stat Assoc. 1927 ;22(158):209-212. doi: 10.1080/01621459.1927.10502953. PubMed
27. R Core Team (2018). R: A language and environment for statistical computing. R Foundation for Statistical Computing, Vienna, Austria. URL http://www.R-project.org/.
28. Chew DP, Zeitz C, Worthley M, et al. Randomized comparison of high-sensitivity troponin reporting in undifferentiated chest pain assessment. Circ Cardiovasc Qual Outcomes. 2016;9(5):542-553. doi: 10.1161/CIRCOUTCOMES.115.002488. PubMed
29. Chen RS, Bivens MJ, Grossman SA. Diagnosis and management of valvular heart disease in emergency medicine. Emerg Med Clin North Am. 2011;29(4):801–10, vii. doi: 10.1016/j.emc.2011.08.001. PubMed
© 2018 Society of Hospital Medicine
Electronic Order Volume as a Meaningful Component in Estimating Patient Complexity and Resident Physician Workload
Resident physician workload has traditionally been measured by patient census.1,2 However, census and other volume-based metrics such as daily admissions may not accurately reflect workload due to variation in patient complexity. Relative value units (RVUs) are another commonly used marker of workload, but the validity of this metric relies on accurate coding, usually done by the attending physician, and is less directly related to resident physician workload. Because much of hospital-based medicine is mediated through the electronic health record (EHR), which can capture differences in patient complexity,3 electronic records could be harnessed to more comprehensively describe residents’ work. Current government estimates indicate that several hundred companies offer certified EHRs, thanks in large part to the Health Information Technology for Economic and Clinical Health (HITECH) Act of 2009, which aimed to promote adoption and meaningful use of health information technology.4, 5 These systems can collect important data about the usage and operating patterns of physicians, which may provide an insight into workload.6-8
Accurately measuring workload is important because of the direct link that has been drawn between physician workload and quality metrics. In a study of attending hospitalists, higher workload, as measured by patient census and RVUs, was associated with longer lengths of stay and higher costs of hospitalization.9 Another study among medical residents found that as daily admissions increased, length of stay, cost, and inpatient mortality appeared to rise.10 Although these studies used only volume-based workload metrics, the implication that high workload may negatively impact patient care hints at a possible trade-off between the two that should inform discussions of physician productivity.
In the current study, we examine whether data obtained from the EHR, particularly electronic order volume, could provide valuable information, in addition to patient volume, about resident physician workload. We first tested the feasibility and validity of using electronic order volume as an important component of clinical workload by examining the relationship between electronic order volume and well-established factors that are likely to increase the workload of residents, including patient level of care and severity of illness. Then, using order volume as a marker for workload, we sought to describe whether higher order volumes were associated with two discharge-related quality metrics, completion of a high-quality after-visit summary and timely discharge summary, postulating that quality metrics may suffer when residents are busier.
METHODS
Study Design and Setting
We performed a single-center retrospective cohort study of patients admitted to the internal medicine service at the University of California, San Francisco (UCSF) Medical Center between May 1, 2015 and July 31, 2016. UCSF is a 600-bed academic medical center, and the inpatient internal medicine teaching service manages an average daily census of 80-90 patients. Medicine teams care for patients on the general acute-care wards, the step-down units (for patients with higher acuity of care), and also patients in the intensive care unit (ICU). ICU patients are comanaged by general medicine teams and intensive care teams; internal medicine teams enter all electronic orders for ICU patients, except for orders for respiratory care or sedating medications. The inpatient internal medicine teaching service comprises eight teams each supervised by an attending physician, a senior resident (in the second or third year of residency training), two interns, and a third- and/or fourth-year medical student. Residents place all clinical orders and complete all clinical documentation through the EHR (Epic Systems, Verona, Wisconsin).11 Typically, the bulk of the orders and documentation, including discharge documentation, is performed by interns; however, the degree of senior resident involvement in these tasks is variable and team-dependent. In addition to the eight resident teams, there are also four attending hospitalist-only internal medicine teams, who manage a service of ~30-40 patients.
Study Population
Our study population comprised all hospitalized adults admitted to the eight resident-run teams on the internal medicine teaching service. Patients cared for by hospitalist-only teams were not included in this analysis. Because the focus of our study was on hospitalizations, individual patients may have been included multiple times over the course of the study. Hospitalizations were excluded if they did not have complete Medicare Severity-Diagnosis Related Group (MS-DRG) data,12 since this was used as our severity of illness marker. This occurred either because patients were not discharged by the end of the study period or because they had a length of stay of less than one day, because this metric was not assigned to these short-stay (observation) patients.
Data Collection
All electronic orders placed during the study period were obtained by extracting data from Epic’s Clarity database. Our EHR allows for the use of order sets; each order in these sets was counted individually, so that an order set with several orders would not be identified as one order. We identified the time and date that the order was placed, the ordering physician, the identity of the patient for which the order was placed, and the location of the patient when the order was placed, to determine the level of care (ICU, step-down, or general medicine unit). To track the composite volume of orders placed by resident teams, we matched each ordering physician to his or her corresponding resident team using our physician scheduling database, Amion (Spiral Software). We obtained team census by tabulating the total number of patients that a single resident team placed orders on over the course of a given calendar day. From billing data, we identified the MS-DRG weight that was assigned at the end of each hospitalization. Finally, we collected data on adherence to two discharge-related quality metrics to determine whether increased order volume was associated with decreased rates of adherence to these metrics. Using departmental patient-level quality improvement data, we determined whether each metric was met on discharge at the patient level. We also extracted patient-level demographic data, including age, sex, and insurance status, from this departmental quality improvement database.
Discharge Quality Outcome Metrics
We hypothesized that as the total daily electronic orders of a resident team increased, the rate of completion of two discharge-related quality metrics would decline due to the greater time constraints placed on the teams. The first metric we used was the completion of a high-quality after-visit summary (AVS), which has been described by the Centers for Medicare and Medicaid Services as part of its Meaningful Use Initiative.13 It was selected by the residents in our program as a particularly high-priority quality metric. Our institution specifically defines a “high-quality” AVS as including the following three components: a principal hospital problem, patient instructions, and follow-up information. The second discharge-related quality metric was the completion of a timely discharge summary, another measure recognized as a critical component in high-quality care.14 To be considered timely, the discharge summary had to be filed no later than 24 hours after the discharge order was entered into the EHR. This metric was more recently tracked by the internal medicine department and was not selected by the residents as a high-priority metric.
Statistical Analysis
To examine how the order volume per day changed throughout each sequential day of hospital admission, mean orders per hospital day with 95% CIs were plotted. We performed an aggregate analysis of all orders placed for each patient per day across three different levels of care (ICU, step-down, and general medicine). For each day of the study period, we summed all orders for all patients according to their location and divided by the number of total patients in each location to identify the average number of orders written for an ICU, step-down, and general medicine patient that day. We then calculated the mean daily orders for an ICU, step-down, and general medicine patient over the entire study period. We used ANOVA to test for statistically significant differences between the mean daily orders between these locations.
To examine the relationship between severity of illness and order volume, we performed an unadjusted patient-level analysis of orders per patient in the first three days of each hospitalization and stratified the data by the MS-DRG payment weight, which we divided into four quartiles. For each quartile, we calculated the mean number of orders placed in the first three days of admission and used ANOVA to test for statistically significant differences. We restricted the orders to the first three days of hospitalization instead of calculating mean orders per day of hospitalization because we postulated that the majority of orders were entered in these first few days and that with increasing length of stay (which we expected to occur with higher MS-DRG weight), the order volume becomes highly variable, which would tend to skew the mean orders per day.
We used multivariable logistic regression to determine whether the volume of electronic orders on the day of a given patient’s discharge, and also on the day before a given patient’s discharge, was a significant predictor of receiving a high-quality AVS. We adjusted for team census on the day of discharge, MS-DRG weight, age, sex, and insurance status. We then conducted a separate analysis of the association between electronic order volume and likelihood of completing a timely discharge summary among patients where discharge summary data were available. Logistic regression for each case was performed independently, so that team orders on the day prior to a patient’s discharge were not included in the model for the relationship between team orders on the day of a patient’s discharge and the discharge-related quality metric of interest, and vice versa, since including both in the model would be potentially disruptive given that orders on the day before and day of a patient’s discharge are likely correlated.
We also performed a subanalysis in which we restricted orders to only those placed during the daytime hours (7
IRB Approval
The study was approved by the UCSF Institutional Review Board and was granted a waiver of informed consent.
RESULTS
Population
We identified 7,296 eligible hospitalizations during the study period. After removing hospitalizations according to our exclusion criteria (Figure 1), there were 5,032 hospitalizations that were used in the analysis for which a total of 929,153 orders were written. The vast majority of patients received at least one order per day; fewer than 1% of encounter-days had zero associated orders. The top 10 discharge diagnoses identified in the cohort are listed in Appendix Table 1. A breakdown of orders by order type, across the entire cohort, is displayed in Appendix Table 2. The mean number of orders per patient per day of hospitalization is plotted in the Appendix Figure, which indicates that the number of orders is highest on the day of admission, decreases significantly after the first few days, and becomes increasingly variable with longer lengths of stay.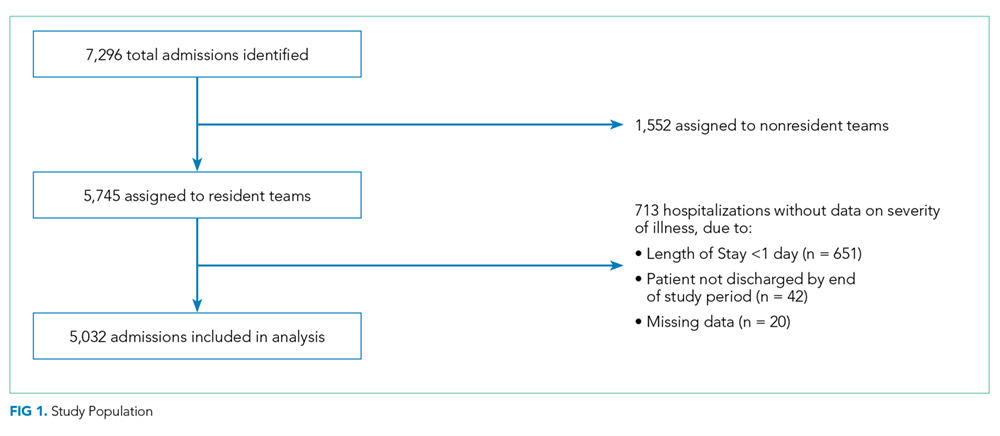
Patient Level of Care and Severity of Illness Metrics
Patients at a higher level of care had, on average, more orders entered per day. The mean order frequency was 40 orders per day for an ICU patient (standard deviation [SD] 13, range 13-134), 24 for a step-down patient (SD 6, range 11-48), and 19 for a general medicine unit patient (SD 3, range 10-31). The difference in mean daily orders was statistically significant (P < .001, Figure 2a).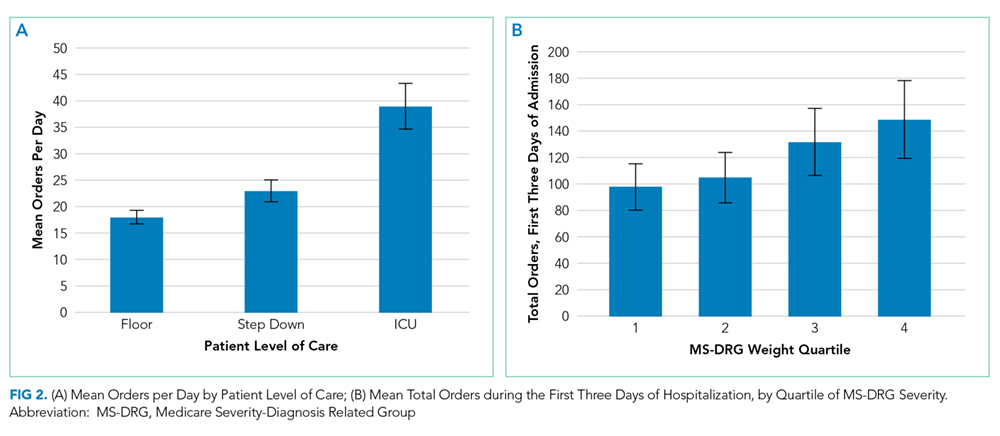
Orders also correlated with increasing severity of illness. Patients in the lowest quartile of MS-DRG weight received, on average, 98 orders in the first three days of hospitalization (SD 35, range 2-349), those in the second quartile received 105 orders (SD 38, range 10-380), those in the third quartile received 132 orders (SD 51, range 17-436), and those in the fourth and highest quartile received 149 orders (SD 59, range 32-482). Comparisons between each of these severity of illness categories were significant (P < .001, Figure 2b).
Discharge-Related Quality Metrics
The median number of orders per internal medicine team per day was 343 (IQR 261- 446). Of the 5,032 total discharged patients, 3,657 (73%) received a high-quality AVS on discharge. After controlling for team census, severity of illness, and demographic factors, there was no statistically significant association between total orders on the day of discharge and odds of receiving a high-quality AVS (OR 1.01; 95% CI 0.96-1.06), or between team orders placed the day prior to discharge and odds of receiving a high-quality AVS (OR 0.99; 95% CI 0.95-1.04; Table 1). When we restricted our analysis to orders placed during daytime hours (7 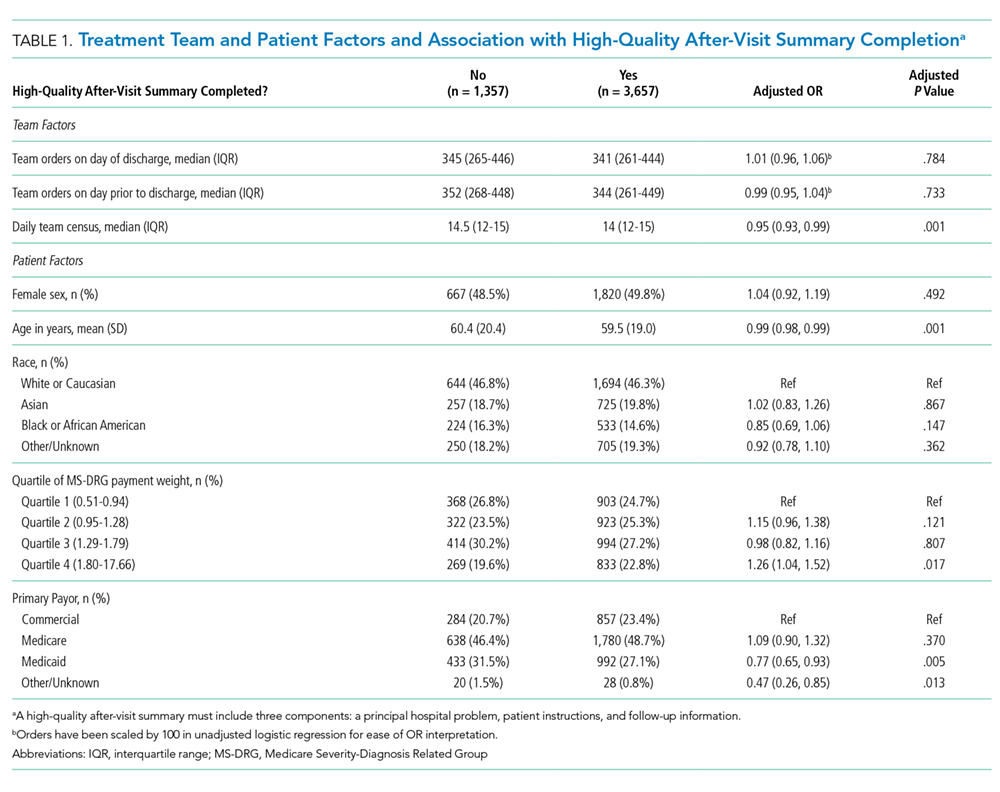
There were 3,835 patients for whom data on timing of discharge summary were available. Of these, 3,455 (91.2%) had a discharge summary completed within 24 hours. After controlling for team census, severity of illness, and demographic factors, there was no statistically significant association between total orders placed by the team on a patient’s day of discharge and odds of receiving a timely discharge summary (OR 0.96; 95% CI 0.88-1.05). However, patients were 12% less likely to receive a timely discharge summary for every 100 extra orders the team placed on the day prior to discharge (OR 0.88, 95% CI 0.82-0.95). Patients who received a timely discharge summary were cared for by teams who placed a median of 345 orders the day prior to their discharge, whereas those that did not receive a timely discharge summary were cared for by teams who placed a significantly higher number of orders (375) on the day prior to discharge (Table 2). When we restricted our analysis to only daytime orders, there were no significant changes in the findings (OR 1.00; 95% CI 0.88-1.14 for orders on the day of discharge; OR 0.84; 95% CI 0.75-0.95 for orders on the day prior to discharge).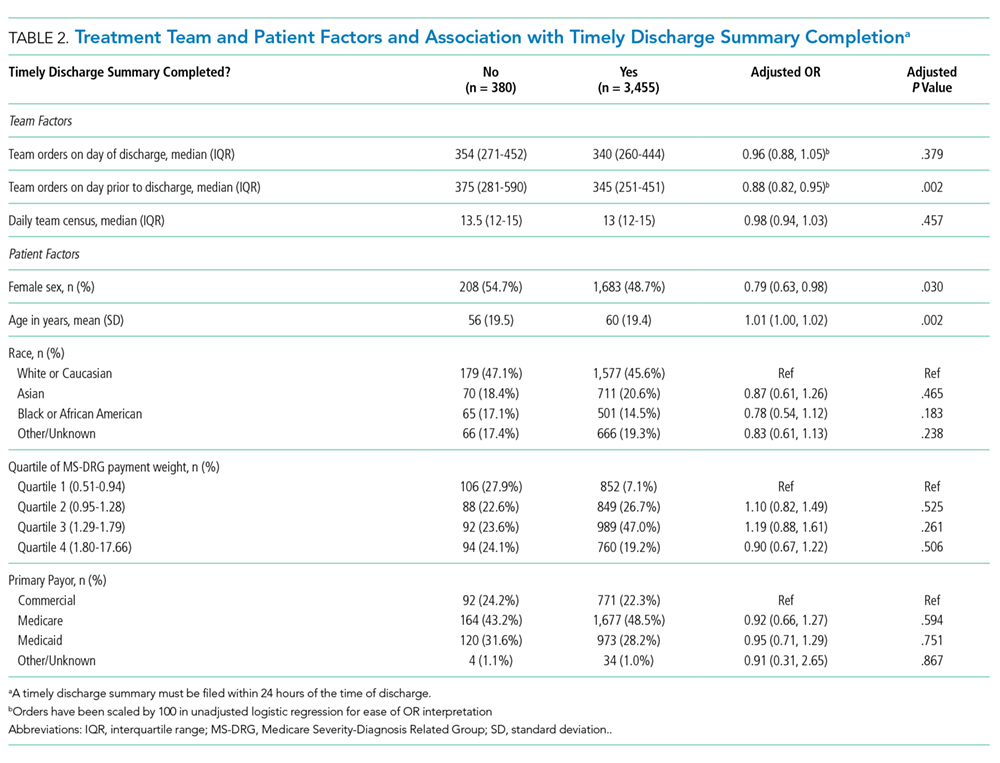
DISCUSSION
We found that electronic order volume may be a marker for patient complexity, which encompasses both level of care and severity of illness, and could be a marker of resident physician workload that harnesses readily available data from an EHR. Recent time-motion studies of internal medicine residents indicate that the majority of trainees’ time is spent on computers, engaged in indirect patient care activities such as reading electronic charts, entering electronic orders, and writing computerized notes.15-18 Capturing these tasks through metrics such as electronic order volume, as we did in this study, can provide valuable insights into resident physician workflow.
We found that ICU patients received more than twice as many orders per day than did general acute care-level patients. Furthermore, we found that patients whose hospitalizations fell into the highest MS-DRG weight quartile received approximately 50% more orders during the first three days of admission compared to that of patients whose hospitalizations fell into the lowest quartile. This strong association indicates that electronic order volume could provide meaningful additional information, in concert with other factors such as census, to describe resident physician workload.
We did not find that our workload measure was significantly associated with high-quality AVS completion. There are several possible explanations for this finding. First, adherence to this quality metric may be independent of workload, possibly because it is highly prioritized by residents at our institution. Second, adherence may only be impacted at levels of workload greater than what was experienced by the residents in our study. Finally, electronic order volume may not encompass enough of total workload to be reliably representative of resident work. However, the tight correlation between electronic order volume with severity of illness and level of care, in conjunction with the finding that patients were less likely to receive a timely discharge summary when workload was high on the day prior to a patient’s discharge, suggests that electronic order volume does indeed encompass a meaningful component of workload, and that with higher workload, adherence to some quality metrics may decline. We found that patients who received a timely discharge summary were discharged by teams who entered 30 fewer orders on the day before discharge compared with patients who did not receive a timely discharge summary. In addition to being statistically significant, it is also likely that this difference is clinically significant, although a determination of clinical significance is outside the scope of this study. Further exploration into the relationship between order volume and other quality metrics that are perhaps more sensitive to workload would be interesting.
The primary strength of our study is in how it demonstrates that EHRs can be harnessed to provide additional insights into clinical workload in a quantifiable and automated manner. Although there are a wide range of EHRs currently in use across the country, the capability to track electronic orders is common and could therefore be used broadly across institutions, with tailoring and standardization specific to each site. This technique is similar to that used by prior investigators who characterized the workload of pediatric residents by orders entered and notes written in the electronic medical record.19 However, our study is unique, in that we explored the relationship between electronic order volume and patient-level severity metrics as well as discharge-related quality metrics.
Our study is limited by several factors. When conceptualizing resident workload, several other elements that contribute to a sense of “busyness” may be independent of electronic orders and were not measured in our study.20 These include communication factors (such as language discordance, discussion with consulting services, and difficult end-of-life discussions), environmental factors (such as geographic localization), resident physician team factors (such as competing clinical or educational responsibilities), timing (in terms of day of week as well as time of year, since residents in July likely feel “busier” than residents in May), and ultimate discharge destination for patients (those going to a skilled nursing facility may require discharge documentation more urgently). Additionally, we chose to focus on the workload of resident teams, as represented by team orders, as opposed to individual work, which may be more directly correlated to our outcomes of interest, completion of a high-quality AVS, and timely discharge summary, which are usually performed by individuals.
Furthermore, we did not measure the relationship between our objective measure of workload and clinical endpoints. Instead, we chose to focus on process measures because they are less likely to be confounded by clinical factors independent of physician workload.21 Future studies should also consider obtaining direct resident-level measures of “busyness” or burnout, or other resident-centered endpoints, such as whether residents left the hospital at times consistent with duty hour regulations or whether they were able to attend educational conferences.
These limitations pose opportunities for further efforts to more comprehensively characterize clinical workload. Additional research is needed to understand and quantify the impact of patient, physician, and environmental factors that are not reflected by electronic order volume. Furthermore, an exploration of other electronic surrogates for clinical workload, such as paging volume and other EHR-derived data points, could also prove valuable in further describing the clinical workload. Future studies should also examine whether there is a relationship between these novel markers of workload and further outcomes, including both process measures and clinical endpoints.
CONCLUSIONS
Electronic order volume may provide valuable additional information for estimating the workload of resident physicians caring for hospitalized patients. Further investigation to determine whether the statistically significant differences identified in this study are clinically significant, how the technique used in this work may be applied to different EHRs, an examination of other EHR-derived metrics that may represent workload, and an exploration of additional patient-centered outcomes may be warranted.
Disclosures
Rajkomar reports personal fees from Google LLC, outside the submitted work. Dr. Khanna reports that during the conduct of the study, his salary, and the development of CareWeb (a communication platform that includes a smartphone-based paging application in use in several inpatient clinical units at University of California, San Francisco [UCSF] Medical Center) were supported by funding from the Center for Digital Health Innovation at UCSF. The CareWeb software has been licensed by Voalte.
Disclaimer
The views expressed in the submitted article are of the authors and not an official position of the institution.
1. Lurie JD, Wachter RM. Hospitalist staffing requirements. Eff Clin Pract. 1999;2(3):126-30. PubMed
2. Wachter RM. Hospitalist workload: The search for the magic number. JAMA Intern Med. 2014;174(5):794-795. doi: 10.1001/jamainternmed.2014.18. PubMed
3. Adler-Milstein J, DesRoches CM, Kralovec P, et al. Electronic health record adoption in US hospitals: progress continues, but challenges persist. Health Aff (Millwood). 2015;34(12):2174-2180. doi: 10.1377/hlthaff.2015.0992. PubMed
4. The Office of the National Coordinator for Health Information Technology, Health IT Dashboard. [cited 2018 April 4]. https://dashboard.healthit.gov/quickstats/quickstats.php Accessed June 28, 2018.
5. Index for Excerpts from the American Recovery and Reinvestment Act of 2009. Health Information Technology (HITECH) Act 2009. p. 112-164.
6. van der Sijs H, Aarts J, Vulto A, Berg M. Overriding of drug safety alerts in computerized physician order entry. J Am Med Inform Assoc. 2006;13(2):138-147. doi: 10.1197/jamia.M1809. PubMed
7. Ancker JS, Kern LM1, Edwards A, et al. How is the electronic health record being used? Use of EHR data to assess physician-level variability in technology use. J Am Med Inform Assoc. 2014;21(6):1001-1008. doi: 10.1136/amiajnl-2013-002627. PubMed
8. Hendey GW, Barth BE, Soliz T. Overnight and postcall errors in medication orders. Acad Emerg Med. 2005;12(7):629-634. doi: 10.1197/j.aem.2005.02.009. PubMed
9. Elliott DJ, Young RS2, Brice J3, Aguiar R4, Kolm P. Effect of hospitalist workload on the quality and efficiency of care. JAMA Intern Med. 2014;174(5):786-793. doi: 10.1001/jamainternmed.2014.300. PubMed
10. Ong M, Bostrom A, Vidyarthi A, McCulloch C, Auerbach A. House staff team workload and organization effects on patient outcomes in an academic general internal medicine inpatient service. Arch Intern Med. 2007;167(1):47-52. doi: 10.1001/archinte.167.1.47. PubMed
11. Epic Systems. [cited 2017 March 28]; Available from: http://www.epic.com/. Accessed June 28, 2018.
12. MS-DRG Classifications and software. https://www.cms.gov/Medicare/Medicare-Fee-for-Service-Payment/AcuteInpatientPPS/MS-DRG-Classifications-and-Software.html. Accessed June 28, 2018.
13. Hummel J, Evans P. Providing Clinical Summaries to Patients after Each Office Visit: A Technical Guide. [cited 2017 March 27]. https://www.healthit.gov/sites/default/files/measure-tools/avs-tech-guide.pdf. Accessed June 28, 2018.
14. Haycock M, Stuttaford L, Ruscombe-King O, Barker Z, Callaghan K, Davis T. Improving the percentage of electronic discharge summaries completed within 24 hours of discharge. BMJ Qual Improv Rep. 2014;3(1) pii: u205963.w2604. doi: 10.1136/bmjquality.u205963.w2604. PubMed
15. Block L, Habicht R, Wu AW, et al. In the wake of the 2003 and 2011 duty hours regulations, how do internal medicine interns spend their time? J Gen Intern Med. 2013;28(8):1042-1047. doi: 10.1007/s11606-013-2376-6. PubMed
16. Wenger N, Méan M, Castioni J, Marques-Vidal P, Waeber G, Garnier A. Allocation of internal medicine resident time in a Swiss hospital: a time and motion study of day and evening shifts. Ann Intern Med. 2017;166(8):579-586. doi: 10.7326/M16-2238. PubMed
17. Mamykina L, Vawdrey DK, Hripcsak G. How do residents spend their shift time? A time and motion study with a particular focus on the use of computers. Acad Med. 2016;91(6):827-832. doi: 10.1097/ACM.0000000000001148. PubMed
18. Fletcher KE, Visotcky AM, Slagle JM, Tarima S, Weinger MB, Schapira MM. The composition of intern work while on call. J Gen Intern Med. 2012;27(11):1432-1437. doi: 10.1007/s11606-012-2120-7. PubMed
19. Was A, Blankenburg R, Park KT. Pediatric resident workload intensity and variability. Pediatrics 2016;138(1):e20154371. doi: 10.1542/peds.2015-4371. PubMed
20. Michtalik HJ, Pronovost PJ, Marsteller JA, Spetz J, Brotman DJ. Developing a model for attending physician workload and outcomes. JAMA Intern Med. 2013;173(11):1026-1028. doi: 10.1001/jamainternmed.2013.405. PubMed
21. Mant J. Process versus outcome indicators in the assessment of quality of health care. Int J Qual Health Care. 2001;13(6):475-480. doi: 10.1093/intqhc/13.6.475. PubMed
Resident physician workload has traditionally been measured by patient census.1,2 However, census and other volume-based metrics such as daily admissions may not accurately reflect workload due to variation in patient complexity. Relative value units (RVUs) are another commonly used marker of workload, but the validity of this metric relies on accurate coding, usually done by the attending physician, and is less directly related to resident physician workload. Because much of hospital-based medicine is mediated through the electronic health record (EHR), which can capture differences in patient complexity,3 electronic records could be harnessed to more comprehensively describe residents’ work. Current government estimates indicate that several hundred companies offer certified EHRs, thanks in large part to the Health Information Technology for Economic and Clinical Health (HITECH) Act of 2009, which aimed to promote adoption and meaningful use of health information technology.4, 5 These systems can collect important data about the usage and operating patterns of physicians, which may provide an insight into workload.6-8
Accurately measuring workload is important because of the direct link that has been drawn between physician workload and quality metrics. In a study of attending hospitalists, higher workload, as measured by patient census and RVUs, was associated with longer lengths of stay and higher costs of hospitalization.9 Another study among medical residents found that as daily admissions increased, length of stay, cost, and inpatient mortality appeared to rise.10 Although these studies used only volume-based workload metrics, the implication that high workload may negatively impact patient care hints at a possible trade-off between the two that should inform discussions of physician productivity.
In the current study, we examine whether data obtained from the EHR, particularly electronic order volume, could provide valuable information, in addition to patient volume, about resident physician workload. We first tested the feasibility and validity of using electronic order volume as an important component of clinical workload by examining the relationship between electronic order volume and well-established factors that are likely to increase the workload of residents, including patient level of care and severity of illness. Then, using order volume as a marker for workload, we sought to describe whether higher order volumes were associated with two discharge-related quality metrics, completion of a high-quality after-visit summary and timely discharge summary, postulating that quality metrics may suffer when residents are busier.
METHODS
Study Design and Setting
We performed a single-center retrospective cohort study of patients admitted to the internal medicine service at the University of California, San Francisco (UCSF) Medical Center between May 1, 2015 and July 31, 2016. UCSF is a 600-bed academic medical center, and the inpatient internal medicine teaching service manages an average daily census of 80-90 patients. Medicine teams care for patients on the general acute-care wards, the step-down units (for patients with higher acuity of care), and also patients in the intensive care unit (ICU). ICU patients are comanaged by general medicine teams and intensive care teams; internal medicine teams enter all electronic orders for ICU patients, except for orders for respiratory care or sedating medications. The inpatient internal medicine teaching service comprises eight teams each supervised by an attending physician, a senior resident (in the second or third year of residency training), two interns, and a third- and/or fourth-year medical student. Residents place all clinical orders and complete all clinical documentation through the EHR (Epic Systems, Verona, Wisconsin).11 Typically, the bulk of the orders and documentation, including discharge documentation, is performed by interns; however, the degree of senior resident involvement in these tasks is variable and team-dependent. In addition to the eight resident teams, there are also four attending hospitalist-only internal medicine teams, who manage a service of ~30-40 patients.
Study Population
Our study population comprised all hospitalized adults admitted to the eight resident-run teams on the internal medicine teaching service. Patients cared for by hospitalist-only teams were not included in this analysis. Because the focus of our study was on hospitalizations, individual patients may have been included multiple times over the course of the study. Hospitalizations were excluded if they did not have complete Medicare Severity-Diagnosis Related Group (MS-DRG) data,12 since this was used as our severity of illness marker. This occurred either because patients were not discharged by the end of the study period or because they had a length of stay of less than one day, because this metric was not assigned to these short-stay (observation) patients.
Data Collection
All electronic orders placed during the study period were obtained by extracting data from Epic’s Clarity database. Our EHR allows for the use of order sets; each order in these sets was counted individually, so that an order set with several orders would not be identified as one order. We identified the time and date that the order was placed, the ordering physician, the identity of the patient for which the order was placed, and the location of the patient when the order was placed, to determine the level of care (ICU, step-down, or general medicine unit). To track the composite volume of orders placed by resident teams, we matched each ordering physician to his or her corresponding resident team using our physician scheduling database, Amion (Spiral Software). We obtained team census by tabulating the total number of patients that a single resident team placed orders on over the course of a given calendar day. From billing data, we identified the MS-DRG weight that was assigned at the end of each hospitalization. Finally, we collected data on adherence to two discharge-related quality metrics to determine whether increased order volume was associated with decreased rates of adherence to these metrics. Using departmental patient-level quality improvement data, we determined whether each metric was met on discharge at the patient level. We also extracted patient-level demographic data, including age, sex, and insurance status, from this departmental quality improvement database.
Discharge Quality Outcome Metrics
We hypothesized that as the total daily electronic orders of a resident team increased, the rate of completion of two discharge-related quality metrics would decline due to the greater time constraints placed on the teams. The first metric we used was the completion of a high-quality after-visit summary (AVS), which has been described by the Centers for Medicare and Medicaid Services as part of its Meaningful Use Initiative.13 It was selected by the residents in our program as a particularly high-priority quality metric. Our institution specifically defines a “high-quality” AVS as including the following three components: a principal hospital problem, patient instructions, and follow-up information. The second discharge-related quality metric was the completion of a timely discharge summary, another measure recognized as a critical component in high-quality care.14 To be considered timely, the discharge summary had to be filed no later than 24 hours after the discharge order was entered into the EHR. This metric was more recently tracked by the internal medicine department and was not selected by the residents as a high-priority metric.
Statistical Analysis
To examine how the order volume per day changed throughout each sequential day of hospital admission, mean orders per hospital day with 95% CIs were plotted. We performed an aggregate analysis of all orders placed for each patient per day across three different levels of care (ICU, step-down, and general medicine). For each day of the study period, we summed all orders for all patients according to their location and divided by the number of total patients in each location to identify the average number of orders written for an ICU, step-down, and general medicine patient that day. We then calculated the mean daily orders for an ICU, step-down, and general medicine patient over the entire study period. We used ANOVA to test for statistically significant differences between the mean daily orders between these locations.
To examine the relationship between severity of illness and order volume, we performed an unadjusted patient-level analysis of orders per patient in the first three days of each hospitalization and stratified the data by the MS-DRG payment weight, which we divided into four quartiles. For each quartile, we calculated the mean number of orders placed in the first three days of admission and used ANOVA to test for statistically significant differences. We restricted the orders to the first three days of hospitalization instead of calculating mean orders per day of hospitalization because we postulated that the majority of orders were entered in these first few days and that with increasing length of stay (which we expected to occur with higher MS-DRG weight), the order volume becomes highly variable, which would tend to skew the mean orders per day.
We used multivariable logistic regression to determine whether the volume of electronic orders on the day of a given patient’s discharge, and also on the day before a given patient’s discharge, was a significant predictor of receiving a high-quality AVS. We adjusted for team census on the day of discharge, MS-DRG weight, age, sex, and insurance status. We then conducted a separate analysis of the association between electronic order volume and likelihood of completing a timely discharge summary among patients where discharge summary data were available. Logistic regression for each case was performed independently, so that team orders on the day prior to a patient’s discharge were not included in the model for the relationship between team orders on the day of a patient’s discharge and the discharge-related quality metric of interest, and vice versa, since including both in the model would be potentially disruptive given that orders on the day before and day of a patient’s discharge are likely correlated.
We also performed a subanalysis in which we restricted orders to only those placed during the daytime hours (7
IRB Approval
The study was approved by the UCSF Institutional Review Board and was granted a waiver of informed consent.
RESULTS
Population
We identified 7,296 eligible hospitalizations during the study period. After removing hospitalizations according to our exclusion criteria (Figure 1), there were 5,032 hospitalizations that were used in the analysis for which a total of 929,153 orders were written. The vast majority of patients received at least one order per day; fewer than 1% of encounter-days had zero associated orders. The top 10 discharge diagnoses identified in the cohort are listed in Appendix Table 1. A breakdown of orders by order type, across the entire cohort, is displayed in Appendix Table 2. The mean number of orders per patient per day of hospitalization is plotted in the Appendix Figure, which indicates that the number of orders is highest on the day of admission, decreases significantly after the first few days, and becomes increasingly variable with longer lengths of stay.
Patient Level of Care and Severity of Illness Metrics
Patients at a higher level of care had, on average, more orders entered per day. The mean order frequency was 40 orders per day for an ICU patient (standard deviation [SD] 13, range 13-134), 24 for a step-down patient (SD 6, range 11-48), and 19 for a general medicine unit patient (SD 3, range 10-31). The difference in mean daily orders was statistically significant (P < .001, Figure 2a).
Orders also correlated with increasing severity of illness. Patients in the lowest quartile of MS-DRG weight received, on average, 98 orders in the first three days of hospitalization (SD 35, range 2-349), those in the second quartile received 105 orders (SD 38, range 10-380), those in the third quartile received 132 orders (SD 51, range 17-436), and those in the fourth and highest quartile received 149 orders (SD 59, range 32-482). Comparisons between each of these severity of illness categories were significant (P < .001, Figure 2b).
Discharge-Related Quality Metrics
The median number of orders per internal medicine team per day was 343 (IQR 261- 446). Of the 5,032 total discharged patients, 3,657 (73%) received a high-quality AVS on discharge. After controlling for team census, severity of illness, and demographic factors, there was no statistically significant association between total orders on the day of discharge and odds of receiving a high-quality AVS (OR 1.01; 95% CI 0.96-1.06), or between team orders placed the day prior to discharge and odds of receiving a high-quality AVS (OR 0.99; 95% CI 0.95-1.04; Table 1). When we restricted our analysis to orders placed during daytime hours (7
There were 3,835 patients for whom data on timing of discharge summary were available. Of these, 3,455 (91.2%) had a discharge summary completed within 24 hours. After controlling for team census, severity of illness, and demographic factors, there was no statistically significant association between total orders placed by the team on a patient’s day of discharge and odds of receiving a timely discharge summary (OR 0.96; 95% CI 0.88-1.05). However, patients were 12% less likely to receive a timely discharge summary for every 100 extra orders the team placed on the day prior to discharge (OR 0.88, 95% CI 0.82-0.95). Patients who received a timely discharge summary were cared for by teams who placed a median of 345 orders the day prior to their discharge, whereas those that did not receive a timely discharge summary were cared for by teams who placed a significantly higher number of orders (375) on the day prior to discharge (Table 2). When we restricted our analysis to only daytime orders, there were no significant changes in the findings (OR 1.00; 95% CI 0.88-1.14 for orders on the day of discharge; OR 0.84; 95% CI 0.75-0.95 for orders on the day prior to discharge).
DISCUSSION
We found that electronic order volume may be a marker for patient complexity, which encompasses both level of care and severity of illness, and could be a marker of resident physician workload that harnesses readily available data from an EHR. Recent time-motion studies of internal medicine residents indicate that the majority of trainees’ time is spent on computers, engaged in indirect patient care activities such as reading electronic charts, entering electronic orders, and writing computerized notes.15-18 Capturing these tasks through metrics such as electronic order volume, as we did in this study, can provide valuable insights into resident physician workflow.
We found that ICU patients received more than twice as many orders per day than did general acute care-level patients. Furthermore, we found that patients whose hospitalizations fell into the highest MS-DRG weight quartile received approximately 50% more orders during the first three days of admission compared to that of patients whose hospitalizations fell into the lowest quartile. This strong association indicates that electronic order volume could provide meaningful additional information, in concert with other factors such as census, to describe resident physician workload.
We did not find that our workload measure was significantly associated with high-quality AVS completion. There are several possible explanations for this finding. First, adherence to this quality metric may be independent of workload, possibly because it is highly prioritized by residents at our institution. Second, adherence may only be impacted at levels of workload greater than what was experienced by the residents in our study. Finally, electronic order volume may not encompass enough of total workload to be reliably representative of resident work. However, the tight correlation between electronic order volume with severity of illness and level of care, in conjunction with the finding that patients were less likely to receive a timely discharge summary when workload was high on the day prior to a patient’s discharge, suggests that electronic order volume does indeed encompass a meaningful component of workload, and that with higher workload, adherence to some quality metrics may decline. We found that patients who received a timely discharge summary were discharged by teams who entered 30 fewer orders on the day before discharge compared with patients who did not receive a timely discharge summary. In addition to being statistically significant, it is also likely that this difference is clinically significant, although a determination of clinical significance is outside the scope of this study. Further exploration into the relationship between order volume and other quality metrics that are perhaps more sensitive to workload would be interesting.
The primary strength of our study is in how it demonstrates that EHRs can be harnessed to provide additional insights into clinical workload in a quantifiable and automated manner. Although there are a wide range of EHRs currently in use across the country, the capability to track electronic orders is common and could therefore be used broadly across institutions, with tailoring and standardization specific to each site. This technique is similar to that used by prior investigators who characterized the workload of pediatric residents by orders entered and notes written in the electronic medical record.19 However, our study is unique, in that we explored the relationship between electronic order volume and patient-level severity metrics as well as discharge-related quality metrics.
Our study is limited by several factors. When conceptualizing resident workload, several other elements that contribute to a sense of “busyness” may be independent of electronic orders and were not measured in our study.20 These include communication factors (such as language discordance, discussion with consulting services, and difficult end-of-life discussions), environmental factors (such as geographic localization), resident physician team factors (such as competing clinical or educational responsibilities), timing (in terms of day of week as well as time of year, since residents in July likely feel “busier” than residents in May), and ultimate discharge destination for patients (those going to a skilled nursing facility may require discharge documentation more urgently). Additionally, we chose to focus on the workload of resident teams, as represented by team orders, as opposed to individual work, which may be more directly correlated to our outcomes of interest, completion of a high-quality AVS, and timely discharge summary, which are usually performed by individuals.
Furthermore, we did not measure the relationship between our objective measure of workload and clinical endpoints. Instead, we chose to focus on process measures because they are less likely to be confounded by clinical factors independent of physician workload.21 Future studies should also consider obtaining direct resident-level measures of “busyness” or burnout, or other resident-centered endpoints, such as whether residents left the hospital at times consistent with duty hour regulations or whether they were able to attend educational conferences.
These limitations pose opportunities for further efforts to more comprehensively characterize clinical workload. Additional research is needed to understand and quantify the impact of patient, physician, and environmental factors that are not reflected by electronic order volume. Furthermore, an exploration of other electronic surrogates for clinical workload, such as paging volume and other EHR-derived data points, could also prove valuable in further describing the clinical workload. Future studies should also examine whether there is a relationship between these novel markers of workload and further outcomes, including both process measures and clinical endpoints.
CONCLUSIONS
Electronic order volume may provide valuable additional information for estimating the workload of resident physicians caring for hospitalized patients. Further investigation to determine whether the statistically significant differences identified in this study are clinically significant, how the technique used in this work may be applied to different EHRs, an examination of other EHR-derived metrics that may represent workload, and an exploration of additional patient-centered outcomes may be warranted.
Disclosures
Rajkomar reports personal fees from Google LLC, outside the submitted work. Dr. Khanna reports that during the conduct of the study, his salary, and the development of CareWeb (a communication platform that includes a smartphone-based paging application in use in several inpatient clinical units at University of California, San Francisco [UCSF] Medical Center) were supported by funding from the Center for Digital Health Innovation at UCSF. The CareWeb software has been licensed by Voalte.
Disclaimer
The views expressed in the submitted article are of the authors and not an official position of the institution.
1. Lurie JD, Wachter RM. Hospitalist staffing requirements. Eff Clin Pract. 1999;2(3):126-30. PubMed
2. Wachter RM. Hospitalist workload: The search for the magic number. JAMA Intern Med. 2014;174(5):794-795. doi: 10.1001/jamainternmed.2014.18. PubMed
3. Adler-Milstein J, DesRoches CM, Kralovec P, et al. Electronic health record adoption in US hospitals: progress continues, but challenges persist. Health Aff (Millwood). 2015;34(12):2174-2180. doi: 10.1377/hlthaff.2015.0992. PubMed
4. The Office of the National Coordinator for Health Information Technology, Health IT Dashboard. [cited 2018 April 4]. https://dashboard.healthit.gov/quickstats/quickstats.php Accessed June 28, 2018.
5. Index for Excerpts from the American Recovery and Reinvestment Act of 2009. Health Information Technology (HITECH) Act 2009. p. 112-164.
6. van der Sijs H, Aarts J, Vulto A, Berg M. Overriding of drug safety alerts in computerized physician order entry. J Am Med Inform Assoc. 2006;13(2):138-147. doi: 10.1197/jamia.M1809. PubMed
7. Ancker JS, Kern LM1, Edwards A, et al. How is the electronic health record being used? Use of EHR data to assess physician-level variability in technology use. J Am Med Inform Assoc. 2014;21(6):1001-1008. doi: 10.1136/amiajnl-2013-002627. PubMed
8. Hendey GW, Barth BE, Soliz T. Overnight and postcall errors in medication orders. Acad Emerg Med. 2005;12(7):629-634. doi: 10.1197/j.aem.2005.02.009. PubMed
9. Elliott DJ, Young RS2, Brice J3, Aguiar R4, Kolm P. Effect of hospitalist workload on the quality and efficiency of care. JAMA Intern Med. 2014;174(5):786-793. doi: 10.1001/jamainternmed.2014.300. PubMed
10. Ong M, Bostrom A, Vidyarthi A, McCulloch C, Auerbach A. House staff team workload and organization effects on patient outcomes in an academic general internal medicine inpatient service. Arch Intern Med. 2007;167(1):47-52. doi: 10.1001/archinte.167.1.47. PubMed
11. Epic Systems. [cited 2017 March 28]; Available from: http://www.epic.com/. Accessed June 28, 2018.
12. MS-DRG Classifications and software. https://www.cms.gov/Medicare/Medicare-Fee-for-Service-Payment/AcuteInpatientPPS/MS-DRG-Classifications-and-Software.html. Accessed June 28, 2018.
13. Hummel J, Evans P. Providing Clinical Summaries to Patients after Each Office Visit: A Technical Guide. [cited 2017 March 27]. https://www.healthit.gov/sites/default/files/measure-tools/avs-tech-guide.pdf. Accessed June 28, 2018.
14. Haycock M, Stuttaford L, Ruscombe-King O, Barker Z, Callaghan K, Davis T. Improving the percentage of electronic discharge summaries completed within 24 hours of discharge. BMJ Qual Improv Rep. 2014;3(1) pii: u205963.w2604. doi: 10.1136/bmjquality.u205963.w2604. PubMed
15. Block L, Habicht R, Wu AW, et al. In the wake of the 2003 and 2011 duty hours regulations, how do internal medicine interns spend their time? J Gen Intern Med. 2013;28(8):1042-1047. doi: 10.1007/s11606-013-2376-6. PubMed
16. Wenger N, Méan M, Castioni J, Marques-Vidal P, Waeber G, Garnier A. Allocation of internal medicine resident time in a Swiss hospital: a time and motion study of day and evening shifts. Ann Intern Med. 2017;166(8):579-586. doi: 10.7326/M16-2238. PubMed
17. Mamykina L, Vawdrey DK, Hripcsak G. How do residents spend their shift time? A time and motion study with a particular focus on the use of computers. Acad Med. 2016;91(6):827-832. doi: 10.1097/ACM.0000000000001148. PubMed
18. Fletcher KE, Visotcky AM, Slagle JM, Tarima S, Weinger MB, Schapira MM. The composition of intern work while on call. J Gen Intern Med. 2012;27(11):1432-1437. doi: 10.1007/s11606-012-2120-7. PubMed
19. Was A, Blankenburg R, Park KT. Pediatric resident workload intensity and variability. Pediatrics 2016;138(1):e20154371. doi: 10.1542/peds.2015-4371. PubMed
20. Michtalik HJ, Pronovost PJ, Marsteller JA, Spetz J, Brotman DJ. Developing a model for attending physician workload and outcomes. JAMA Intern Med. 2013;173(11):1026-1028. doi: 10.1001/jamainternmed.2013.405. PubMed
21. Mant J. Process versus outcome indicators in the assessment of quality of health care. Int J Qual Health Care. 2001;13(6):475-480. doi: 10.1093/intqhc/13.6.475. PubMed
You Can’t Have It All: The Experience of Academic Hospitalists During Pregnancy, Parental Leave, and Return to Work
Despite recent advances made in medicine, gender-based disparities persist.1-3 In particular, women with children have barriers to career advancement and show evidence of slower career advancement.1,2 Multiple challenges for working women experiencing motherhood have been described. In academic medicine in the United States, women have limited access to paid parental leave.4-6 For women who choose to breastfeed, there is limited time, space, and support available for breastfeeding.7 Furthermore, sleep deprivation in the postpartum period significantly impacts the ability to function at work.8
Hospital medicine is a unique specialty as it comprises 47% women, 80% of whom are aged less than 40 years, suggesting that a large portion are women of childbearing age.9 The field poses known challenges to this population, including shift work, atypical schedules, and unpredictable hours. We conducted a descriptive qualitative study to improve our understanding of the experience of female academic hospitalists who have experienced pregnancy, parental leave, and the return to work as faculty. Our goal was to both explore the challenges to undergoing this experience and discover solutions to support female academic hospitalists.
METHODS
Study Design
We conducted a qualitative descriptive study of female hospitalists recruited from academic institutions represented in Society of Hospital Medicine (SHM) committees. Interviews were conducted between November 2017 and February 2018. Participants completed an informed consent and a demographic survey prior to the interview. Each interview lasted approximately 30 minutes; discussions were recorded on digital records and transcribed verbatim. This protocol was reviewed and granted exemption by the Institutional Review Board at the University of Colorado.
Population
We recruited participants from a selection of hospital medicine groups nationally, chosen from SHM committee representation. A purposeful snowball approach was used to identify hospitalists from representative programs and seek their recommendation for hospitalists from other targeted programs. Ten hospitalists were approached by e-mail to determine their interest in participation, and all of them agreed to participate. Each participant experienced new parenthood within the last seven years.
Framework
We constructed our interview to represent the following timeline associated with having children as it pertains to a hospitalist position: pregnancy, parental leave, and the return to work. The interview guide was structured to invoke the positive aspects, challenges, and solutions within each domain (Appendix 1).
Analysis
Codes were inductively developed from the interview data by a team of three board-certified internal medicine physicians (E.G., A.M., and C.J.), one of whom had prior training and experience with qualitative interviews and analysis (C.J.). Among the coders, two (E.G. and A.M.) conducted the semistructured interviews. Code disparities were reconciled by team consensus, where the primary coder facilitated the discussions. Themes were developed inductively from the codes, and the analysis was completed using a team-based iterative approach that was facilitated using ATLAS.ti.10 Thematic saturation was achieved. This study was approved by the Colorado Multiple Institutional Review Board.
RESULTS
The demographics and the characteristics of the hospital medicine group are shown in Table 1. Although we asked questions about both the positive and challenging aspects of the experience of parenthood, the interviews tended to focus more on the challenges faced and on areas for optimization.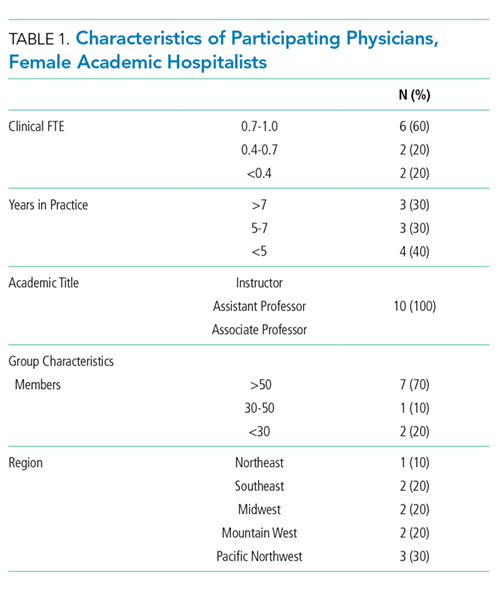
Paid Parental leave
Most of the participants described inadequate paid parental leave, with minimal transparency in the processes for ensuring time off following the birth of their child, resulting in “haggling” with bosses, human resources, and the administrative staff. Rarely was a formal parental leave policy in place. Once a parental leave plan was established, several women reported the financial burden associated with a leave that was partially, or fully, unpaid.
“All of my leave was unpaid. .. managed to finagle short-term disability into paying for it… the system was otherwise set up to screw me financially.”
For the three women who did experience sufficient paid parental leave, they recognized the financial and emotional benefit and suggested that further optimization would include a prebirth schedule to account for the physical challenges and potential complications.
Physical Challenges
All of the women described significant physical challenges when working during pregnancy, resulting in limited bandwidth for additional academic activities outside of direct clinical care responsibilities.
“Exhaustion that hits you in your pregnancy and then you have to round. I used to lie on the floor of my office, take a little nap, wake up, write some notes, go home, take another nap, wake up, write some more notes.”
Upon return to work, women reported additional physical challenges related to sleep deprivation, impacting their productivity with academic work and emotional well-being.
“I came back from maternity leave and I was sleep-deprived and exhausted, I didn’t have the energy. All of these great projects that I had started or dreamed of … dwindled and died on the vine.”
Solutions suggested by the participants included creation of a flexible schedule with a ramp-up and ramp-down period around the birth.
Breastfeeding
The majority of participants in this study encountered several challenges associated with a shared goal of breastfeeding according to evidence-based guidelines.11 Designated pumping areas were often inconveniently located and not conducive to multitasking.
“It’s two chairs that are behind a curtain in a women’s locker room in the basement of the hospital, that are tiny and gross. No computers, so I felt like I was wasting time.”
One hospitalist described carving out time for pumping in her office while multitasking with clinical work.
“I would get to work, set up, and pump while chart reviewing. Then I would go and see people… and come back to my office and pump and write a few notes. And go out and see more patients, and then pump and write a few more notes. And then pump, and then go home. I was like a cow.”
Women highlighted the barriers that could be optimized such as creating time in the clinical schedule for pumping, a physical space to breastfeed or pump, and accessible milk storage facilities.
Career Opportunities
When asked about the impact of parental leave on career opportunities, a few of the women described a phenomenon of no longer being asked to participate or being left out of prior projects.
“People didn’t want to offer you things or give you things because they realize you’re having this transition in your life. Not out of animosity, but out of courtesy that they don’t want to fill up your place even more. Her plate is full; we are not going to ask her to do anything extra.”
However, two women specifically reported a supportive environment without a loss of opportunities, often referenced as a boss who “saved” projects for their return.
Colleague Responses
One participant used the term “microaggressions,” to describe passive aggressions encountered by their colleagues or leadership.
“(A colleague) was diagnosed with pre-eclampsia, and very urgently had to deliver and couldn’t cover a week of shifts…She was asked initially to find her own coverage…Not treating (pregnancy) similar to other serious illnesses is what I would term a microaggression.”
Yet, women in our study also reported positive responses from colleagues and the importance of support networks of physician mothers (Table 2).
Empathy in Patient Care
Finally, the experience of motherhood impacted all of the women as physicians, described as increased empathy, patience, and understanding of difficult family situations.
“I’m just more sensitive to people’s lives outside the hospital, so, you know, when it’s difficult for a family member to get there because they have three other kids they are taking care of or, somebody that says they are leaving AMA, but it’s because they have a sick kid at home. I just have a better context for that.”
DISCUSSION
Gender disparities persist in both internal medicine and hospital medicine.1 Providers in this descriptive qualitative study suggested that the following factors contribute: lack of paid parental leave and the associated financial penalties, loss of career opportunities, the physical challenges associated with pregnancy, decreasing productivity, and the amount of time and effort involved in breastfeeding. However, the participants also shared valuable ideas for future solutions to relieve the challenges imposed on working physician mothers (Table 2).
Breaking the Glass Ceiling
Participants noted the importance of a paid leave policy that encompasses not only maternity leave but also a flexible scheduling period before and after the leave to account for the challenges of pregnancy and new motherhood. Paid parental leave is rare in academic settings, but studies from other industries show that when women take paid leave, they are more likely to remain in the workforce 9-12 months afterward, work more weekly hours, and feel more loyal to their organization.12,13 In the rare instance when negotiations around leave violate local policy or the law, women should be encouraged to seek guidance from their human resources department.
Me Too: Building Solidarity
Women in our study reported the value of a supportive workplace in easing their transition into motherhood. Specifically, they noted that a supportive boss who protected their career opportunities prevented momentum loss in their career trajectory. Access to mutual supports such as the Physicians Mom Group, a well-established Facebook group comprising more than 70,000 women, was referenced as a meaningful way to share joys and tribulations related to balancing a career as a physician and motherhood. Growth of similar support systems within institutions will further support this experience.
Time’s Up: The Promotion Clock
Women in our study described a prolonged period of diminished productivity related to having children, coinciding with a set time to promotion in academics. Flexible promotion schedules may impact women’s ability to successfully undergo promotion.
FUTURE DIRECTION
The aim of this study was to represent a shared set of experiences of female academic hospitalists who participated; therefore, the results may not be generalizable beyond this group. Due to the use of a purposeful snowball approach, there was a potential for selection bias. Future research may include comparing the experience of women at institutions that offer paid leave versus those that do not and the impact on retention, promotion, and well-being.
CONCLUSION
Women in hospital medicine encounter several challenges to having children, but they are also motivated to provide solutions. Efforts to improve the institutional and cultural landscape to better support women physicians with children are critical to prevent attrition of women and ensure equitable academic promotion and achievement of leadership positions.
Disclosures
The authors have no conflicts of interest to report.
Author Contributions
Each author was involved in the creation of the study protocol, data collection and analysis, and creation of the manuscript.
1. Association of American Medical Colleges. The State of Women in Academic Medicine: The pipeline and pathways to leadership, 2013-2014. https://www.hopkinsmedicine.org/women_science_medicine/_pdfs/The%20State%20of%20Women%20in%20Academic%20Medicine%202013-2014%20FINAL.pdf. Accessed February 26, 2018.
2. Carr PL, Ash AS, Friedman RH, et al. Relation of family responsibilities and gender to the productivity and career satisfaction of medical faculty. Ann Int Med. 1998;129(7):532-538. doi: 10.7326/0003-4819-129-7-199810010-00004. PubMed
3. Burden M, Frank MG, Keniston A, et al. Gender disparities for academic hospitalists. J Hosp Med. 2015;10(8):481-485. doi:10.1002/jhm.2340. PubMed
4. Bristol MN, Abbuhl S, Cappola AR, Sonnad SS. Work-life policies for faculty at the top ten medical schools. J Women’s Health. 2008;17(8):1311-1320. doi: 10.1089/jwh.2007.0682. PubMed
5. Welch JL, Wiehe SE, Palmer-Smith V, Dankoski ME. Flexibility in faculty work-life policies at medical schools in the big ten conference. J Women’s Health. 2011;20(5):725-732. doi: 10.1089/jwh.2010.2553. PubMed
6. Riano NS, Linos E, Accurso EC, et al. Paid family and childbearing leave policies at top US medical schools. JAMA. 2018;319(6):611-614. doi: 10.1001/jama.2017.19519. PubMed
7. Arthur CR, Saenz RB, Replogle WH. The employment-related breastfeeding decisions of physician mothers. J Miss State Med Assoc. 2003;44(12):383-387. PubMed
8. Filtness AJ, MacKenzie J, Armstrong K. Longitudinal change in sleep and daytime sleepiness in postpartum women. PLoS ONE. 2014;9(7):e103513. doi: 10.1371/journal.pone.0103513. PubMed
9. Reid MB, Misky GJ, Harrison RA, Sharpe B, Auerbach A, Glasheen JJ. Mentorship, productivity, and promotion among academic hospitalists. J Gen Intern Med. 2012;27(1):23-27. doi: 10.1007/s11606-011-1892-5. PubMed
10. Jones J, Nowels CT, Sudore R, Ahluwalia S, Bekelman DB. The future as a series of transitions: qualitative study of heart failure patients and their informal caregivers. J Gen Intern Med. 2015;30(2):176-182. doi: 10.1007/s11606-014-3085-5. PubMed
11. American Academy of Pediatrics. Breastfeeding and the use of human milk. Pediatrics. 2012;129(3):e827-e841. doi: 10.1542/peds.2011-3552. PubMed
12. Houser, L, Vartanian, T. Pay matters: the positive economic impact of paid family Leave for families, businesses and the public. Center for Women and Work at Rutgers. January, 2012. http://go.nationalpartnership.org/site/DocServer/Pay_Matters_Positive_Economic_Impacts_of_Paid_Fam ily_L.pdf?docID=9681. Accessed February 26, 2018.
13. Rossin-Slater M, Ruhm C, Waldfogel J. The effects of California’s paid family leave program on mothers’ leave-taking and subsequent labor market outcomes. J Policy Anal Manage. 2013;32(2):224-2 45. doi: 10.1002/pam.21676. PubMed
Despite recent advances made in medicine, gender-based disparities persist.1-3 In particular, women with children have barriers to career advancement and show evidence of slower career advancement.1,2 Multiple challenges for working women experiencing motherhood have been described. In academic medicine in the United States, women have limited access to paid parental leave.4-6 For women who choose to breastfeed, there is limited time, space, and support available for breastfeeding.7 Furthermore, sleep deprivation in the postpartum period significantly impacts the ability to function at work.8
Hospital medicine is a unique specialty as it comprises 47% women, 80% of whom are aged less than 40 years, suggesting that a large portion are women of childbearing age.9 The field poses known challenges to this population, including shift work, atypical schedules, and unpredictable hours. We conducted a descriptive qualitative study to improve our understanding of the experience of female academic hospitalists who have experienced pregnancy, parental leave, and the return to work as faculty. Our goal was to both explore the challenges to undergoing this experience and discover solutions to support female academic hospitalists.
METHODS
Study Design
We conducted a qualitative descriptive study of female hospitalists recruited from academic institutions represented in Society of Hospital Medicine (SHM) committees. Interviews were conducted between November 2017 and February 2018. Participants completed an informed consent and a demographic survey prior to the interview. Each interview lasted approximately 30 minutes; discussions were recorded on digital records and transcribed verbatim. This protocol was reviewed and granted exemption by the Institutional Review Board at the University of Colorado.
Population
We recruited participants from a selection of hospital medicine groups nationally, chosen from SHM committee representation. A purposeful snowball approach was used to identify hospitalists from representative programs and seek their recommendation for hospitalists from other targeted programs. Ten hospitalists were approached by e-mail to determine their interest in participation, and all of them agreed to participate. Each participant experienced new parenthood within the last seven years.
Framework
We constructed our interview to represent the following timeline associated with having children as it pertains to a hospitalist position: pregnancy, parental leave, and the return to work. The interview guide was structured to invoke the positive aspects, challenges, and solutions within each domain (Appendix 1).
Analysis
Codes were inductively developed from the interview data by a team of three board-certified internal medicine physicians (E.G., A.M., and C.J.), one of whom had prior training and experience with qualitative interviews and analysis (C.J.). Among the coders, two (E.G. and A.M.) conducted the semistructured interviews. Code disparities were reconciled by team consensus, where the primary coder facilitated the discussions. Themes were developed inductively from the codes, and the analysis was completed using a team-based iterative approach that was facilitated using ATLAS.ti.10 Thematic saturation was achieved. This study was approved by the Colorado Multiple Institutional Review Board.
RESULTS
The demographics and the characteristics of the hospital medicine group are shown in Table 1. Although we asked questions about both the positive and challenging aspects of the experience of parenthood, the interviews tended to focus more on the challenges faced and on areas for optimization.
Paid Parental leave
Most of the participants described inadequate paid parental leave, with minimal transparency in the processes for ensuring time off following the birth of their child, resulting in “haggling” with bosses, human resources, and the administrative staff. Rarely was a formal parental leave policy in place. Once a parental leave plan was established, several women reported the financial burden associated with a leave that was partially, or fully, unpaid.
“All of my leave was unpaid. .. managed to finagle short-term disability into paying for it… the system was otherwise set up to screw me financially.”
For the three women who did experience sufficient paid parental leave, they recognized the financial and emotional benefit and suggested that further optimization would include a prebirth schedule to account for the physical challenges and potential complications.
Physical Challenges
All of the women described significant physical challenges when working during pregnancy, resulting in limited bandwidth for additional academic activities outside of direct clinical care responsibilities.
“Exhaustion that hits you in your pregnancy and then you have to round. I used to lie on the floor of my office, take a little nap, wake up, write some notes, go home, take another nap, wake up, write some more notes.”
Upon return to work, women reported additional physical challenges related to sleep deprivation, impacting their productivity with academic work and emotional well-being.
“I came back from maternity leave and I was sleep-deprived and exhausted, I didn’t have the energy. All of these great projects that I had started or dreamed of … dwindled and died on the vine.”
Solutions suggested by the participants included creation of a flexible schedule with a ramp-up and ramp-down period around the birth.
Breastfeeding
The majority of participants in this study encountered several challenges associated with a shared goal of breastfeeding according to evidence-based guidelines.11 Designated pumping areas were often inconveniently located and not conducive to multitasking.
“It’s two chairs that are behind a curtain in a women’s locker room in the basement of the hospital, that are tiny and gross. No computers, so I felt like I was wasting time.”
One hospitalist described carving out time for pumping in her office while multitasking with clinical work.
“I would get to work, set up, and pump while chart reviewing. Then I would go and see people… and come back to my office and pump and write a few notes. And go out and see more patients, and then pump and write a few more notes. And then pump, and then go home. I was like a cow.”
Women highlighted the barriers that could be optimized such as creating time in the clinical schedule for pumping, a physical space to breastfeed or pump, and accessible milk storage facilities.
Career Opportunities
When asked about the impact of parental leave on career opportunities, a few of the women described a phenomenon of no longer being asked to participate or being left out of prior projects.
“People didn’t want to offer you things or give you things because they realize you’re having this transition in your life. Not out of animosity, but out of courtesy that they don’t want to fill up your place even more. Her plate is full; we are not going to ask her to do anything extra.”
However, two women specifically reported a supportive environment without a loss of opportunities, often referenced as a boss who “saved” projects for their return.
Colleague Responses
One participant used the term “microaggressions,” to describe passive aggressions encountered by their colleagues or leadership.
“(A colleague) was diagnosed with pre-eclampsia, and very urgently had to deliver and couldn’t cover a week of shifts…She was asked initially to find her own coverage…Not treating (pregnancy) similar to other serious illnesses is what I would term a microaggression.”
Yet, women in our study also reported positive responses from colleagues and the importance of support networks of physician mothers (Table 2).
Empathy in Patient Care
Finally, the experience of motherhood impacted all of the women as physicians, described as increased empathy, patience, and understanding of difficult family situations.
“I’m just more sensitive to people’s lives outside the hospital, so, you know, when it’s difficult for a family member to get there because they have three other kids they are taking care of or, somebody that says they are leaving AMA, but it’s because they have a sick kid at home. I just have a better context for that.”
DISCUSSION
Gender disparities persist in both internal medicine and hospital medicine.1 Providers in this descriptive qualitative study suggested that the following factors contribute: lack of paid parental leave and the associated financial penalties, loss of career opportunities, the physical challenges associated with pregnancy, decreasing productivity, and the amount of time and effort involved in breastfeeding. However, the participants also shared valuable ideas for future solutions to relieve the challenges imposed on working physician mothers (Table 2).
Breaking the Glass Ceiling
Participants noted the importance of a paid leave policy that encompasses not only maternity leave but also a flexible scheduling period before and after the leave to account for the challenges of pregnancy and new motherhood. Paid parental leave is rare in academic settings, but studies from other industries show that when women take paid leave, they are more likely to remain in the workforce 9-12 months afterward, work more weekly hours, and feel more loyal to their organization.12,13 In the rare instance when negotiations around leave violate local policy or the law, women should be encouraged to seek guidance from their human resources department.
Me Too: Building Solidarity
Women in our study reported the value of a supportive workplace in easing their transition into motherhood. Specifically, they noted that a supportive boss who protected their career opportunities prevented momentum loss in their career trajectory. Access to mutual supports such as the Physicians Mom Group, a well-established Facebook group comprising more than 70,000 women, was referenced as a meaningful way to share joys and tribulations related to balancing a career as a physician and motherhood. Growth of similar support systems within institutions will further support this experience.
Time’s Up: The Promotion Clock
Women in our study described a prolonged period of diminished productivity related to having children, coinciding with a set time to promotion in academics. Flexible promotion schedules may impact women’s ability to successfully undergo promotion.
FUTURE DIRECTION
The aim of this study was to represent a shared set of experiences of female academic hospitalists who participated; therefore, the results may not be generalizable beyond this group. Due to the use of a purposeful snowball approach, there was a potential for selection bias. Future research may include comparing the experience of women at institutions that offer paid leave versus those that do not and the impact on retention, promotion, and well-being.
CONCLUSION
Women in hospital medicine encounter several challenges to having children, but they are also motivated to provide solutions. Efforts to improve the institutional and cultural landscape to better support women physicians with children are critical to prevent attrition of women and ensure equitable academic promotion and achievement of leadership positions.
Disclosures
The authors have no conflicts of interest to report.
Author Contributions
Each author was involved in the creation of the study protocol, data collection and analysis, and creation of the manuscript.
1. Association of American Medical Colleges. The State of Women in Academic Medicine: The pipeline and pathways to leadership, 2013-2014. https://www.hopkinsmedicine.org/women_science_medicine/_pdfs/The%20State%20of%20Women%20in%20Academic%20Medicine%202013-2014%20FINAL.pdf. Accessed February 26, 2018.
2. Carr PL, Ash AS, Friedman RH, et al. Relation of family responsibilities and gender to the productivity and career satisfaction of medical faculty. Ann Int Med. 1998;129(7):532-538. doi: 10.7326/0003-4819-129-7-199810010-00004. PubMed
3. Burden M, Frank MG, Keniston A, et al. Gender disparities for academic hospitalists. J Hosp Med. 2015;10(8):481-485. doi:10.1002/jhm.2340. PubMed
4. Bristol MN, Abbuhl S, Cappola AR, Sonnad SS. Work-life policies for faculty at the top ten medical schools. J Women’s Health. 2008;17(8):1311-1320. doi: 10.1089/jwh.2007.0682. PubMed
5. Welch JL, Wiehe SE, Palmer-Smith V, Dankoski ME. Flexibility in faculty work-life policies at medical schools in the big ten conference. J Women’s Health. 2011;20(5):725-732. doi: 10.1089/jwh.2010.2553. PubMed
6. Riano NS, Linos E, Accurso EC, et al. Paid family and childbearing leave policies at top US medical schools. JAMA. 2018;319(6):611-614. doi: 10.1001/jama.2017.19519. PubMed
7. Arthur CR, Saenz RB, Replogle WH. The employment-related breastfeeding decisions of physician mothers. J Miss State Med Assoc. 2003;44(12):383-387. PubMed
8. Filtness AJ, MacKenzie J, Armstrong K. Longitudinal change in sleep and daytime sleepiness in postpartum women. PLoS ONE. 2014;9(7):e103513. doi: 10.1371/journal.pone.0103513. PubMed
9. Reid MB, Misky GJ, Harrison RA, Sharpe B, Auerbach A, Glasheen JJ. Mentorship, productivity, and promotion among academic hospitalists. J Gen Intern Med. 2012;27(1):23-27. doi: 10.1007/s11606-011-1892-5. PubMed
10. Jones J, Nowels CT, Sudore R, Ahluwalia S, Bekelman DB. The future as a series of transitions: qualitative study of heart failure patients and their informal caregivers. J Gen Intern Med. 2015;30(2):176-182. doi: 10.1007/s11606-014-3085-5. PubMed
11. American Academy of Pediatrics. Breastfeeding and the use of human milk. Pediatrics. 2012;129(3):e827-e841. doi: 10.1542/peds.2011-3552. PubMed
12. Houser, L, Vartanian, T. Pay matters: the positive economic impact of paid family Leave for families, businesses and the public. Center for Women and Work at Rutgers. January, 2012. http://go.nationalpartnership.org/site/DocServer/Pay_Matters_Positive_Economic_Impacts_of_Paid_Fam ily_L.pdf?docID=9681. Accessed February 26, 2018.
13. Rossin-Slater M, Ruhm C, Waldfogel J. The effects of California’s paid family leave program on mothers’ leave-taking and subsequent labor market outcomes. J Policy Anal Manage. 2013;32(2):224-2 45. doi: 10.1002/pam.21676. PubMed
© 2018 Society of Hospital Medicine
Who Consults Us and Why? An Evaluation of Medicine Consult/Comanagement Services at Academic Medical Centers
The role of internists in consultation has considerably expanded over the past half century. Consulting general internists increasingly work across disciplines to coordinate complex care.1,2 Some internists assume a “comanagement” role with surgical specialties. This role requires sharing responsibility and accountability and involvement in admission/discharge processes.3-6 Internal medicine (IM) residents are required to serve as consultants.7 Yet, aside from observations collected 30 to 40 years ago, limited information is available for guiding educators in developing consultative curricula.2,8-10 We sought to assess current consultative practices across a sample of IM training programs. Specifically, we examined which services consult IM and their reasons for consultation (RFCs).
METHODS
We collected data on consultation requests at 11 US academic medical centers (AMCs). We applied a selective sampling approach that leveraged existing relationships and interest in consultative medicine to identify institutions across a variety of geographic locations. We collected data regarding the consult service structure at each site, including data on the presence or absence of comanagement services and consult requests received.
Data Collection Tool
Investigators at the University of Texas Health San Antonio (UTHSA) drafted the data collection tool. Iterative feedback on the data collection tool was obtained from the research consortium (final tool, Supplemental Figure). Data collected included service requesting consultation, RFC, time request was made (day/night), who first saw the patient (eg, resident, attending), whether requesting and consulting providers verbally communicated, and whether patients were transferred to medicine. Respondents also estimated how often RFCs were encountered during their general medicine services.
To streamline data collection, we used click boxes and drop-down lists that included diagnoses and symptoms. The use of these predetermined RFCs was based on prior studies and discussion with the research consortium on common RFCs in clinical practice. A write-in field was also included. Respondents could select multiple RFCs in the case of multiple questions. Respondents also provided data regarding clinical issues that were incidentally identified during their initial patient assessments. Incidentally identified issues are hereafter called “additional RFCs” for differentiation from stated RFCs. Prior to data collection, the tool was piloted at UTHSA.
Data Collection, Categorization, and Analysis
Participants submitted data using Survey Monkey (Palo Alto, California). Emails with the survey link were sent daily. Specific participants for each data collection period were chosen by each site. Days with no data entry were confirmed by the study coordinator. Each institution collected data for four 2-week periods from July 2014 to July 2015 for a total of 8 weeks. We did not track follow-up encounters. Repeat consultations for different reasons were considered new consults.
All survey responses and free-text RFC entries were independently reviewed and categorized by 2 authors (E.W. and M.S.). New categories were created if needed. If reviewers disagreed, a third reviewer (C.M.) reviewed the RFC. The research consortium reviewed the final list of categories and entries.
We calculated descriptive statistics using SAS version 9.3 (SAS Institute, Inc., Cary, North Carolina). Each analysis used complete responses for each survey component. We separately analyzed services with and without comanagement components. The study was approved by UTHSA’s Institutional Review Board.
RESULTS
A total of 11 AMCs that represent 9 academic affiliations participated in this study (Table 1). Of the 11 AMCs, 7 were public nonprofit, 3 were private nonprofit, and 1 was a Veterans Health Administration facility. Out of the 11 AMCs, 9 sites included residents on the consult service, and the rotation was required at 6 of the sites. Most sites with residents had a formal curriculum that ranged from curated articles to online modules. Out of the 11 services, 4 were consult and comanagement services. All 4 co-managed orthopedic patients, and 1 also included other patients.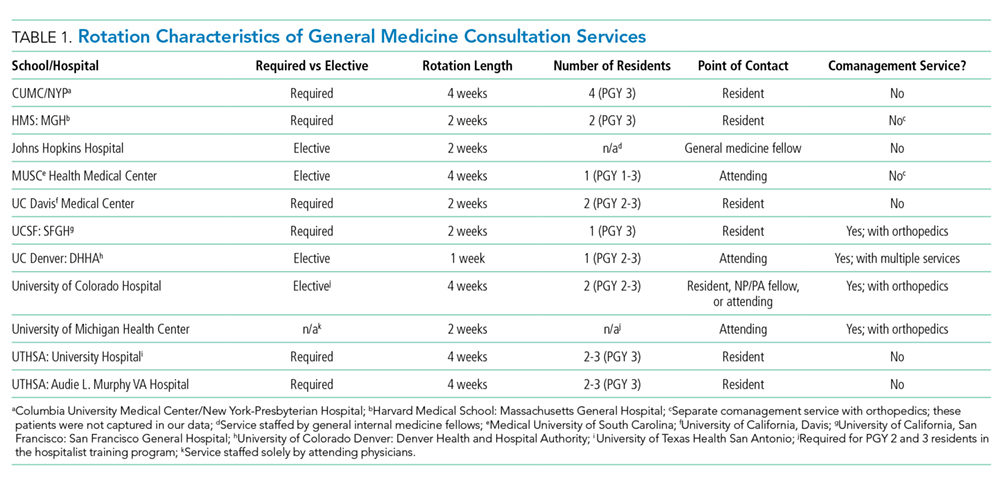
Data for 1,264 patient encounters with 2,778 RFCs were collected. A total of 1,218 of the surveys (96.4%) were fully completed, and only 5 surveys were missing data for multiple questions. A total of 7 sites adhered to the planned protocol. Among the sites, 1 site had 1 incomplete collection period, 1 site missed 1 collection period, and 1 site missed 2 collection periods.
Most consultations (87.1%) were requested during the day. Many patients (55.9%) were initially seen by residents, and 32.4% of the patients were initially seen by an attending. Respondents reported communicating verbally with the requesting team in 93.9% of instances. Among the patients, 7.8% were transferred to medicine following initial consultation. This percentage was higher (10.2%) in services without comanagement.
The average number of new consults per day per site was 2.24. The range for individual sites was 1.36-3.48. The maximum number of new consults in 1 day was 10. All sites had at least 1 day without new consults. The mean number of RFCs per encounter was 2.20 (median 2, range 1-13). In 226 of 360 encounters in which comanagement was an RFC, the respondent enumerated the other specific RFCs addressed. In these encounters, the mean number of RFCs (in addition to comanagement) was 3.02.
Most requests (82.2%) originated from surgical services. Among all surgical services, orthopedic surgery requested the highest number of consultations (67.5% for services with a comanagement component; 28.5% for services without) and 81.2% of the 360 comanagement encounters. Refer to Supplemental Table 1 for detailed information on the services that requested consultation.
The most common RFC was comanagement (13.0% across the entire study; 23.3% for services with a comanagement component; Table 2). For services without comanagement, preoperative evaluation was the most common RFC (16.4%). Other frequent RFCs across the entire study included blood pressure management (8.9%), glycemic management (7.2%), and renal failure (3.9%). Additional (unstated) RFCs were addressed in 944 patients (34.0%), and blood pressure management was the most common additional RFC.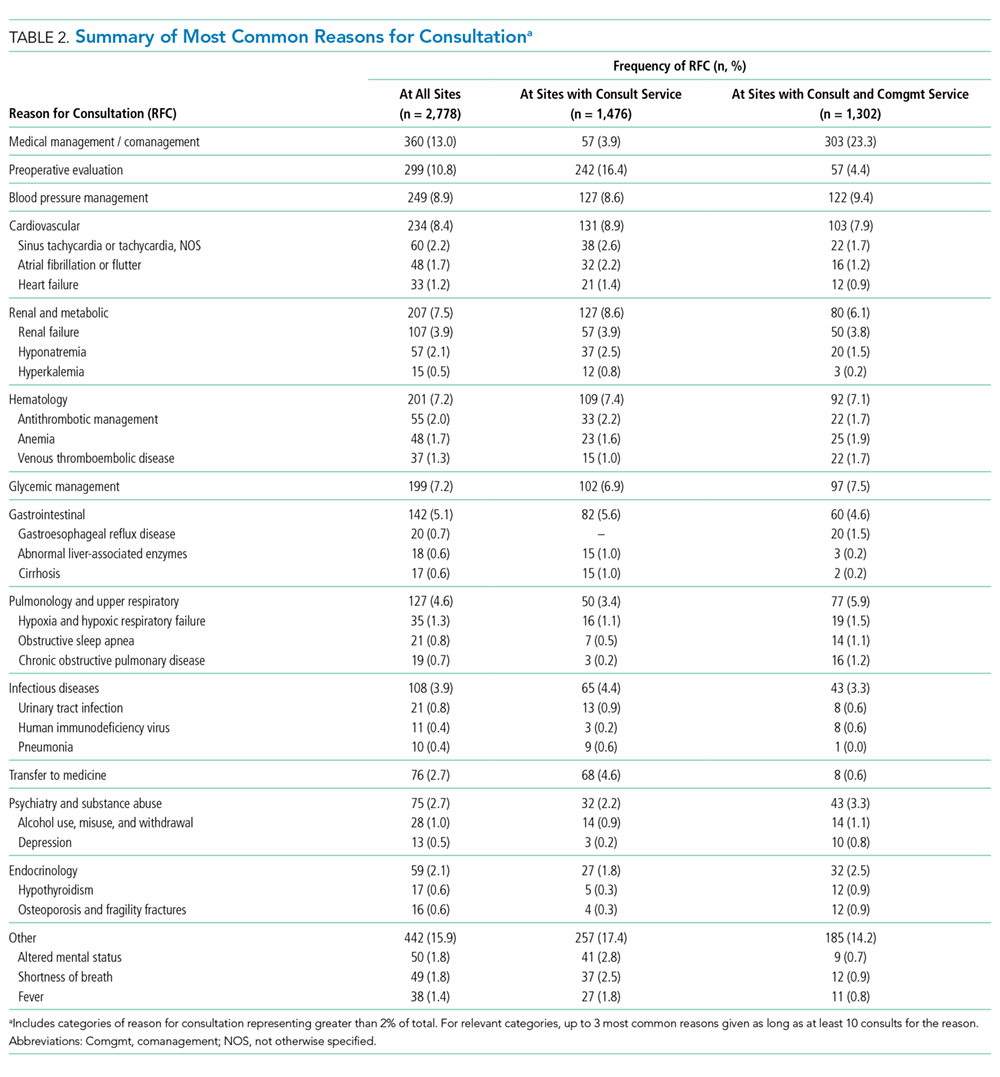
Respondents indicated that 54.9% of RFCs were clinical topics that are “often” or “always” encountered in IM inpatient services. In 11.8% of encounters, the RFC was “rarely” or “never” encountered; the most common RFCs in such encounters were comanagement (53.4%), preoperative evaluation (17.4%), and transfer to medicine (5.4%).
DISCUSSION
Our study provides insights into the consultative landscape of AMCs and identified who consults IMs and their RFCs. Thus, our study has implications for resident consultative education. The consult services included in our study presented varied structures, including those that require medicine consultation as a resident rotation and those with comanagement agreements. Consistent with the results of prior studies, surgical services requested the majority of consults, with orthopedic surgery generating the highest number of requests. Consultation requests from neurosurgery were higher than previously reported.2,8,9
Our study reveals that comanagement and preoperative evaluation are the most common RFCs and are the least commonly encountered RFCs in IM inpatient services. The broad nature of these RFCs speaks to an increasing need for comprehensive consultative care. Consultants addressed a wide range of clinical issues, including rare entities that defy easy categorization (eg, Moyamoya disease). This broad landscape presents challenges in focusing curricular content areas outside of comanagement and preoperative evaluation but does provide evidence “to expect the unexpected” in IM consultation, as has been previously noted.8
In over a third of encounters, consultants addressed an issue that was not stated in the initial RFC. Consultants also addressed more than 2 RFCs per encounter. These observations suggest that medicine consult services may be essentially comanaging some patients even when a comanagement care model is not formally in place. These findings provide rationale for the continued expansion of comanagement services.11
Our study provides further evidence that, in modern consultative practice, “determining your customer” is more important than “determining the question.”12-14 We work in an era in which comanagement services are increasingly prevalent but are not ubiquitous and in which IM consultants routinely address multiple issues. Prior studies indicated that most surgeons do not believe that consults should be limited to specific questions and instead prefer comanagement.13 Understanding the expectations of the requesting physician is therefore important and highlights the importance of verbal communication at the time of initial consultation. Ongoing interprofessional communication is a vital skill that residents should acquire.
Our study has several limitations. Although our sites represented a varied sample, we focused on AMCs. Therefore, our study may not reflect consultative experiences in nonacademic hospitals or sites without dedicated consult services. Trade-offs exist in our data collection approach, which provided predetermined RFCs. We selected our methodology to facilitate data entry and to aid RFC categorization. Nevertheless, it may have lessened the clinical nuance of submitted data. The provision of predetermined RFCs may have influenced issue selection by the respondents. However, in 473 encounters (37.4%), the survey respondents provided free-text entries for the stated RFC, and 944 additional RFCs were written in as responses. These results demonstrated that respondents did not limit themselves to the predetermined list. We did not perform chart reviews to validate data. Finally, our data were a cross-section of initial consultations. We lack information on subsequent diagnoses or additional clinical issues that developed later.
In conclusion, we found varied consultative experiences across AMCs. However, preoperative evaluation and perioperative comanagement – particularly of orthopedic and neurosurgical patients – were common and should be included in curricula. Faculty should recognize the unique nature of IM consultation to prepare residents. Specifically, faculty should prepare residents to expect to identify and address unstated medical issues and to provide comprehensive assessments regardless of whether the consultative structure has a comanagement component. Given the unique nature of consultative IM work and the possibility of discordant expectations between consulting and requesting physicians, perhaps the most valuable skill to impart to residents is effective and regular communication.
Medicine Consult/Comanagement Consortium Members
The Medicine Consult/Comanagement Consortium consists of: Mary Anderson Wallace, MD, Brian Wolfe, MD (University of Colorado), Meridale Baggett, MD, Douglas Wright, MD, PhD (Harvard University), Joyeeta G. Dastidar MD, Maureen Kelly, MD (Columbia University), Leonard S. Feldman, MD (Johns Hopkins University), Cecily J. Gallup, MD, MPH (University of California, San Francisco), Paul J. Grant, MD (University of Michigan), Craig R. Keenan, MD (University of California, Davis), Fletcher Penney, MD (Medical University of South Carolina).
Acknowledgments
The authors thank the clinicians at each site who were involved in data collection for this study, including Barbara Statland, MD. The authors also thank Timothy Niessen, MD for data and physician coordination and Musarrat Nahid, MSc. for statistical analysis.
Disclosures
Paul J. Grant receives royalties from the medical textbook Perioperative Medicine: Medical Consultation and Comanagement, Wiley Publishing 2012. Craig R. Keenan receives medicolegal consultation fees from Weiss-Salinas Law Group and American Psychiatric Association Publishers for book royalties. All other authors declare that they do not have any conflicts of interest.
Funding Information
The research reported here was supported by the Department of Veterans Affairs, Veterans Health Administration. Investigator salary support is provided through the South Texas Veterans Health Care System. The views expressed in this article are those of the authors and do not necessarily reflect the position or policy of the Department of Veterans Affairs or our institutions.
1. Hollenberg CH, Langley GR. The Canadian general internist: education and future role. CMAJ. 1978;118(4):397-400. PubMed
2. Charlson ME, Cohen RP, Sears CL. General medicine consultation: lessons from a clinical service. Am J Med. 1983;75(1):121-128. https://doi.org/10.1016/0002-9343(83)91175-0. PubMed
3. Society of Hospital Medicine. The evolution of co-management in hospital medicine. http://www.hospitalmedicine.org/Web/Practice_Management/CoManagement.aspx. Accessed March 8, 2018.
4. Auerbach AD, Wachter RM, Cheng HQ, et al. Comanagement of surgical patients between neurosurgeons and hospitalists. Arch Intern Med. 2010;170(22):2004-2010. 10.1001/archinternmed.2010.432. PubMed
5. Sharma G, Kuo YF, Freeman J, Zhang DD, Goodwin JS. Comanagement of hospitalized surgical patients by medicine physicians in the United States. Arch Intern Med. 2010;170(4):363-368. 10.1001/archinternmed.2009.553. PubMed
6. Thompson RE, Pfeifer K, Grant PJ, et al. Hospital medicine and perioperative care: a framework for high-quality, high-value collaborative care. J Hosp Med. 2017;12(4):277-282. 10.12788/jhm.2717. PubMed
7. Accreditation Council for Graduate Medical Education. Common Program Requirements. https://www.acgme.org/Portals/0/PFAssets/ProgramRequirements/140_internal_medicine_2017-07-01.pdf. Accessed March 8, 2018.
8. Moore RA, Kammerer WS, McGlynn TJ, Trautlein JJ, Burnside JW. Consultations in internal medicine: a training program resource. J Med Educ. 1977;52(4):323-327. PubMed
9. Robie PW. The service and educational contributions of a general medicine consultation service. J Gen Intern Med. 1986;1(4):225-227. https://doi.org/10.1007/BF02596187. PubMed
10. Devor M, Renvall M, Ramsdell J. Practice patterns and the adequacy of residency training in consultation medicine. J Gen Intern Med. 1993;8(10):554-560. 10.1007/BF02599639. PubMed
11. Siegal EM. Just because you can, doesn’t mean that you should: a call for the rational application of hospitalist comanagement. J Hosp Med. 2008;3(5):398-402. 10.1002/jhm.361. PubMed
12. Goldman L, Lee T, Rudd P. Ten commandments for effective consultations. Arch Intern Med. 1983;143(9):1753-1755. 10.1001/archinte.1983.00350090131022. PubMed
13. Salerno SM. Principles of effective consultation: an update for the 21st-century consultant. Arch Intern Med. 2007;167:271-275. 10.1001/archinte.167.3.271. PubMed
14. Merli GJ, Weitz HH. Medical management of the surgical patient E-Book. Elsevier Health Sciences; 2008. PubMed
The role of internists in consultation has considerably expanded over the past half century. Consulting general internists increasingly work across disciplines to coordinate complex care.1,2 Some internists assume a “comanagement” role with surgical specialties. This role requires sharing responsibility and accountability and involvement in admission/discharge processes.3-6 Internal medicine (IM) residents are required to serve as consultants.7 Yet, aside from observations collected 30 to 40 years ago, limited information is available for guiding educators in developing consultative curricula.2,8-10 We sought to assess current consultative practices across a sample of IM training programs. Specifically, we examined which services consult IM and their reasons for consultation (RFCs).
METHODS
We collected data on consultation requests at 11 US academic medical centers (AMCs). We applied a selective sampling approach that leveraged existing relationships and interest in consultative medicine to identify institutions across a variety of geographic locations. We collected data regarding the consult service structure at each site, including data on the presence or absence of comanagement services and consult requests received.
Data Collection Tool
Investigators at the University of Texas Health San Antonio (UTHSA) drafted the data collection tool. Iterative feedback on the data collection tool was obtained from the research consortium (final tool, Supplemental Figure). Data collected included service requesting consultation, RFC, time request was made (day/night), who first saw the patient (eg, resident, attending), whether requesting and consulting providers verbally communicated, and whether patients were transferred to medicine. Respondents also estimated how often RFCs were encountered during their general medicine services.
To streamline data collection, we used click boxes and drop-down lists that included diagnoses and symptoms. The use of these predetermined RFCs was based on prior studies and discussion with the research consortium on common RFCs in clinical practice. A write-in field was also included. Respondents could select multiple RFCs in the case of multiple questions. Respondents also provided data regarding clinical issues that were incidentally identified during their initial patient assessments. Incidentally identified issues are hereafter called “additional RFCs” for differentiation from stated RFCs. Prior to data collection, the tool was piloted at UTHSA.
Data Collection, Categorization, and Analysis
Participants submitted data using Survey Monkey (Palo Alto, California). Emails with the survey link were sent daily. Specific participants for each data collection period were chosen by each site. Days with no data entry were confirmed by the study coordinator. Each institution collected data for four 2-week periods from July 2014 to July 2015 for a total of 8 weeks. We did not track follow-up encounters. Repeat consultations for different reasons were considered new consults.
All survey responses and free-text RFC entries were independently reviewed and categorized by 2 authors (E.W. and M.S.). New categories were created if needed. If reviewers disagreed, a third reviewer (C.M.) reviewed the RFC. The research consortium reviewed the final list of categories and entries.
We calculated descriptive statistics using SAS version 9.3 (SAS Institute, Inc., Cary, North Carolina). Each analysis used complete responses for each survey component. We separately analyzed services with and without comanagement components. The study was approved by UTHSA’s Institutional Review Board.
RESULTS
A total of 11 AMCs that represent 9 academic affiliations participated in this study (Table 1). Of the 11 AMCs, 7 were public nonprofit, 3 were private nonprofit, and 1 was a Veterans Health Administration facility. Out of the 11 AMCs, 9 sites included residents on the consult service, and the rotation was required at 6 of the sites. Most sites with residents had a formal curriculum that ranged from curated articles to online modules. Out of the 11 services, 4 were consult and comanagement services. All 4 co-managed orthopedic patients, and 1 also included other patients.
Data for 1,264 patient encounters with 2,778 RFCs were collected. A total of 1,218 of the surveys (96.4%) were fully completed, and only 5 surveys were missing data for multiple questions. A total of 7 sites adhered to the planned protocol. Among the sites, 1 site had 1 incomplete collection period, 1 site missed 1 collection period, and 1 site missed 2 collection periods.
Most consultations (87.1%) were requested during the day. Many patients (55.9%) were initially seen by residents, and 32.4% of the patients were initially seen by an attending. Respondents reported communicating verbally with the requesting team in 93.9% of instances. Among the patients, 7.8% were transferred to medicine following initial consultation. This percentage was higher (10.2%) in services without comanagement.
The average number of new consults per day per site was 2.24. The range for individual sites was 1.36-3.48. The maximum number of new consults in 1 day was 10. All sites had at least 1 day without new consults. The mean number of RFCs per encounter was 2.20 (median 2, range 1-13). In 226 of 360 encounters in which comanagement was an RFC, the respondent enumerated the other specific RFCs addressed. In these encounters, the mean number of RFCs (in addition to comanagement) was 3.02.
Most requests (82.2%) originated from surgical services. Among all surgical services, orthopedic surgery requested the highest number of consultations (67.5% for services with a comanagement component; 28.5% for services without) and 81.2% of the 360 comanagement encounters. Refer to Supplemental Table 1 for detailed information on the services that requested consultation.
The most common RFC was comanagement (13.0% across the entire study; 23.3% for services with a comanagement component; Table 2). For services without comanagement, preoperative evaluation was the most common RFC (16.4%). Other frequent RFCs across the entire study included blood pressure management (8.9%), glycemic management (7.2%), and renal failure (3.9%). Additional (unstated) RFCs were addressed in 944 patients (34.0%), and blood pressure management was the most common additional RFC.
Respondents indicated that 54.9% of RFCs were clinical topics that are “often” or “always” encountered in IM inpatient services. In 11.8% of encounters, the RFC was “rarely” or “never” encountered; the most common RFCs in such encounters were comanagement (53.4%), preoperative evaluation (17.4%), and transfer to medicine (5.4%).
DISCUSSION
Our study provides insights into the consultative landscape of AMCs and identified who consults IMs and their RFCs. Thus, our study has implications for resident consultative education. The consult services included in our study presented varied structures, including those that require medicine consultation as a resident rotation and those with comanagement agreements. Consistent with the results of prior studies, surgical services requested the majority of consults, with orthopedic surgery generating the highest number of requests. Consultation requests from neurosurgery were higher than previously reported.2,8,9
Our study reveals that comanagement and preoperative evaluation are the most common RFCs and are the least commonly encountered RFCs in IM inpatient services. The broad nature of these RFCs speaks to an increasing need for comprehensive consultative care. Consultants addressed a wide range of clinical issues, including rare entities that defy easy categorization (eg, Moyamoya disease). This broad landscape presents challenges in focusing curricular content areas outside of comanagement and preoperative evaluation but does provide evidence “to expect the unexpected” in IM consultation, as has been previously noted.8
In over a third of encounters, consultants addressed an issue that was not stated in the initial RFC. Consultants also addressed more than 2 RFCs per encounter. These observations suggest that medicine consult services may be essentially comanaging some patients even when a comanagement care model is not formally in place. These findings provide rationale for the continued expansion of comanagement services.11
Our study provides further evidence that, in modern consultative practice, “determining your customer” is more important than “determining the question.”12-14 We work in an era in which comanagement services are increasingly prevalent but are not ubiquitous and in which IM consultants routinely address multiple issues. Prior studies indicated that most surgeons do not believe that consults should be limited to specific questions and instead prefer comanagement.13 Understanding the expectations of the requesting physician is therefore important and highlights the importance of verbal communication at the time of initial consultation. Ongoing interprofessional communication is a vital skill that residents should acquire.
Our study has several limitations. Although our sites represented a varied sample, we focused on AMCs. Therefore, our study may not reflect consultative experiences in nonacademic hospitals or sites without dedicated consult services. Trade-offs exist in our data collection approach, which provided predetermined RFCs. We selected our methodology to facilitate data entry and to aid RFC categorization. Nevertheless, it may have lessened the clinical nuance of submitted data. The provision of predetermined RFCs may have influenced issue selection by the respondents. However, in 473 encounters (37.4%), the survey respondents provided free-text entries for the stated RFC, and 944 additional RFCs were written in as responses. These results demonstrated that respondents did not limit themselves to the predetermined list. We did not perform chart reviews to validate data. Finally, our data were a cross-section of initial consultations. We lack information on subsequent diagnoses or additional clinical issues that developed later.
In conclusion, we found varied consultative experiences across AMCs. However, preoperative evaluation and perioperative comanagement – particularly of orthopedic and neurosurgical patients – were common and should be included in curricula. Faculty should recognize the unique nature of IM consultation to prepare residents. Specifically, faculty should prepare residents to expect to identify and address unstated medical issues and to provide comprehensive assessments regardless of whether the consultative structure has a comanagement component. Given the unique nature of consultative IM work and the possibility of discordant expectations between consulting and requesting physicians, perhaps the most valuable skill to impart to residents is effective and regular communication.
Medicine Consult/Comanagement Consortium Members
The Medicine Consult/Comanagement Consortium consists of: Mary Anderson Wallace, MD, Brian Wolfe, MD (University of Colorado), Meridale Baggett, MD, Douglas Wright, MD, PhD (Harvard University), Joyeeta G. Dastidar MD, Maureen Kelly, MD (Columbia University), Leonard S. Feldman, MD (Johns Hopkins University), Cecily J. Gallup, MD, MPH (University of California, San Francisco), Paul J. Grant, MD (University of Michigan), Craig R. Keenan, MD (University of California, Davis), Fletcher Penney, MD (Medical University of South Carolina).
Acknowledgments
The authors thank the clinicians at each site who were involved in data collection for this study, including Barbara Statland, MD. The authors also thank Timothy Niessen, MD for data and physician coordination and Musarrat Nahid, MSc. for statistical analysis.
Disclosures
Paul J. Grant receives royalties from the medical textbook Perioperative Medicine: Medical Consultation and Comanagement, Wiley Publishing 2012. Craig R. Keenan receives medicolegal consultation fees from Weiss-Salinas Law Group and American Psychiatric Association Publishers for book royalties. All other authors declare that they do not have any conflicts of interest.
Funding Information
The research reported here was supported by the Department of Veterans Affairs, Veterans Health Administration. Investigator salary support is provided through the South Texas Veterans Health Care System. The views expressed in this article are those of the authors and do not necessarily reflect the position or policy of the Department of Veterans Affairs or our institutions.
1. Hollenberg CH, Langley GR. The Canadian general internist: education and future role. CMAJ. 1978;118(4):397-400. PubMed
2. Charlson ME, Cohen RP, Sears CL. General medicine consultation: lessons from a clinical service. Am J Med. 1983;75(1):121-128. https://doi.org/10.1016/0002-9343(83)91175-0. PubMed
3. Society of Hospital Medicine. The evolution of co-management in hospital medicine. http://www.hospitalmedicine.org/Web/Practice_Management/CoManagement.aspx. Accessed March 8, 2018.
4. Auerbach AD, Wachter RM, Cheng HQ, et al. Comanagement of surgical patients between neurosurgeons and hospitalists. Arch Intern Med. 2010;170(22):2004-2010. 10.1001/archinternmed.2010.432. PubMed
5. Sharma G, Kuo YF, Freeman J, Zhang DD, Goodwin JS. Comanagement of hospitalized surgical patients by medicine physicians in the United States. Arch Intern Med. 2010;170(4):363-368. 10.1001/archinternmed.2009.553. PubMed
6. Thompson RE, Pfeifer K, Grant PJ, et al. Hospital medicine and perioperative care: a framework for high-quality, high-value collaborative care. J Hosp Med. 2017;12(4):277-282. 10.12788/jhm.2717. PubMed
7. Accreditation Council for Graduate Medical Education. Common Program Requirements. https://www.acgme.org/Portals/0/PFAssets/ProgramRequirements/140_internal_medicine_2017-07-01.pdf. Accessed March 8, 2018.
8. Moore RA, Kammerer WS, McGlynn TJ, Trautlein JJ, Burnside JW. Consultations in internal medicine: a training program resource. J Med Educ. 1977;52(4):323-327. PubMed
9. Robie PW. The service and educational contributions of a general medicine consultation service. J Gen Intern Med. 1986;1(4):225-227. https://doi.org/10.1007/BF02596187. PubMed
10. Devor M, Renvall M, Ramsdell J. Practice patterns and the adequacy of residency training in consultation medicine. J Gen Intern Med. 1993;8(10):554-560. 10.1007/BF02599639. PubMed
11. Siegal EM. Just because you can, doesn’t mean that you should: a call for the rational application of hospitalist comanagement. J Hosp Med. 2008;3(5):398-402. 10.1002/jhm.361. PubMed
12. Goldman L, Lee T, Rudd P. Ten commandments for effective consultations. Arch Intern Med. 1983;143(9):1753-1755. 10.1001/archinte.1983.00350090131022. PubMed
13. Salerno SM. Principles of effective consultation: an update for the 21st-century consultant. Arch Intern Med. 2007;167:271-275. 10.1001/archinte.167.3.271. PubMed
14. Merli GJ, Weitz HH. Medical management of the surgical patient E-Book. Elsevier Health Sciences; 2008. PubMed
© 2018 Society of Hospital Medicine
Impact of Clinical Specialty on Attitudes Regarding Overuse of Inpatient Laboratory Testing
Routine laboratory testing in hospitalized patients is common, with a high prevalence of unnecessary tests that do not contribute to patient management.1 Excessive laboratory testing of hospitalized patients can contribute to anemia2 and may cause patient discomfort, additional unnecessary testing resulting from false positive results, and higher out-of-pocket patient costs. Excessive testing can impact hospital budgets both directly (though direct costs are often low) and indirectly through costly downstream services and prolonged hospital stay.3 As part of the American Board of Internal Medicine (ABIM) Foundation’s Choosing Wisely initiative, several professional societies have recommended against routine laboratory testing of hospitalized adult patients.4
Excessive inpatient laboratory testing has been documented mostly among adult internal medicine (IM) patients with studies of drivers of unnecessary testing and efforts to reduce it conducted in IM settings.5, 6 Attitudes toward other issues related to testing overuse differ by specialty7 and are likely to similarly vary with regard to unnecessary laboratory testing. Understanding differences in attitudes by clinical specialty is critical for framing tailored approaches to reducing inappropriate care.
We performed a cross-sectional survey of a diverse group of hospital clinicians to describe attitudes and beliefs regarding laboratory testing and its overuse across clinical specialties (eg, medical, surgical, and pediatric). We hypothesized that attitudes toward the need for testing would differ across specialties.
METHODS
Survey Development and Administration
The study was conducted at Memorial Sloan Kettering Cancer Center, a tertiary academic cancer hospital in New York City. The 12-item survey was adopted from a previously administered but not formally validated survey (Online-only Appendix).5,8 The survey was pilot tested with 4 physicians, 3 NPs, 2 PAs, and 3 RNs and edited for content and clarity. All staff providers including NPs, PAs, RNs, and resident, fellow, and attending MDs working in the hospital during the 2-week survey period (November 2-15, 2015) were eligible to participate and were emailed a link to the survey. The email invitation was resent 3 times during the survey period. Participants who completed the survey received a coupon for a free coffee. The study was reviewed by the Institutional Review Board and exempted from ongoing oversight.
Measures
Demographic items included clinical specialty, provider type, and gender (Online-only Appendix). The remaining survey questions included the following categories:
1. Attitudes toward laboratory testing were evaluated by 3 items about accepted norms for lab testing and 2 items about fears (Table 2). Responses to these items used a 4-point Likert scale (strongly agree to strongly disagree).
2. Drivers contributing to unnecessary testing were evaluated by presenting a list of possible contributing factors (Table 2). Responses to these items used a 3-point Likert scale (contributes a lot, contributes a little, or does not contribute).
Analysis
We used univariate statistics to describe demographics and survey responses. We used the chi-square statistic to evaluate differences in attitudes and drivers by clinical specialty. We dichotomized responses regarding attitudes toward lab testing (“strongly agree” and “somewhat agree” vs. “somewhat disagree” and “strongly disagree.”) and beliefs regarding contributing drivers (“contributes a lot” vs all others). We grouped clinical specialty into medical/med-oncology, surgical, pediatric, and other (gynecological, critical care, and other).
We used logistic regression to explore the associations between attitudes/drivers and clinical specialty after adjusting for provider type, and report the overall P-value. We used pediatrics as the reference group to assess direct comparisons with each of the other specialties. We performed analyses with SAS statistical software, version 9.4 (SAS Institute, Cary, North Carolina) and considered P < .05 to be significant.
RESULTS
Among 1580 eligible participants, 837 (53%) completed surveys. Attending MD response rates ranged between 61% (surgical) to 86% (pediatric); rates were 59% for all trainees, 72% for PAs and 46% for RNs and NPs combined. Given privacy concerns, we were unable to collect detailed response rate information or any information about nonrespondents. The demographics are shown in Table 1.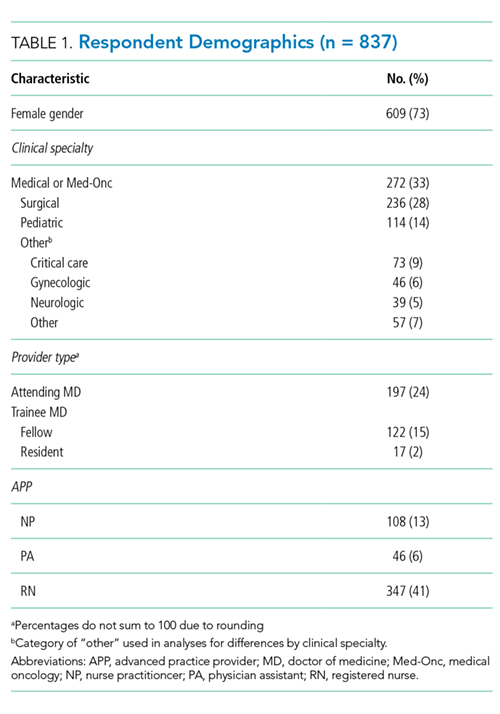
Attitudes toward Laboratory Testing
The majority of respondents agreed that hospitalized patients should get daily labs (59%), testing on the discharge day (52%), and that daily testing generally enhances safety (55%; Table 2). Fewer pediatric and surgical clinicians endorsed that laboratory testing should be done daily (56% and 47% respectively) and enhances patient safety (46% and 47%). These differences were significant after adjusting for provider type. In addition, fewer pediatric providers endorsed the statement that daily laboratory testing helps avoid malpractice litigation. Overall, 68% of respondents agreed they would be comfortable with less testing.
Drivers Contributing to Unnecessary Laboratory Testing
The strongest drivers of unnecessary testing were seen as habit (94% responding “contributes a lot”) and institutional culture (89% responding “contributes a lot”; Table 2). After adjusting for provider type, significant differences were observed based on clinical specialty. In particular, pediatric specialists were less likely to endorse fear of litigation (P < .001) and more likely to endorse pressure from patient/family (P = .0003) compared to all other specialties (Table 2, odd ratios not shown).
DISCUSSION
Overuse of laboratory testing in hospitalized patients is widely recognized in IM and likely to be prevalent in other clinical specialties. Our study elucidated differences in attitudes toward unnecessary testing and self-identified drivers across specialties in a diverse group of clinical providers at an academic cancer center. We found differences based on clinical specialty, with those caring for pediatric and surgical patients less likely than others to believe that testing should be done daily and that daily testing enhances patient safety. Furthermore, comfort with less testing was highest among pediatric specialists. Habit and institutional culture were recognized broadly as the strongest drivers of laboratory testing overuse.
Our findings regarding differences based on clinical specialty are novel. Respondents caring for pediatric patients generally placed lower value on testing, and IM clinicians were the most likely to endorse daily testing and to believe that it enhances patient safety and helps avoid malpractice litigation. The difference between adult and pediatric clinicians is surprising given the fundamental similarities between these specialties.9 Although some resource use studies have described differences across specialties, none has examined differences in laboratory testing or examined the practice patterns of clinicians who are not physicians across specialties.10 Prior studies have documented the impact of training location on practice11,12, suggesting the importance of the local training culture.13 As physician personalities vary across clinical specialties14 it is likely that culture varies as well. Specialty-specific cultures are likely to strongly influence attitudes and practice patterns and warrant further exploration.
Clinicians in our sample identified drivers of unnecessary laboratory testing that were consistent with other studies, most frequently endorsing habit, followed by culture, discomfort with not knowing, and concern that someone will ask for the results.5,15 Previous studies have focused on IM and have not included nonphysicians or compared attitudes across specialties. We found that the largest differences in drivers by specialty were related to malpractice concerns and the perception of pressure from patients or families. The low endorsement of defensive medicine among clinicians serving pediatric populations may imply that interventions to reduce unnecessary care in hospitalized children may not need to address malpractice fear. In contrast, clinicians from pediatrics identified family pressure as a greater driver of unnecessary testing. Efforts to reduce unnecessary laboratory testing in pediatrics will need to address parent expectations.
Our findings have implications for efforts to reduce unnecessary testing. Culture, identified as a key driver of testing, reflects leadership priorities, institutional history, and other factors and is difficult to specifically target. Habit, the other most-endorsed driver, is a more promising target for quality improvement interventions, particularly those addressing care processes (eg, electronic ordering). Discomfort with not knowing and fear of being asked are drivers that might be influenced by better communication about information expectations by supervising physicians and hospital administration. Lastly, education about the potential harms of excessive testing may facilitate more targeted efforts to reduce testing overuse.
Our study has important limitations. The cancer focus of the center may have influenced provider attitudes and practices. Attitudes may differ at community centers, though important differences regarding routine laboratory testing are unlikely. Second, although our sample was large, our response rate was modest at 53% and as low as 46% among RNs and NPs and we have no information regarding nonresponders. This response rate, though, was comparable to response rates seen in other large surveys.5,15 In addition, our results reflect clinician self-report; perceptions of necessity and the true need for testing may vary across specialties and the true subconscious drivers of behavior may differ. However, differences across specialties are likely to be valid even if there are other factors at play. Self assessment of unnecessary testing may also underestimate prevalence of the problem. Finally, our findings related to drivers of unnecessary testing are descriptive rather than quantitative given the lack of validated scales.
In conclusion, we evaluated attitudes toward routine laboratory testing in hospitalized patients in clinicians across specialties and found important differences. These findings speak to the diversity of cultures of medical care even within a single institution and point to the importance of studying attitudes about overused services across clinical specialties. In particular, as medical fields beyond IM increasingly recognize the importance of reducing medical overuse both in and out of the hospital, our findings highlight the importance of elucidating specialty-specific attitudes to optimize interventions to address unnecessary testing.
Disclosures
Mr. Husain, Ms. Gennarelli, Ms. White4, Mr. Masciale, MA5, and Dr. Roman, MD, have nothing to disclose. The work of Dr. Roman and Dr. Korenstein on this project was supported, in part, by a Cancer Center Support Grant from the National Cancer Institute to Memorial Sloan Kettering Cancer Center (P30 CA008748)
1. Zhi M, Ding EL, Theisen-Toupal J, Whelan J, Arnaout R. The landscape of inappropriate laboratory testing: a 15-year meta-analysis. PloS One. 2013;8(11):e78962. DOI: 10.1371/journal.pone.0078962. PubMed
2. Thavendiranathan P, Bagai A, Ebidia A, Detsky AS, Choudhry NK. Do blood tests cause anemia in hospitalized patients? The effect of diagnostic phlebotomy on hemoglobin and hematocrit levels. J Gen Intern Med. 2005;20(6):520-524. DOI: 10.1111/j.1525-1497.2005.0094.x. PubMed
3. Eaton KP, Levy K, Soong C, et al. Evidence-based guidelines to eliminate repetitive laboratory testing. JAMA Intern Med. 2017;177(12):1833-1839. DOI: 10.1001/jamainternmed.2017.5152 PubMed
4. Choosing wisely. http://www.choosingwisely.org/resources/. Accessed November 21, 2017.
5. Sedrak MS, Patel MS, Ziemba JB, et al. Residents’ self-report on why they order perceived unnecessary inpatient laboratory tests. J Hosp Med. 2016;11(12):869-872. DOI: 10.1002/jhm.2645. PubMed
6. Thakkar RN, Kim D, Knight AM, Riedel S, Vaidya D, Wright SM. Impact of an educational intervention on the frequency of daily blood test orders for hospitalized patients. Am J Clin Pathol. 2015;143(3):393-397. DOI: 10.1309/AJCPJS4EEM7UAUBV. PubMed
7. Sheeler RD, Mundell T, Hurst SA, et al. Self-reported rationing behavior among US physicians: a national survey. J Gen Intern Med. 2016;31(12):1444-1451. DOI: 10.1007/s11606-016-3756-5. PubMed
8. Roman BR, Yang A, Masciale J, Korenstein D. Association of attitudes regarding overuse of inpatient laboratory testing with health care provider type. JAMA Intern Med. 2017;177(8):1205-1207. DOI: 10.1001/jamainternmed.2017.1634. PubMed
9. Schatz IJ, Realini JP, Charney E. Family practice, internal medicine, and pediatrics as partners in the education of generalists. Acad Med. 1996;71(1):35-39. PubMed
10. Johnson RE, Freeborn DK, Mullooly JP. Physicians’ use of laboratory, radiology, and drugs in a prepaid group practice HMO. Health Serv Res. 1985;20(5):525-547. PubMed
11. Chen C, Petterson S, Phillips R, Bazemore A, Mullan F. Spending patterns in region of residency training and subsequent expenditures for care provided by practicing physicians for Medicare beneficiaries. JAMA. Dec 10, 2014;312(22):2385-2393. DOI: 10.1001/jama.2014.15973. PubMed
12. Sirovich BE, Lipner RS, Johnston M, Holmboe ES. The association between residency training and internists’ ability to practice conservatively. JAMA Intern Med. 2014;174(10):1640-1648. DOI: 10.1001/jamainternmed.2014.3337. PubMed
13. Smith CD, Korenstein D. Harnessing the power of peer pressure to reduce health care waste and improve clinical outcomes. Mayo Clin Proc. 2015;90(3):311-312. DOI: https://doi.org/10.1017/ice.2015.136 PubMed
14. Vaidya NA, Sierles FS, Raida MD, Fakhoury FJ, Przybeck TR, Cloninger CR. Relationship between specialty choice and medical student temperament and character assessed with Cloninger Inventory. Teach Learn Med. 2004;16(2):150-156. DOI: 10.1207/s15328015tlm1602_6 PubMed
15. Studdert DM, Mello MM, Sage WM, et al. Defensive medicine among high-risk specialist physicians in a volatile malpractice environment. JAMA. 2005;293(21):2609-2617. DOI: 10.1001/jama.293.21.2609 PubMed
Routine laboratory testing in hospitalized patients is common, with a high prevalence of unnecessary tests that do not contribute to patient management.1 Excessive laboratory testing of hospitalized patients can contribute to anemia2 and may cause patient discomfort, additional unnecessary testing resulting from false positive results, and higher out-of-pocket patient costs. Excessive testing can impact hospital budgets both directly (though direct costs are often low) and indirectly through costly downstream services and prolonged hospital stay.3 As part of the American Board of Internal Medicine (ABIM) Foundation’s Choosing Wisely initiative, several professional societies have recommended against routine laboratory testing of hospitalized adult patients.4
Excessive inpatient laboratory testing has been documented mostly among adult internal medicine (IM) patients with studies of drivers of unnecessary testing and efforts to reduce it conducted in IM settings.5, 6 Attitudes toward other issues related to testing overuse differ by specialty7 and are likely to similarly vary with regard to unnecessary laboratory testing. Understanding differences in attitudes by clinical specialty is critical for framing tailored approaches to reducing inappropriate care.
We performed a cross-sectional survey of a diverse group of hospital clinicians to describe attitudes and beliefs regarding laboratory testing and its overuse across clinical specialties (eg, medical, surgical, and pediatric). We hypothesized that attitudes toward the need for testing would differ across specialties.
METHODS
Survey Development and Administration
The study was conducted at Memorial Sloan Kettering Cancer Center, a tertiary academic cancer hospital in New York City. The 12-item survey was adopted from a previously administered but not formally validated survey (Online-only Appendix).5,8 The survey was pilot tested with 4 physicians, 3 NPs, 2 PAs, and 3 RNs and edited for content and clarity. All staff providers including NPs, PAs, RNs, and resident, fellow, and attending MDs working in the hospital during the 2-week survey period (November 2-15, 2015) were eligible to participate and were emailed a link to the survey. The email invitation was resent 3 times during the survey period. Participants who completed the survey received a coupon for a free coffee. The study was reviewed by the Institutional Review Board and exempted from ongoing oversight.
Measures
Demographic items included clinical specialty, provider type, and gender (Online-only Appendix). The remaining survey questions included the following categories:
1. Attitudes toward laboratory testing were evaluated by 3 items about accepted norms for lab testing and 2 items about fears (Table 2). Responses to these items used a 4-point Likert scale (strongly agree to strongly disagree).
2. Drivers contributing to unnecessary testing were evaluated by presenting a list of possible contributing factors (Table 2). Responses to these items used a 3-point Likert scale (contributes a lot, contributes a little, or does not contribute).
Analysis
We used univariate statistics to describe demographics and survey responses. We used the chi-square statistic to evaluate differences in attitudes and drivers by clinical specialty. We dichotomized responses regarding attitudes toward lab testing (“strongly agree” and “somewhat agree” vs. “somewhat disagree” and “strongly disagree.”) and beliefs regarding contributing drivers (“contributes a lot” vs all others). We grouped clinical specialty into medical/med-oncology, surgical, pediatric, and other (gynecological, critical care, and other).
We used logistic regression to explore the associations between attitudes/drivers and clinical specialty after adjusting for provider type, and report the overall P-value. We used pediatrics as the reference group to assess direct comparisons with each of the other specialties. We performed analyses with SAS statistical software, version 9.4 (SAS Institute, Cary, North Carolina) and considered P < .05 to be significant.
RESULTS
Among 1580 eligible participants, 837 (53%) completed surveys. Attending MD response rates ranged between 61% (surgical) to 86% (pediatric); rates were 59% for all trainees, 72% for PAs and 46% for RNs and NPs combined. Given privacy concerns, we were unable to collect detailed response rate information or any information about nonrespondents. The demographics are shown in Table 1.
Attitudes toward Laboratory Testing
The majority of respondents agreed that hospitalized patients should get daily labs (59%), testing on the discharge day (52%), and that daily testing generally enhances safety (55%; Table 2). Fewer pediatric and surgical clinicians endorsed that laboratory testing should be done daily (56% and 47% respectively) and enhances patient safety (46% and 47%). These differences were significant after adjusting for provider type. In addition, fewer pediatric providers endorsed the statement that daily laboratory testing helps avoid malpractice litigation. Overall, 68% of respondents agreed they would be comfortable with less testing.
Drivers Contributing to Unnecessary Laboratory Testing
The strongest drivers of unnecessary testing were seen as habit (94% responding “contributes a lot”) and institutional culture (89% responding “contributes a lot”; Table 2). After adjusting for provider type, significant differences were observed based on clinical specialty. In particular, pediatric specialists were less likely to endorse fear of litigation (P < .001) and more likely to endorse pressure from patient/family (P = .0003) compared to all other specialties (Table 2, odd ratios not shown).
DISCUSSION
Overuse of laboratory testing in hospitalized patients is widely recognized in IM and likely to be prevalent in other clinical specialties. Our study elucidated differences in attitudes toward unnecessary testing and self-identified drivers across specialties in a diverse group of clinical providers at an academic cancer center. We found differences based on clinical specialty, with those caring for pediatric and surgical patients less likely than others to believe that testing should be done daily and that daily testing enhances patient safety. Furthermore, comfort with less testing was highest among pediatric specialists. Habit and institutional culture were recognized broadly as the strongest drivers of laboratory testing overuse.
Our findings regarding differences based on clinical specialty are novel. Respondents caring for pediatric patients generally placed lower value on testing, and IM clinicians were the most likely to endorse daily testing and to believe that it enhances patient safety and helps avoid malpractice litigation. The difference between adult and pediatric clinicians is surprising given the fundamental similarities between these specialties.9 Although some resource use studies have described differences across specialties, none has examined differences in laboratory testing or examined the practice patterns of clinicians who are not physicians across specialties.10 Prior studies have documented the impact of training location on practice11,12, suggesting the importance of the local training culture.13 As physician personalities vary across clinical specialties14 it is likely that culture varies as well. Specialty-specific cultures are likely to strongly influence attitudes and practice patterns and warrant further exploration.
Clinicians in our sample identified drivers of unnecessary laboratory testing that were consistent with other studies, most frequently endorsing habit, followed by culture, discomfort with not knowing, and concern that someone will ask for the results.5,15 Previous studies have focused on IM and have not included nonphysicians or compared attitudes across specialties. We found that the largest differences in drivers by specialty were related to malpractice concerns and the perception of pressure from patients or families. The low endorsement of defensive medicine among clinicians serving pediatric populations may imply that interventions to reduce unnecessary care in hospitalized children may not need to address malpractice fear. In contrast, clinicians from pediatrics identified family pressure as a greater driver of unnecessary testing. Efforts to reduce unnecessary laboratory testing in pediatrics will need to address parent expectations.
Our findings have implications for efforts to reduce unnecessary testing. Culture, identified as a key driver of testing, reflects leadership priorities, institutional history, and other factors and is difficult to specifically target. Habit, the other most-endorsed driver, is a more promising target for quality improvement interventions, particularly those addressing care processes (eg, electronic ordering). Discomfort with not knowing and fear of being asked are drivers that might be influenced by better communication about information expectations by supervising physicians and hospital administration. Lastly, education about the potential harms of excessive testing may facilitate more targeted efforts to reduce testing overuse.
Our study has important limitations. The cancer focus of the center may have influenced provider attitudes and practices. Attitudes may differ at community centers, though important differences regarding routine laboratory testing are unlikely. Second, although our sample was large, our response rate was modest at 53% and as low as 46% among RNs and NPs and we have no information regarding nonresponders. This response rate, though, was comparable to response rates seen in other large surveys.5,15 In addition, our results reflect clinician self-report; perceptions of necessity and the true need for testing may vary across specialties and the true subconscious drivers of behavior may differ. However, differences across specialties are likely to be valid even if there are other factors at play. Self assessment of unnecessary testing may also underestimate prevalence of the problem. Finally, our findings related to drivers of unnecessary testing are descriptive rather than quantitative given the lack of validated scales.
In conclusion, we evaluated attitudes toward routine laboratory testing in hospitalized patients in clinicians across specialties and found important differences. These findings speak to the diversity of cultures of medical care even within a single institution and point to the importance of studying attitudes about overused services across clinical specialties. In particular, as medical fields beyond IM increasingly recognize the importance of reducing medical overuse both in and out of the hospital, our findings highlight the importance of elucidating specialty-specific attitudes to optimize interventions to address unnecessary testing.
Disclosures
Mr. Husain, Ms. Gennarelli, Ms. White4, Mr. Masciale, MA5, and Dr. Roman, MD, have nothing to disclose. The work of Dr. Roman and Dr. Korenstein on this project was supported, in part, by a Cancer Center Support Grant from the National Cancer Institute to Memorial Sloan Kettering Cancer Center (P30 CA008748)
1. Zhi M, Ding EL, Theisen-Toupal J, Whelan J, Arnaout R. The landscape of inappropriate laboratory testing: a 15-year meta-analysis. PloS One. 2013;8(11):e78962. DOI: 10.1371/journal.pone.0078962. PubMed
2. Thavendiranathan P, Bagai A, Ebidia A, Detsky AS, Choudhry NK. Do blood tests cause anemia in hospitalized patients? The effect of diagnostic phlebotomy on hemoglobin and hematocrit levels. J Gen Intern Med. 2005;20(6):520-524. DOI: 10.1111/j.1525-1497.2005.0094.x. PubMed
3. Eaton KP, Levy K, Soong C, et al. Evidence-based guidelines to eliminate repetitive laboratory testing. JAMA Intern Med. 2017;177(12):1833-1839. DOI: 10.1001/jamainternmed.2017.5152 PubMed
4. Choosing wisely. http://www.choosingwisely.org/resources/. Accessed November 21, 2017.
5. Sedrak MS, Patel MS, Ziemba JB, et al. Residents’ self-report on why they order perceived unnecessary inpatient laboratory tests. J Hosp Med. 2016;11(12):869-872. DOI: 10.1002/jhm.2645. PubMed
6. Thakkar RN, Kim D, Knight AM, Riedel S, Vaidya D, Wright SM. Impact of an educational intervention on the frequency of daily blood test orders for hospitalized patients. Am J Clin Pathol. 2015;143(3):393-397. DOI: 10.1309/AJCPJS4EEM7UAUBV. PubMed
7. Sheeler RD, Mundell T, Hurst SA, et al. Self-reported rationing behavior among US physicians: a national survey. J Gen Intern Med. 2016;31(12):1444-1451. DOI: 10.1007/s11606-016-3756-5. PubMed
8. Roman BR, Yang A, Masciale J, Korenstein D. Association of attitudes regarding overuse of inpatient laboratory testing with health care provider type. JAMA Intern Med. 2017;177(8):1205-1207. DOI: 10.1001/jamainternmed.2017.1634. PubMed
9. Schatz IJ, Realini JP, Charney E. Family practice, internal medicine, and pediatrics as partners in the education of generalists. Acad Med. 1996;71(1):35-39. PubMed
10. Johnson RE, Freeborn DK, Mullooly JP. Physicians’ use of laboratory, radiology, and drugs in a prepaid group practice HMO. Health Serv Res. 1985;20(5):525-547. PubMed
11. Chen C, Petterson S, Phillips R, Bazemore A, Mullan F. Spending patterns in region of residency training and subsequent expenditures for care provided by practicing physicians for Medicare beneficiaries. JAMA. Dec 10, 2014;312(22):2385-2393. DOI: 10.1001/jama.2014.15973. PubMed
12. Sirovich BE, Lipner RS, Johnston M, Holmboe ES. The association between residency training and internists’ ability to practice conservatively. JAMA Intern Med. 2014;174(10):1640-1648. DOI: 10.1001/jamainternmed.2014.3337. PubMed
13. Smith CD, Korenstein D. Harnessing the power of peer pressure to reduce health care waste and improve clinical outcomes. Mayo Clin Proc. 2015;90(3):311-312. DOI: https://doi.org/10.1017/ice.2015.136 PubMed
14. Vaidya NA, Sierles FS, Raida MD, Fakhoury FJ, Przybeck TR, Cloninger CR. Relationship between specialty choice and medical student temperament and character assessed with Cloninger Inventory. Teach Learn Med. 2004;16(2):150-156. DOI: 10.1207/s15328015tlm1602_6 PubMed
15. Studdert DM, Mello MM, Sage WM, et al. Defensive medicine among high-risk specialist physicians in a volatile malpractice environment. JAMA. 2005;293(21):2609-2617. DOI: 10.1001/jama.293.21.2609 PubMed
© 2018 Society of Hospital Medicine
Prevalence of Staphylococcus aureus and Use of Antistaphylococcal Therapy in Children Hospitalized with Pneumonia
Although Staphylococcus aureus pneumonia is common in children with cystic fibrosis and those with healthcare-associated infections (eg, ventilator-associated pneumonia),1,2 S. aureus is an uncommon cause of community-acquired pneumonia in children. In recent years, concerns have arisen about the increasing frequency and severity of staphylococcal pneumonia, largely fueled by the emergence of community-associated methicillin-resistant S. aureus (MRSA).3,4 Thus, therapy with clindamycin or vancomycin, both active against MRSA, has been recommended when S. aureus is suspected.5 Given the lack of rapid and sensitive approaches to the detection of the etiologies of pneumonia, antibiotic selection is most often empirical, contributing to overuse of anti-MRSA antibiotics. In addition, resistance against these antibiotics, especially clindamycin, has been increasing.6,7
A better understanding of the likelihood of staphylococcal pneumonia would help to optimize empirical antibiotic selection, allowing for judicious use of antistaphylococcal antibiotics, while also avoiding poor outcomes due to delays in effective treatment when S. aureus is present.8 Using data from a multicenter, population-based study of pneumonia hospitalizations in children, we sought to describe the prevalence, clinical characteristics, and in-hospital outcomes of staphylococcal pneumonia and the prevalence of antistaphylococcal antibiotic use.
METHODS
The Etiology of Pneumonia in the Community (EPIC) study was a prospective, active, population-based surveillance study of pneumonia hospitalizations among children (age <18 years) conducted between 2010 and 2012 at three children’s hospitals, including two in Tennessee and one in Utah.9 Children hospitalized with clinical evidence of pneumonia and radiographic evidence confirmed by a blinded review by study radiologists were enrolled. Etiologic assessments included blood analysis for bacterial culture, serology for eight respiratory viruses, pneumococcal and group A streptococcal polymerase chain reaction (PCR), and naso/oro-pharyngeal swabs for PCR for 13 respiratory viruses, Mycoplasma pneumoniae, and Chlamydophila pneumoniae. Data from other clinical specimens (pleural fluid, high-quality endotracheal aspirate, or quantified bronchoalveolar lavage fluid) were also recorded. For this study, we included only children with at least one bacterial culture and complete information about antibiotic use. Those with confirmed fungal pneumonia were excluded. Additional details regarding the study population and methods have been published previously.9
Staphylococcal pneumonia was defined based on the detection of S. aureus by culture (any site) or PCR (pleural fluid only), regardless of codetection of other pathogens. Antibiotic susceptibility profiles were used to classify S. aureus isolates as MRSA or methicillin-sensitive S. aureus (MSSA). The remaining children were classified as nonstaphylococcal pneumonia including children with other bacterial pathogens detected (classified as other bacterial pneumonia, excludes atypical bacteria), atypical bacteria, viruses, and no pathogens detected.
Use of anti-MRSA antibiotics (vancomycin, clindamycin, linezolid, doxycycline, and trimethoprim-sulfamethoxazole) and any antistaphylococcal antibiotics (anti-MRSA agents plus oxacillin, nafcillin, and cefazolin) during and after the first two calendar days of admission was identified by medical record review.
Descriptive statistics included number (%) and median (interquartile range, [IQR]) for categorical and continuous variables, respectively. Baseline clinical characteristics and outcomes were compared between children with staphylococcal versus nonstaphylococcal pneumonia, those with staphylococcal versus other bacterial pneumonia, and those with MRSA versus MSSA pneumonia using Wilcoxon rank-sum and Pearson’s chi-square tests where appropriate. To account for multiple comparisons, we used a Bonferroni corrected P value threshold of <.001 to determine statistical significance.
RESULTS
Of the 2,358 children enrolled in the EPIC study hospitalized with radiographically confirmed pneumonia, 2,146 (91.0%) had ≥1 bacterial culture obtained. Two children with Histoplasma capsulatum fungal infection and six children with incomplete antibiotic utilization data were excluded, yielding a final study population of 2,138 children. Among these, blood samples were obtained from 2,134 (>99%) children for culture, pleural fluid from 87 (4%) children, bronchoalveolar lavage fluid from 31 (1%) children, and endotracheal aspirate from 80 (4%) children. Across all culture types, there were 2,332 initial cultures; 2,150 (92%) were collected within the first 24 hours.
Staphylococcal pneumonia was detected in 23 of the 2,138 children (1% [95% CI 0.7, 1.6]; 17 MRSA, 6 MSSA). Of these, 6/23 (26%) had bacteremia, 12/23 (52%) had a positive pleural fluid, and 9/23 (39%) had a positive culture from bronchoalveolar lavage fluid or endotracheal aspirate; 4/23 (17%) children had S. aureus detected from more than one site. Three children (13%) with S. aureus had a viral codetection, including two with influenza.
Compared with children with nonstaphylococcal pneumonia, those with staphylococcal pneumonia were more likely to have a parapneumonic effusion (78% vs 12%, P < .001), but less likely to have cough (78% vs 95%, P < .001). Other baseline characteristics were similar between the two groups. Children with staphylococcal pneumonia had more adverse outcomes than those without (Table), including longer median length of stay (10 vs 3 days, P < .001), more frequent admission to intensive care (83% vs 21%, P < .001), and more frequent invasive mechanical ventilation (65% vs 7%, P < .001). Similar findings were noted when staphylococcal pneumonia was compared with pneumonia caused due to other bacterial pathogens (n = 124). There were no significant differences in baseline characteristics or clinical course between children with MRSA and MSSA pneumonia, although the numbers were small. Overall, S. aureus was detected in 18/267 (7%) children with parapneumonic effusion and 19/462 (4%) children admitted to intensive care. Importantly, there were no confirmed S. aureus cases among children with less severe pneumonia, defined as lacking both parapneumonic effusion and intensive care admission (n = 1,488).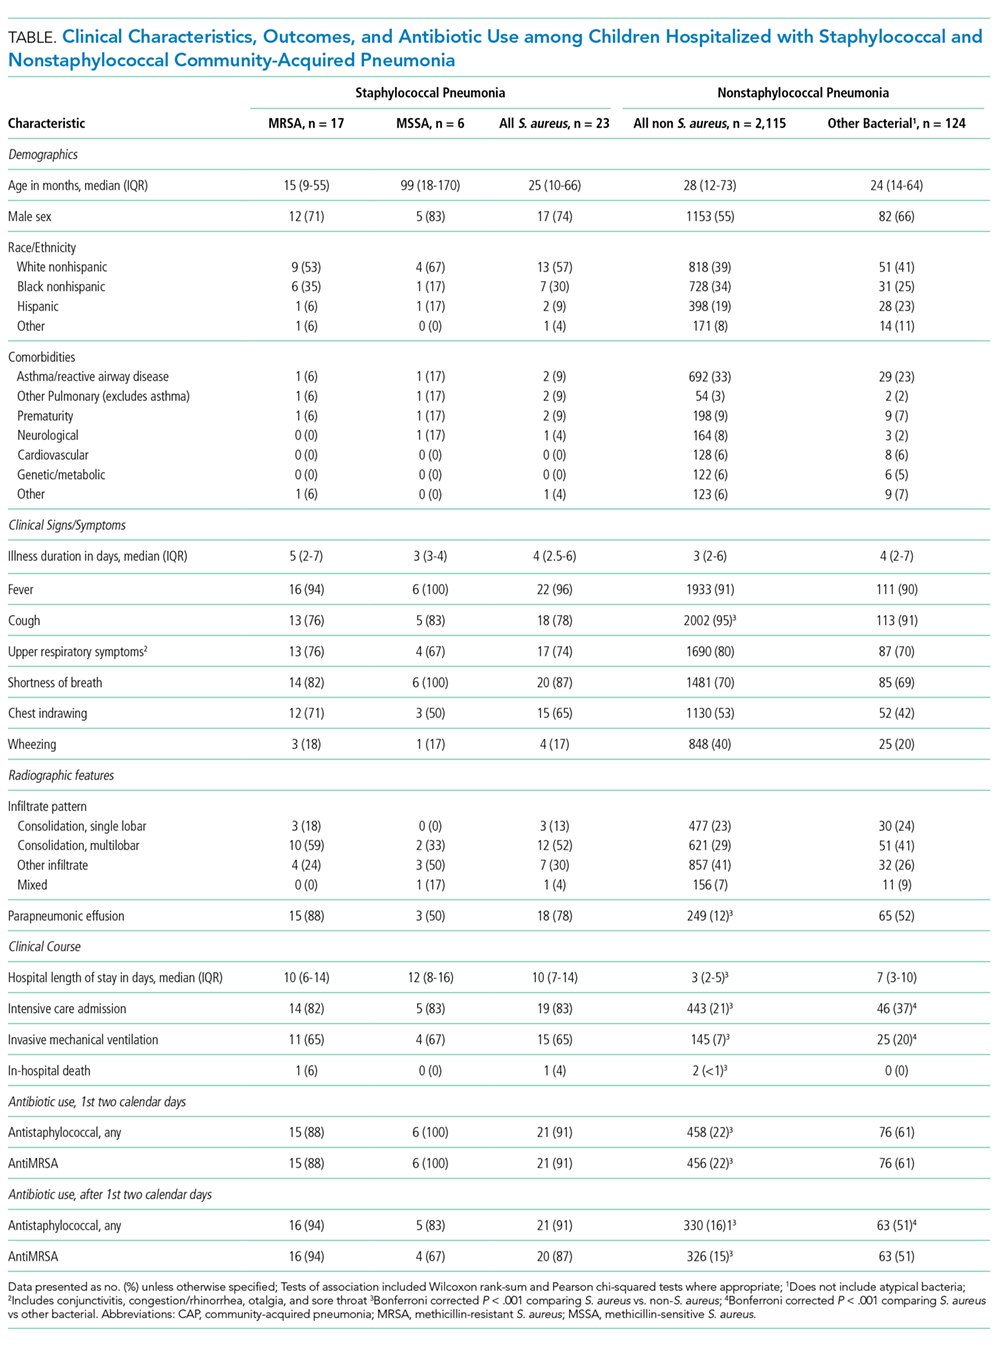
Overall, 519 children (24%) received antistaphylococcal therapy during their hospitalization (512/519, 99% received anti-MRSA therapy), including 22 of the 23 children with S. aureus detected (the only child without antistaphylococcal therapy had S. aureus detected from a high-quality endotracheal tube aspirate only and also had respiratory syncytial virus detected). Clindamycin was most often used (n = 266, 51%), followed by vancomycin (n = 128, 24%), clindamycin plus vancomycin (n = 83, 16%), and others (n = 42, 8%). During the first two days of hospitalization, 479 children (22%) received antistaphylococcal therapy (477 received anti-MRSA therapy). After the first two days, 351 children (16%) received antistaphylococcal therapy (346/351, 99% received anti-MRSA therapy). Use of antistaphylococcal therapy was very common in those admitted to intensive care (182/462, 39%; all but two received anti-MRSA therapy) and in those requiring invasive mechanical ventilation (103/159, 65%). Among those lacking both parapneumonic effusion and intensive care admission (n = 1488), 232 (16%) received antistaphylococcal therapy.
DISCUSSION
In our large, population-based study of >2,000 children hospitalized with community-acquired pneumonia, S. aureus was identified in only 1% of children. Compared with children with other pneumonia etiologies, staphylococcal pneumonia was associated with increased disease severity. Among the small numbers studied, no differences in outcomes were found between children with MRSA and MSSA disease. Despite the low prevalence of staphylococcal pneumonia, almost 1 in 4 children received antistaphylococcal antibiotic therapy; anti-MRSA therapy was used almost exclusively.
The severity of staphylococcal pneumonia was striking, with >80% of children with S. aureus detected being admitted to intensive care, about 65% requiring invasive mechanical ventilation, and >75% with parapneumonic effusion. These findings are similar to those of prior retrospective studies.4,10 The association between staphylococcal pneumonia and adverse outcomes underscores the importance of prompt institution of antimicrobial therapy targeting S. aureus in high-risk patients. This is noteworthy given recent epidemiological data demonstrating increases in MSSA relative to MRSA infections in children,6 and the known superiority of beta-lactam versus vancomycin for MSSA infections, including pneumonia.11
Although detection of staphylococcal infection was rare, almost a quarter of children received antistaphylococcal therapy; nearly all of these children received anti-MRSA therapy. Confirming a bacterial etiology of pneumonia, however, is challenging. Given the severity associated with staphylococcal pneumonia, it is not surprising that use of antistaphylococcal therapy outpaced staphylococcal detections. Antistaphylococcal therapy was especially common in those with severe pneumonia, suggesting that disease severity is an important factor that influences initial antibiotic treatment decisions. Even so, two children with MRSA detected did not initially receive anti-MRSA therapy, highlighting the challenge of balancing judicious antibiotic selection along with ensuring effective treatment. Perhaps more striking is the finding that 16% of children received antistaphylococcal therapy beyond the first two days of hospitalization, presumably after the initial culture results were available. This suggests that clinicians are reluctant to stop antistaphylococcal therapy when the etiology is unknown, although certain features, such as negative cultures, rapid clinical improvement, and lack of risk factors for staphylococcal disease, may provide important clues to support de-escalation of empiric antibiotic therapy. It is also possible that some antibiotics with antistaphylococcal activity were used for alternative indications (eg, clindamycin for penicillin allergy or concern for aspiration pneumonia).
A simple strategy for tailoring antibiotic treatment is maximizing opportunities to identify a causative pathogen. Despite the very low yield of blood cultures in children with pneumonia overall, bacteremia is more common in children with severe pneumonia and those with parapneumonic effusion, especially when cultures are obtained prior to antibiotic use.12,13 Similarly, obtaining pleural fluid is often therapeutic and significantly improves the chances of identifying a bacterial pathogen.14 Moreover, at least one study suggests that S. aureus is much less likely in cases of culture-negative parapneumonic effusions.15 Institutional guidelines, order sets, and antimicrobial stewardship teams are also effective strategies that can facilitate judicious antibiotic use. In particular, stewardship experts can be very useful in assisting clinicians around de-escalation of therapy.16 Use of procalcitonin, a biomarker associated with bacterial infections,17 and prognostic tools to identify risk for adverse outcomes,18 may also inform treatment decisions and are deserving of further study.
Our study must be considered in
Our study demonstrates a very low prevalence of S. aureus detection among children hospitalized with pneumonia and highlights the association between staphylococcal disease and adverse in-hospital outcomes. We also document important discrepancies between disease prevalence and utilization of antistaphylococcal therapy, especially anti-MRSA therapy. Improved approaches are needed to minimize overuse of antistaphylococcal antibiotics while also ensuring adequate therapy for those who need it.
Disclosures
Drs. Zhu, Edwards, Self, Ampofo, Arnold, McCullers, and Williams report grants from the Centers for Disease Control and Prevention during the conduct of the study. Ms. Frush has nothing to disclose. Dr. Jain has nothing to disclose. Dr. Grijalva reports other from Merck, grants and other from Sanofi, other from Pfizer, grants from CDC, grants from AHRQ, grants from NIH, and grants from Campbell Alliance, outside the submitted work. Dr. Self reports grants from CDC, during the conduct of the study; personal fees from Cempra Pharmaceuticals, grants and personal fees from Ferring Pharmaceuticals, personal fees from BioTest AG, personal fees from Abbott Point of Care, personal fees from Gilead Pharmaceuticals, personal fees from Pfizer, grants from Merck, outside the submitted work. Dr. Thomsen has nothing to disclose. Dr. Ampofo reports grants from CDC, during the conduct of the study; other from GlaxoSmithKline, other from Cubist Pharmaceuticals outside the submitted work; and KA collaborate with BioFire Diagnostics, Inc. (formerly Idaho Technology, Inc.) on several NIH grants. Dr. Pavia reports grants from NAID/NIH, grants from NAID/NIH, grants from CDC, personal fees from WebMD, personal fees from Antimicrobial Therapy Inc., outside the submitted work.
Funding
This work was supported by the National Institute of Allergy and Infectious Diseases of the National Institutes of Health under Award Number K23AI104779 to D.J.W. and Award 1K23AI113150 to I.P.T., the National Institute of General Medical Sciences under Award K23GM110469 to W.H.S., and the Agency for Healthcare Research and Quality under Award R03HS022342 to C.G.G. The EPIC study was supported by the Influenza Division in the National Center for Immunizations and Respiratory Diseases at the Centers for Disease Control and Prevention through cooperative agreements with each study site and was based on a competitive research funding opportunity. The findings and conclusions in this report are those of the authors and do not necessarily represent the views of the National Institute of Allergy and Infectious Diseases, the National Institute of General Medical Sciences, the Agency for Healthcare Research and Quality, or the Centers for Disease Control and Prevention.
1. Akil N, Muhlebach MS. Biology and management of methicillin resistant Staphylococcus aureus in cystic fibrosis. Pediatr Pulmonol. 2018. doi: 10.1002/ppul.24139. PubMed
2. Srinivasan R, Asselin J, Gildengorin G, Wiener-Kronish J, Flori HR. A prospective study of ventilator-associated pneumonia in children. Pediatrics.
2009;123(4):1108-1115. doi: 10.1542/peds.2008-1211. PubMed
3. Gonzalez BE, Martinez-Aguilar G, Hulten KG, et al. Severe Staphylococcal sepsis in adolescents in the era of community-acquired methicillin-resistant Staphylococcus aureus. Pediatrics. 2005;115(3):642-648. doi: 10.1542/peds.2004-2300. PubMed
4. Carrillo-Marquez MA, Hulten KG, Hammerman W, Lamberth L, Mason EO, Kaplan SL. Staphylococcus aureus pneumonia in children in the era of community-acquired methicillin-resistance at Texas Children’s Hospital. Pediatr Infect Dis J. 2011;30(7):545-550. doi: 10.1097/INF.0b013e31821618be. PubMed
5. Bradley JS, Byington CL, Shah SS, et al. The management of community-acquired pneumonia in infants and children older than 3 months of age: clinical practice guidelines by the pediatric infectious diseases society and the infectious diseases society of America. Clin Infect Dis. 2011;53(7):e25-e76. doi: 10.1093/cid/cir531. PubMed
6. Sutter DE, Milburn E, Chukwuma U, Dzialowy N, Maranich AM, Hospenthal DR. Changing susceptibility of Staphylococcus aureus in a US pediatric population. Pediatrics. 2016;137(4):e20153099–e20153099. doi: 10.1542/peds.2015-3099. PubMed
7. Sakoulas G, Moellering RC, Jr. Increasing antibiotic resistance among methicillin-resistant Staphylococcus aureus strains. Clin Infect Dis. 2008;46(Suppl 5):S360-S367. doi: 10.1086/533592. PubMed
8. Rubinstein E, Kollef MH, Nathwani D. Pneumonia caused by methicillin-resistant
Staphylococcus aureus. Clin Infect Dis. 2008;46(Suppl 5):S378-S385. doi: 10.1086/533594. PubMed
9. Jain S, Williams DJ, Arnold SR, et al. Community-acquired pneumonia requiring hospitalization among U.S. children. N Engl J Med. 2015;372(9):835-845. doi: 10.1056/NEJMoa1405870. PubMed
10. Kallen AJ, Reed C, Patton M, Arnold KE, Finelli L, Hageman J. Staphylococcus aureus community-onset pneumonia in patients admitted to children’s hospitals during autumn and winter of 2006-2007. Epidemiol Infect. 2010;138(5):666-672. doi: 10.1017/S095026880999135X. PubMed
11. González C, Rubio M, Romero-Vivas J, González M, Picazo JJ. Bacteremic pneumonia due to Staphylococcus aureus: A comparison of disease caused by methicillin-resistant and methicillin-susceptible organisms. Clin Infect Dis. 1999;29(5):1171-1177. doi: 10.1086/313440. PubMed
12. Myers AL, Hall M, Williams DJ, et al. Prevalence of bacteremia in hospitalized pediatric patients with community-acquired pneumonia. Pediatr Infect Dis J. 2013;32(7):736-740. doi: 10.1097/INF.0b013e318290bf63. PubMed
13. Iroh Tam PY, Bernstein E, Ma X, Ferrieri P. Blood culture in evaluation of pediatric community-acquired pneumonia: A systematic review and meta-analysis. Hosp Pediatr. 2015;5(6):324-336. doi: 10.1542/hpeds.2014-0138. PubMed
14. Byington CL, Spencer LY, Johnson TA, et al. An epidemiological investigation of a sustained high rate of pediatric parapneumonic empyema: risk factors and microbiological associations. Clin Infect Dis. 2002;34(4):434-440. doi: 10.1086/338460. PubMed
15. Blaschke AJ, Heyrend C, Byington CL, et al. Molecular analysis improves pathogen identifi cation and epidemiologic study of pediatric parapneumonic empyema. Pediatr Infect Dis J. 2011;30(4):289-294. doi: 10.1097/INF.0b013e3182002d14. PubMed
16. Banerjee R, Teng CB, Cunningham SA, et al. Randomized trial of rapid multiplex polymerase chain reaction-based blood culture identifi cation and susceptibility testing. Clin Infect Dis. 2015;61(7):1071-1080. doi: 10.1093/cid/civ447. PubMed
17. Stockmann C, Ampofo K, Killpack J, et al. Procalcitonin accurately identifies hospitalized children with low risk of bacterial community-acquired pneumonia. J Pediatr Infect Dis Soc. 2018;7(1):46–53. doi: 10.1093/jpids/piw091. PubMed
18. Williams DJ, Zhu Y, Grijalva CG, et al. Predicting severe pneumonia outcomes in children. Pediatrics. 2016;138(4). doi: 10.1542/peds.2016-1019. PubMed
19. Brogan TV, Hall M, Williams DJ, et al. Variability in processes of care and outcomes among children hospitalized with community-acquired pneumonia. Pediatr Infect Dis J. 2012;31(10):1036-1041. doi: 10.1097/INF.0b013e-31825f2b10. PubMed
Although Staphylococcus aureus pneumonia is common in children with cystic fibrosis and those with healthcare-associated infections (eg, ventilator-associated pneumonia),1,2 S. aureus is an uncommon cause of community-acquired pneumonia in children. In recent years, concerns have arisen about the increasing frequency and severity of staphylococcal pneumonia, largely fueled by the emergence of community-associated methicillin-resistant S. aureus (MRSA).3,4 Thus, therapy with clindamycin or vancomycin, both active against MRSA, has been recommended when S. aureus is suspected.5 Given the lack of rapid and sensitive approaches to the detection of the etiologies of pneumonia, antibiotic selection is most often empirical, contributing to overuse of anti-MRSA antibiotics. In addition, resistance against these antibiotics, especially clindamycin, has been increasing.6,7
A better understanding of the likelihood of staphylococcal pneumonia would help to optimize empirical antibiotic selection, allowing for judicious use of antistaphylococcal antibiotics, while also avoiding poor outcomes due to delays in effective treatment when S. aureus is present.8 Using data from a multicenter, population-based study of pneumonia hospitalizations in children, we sought to describe the prevalence, clinical characteristics, and in-hospital outcomes of staphylococcal pneumonia and the prevalence of antistaphylococcal antibiotic use.
METHODS
The Etiology of Pneumonia in the Community (EPIC) study was a prospective, active, population-based surveillance study of pneumonia hospitalizations among children (age <18 years) conducted between 2010 and 2012 at three children’s hospitals, including two in Tennessee and one in Utah.9 Children hospitalized with clinical evidence of pneumonia and radiographic evidence confirmed by a blinded review by study radiologists were enrolled. Etiologic assessments included blood analysis for bacterial culture, serology for eight respiratory viruses, pneumococcal and group A streptococcal polymerase chain reaction (PCR), and naso/oro-pharyngeal swabs for PCR for 13 respiratory viruses, Mycoplasma pneumoniae, and Chlamydophila pneumoniae. Data from other clinical specimens (pleural fluid, high-quality endotracheal aspirate, or quantified bronchoalveolar lavage fluid) were also recorded. For this study, we included only children with at least one bacterial culture and complete information about antibiotic use. Those with confirmed fungal pneumonia were excluded. Additional details regarding the study population and methods have been published previously.9
Staphylococcal pneumonia was defined based on the detection of S. aureus by culture (any site) or PCR (pleural fluid only), regardless of codetection of other pathogens. Antibiotic susceptibility profiles were used to classify S. aureus isolates as MRSA or methicillin-sensitive S. aureus (MSSA). The remaining children were classified as nonstaphylococcal pneumonia including children with other bacterial pathogens detected (classified as other bacterial pneumonia, excludes atypical bacteria), atypical bacteria, viruses, and no pathogens detected.
Use of anti-MRSA antibiotics (vancomycin, clindamycin, linezolid, doxycycline, and trimethoprim-sulfamethoxazole) and any antistaphylococcal antibiotics (anti-MRSA agents plus oxacillin, nafcillin, and cefazolin) during and after the first two calendar days of admission was identified by medical record review.
Descriptive statistics included number (%) and median (interquartile range, [IQR]) for categorical and continuous variables, respectively. Baseline clinical characteristics and outcomes were compared between children with staphylococcal versus nonstaphylococcal pneumonia, those with staphylococcal versus other bacterial pneumonia, and those with MRSA versus MSSA pneumonia using Wilcoxon rank-sum and Pearson’s chi-square tests where appropriate. To account for multiple comparisons, we used a Bonferroni corrected P value threshold of <.001 to determine statistical significance.
RESULTS
Of the 2,358 children enrolled in the EPIC study hospitalized with radiographically confirmed pneumonia, 2,146 (91.0%) had ≥1 bacterial culture obtained. Two children with Histoplasma capsulatum fungal infection and six children with incomplete antibiotic utilization data were excluded, yielding a final study population of 2,138 children. Among these, blood samples were obtained from 2,134 (>99%) children for culture, pleural fluid from 87 (4%) children, bronchoalveolar lavage fluid from 31 (1%) children, and endotracheal aspirate from 80 (4%) children. Across all culture types, there were 2,332 initial cultures; 2,150 (92%) were collected within the first 24 hours.
Staphylococcal pneumonia was detected in 23 of the 2,138 children (1% [95% CI 0.7, 1.6]; 17 MRSA, 6 MSSA). Of these, 6/23 (26%) had bacteremia, 12/23 (52%) had a positive pleural fluid, and 9/23 (39%) had a positive culture from bronchoalveolar lavage fluid or endotracheal aspirate; 4/23 (17%) children had S. aureus detected from more than one site. Three children (13%) with S. aureus had a viral codetection, including two with influenza.
Compared with children with nonstaphylococcal pneumonia, those with staphylococcal pneumonia were more likely to have a parapneumonic effusion (78% vs 12%, P < .001), but less likely to have cough (78% vs 95%, P < .001). Other baseline characteristics were similar between the two groups. Children with staphylococcal pneumonia had more adverse outcomes than those without (Table), including longer median length of stay (10 vs 3 days, P < .001), more frequent admission to intensive care (83% vs 21%, P < .001), and more frequent invasive mechanical ventilation (65% vs 7%, P < .001). Similar findings were noted when staphylococcal pneumonia was compared with pneumonia caused due to other bacterial pathogens (n = 124). There were no significant differences in baseline characteristics or clinical course between children with MRSA and MSSA pneumonia, although the numbers were small. Overall, S. aureus was detected in 18/267 (7%) children with parapneumonic effusion and 19/462 (4%) children admitted to intensive care. Importantly, there were no confirmed S. aureus cases among children with less severe pneumonia, defined as lacking both parapneumonic effusion and intensive care admission (n = 1,488).
Overall, 519 children (24%) received antistaphylococcal therapy during their hospitalization (512/519, 99% received anti-MRSA therapy), including 22 of the 23 children with S. aureus detected (the only child without antistaphylococcal therapy had S. aureus detected from a high-quality endotracheal tube aspirate only and also had respiratory syncytial virus detected). Clindamycin was most often used (n = 266, 51%), followed by vancomycin (n = 128, 24%), clindamycin plus vancomycin (n = 83, 16%), and others (n = 42, 8%). During the first two days of hospitalization, 479 children (22%) received antistaphylococcal therapy (477 received anti-MRSA therapy). After the first two days, 351 children (16%) received antistaphylococcal therapy (346/351, 99% received anti-MRSA therapy). Use of antistaphylococcal therapy was very common in those admitted to intensive care (182/462, 39%; all but two received anti-MRSA therapy) and in those requiring invasive mechanical ventilation (103/159, 65%). Among those lacking both parapneumonic effusion and intensive care admission (n = 1488), 232 (16%) received antistaphylococcal therapy.
DISCUSSION
In our large, population-based study of >2,000 children hospitalized with community-acquired pneumonia, S. aureus was identified in only 1% of children. Compared with children with other pneumonia etiologies, staphylococcal pneumonia was associated with increased disease severity. Among the small numbers studied, no differences in outcomes were found between children with MRSA and MSSA disease. Despite the low prevalence of staphylococcal pneumonia, almost 1 in 4 children received antistaphylococcal antibiotic therapy; anti-MRSA therapy was used almost exclusively.
The severity of staphylococcal pneumonia was striking, with >80% of children with S. aureus detected being admitted to intensive care, about 65% requiring invasive mechanical ventilation, and >75% with parapneumonic effusion. These findings are similar to those of prior retrospective studies.4,10 The association between staphylococcal pneumonia and adverse outcomes underscores the importance of prompt institution of antimicrobial therapy targeting S. aureus in high-risk patients. This is noteworthy given recent epidemiological data demonstrating increases in MSSA relative to MRSA infections in children,6 and the known superiority of beta-lactam versus vancomycin for MSSA infections, including pneumonia.11
Although detection of staphylococcal infection was rare, almost a quarter of children received antistaphylococcal therapy; nearly all of these children received anti-MRSA therapy. Confirming a bacterial etiology of pneumonia, however, is challenging. Given the severity associated with staphylococcal pneumonia, it is not surprising that use of antistaphylococcal therapy outpaced staphylococcal detections. Antistaphylococcal therapy was especially common in those with severe pneumonia, suggesting that disease severity is an important factor that influences initial antibiotic treatment decisions. Even so, two children with MRSA detected did not initially receive anti-MRSA therapy, highlighting the challenge of balancing judicious antibiotic selection along with ensuring effective treatment. Perhaps more striking is the finding that 16% of children received antistaphylococcal therapy beyond the first two days of hospitalization, presumably after the initial culture results were available. This suggests that clinicians are reluctant to stop antistaphylococcal therapy when the etiology is unknown, although certain features, such as negative cultures, rapid clinical improvement, and lack of risk factors for staphylococcal disease, may provide important clues to support de-escalation of empiric antibiotic therapy. It is also possible that some antibiotics with antistaphylococcal activity were used for alternative indications (eg, clindamycin for penicillin allergy or concern for aspiration pneumonia).
A simple strategy for tailoring antibiotic treatment is maximizing opportunities to identify a causative pathogen. Despite the very low yield of blood cultures in children with pneumonia overall, bacteremia is more common in children with severe pneumonia and those with parapneumonic effusion, especially when cultures are obtained prior to antibiotic use.12,13 Similarly, obtaining pleural fluid is often therapeutic and significantly improves the chances of identifying a bacterial pathogen.14 Moreover, at least one study suggests that S. aureus is much less likely in cases of culture-negative parapneumonic effusions.15 Institutional guidelines, order sets, and antimicrobial stewardship teams are also effective strategies that can facilitate judicious antibiotic use. In particular, stewardship experts can be very useful in assisting clinicians around de-escalation of therapy.16 Use of procalcitonin, a biomarker associated with bacterial infections,17 and prognostic tools to identify risk for adverse outcomes,18 may also inform treatment decisions and are deserving of further study.
Our study must be considered in
Our study demonstrates a very low prevalence of S. aureus detection among children hospitalized with pneumonia and highlights the association between staphylococcal disease and adverse in-hospital outcomes. We also document important discrepancies between disease prevalence and utilization of antistaphylococcal therapy, especially anti-MRSA therapy. Improved approaches are needed to minimize overuse of antistaphylococcal antibiotics while also ensuring adequate therapy for those who need it.
Disclosures
Drs. Zhu, Edwards, Self, Ampofo, Arnold, McCullers, and Williams report grants from the Centers for Disease Control and Prevention during the conduct of the study. Ms. Frush has nothing to disclose. Dr. Jain has nothing to disclose. Dr. Grijalva reports other from Merck, grants and other from Sanofi, other from Pfizer, grants from CDC, grants from AHRQ, grants from NIH, and grants from Campbell Alliance, outside the submitted work. Dr. Self reports grants from CDC, during the conduct of the study; personal fees from Cempra Pharmaceuticals, grants and personal fees from Ferring Pharmaceuticals, personal fees from BioTest AG, personal fees from Abbott Point of Care, personal fees from Gilead Pharmaceuticals, personal fees from Pfizer, grants from Merck, outside the submitted work. Dr. Thomsen has nothing to disclose. Dr. Ampofo reports grants from CDC, during the conduct of the study; other from GlaxoSmithKline, other from Cubist Pharmaceuticals outside the submitted work; and KA collaborate with BioFire Diagnostics, Inc. (formerly Idaho Technology, Inc.) on several NIH grants. Dr. Pavia reports grants from NAID/NIH, grants from NAID/NIH, grants from CDC, personal fees from WebMD, personal fees from Antimicrobial Therapy Inc., outside the submitted work.
Funding
This work was supported by the National Institute of Allergy and Infectious Diseases of the National Institutes of Health under Award Number K23AI104779 to D.J.W. and Award 1K23AI113150 to I.P.T., the National Institute of General Medical Sciences under Award K23GM110469 to W.H.S., and the Agency for Healthcare Research and Quality under Award R03HS022342 to C.G.G. The EPIC study was supported by the Influenza Division in the National Center for Immunizations and Respiratory Diseases at the Centers for Disease Control and Prevention through cooperative agreements with each study site and was based on a competitive research funding opportunity. The findings and conclusions in this report are those of the authors and do not necessarily represent the views of the National Institute of Allergy and Infectious Diseases, the National Institute of General Medical Sciences, the Agency for Healthcare Research and Quality, or the Centers for Disease Control and Prevention.
1. Akil N, Muhlebach MS. Biology and management of methicillin resistant Staphylococcus aureus in cystic fibrosis. Pediatr Pulmonol. 2018. doi: 10.1002/ppul.24139. PubMed
2. Srinivasan R, Asselin J, Gildengorin G, Wiener-Kronish J, Flori HR. A prospective study of ventilator-associated pneumonia in children. Pediatrics.
2009;123(4):1108-1115. doi: 10.1542/peds.2008-1211. PubMed
3. Gonzalez BE, Martinez-Aguilar G, Hulten KG, et al. Severe Staphylococcal sepsis in adolescents in the era of community-acquired methicillin-resistant Staphylococcus aureus. Pediatrics. 2005;115(3):642-648. doi: 10.1542/peds.2004-2300. PubMed
4. Carrillo-Marquez MA, Hulten KG, Hammerman W, Lamberth L, Mason EO, Kaplan SL. Staphylococcus aureus pneumonia in children in the era of community-acquired methicillin-resistance at Texas Children’s Hospital. Pediatr Infect Dis J. 2011;30(7):545-550. doi: 10.1097/INF.0b013e31821618be. PubMed
5. Bradley JS, Byington CL, Shah SS, et al. The management of community-acquired pneumonia in infants and children older than 3 months of age: clinical practice guidelines by the pediatric infectious diseases society and the infectious diseases society of America. Clin Infect Dis. 2011;53(7):e25-e76. doi: 10.1093/cid/cir531. PubMed
6. Sutter DE, Milburn E, Chukwuma U, Dzialowy N, Maranich AM, Hospenthal DR. Changing susceptibility of Staphylococcus aureus in a US pediatric population. Pediatrics. 2016;137(4):e20153099–e20153099. doi: 10.1542/peds.2015-3099. PubMed
7. Sakoulas G, Moellering RC, Jr. Increasing antibiotic resistance among methicillin-resistant Staphylococcus aureus strains. Clin Infect Dis. 2008;46(Suppl 5):S360-S367. doi: 10.1086/533592. PubMed
8. Rubinstein E, Kollef MH, Nathwani D. Pneumonia caused by methicillin-resistant
Staphylococcus aureus. Clin Infect Dis. 2008;46(Suppl 5):S378-S385. doi: 10.1086/533594. PubMed
9. Jain S, Williams DJ, Arnold SR, et al. Community-acquired pneumonia requiring hospitalization among U.S. children. N Engl J Med. 2015;372(9):835-845. doi: 10.1056/NEJMoa1405870. PubMed
10. Kallen AJ, Reed C, Patton M, Arnold KE, Finelli L, Hageman J. Staphylococcus aureus community-onset pneumonia in patients admitted to children’s hospitals during autumn and winter of 2006-2007. Epidemiol Infect. 2010;138(5):666-672. doi: 10.1017/S095026880999135X. PubMed
11. González C, Rubio M, Romero-Vivas J, González M, Picazo JJ. Bacteremic pneumonia due to Staphylococcus aureus: A comparison of disease caused by methicillin-resistant and methicillin-susceptible organisms. Clin Infect Dis. 1999;29(5):1171-1177. doi: 10.1086/313440. PubMed
12. Myers AL, Hall M, Williams DJ, et al. Prevalence of bacteremia in hospitalized pediatric patients with community-acquired pneumonia. Pediatr Infect Dis J. 2013;32(7):736-740. doi: 10.1097/INF.0b013e318290bf63. PubMed
13. Iroh Tam PY, Bernstein E, Ma X, Ferrieri P. Blood culture in evaluation of pediatric community-acquired pneumonia: A systematic review and meta-analysis. Hosp Pediatr. 2015;5(6):324-336. doi: 10.1542/hpeds.2014-0138. PubMed
14. Byington CL, Spencer LY, Johnson TA, et al. An epidemiological investigation of a sustained high rate of pediatric parapneumonic empyema: risk factors and microbiological associations. Clin Infect Dis. 2002;34(4):434-440. doi: 10.1086/338460. PubMed
15. Blaschke AJ, Heyrend C, Byington CL, et al. Molecular analysis improves pathogen identifi cation and epidemiologic study of pediatric parapneumonic empyema. Pediatr Infect Dis J. 2011;30(4):289-294. doi: 10.1097/INF.0b013e3182002d14. PubMed
16. Banerjee R, Teng CB, Cunningham SA, et al. Randomized trial of rapid multiplex polymerase chain reaction-based blood culture identifi cation and susceptibility testing. Clin Infect Dis. 2015;61(7):1071-1080. doi: 10.1093/cid/civ447. PubMed
17. Stockmann C, Ampofo K, Killpack J, et al. Procalcitonin accurately identifies hospitalized children with low risk of bacterial community-acquired pneumonia. J Pediatr Infect Dis Soc. 2018;7(1):46–53. doi: 10.1093/jpids/piw091. PubMed
18. Williams DJ, Zhu Y, Grijalva CG, et al. Predicting severe pneumonia outcomes in children. Pediatrics. 2016;138(4). doi: 10.1542/peds.2016-1019. PubMed
19. Brogan TV, Hall M, Williams DJ, et al. Variability in processes of care and outcomes among children hospitalized with community-acquired pneumonia. Pediatr Infect Dis J. 2012;31(10):1036-1041. doi: 10.1097/INF.0b013e-31825f2b10. PubMed
©2018 Society of Hospital Medicine
Interventions for Frequently Hospitalized Patients and Their Effect on Outcomes: A Systematic Review
In recent years, hospitals and health systems have engaged in considerable efforts to reduce readmissions, in part due to financial incentives from the Medicare Hospital Readmission Reduction Program.1,2 Though efforts to improve transitions of care for all patients are laudable, risk for readmission is not distributed equally; a small subset of patients accounts for a disproportionate number of hospital readmissions.3 This phenomenon of frequently hospitalized patients is similar to that seen in other populations in which a small proportion of patients account for a majority of healthcare utilization.3,4
Recognizing that the current system of healthcare delivery does not meet the needs of this population, healthcare organizations have begun to implement interventions that supplement or redesign the system of care for frequently hospitalized patients.5-7 Descriptive reviews of ambulatory "high-need, high-cost" patients emphasize complex case management and interdisciplinary, team-based care.8,9 Prior systematic reviews of studies aimed at patients with high use of emergency care demonstrate improvements in social outcomes such as homelessness but mixed results in reducing emergency department (ED) use.10 However, we were unable to identify any prior reviews that evaluated interventions intended specifically for patients with frequent hospital admissions. Our objective in this systematic review was to characterize interventions for frequently admitted patients and determine whether these interventions decrease use of healthcare resources, improve health outcomes, and/or reduce costs.
METHODS
Literature Search
We registered our study protocol in the PROSPERO database. A librarian (L.O.) collaboratively developed the search strategies with other review authors (A.G., B.H., N.N.) and in January 2018 ran searches on "super users," "high utilizers," and similar terms in the following databases: PubMed MEDLINE, Embase (embase.com), and Cochrane Central Register of Controlled Trials (CENTRAL) on the Wiley platform. The complete search strategies used are available in Appendix A.
We attempted to discover additional studies by searching the reference lists of key publications and contacted authors of relevant abstracts to determine whether studies had been published or were planned for peer-reviewed publication. We also contacted authors of included studies to locate additional studies meeting inclusion criteria.
Data Collection Process
Studies were eligible for inclusion in our review if they were (1) published in a peer-reviewed source, (2) defined a study population of patients frequently admitted to inpatient medical services, (3) evaluated an intervention targeting frequently hospitalized patients, and (4) included patients who were >18 years old and (5) admitted as inpatients on medical services. Of note, studies with patients admitted to psychiatric, obstetric, or surgical wards were not included, as the authors did not define these as "general medicine" units. Studies focused solely on an ambulatory population were similarly excluded. Given the heterogeneity of how studies defined frequently hospitalized patients, we did not establish a prespecified number of admissions for inclusion to ensure that we did not exclude interventions not meeting a strict set of criteria. The goal was not to examine interventions to reduce all readmissions, but rather, to look at patients who were recurrently hospitalized. Thus, patients had to be repeatedly admitted, but we let the studies define that usage explicitly.
Two members of a four-physician team (A.G., B.H., K.O., and N.N.) screened all initial results for eligibility through title and abstract review; potentially relevant articles were retained for full-text review to assess each study's eligibility. If a study's abstract did not clearly indicate whether inclusion criteria were met, we retained the article for full-text review. Two team members (A.G. and B.H.) independently reviewed the full text of each selected article to determine final inclusion in the study. The previously described inclusion criteria were again applied, and a final set of articles was identified for data extraction. Disagreements regarding inclusion in the final review (such as whether a study measured medical or psychiatric hospitalizations) were resolved through discussion among the entire four-physician review team to achieve consensus or, when required, by contacting authors of individual studies.
Data Abstraction and Risk of Bias Assessment
After selecting the final set of articles, we abstracted data using a tool developed by the Cochrane Effective Practice and Organization of Care Group.11 We then compiled study-level data into a single database for reporting. Extracted elements included study design, setting, patient characteristics, inclusion and exclusion criteria, control group identification, outcome measures, results, and length of follow-up. We also extracted individual characteristics of each intervention, including common intervention elements such as intervention setting, use of health information technology resources, and whether programs developed interdisciplinary care plans. We assessed the risk of bias of each study and the quality of studies using the Downs and Black Scale.12,13 Two team members (A.G. and B.H.) independently assessed the risk of bias for all nine studies, and differences were resolved by consensus. Due to the variation in the outcomes used, we were unable to conduct a meta-analysis.
RESULTS
Search Results
We found a total of 4,762 references in the three databases. After de-duplication using the EndNote software, there were 3,314 references to screen. We identified 116 studies for full-text review. Of those, we selected nine studies that met the criteria for this study (Figure). The most common reason for exclusion of an article for full-text review was that the patients studied were not defined as high utilizers of inpatient resources and were instead high-utilizers of ambulatory or emergency care (32 studies). We identified five of the included studies through the primary search and four through review of the references of the included papers.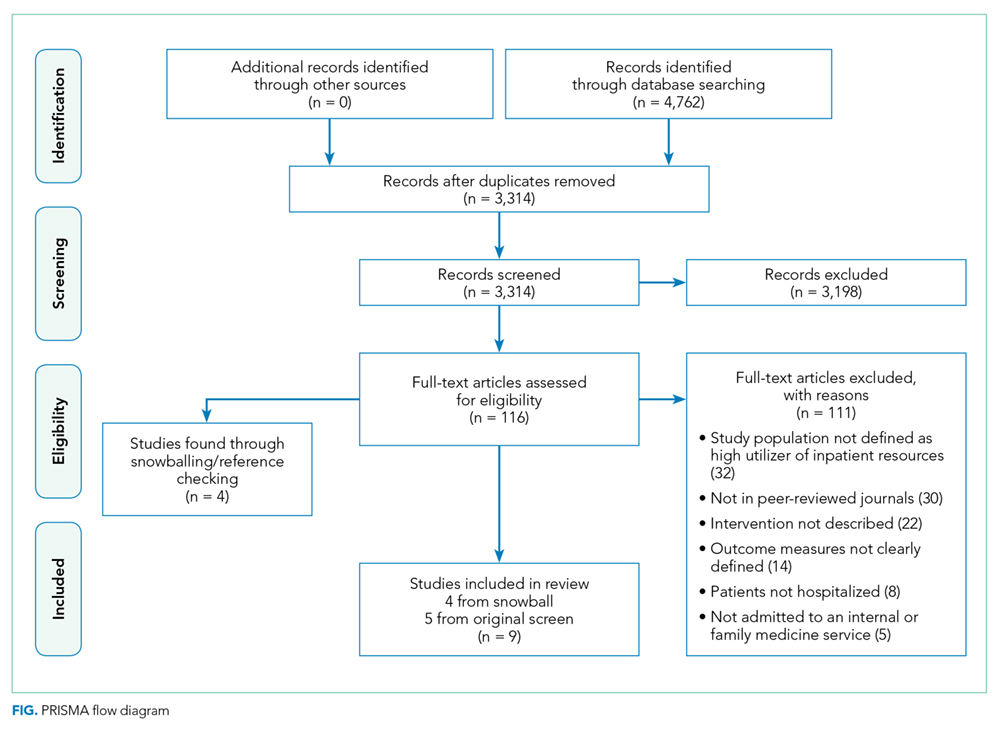
Study Designs and Included Studies
Of the nine included studies, three were randomized controlled trials, three were controlled retrospective cohort studies, and three were uncontrolled pre-post studies. The key characteristics of each study are described in Table 1.14-22 The included studies had different definitions for patients who were high utilizers of hospital care. Eight used a "threshold" model that predicted future admissions using past patterns; these studies included patients with at least two admissions over a period of 6 to 12 months, although many had higher thresholds. Zulman et al. used a prediction algorithm to identify patients at risk of future admission. Four studies also included some measure of medical complexity, such as a certain number of chronic medical conditions;14,17,18,22 in contrast, Sledge et al. excluded the most complex and high-cost patients.20
All studies measured hospital admissions as a primary or a secondary outcome (Table 1). Although all studies demonstrated a reduction in hospital admissions following implementation, those with the greatest reductions did not have a control group.14,15,17 All three randomized controlled trials showed equal reductions in admission rates between the intervention and control groups.18,20,22 Among those specifically examining readmissions to the hospital, similar trends emerged, although one study (Plant et al.) found a nonsignificant decrease in hospital readmissions (17% reduction in 24 months, P = .07).18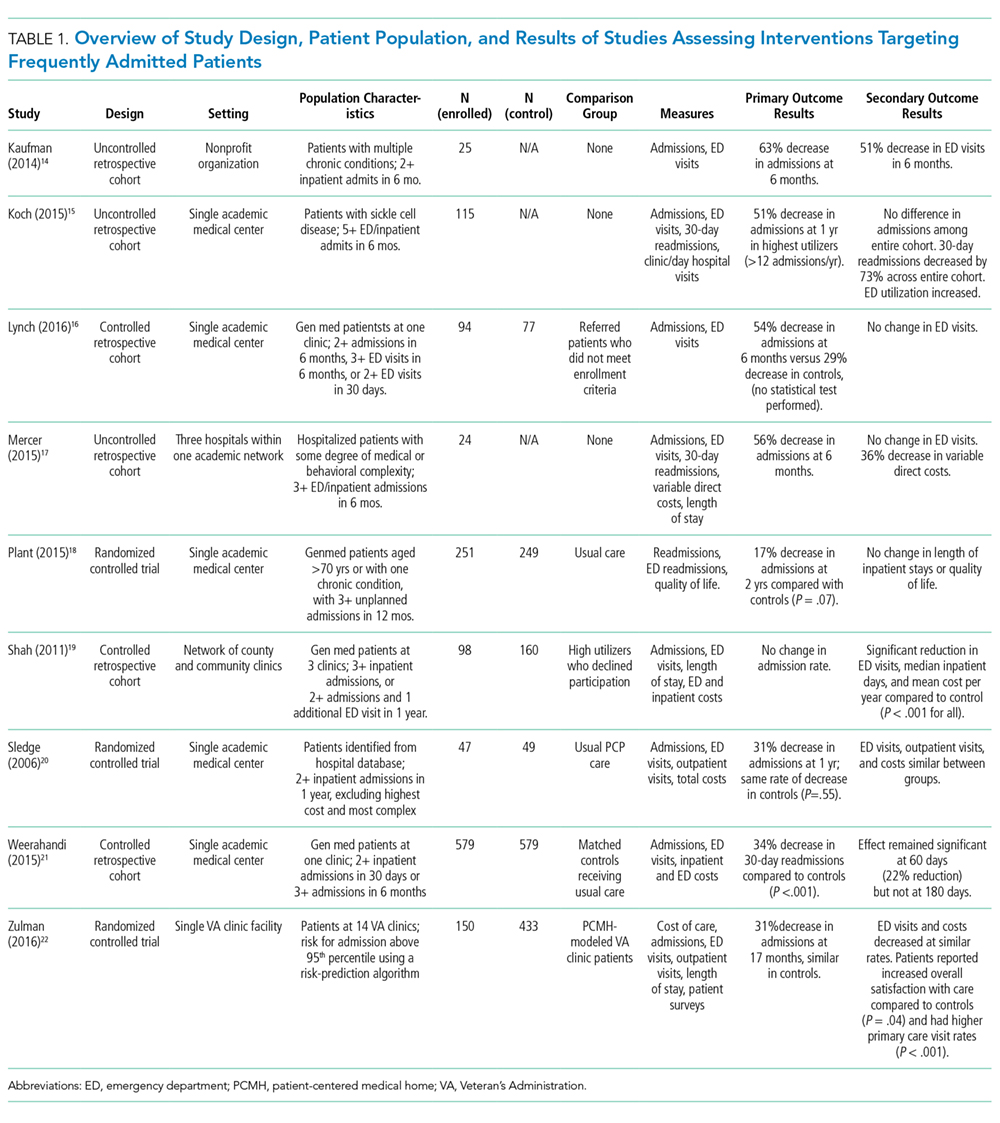
In the secondary outcome analysis, six of the nine studies found nonsignificant reductions in ED admissions (Table 1). Four studies measured costs to the hospital or the local hospital system, though none examined costs to patients or payors. Studies estimated cost differently, including the use of estimated hospital costs,17,20 "facility patient costs" at the VA,22 and a combination of inpatient and ED costs.19 The latter study (Shah et al., which implemented complex case management services) was the only one to find a statistically significant decrease in mean cost per year pre- and postintervention ($20,298 versus $7,053, P < .001).19
Only one study measured the quality of life, finding no significant change in summary scores after the intervention compared with controls (93.4 versus 92, P = .32).21 Another study conducted at a VA clinic network found no difference in a patient activation scale following the intervention but found significantly increased satisfaction with overall VA care (3.16 versus 2.90, P = .04).22
Intervention Characteristics
Intervention characteristics are summarized in Table 2. Although there was heterogeneity in study interventions, we identified common themes. Five of the nine interventions14-17,22 consisted of interdisciplinary teams that included community health workers, nurses, social workers, and physicians. Physicians were not included on every team; three interventions used them in direct care roles while two others contained physicians as advisors or in indirect roles. Intervention teams also had a variable level of involvement in a patient's care. Mercer et al. developed care plans for patients without physical interaction,17 whereas Zulman et al. recruited patients to a separate, intensive outpatient clinic outside the usual VA care team structure.22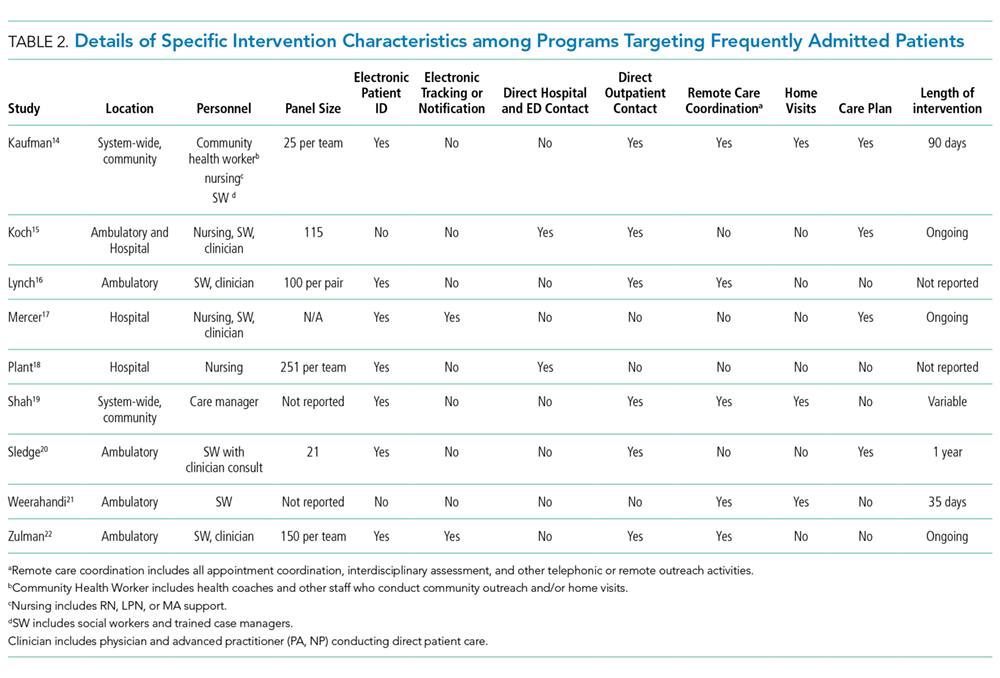
The majority of interventions added direct services or support - most commonly, a social worker - to usual care processes. Patient panel sizes were relatively small, with most of the teams recruiting fewer than 150 patients per interdisciplinary team (range, 25-251). There was variation in the length of intervention, from 35 days of case management following hospital discharge to one year of intensive social work support to others of an indefinite length.15,17,22
Additional common themes included caring for patients across settings and incorporating information technology (IT) into workflows. Four interventions reported either interacting with patients in multiple settings, such as the hospital, clinic, and day hospital, ED, at home, or in the community.14,19,21,22 Two others16,20 interacted with patients only in the clinic but expanded the scope of a "traditional" primary care practice to include open scheduling, flexible appointment times, interdisciplinary visits, or outreach. In addition, IT resources assisted seven of the nine interventions, most commonly by identifying eligible patients via an electronic data tracking system or by automated alerts when their patients arrived at affiliated care locations.
Risk of Study Bias
We systematically assessed the risk of bias of the nine included studies (Appendix B). Using the scale published by Downs and Black, a point-based scale in which a score of 18 denotes a high-quality study, the studies in this review scored 15.55 on average (range 6-22, standard deviation [SD] 5.0). Four of the nine studies met the benchmark for high quality.12,13,18-22 The risk of bias was highest for measures of internal validity and confounding (range 0-5, mean 2.83, SD 1.94). The risk of bias was lowest for reporting measures (range 0-13, mean 7.40, SD 3.43).
DISCUSSION
Overall, studies reported mixed results related to readmissions and hospital utilization. While low-quality studies found reductions in hospital use over time, higher quality studies found similar reductions in utilization between the intervention and control groups. Johnson et al. showed that frequent hospitalization rates in a cohort of high-utilizer patients declined naturally over the course of 1-2 years; only 10% of individuals in the initial cohort remained "chronically hospitalized."6 Thus, expanding on these findings, the decline in hospitalizations over time as observed in some of the studies included in this review may be due to study patients being identified during a "spike" in utilization, which naturally decreases as the underlying medical or social factors driving rehospitalization resolve. Alternatively, reduction in hospitalizations may represent patients choosing to pursue care at other neighboring hospitals.23 No study included in our review evaluated healthcare use at institutions other than their study hospital or health system.
A striking theme of this review was the heterogeneity in each study's patient population. Thresholds for "high utilizers" varied from two hospital admissions in six months to two to three admissions in 30 days, to a combination of ED and hospital admissions, and to the use of predictive algorithms. A standard "case definition" for this population could guide future research, enabling comparison of outcomes across settings. Thus, we propose that future studies use three or more hospital admissions within six months when evaluating interventions targeting "high utilizer" patients. Although patients with one prior hospitalization in the past year are at elevated risk of rehospitalization,2 we feel that a higher "threshold" for this population will identify those at the highest strata of risk. Although predictive models may be better than "threshold" models, more work in validating these tools needs to be done before these can be put to use across settings.
In contrast to interventions designed to reduce readmissions for heart failure, pneumonia, or other diagnoses, frequently admitted patients do not encompass one disease or pathology pattern. Rinehart et al., in a study characterizing frequently admitted patients across a health system, identified five "subgroups" of patients, including those with (1) unstable housing, (2) comorbid medical and psychiatric illness, (3) severe complex medical illness, (4) dual-diagnosis psychiatric illness and substance abuse, and (5) a combination of medical and psychosocial barriers.25 In light of this population's heterogeneity, interventions may need to be flexible and tailored to the needs of individual patients, while simultaneously accounting for the capabilities and priorities of the health system. More specific and standardized interventions, targeting more homogenous groups, may be appropriate for populations defined according to pathology (such as heart failure or sickle cell disease).27
The components of interventions used for frequently hospitalized patients were diverse. Although most of the studies used interdisciplinary teams, they focused their efforts in a variety of settings, often crossing modern "boundaries of care" by providing direct or indirect input on care across healthcare settings. Care fragmentation probably plays an important role in the risk for readmissions in this population;9 as such, interventions that address factors across the continuum of care may be more likely to succeed.21 Notably, six of nine studies were conducted at academic medical centers and an additional one at a VA facility affiliated with an academic center. Only two were located at community-based clinical networks, indicating a theoretical potential for publication bias as academic centers may be more likely to study and publish their work. There may be successful interventions that have not been formally studied or published in the peer-reviewed literature.
The breadth of the outcome measures in the included studies raises questions about what metrics should define success. Although all the studies looked at hospital utilization and readmission, measure definitions varied. Importantly, a minority of studies investigated quality of life and patient satisfaction, outcomes that may ultimately provide a more fertile ground for inquiry and intervention. Two studies looked at quality of life as an outcome,19,22 but only one found that patients reported increased satisfaction despite showing nonsignificant reductions in hospital use.22 As shown in multiple prior studies, patient engagement is associated with increased satisfaction and can be associated with lower healthcare costs.26,27 Hibbard et al. have demonstrated that patient activation is a specific component of patient engagement and inversely impacts healthcare cost, with lower levels of patient activation showing increased costs in comparison to those patients more engaged in their own care.27 By focusing on changing patients' perceptions about their own health and involvement in their own care team as a partner, programs may be able to make a greater impact.
Our systematic review has several limitations. Although we used a search strategy designed to identify all relevant studies, reviewed the references of included studies, and contacted the authors, we identified only nine studies meeting our inclusion criteria. Four of the nine studies were identified from a manual review of references of the included studies, suggesting the possibility of a suboptimal search strategy. Although the inclusion of articles that appear in a check of reference lists is a valid step in the systematic review article acquisition process, we conducted a post hoc investigation of alternate search strategies. We checked the titles, abstracts, and subject headings of the four articles found by reference review to determine whether the original search could have been improved. An analysis of the articles revealed that the terminology used was not consistent with the super user/utilizer terminology we were operating under, and that the four articles used terms such as "high risk" and "complex patients," which are more generic than our targeted terms. Only on a careful read of the abstracts and full-text did we find that these articles were useful to the study. Adjusting the original search to include these general terms would have resulted in an unwieldy set of results; hence, we felt it best to adhere to our original search strategy.
Additional limitations include that only four of the nine included studies were at low risk of bias. In addition to limitations based on study design and small sample sizes, the interventions were often limited to a short period. In light of the multiple factors that contribute to frequent hospitalizations, some of which cannot be addressed quickly, studies to evaluate interventions for longer durations are warranted.
CONCLUSIONS
We found mixed results for the effect of interventions on outcomes for frequently hospitalized patients. While low-quality studies found reductions in hospital use over time, higher quality studies generally found similar reductions in utilization between the intervention and control groups. The range of definitions, interventions, and outcomes used for frequently hospitalized patients is partly explained by the heterogeneity of the population. More rigorous studies using multifaceted interventions that adapt to patients' unique needs should be conducted to assess the effect on outcomes relevant to both providers and patients.
Acknowledgments
The authors would like the thank Dr. Luke Hansen, Dr. Margaret Chapman, and McKay Barra for their support and contributions to this paper and to Northwestern Memorial Hospital's CHAMP (Complex High Admission Management Program).
Disclosures
The authors have nothing to disclose.
Funding
The authors received no funding from external or internal sources for the completion of this project.
1. Center for Medicare and Medicaid Services. Readmissions Reduction Program (HRRP). https://www.cms.gov/medicare/medicare-fee-for-service-payment/acuteinpatientpps/readmissions-reduction-program.html. Accessed March 23, 2018.
2. Hansen LO, Young RS, Hinami K, Leung A, Williams MV. Interventions to reduce 30-day rehospitalization: a systematic review. Ann Intern Med. 2011;155(8):520-528. doi: 10.7326/0003-4819-155-8-201110180-00008. PubMed
3. Blumenthal D, Chernof B, Fulmer T, Lumpkin J, Selberg J. Caring for high-need, high-cost patients - an urgent priority. N Engl J Med. 2016;375(10):909-911. doi: 10.1056/NEJMp1608511. PubMed
4. Gawande A. The Hot Spotters. The New Yorker. 2011 Jan: 40-51.
5. Szekendi MK, Williams MV, Carrier D, Hensley L, Thomas S, Cerese J. The characteristics of patients frequently admitted to academic medical centers in the United States. J Hosp Med. 2015;10(9):563-568. doi: 10.1002/jhm.2375. PubMed
6. Johnson TL, Rinehart DJ, Durfee J, et al. For many patients who use large amounts of health care services, the need is intense yet temporary. Health Aff (Millwood). 2015;34(8):1312-1319. doi: 10.1377/hlthaff.2014.1186. PubMed
7. Tinetti ME, Reuben DB. The hospital-dependent patient. N Engl J Med. 2014;370:694-697. doi: 10.1056/NEJMp1315568. PubMed
8. Hong CS, Siegel AL, Ferris TG. Caring for high-need, high-cost patients: what makes for a successful care management program? Issue Brief (Commonw Fund). 2014;19:1-19. PubMed
9. Hochman M, Asch SM. Disruptive models in primary care: caring for high-needs, high-cost populations. J Gen Intern Med. 2017;32(4):392-397. doi: 10.1007/s11606-016-3945-2. PubMed
10. Althaus F1, Paroz S, Hugli O, et al. Effectiveness of interventions targeting frequent users of emergency departments: a systematic review. Ann Emerg Med. 2011 Jul;58(1):41-52.e42. doi: 10.1016/j.annemergmed.2011.03.007 PubMed
11. Cochrane Effective Practice and Organisation of Care (EPOC). What study designs should be included in an EPOC review? EPOC resources for review authors. Available at:http://epoc.cochrane.org/epoc-resources-review-authors. Accessed March 23, 2018.
12. Downs SH, Black N. The feasibility of creating a checklist for the assessment of the methodological quality both of randomised and non-randomised studies of health care interventions. J Epidemiol Community Health. 1998;52(6):377-384. doi: 10.1136/jech.52.6.377. PubMed
13. Goyal AA, Tur K, Mann J, Townsend W, Flanders SA, Chopra V. Do bedside visual tools improve patient and caregiver satisfaction? A systematic review of the literature. J Hosp Med 2017;12(11):930-936. doi: 10.12788/jhm.2871. PubMed
14. Kaufman S, Ali N, DeFiglio V, Craig K, Brenner J. Early efforts to target and enroll high-risk diabetic patients into urban community-based programs. Health Promot Pract. 2014;15(2 Suppl):62S-70S. doi: 10.1177/1524839914535776. PubMed
15. Koch KL, Karafin MS, Simpson P, Field JJ. Intensive management of high-utilizing adults with sickle cell disease lowers admissions. Am J Hematol. 2015;90(3):215-219. doi: 10.1002/ajh.23912. PubMed
16. Lynch CS, Wajnberg A, Jervis R, et al. Implementation science workshop: a novel multidisciplinary primary care program to improve care and outcomes for super-utilizers. J Gen Intern Med. 2016;31(7):797-802. doi: 10.1007/s11606-016-3598-1. PubMed
17. Mercer T, Bae J, Kipnes J, Velazquez M, Thomas S, Setji N. The highest utilizers of care: individualized care plans to coordinate care, improve healthcare service utilization, and reduce costs at an academic tertiary care center. J Hosp Med. 2015;10(7):419-424. doi: 10.1002/jhm.2351. PubMed
18. Plant NA, Kelly PJ, Leeder SR, et al. Coordinated care versus standard care in hospital admissions of people with chronic illness: a randomised controlled trial. Med J Aust. 2015;203(1):33-38. doi: 10.5694/mja14.01049. PubMed
19. Shah R, Chen C, O'Rourke S, Lee M, Mohanty SA, Abraham J. Evaluation of care management for the uninsured. Med Care. 2011;49(2):166-171. doi: 10.1097/MLR.0b013e3182028e81. PubMed
20. Sledge WH, Brown KE, Levine JM, et al. A randomized trial of primary intensive care to reduce hospital admissions in patients with high utilization of inpatient services. Dis Manag. 2006;9(6):328-338. doi: 10.1089/dis.2006.9.328. PubMed
21. Weerahandi H, Basso Lipani M, Kalman J, et al. Effects of a psychosocial transitional care model on hospitalizations and cost of care for high utilizers. Soc Work Health Care. 2015;54(6):485-498. doi: 10.1080/00981389.2015.1040141. PubMed
22. Zulman DM, Ezeji-Okoye SC, Shaw JG, et al. Partnered research in healthcare delivery redesign for high-need, high-cost patients: development and feasibility of an Intensive Management Patient-Aligned Care Team (ImPACT). J Gen Intern Med. 2014;29(4):861-869. doi: 10.1007/s11606-014-3022-7. PubMed
23. Mautner DB, Pang H, Brenner JC, et al. Generating hypotheses about care needs of high utilizers: lessons from patient interviews. Popul Health Manag. 2013;16 Suppl 1:S26-33. doi: 10.1089/pop.2013.0033. PubMed
24. Bodenheimer T. Strategies to reduce costs and improve care for high-utilizing Medicaid patients: Reflections on pioneering programs. Center for Health Care Strategies, Inc.;2013.
25. Rinehart DJ, Oronce C, Durfee MJ, et al. Identifying subgroups of adult superutilizers in an urban safety-net system using latent class analysis: implications for clinical practice. Med Care. 2018;56(1):e1-e9. doi: 10.1097/MLR.0000000000000628. PubMed
26. Boutwell A, Kunst E, Sorin J, Shniffer A, Logozzo J, Woodhouse D. DSRIP-Medicaid Accelerated eXchange (MAX) Series Program: Improving Care for Super Utilizers. January 2017. https://www.health.ny.gov/health_care/medicaid/redesign/dsrip/pps_workshops/docs/2017-01_imp_care.pdf. Accessed January 24, 2018.
27. Hibbard JH, Stockard J, Mahoney ER, Tusler M. Development of the Patient Activation Measure (PAM): conceptualizing and measuring activation in patients and consumers. Health Serv Res. 2004;39(4 Pt 1):1005-1026. doi: 10.1111/j.1475-6773.2004.00269.x PubMed
In recent years, hospitals and health systems have engaged in considerable efforts to reduce readmissions, in part due to financial incentives from the Medicare Hospital Readmission Reduction Program.1,2 Though efforts to improve transitions of care for all patients are laudable, risk for readmission is not distributed equally; a small subset of patients accounts for a disproportionate number of hospital readmissions.3 This phenomenon of frequently hospitalized patients is similar to that seen in other populations in which a small proportion of patients account for a majority of healthcare utilization.3,4
Recognizing that the current system of healthcare delivery does not meet the needs of this population, healthcare organizations have begun to implement interventions that supplement or redesign the system of care for frequently hospitalized patients.5-7 Descriptive reviews of ambulatory "high-need, high-cost" patients emphasize complex case management and interdisciplinary, team-based care.8,9 Prior systematic reviews of studies aimed at patients with high use of emergency care demonstrate improvements in social outcomes such as homelessness but mixed results in reducing emergency department (ED) use.10 However, we were unable to identify any prior reviews that evaluated interventions intended specifically for patients with frequent hospital admissions. Our objective in this systematic review was to characterize interventions for frequently admitted patients and determine whether these interventions decrease use of healthcare resources, improve health outcomes, and/or reduce costs.
METHODS
Literature Search
We registered our study protocol in the PROSPERO database. A librarian (L.O.) collaboratively developed the search strategies with other review authors (A.G., B.H., N.N.) and in January 2018 ran searches on "super users," "high utilizers," and similar terms in the following databases: PubMed MEDLINE, Embase (embase.com), and Cochrane Central Register of Controlled Trials (CENTRAL) on the Wiley platform. The complete search strategies used are available in Appendix A.
We attempted to discover additional studies by searching the reference lists of key publications and contacted authors of relevant abstracts to determine whether studies had been published or were planned for peer-reviewed publication. We also contacted authors of included studies to locate additional studies meeting inclusion criteria.
Data Collection Process
Studies were eligible for inclusion in our review if they were (1) published in a peer-reviewed source, (2) defined a study population of patients frequently admitted to inpatient medical services, (3) evaluated an intervention targeting frequently hospitalized patients, and (4) included patients who were >18 years old and (5) admitted as inpatients on medical services. Of note, studies with patients admitted to psychiatric, obstetric, or surgical wards were not included, as the authors did not define these as "general medicine" units. Studies focused solely on an ambulatory population were similarly excluded. Given the heterogeneity of how studies defined frequently hospitalized patients, we did not establish a prespecified number of admissions for inclusion to ensure that we did not exclude interventions not meeting a strict set of criteria. The goal was not to examine interventions to reduce all readmissions, but rather, to look at patients who were recurrently hospitalized. Thus, patients had to be repeatedly admitted, but we let the studies define that usage explicitly.
Two members of a four-physician team (A.G., B.H., K.O., and N.N.) screened all initial results for eligibility through title and abstract review; potentially relevant articles were retained for full-text review to assess each study's eligibility. If a study's abstract did not clearly indicate whether inclusion criteria were met, we retained the article for full-text review. Two team members (A.G. and B.H.) independently reviewed the full text of each selected article to determine final inclusion in the study. The previously described inclusion criteria were again applied, and a final set of articles was identified for data extraction. Disagreements regarding inclusion in the final review (such as whether a study measured medical or psychiatric hospitalizations) were resolved through discussion among the entire four-physician review team to achieve consensus or, when required, by contacting authors of individual studies.
Data Abstraction and Risk of Bias Assessment
After selecting the final set of articles, we abstracted data using a tool developed by the Cochrane Effective Practice and Organization of Care Group.11 We then compiled study-level data into a single database for reporting. Extracted elements included study design, setting, patient characteristics, inclusion and exclusion criteria, control group identification, outcome measures, results, and length of follow-up. We also extracted individual characteristics of each intervention, including common intervention elements such as intervention setting, use of health information technology resources, and whether programs developed interdisciplinary care plans. We assessed the risk of bias of each study and the quality of studies using the Downs and Black Scale.12,13 Two team members (A.G. and B.H.) independently assessed the risk of bias for all nine studies, and differences were resolved by consensus. Due to the variation in the outcomes used, we were unable to conduct a meta-analysis.
RESULTS
Search Results
We found a total of 4,762 references in the three databases. After de-duplication using the EndNote software, there were 3,314 references to screen. We identified 116 studies for full-text review. Of those, we selected nine studies that met the criteria for this study (Figure). The most common reason for exclusion of an article for full-text review was that the patients studied were not defined as high utilizers of inpatient resources and were instead high-utilizers of ambulatory or emergency care (32 studies). We identified five of the included studies through the primary search and four through review of the references of the included papers.
Study Designs and Included Studies
Of the nine included studies, three were randomized controlled trials, three were controlled retrospective cohort studies, and three were uncontrolled pre-post studies. The key characteristics of each study are described in Table 1.14-22 The included studies had different definitions for patients who were high utilizers of hospital care. Eight used a "threshold" model that predicted future admissions using past patterns; these studies included patients with at least two admissions over a period of 6 to 12 months, although many had higher thresholds. Zulman et al. used a prediction algorithm to identify patients at risk of future admission. Four studies also included some measure of medical complexity, such as a certain number of chronic medical conditions;14,17,18,22 in contrast, Sledge et al. excluded the most complex and high-cost patients.20
All studies measured hospital admissions as a primary or a secondary outcome (Table 1). Although all studies demonstrated a reduction in hospital admissions following implementation, those with the greatest reductions did not have a control group.14,15,17 All three randomized controlled trials showed equal reductions in admission rates between the intervention and control groups.18,20,22 Among those specifically examining readmissions to the hospital, similar trends emerged, although one study (Plant et al.) found a nonsignificant decrease in hospital readmissions (17% reduction in 24 months, P = .07).18
In the secondary outcome analysis, six of the nine studies found nonsignificant reductions in ED admissions (Table 1). Four studies measured costs to the hospital or the local hospital system, though none examined costs to patients or payors. Studies estimated cost differently, including the use of estimated hospital costs,17,20 "facility patient costs" at the VA,22 and a combination of inpatient and ED costs.19 The latter study (Shah et al., which implemented complex case management services) was the only one to find a statistically significant decrease in mean cost per year pre- and postintervention ($20,298 versus $7,053, P < .001).19
Only one study measured the quality of life, finding no significant change in summary scores after the intervention compared with controls (93.4 versus 92, P = .32).21 Another study conducted at a VA clinic network found no difference in a patient activation scale following the intervention but found significantly increased satisfaction with overall VA care (3.16 versus 2.90, P = .04).22
Intervention Characteristics
Intervention characteristics are summarized in Table 2. Although there was heterogeneity in study interventions, we identified common themes. Five of the nine interventions14-17,22 consisted of interdisciplinary teams that included community health workers, nurses, social workers, and physicians. Physicians were not included on every team; three interventions used them in direct care roles while two others contained physicians as advisors or in indirect roles. Intervention teams also had a variable level of involvement in a patient's care. Mercer et al. developed care plans for patients without physical interaction,17 whereas Zulman et al. recruited patients to a separate, intensive outpatient clinic outside the usual VA care team structure.22
The majority of interventions added direct services or support - most commonly, a social worker - to usual care processes. Patient panel sizes were relatively small, with most of the teams recruiting fewer than 150 patients per interdisciplinary team (range, 25-251). There was variation in the length of intervention, from 35 days of case management following hospital discharge to one year of intensive social work support to others of an indefinite length.15,17,22
Additional common themes included caring for patients across settings and incorporating information technology (IT) into workflows. Four interventions reported either interacting with patients in multiple settings, such as the hospital, clinic, and day hospital, ED, at home, or in the community.14,19,21,22 Two others16,20 interacted with patients only in the clinic but expanded the scope of a "traditional" primary care practice to include open scheduling, flexible appointment times, interdisciplinary visits, or outreach. In addition, IT resources assisted seven of the nine interventions, most commonly by identifying eligible patients via an electronic data tracking system or by automated alerts when their patients arrived at affiliated care locations.
Risk of Study Bias
We systematically assessed the risk of bias of the nine included studies (Appendix B). Using the scale published by Downs and Black, a point-based scale in which a score of 18 denotes a high-quality study, the studies in this review scored 15.55 on average (range 6-22, standard deviation [SD] 5.0). Four of the nine studies met the benchmark for high quality.12,13,18-22 The risk of bias was highest for measures of internal validity and confounding (range 0-5, mean 2.83, SD 1.94). The risk of bias was lowest for reporting measures (range 0-13, mean 7.40, SD 3.43).
DISCUSSION
Overall, studies reported mixed results related to readmissions and hospital utilization. While low-quality studies found reductions in hospital use over time, higher quality studies found similar reductions in utilization between the intervention and control groups. Johnson et al. showed that frequent hospitalization rates in a cohort of high-utilizer patients declined naturally over the course of 1-2 years; only 10% of individuals in the initial cohort remained "chronically hospitalized."6 Thus, expanding on these findings, the decline in hospitalizations over time as observed in some of the studies included in this review may be due to study patients being identified during a "spike" in utilization, which naturally decreases as the underlying medical or social factors driving rehospitalization resolve. Alternatively, reduction in hospitalizations may represent patients choosing to pursue care at other neighboring hospitals.23 No study included in our review evaluated healthcare use at institutions other than their study hospital or health system.
A striking theme of this review was the heterogeneity in each study's patient population. Thresholds for "high utilizers" varied from two hospital admissions in six months to two to three admissions in 30 days, to a combination of ED and hospital admissions, and to the use of predictive algorithms. A standard "case definition" for this population could guide future research, enabling comparison of outcomes across settings. Thus, we propose that future studies use three or more hospital admissions within six months when evaluating interventions targeting "high utilizer" patients. Although patients with one prior hospitalization in the past year are at elevated risk of rehospitalization,2 we feel that a higher "threshold" for this population will identify those at the highest strata of risk. Although predictive models may be better than "threshold" models, more work in validating these tools needs to be done before these can be put to use across settings.
In contrast to interventions designed to reduce readmissions for heart failure, pneumonia, or other diagnoses, frequently admitted patients do not encompass one disease or pathology pattern. Rinehart et al., in a study characterizing frequently admitted patients across a health system, identified five "subgroups" of patients, including those with (1) unstable housing, (2) comorbid medical and psychiatric illness, (3) severe complex medical illness, (4) dual-diagnosis psychiatric illness and substance abuse, and (5) a combination of medical and psychosocial barriers.25 In light of this population's heterogeneity, interventions may need to be flexible and tailored to the needs of individual patients, while simultaneously accounting for the capabilities and priorities of the health system. More specific and standardized interventions, targeting more homogenous groups, may be appropriate for populations defined according to pathology (such as heart failure or sickle cell disease).27
The components of interventions used for frequently hospitalized patients were diverse. Although most of the studies used interdisciplinary teams, they focused their efforts in a variety of settings, often crossing modern "boundaries of care" by providing direct or indirect input on care across healthcare settings. Care fragmentation probably plays an important role in the risk for readmissions in this population;9 as such, interventions that address factors across the continuum of care may be more likely to succeed.21 Notably, six of nine studies were conducted at academic medical centers and an additional one at a VA facility affiliated with an academic center. Only two were located at community-based clinical networks, indicating a theoretical potential for publication bias as academic centers may be more likely to study and publish their work. There may be successful interventions that have not been formally studied or published in the peer-reviewed literature.
The breadth of the outcome measures in the included studies raises questions about what metrics should define success. Although all the studies looked at hospital utilization and readmission, measure definitions varied. Importantly, a minority of studies investigated quality of life and patient satisfaction, outcomes that may ultimately provide a more fertile ground for inquiry and intervention. Two studies looked at quality of life as an outcome,19,22 but only one found that patients reported increased satisfaction despite showing nonsignificant reductions in hospital use.22 As shown in multiple prior studies, patient engagement is associated with increased satisfaction and can be associated with lower healthcare costs.26,27 Hibbard et al. have demonstrated that patient activation is a specific component of patient engagement and inversely impacts healthcare cost, with lower levels of patient activation showing increased costs in comparison to those patients more engaged in their own care.27 By focusing on changing patients' perceptions about their own health and involvement in their own care team as a partner, programs may be able to make a greater impact.
Our systematic review has several limitations. Although we used a search strategy designed to identify all relevant studies, reviewed the references of included studies, and contacted the authors, we identified only nine studies meeting our inclusion criteria. Four of the nine studies were identified from a manual review of references of the included studies, suggesting the possibility of a suboptimal search strategy. Although the inclusion of articles that appear in a check of reference lists is a valid step in the systematic review article acquisition process, we conducted a post hoc investigation of alternate search strategies. We checked the titles, abstracts, and subject headings of the four articles found by reference review to determine whether the original search could have been improved. An analysis of the articles revealed that the terminology used was not consistent with the super user/utilizer terminology we were operating under, and that the four articles used terms such as "high risk" and "complex patients," which are more generic than our targeted terms. Only on a careful read of the abstracts and full-text did we find that these articles were useful to the study. Adjusting the original search to include these general terms would have resulted in an unwieldy set of results; hence, we felt it best to adhere to our original search strategy.
Additional limitations include that only four of the nine included studies were at low risk of bias. In addition to limitations based on study design and small sample sizes, the interventions were often limited to a short period. In light of the multiple factors that contribute to frequent hospitalizations, some of which cannot be addressed quickly, studies to evaluate interventions for longer durations are warranted.
CONCLUSIONS
We found mixed results for the effect of interventions on outcomes for frequently hospitalized patients. While low-quality studies found reductions in hospital use over time, higher quality studies generally found similar reductions in utilization between the intervention and control groups. The range of definitions, interventions, and outcomes used for frequently hospitalized patients is partly explained by the heterogeneity of the population. More rigorous studies using multifaceted interventions that adapt to patients' unique needs should be conducted to assess the effect on outcomes relevant to both providers and patients.
Acknowledgments
The authors would like the thank Dr. Luke Hansen, Dr. Margaret Chapman, and McKay Barra for their support and contributions to this paper and to Northwestern Memorial Hospital's CHAMP (Complex High Admission Management Program).
Disclosures
The authors have nothing to disclose.
Funding
The authors received no funding from external or internal sources for the completion of this project.
1. Center for Medicare and Medicaid Services. Readmissions Reduction Program (HRRP). https://www.cms.gov/medicare/medicare-fee-for-service-payment/acuteinpatientpps/readmissions-reduction-program.html. Accessed March 23, 2018.
2. Hansen LO, Young RS, Hinami K, Leung A, Williams MV. Interventions to reduce 30-day rehospitalization: a systematic review. Ann Intern Med. 2011;155(8):520-528. doi: 10.7326/0003-4819-155-8-201110180-00008. PubMed
3. Blumenthal D, Chernof B, Fulmer T, Lumpkin J, Selberg J. Caring for high-need, high-cost patients - an urgent priority. N Engl J Med. 2016;375(10):909-911. doi: 10.1056/NEJMp1608511. PubMed
4. Gawande A. The Hot Spotters. The New Yorker. 2011 Jan: 40-51.
5. Szekendi MK, Williams MV, Carrier D, Hensley L, Thomas S, Cerese J. The characteristics of patients frequently admitted to academic medical centers in the United States. J Hosp Med. 2015;10(9):563-568. doi: 10.1002/jhm.2375. PubMed
6. Johnson TL, Rinehart DJ, Durfee J, et al. For many patients who use large amounts of health care services, the need is intense yet temporary. Health Aff (Millwood). 2015;34(8):1312-1319. doi: 10.1377/hlthaff.2014.1186. PubMed
7. Tinetti ME, Reuben DB. The hospital-dependent patient. N Engl J Med. 2014;370:694-697. doi: 10.1056/NEJMp1315568. PubMed
8. Hong CS, Siegel AL, Ferris TG. Caring for high-need, high-cost patients: what makes for a successful care management program? Issue Brief (Commonw Fund). 2014;19:1-19. PubMed
9. Hochman M, Asch SM. Disruptive models in primary care: caring for high-needs, high-cost populations. J Gen Intern Med. 2017;32(4):392-397. doi: 10.1007/s11606-016-3945-2. PubMed
10. Althaus F1, Paroz S, Hugli O, et al. Effectiveness of interventions targeting frequent users of emergency departments: a systematic review. Ann Emerg Med. 2011 Jul;58(1):41-52.e42. doi: 10.1016/j.annemergmed.2011.03.007 PubMed
11. Cochrane Effective Practice and Organisation of Care (EPOC). What study designs should be included in an EPOC review? EPOC resources for review authors. Available at:http://epoc.cochrane.org/epoc-resources-review-authors. Accessed March 23, 2018.
12. Downs SH, Black N. The feasibility of creating a checklist for the assessment of the methodological quality both of randomised and non-randomised studies of health care interventions. J Epidemiol Community Health. 1998;52(6):377-384. doi: 10.1136/jech.52.6.377. PubMed
13. Goyal AA, Tur K, Mann J, Townsend W, Flanders SA, Chopra V. Do bedside visual tools improve patient and caregiver satisfaction? A systematic review of the literature. J Hosp Med 2017;12(11):930-936. doi: 10.12788/jhm.2871. PubMed
14. Kaufman S, Ali N, DeFiglio V, Craig K, Brenner J. Early efforts to target and enroll high-risk diabetic patients into urban community-based programs. Health Promot Pract. 2014;15(2 Suppl):62S-70S. doi: 10.1177/1524839914535776. PubMed
15. Koch KL, Karafin MS, Simpson P, Field JJ. Intensive management of high-utilizing adults with sickle cell disease lowers admissions. Am J Hematol. 2015;90(3):215-219. doi: 10.1002/ajh.23912. PubMed
16. Lynch CS, Wajnberg A, Jervis R, et al. Implementation science workshop: a novel multidisciplinary primary care program to improve care and outcomes for super-utilizers. J Gen Intern Med. 2016;31(7):797-802. doi: 10.1007/s11606-016-3598-1. PubMed
17. Mercer T, Bae J, Kipnes J, Velazquez M, Thomas S, Setji N. The highest utilizers of care: individualized care plans to coordinate care, improve healthcare service utilization, and reduce costs at an academic tertiary care center. J Hosp Med. 2015;10(7):419-424. doi: 10.1002/jhm.2351. PubMed
18. Plant NA, Kelly PJ, Leeder SR, et al. Coordinated care versus standard care in hospital admissions of people with chronic illness: a randomised controlled trial. Med J Aust. 2015;203(1):33-38. doi: 10.5694/mja14.01049. PubMed
19. Shah R, Chen C, O'Rourke S, Lee M, Mohanty SA, Abraham J. Evaluation of care management for the uninsured. Med Care. 2011;49(2):166-171. doi: 10.1097/MLR.0b013e3182028e81. PubMed
20. Sledge WH, Brown KE, Levine JM, et al. A randomized trial of primary intensive care to reduce hospital admissions in patients with high utilization of inpatient services. Dis Manag. 2006;9(6):328-338. doi: 10.1089/dis.2006.9.328. PubMed
21. Weerahandi H, Basso Lipani M, Kalman J, et al. Effects of a psychosocial transitional care model on hospitalizations and cost of care for high utilizers. Soc Work Health Care. 2015;54(6):485-498. doi: 10.1080/00981389.2015.1040141. PubMed
22. Zulman DM, Ezeji-Okoye SC, Shaw JG, et al. Partnered research in healthcare delivery redesign for high-need, high-cost patients: development and feasibility of an Intensive Management Patient-Aligned Care Team (ImPACT). J Gen Intern Med. 2014;29(4):861-869. doi: 10.1007/s11606-014-3022-7. PubMed
23. Mautner DB, Pang H, Brenner JC, et al. Generating hypotheses about care needs of high utilizers: lessons from patient interviews. Popul Health Manag. 2013;16 Suppl 1:S26-33. doi: 10.1089/pop.2013.0033. PubMed
24. Bodenheimer T. Strategies to reduce costs and improve care for high-utilizing Medicaid patients: Reflections on pioneering programs. Center for Health Care Strategies, Inc.;2013.
25. Rinehart DJ, Oronce C, Durfee MJ, et al. Identifying subgroups of adult superutilizers in an urban safety-net system using latent class analysis: implications for clinical practice. Med Care. 2018;56(1):e1-e9. doi: 10.1097/MLR.0000000000000628. PubMed
26. Boutwell A, Kunst E, Sorin J, Shniffer A, Logozzo J, Woodhouse D. DSRIP-Medicaid Accelerated eXchange (MAX) Series Program: Improving Care for Super Utilizers. January 2017. https://www.health.ny.gov/health_care/medicaid/redesign/dsrip/pps_workshops/docs/2017-01_imp_care.pdf. Accessed January 24, 2018.
27. Hibbard JH, Stockard J, Mahoney ER, Tusler M. Development of the Patient Activation Measure (PAM): conceptualizing and measuring activation in patients and consumers. Health Serv Res. 2004;39(4 Pt 1):1005-1026. doi: 10.1111/j.1475-6773.2004.00269.x PubMed
© 2018 Society of Hospital Medicine
Acute Treatment of Hypertensive Urgency
The "Things We Do for No Reason" (TWDFNR) series reviews practices which have become common parts of hospital care but provide little value to our patients. Practices reviewed in the TWDFNR series do not represent "black and white" conclusions or clinical practice standards but are meant as a starting place for research and active discussions among hospitalists and patients. We invite you to be part of that discussion. https://www.choosingwisely.org/

CLINICAL SCENARIO
A 67-year-old man is hospitalized with community-acquired pneumonia. He has a history of hypertension and is prescribed two antihypertensive medications (amlodipine and chlorthalidone) as an outpatient. On the evening of hospital day two, he is found to have a blood pressure of 192/95 on a scheduled vital signs check. He reports no symptoms other than cough, which is not new or worsening. The covering hospitalist reviews the documented blood pressures since admission and notes that many have been elevated despite continuation of his home regimen. The patient's nurse inquires about treating the patient with additional "as-needed" antihypertensive medications.
BACKGROUND
Hypertensive crises are common in hospitalized patients, with approximately one in seven patients experiencing an episode of hypertensive emergency and/or hypertensive urgency.1 Hypertensive emergency is typically defined as (1) a systolic blood pressure ≥180 mm Hg and/or a diastolic blood pressure ≥120 mm Hg with (2) evidence of new or worsening end-organ damage. The organs most commonly affected by severe hypertension are the brain (headache, confusion, stroke), heart (chest pain, myocardial infarction, pulmonary edema), large blood vessels (aortic dissection), and kidneys (acute hypertensive nephrosclerosis).2 With hypertensive urgency, patients experience similarly elevated blood pressure but have no symptoms or signs suggesting acute end-organ damage. Acute treatment with intravenous (IV) or immediate-acting oral medications is common; a single-center study showed that 7.4% of hospitalized patients had an order for "as needed" IV hydralazine or labetalol, with 60.3% receiving at least one dose.3 Among internal medicine and family medicine trainees in one survey, nearly half reported that they would use IV medications in a scenario where an inpatient had an asymptomatic blood pressure above 180 mm Hg.4
WHY YOU MIGHT THINK TREATING HYPERTENSIVE URGENCY IS NECESSARY
Treating patients with hypertensive urgency is based on an assumption: If one does not treat immediately, something bad (ie, end-organ damage) will occur over the next few hours. Data from the 1930s showed that patients with untreated hypertensive emergency had a one-year mortality rate >79% and a median survival of 10.4 months.5 More recent studies suggest that the in-hospital and one-year mortality for those with hypertensive emergency are 13% and 39%, respectively.6 These data demonstrate that patients with hypertensive emergency are at risk in both the short- and long-term.
Patients with hypertensive urgency are also at increased risk for long-term morbidity and mortality. The one-year mortality for those experiencing an episode of hypertensive urgency is approximately 9%.6 Given the concerns about poor outcomes, it remains a common practice in many facilities to acutely lower the blood pressure in patients with hypertensive urgency. This is highlighted by recommendations of a commonly used point-of-care medical resource, which suggests that "potential legal ramifications partially motivate lowering the blood pressure over several hours."7
WHY TREATING HYPERTENSIVE URGENCY IS UNNECESSARY AND POTENTIALLY HARMFUL
Concerns regarding overtreatment of hypertensive urgency relate to overestimated rates of hypertensive complications, the pathophysiology of hypertension itself, and the potential for adverse events related to treatment. Given that there are few trials examining hospitalized patients with hypertensive urgency, much of the data supporting a conservative approach are drawn from studies of outpatients or emergency department patients. In addition, there is little data suggesting that outcomes are different for patients presenting with a chief complaint of hypertensive urgency and those presenting with an alternate diagnosis but who are found to have blood pressures that meet the threshold for diagnosis of hypertensive urgency.
The landmark 1967 Veterans Affairs Cooperative Trial demonstrated the long-term benefits of treating patients with chronic hypertensive urgency.8 Importantly though, benefits accrued over a period of months to years, not hours. The time to the first adverse event in the placebo arm was two months, suggesting that even those with blood pressures chronically in the range of hypertensive urgency are unlikely to experience hyperacute (ie, within hours) events, even without treatment.
A more recent study, conducted by Patel et al., examined 58,836 patients seen in outpatient clinics and found to have blood pressures meeting the criteria for hypertensive urgency.9 This study included patients whose primary issue was hypertensive urgency and patients in whom the diagnosis was secondary. A total of 426 patients were referred to the hospital and only 100 (0.17%) were subsequently admitted. At seven days, the rates of the primary outcome (a composite of myocardial infarction, stroke, and/or transient ischemic attack) were 0.1% in those sent home and 0.5% in those sent to the hospital. In those patients with a systolic blood pressure ≥220 mm Hg, two out of 977 (0.2%) of those sent home and zero out of 81 of those sent to the hospital experienced the primary outcome. These data reinforce the message that, in patients with hypertensive urgency, rates of adverse events at seven days are low, even with extreme blood pressure elevation.
The human body has adapted to withstand wide variations in blood pressure.10 For example, through arteriolar constriction and reflex vasodilation, cerebral autoregulation maintains a constant cerebral blood flow within a wide range of perfusion pressures, ensuring that the brain is protected from higher mean arterial pressures.11 While this process is protective, over time the autoregulatory system becomes impaired, especially in patients with cerebrovascular disease. This places patients at risk for cerebral and/or cardiac ischemia with even slight drops in perfusion pressure.12,13 Indeed, in assessing treatment-related adverse events in a series of patients treated with intravenous nicardipine or nitroprusside for hypertensive emergency, Brooks and colleagues reported that 57% (27 of 47) of patients had overly large reductions in blood pressure (>25% reduction in mean arterial pressure) within the first 30 minutes of treatment.14 Two patients had acute ischemic events attributed to treatment with antihypertensive medications. Myocardial infarction and stroke have both been reported,12 and medication classes such as calcium channel blockers (sublingual nifedipine in particular), beta-blockers (eg, labetolol), angiotensin-converting-enzyme inhibitors (eg, captopril), and clonidine have all been implicated in treatment-related adverse events.12,15-17 Another potential issue derives from the observation that blood pressures obtained in the hospital setting are often inaccurate, owing to inappropriate patient preparation, faulty equipment, and inadequate training of staff obtaining the measurement.18
National guidelines support a cautious approach to the treatment of hypertensive urgency. The seventh Report of the Joint National Committee on Detection, Evaluation, and Treatment of Hypertension, published in 2003, noted that "patients with markedly elevated BP but without acute target-organ damage usually do not require hospitalization, but they should receive immediate combination oral antihypertensive therapy" and that "there is no evidence to suggest that failure to aggressively lower BP in the [emergency department] is associated with any increased short-term risk to the patient who presents with severe hypertension." JNC 7 also laments contemporary terminology: "Unfortunately, the term 'urgency' has led to overly aggressive management of many patients with severe, uncomplicated hypertension. Aggressive dosing with intravenous drugs or even oral agents, to rapidly lower BP is not without risk."19 The most recent JNC guideline does not comment on hypertensive urgency,20 and the 2017 American College of Cardiology/American Heart Association Guideline for the Prevention, Detection, Evaluation, and Management of High Blood Pressure in Adults argues that, "¬there is no indication for referral to the emergency department, immediate reduction in BP in the emergency department, or hospitalization for [patients with hypertensive urgency]."21
WHAT CLINICIANS SHOULD DO INSTEAD
After it is confirmed that a patient has no end-organ damage (ie, the patient has hypertensive urgency, not emergency), treatable causes of hypertension should be assessed. In hospitalized patients, these include missed or held doses of outpatient medications, pain, nausea, alcohol and/or benzodiazepine withdrawal, delirium, and obstructive sleep apnea.22 If no remediable cause is identified, patients should be allowed to rest for at least 30 minutes without the administration of additional antihypertensive medications, after which time the blood pressure should be measured using the correct technique.2 Clinical trials have shown that rest is effective at lowering blood pressure in patients with hypertensive urgency.23,24 One study initially treated 549 emergency department patients with a 30-minute rest period, after which time 32% of patients had responded (defined as a SBP <180 mm Hg and DBP <110 mm Hg, with at least a 20 mm Hg reduction in baseline SBP and/or a 10 mm Hg reduction in DBP).23 Another study randomized 138 patients with hypertensive urgency to either rest or active treatment with telmisartan. Blood pressures were checked every 30 minutes for four hours. The primary endpoint (reduction of MAP of 10%-35%) was similar in both groups (68.5% in the rest group and 69.1% in the telmisartan group).24 Even if rest is ineffective, the risk-benefit ratio of acutely lowering blood pressure will typically favor withholding acute treatment in asymptomatic patients. If blood pressure remains consistently elevated, augmentation of the home regimen (eg, increasing the dose of their next scheduled antihypertensive) of oral medications may be warranted. Though not all agree with management of antihypertensives in hospitalized patients,25 acute hospitalizations afford an opportunity to modify and observe chronic hypertension.26
RECOMMENDATIONS
- Ensure that patients do not have symptoms and/or signs of end-organ damage. This can be done with a brief review of systems and a physical examination. In select cases, an electrocardiogram and a chest x-ray may be warranted.
- Search for common causes of treatable hypertension in hospitalized patients; these include pain, nausea, withdrawal syndromes, and holding of usual antihypertensive medications.
- In those patients without symptoms and/or signs of end-organ damage, allow rest, followed by reassessment.
- Do not administer intravenous or immediate-acting oral antihypertensive medications to acutely lower blood pressure. Instead, address the issues raised in Recommendation #2 and consider modifying the chronic oral antihypertensive regimen in patients who are uncontrolled as outpatients or who are not treated as outpatients. Coordinate early postdischarge follow-up for repeat blood pressure evaluation and continued modification of a patient's chronic antihypertensive regimen.
CONCLUSION
Although patients with hypertensive urgency are often treated with medications to acutely lower their blood pressure, there is no evidence to support this practice, and a strong pathophysiologic basis suggests that harm may result. The patient in the case described above should be allowed to rest for at least 30 minutes, with reevaluation of his blood pressure. If it remains elevated and no treatable secondary causes are found, the treating hospitalist should consider altering his chronic antihypertensive regimen to promote long-term blood pressure control.
Do you think this is a low-value practice? Is this truly a "Thing We Do for No Reason?" Share what you do in your practice and join in the conversation online by retweeting it on Twitter (#TWDFNR) and liking it on Facebook. We invite you to propose ideas for other "Things We Do for No Reason" topics by emailing TWDFNR@hospitalmedicine.org.
Disclosures
The authors have no conflicts of interest.
1. Shorr AF, Zilberberg MD, Sun X, et al. Severe acute hypertension among inpatients admitted from the emergency department. J Hosp Med. 2012;7(3):203-210. doi: 10.1002/jhm.969. PubMed
2. Whelton PK, Carey RM, Aronow WS, et al. ACC/AHA/AAPA/ABC/ACPM/AGS/APhA/ASH/ASPC/NMA/PCNA guideline for the Prevention, detection, evaluation, and management of High blood pressure in adults: A report of the American College of Cardiology/American Heart Association task force on clinical practice guidelines. Hypertension. 2017. PubMed
3. Weder AB, Erickson S. Treatment of hypertension in the inpatient setting: use of intravenous labetalol and hydralazine. J Clin Hypertens (Greenwich). 2010;12(1):29-33. doi: 10.1111/j.1751-7176.2009.00196.x. PubMed
4. Axon RN, Garrell R, Pfahl K, et al. Attitudes and practices of resident physicians regarding hypertension in the inpatient setting. J Clin Hypertens (Greenwich). 2010;12(9):698-705. doi: 10.1111/j.1751-7176.2010.00309.x. PubMed
5. Keith NM, Wagener HP, Barker NW. Some different types of essential hypertension: their course and prognosis. Am J Med Sci. 1974;268(6):336-345. doi: 10.1097/00000441-197412000-00004. PubMed
6. Guiga H, Decroux C, Michelet P, et al. Hospital and out-of-hospital mortality in 670 hypertensive emergencies and urgencies. J Clin Hypertens (Greenwich). 2017;19(11):1137-1142. doi: 10.1111/jch.13083. PubMed
7. Varon J, Williams EJ. Management of severe asymptomatic hypertension (hypertensive urgencies) in adults. In: Post T, ed. UpToDate, Waltham, MA. (Accessed February 13, 2018). PubMed
8. Effects of treatment on morbidity in hypertension. Results in patients with diastolic blood pressures averaging 115 through 129 mm Hg. JAMA. 1967;202(11):1028-1034. soi: 10.1001/jama.1967.03130240070013 PubMed
9. Patel KK, Young L, Howell EH, et al. Characteristics and outcomes of patients presenting with hypertensive urgency in the office setting. JAMA Intern Med. 2016;176(7):981-988. doi: 10.1001/jamainternmed.2016.1509. PubMed
10. MacDougall JD, Tuxen D, Sale DG, Moroz JR, Sutton JR. Arterial blood pressure response to heavy resistance exercise. J Appl Physiol. 1985;58(3):785-790. doi: 10.1152/jappl.1985.58.3.785. PubMed
11. Strandgaard S, Olesen J, Skinhoj E, Lassen NA. Autoregulation of brain circulation in severe arterial hypertension. Br Med J. 1973;1(5852):507-510. doi: 10.1136/bmj.1.5852.507. PubMed
12. Fischberg GM, Lozano E, Rajamani K, Ameriso S, Fisher MJ. Stroke precipitated by moderate blood pressure reduction. J Emerg Med. 2000;19(4):339-346. doi: 10.1016/S0736-4679(00)00267-5. PubMed
13. Ross RS. Pathophysiology of coronary circulation. Br Heart J. 1971;33(2):173-184. doi: 10.1136/hrt.33.2.173. PubMed
14. Brooks TW, Finch CK, Lobo BL, Deaton PR, Varner CF. Blood pressure management in acute hypertensive emergency. Am J Health Syst Pharm. 2007;64(24):2579-2582. doi: 10.2146/ajhp070105. PubMed
15. Grossman E, Messerli FH, Grodzicki T, Kowey P. Should a moratorium be placed on sublingual nifedipine capsules given for hypertensive emergencies and pseudoemergencies? JAMA. 1996;276(16):1328-1331. doi: 10.1001/jama.1996.03540160050032 PubMed
16. Hodsman GP, Isles CG, Murray GD et al. Factors related to first dose hypotensive effect of captopril: prediction and treatment. Br Med J (Clin Res Ed). 1983;286(6368):832-834. doi: 10.1136/bmj.286.6368.832. PubMed
17. Zeller KR, Von Kuhnert L, Matthews C. Rapid reduction of severe asymptomatic hypertension. A prospective, controlled trial. Arch Intern Med. 1989;149(10):2186-2189. doi: 10.1001/archinte.149.10.2186. PubMed
18. Pickering TG, Hall JE, Appel LJ, et al. Recommendations for blood pressure measurement in humans and experimental animals: Part 1: Blood pressure measurement in humans: a statement for professionals from the Subcommittee of Professional and Public Education of the American Heart Association Council on High Blood Pressure Research. Circulation. 2005;111(5):697-716. doi: 10.1161/01.CIR.0000154900.76284.F6. PubMed
19. Chobanian AV, Bakris GL, Black HR, et al. The seventh Report of the Joint National Committee on Prevention, Detection, Evaluation, and Treatment of High blood pressure: the JNC 7 report. JAMA. 2003;289(19):2560-2572. doi: 10.1001/jama.289.19.2560. PubMed
20. James PA, Oparil S, Carter BL, et al. 2014 evidence-based guideline for the management of high blood pressure in adults: report from the panel members appointed to the Eighth Joint National Committee (JNC 8). JAMA. 2014;311(5):507-520. doi: 10.1001/jama.2013.284427 PubMed
21. Whelton PK, Carey RM, Aronow WS, et al. ACC/AHA/AAPA/ABC/ACPM/AGS/APhA/ASH/ASPC/NMA/PCNA guideline for the Prevention, detection, evaluation, and management of High blood pressure in adults: A report of the American College of Cardiology/American Heart Association Task Force on Clinical Practice Guidelines. J Am Coll Cardiol. 2017. PubMed
22. Axon RN, Turner M, Buckley R. An update on inpatient hypertension management. Curr Cardiol Rep. 2015;17(11):94. doi: 10.1007/s11886-015-0648-y. PubMed
23. Grassi D, O'Flaherty M, Pellizzari M, et al. Hypertensive urgencies in the emergency department: evaluating blood pressure response to rest and to antihypertensive drugs with different profiles. J Clin Hypertens (Greenwich). 2008;10(9):662-667. doi: 10.1111/j.1751-7176.2008.00001.x. PubMed
24. Park SK, Lee DY, Kim WJ, et al. Comparing the clinical efficacy of resting and antihypertensive medication in patients of hypertensive urgency: a randomized, control trial. J Hypertens. 2017;35(7):1474-1480. doi: 10.1097/HJH.0000000000001340. PubMed
25. Steinman MA, Auerbach AD. Managing chronic disease in hospitalized patients. JAMA Intern Med. 2013;173(20):1857-1858. doi: 10.1001/jamainternmed.2013.9511. PubMed
26. Breu AC, Allen-Dicker J, Mueller S et al. Hospitalist and primary care physician perspectives on medication management of chronic conditions for hospitalized patients. J Hosp Med. 2014;9(5):303-309. doi: 10.1002/jhm.2137. PubMed
The "Things We Do for No Reason" (TWDFNR) series reviews practices which have become common parts of hospital care but provide little value to our patients. Practices reviewed in the TWDFNR series do not represent "black and white" conclusions or clinical practice standards but are meant as a starting place for research and active discussions among hospitalists and patients. We invite you to be part of that discussion. https://www.choosingwisely.org/
CLINICAL SCENARIO
A 67-year-old man is hospitalized with community-acquired pneumonia. He has a history of hypertension and is prescribed two antihypertensive medications (amlodipine and chlorthalidone) as an outpatient. On the evening of hospital day two, he is found to have a blood pressure of 192/95 on a scheduled vital signs check. He reports no symptoms other than cough, which is not new or worsening. The covering hospitalist reviews the documented blood pressures since admission and notes that many have been elevated despite continuation of his home regimen. The patient's nurse inquires about treating the patient with additional "as-needed" antihypertensive medications.
BACKGROUND
Hypertensive crises are common in hospitalized patients, with approximately one in seven patients experiencing an episode of hypertensive emergency and/or hypertensive urgency.1 Hypertensive emergency is typically defined as (1) a systolic blood pressure ≥180 mm Hg and/or a diastolic blood pressure ≥120 mm Hg with (2) evidence of new or worsening end-organ damage. The organs most commonly affected by severe hypertension are the brain (headache, confusion, stroke), heart (chest pain, myocardial infarction, pulmonary edema), large blood vessels (aortic dissection), and kidneys (acute hypertensive nephrosclerosis).2 With hypertensive urgency, patients experience similarly elevated blood pressure but have no symptoms or signs suggesting acute end-organ damage. Acute treatment with intravenous (IV) or immediate-acting oral medications is common; a single-center study showed that 7.4% of hospitalized patients had an order for "as needed" IV hydralazine or labetalol, with 60.3% receiving at least one dose.3 Among internal medicine and family medicine trainees in one survey, nearly half reported that they would use IV medications in a scenario where an inpatient had an asymptomatic blood pressure above 180 mm Hg.4
WHY YOU MIGHT THINK TREATING HYPERTENSIVE URGENCY IS NECESSARY
Treating patients with hypertensive urgency is based on an assumption: If one does not treat immediately, something bad (ie, end-organ damage) will occur over the next few hours. Data from the 1930s showed that patients with untreated hypertensive emergency had a one-year mortality rate >79% and a median survival of 10.4 months.5 More recent studies suggest that the in-hospital and one-year mortality for those with hypertensive emergency are 13% and 39%, respectively.6 These data demonstrate that patients with hypertensive emergency are at risk in both the short- and long-term.
Patients with hypertensive urgency are also at increased risk for long-term morbidity and mortality. The one-year mortality for those experiencing an episode of hypertensive urgency is approximately 9%.6 Given the concerns about poor outcomes, it remains a common practice in many facilities to acutely lower the blood pressure in patients with hypertensive urgency. This is highlighted by recommendations of a commonly used point-of-care medical resource, which suggests that "potential legal ramifications partially motivate lowering the blood pressure over several hours."7
WHY TREATING HYPERTENSIVE URGENCY IS UNNECESSARY AND POTENTIALLY HARMFUL
Concerns regarding overtreatment of hypertensive urgency relate to overestimated rates of hypertensive complications, the pathophysiology of hypertension itself, and the potential for adverse events related to treatment. Given that there are few trials examining hospitalized patients with hypertensive urgency, much of the data supporting a conservative approach are drawn from studies of outpatients or emergency department patients. In addition, there is little data suggesting that outcomes are different for patients presenting with a chief complaint of hypertensive urgency and those presenting with an alternate diagnosis but who are found to have blood pressures that meet the threshold for diagnosis of hypertensive urgency.
The landmark 1967 Veterans Affairs Cooperative Trial demonstrated the long-term benefits of treating patients with chronic hypertensive urgency.8 Importantly though, benefits accrued over a period of months to years, not hours. The time to the first adverse event in the placebo arm was two months, suggesting that even those with blood pressures chronically in the range of hypertensive urgency are unlikely to experience hyperacute (ie, within hours) events, even without treatment.
A more recent study, conducted by Patel et al., examined 58,836 patients seen in outpatient clinics and found to have blood pressures meeting the criteria for hypertensive urgency.9 This study included patients whose primary issue was hypertensive urgency and patients in whom the diagnosis was secondary. A total of 426 patients were referred to the hospital and only 100 (0.17%) were subsequently admitted. At seven days, the rates of the primary outcome (a composite of myocardial infarction, stroke, and/or transient ischemic attack) were 0.1% in those sent home and 0.5% in those sent to the hospital. In those patients with a systolic blood pressure ≥220 mm Hg, two out of 977 (0.2%) of those sent home and zero out of 81 of those sent to the hospital experienced the primary outcome. These data reinforce the message that, in patients with hypertensive urgency, rates of adverse events at seven days are low, even with extreme blood pressure elevation.
The human body has adapted to withstand wide variations in blood pressure.10 For example, through arteriolar constriction and reflex vasodilation, cerebral autoregulation maintains a constant cerebral blood flow within a wide range of perfusion pressures, ensuring that the brain is protected from higher mean arterial pressures.11 While this process is protective, over time the autoregulatory system becomes impaired, especially in patients with cerebrovascular disease. This places patients at risk for cerebral and/or cardiac ischemia with even slight drops in perfusion pressure.12,13 Indeed, in assessing treatment-related adverse events in a series of patients treated with intravenous nicardipine or nitroprusside for hypertensive emergency, Brooks and colleagues reported that 57% (27 of 47) of patients had overly large reductions in blood pressure (>25% reduction in mean arterial pressure) within the first 30 minutes of treatment.14 Two patients had acute ischemic events attributed to treatment with antihypertensive medications. Myocardial infarction and stroke have both been reported,12 and medication classes such as calcium channel blockers (sublingual nifedipine in particular), beta-blockers (eg, labetolol), angiotensin-converting-enzyme inhibitors (eg, captopril), and clonidine have all been implicated in treatment-related adverse events.12,15-17 Another potential issue derives from the observation that blood pressures obtained in the hospital setting are often inaccurate, owing to inappropriate patient preparation, faulty equipment, and inadequate training of staff obtaining the measurement.18
National guidelines support a cautious approach to the treatment of hypertensive urgency. The seventh Report of the Joint National Committee on Detection, Evaluation, and Treatment of Hypertension, published in 2003, noted that "patients with markedly elevated BP but without acute target-organ damage usually do not require hospitalization, but they should receive immediate combination oral antihypertensive therapy" and that "there is no evidence to suggest that failure to aggressively lower BP in the [emergency department] is associated with any increased short-term risk to the patient who presents with severe hypertension." JNC 7 also laments contemporary terminology: "Unfortunately, the term 'urgency' has led to overly aggressive management of many patients with severe, uncomplicated hypertension. Aggressive dosing with intravenous drugs or even oral agents, to rapidly lower BP is not without risk."19 The most recent JNC guideline does not comment on hypertensive urgency,20 and the 2017 American College of Cardiology/American Heart Association Guideline for the Prevention, Detection, Evaluation, and Management of High Blood Pressure in Adults argues that, "¬there is no indication for referral to the emergency department, immediate reduction in BP in the emergency department, or hospitalization for [patients with hypertensive urgency]."21
WHAT CLINICIANS SHOULD DO INSTEAD
After it is confirmed that a patient has no end-organ damage (ie, the patient has hypertensive urgency, not emergency), treatable causes of hypertension should be assessed. In hospitalized patients, these include missed or held doses of outpatient medications, pain, nausea, alcohol and/or benzodiazepine withdrawal, delirium, and obstructive sleep apnea.22 If no remediable cause is identified, patients should be allowed to rest for at least 30 minutes without the administration of additional antihypertensive medications, after which time the blood pressure should be measured using the correct technique.2 Clinical trials have shown that rest is effective at lowering blood pressure in patients with hypertensive urgency.23,24 One study initially treated 549 emergency department patients with a 30-minute rest period, after which time 32% of patients had responded (defined as a SBP <180 mm Hg and DBP <110 mm Hg, with at least a 20 mm Hg reduction in baseline SBP and/or a 10 mm Hg reduction in DBP).23 Another study randomized 138 patients with hypertensive urgency to either rest or active treatment with telmisartan. Blood pressures were checked every 30 minutes for four hours. The primary endpoint (reduction of MAP of 10%-35%) was similar in both groups (68.5% in the rest group and 69.1% in the telmisartan group).24 Even if rest is ineffective, the risk-benefit ratio of acutely lowering blood pressure will typically favor withholding acute treatment in asymptomatic patients. If blood pressure remains consistently elevated, augmentation of the home regimen (eg, increasing the dose of their next scheduled antihypertensive) of oral medications may be warranted. Though not all agree with management of antihypertensives in hospitalized patients,25 acute hospitalizations afford an opportunity to modify and observe chronic hypertension.26
RECOMMENDATIONS
- Ensure that patients do not have symptoms and/or signs of end-organ damage. This can be done with a brief review of systems and a physical examination. In select cases, an electrocardiogram and a chest x-ray may be warranted.
- Search for common causes of treatable hypertension in hospitalized patients; these include pain, nausea, withdrawal syndromes, and holding of usual antihypertensive medications.
- In those patients without symptoms and/or signs of end-organ damage, allow rest, followed by reassessment.
- Do not administer intravenous or immediate-acting oral antihypertensive medications to acutely lower blood pressure. Instead, address the issues raised in Recommendation #2 and consider modifying the chronic oral antihypertensive regimen in patients who are uncontrolled as outpatients or who are not treated as outpatients. Coordinate early postdischarge follow-up for repeat blood pressure evaluation and continued modification of a patient's chronic antihypertensive regimen.
CONCLUSION
Although patients with hypertensive urgency are often treated with medications to acutely lower their blood pressure, there is no evidence to support this practice, and a strong pathophysiologic basis suggests that harm may result. The patient in the case described above should be allowed to rest for at least 30 minutes, with reevaluation of his blood pressure. If it remains elevated and no treatable secondary causes are found, the treating hospitalist should consider altering his chronic antihypertensive regimen to promote long-term blood pressure control.
Do you think this is a low-value practice? Is this truly a "Thing We Do for No Reason?" Share what you do in your practice and join in the conversation online by retweeting it on Twitter (#TWDFNR) and liking it on Facebook. We invite you to propose ideas for other "Things We Do for No Reason" topics by emailing TWDFNR@hospitalmedicine.org.
Disclosures
The authors have no conflicts of interest.
1. Shorr AF, Zilberberg MD, Sun X, et al. Severe acute hypertension among inpatients admitted from the emergency department. J Hosp Med. 2012;7(3):203-210. doi: 10.1002/jhm.969. PubMed
2. Whelton PK, Carey RM, Aronow WS, et al. ACC/AHA/AAPA/ABC/ACPM/AGS/APhA/ASH/ASPC/NMA/PCNA guideline for the Prevention, detection, evaluation, and management of High blood pressure in adults: A report of the American College of Cardiology/American Heart Association task force on clinical practice guidelines. Hypertension. 2017. PubMed
3. Weder AB, Erickson S. Treatment of hypertension in the inpatient setting: use of intravenous labetalol and hydralazine. J Clin Hypertens (Greenwich). 2010;12(1):29-33. doi: 10.1111/j.1751-7176.2009.00196.x. PubMed
4. Axon RN, Garrell R, Pfahl K, et al. Attitudes and practices of resident physicians regarding hypertension in the inpatient setting. J Clin Hypertens (Greenwich). 2010;12(9):698-705. doi: 10.1111/j.1751-7176.2010.00309.x. PubMed
5. Keith NM, Wagener HP, Barker NW. Some different types of essential hypertension: their course and prognosis. Am J Med Sci. 1974;268(6):336-345. doi: 10.1097/00000441-197412000-00004. PubMed
6. Guiga H, Decroux C, Michelet P, et al. Hospital and out-of-hospital mortality in 670 hypertensive emergencies and urgencies. J Clin Hypertens (Greenwich). 2017;19(11):1137-1142. doi: 10.1111/jch.13083. PubMed
7. Varon J, Williams EJ. Management of severe asymptomatic hypertension (hypertensive urgencies) in adults. In: Post T, ed. UpToDate, Waltham, MA. (Accessed February 13, 2018). PubMed
8. Effects of treatment on morbidity in hypertension. Results in patients with diastolic blood pressures averaging 115 through 129 mm Hg. JAMA. 1967;202(11):1028-1034. soi: 10.1001/jama.1967.03130240070013 PubMed
9. Patel KK, Young L, Howell EH, et al. Characteristics and outcomes of patients presenting with hypertensive urgency in the office setting. JAMA Intern Med. 2016;176(7):981-988. doi: 10.1001/jamainternmed.2016.1509. PubMed
10. MacDougall JD, Tuxen D, Sale DG, Moroz JR, Sutton JR. Arterial blood pressure response to heavy resistance exercise. J Appl Physiol. 1985;58(3):785-790. doi: 10.1152/jappl.1985.58.3.785. PubMed
11. Strandgaard S, Olesen J, Skinhoj E, Lassen NA. Autoregulation of brain circulation in severe arterial hypertension. Br Med J. 1973;1(5852):507-510. doi: 10.1136/bmj.1.5852.507. PubMed
12. Fischberg GM, Lozano E, Rajamani K, Ameriso S, Fisher MJ. Stroke precipitated by moderate blood pressure reduction. J Emerg Med. 2000;19(4):339-346. doi: 10.1016/S0736-4679(00)00267-5. PubMed
13. Ross RS. Pathophysiology of coronary circulation. Br Heart J. 1971;33(2):173-184. doi: 10.1136/hrt.33.2.173. PubMed
14. Brooks TW, Finch CK, Lobo BL, Deaton PR, Varner CF. Blood pressure management in acute hypertensive emergency. Am J Health Syst Pharm. 2007;64(24):2579-2582. doi: 10.2146/ajhp070105. PubMed
15. Grossman E, Messerli FH, Grodzicki T, Kowey P. Should a moratorium be placed on sublingual nifedipine capsules given for hypertensive emergencies and pseudoemergencies? JAMA. 1996;276(16):1328-1331. doi: 10.1001/jama.1996.03540160050032 PubMed
16. Hodsman GP, Isles CG, Murray GD et al. Factors related to first dose hypotensive effect of captopril: prediction and treatment. Br Med J (Clin Res Ed). 1983;286(6368):832-834. doi: 10.1136/bmj.286.6368.832. PubMed
17. Zeller KR, Von Kuhnert L, Matthews C. Rapid reduction of severe asymptomatic hypertension. A prospective, controlled trial. Arch Intern Med. 1989;149(10):2186-2189. doi: 10.1001/archinte.149.10.2186. PubMed
18. Pickering TG, Hall JE, Appel LJ, et al. Recommendations for blood pressure measurement in humans and experimental animals: Part 1: Blood pressure measurement in humans: a statement for professionals from the Subcommittee of Professional and Public Education of the American Heart Association Council on High Blood Pressure Research. Circulation. 2005;111(5):697-716. doi: 10.1161/01.CIR.0000154900.76284.F6. PubMed
19. Chobanian AV, Bakris GL, Black HR, et al. The seventh Report of the Joint National Committee on Prevention, Detection, Evaluation, and Treatment of High blood pressure: the JNC 7 report. JAMA. 2003;289(19):2560-2572. doi: 10.1001/jama.289.19.2560. PubMed
20. James PA, Oparil S, Carter BL, et al. 2014 evidence-based guideline for the management of high blood pressure in adults: report from the panel members appointed to the Eighth Joint National Committee (JNC 8). JAMA. 2014;311(5):507-520. doi: 10.1001/jama.2013.284427 PubMed
21. Whelton PK, Carey RM, Aronow WS, et al. ACC/AHA/AAPA/ABC/ACPM/AGS/APhA/ASH/ASPC/NMA/PCNA guideline for the Prevention, detection, evaluation, and management of High blood pressure in adults: A report of the American College of Cardiology/American Heart Association Task Force on Clinical Practice Guidelines. J Am Coll Cardiol. 2017. PubMed
22. Axon RN, Turner M, Buckley R. An update on inpatient hypertension management. Curr Cardiol Rep. 2015;17(11):94. doi: 10.1007/s11886-015-0648-y. PubMed
23. Grassi D, O'Flaherty M, Pellizzari M, et al. Hypertensive urgencies in the emergency department: evaluating blood pressure response to rest and to antihypertensive drugs with different profiles. J Clin Hypertens (Greenwich). 2008;10(9):662-667. doi: 10.1111/j.1751-7176.2008.00001.x. PubMed
24. Park SK, Lee DY, Kim WJ, et al. Comparing the clinical efficacy of resting and antihypertensive medication in patients of hypertensive urgency: a randomized, control trial. J Hypertens. 2017;35(7):1474-1480. doi: 10.1097/HJH.0000000000001340. PubMed
25. Steinman MA, Auerbach AD. Managing chronic disease in hospitalized patients. JAMA Intern Med. 2013;173(20):1857-1858. doi: 10.1001/jamainternmed.2013.9511. PubMed
26. Breu AC, Allen-Dicker J, Mueller S et al. Hospitalist and primary care physician perspectives on medication management of chronic conditions for hospitalized patients. J Hosp Med. 2014;9(5):303-309. doi: 10.1002/jhm.2137. PubMed
© 2018 Society of Hospital Medicine